factors influencing tax compliance among small and medium
TRANSCRIPT

FACTORS INFLUENCING TAX COMPLIANCE AMONG SMALL AND MEDIUM ENTERPRISES IN NAIROBI’S
INDUSTRIAL AREA, KENYA
BY
PATRICK C. NDEGWA MWANGI
A RESEARCH PROJECT REPORT SUBMITTED IN PARTIAL FULFILLMENT OF THE REQUIREMENTS FOR THE AWARD OF THE
DEGREE OF MASTER OF ARTS IN PROJECT PLANNING AND MANAGEMENT OF THE UNIVERSITY OF NAIROBI.
2014

ii
DECLARATION
This is my original work and has not been presented for award of a degree in any other university
or any other institution of higher learning for examination.
………………………………………. Date ………………………..
PATRICK C. NDEGWA MWANGI
REG.NO:L50/70556/2011
This research report has been submitted for examination with my approval as the University
Supervisor.
…………………………………………….. Date ………………………
MR. CYRUS GITONGA
Department of Extra Mural Studies
University of Nairobi

iii
DEDICATION
I dedicate this project to my loving wife, Lobanzo; your practical help and emotional
encouragement as I pursued this course is highly appreciated. To my parents, Mr. and Mrs.
Mwangi and to my wonderful siblings, Grace and George, I would not have made it without your
moral as well as financial support, understanding and perseverance during my study period.

iv
ACKNOWLEDGEMENT
I am greatly indebted to my supervisor, Mr. Cyrus Gitonga who imparted invaluable knowledge
to me about the research process and always found time to guide me despite his busy schedule. I
wish to appreciate and thank the Board of Post Graduate Studies of the University of Nairobi for
giving me an opportunity to take this course.
I sincerely wish to thank Mrs. Vivian Ndegwa of Kenya Revenue Authority for making it
possible for me to access their taxpayer’s records database. To all other individuals and
organizations that I have not specifically mentioned by name, please accept my gratitude for
without your support, this report would have remained but a dream.
Thank you all.
v
TABLE OF CONTENT
PAGE
DECLARATION ............................................................................................................................ ii
DEDICATION ............................................................................................................................... iii
ACKNOWLEDGEMENT ............................................................................................................. iv
TABLE OF CONTENT .................................................................................................................. v
LIST OF TABLES ....................................................................................................................... viii
LIST OF FIGURES ....................................................................................................................... ix
ABBREVIATIONS AND ACRONYMS ....................................................................................... x
ABSTRACT ................................................................................................................................... xi
CHAPTER ONE: INTRODUCTION ......................................................................................... 1
1.1 Background of the study ......................................................................................................... 1
1.2 Statement of the problem ........................................................................................................ 3
1.3 Purpose of the study ................................................................................................................ 5
1.4 Objectives of the study............................................................................................................ 5
1.5 Research questions .................................................................................................................. 5
1.6 Significance of the study ......................................................................................................... 5
1.7 Basic assumptions of the study ............................................................................................... 6
1.8 Limitations of the study .......................................................................................................... 6
1.9 Delimitations of the study ....................................................................................................... 7
1.10 Definitions of significant terms used in the study ................................................................. 7
1.11 Organization of the study ....................................................................................................... 8
CHAPTER TWO: LITERATURE REVIEW ............................................................................ 9
2.1 Introduction ............................................................................................................................ 9
2.2 Theoretical framework ........................................................................................................... 9
2.3 Tax compliance by SME’s ................................................................................................... 11
2.4 Tax rate ................................................................................................................................ 16
2.5 Tax information ................................................................................................................... 17
2.6 Tax compliance cost ............................................................................................................ 19
2.7 Taxpayer’s attitude............................................................................................................... 20
2.8 Conceptual Framework ........................................................................................................ 22
vi
2.10 Summary of literature review ............................................................................................. 23
CHAPTER THREE: RESEARCH METHODOLOGY ......................................................... 24
3.1 Introduction ......................................................................................................................... 24
3.2 Research design .................................................................................................................. 24
3.3 Target population ................................................................................................................ 24
3.4 Sampling size and procedures ............................................................................................. 25
3.5 Data collection methods ...................................................................................................... 26
3.6 Data collection procedure ................................................................................................... 27
3.7 Data Analysis ...................................................................................................................... 28
3.8 Ethical issues ....................................................................................................................... 28
3.9 Operationalization of variables ........................................................................................... 28
CHAPTER FOUR: DATA ANALYSIS, PRESENTATION AND INTERPRETATION ... 30
4.1 Introduction ......................................................................................................................... 30
4.2 Response Rate ..................................................................................................................... 30
4.3 Demographic information ................................................................................................... 31
4.4 Tax rates .............................................................................................................................. 34
4.5 Availability of tax information ........................................................................................... 36
4.6 Tax compliance cost ........................................................................................................... 39
4.6 SMEs attitude about tax ...................................................................................................... 41
4.7 Summary ............................................................................................................................. 45
CHAPTER FIVE:SUMMARY OF THE FINDINGS, CONCLUSIONS AND
RECOMMENDATIONS ............................................................................................................ 46
5.1 Introduction ......................................................................................................................... 46
5.2 Summary of findings............................................................................................................ 46
5.2.1 Tax rates ......................................................................................................................................... 46
5.2.2 Availability of tax information ....................................................................................................... 46
5.2.3 Tax Compliance Cost ..................................................................................................................... 47
5.2.4 Taxpayers Attitude towards tax ...................................................................................................... 47
5.3 Discussion of findings........................................................................................................... 47
5.4 Conclusions ........................................................................................................................... 50
5.5 Recommendations of the study ............................................................................................. 51
vii
5.6 Suggestions for further research ........................................................................................... 53
REFERENCES ............................................................................................................................ 54
APPENDICES ............................................................................................................................. 58
APPENDIX I: Letter Of Transmittal ........................................................................................... 58
APPENDIX II: Questionnaire ..................................................................................................... 59
APPENDIX III: Indepth Interview Guide................................................................................... 63
APPENDIX IV: Krejcie And Morgan Table For Determining The Sample Size ....................... 64

viii
LIST OF TABLES
PAGE
Table 3.1 Target Population in Nairobi’s Industrial Area ............................................................ 24
Table 3.2 Sampling Frame and Sample Size ................................................................................ 25
Table 3.3: Operationalization of Variables ................................................................................... 29
Table 4.1: Response Rate .............................................................................................................. 30
Table 4.2: Position of respondent in the organization .................................................................. 31
Table 4.3: Age of Business ........................................................................................................... 32
Table 4.4: Composition of business activity type ......................................................................... 32
Table 4.5: Monthly turnover ......................................................................................................... 33
Table 4.6: Number of respondents with PIN ................................................................................ 33
Table 4.7: Number of employees in the organization ................................................................... 34
Table 4.8: Perception of Kenyan tax rates .................................................................................... 35
Table 4.9: Perception of forms of taxes ........................................................................................ 35
Table 4.10: Assessment of tax amount payable as a factor influencing tax compliance .............. 35
Table 4.11: Ready availability of tax information ........................................................................ 36
Table 4.12: Extent to which lack of tax information affects tax compliance ............................... 37
Table 4.13: Correct calculation of taxes ....................................................................................... 37
Table 4.14: Monthly cost of compliance ...................................................................................... 39
Table 4.15: Extent to which tax compliance cost affects tax compliance .................................... 40
Table 4.16: Comparison of tax compliance cost ........................................................................... 40
Table 4.17: Extent of access to public utilities and services funded by tax .................................. 41
Table 4.18: Extent to which companies value payment of tax to Kenyan government ................ 42
Table 4.19: Extent other SMEs value payment of tax to Kenyan government ............................. 43
Table 4.20: Opinion on improvement of the tax system ............................................................... 44

ix
LIST OF FIGURES
PAGE
Figure 1 Conceptual Framework ………………………………………………………. 22
x
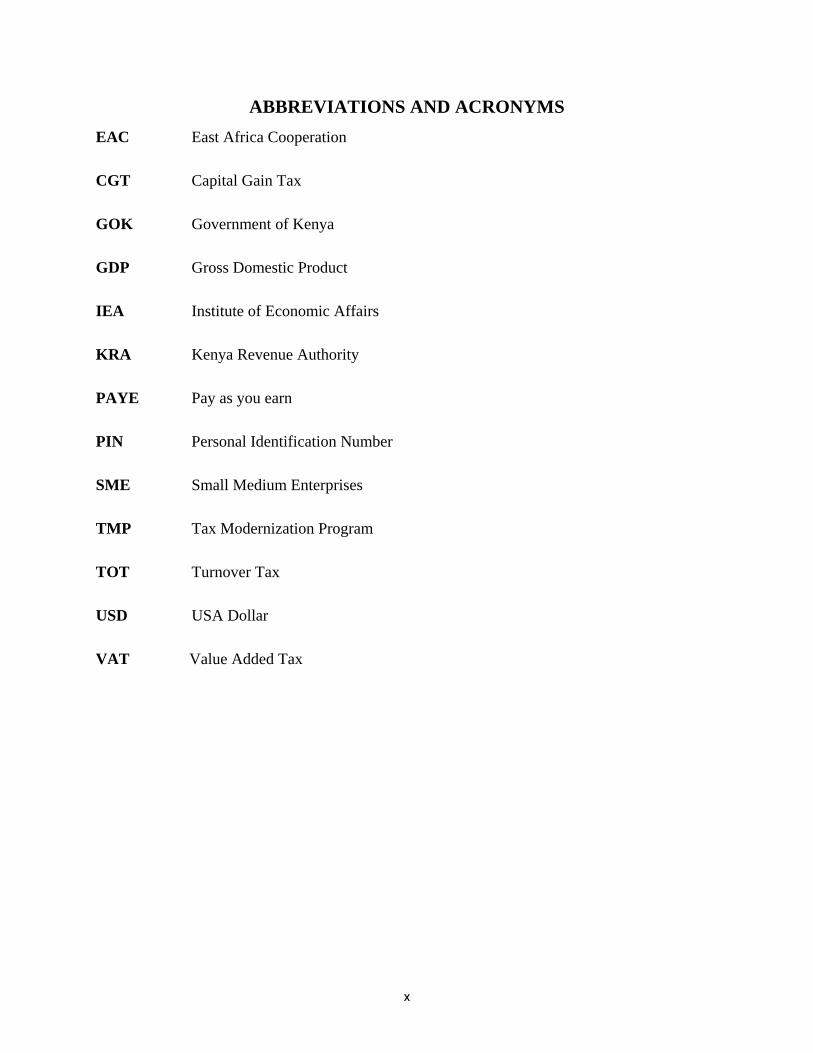
ABBREVIATIONS AND ACRONYMS
EAC East Africa Cooperation
CGT Capital Gain Tax
GOK Government of Kenya
GDP Gross Domestic Product
IEA Institute of Economic Affairs
KRA Kenya Revenue Authority
PAYE Pay as you earn
PIN Personal Identification Number
SME Small Medium Enterprises
TMP Tax Modernization Program
TOT Turnover Tax
USD USA Dollar
VAT Value Added Tax
xi
ABSTRACT
Tax is an important stream of revenue for government’s development projects and therefore all efforts must be made by governments to ensure that it is accurately and efficiently collected so as to facilitate the government’s operations. In an effort to maximize collection of revenue and efficiency in tax administration, key changes to tax policy evolving around ensuring equity, further widening the tax base, promoting increased investment and in so doing, reducing the tax compliance burden, have in the recent past been made by the Kenyan government. This study sought to identify the factors that influence tax compliance in Kenya, specifically focusing on SME’s operating within Nairobi’s Industrial Area. The researcher outlined a detailed literature review and identified the variables for this research to be tax rate, availability of tax information, tax compliance cost and attitude of SME’s. The research was a descriptive survey. Given the large population of registered taxpayers in Nairobi, a sample size of 150 was picked as representative, to be the focus of this study. To ensure that various diverse categories of taxpayers and business entities were included in the survey, stratified sampling technique was adopted. Data was collected using self administered questionnaires and an interview guide. The collected data was consequently analyzed using Statistical Package for Social Scientist software and the findings of the research presented using tables. The findings of the study revealed that with regard to tax rate as a factor influencing SMEs compliance, the majority view that Kenya has high tax rates with several different tax heads and this consequently hinders their level of compliance. The lack of readily available information relating to tax matters accounted to a great percent as a reason for non-compliance. The lack of information contributed to the inability of the taxpayers to correctly calculate the taxes payable; another form of non-compliance. The SMEs view that if more information would be availed to them in form of tax seminars and literature, this would demystify the complex concept of tax and greatly motivate them to be compliant. The findings of this study further revealed that 47% of the SMEs interviewed incur more than Ksh.50, 000 monthly, as costs of tax compliance. Some of these costs include bookkeeping, installation of software and internet costs, additional cost of hiring professional staff such as auditors and tax experts, accounting for the largest proportion of these costs. With regard to SMEs attitude as a factor affecting tax compliance, the respondents do agree and feel that they do have access to public utilities which are made available by the taxes paid to the government; hence they enjoy benefits of the taxes they pay. These organizations do value the payment of taxes to the government to a great extent, which affects their level of tax compliance. The findings of the study further revealed that the respondents do feel that their counterparts, fellow SMEs, also value the payment of taxes to the government to some extent. However, the taxpayers do feel and strongly agree that the taxation system in Kenya is in great need of improvement. By gaining an understanding of these underlying factors, KRA and the government will be able to make changes that will greatly improve taxpayers’ tax compliance level, with the end result being increased government revenues, allowing the tax authority to give quality service to taxpayers and the government as a whole providing more and improved utilities to the public.

1
CHAPTER ONE
INTRODUCTION
1.1 Background of the study
Tax Compliance can be defined as the degree to which a taxpayer complies (or fails to comply)
with the tax rules of his country, for example by declaring income, filing a return, and paying the
tax due in a timely manner. While Tax evasion can be defined as the failure by a person or
business to comply with the tax obligations. It is a serious challenge to tax authorities in both the
developed and developing countries. It diminishes the mobilization of resources that
governments need to invest in critical areas of social and personal development including health,
education and infrastructure development (Cummings, 2007). In 2011, it cost governments
worldwide about 5.1 % of their Gross domestic Product (GDP). In Europe tax evasion constitutes
about 8% of the GDP of economies in the region. In North and South America, tax evasion costs
economies 2% and 10% of their GDP respectively. Even in the most advanced economies in the
world, tax evasion undermines revenue collection substantially (Rile, 2011).
Italy loses €183 billion, or $242 billion, to tax evasion a year, and its debt of €1.9 trillion
represents just over 10 years of tax evasion. Countries like Italy and Greece have vowed to crack
down on tax evasion and cash transactions for goods and services that fall below the authorities’
radar. Germany and Britain signed an agreement with Switzerland about recovering some tax
revenue from accounts held by their citizens in Swiss banks. South America has the world’s
largest shadow economy compared with its G.D.P. followed by Africa and Europe, where
income hidden from the tax authorities amounts to about 20.5 percent of G.D.P. That compares
with 10.8 percent in North America (Association, 1998). Of the three East African countries of
Kenya, Uganda, and Tanzania, tax evasion as a function of GDP is high. Uganda loses the least
amount in tax evasion: In 2011, it lost 856 million USD, followed by Tanzania at 1.9 billion
USD, and Kenya loses slightly over 2 billion USD. In 2011, the informal economy constituted
33% of the GDP in Kenya and represented 7% of total government expenditure. The tax burden
in Kenya would thus be high, standing at about 20.9%. If the Kenya government is to increase its
social expenditure, then it needs to reduce tax evasion in the informal economy (Griffiths, 2005).
2
Taxpayers’ behavior towards tax system has evoked great attention among many Revenue
Authorities in the World especially in Developed Countries. However, it is debatable on what
has been done towards the study of taxpayers behavior towards tax system in developing
countries as they concentrate more in studies which would increase their budgets bottom-line in
terms of huge revenue collection and enforcement efforts at the expense of studies on taxpayers
behavior which would make increase in this tax revenue to be realized and enforcement efforts
work. Perhaps the less developed countries are not to blame as they run on budget deficits hence,
scarce resources to see through such studies which are perceived as adding no direct value to
revenue collection. Empirical evidence on the ground shows there has been hostility between the
taxpayers and tax collectors on issue relating to tax compliance (Porcano, 2011)
Kenya relied on unified tax policies and an administrative system jointly administered by the
initial three members of the EAC. This was a legacy of British colonial administration that all the
three countries inherited at independence. At that point, the government’s three main sources of
tax revenue were: income tax; customs and excise duties; and Inland Revenue. Changes in both
policies and administration were collaboratively determined and minimal until early 1970s.
Following a decision to assign responsibility for income tax to each EAC member state, Kenya
adopted the community legislation and enacted the Income Tax Act of 1973 (A.D.B, 2010)
Thereafter, three distinct phases of major initiatives in tax policy reforms can be discerned for
Kenya.
Initial efforts at widening the tax base after independence, the first major change to the tax
system, was the introduction of a consumption tax - the sales tax in 1973. The impetus for this
change derived from adverse effects on customs duty revenue receipts brought about by
restrictions on imports associated with an import substitution industrialization policy. Another
measure to widen the tax base was the introduction of capital gains tax (CGT) in 1975 to cash in
on high property prices arising from a coffee boom. But, in 1984, in an effort to jumpstart
economic growth through the construction industry, GoK suspended the CGT and formed a
commission to examine economic management, and extend advice on possible changes (A.D.B,
2010).
3
Tax policies introduced under the TMP (Tax Modernization Program) (1986 to 2002) thrust
under the TMP (1986 to 1996) was to raise and maintain revenue as ratio of GDP at 24% by
1999/2000; expand the tax base; rationalize the tax structure to make it more equitable; reduce
and rationalize tax rates and tariffs; reduce trade taxes and increase them on consumption to
support investment; and seal leakage loopholes (Moyi and Ronge, 2006). With respect to income
taxes, government reduced the top marginal rates for: personal income tax (PIT) from 65% in
1986/87 to 45% in 1993 to 35% in 1995/96 – by 1999/00 the top rate was 30%; and corporate
income tax from 45% in 1987/88 to 30% in 1999/00 (ADB, 2010). Government launched the
VAT in 1990 to increase revenue through the expansion of the tax base.
Tax policies introduced during the third phase: 2003/04 to 2008/09 Key changes to tax policy
made by the NARC government (2003-2008) and coalition government (2008-2009) has so far
evolved around ensuring equity, further widening the tax base, promoting increased investment
and reducing the tax compliance burden. To promote equity GoK widened income tax bands by
5% in 2004/05. Tax bands had remained unchanged since 2002. In the same year, GoK also
increased personal relief by 10%. From 16 June 2006, GoK increased the threshold turnover for
VAT from KShs 3 million p.a. to KShs 5 million p.a. with a view to reducing the compliance
burden for three quarters of registered taxpayers who either file nil returns, or whose turnover is
not substantial (ADB, 2010).
1.2 Statement of the Problem
Tax plays an important role in the growth of any economy so tax evasion is harmful to the
economy. Tax evasion hampers government revenue collection thus inefficiency in Government
spending because it diminishes the capacity of the state to mobilize domestic revenues, resources
that are needed for investments. In 2010, for example the amount lost to tax evasion represented
about twice the amount the country spent on health care. Tax evasion also damages the country's
growth capacity by discouraging both local and foreign investors. The high tax rate and burden
in Kenya, which is related to the high levels of tax evasion, is the leading disincentive to
business activity (Karingi, 2005)

4
The increasing trend of disparity between the levels of submitted annual income tax returns,
reported tax assessments and voluntarily paid tax liabilities, among SMEs, on the one hand, and
the trend of business birth and growth, on the other hand, has been a cause of worry to the
government of Kenya. This resulted in the government offer of an olive branch to taxpayers
through the tax amnesty announced by the Minister for Finance in Kenya in 2004 (GOK, 2004)
A study by, Parliamentary Budget Office (2010) shows that in 2008 the government could have
increased the tax base by approximately Kshs.79.3 billion if the tax evasion among SMEs was
addressed. According to the KRA annual report for year ended 2012, the amount lost inform of
taxes was Ksh 108 billion which can be directly attributed to the informal sectors and SMEs.
(K.R.A, Annual Tax Report, 2013). The SMEs are continuously expanding and has the potential
to increase the revenue flows but which have been otherwise left out of the tax bracket.
Generally, if the informal sector remains untaxed, and as more people transition in to the sector,
the government is likely to continue losing billions of shillings. Such a scenario will impact on
government’s ability to achieve its revenue targets and consequently its development agenda.
The question as to why some people pay tax while others do not has raised a lot of concern
among economists, governments and tax administrators alike. Tax revenues have, for quite some
time, remained low relative to the number of both registered and non registered firms and
individuals who are legally qualify to pay tax. Continued low revenue collection levels for
government is detrimental to economic development of this nation. (Cobham, 2005). A large
segment of the informal sector, especially the SMEs in Industrial area in Nairobi exhibit low tax
compliance levels. This is a great loss of revenues meant for public expenditure. It is for this
reason that research need to be undertaken to identify the causes for low tax compliance among
small and medium enterprises in Industrial area. It is also instructive to note that there is little
research that has been done in this area. In this context SMEs in Nairobi’s Industrial area exhibit
low tax compliance levels and this requires an understanding on the determinants of tax
compliance to enable the government to improve on its tax collection among the SMEs in
Nairobi’s Industrial area.
5
1.3 Purpose of the study
The purpose of this study was to evaluate the factors that influence tax compliance among Small
and Medium Enterprises in Nairobi’s Industrial area, Kenya.
1.4 Objectives of the Study
This study was guided by the following objectives:
1. To assess the extent to which tax rates explains tax compliance among Small and
Medium Enterprises.
2. To assess the availability of tax information as a factor influencing tax compliance
among Small and Medium Enterprises.
3. To determine the extent to which costs incurred by Small and Medium enterprises in
being tax compliant influence their level of tax compliance.
4. To determine how Small and Medium Enterprises attitude about tax influence tax
compliance.
1.5 Research Questions
This research was guided by the following research questions:
1. To what extent do tax rates in Kenya explain tax compliance among Small and Medium
Enterprises?
2. How does the availability of tax information influence tax compliance among Small and
Medium Enterprises?
3. To what extent does the cost of tax compliance explain tax compliance among Small and
Medium Enterprises?
4. How does the attitude of Small and Medium Enterprises about tax influence tax
compliance?
1.6 Significance of the study
The government is not able to collect the required taxes from the targeted tax payers. From the
SME point of view, tax evasion is driven generally by a perception that the tax burden is too
high. This poses a number of problems to tax systems, raising difficult questions over how tax
policies and tax administration may influence tax compliance incentives and behavior. The

6
compliance tax burden on the Informal Sector may be high relative to that of large companies
(higher unit cost in relation to turnover). Further, the cost of complying with a given set of tax
rules and regulations is generally high.
This study focused on how social, cultural and personal factors influence tax compliance. It is
anticipated that the results of this study will provide concepts and grounds on which to develop a
framework. The knowledge accruing from this study could benefit the Government of Kenya and
its revenue collection body Kenya Revenue authority in its effort to design suitable tax policies
for SMEs. This study has provided concepts which to develop a framework to explore tax
compliance behaviour among SMEs. It has opened the underlying factors that promote tax
compliance. The research will be useful to the business community and organization’s
management teams for purposes of knowing the tax compliance environmental factors and how
the conditions can be improved or dealt with. Finally, the research will be of interest to scholars
and researchers who may require developing and/or advancing their knowledge in the field of tax
compliance and administration.
1.7 Basic assumptions of the study
It was assumed that the respondents would be willing to participate in the study, be co-operative
and provide accurate information when responding to the research questions.
1.8 Limitations of the study
Time constraint was a limiting factor because the study is to be concluded within a short time.
Availability of funds was also a limiting factor to the study since the researcher is self sponsored.
There was no assurance that the respondents will return all the questionnaires duly completed,
neither was there a guarantee that those who will be interviewed would respond to all the
questions put forward to them comprehensively for fear that it would expose their non-
compliance to K.R.A.
To counter these limitations, the researcher took leave from work to make time to interview the
respondents and also sought for funding from relatives. The SMEs fear of participation was
overcome by explaining to them the intent of the study and issuing the transmittal letter as well
as the supervisors contact for verification purposes.

7
1.9 Delimitations of the study
The study area, Industrial area in Nairobi had a high concentration of taxpayers falling under the
SMEs category, and a wide variety of business activities. It was also within the convenience of
the researcher, this made the process of data collection easy, cheaper and less tedious.
1.10 Definitions of significant terms used in the study
Tax: A compulsory financial contribution imposed by a government to raise
revenue, levied on the income or property of persons or organizations, on
the production costs or sales prices of goods and services, etc.
Tax Compliance: The Degree to which a taxpayer complies (or fails to comply) with the tax
rules of his country, for example by declaring income, filing a return, and
paying the tax due in a timely manner.
Tax Evasion: It refers to the conscious or unconscious action and behavior of a person
who is liable to pay tax but who fails to fulfill this duty by either under
reporting his tax liability or failing to account for his income generating
activities altogether. Tax evasion also refers to the reduction or
minimization of tax liability by illegal methods.
Tax Rate: The tax rate is the tax imposed by the federal government based on an
individual's taxable income or a corporation's earnings. Kenya uses a
progressive tax rate system, where the percentage of tax increases as
taxable income. It can also be defined as the percent of income paid as tax.
Tax Information: The knowledge or facts provided about taxes.
Tax Obligation: Responsibilities pertaining to tax payment and declaring of tax returns
which a person duly registered and having a PIN is required to observe.
8
Tax Compliance cost: It refers to the expenditure of time or money in conforming with
government requirements such as legislation or regulation.
Tax Attitude: The way of thinking or feeling about taxes
Tax Administration: It refers to the procedures attached to tax compliance including
registration and filling of returns.
Small and Medium Enterprises: Those entities with full-time employees not exceeding 100
or annual sales turnover not exceeding Ksh 150 million.
Small Enterprises: An enterprise with 10-50 Employees
Medium Enterprises: An enterprise with 50 -100 Employees
1.11 Organization of the study
This report is divided into five key sections. Chapter one provides a background on the
introduction of taxation system in Kenya. It particularly highlights the taxation policies and tax
reforms that have been undertaken in Kenya over the years. The Chapter further states the
statement of the problem, research objectives and research questions that the study aims to
answer. The significance of the study and definitions of terms as used in the study are indicated
in the same chapter.
Chapter Two outlines the various schools of thought that have been brought forward with regard
to tax compliance behavior. The variables of the study are discussed with reference to studies
conducted by other researchers as well as published material on the same. Chapter three outlines
the research design and methodology to be used for purposes of completing the study. It also
describes in details, the research design, target population, the sample, sampling procedure to be
adopted as well as the data collection instruments.
Chapter four contains data analysis, presentation and interpretation of the findings while chapter
five provides a summary of findings, its discussion, conclusions and recommendations. This is
followed by references and appendices sections.
9
CHAPTER TWO
LITERATURE REVIEW
2.1 Introduction
This chapter outlined the various schools of thought revolving around tax compliance and
evasion. This Chapter identified the various theories put across by various scholars in relation to
tax compliance. For the research questions identified in Chapter One, the researcher highlighted
the findings of different authors, on the factors influencing factors influencing tax compliance
among SMEs.
2.2 Theoretical Framework
This study borrowed heavily from existing research that is increasing. It was influenced by the
following theories which have been put across by various scholars with regard to adoption of
technology in society:
2.2.1 The Tax Morale Theory The tax morale theory was first advanced by German scholars centered around Gunter
Schmolders known as Cologne school of tax psychology. Tax morale can be termed as the
individual factor that motivates a person to comply with his or her tax obligations. As a
determinant of tax behavior, tax morals aim to explain how and why a tax payer morality
influences his or her tax behavior. Many studies have found out that tax evasion can be attributed
to the tax morale (Mocetti, Vol 18 No. 6).
Tax payers would be inclined to evade tax when the communities in which they live or operate
disapprove of tax evasion.Tax payers are more likely to comply with tax obligation if their
friends, relatives and acquintances comply with these obligations. Also tax payers will evade
taxes if they feel that other people are getting away with tax evasion. In other words, if a society
tolerates tax evasion, such a society would encourage tax evasion(Waweru, 2004). Religious
beliefs are a variable in tax evasion as studies have shown that tax ayers who have strong
religious commitments or beliefs would likely be tax compliant even if they feel that the tax rate
is high (Gee, 2006).

10
In some instances tax payers can feel morally feel justified in evading taxes if they feel that the
quality and quantity of public services and goods are unsatisfactory. The opposite is also true. In
economies where the provision of pulic goods and services is satisfactory the evasion rates are
low. Tax payers will tend to comply with their tax obligation if they feel that their government is
honest, democartic and participatory and also if the tax payers feel they play a meaningful role in
governance (Cummings, 2007). Thus tax payers attitude are important predictors of tax evasion
thus the study aims to interpreate the tax attitudes of SMEs and how it contibute to tax evasion.
2.2.2 The Allingham and Sandmo Theory (AS Theory) This theory was advanced by Allingham and Sandmo. According to (Sandmo, 1972) The AS
theory holds that the government deters tax evasion through a sanction arrangement and audits.
A tax payer will decide to violate the fiscal laws and evade his or her tax obligations when he or
she percieves that the cost of evading tax is too low, believing he or she does that he or she is
unlikely to be detected or audited.
Tax payers would also evade tax when he or she perceives the cost of compliance is high. Tax
systems and procedures that are involving and cumbersome tend to encourage tax evasion. Tax
payers who feel that tax rate is high and punitive will evade tax. There is a negative correlation
between tax evasion, the probabilty of detection, the degree of punishment and high transactional
costs associated with tax laws. Income tax evasion was pioneered by Allingham and Sandmo
(1972), where a rational and a moral taxpayer maximizes expected utility, which solely depends
on income. When caught, the agent must pay penalties, imposed on the amount of evaded
income. A key comparative static result is that when the tax rate goes up,competing income and
substitution effects might lead to more or less tax compliance. The substitution effect encourages
evasion since the marginal benefit of cheating goes up with the tax rate. On the contrary, the
income effect tends to suppress evasion since a higher tax rate makes the taxpayer with
decreasing absolute risk aversion feel worse-off, and thus decrease risk-taking.Therefore, the net
effect is ambiguous.
However, Shlomo Yitzhaki (2002) showed that when the penalty is imposed on the amount of
evaded taxes, as it is under most current tax laws,the substitution effect vanishes. At the original
11
optimum, the penalty paid on concealed income increases proportionally with the tax rate, and
hence, there is no substitution effect. The remaining income effect is responsible for inducing the
taxpayer to cheat less. Therefore, the net effect is better compliance.Yitzhaki's (2002) result is
perhaps the single most important finding in the early tax evasion literature, having spurred a lot
of remarkable extensions. The SMEs are prone to tax evasion as they face difficulties in
complying with tax laws. They are expected to comply with strict deadlines, keep proper books
of accounts. This kind of environment leads to tax evasion.
2.3 Tax Compliance by SME’s
Tax plays an important role in the growth of Small and Medium Enterprises (SMEs) in low
income countries like Kenya. The role of SMEs is critical in pushing the socio-economic
development agenda of the country further. Therefore, alignment of the tax system to the
environment specific SME growth needs can be considered an important agenda for the policy
makers. (Mika Mungaya, IJMBS Vol. 2, Issue 3, July - Sept 2012).
In the 1970s, SMEs in Kenya were perceived as marginal to mainstream activity. They were
typically cast as habitual avoiders and evaders however the 1980s the service sector took off and
represented a higher and growing proportion of GDP in the country. SMEs are an important
force for economic development and industrialization in poor countries. It is increasingly
recognized that these enterprises contribute substantially to job creation, economic growth and
poverty alleviation. The 2005 World Development Report suggests that creating “sustainable
jobs and opportunities for micro entrepreneurs are the key pathways out of poverty for poor
people” (World Bank, 2004). Like any other developing countries, Kenya has taken a number of
measures to promote the growth of private sector and Small and Medium Enterprises (SMEs).
SMEs were estimated to account for a significant share of Gross Domestic Product (GDP).
The government formulates and implements various policies aimed at increasing job
opportunities, development of infrastructure as well as income generation through the creation of
new SMEs and improving the performance and competitiveness of existing one, the revenue
collected from taxes represents the major funding source for governmental expenditures (Baurer,
2005).If the tax structure is not adequately designed to the specific environmental conditions, it
may create a greater burden to the tax-paying organizations and eventually affecting the final
12
consumer due to the shifter ability of tax. SMEs in developing countries often face difficulties
when dealing with tax matters. It would be rare indeed not to hear complaints about the
complexity and or ambiguity of the tax laws, high tax rates, and the lack of an integrated fiscal
strategy that takes social taxes, and local taxes and fees into account when determining the
overall tax burden placed on the business community (Baurer, 2005).
This implies that as a policy maker and regulator, Government must consider the factors that
could affect the competitiveness of the enterprises. Assessing the impact of tax systems on SMEs
is not simply a matter of looking at tax rates. Tax systems play an important role in encouraging
growth, investment and innovation and facilitating international trade and mobility. For SMEs
key considerations are to minimize administrative burden while ensuring compliance, including
considering the drivers and impacts of operating in the informal economy (Kolstad, 2006)
indicated that taxes are perceived to be a major problem for both young and old firms. Therefore,
taxation has showing a way towards impacting small and medium enterprise.
The GoK has attempted to mobilize revenue by bringing more SMEs to the tax bracket by
introducing Turnover tax (TOT). There are four broad categories of obligations identified as
Registration in the system, Timely filling or lodging of the required information, reporting of
complete and accurate information and payment of taxes in time.
The definitions of SMEs differ from country to country, region to region and there is no
universal definition. Small and Medium Enterprises (SMEs) play an important economic role in
many countries. In Kenya, for example the SME sector contributed over 50 percent of new jobs
created in 2005 but despite their significance, most SMEs evade tax. Nevertheless, the factors
that attribute to the tax evasion among SMEs are not well understood. Hostility towards tax
compliance dates back to history of taxation. Taxes are considered a problem by everyone, not
surprising, taxation problem date back to the earliest recorded history (World Tax Organisation,
April 7 1999)
Kenya is ranked among low income countries and low compliance countries and is further faced
with the difficult task of ensuring efficient and effective tax administration. According to a
research conducted in Kenya by African Research review, the problem of tax non compliance

13
among business firms constrains the realization of revenue collection targets by Kenya Revenue
Authority (K.R.A). The research aimed at investigating the relationship between the size of
taxpayer’s income, inspection by the tax authorities, use of tax registers and VAT compliance. A
sample of 233 registered firms was selected and data collected using self administered
questionnaires to personnel in finance department of the selected firms. The data was analyzed
both descriptive and correlation analysis. The study revealed that VAT non compliance is high
among the middle-income business firms and that Inspection of business firms by tax authorities
had a slight positive relationship with VAT compliance (r =0.15, p<0.05) The study revealed that
effective and regular use of Tax Registers had a significant positive relationship with VAT
compliance (r = 0.622, p<0.05). The study recommends that stringent compliance measures and
close monitoring should be observed among the mid-sized private firms. Tax authorities should
also encourage effective use of tax registers through regular but impromptu inspections (Naibei,
2012)
Tax compliance is low among SMEs as a result of several factors such as poor management and
internal control practices as many of the enterprises are merely trying to make ends meet.
Another contributory factor to low tax compliance among SME’s is the informal approach to
establishment, operation and dissolution which creates an ease of mobility, consequently making
it difficult for the tax administration to keep pace with them. Cash-based economies have also
had inadequate accounting records and audit trails in practice. Tax compliance is low among
SMEs also because compliance costs for the SMEs are much higher relative to larger business
operations that they are competing against. In addition, small businesses have limited resources
and technical capacity. Often, the priority of a tax administration is to focus on large taxpayers
because of the high delinquency rate and low revenue yields associated with small businesses,
with very little enforcement action. This ultimately encourages non-compliance (Masinde, 2010)
From the perspective of tax administration, the major obstacle which hinders government in
ensuring that the SME is incorporated in the taxation bracket is the nature of businesses. The
small sizes of the businesses make it easier for them to remain outside the taxation bracket.
Mistrust and weak structural dialogue between informal sector and government is another factor
that hinders taxing of the informal sector. There is a general mistrust between tax agents and

14
taxpayers, with agents perceiving the SME as tax evaders, unwilling and unable to pay their
taxes. The operators too are wary of government agencies’ high-handedness in collection of
taxes. There is lack of structured dialogue between the SME and the government as well as other
law enforcing authorities. This has led to mistrust and prevents the sector from engaging
constructively with the government in reform processes (Programme Issue No. 29 September
2012 )
Other bottlenecks according to a publication of the IEA budget information program include the
lack of opportunity to grow and adapt good culture of corporate governance. The informal sector
has limited access to training and professional services that would enable them adapt to a sound
culture of corporate governance. (Osambo, 2009) Complicated tax systems and numerous
processes (licensing etc.) make it difficult and expensive for start-up firms to act in good faith.
Policies regarding the informal sector are poorly coordinated and disseminated across five
different but related government ministries namely finance, trade, industrialization, local
government and labour. This confusion often places sector operators at a disadvantaged position
more so in terms of accessing policy updates (Programme Issue No. 29 September 2012 )
The current policy reforms regarding business regulations and taxation laws and systems have
been formulated with little participation of the informal sector. As a result, many workers and
business entrepreneurs in the informal sector feel left out. (Chipeta, 2002) In addition, most
prospective entrepreneurs are not aware of business start-up regulations and taxation procedures,
mainly due to lack of effective information dissemination strategies on government policies. This
prevents the sector operators from entering into formal economy and tax evasion and corruption
as normal way of doing business. The informal sector operators who opt not to pay taxes and do
business without licenses operate incognito in back alleys and roadsides. They are often mobile
and in most cases engage in running battles with law enforcement and council authorities. In the
process of evading taxes, they end up paying more money in the form of bribes, to the law
enforcers (Programme Issue No. 29 September 2012 )

15
Spicer and Lundstedt (1976) pointed out that SMEs have more possibilities to avoid taxes than
larger taxpayers. They also have more opportunities for tax evasion and opportunities might
further increase with the number of different income sources. Hence, in compliance decisions the
level of income might interact with its source. The importance of how one’s economic status is
perceived was demonstrated by (Vogel, 1974) taxpayers who reported improvements of their
economic status were less compliant than others who reported deterioration of their financial
well-being. A positive relation of SMEs income and tax compliance also found empirical
support. Other studies found no relation of income level and tax compliance. Self-reported
compliance behavior was not related to income among Swedish taxpayers.
In an experimental study, (Feld, 2002) found that tax compliance is higher on average in an
endogenous fine treatment in which subjects are allowed to approve or reject the proposal of a
fine as compared to an exogenous fine treatment where the fine is imposed by the experimenter.
The main explanation why people show higher tax morale if they are allowed to vote on a fine is
legitimacy. Compliance rates are higher if the fine is accepted than in the case the fine is
rejected. Subjects who reject the proposal of the fine show a higher compliance rate than subjects
in the exogenous fine treatment even if they know that the dominant strategy under the existence
of the low fine is non-compliance.
Combining econometrics and surveys methods, (Spicer, 1976) sought to investigate impact of
attitude and social norms in the evasion decision; the data were collected from a 1974 survey in
USA. Econometric results revealed that the propensity to evade taxation was reduced by
increased probability of detection. Surprisingly, an increase in income reduced the propensity to
comply. With respect to attitude variables, an increase in both inequity of taxation and the
number of taxpayers who evade taxes known to a taxpayer made evasion more likely. This study
also revealed that the experience of taxpayer of previous audits by the income department
influences the compliance rates.
According to (Feldstein, 2002) Tax avoidance and evasion are pervasive in all countries, and tax
structures are undoubtedly skewed by this reality. Standard models of taxation and their
conclusions must reflect these realities. This study first presents theoretical models that integrate

16
avoidance and evasion into the overall decision problem faced by individuals. If the cost of
evasion and avoidance depends on other aspects of behavior, the choice of consumption basket
and avoidance become intertwined. The study then relates the behavior predicted by the model to
what is known empirically about the extent of evasion and avoidance, and how it responds to tax
enforcement policy. There are a variety of policy instruments that can affect the magnitude and
nature of avoidance and evasion response, the elasticity of behavioral response is itself a policy
instrument, to be chosen optimally. The study reviews that is known about these issues, and
introduces a general theory of optimal tax systems, in which tax rates and bases are chosen
simultaneously with the administrative and enforcement regimes.
To summarize, most empirical studies on the impact of tax rates support the assumption that high
tax burdens have a negative impact on compliance.
2.4 Tax Rate
It is generally believed that a high tax rate is the main cause of tax evasion. Incentives to evade
tax depend on the marginal rates of taxation because these govern the gains from evasion as a
sum of the sum evaded (Kaldor, 1956) One major tax evasion is the high personal income tax
rates which tend to lead tax payers to evade tax. Too many and complicated rules and regulations
imposed by the government tend to lead to tax evasion. Businesses find it generally difficult
often not profitable to do business legally. The heavy taxation is also a subject of worry not only
in developed countries like USA but also in Kenya and other less industrialized countries in
Africa and Latin America. For instance, taxes in Kenya confront the large manufacturing sector
in different shapes and shades example: import duties, export & excise duties, sales and VAT,
withholdings and income taxes, and PAYE etc. (KRA, 2011)
The high levels of taxation of SMEs in Africa and in Kenya in particular, warrants attention on
accelerated research areas aimed at addressing the overall effects of taxation on SMEs (Osambo,
2009) By studying taxation behavior in five different countries (USA, Gambia, Nigeria, South
Africa and Kenya), Derwent (2000) concluded that increased tax burden is a major threat. The
results show that the increase in tax rates leads to higher production, distribution and selling
costs which lead to higher prices and as a result consumers change their buying behavior. People
react to the higher prices by buying less of the product. When sales fall, some manufacturers cut
back on production and some workers may lose their jobs. The productive resources i.e. land,
17
capital, labour and entrepreneurship are allocated to other industries or go unused. For instance
when the government increase taxes on items such as beer and cigarettes for the purpose of
realizing revenue and discouraging their consumption people tend to buy local brews. Whenever
prices increase due to increase in tax rates; prices of goods and service increase and there is a
drop in the consumption rate and a decrease in sales volumes which leads to retarded growth of
SMEs. Tax payment is among the outflows of cash from the business which reduce the
purchasing power of an enterprise. This is due to the fact that a large amount of cash collected is
used to pay taxes rather than to expand the business. The study showed that the purchasing
power of an enterprise drops immediately an organization pays taxes (Mika Mungaya, IJMBS
Vol. 2, Issue 3, July - Sept 2012)
Some studies suggest that high tax rates foster evasion. The intuition is that high tax rates
increase the tax burden and, hence, lower the disposable income of the taxpayer (Chipeta, 2002)
However, the level of the tax rate may not be the only factor influencing people’s decision about
paying taxes. In fact, the structure of the overall tax system has an impact as well. If, for
example, the tax rate on corporate profits is relatively low, but individuals are facing a high tax
rate on their personal income, they may perceive their personal tax burden as unfair and choose
to declare only a part of their income. Similarly, large companies can often more easily take
advantage of tax loopholes, thereby contributing to the perceived unfairness of the system. Tax
rates and the overall structure of the tax system, therefore, have a significant effect on the
disposition to evade and avoid taxes.
2.5 Tax Information
Standard models assume that tax payers are fully informed of all the aspects that cover the tax
reporting processes. However this is a strong assumption and not the case. (Andreoni J. Errard,
1998) Tax research has shown that the degree of information is an important factor on the
behavior of tax payers and how it influences tax evasion. Less educated tax payer’s are less
exposed to tax compliance information and are less informed about relevant tax compliance
information and thus are more prone to tax evasion. Some tax payers find the complexity of tax
information more difficult to understand than others. This complexity may lead to unintentional
non compliance if tax payers have problems maybe in filling of tax returns.
18
In 1992, Kenya adopted the self assessment system of paying taxes. The responsibility of
declaring and paying the correct taxes is vested on the tax payer. A tax payer is required by law
to file a self assessment return by the end of the six month after year end. After filing the returns,
Kenya Revenue Authority (KRA) reviews them and if it has reason to believe that a tax payer
did not disclose the correct taxes, it is empowered under the law to carry out an in-depth tax
audit to verify the information disclosed by the tax payer. This is where problems start! The tax
payer then goes through the rigorous process that is both time consuming and costly for errors or
omissions that would have been avoided had advance tax rulings been in place (Muiru, 2012)
Further, businesses contemplating significant transactions are often faced with the problem of
not knowing, with some degree of certainty, what the tax outcome of those transactions would
be. This uncertainty could sometimes mean a deal is aborted because an adverse tax treatment
could make it commercially non-viable. The situation is further complicated by the complexity
of our tax laws and the fact that they are subject to change from time to time.
The way business is conducted has also become more sophisticated due to the geographical
spread of enterprises. We have recently witnessed many multinational companies set up
operations in Kenya in keeping pace with the wave of globalization. The world has become a
global village but it is unfortunate that our tax laws have not kept pace with this trend. For
instance, it is not a wonder to find a company producing goods in one country and selling in
another country to benefit from tax advantages in low tax jurisdictions. The complexity of
business transactions makes the application of intricate tax laws that have generally not kept pace
particularly problematic. Tax payers often find themselves in difficult situations while making
important business decisions as tax laws may not be clear as to the treatment of complex
business transactions. Our tax legislation does not provide for advance tax rulings though in
practice, tax payers seek the Commissioner’s interpretation of various tax laws or tax
implications of certain business transactions. Sometimes this is done on a no-name basis in order
to retain confidentiality (Muiru, 2012).
Kenya has a complex tax system that makes it expensive for taxpayers to comply with an
increased cost of doing. it is costly to implement occasioning losses Kenya’s economy. The
more complex a tax system is the more costly is its administration and the more expensive it is
19
for people to comply with it. Taxes administered in Kenya include corporate income tax,
personal income tax, Value Added Tax (VAT) and withholding tax. Corporate income tax rate is
30 percent, personal income tax rate ranges between 10 percent and 30 percent, VAT rate is 16
percent and while withholding tax rates begin from 3 percent and depend on income source and
whether one is a Kenyan or not (Government of Republic of Kenya, 2012).
2.6 Tax Compliance Cost
A compliance cost is expenditure of time or money in conforming with government requirements
such as legislation or regulation. For example, people or organizations registered for value added
tax have the extra burden of having to keep detailed records of all input tax and output tax to
facilitate the completion of VAT returns. This may necessitate them having to employ someone
skilled in this field, which would be regarded a compliance cost. Compliance costs normally
include all costs associated with obeying the law, including planning and administration, in
addition to the direct time and money spent filing paperwork. Businesses especially small ones
often face heavy costs in the process of preparing, filing, and paying taxes in addition to the
burden of tax payments. These compliance costs, added to fines, penalties, and the risks of
inspections and demands for bribes, often deter business creation and growth in developing and
transition countries. A tax compliance cost survey can provide useful information for the design
of reforms to reduce compliance costs and risks for small businesses. This note highlights key
findings of tax compliance cost surveys conducted in South Africa, the Republic of Yemen,
Ukraine, and Peru that measured the burdens on business. These surveys helped fine-tune the
design of reforms to lower costs for businesses and improve their competitiveness (Coolidge,
2010)
High compliance costs can result in tax avoidance, tax fraud, and inhibit investment by way of
diminishing competitiveness of the country in terms of taxation attractiveness (Ojeka, 2012). The
full cost of a tax system is more than simply the amount of tax paid. It also includes the cost of
tax planning and paperwork. Economists call these "tax compliance" costs, and the IRS estimates
Americans spend 6.6 billion hours per year filling out tax forms—including 1.6 billion hours on
the 1040 form alone. In a study carried out on tax compliance and simplifications (OECD, 2004)
established that compliance costs tend to increase with the number of taxes that an entrepreneur
20
is subject to, the complexity of the tax rules, the frequency of submitting tax returns and the
number of levels of government involved in levying and collecting taxes. Taxes introduce
complexities and costs not relevant to SMEs and the complexities may increase where more than
one level of government is involved for example the devolved government in Kenya. This results
to SMEs avoiding the paying of taxes as it affects the business.
2.7 Taxpayer’s Attitude
Tax payers attitude maybe influenced by many factors which eventually influence taxpayer’s
behavior (Ambrecht, 1998). Some of these factors which influence tax compliance behaviour and
tax compliance behaviour are many and are different from one country to another and from one
individual to another. They include taxpayers perception of the tax system and revenue authority;
peer attitude; tax payers understaning of tax system and tax laws; Motivation such as rewards
and and penalties; Cost of compliance; enforcement efforts such as audit; probabilty of detection;
difference across culture; Equity of the tax systems and demographic factors such assex, age and
size of income.
There is a very strong relationship between the taxpayers' attitudes and tax compliance in Kenya,
in that taxpayer's attitudes encourages tax compliance in and all that influence the taxpayers'
attitudes, equally affect the taxpayers' compliance with the tax requirements. In a research
conducted in Kenya (Wanjohi, 2010) the following conclusions were arrived at: First, most
taxpayers view the Kenyan tax system as unfair. This was because most respondents differed that
they are paying a fair share of tax; that their neighbors or friends, the tax laws are not easy to
understand such as calculation of tax filing and paying dates. Secondly, some of the factors for
tax non-compliance were found to be: the inability to understand tax laws, for example, rates of
tax, filing and paying dates, a feeling that they are not paying a fair share of tax, negative peer
attitude, and a belief that their neighbours are not reporting and paying tax honestly, and non
rewarding taxpayers.
The attitude issues from the various studies rotate around the tax fairness; improper use of
revenue collected by government and pure intent to evade payment of tax for the collective good
vis-à-vis the individual interest. Attitudes represent the positive and negative evaluations that an
21
individual holds of objects. It is assumed that attitudes encourage individuals to act according to
them. Thus, a taxpayer with positive attitudes towards tax evasion is expected to be less
compliant than a taxpayer with negative attitudes. Attitudes towards tax evasion are often found
to be quite positive (Kirchler, 2001). Many studies on tax evasion found significant, but weak
relationships between attitudes and self‐reported tax evasion (Trivedi, 2005) . A model of tax
evasion behavior developed by Weigel, Hessing considers social and psychological conditions,
including attitudes and moral beliefs about tax evasion’s propriety, as antecedents of tax
compliance. Data collected from fined tax evaders and honest taxpayers showed that attitudes
explain in part self‐reported tax evasion, but are insignificant predictors of actual behavior.
However, the correlations between self‐reported tax non‐compliance and attitudes are significant
but fairly weak. These findings suggest a rather complicated relationship between tax evasion
and attitudes, nevertheless we can be confident in our general prediction that if tax attitudes
become worse, tax evasion will increase (Lewis, 2005). The attitudes are important for both the
power and the trust dimension. On the one hand, favorable attitudes will contribute to trust in
authorities and consequently will enhance voluntary tax compliance. On the other hand, attitudes
towards the authorities will be relevant for the interpretation of the use of power as benevolent or
malicious. Tax attitudes in general also depend on the perceived use of the money collected and
therefore are connected to knowledge (Kirchler, 2001)
22
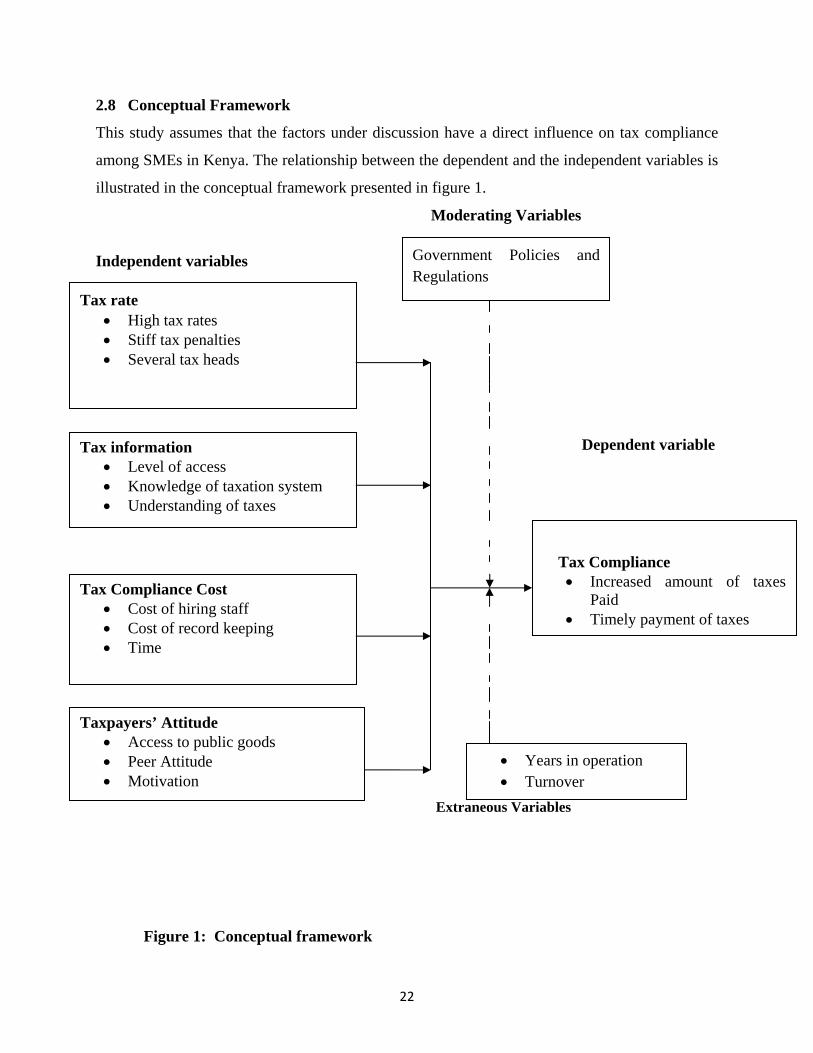
2.8 Conceptual Framework
This study assumes that the factors under discussion have a direct influence on tax compliance
among SMEs in Kenya. The relationship between the dependent and the independent variables is
illustrated in the conceptual framework presented in figure 1.
Moderating Variables
Independent variables
Dependent variable
Extraneous Variables
Figure 1: Conceptual framework
Tax rate High tax rates Stiff tax penalties Several tax heads
Tax information Level of access Knowledge of taxation system Understanding of taxes
Tax Compliance Cost Cost of hiring staff Cost of record keeping Time
Taxpayers’ Attitude Access to public goods Peer Attitude Motivation
Tax Compliance Increased amount of taxes
Paid Timely payment of taxes
Government Policies and Regulations
Years in operation Turnover
23
The independent variables are tax rate and system, tax information and education, tax
compliance cost and taxpayers attitude. Tax rate and system as an independent variable
influencing tax compliance is indicated by the complex nature of the tax system and high tax
rate. Tax information and education is the second independent variable is characterized by the
lack of knowledge of taxation by SMEs as well as misunderstanding of the taxation system. Tax
compliance cost is characterized by the time it takes and the cost of compliance by SMEs.
Taxpayer’s attitude is indicated by the attitude the taxpayers peers have with regards to tax
compliance as well as the motivation tax compliance holds for the SMEs. The dependent
variable for the study is tax compliance by SMEs government policies and regulations are the
extraneous variables for this study.
2.10 Summary of literature review
From the review of literature, it is clear to date, there has been research exploring factors that
influence compliance among SMEs. The main objective of this study was to identify the factors
that affect tax compliance among SMES. The research focused on tax rate, tax information, tax
compliance cost and taxpayers attitude. The research outlined in this paper aims to address the
tax gap of non filling, under reporting and under payment. The specific aim of the research is to
gain insight into the factors that influence the tax compliance among SMEs in Kenya by focusing
on those operating within Nairobi’s Industrial area. It is expected that the findings will help
decision makers and particularly K.R.A gain a better understanding of SMEs enabling them to
plan and design services more effectively.
24
CHAPTER THREE RESEARCH METHODOLOGY
3.1 Introduction
This chapter outlined the research methodology as the method of achieving the purpose of the
study. This includes the research design, target population, sampling for the study, data
collection instruments and data analysis. Section 3.2 outlines the research design.
3.2 Research design
A descriptive survey design was adopted for this study. A descriptive survey design was best for
this study as it describes characteristics associated with the subject population, and in particular
factors that make them behave the way they do. According to Cooper and Schindler (Cooper,
2003) descriptive design discovers and measures the cause and effect of relationships between
variables. Mugenda and Mugenda (Mugenda, 2003) state that a descriptive research determines
and reports the way things are and attempt to describe possible behavior, attitude, values and
characteristics of such things. The study used a descriptive design because it enables the
researcher to collect a large quantity of in-depth information about the population being studied.
A survey design was appropriate as the data required for analysis needed to be collected from a
large population that is SMEs operating in Nairobi’s Industrial area.
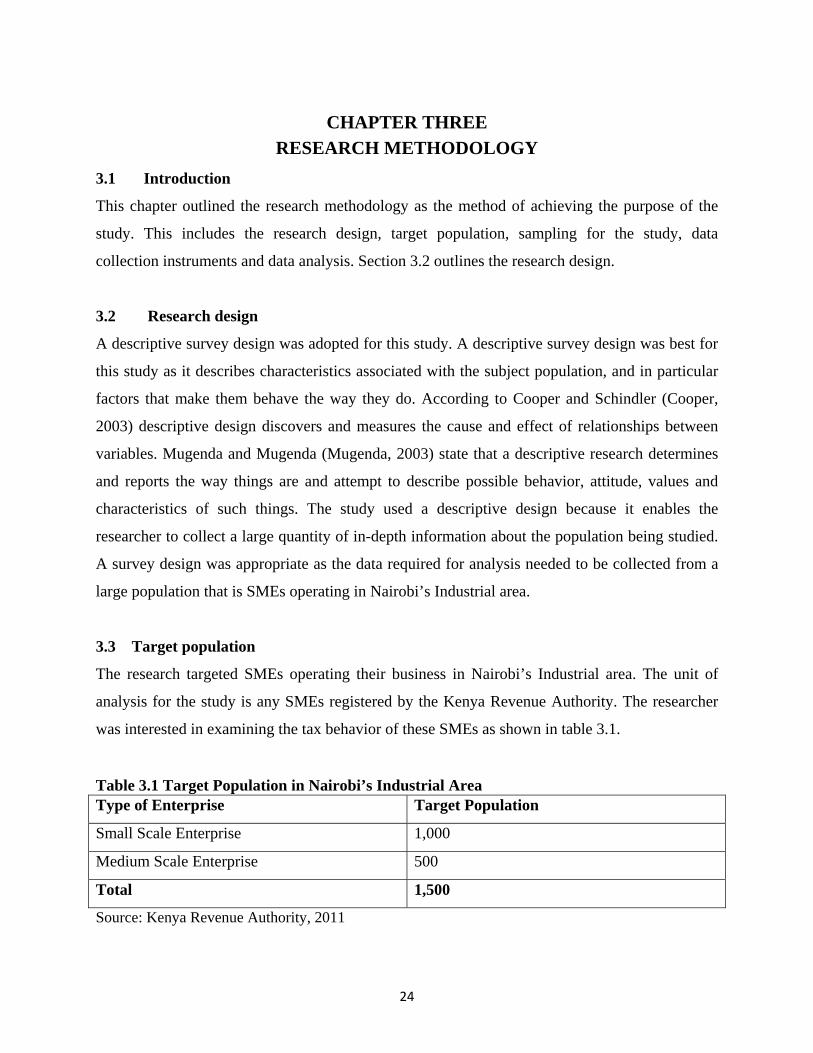
3.3 Target population
The research targeted SMEs operating their business in Nairobi’s Industrial area. The unit of
analysis for the study is any SMEs registered by the Kenya Revenue Authority. The researcher
was interested in examining the tax behavior of these SMEs as shown in table 3.1.
Table 3.1 Target Population in Nairobi’s Industrial Area Type of Enterprise Target Population
Small Scale Enterprise 1,000
Medium Scale Enterprise 500
Total 1,500
Source: Kenya Revenue Authority, 2011
25
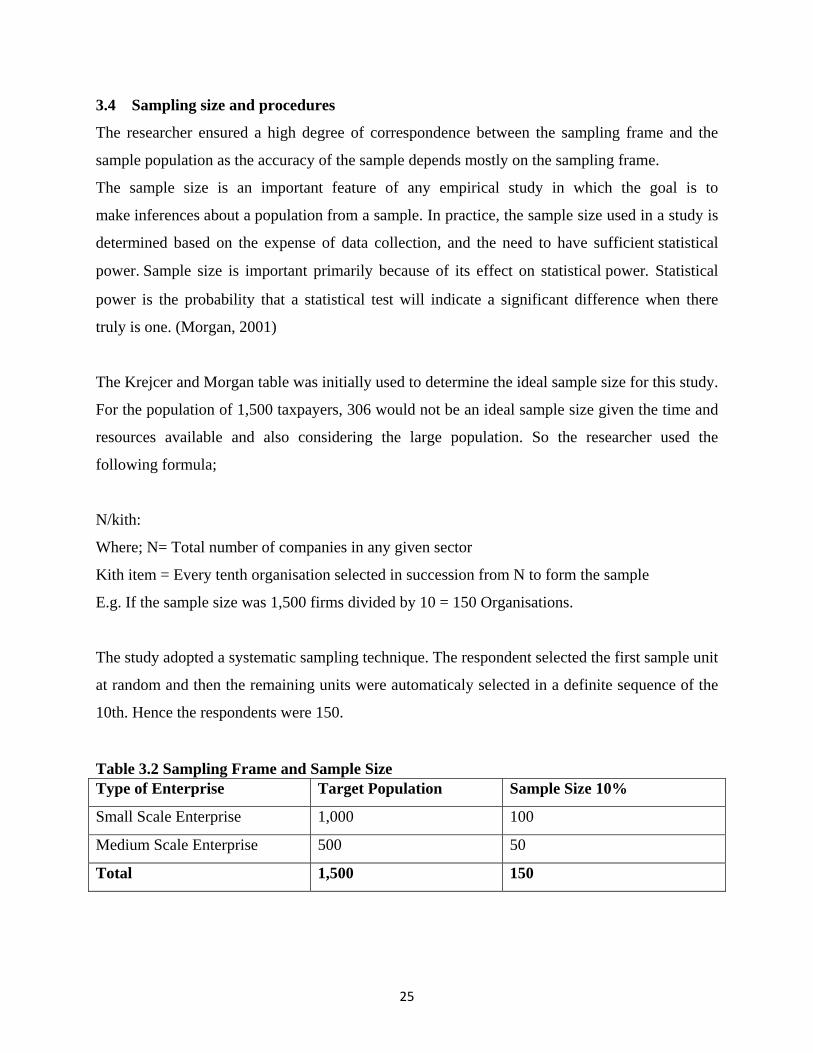
3.4 Sampling size and procedures
The researcher ensured a high degree of correspondence between the sampling frame and the
sample population as the accuracy of the sample depends mostly on the sampling frame.
The sample size is an important feature of any empirical study in which the goal is to
make inferences about a population from a sample. In practice, the sample size used in a study is
determined based on the expense of data collection, and the need to have sufficient statistical
power. Sample size is important primarily because of its effect on statistical power. Statistical
power is the probability that a statistical test will indicate a significant difference when there
truly is one. (Morgan, 2001)
The Krejcer and Morgan table was initially used to determine the ideal sample size for this study.
For the population of 1,500 taxpayers, 306 would not be an ideal sample size given the time and
resources available and also considering the large population. So the researcher used the
following formula;
N/kith:
Where; N= Total number of companies in any given sector
Kith item = Every tenth organisation selected in succession from N to form the sample
E.g. If the sample size was 1,500 firms divided by 10 = 150 Organisations.
The study adopted a systematic sampling technique. The respondent selected the first sample unit
at random and then the remaining units were automaticaly selected in a definite sequence of the
10th. Hence the respondents were 150.
Table 3.2 Sampling Frame and Sample Size Type of Enterprise Target Population Sample Size 10%
Small Scale Enterprise 1,000 100
Medium Scale Enterprise 500 50
Total 1,500 150

26
3.5 Data collection methods
The study employed primary data collection. Primary data was collected through a self-
administered questionnaire. The questionnaire adopted structured open ended as well as closed
questions. The responses in the questionnaires helped in gaining an in-depth understanding of the
factors influencing tax compliance among SMEs
The research instruments used in this study was a questionnaire and in depth interviews. A
questionnaire gathered statistically meaningful data on the perspectives of respondents on an
issue of interest based on a set of predetermined questions. The questionnaire had three major
sections. The first dealt with the biographic data, the second section dealt with the factors
influencing tax compliance while the third section dealt with strategies that can improve tax
compliance in Kenya.
The researcher administered the questionnaires assisted by two research assistants. The
researcher supervised the assistants and trained them. The researcher endeavored to win the trust
of the respondents and allowed the respondents to tell their stories freely to maximize on their
self disclosure as it is a sensitive topic in Kenya. During the interview section the researcher
targeted selected Business owners, Managing directors, Finance managers and accountants with
a lot wealth in taxation matters. The researcher allowed the respondents to tell their stories freely
to maximize their self disclosure. In developing the questionnaire items the fixed choice and
open ended formats was used. Some items adopted a Likert scale.
In depth interviews belong in philosophical terms to the constructivist or interpretive tradition.
These kinds of interviews are functional in collating narratives of subjective realities or
experiences. These interviews contain detailed expressions of the meanings and effect that
phenomenon have on respondent. In depth interviews seek to explore the social and human
phenomenon by asking the why question (Silverman, 2006). For the interviews, the researcher
had predetermined questions grouped together to address particular objectives of the study.
Majority of the questions were unstructured, so as to enable the researcher gather as much
information as possible in regards to the factors influencing tax compliance among SMEs. Using
interview method of data collection ensured that the questions were understood thus minimizing

27
the risk of collecting incomplete and wrong information as it is with questionnaires particularly
when people are unable to understand the questions properly. This data collection method was
considered by the researcher as appropriate in providing safe basis for generalization and high
accuracy.
3.5.1 Validity of Research Instrument
Validity is the degree to which an instrument measures what it is supposed to measure. (Kothari,
2004) Therefore, the term refers to the extent to which an instrument asks the right questions in
terms of accuracy. The content validity of the research instrument for this study was determined
through piloting, where the responses of the subjects were checked against the research
objectives. For a research instrument to be considered valid, the content selected and included in
the questionnaire must be relevant to the variable being investigated. The researcher performed
the pilot test with a randomly selected sample of fifteen SMEs in Nairobi’s Central Business
District. Content validity of the instrument was also tested using a research expert’s opinion, who
was the research supervisor. The research expert independently judged the validity of the items
in the questionnaire in relation to research objectives.
3.5.2 Reliability of Research Instrument
Reliability of an instrument is the measure of the degree to which a research instrument yields
consistent results or data after repeated trials (Cooper, 2003). To test the reliability of the
questionnaire as a research instrument, a test-retest technique was employed in which
questionnaires were administering to a group of SMEs with similar characteristics as the actual
sample size but not included in the final study. The test was repeated after two weeks. This was
to establish the extent to which the questionnaire elicited the same responses every time it is
administered. The findings were found to be consistent and therefore the questionnaire proved to
be a reliable research instrument.
3.6 Data collection procedure
Data collection procedures began upon approval of the proposal after its defense. An
introduction letter was issued to the sampled entities for consent to collect data from the
respondents. The questionnaires were administered to the respondents directly by the researcher
28
with the help of two research assistants in order to save on time. For those respondents who were
not available for a sit-in filling of the questionnaire, it was e-mailed to them. The interviews were
conducted at a time and place convenient to the respondents to provide an environment in which
the respondents would feel free to participate.
3.7 Data Analysis
A careful analysis of the completed questionnaires was done to ensure that the collected data was
accurate and consistent with other information gathered. Pre-processing of collected data was
done through editing to detect errors and omissions and making of corrections where necessary.
Data was analyzed by coding according to variables in the study for efficiency so as to reduce
the replies given by respondents to a small number of classes. After completion of coding, the
data was classified on the basis of common characteristics and attributes. The raw data was then
assembled and tabulated in form of statistical tables to allow for further analysis. The Statistical
Package for Social Sciences (SPSS) was used to aid in the statistical analysis of the data.
3.8 Ethical issues
This research endeavored to obtain an informed consent from the respondents before undertaking
to collect data from the field. Objectives of the research were explained and made known to the
respondents so as to solicit their informed consent. High level of confidentiality on the
information provided by respondents through interview or questionnaires was maintained.
3.9 Operationalization of variables
The measurement of variables in the study and relationship between the variables and the survey
questions are illustrated in table 3.3.

29
Table 3.3: Operationalization of Variables Objective Variable Indicator Measurement
Scale
Tools of
Analysis
Type of
Analysis
To ascertain the
extent to which
tax rates explain
tax compliance
behavior.
Independent The high tax rate.
Stiff tax penalties
Several tax heads
Nominal Mean
Percentages
Descriptive
statistics
To establish the
relationship
between
availability of
tax information
and tax
compliance by
SME’s.
Independent
Level of access
Knowledge and
understanding of
Taxation by SME’s.
Nominal
Mean
Percentages
Frequencies
Descriptive
Statistics
Inferential
Statistics
To determine the
extent to which
tax compliance
costs explain tax
compliance.
Independent Cost of hiring staff
Cost of record keeping
Amount of time and
money spent in tax
compliance.
Ordinal Mean
Percentages
Descriptive
statistics
To determine
how attitude of
SME’s about tax
influence tax
compliance.
Independent
Access to public goods
Peer Attitude and
motivation associated
with tax compliance.
Ordinal
Percentages
Mean
Descriptive
Statistics
Government
Policies and
Regulations
Moderating Guidelines for
registration for tax and
tax declaration
provided in the law.
Ordinal Scale Descriptive
Statistics

30
CHAPTER FOUR
DATA ANALYSIS, PRESENTATION AND INTERPRETATION
4.1 Introduction
This chapter presented the data analysis, presentation and interpretation of findings on the data
collected from registered SMEs in Nairobi’s Industrial area, based on the factors influencing tax
compliance. The main objective of the study was to evaluate the factors that influence the tax
compliance among SMEs in Nairobi Industrial area, Kenya. The study sought to answer the
research questions: To what extent do tax rate in Kenya explain tax compliance among SMEs?
How does the availability of tax information influence tax compliance among SMEs? To what
extent do tax compliance costs explain tax compliance among SMEs? How does the attitude of
SMEs about tax influence tax compliance? The study sampled 150 registered taxpayers operating
within Nairobi’s Industrial Area. The data was interpreted as per the research questions.
4.2 Response Rate
The study targeted 150 respondents in collecting data with regard to the factors that influence tax
compliance among Small and medium enterprises in Nairobi’s Industrial area. Out of the 150
questionnaires issued, 120 were returned, giving an 80% response rate, as shown in Table 4.1.
This was commendable given the prejudices which taxpayers normally harbor toward questions
relating to their tax affairs. According to Mugenda and Mugenda (2003) a 50% response rate is
adequate, 60% good and above 70% is rated very good. This also concurs with (Kothari, 2004)
assertion that a response rate of 50% is adequate, while a response rate greater than 70% is very
good. This implies that based on these assertions; the response rate for this study, 80% is very
good.
Table 4.1: Response Rate Respondents Questionnaires Questionnaires
Administered Filled and Returned
Percentage
Total 150 120 80
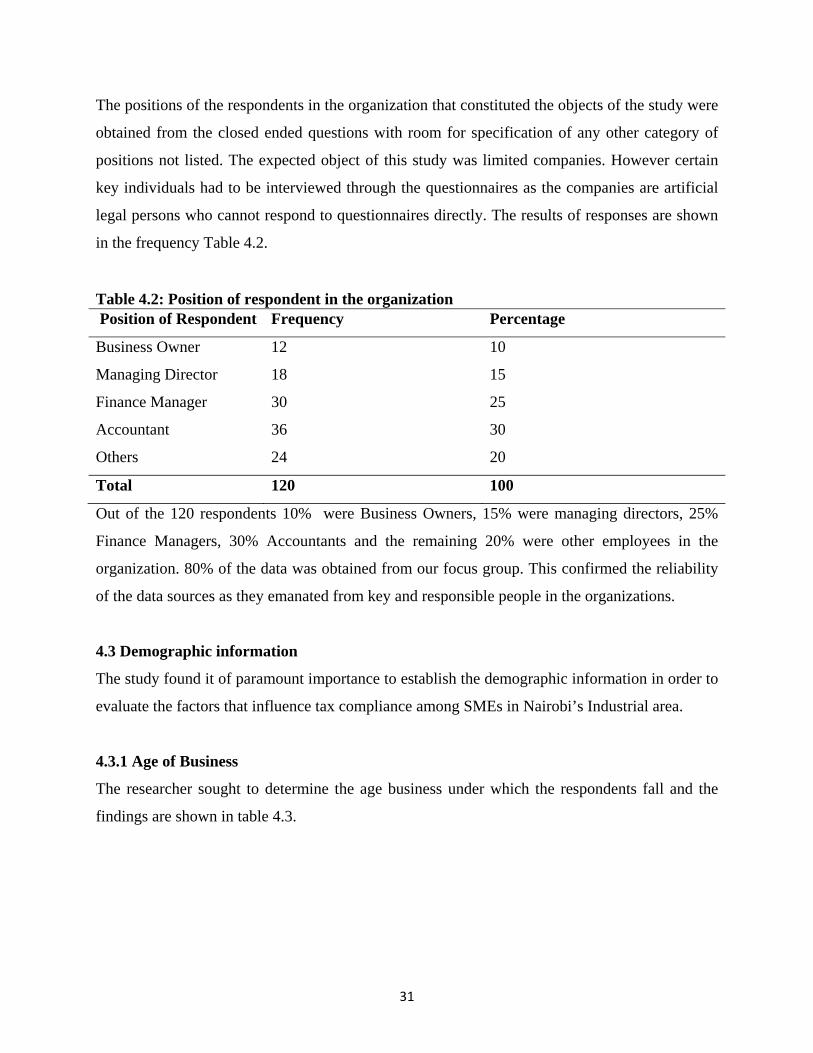
31
The positions of the respondents in the organization that constituted the objects of the study were
obtained from the closed ended questions with room for specification of any other category of
positions not listed. The expected object of this study was limited companies. However certain
key individuals had to be interviewed through the questionnaires as the companies are artificial
legal persons who cannot respond to questionnaires directly. The results of responses are shown
in the frequency Table 4.2.
Table 4.2: Position of respondent in the organization Position of Respondent Frequency Percentage
Business Owner 12 10
Managing Director 18 15
Finance Manager
Accountant
30
36
25
30
Others 24 20
Total 120 100
Out of the 120 respondents 10% were Business Owners, 15% were managing directors, 25%
Finance Managers, 30% Accountants and the remaining 20% were other employees in the
organization. 80% of the data was obtained from our focus group. This confirmed the reliability
of the data sources as they emanated from key and responsible people in the organizations.
4.3 Demographic information
The study found it of paramount importance to establish the demographic information in order to
evaluate the factors that influence tax compliance among SMEs in Nairobi’s Industrial area.
4.3.1 Age of Business
The researcher sought to determine the age business under which the respondents fall and the
findings are shown in table 4.3.
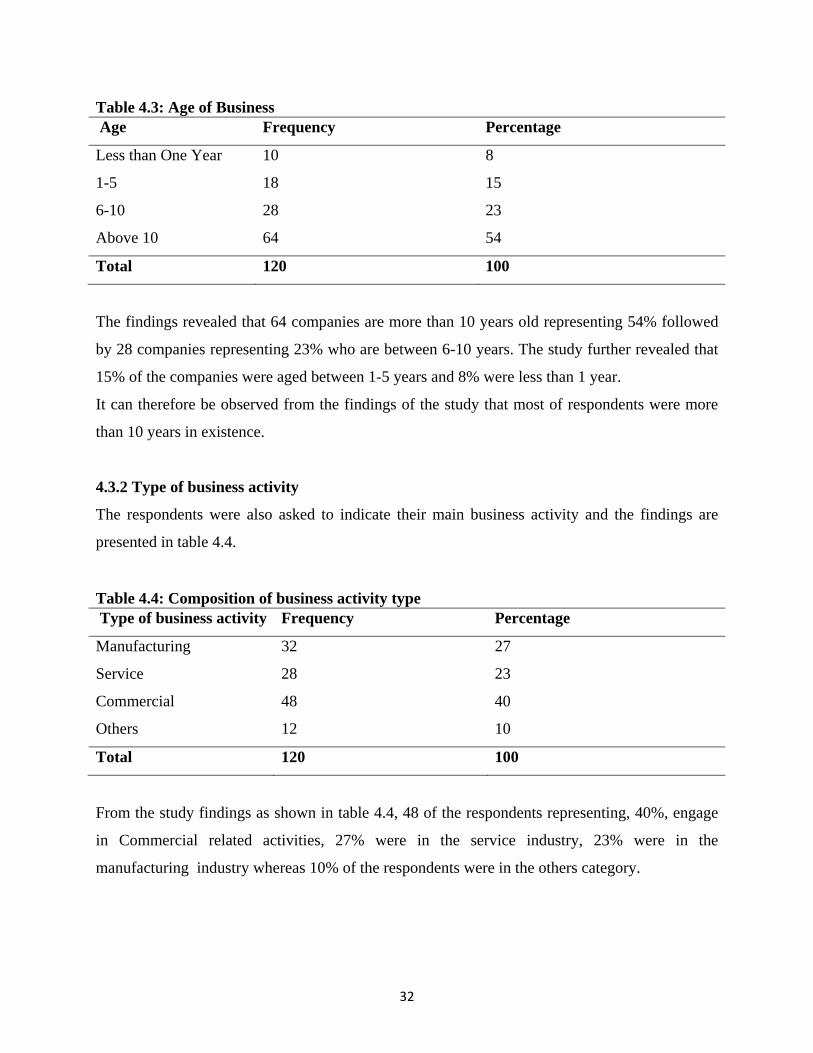
32
Table 4.3: Age of Business Age Frequency Percentage
Less than One Year 10 8
1-5 18 15
6-10 28 23
Above 10 64 54
Total 120 100
The findings revealed that 64 companies are more than 10 years old representing 54% followed
by 28 companies representing 23% who are between 6-10 years. The study further revealed that
15% of the companies were aged between 1-5 years and 8% were less than 1 year.
It can therefore be observed from the findings of the study that most of respondents were more
than 10 years in existence.
4.3.2 Type of business activity
The respondents were also asked to indicate their main business activity and the findings are
presented in table 4.4.
Table 4.4: Composition of business activity type Type of business activity Frequency Percentage
Manufacturing 32 27
Service 28 23
Commercial 48 40
Others 12 10
Total 120 100
From the study findings as shown in table 4.4, 48 of the respondents representing, 40%, engage
in Commercial related activities, 27% were in the service industry, 23% were in the
manufacturing industry whereas 10% of the respondents were in the others category.
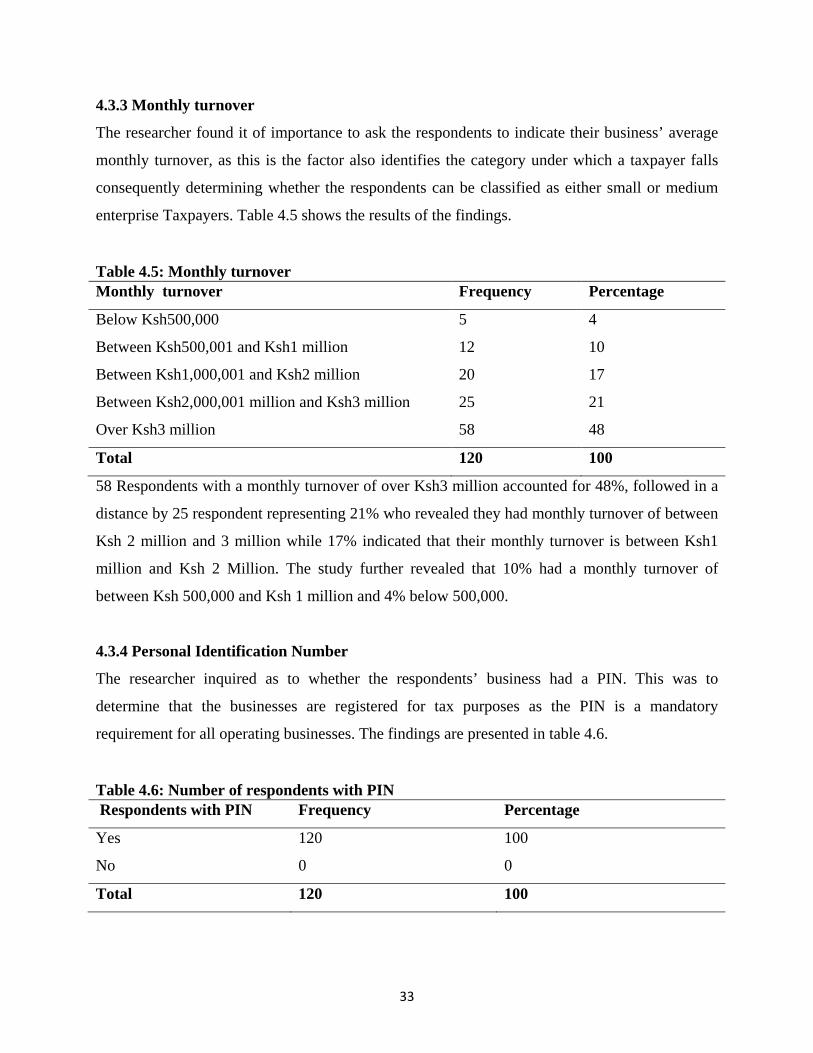
33
4.3.3 Monthly turnover
The researcher found it of importance to ask the respondents to indicate their business’ average
monthly turnover, as this is the factor also identifies the category under which a taxpayer falls
consequently determining whether the respondents can be classified as either small or medium
enterprise Taxpayers. Table 4.5 shows the results of the findings.
Table 4.5: Monthly turnover Monthly turnover Frequency Percentage
Below Ksh500,000 5 4
Between Ksh500,001 and Ksh1 million 12 10
Between Ksh1,000,001 and Ksh2 million 20 17
Between Ksh2,000,001 million and Ksh3 million 25 21
Over Ksh3 million 58 48
Total 120 100
58 Respondents with a monthly turnover of over Ksh3 million accounted for 48%, followed in a
distance by 25 respondent representing 21% who revealed they had monthly turnover of between
Ksh 2 million and 3 million while 17% indicated that their monthly turnover is between Ksh1
million and Ksh 2 Million. The study further revealed that 10% had a monthly turnover of
between Ksh 500,000 and Ksh 1 million and 4% below 500,000.
4.3.4 Personal Identification Number
The researcher inquired as to whether the respondents’ business had a PIN. This was to
determine that the businesses are registered for tax purposes as the PIN is a mandatory
requirement for all operating businesses. The findings are presented in table 4.6.
Table 4.6: Number of respondents with PIN Respondents with PIN Frequency Percentage
Yes 120 100
No 0 0
Total 120 100
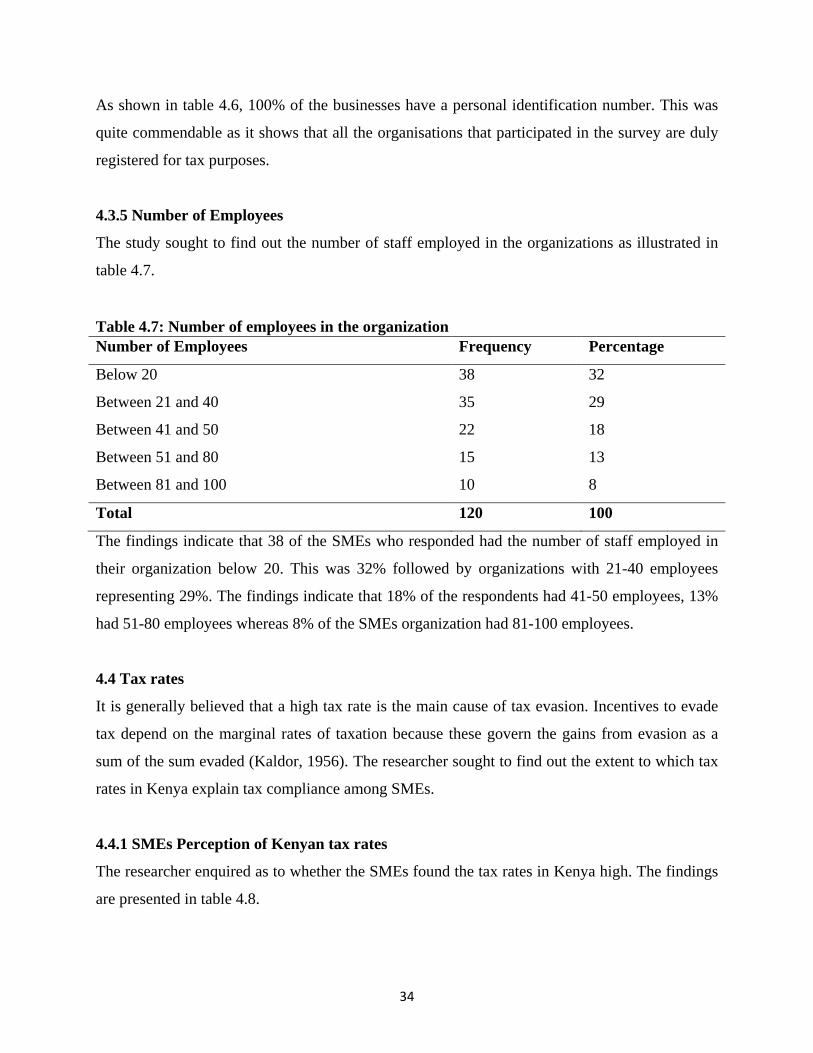
34
As shown in table 4.6, 100% of the businesses have a personal identification number. This was
quite commendable as it shows that all the organisations that participated in the survey are duly
registered for tax purposes.
4.3.5 Number of Employees
The study sought to find out the number of staff employed in the organizations as illustrated in
table 4.7.
Table 4.7: Number of employees in the organization Number of Employees Frequency Percentage
Below 20 38 32
Between 21 and 40 35 29
Between 41 and 50 22 18
Between 51 and 80 15 13
Between 81 and 100 10 8
Total 120 100
The findings indicate that 38 of the SMEs who responded had the number of staff employed in
their organization below 20. This was 32% followed by organizations with 21-40 employees
representing 29%. The findings indicate that 18% of the respondents had 41-50 employees, 13%
had 51-80 employees whereas 8% of the SMEs organization had 81-100 employees.
4.4 Tax rates
It is generally believed that a high tax rate is the main cause of tax evasion. Incentives to evade
tax depend on the marginal rates of taxation because these govern the gains from evasion as a
sum of the sum evaded (Kaldor, 1956). The researcher sought to find out the extent to which tax
rates in Kenya explain tax compliance among SMEs.
4.4.1 SMEs Perception of Kenyan tax rates
The researcher enquired as to whether the SMEs found the tax rates in Kenya high. The findings
are presented in table 4.8.

35
Table 4.8: Perception of Kenyan tax rates Perception of tax rate Frequency Percentage
The tax rates are high. 86 72
The tax rates are not high. 34 28
Total 120 100
86 organisations out of 120 which is 72% of the respondents think that the tax rates in Kenya are
high while those who do not think that it is high were a minority and accounted for only 28%. It
can therefore be deduced that to the majority of SMEs find the tax rates high.
4.4.2 SMEs Perception of the different types of taxes
The other aspect reviewed in the study is whether they are many different types of taxes that are
usually payable to KRA. The results of the study are shown in Table 4.9.
Table 4.9: Perception of forms of taxes Perception Frequency Percentage
They are several types of taxes. 116 97
The taxes are not too many. 4 3
Total 120 100
The results of the study showed that 97% of the respondents felt that the tax heads are too many,
while only 3% felt otherwise. This is a clear indicator that majority of SMEs feel that the number
and types of taxes demanded from them are too many.
4.4.3 Tax amount payable as a factor influencing SMEs tax compliance
The researcher sought to determine whether the SMEs compliance is influenced by the amount
of tax to be paid. The findings are presented in table 4.10.
Table 4.10: Assessment of tax amount payable as a factor influencing tax compliance Opinion Frequency Percentage
Tax amount to be paid influences compliance. 73 61
Tax amount to be paid does not influence compliance. 47 39
Total 120 100
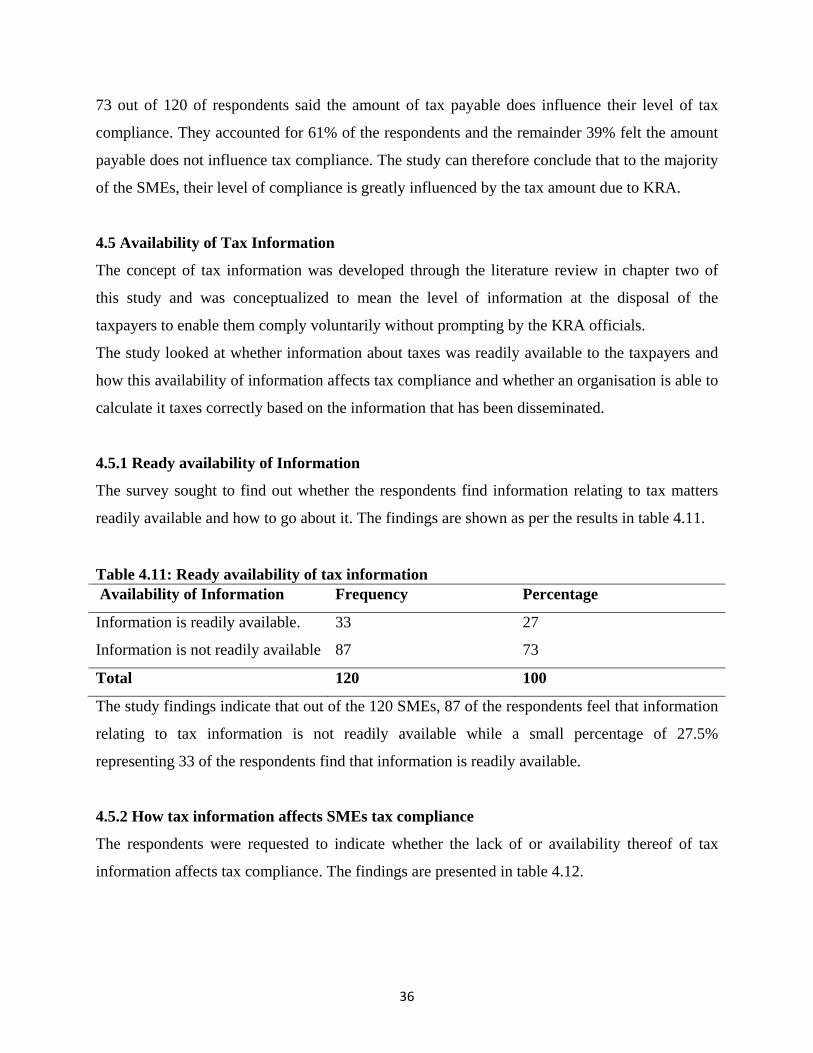
36
73 out of 120 of respondents said the amount of tax payable does influence their level of tax
compliance. They accounted for 61% of the respondents and the remainder 39% felt the amount
payable does not influence tax compliance. The study can therefore conclude that to the majority
of the SMEs, their level of compliance is greatly influenced by the tax amount due to KRA.
4.5 Availability of Tax Information
The concept of tax information was developed through the literature review in chapter two of
this study and was conceptualized to mean the level of information at the disposal of the
taxpayers to enable them comply voluntarily without prompting by the KRA officials.
The study looked at whether information about taxes was readily available to the taxpayers and
how this availability of information affects tax compliance and whether an organisation is able to
calculate it taxes correctly based on the information that has been disseminated.
4.5.1 Ready availability of Information
The survey sought to find out whether the respondents find information relating to tax matters
readily available and how to go about it. The findings are shown as per the results in table 4.11.
Table 4.11: Ready availability of tax information Availability of Information Frequency Percentage
Information is readily available. 33 27
Information is not readily available 87 73
Total 120 100
The study findings indicate that out of the 120 SMEs, 87 of the respondents feel that information
relating to tax information is not readily available while a small percentage of 27.5%
representing 33 of the respondents find that information is readily available.
4.5.2 How tax information affects SMEs tax compliance
The respondents were requested to indicate whether the lack of or availability thereof of tax
information affects tax compliance. The findings are presented in table 4.12.

37
Table 4.12: Extent to which lack of tax information affects tax compliance Opinion Frequency Percentage
Not at all 5 4
Less Extent 13 11
Some Extent 32 27
Great Extent 40 33
Very Great extent 30 25
Total 120 100
The results as shown in table 4.12 revealed that 25% of the respondents agreed that the lack of
tax information affects their level of tax compliance to a very great extent. 33% of the
respondents felt that their level of tax compliance was affected to a great extent by lack of tax
information. This was followed by 27% who felt it was to some extent, 11% to a less extent and
4% not at all. It is therefore clear that for the majority of SMEs, the lack of tax information
affects tax compliance to a very great extent
.
4.5.3 Correct calculation of taxes based on available information
The study sought to establish whether SMEs are able to correctly calculate the taxes based on the
available information. This was in a bid to determine whether the level of information relating to
taxes affect tax compliance. Table 4.13 presents the findings.
Table 4.13: Correct calculation of taxes Opinion Frequency Percentage
We calculate the correct taxes. 31 26
We do not calculate the correct taxes. 21 17
We are not sure. 68 57
Total 120 100
The results of the findings as shown in table 4.13 revealed that 57% of the respondents are not
sure whether they calculate the correct taxes, 26% felt they are able to correctly calculate taxes
due from them while 17% feel that they do not calculate the correct taxes, all based on the
availability of tax information at their disposal. It can therefore be concluded that based on the

38
information relating to tax available to SMEs, the majority of taxpayers are not able to correctly
calculate tax due from them and may hence end up paying the incorrect amount.
4.5.4 Correlation Matrix
Correlation between availability of tax information and ability to correctly calculate tax and
SMEs tax compliance
Information
about tax
matters is
readily
available.
Ability to
correctly
calculate the
tax due and
payable.
Level of Tax
compliance.
Information about tax
matters is readily
available.
Pearson Correlation 1 .730** .648**
Sig. (2-tailed) .000 .000
N 120 120 120
Ability to correctly
calculate tax due and
payable.
Pearson Correlation .730** 1 .353**
Sig. (2-tailed) .000 .000
N 120 120 120
Level of tax compliance.
Pearson Correlation .648** .353** 1
Sig. (2-tailed) .000 .000
N 120 120 120
**. Correlation is significant at the 0.01 level (2-tailed). Analysis of correlation shows that ready availability of information about tax matters is
positively related to the taxpayers’ ability to correctly calculate the tax due and payable
with a correlation coefficient of 0.730. The correlation coefficient is within the acceptable
range of between -1 and 1. It can therefore be deduced with confidence that there is a
genuine relationship between the ready availability of information on tax, the ability to
correctly calculate tax payable and the level of tax compliance; the more access an SME
has to information on tax, the more likely it is that they will be able to correctly calculate
tax due from them and consequently, the more likely it is that their level of compliance
will be high.
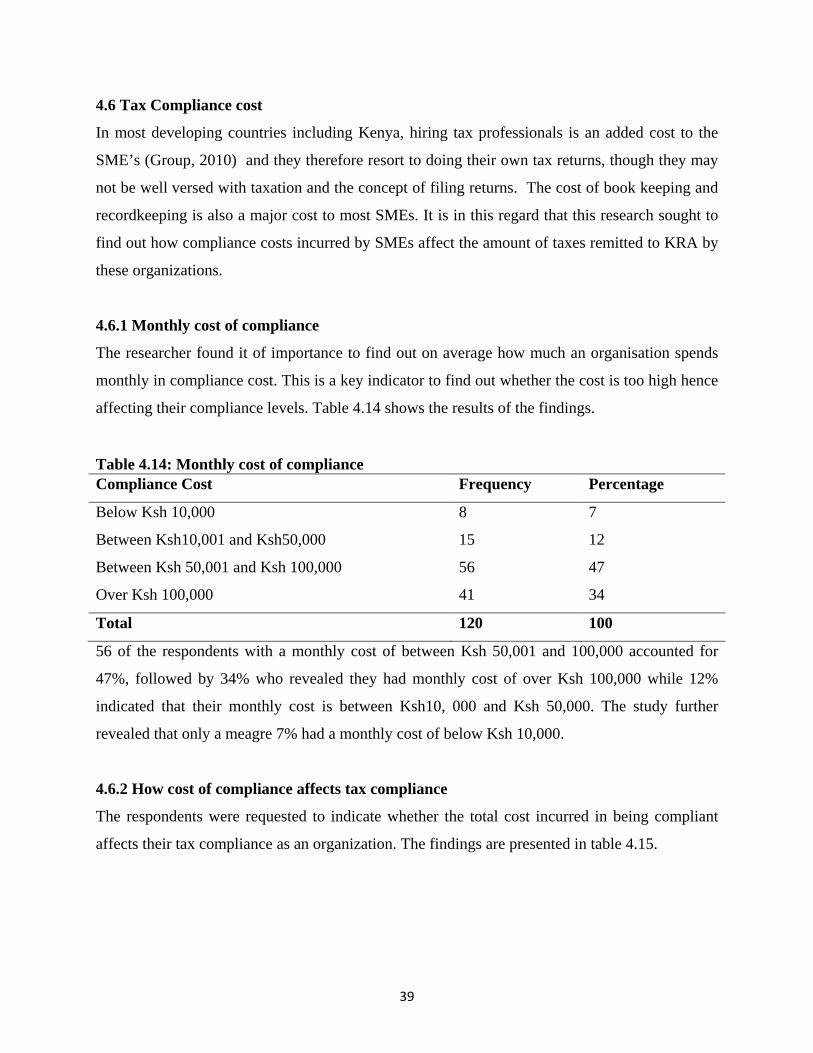
39
4.6 Tax Compliance cost
In most developing countries including Kenya, hiring tax professionals is an added cost to the
SME’s (Group, 2010) and they therefore resort to doing their own tax returns, though they may
not be well versed with taxation and the concept of filing returns. The cost of book keeping and
recordkeeping is also a major cost to most SMEs. It is in this regard that this research sought to
find out how compliance costs incurred by SMEs affect the amount of taxes remitted to KRA by
these organizations.
4.6.1 Monthly cost of compliance
The researcher found it of importance to find out on average how much an organisation spends
monthly in compliance cost. This is a key indicator to find out whether the cost is too high hence
affecting their compliance levels. Table 4.14 shows the results of the findings.
Table 4.14: Monthly cost of compliance Compliance Cost Frequency Percentage
Below Ksh 10,000 8 7
Between Ksh10,001 and Ksh50,000 15 12
Between Ksh 50,001 and Ksh 100,000 56 47
Over Ksh 100,000 41 34
Total 120 100
56 of the respondents with a monthly cost of between Ksh 50,001 and 100,000 accounted for
47%, followed by 34% who revealed they had monthly cost of over Ksh 100,000 while 12%
indicated that their monthly cost is between Ksh10, 000 and Ksh 50,000. The study further
revealed that only a meagre 7% had a monthly cost of below Ksh 10,000.
4.6.2 How cost of compliance affects tax compliance
The respondents were requested to indicate whether the total cost incurred in being compliant
affects their tax compliance as an organization. The findings are presented in table 4.15.
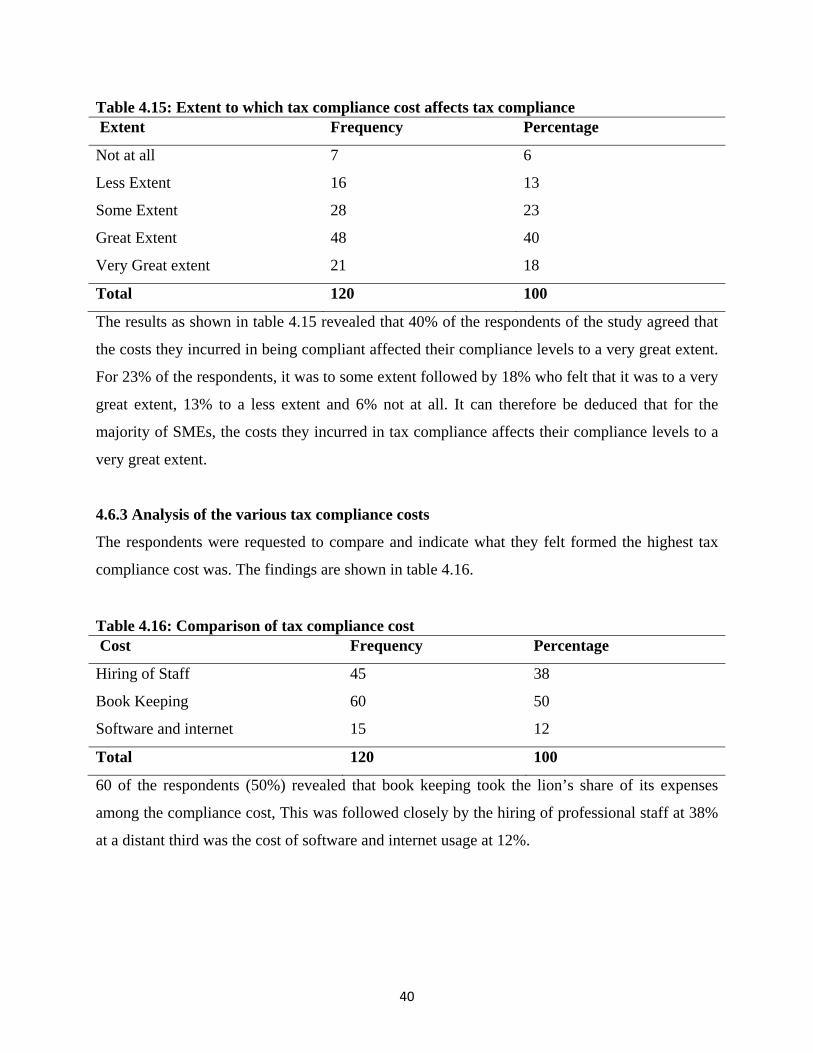
40
Table 4.15: Extent to which tax compliance cost affects tax compliance Extent Frequency Percentage
Not at all 7 6
Less Extent 16 13
Some Extent 28 23
Great Extent 48 40
Very Great extent 21 18
Total 120 100
The results as shown in table 4.15 revealed that 40% of the respondents of the study agreed that
the costs they incurred in being compliant affected their compliance levels to a very great extent.
For 23% of the respondents, it was to some extent followed by 18% who felt that it was to a very
great extent, 13% to a less extent and 6% not at all. It can therefore be deduced that for the
majority of SMEs, the costs they incurred in tax compliance affects their compliance levels to a
very great extent.
4.6.3 Analysis of the various tax compliance costs
The respondents were requested to compare and indicate what they felt formed the highest tax
compliance cost was. The findings are shown in table 4.16.
Table 4.16: Comparison of tax compliance cost Cost Frequency Percentage
Hiring of Staff 45 38
Book Keeping 60 50
Software and internet 15 12
Total 120 100
60 of the respondents (50%) revealed that book keeping took the lion’s share of its expenses
among the compliance cost, This was followed closely by the hiring of professional staff at 38%
at a distant third was the cost of software and internet usage at 12%.

41
4.6 SMEs attitude about tax
The concept of attitude was reviewed through the literature review and interpreted to mean the
measure of confidence a taxpayer has in a tax system. When a taxpayer feels there is unfairness
in a tax system, the voluntary tax compliance becomes replaced with intentional tax evasion. The
study therefore sought to examine how attitude about tax affects the income tax compliance of
SMEs in Nairobi’s Industrial area. The aspects looked at in this study include the extent of
access by companies to public utilities financed by taxes, the value companies attach to the
responsibility of paying taxes to the government, and the main reasons for the various attitudinal
positions taken by the companies.
4.6.1 Access to public utilities and services The study showed the results in respect of the extent to which access public utilities financed
taxes as outlined in Table 4.17.
Table 4.17: Extent of access to public utilities and services funded by tax Opinion Frequency Percentage
Not at all 14 11
Less Extent 36 30
Some Extent 42 35
Great Extent 20 17
Very Great extent 8 7
Total 120 100
The results of the study were that 35% of the respondents felt that they had access to public
utilities financed by the funds collected from taxes to some extent. 30% of the respondents felt
that they access to public utilities to a less extent, and 17% of the respondents felt that they had
to a great extent, 11% not at all while 7% to a great extent access to public utilities financed by
fund generated from taxes. The expectation of the study was that when the extent of access to
public utilities by companies is high then the level of voluntary income tax compliance will be
enhanced greatly. In this study only 59% accessed the public utilities to some, great and very
great extent.

42
4.6.2 Value the company places on payment of taxes
The other aspect examined was the extent which SMEs value the payment of income tax to the
Kenyan government. The results of the study were as per table 4.18.
Table 4.18: Extent to which companies value payment of tax to Kenyan government Opinion Frequency Percentage
Not at all 3 2
Less Extent 12 10
Some Extent 24 20
Great Extent 67 56
Very Great extent 14 12
Total 120 100
The results as shown in table 4.18 revealed that 56% of the respondents value payment of taxes
to the government to a great extent.20% to some extent. The study further revealed that for 12%
it is to a very great extent, 10% to a less extent and 2% not at all. The expectation of the study
was that companies’ voluntary compliance would be high when companies attach a lot of value
to the payment of taxes to the government. In this study 88% attach value to some, great and
very great extent to the payment of taxes to the government of Kenya. Thus we can conclude that
most SMEs do value payment of taxes.
4.6.3 Respondents view on the value other SMEs places on payment of taxes The other aspect examined was the extent which the respondent viewed how other SMEs value
the payment of income tax to the Kenyan government. The results of the study were as per table
4.19.
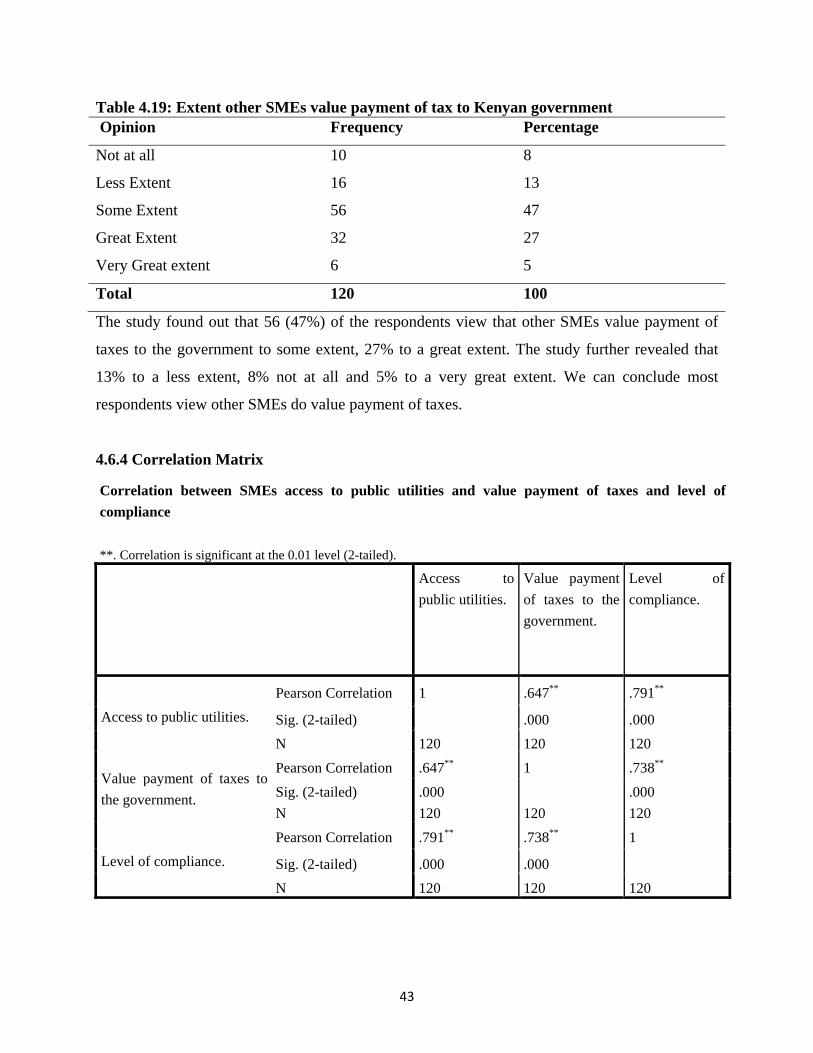
43
Table 4.19: Extent other SMEs value payment of tax to Kenyan government Opinion Frequency Percentage
Not at all 10 8
Less Extent 16 13
Some Extent 56 47
Great Extent 32 27
Very Great extent 6 5
Total 120 100
The study found out that 56 (47%) of the respondents view that other SMEs value payment of
taxes to the government to some extent, 27% to a great extent. The study further revealed that
13% to a less extent, 8% not at all and 5% to a very great extent. We can conclude most
respondents view other SMEs do value payment of taxes.
4.6.4 Correlation Matrix
Correlation between SMEs access to public utilities and value payment of taxes and level of
compliance
**. Correlation is significant at the 0.01 level (2-tailed).
Access to
public utilities.
Value payment
of taxes to the
government.
Level of
compliance.
Access to public utilities.
Pearson Correlation 1 .647** .791**
Sig. (2-tailed) .000 .000
N 120 120 120
Value payment of taxes to
the government.
Pearson Correlation .647** 1 .738**
Sig. (2-tailed) .000 .000
N 120 120 120
Level of compliance.
Pearson Correlation .791** .738** 1
Sig. (2-tailed) .000 .000
N 120 120 120
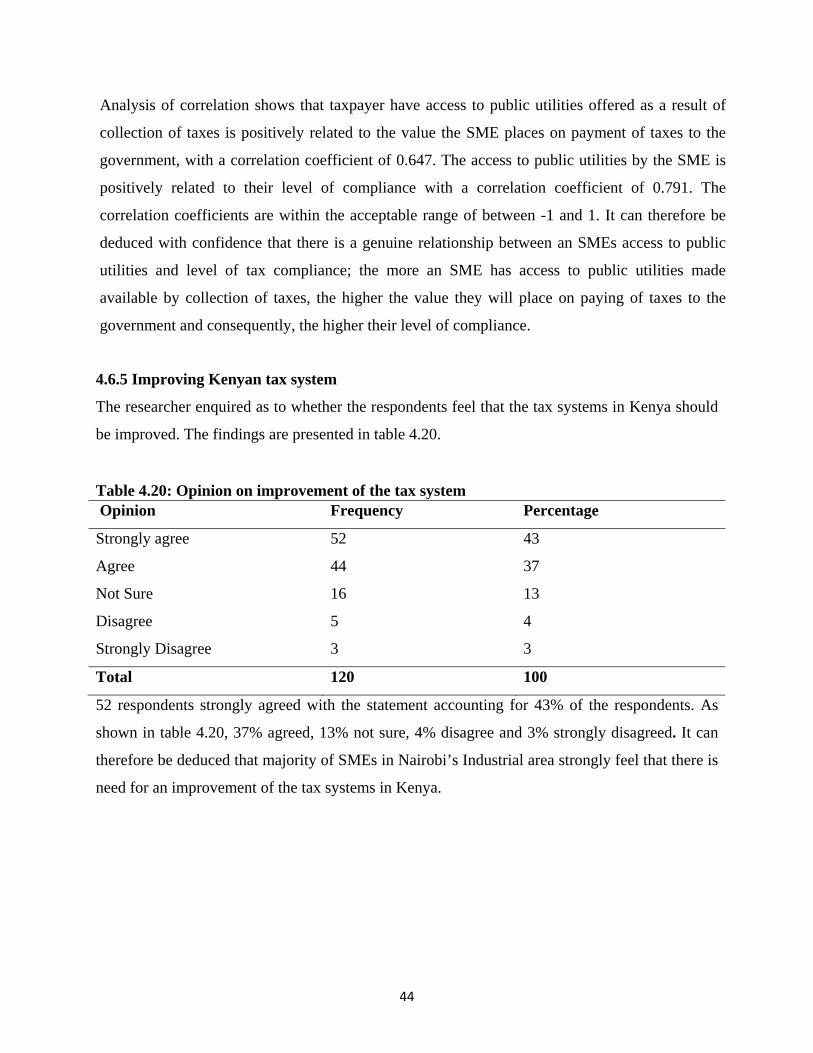
44
Analysis of correlation shows that taxpayer have access to public utilities offered as a result of
collection of taxes is positively related to the value the SME places on payment of taxes to the
government, with a correlation coefficient of 0.647. The access to public utilities by the SME is
positively related to their level of compliance with a correlation coefficient of 0.791. The
correlation coefficients are within the acceptable range of between -1 and 1. It can therefore be
deduced with confidence that there is a genuine relationship between an SMEs access to public
utilities and level of tax compliance; the more an SME has access to public utilities made
available by collection of taxes, the higher the value they will place on paying of taxes to the
government and consequently, the higher their level of compliance.
4.6.5 Improving Kenyan tax system
The researcher enquired as to whether the respondents feel that the tax systems in Kenya should
be improved. The findings are presented in table 4.20.
Table 4.20: Opinion on improvement of the tax system Opinion Frequency Percentage
Strongly agree 52 43
Agree 44 37
Not Sure 16 13
Disagree 5 4
Strongly Disagree 3 3
Total 120 100
52 respondents strongly agreed with the statement accounting for 43% of the respondents. As
shown in table 4.20, 37% agreed, 13% not sure, 4% disagree and 3% strongly disagreed. It can
therefore be deduced that majority of SMEs in Nairobi’s Industrial area strongly feel that there is
need for an improvement of the tax systems in Kenya.
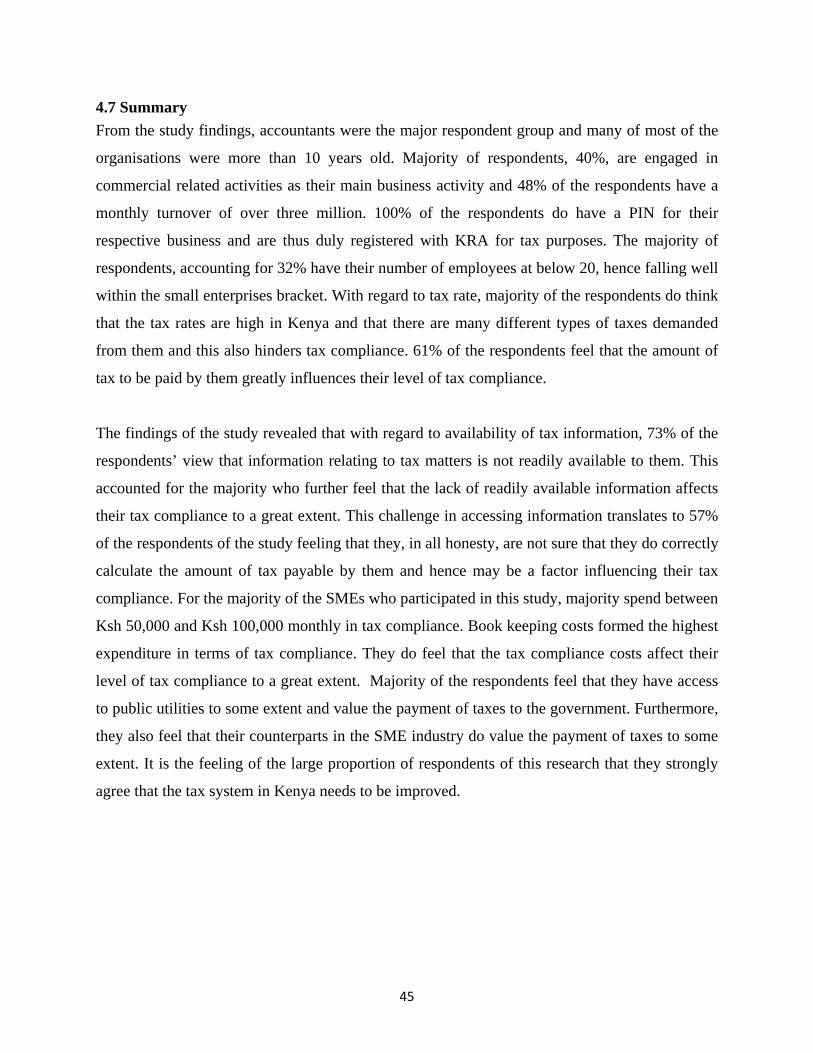
45
4.7 Summary
From the study findings, accountants were the major respondent group and many of most of the
organisations were more than 10 years old. Majority of respondents, 40%, are engaged in
commercial related activities as their main business activity and 48% of the respondents have a
monthly turnover of over three million. 100% of the respondents do have a PIN for their
respective business and are thus duly registered with KRA for tax purposes. The majority of
respondents, accounting for 32% have their number of employees at below 20, hence falling well
within the small enterprises bracket. With regard to tax rate, majority of the respondents do think
that the tax rates are high in Kenya and that there are many different types of taxes demanded
from them and this also hinders tax compliance. 61% of the respondents feel that the amount of
tax to be paid by them greatly influences their level of tax compliance.
The findings of the study revealed that with regard to availability of tax information, 73% of the
respondents’ view that information relating to tax matters is not readily available to them. This
accounted for the majority who further feel that the lack of readily available information affects
their tax compliance to a great extent. This challenge in accessing information translates to 57%
of the respondents of the study feeling that they, in all honesty, are not sure that they do correctly
calculate the amount of tax payable by them and hence may be a factor influencing their tax
compliance. For the majority of the SMEs who participated in this study, majority spend between
Ksh 50,000 and Ksh 100,000 monthly in tax compliance. Book keeping costs formed the highest
expenditure in terms of tax compliance. They do feel that the tax compliance costs affect their
level of tax compliance to a great extent. Majority of the respondents feel that they have access
to public utilities to some extent and value the payment of taxes to the government. Furthermore,
they also feel that their counterparts in the SME industry do value the payment of taxes to some
extent. It is the feeling of the large proportion of respondents of this research that they strongly
agree that the tax system in Kenya needs to be improved.
46
CHAPTER FIVE
SUMMARY OF THE FINDINGS, CONCLUSIONS AND
RECOMMENDATIONS
5.1 Introduction
In this chapter the research findings were summarized, then conclusion and recommendations to
the study are drawn and research gaps are identified for future studies as the study aimed at
determining factors influencing tax compliance among SMEs in Nairobi’s Industrial area,
Kenya.
5.2 Summary of findings
The researcher sampled 150 Medium and Small taxpayers operating within Nairobi’s Industrial
area. 120 of the targeted respondents filled in and returned the questionnaires, giving an 80%
response rate. Relying on the responses given by the respondents, the researcher came up with
findings which were used to make conclusions and give recommendations.
From the study findings, most of the SMEs are more than 10 years old. 48 of respondents
representing 40% are engaged in commercial related activities as their business type and 48% of
the respondents have a monthly turnover of over three million. 100% of the respondents do have
a PIN for their respective business and for 32% of the respondents have staff below 20.
5.2.1 Tax rates
72% of the respondents think that the tax rates in Kenya are high. 97% agree that there are
several types of tax heads which reduce tax compliance as most SMEs are not aware of ways to
comply with the many different forms of taxes. 61% of the respondents agree that the tax amount
due for payment does influence the tax to be paid. This is a clear indication that KRA and the
Kenyan Government have not put in places ways of harmonizing the tax rates.
5.2.2 Availability of tax information
With regard to availability of tax information as a factor, the findings revealed that 87 (73%) of
the respondents agree that information about taxes is not readily available, and 85% attest that
the lack of information affects SMEs when it comes to tax compliance and 57% have are not
even sure whether they are able to calculate the correct taxes.
47
5.2.3 Tax Compliance Cost
81% of the respondents which is 97 out of the 120 organisations spend more than 50,000 in a
month in expenses which are directly related to tax compliance costs. Majority of the
respondents agree that the cost of complying also affects tax compliance among SMEs, 50%
ranks book keeping as the major cost when it comes to expenses directly related to tax
compliance.
5.2.4 Taxpayers Attitude towards tax
59% of the respondents have access to public utilities this leaves a big group who fell they have
no access to public utilities. This undermines tax compliance. However, the study did reveal that
most SMEs do value payment of taxes to the government and they also feel that their
counterparts, other SMEs, do also value the payment of taxes.
5.3 Discussion of findings
This section gives a detailed discussion of the findings from this study as per the objectives that the study sought to achieve. 5.3.1 Tax rates
SMEs feel that tax rates for the already several tax heads, that is, corporate tax, VAT and Pay As
You Earn (PAYE) are either high or very high. A high tax rate erodes taxpayer’s earnings and
disposable incomes thus will have a negative effect on consumption and investments. It will also
encourage tax avoidance and evasion as the opportunity cost to evade is high. This may be an
expected reaction from taxpayers as no single taxpayer can rate a tax rate as 'low'. There is also
the problem of defining the line between 'high', 'low' and 'fair'. The findings of this study do
therefore agree with those of other researchers as discussed in the literature review. As interest
rates go higher, the opportunity cost to evade becomes higher and thus taxpayers get tempted to
evade. (Friedland, 1978). Kenya’s tax rates compare favorably with that of her neighbors,
Uganda and Tanzania, who charge the same rates for corporate tax, withholding tax and VAT.
However, given the large percentage of respondents who feel that they are high, there is need to
revise these rates and make them more attractive to them. This will enhance tax collection by
reducing evasion and enhance investments. For PAYE, a revision of tax bands should be pursued
in addition to reducing tax rates which will also reduce the poverty level.

48
The respondents rate the current penalties as ‘very high’ or ‘high’. This is true for VAT and
income tax. The respondents observe that the present 2% per month interest is extremely high
and punitive to allow any organization to effect payments. Sometimes penalties and interest
alone are higher than the principal tax. Penalties and interest arise out of late filing of returns
and non-payment of taxes and non-disclosure of taxable income which is discovered during
audit. Given the self-assessment system, audits can only be done after returns have been
submitted. Hence there is some lapse of time from the time a return is submitted and the time
when audit is carried out. Interest starts accruing from due date of the tax until the time an audit
is complete. The penalty and interest rates are specified in the respective Acts.
Since these are legislative requirements, KRA can only act to reduce interest by carrying out
audits more frequently and at regular intervals. The other option is to change law and thus lower
rates. Studies done show that high penalties increase compliance but marginally (Alm, 2001).
5.3.2 Availability of tax information
The findings of this study revealed that majority of the respondents have a challenge in accessing
information about taxes. As earlier discussed in the literature review section of this study, less
educated tax payers are less exposed to tax compliance information and are less informed about
relevant tax compliance information and thus are more prone to tax evasion. Some tax payers
find the complexity of tax information more difficult to understand than others. This complexity
may lead to unintentional non compliance if tax payers have problems maybe in filling of tax
returns. SMEs generally find the information given by KRA fairly inadequate to enable them
complete the tax returns expected from them. Some find the process to be complicated; requiring
too much information thus a waste of time and resources, it is thus clear that there is a strong
case for improvement of the information available. Majority of the respondents are in agreement
that Taxpayer Education/Seminars plays a positive role in enhancing tax compliance. Taxpayer
education is one of the powerful tools of enhancing compliance. At this forum, knowledge is
passed to taxpayers exhaustively and this enhances future compliance and through this
knowledge the taxpayer is able to know the various rights and obligations accruing from services
offered by KRA. Communication channels open up and this enhances friendly relations between
the taxpayer and the tax authority. Consequently, taxpayers also feel part and parcel of the policy
making process. KRA should strive to open ‘Help’ counters and website for taxpayers to seek

49
help in dispensing information. Well-trained and knowledgeable staff should man the counters.
They should also enhance taxpayer education and remove the ambiguities in the VAT and
Income Tax Acts.
5.3.3 Tax Compliance Cost
High compliance costs can result in tax avoidance, tax fraud, and inhibit investment by way of
diminishing competitiveness of the country in terms of taxation attractiveness. (Ojeka, 2012).The
respondents of this study feel that consultancy charges and the cost of hiring professional staff is
expensive. Concerning the book keeping issues, it can be concluded that many SMEs resort to
engaging professional tax consultants to be able accomplish the statutory requirement to
accompany annual returns with audited accounts, and at the same time a good number of
companies have computerized their accounting system to go around the requirement. All these
efforts do amount to some cost borne by the taxpayer, and since there is a positive correlation
between book keeping and income tax compliance; the government can endeavor to improve
compliance by promoting sound accounting practices. Compliance costs, in form of fees charged
by tax consultants, are positively correlated with noncompliance behavior and thus negatively
correlated with tax compliance behavior. Obtaining a tax clearance certificate is the highest
motivation to comply with tax laws and regulations for most SME operators in Kenya. Because
of the perceived technical nature of return filing, most taxpayers are forced to employ
professional tax consultants. The Acts are legal documents with legal language which is
complicated for ordinary taxpayers to comprehend and given the numerous legal amendments
every year, taxpayers lack the necessary expertise to complete the tax returns. It also saves time
and money by engaging a tax consultant to complete the return in the most efficient manner.
However, few taxpayers can afford such professional services and in most cases hire non-
professional agents like family members and friends. These sub-standard agents charge moderate
fees but offer unprofessional services that result in misrepresentation of the business
records/status.
5.3.4 Taxpayers Attitude towards tax
In terms of attitude of taxpayers toward payment of taxes to the government it can be concluded
that majority of the companies had at least some access to the public utilities financed by taxes

50
while at the same time valued the payment of taxes to the government of Kenya .This factor can
be exploited to improve income tax compliance. With regards to perceptions of bureaucracy and
corruption by tax administrators and government spending, those who engage in tax evasion
often justify such behavior by suggesting that the government wastes tax revenue and spends
unwisely; such arguments can decrease voluntary compliance in the long run (Braithwaite,
2009) It is expected that if the government spends taxpayers’ money wisely, for example on
basic facilities like education, health and safety and public transportation, it is assumed that
voluntary compliance will increase. In contrast, if taxpayers perceive that the government spends
too much on something else, taxpayers might feel betrayed and attempt to evade. In judging their
own behavior, people tend to believe the cause is due to external attributes and cannot be tax
compliant. Therefore, the government should spend taxpayers’ money wisely so that tax
compliance will increase, thus the tax collection will also increase.
5.4 Conclusions
Findings from the study reveal that all the identified factors have a direct influence on the tax
compliance among SMEs. The tax compliance factors examined included tax rates, availability
of tax information, tax compliance cost, and attitude of taxpayers toward payment of income tax.
The study confirmed that KRA why uses both voluntary tax compliance strategy alongside the
deterrent measures strategy. Most of the respondents felt the tax rates should be reviewed, thus
the government should relook at the tax rates currently charged to SMEs. On availability of tax
information, information received by taxpayers is an important factor that contributes to their
understanding of tax responsibilities, especially regarding registration and filing requirements.
KRA should address the complexities of annual tax returns, periodic variations in the tax laws,
and levels of penalties and fines. They should pass this information regularly to SMEs via
various channels like tax Seminars, Booklets and Media Channels. This will greatly improve the
SMEs level of compliance as the great complexity associated with tax matters will be
demystified.
On tax compliance cost, the companies confirmed to engaging the services of tax agents and
professional staff to handle accounting issues. This cost is normally a burden to the SMEs.
51
SMES should be encouraged to improve their bookkeeping by offering incentives, such as
application of a lower presumptive tax rate for small businesses meeting certain recordkeeping
standards. The government should also engage the small holders in sensitization forums on how
to reduce the cost associated with tax compliance.
With regard to the attitude of taxpayers toward payment of taxes to the government, the study
revealed that most of the companies felt they had at least some access to the public utilities
financed by taxes while at the same time valued the payment of taxes to the government of
Kenya .Taxpayers’ attitudes encourages tax compliance in Kenya and what influence the
taxpayers’ attitudes, equally affect the taxpayers’ compliance with the tax requirement i.e.
taxpayers’ attitudes encourages tax compliance in Kenya.
5.5 Recommendations of the study
Based on the findings of this study, the researcher came up with several recommendations to
encourage tax compliance among SMEs. These include;
1. Tax rates and penalty rates
Consider lowering the tax rates to enhance collections. Lower tax rates make it less
attractive to evade taxes as opposed to high rates. High penalty rates will increase
compliance but only marginally. This penalty rates should be kept at an optimum level
not to discourage taxpayers. Also consider uniform penalty rates for all tax heads.
2. Tax Return forms
The returns ought to be simplified and accompanying notes reconstructed into plain
language that can be understood by all taxpayers. They should also be clear and brief but
complete in detail to enable the taxpayers fill the return. In addition, where possible,
simple computed examples should be incorporated in the notes. Returns should also be
made readily accessible to both manual and computerized taxpayers. This will mean
making available return forms in the KRA web site for downloading by the taxpayers
with computerized systems.
52
3. Taxpayer education
To enhance compliance there is need to intensify taxpayer education in terms of
increasing the number of sessions and broadening coverage to include tax consultants.
This will enlighten the taxpayers on existing law and any other tax liability. This will also
provide a forum for taxpayers to air their complaints and or compliments
4. Audits
Increased rates of audits that seek to reduce the time between audits will improve
compliance, as taxpayers will fear the risk of being audited and penalized. The audits
should also be broadened to cover a wider area with a possibility of conducting joint
income tax and VAT audits based on modern audit tools. These measures are expected to
result in enhanced tax collection improved sharing of information and time saving both to
the authority and to the taxpayers. The criteria for selection of files for audits should be
based on information given in returns and not random or subjective selection. This will
make audits more productive and informative.
5. Improved Services
The authority should strive to give taxpayers high quality services as stipulated in the
corporate plan. Most of the services provided by the authority like refunds, remissions
and dispute resolutions were rated poor and thus there is every reason to improve them.
Where possible, officers should endeavor to adhere to the taxpayers’ charter in terms of
service provision to taxpayers. ‘Help’ counters manned by technical and knowledgeable
staff should be introduced and enhanced throughout the authority’s offices to bring
services closer to the taxpayers. This will also improve communication between the
taxpayers and the authority. Other services worth introducing include payment of VAT
directly into the banks- as is the case with PAYE, and modern technology such as
telephone exchanges.
6. Training
There is need to continuously train technical staff to keep abreast with the tax law and
any other changes therein. This way, the officers will impart proper and correct advice to
taxpayers during the time of audits. Customer care lessons should form an integral part of
this training. Recruitment of new taxpayers by the authority should be intensified and
enhanced. This will broaden the tax base and reduce pressure on the complying taxpayers

53
5.6 Suggestions for further research
This study proposes the following areas for further study:
1. Factors affecting income tax compliance among SMEs in other regions of Kenya.
2. A study on the relationship between voluntary tax compliance strategy and the deterrence
measures kind of strategy.
3. Factors that motivate SMEs to be tax compliant.
54
REFERENCES
Alm, J. (2001). Tax Compliance & Tax Administration,. Georgia State University: Andrew Young School of Policy Studies.
Andreoni J. Errard, B. &. (1998). Tax Compliane; Journal of Economic Literature.
Association, A. &. (1998). Increasing Taxpayers compliance. A discussion of the Negligence penalty .
Bank, A. D. (2010). Domestic Resource Mobilization for Poverty Reduction in East Africa.
Bauer I.L. (2005). Tax administrations and SME in Developing Countries.
Braithwaite, V. (2009). Taxing Democracy; Understanding tax Avoidance and Evasion. Ashgate.
Charles, K. (2006). Environmental Economics. Oxford University Press.
Chipeta, C. (2002). The Second Economy and Tax Yield in Malawi. Research Paper No 113 .
Cobham, A. (2005). Tax evasion, tax avoidance and development finance.
Coolidge, J. W. (2010). Tax Compliance Cost Surveys : Using data to design targeted reforms.
Cooper, R. D. (2003). Business Research Methods. McGraw-Hill School Education Group.
Cummings, R. G. (2007). Effects of Tax Morale on Tax Compliance. Experiemental and Survey Evidence .
Derwent, J. (2000). Dismantling the Barriers: . A Pan-European Survey on Use of Patents in SMEs .
Development, O. f. (2004). Compliance Risk Management. Managing and Improving tax compliance .

55
Feld, L. &. (2002). Tax evasion and voting: An experimental analysis, . Kyklos Journal , 197-222.
Feldstein, A. J. (2002). Handbook of Public Economics. Amsterdam: Elesevier.
Friedland, N. M. (1978). A simulation study of income tax evasion, Journal of Public Economics,. 107-116.
Gee, R. W. (2006). Three views on the ethics of Tax Evasion. Journal of Business Ethics .
Government Of Kenya, F. B. (2004). Finance Bill. The Budget Estimates Ministry of finance, Kenya Gazette No.32, Bill No. 11 of 10th June.
Government of Republic of Kenya, G. A. (2012). Public Expenditure and Financial Accountability.
Griffiths, N. C. (2005). Increasing Tax Revenue in Sub Saharn Africa; A case study of Kenya. Oxford: Oxford Council .
Naibei, G. M. (2012). Relationship between Income Size, Inspection and VAT Compliance: Evidence from Private Firms in Kenya. African Research Review. ISSN: 1994-9057.
K.R.A. (2011). Fifth Corporate Plan. Kenya Revenue Authority. K.R.A.
K.R.A. (2013). Annual Tax Report. Nairobi: Government Press.
Kaldor, N. (Vol. 23, No. 2. (1955 - 1956), pp. 83-100). Alternative Theories of Distribution-The Review of Economic Studies.
Karingi, B. a. (2005). The tax Reform Experience. Nairobi.
Kirchler, E. M. (2001). Why Pay Taxes? . A review of Tax compliance Decisions , 173-194.
Kothari, C. (2004). Research Methodology; Methods and Techniques. New Delhi, India: New Age International (P) Ltd.
56
Lewis, A. W. (2005). The New Economic Mind;The social Psychology of Economic Behaviour. New York: Harvester.
Masinde, M. M. (2010). Unlocking the Revenue.
Mika Mungaya. (IJMBS Vol. 2, ISSue 3, July - Sept 2012). Study of Tax System Impact on the Growth of Sme. With Reference to Shinyanga .
Mocetti, G. B. (Vol 18 No.6). Tax Morale and Public Spending Inefficiency. International Tax and Public Finance .
Morgan, R. H. (2001). Sample Size Estimation: How Many Individuals Should Be Studied? Radiology .
Mugenda, M. A. (1999). Research Methods; Qualitative and Quantitative Approach. Acts Press.
Muiru, R. (2012). Intricate tax laws a major hindrance to doing business in Kenya.
Ojeka, O. W. (2012). Factors that effect Tax compliance among SMEs in North Central Nigeria.
Osambo, A. (2009). Effects of Taxation on SMEs.
Parliament, K. (2008). Parliamentary Budget Office. Taxation and Budget .
Porcano M, T. (2011). Correlates of Tax Evasion. Journal of Economic Psychology , 47-67.
Programme, A. P. (2012). The Budget Focus: Informal Sector and Taxation in Kenya .
Rile, R. M. (2011). The cost of tax abuse; A paper on the cost of Tax evasion. Tax Justice Network: .
Sandmo, M. A. (1972). Income tax Evasion; A theoretical analysis. Jounal of Public Economics .
Spicer, M. &. (1976). Understanding tax Evasion, Journal of Public .
Tax World Organisation, D. (April 7 1999).

57
Trivedi, V. S. (2005). Attitudes,Incentives and Tax compliance. 29-61.
Vogel, J. (1974). Taxation and public opinion in Sweden. National Tax Journal , 499-514.
Wanjohi, M. S. (2010). Taxpayer's Attitude and Tax Compliance Behaviour in SMEs. Taxpayer's Attitude and Tax Compliance Behaviour in SMEs .
Waweru, M. G. (2004). Tax administration in Kenya; Problems and Prospects. AGM of FKE.
World, W. B. (2004). World Development Report. 19.
Yitzhaki, S. (2002). Tax avoidance, evasion, and administration, Handbook of Public Economics,. Cambridge,.
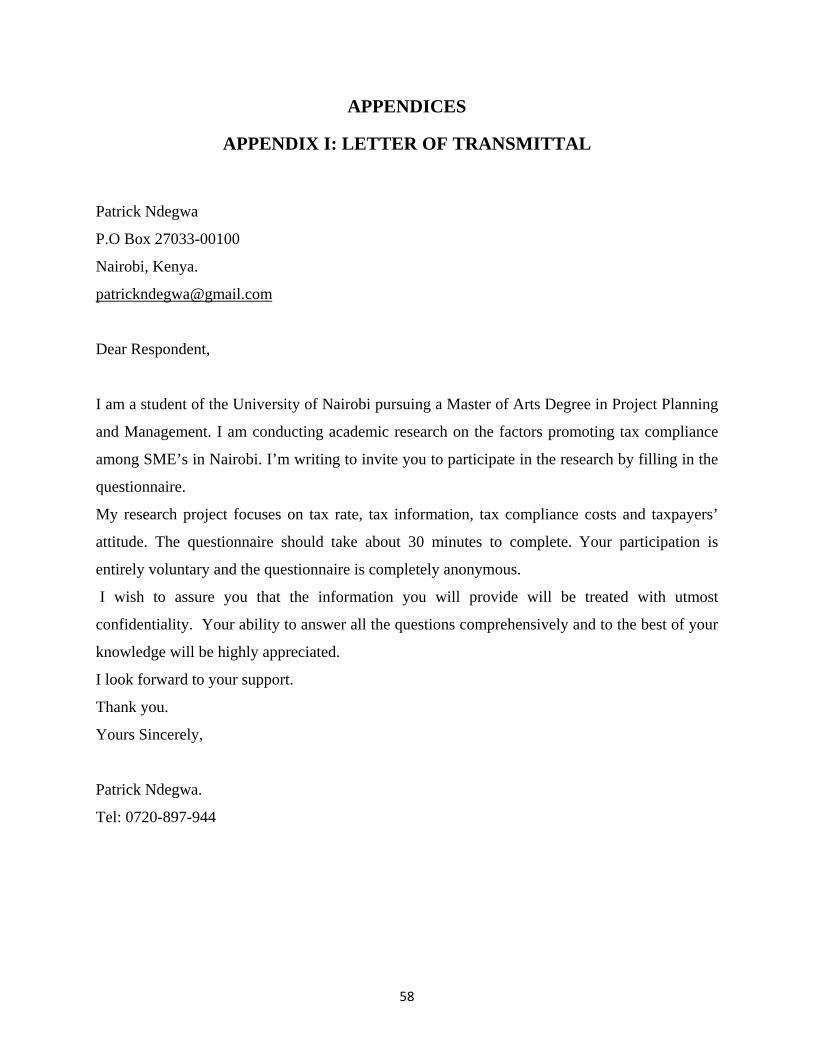
58
APPENDICES
APPENDIX I: LETTER OF TRANSMITTAL
Patrick Ndegwa
P.O Box 27033-00100
Nairobi, Kenya.
Dear Respondent,
I am a student of the University of Nairobi pursuing a Master of Arts Degree in Project Planning
and Management. I am conducting academic research on the factors promoting tax compliance
among SME’s in Nairobi. I’m writing to invite you to participate in the research by filling in the
questionnaire.
My research project focuses on tax rate, tax information, tax compliance costs and taxpayers’
attitude. The questionnaire should take about 30 minutes to complete. Your participation is
entirely voluntary and the questionnaire is completely anonymous.
I wish to assure you that the information you will provide will be treated with utmost
confidentiality. Your ability to answer all the questions comprehensively and to the best of your
knowledge will be highly appreciated.
I look forward to your support.
Thank you.
Yours Sincerely,
Patrick Ndegwa.
Tel: 0720-897-944

59
APPENDIX II: QUESTIONNAIRE Instructions
This questionnaire is designed to collect information on the factors affecting tax compliance in
SMEs in Nairobi’s Industrial Area, Kenya. The information obtained will only be used for
academic purposes and shall be treated in utmost confidence. You are requested to complete this
questionnaire as honestly and objectively as possible.
Please tick in the appropriate box and also fill in the blank spaces provided for those questions
where elaborate answers are required. Use the space at the back of this questionnaire if you need
more space for your responses.
SECTION A: GENERAL INFORMATION
1. Name of SME (Optional).................................................................................................... 2. Position of respondent in the organization.
Business Owner Managing Directors Finance Managers Accountant Others (Specify)………………………………………………….
3. How long has the organisation been in existence?
Less than One year 1-5 Years 6-10 Years More than 10 Years
4. What is your main business activity? ………………………………………………………………………………………………………………………………………………………………………………………………………………
1. What is the Nature of your Business?
Manufacturing Service Commercial Others( Specify) ………………………………………………………………
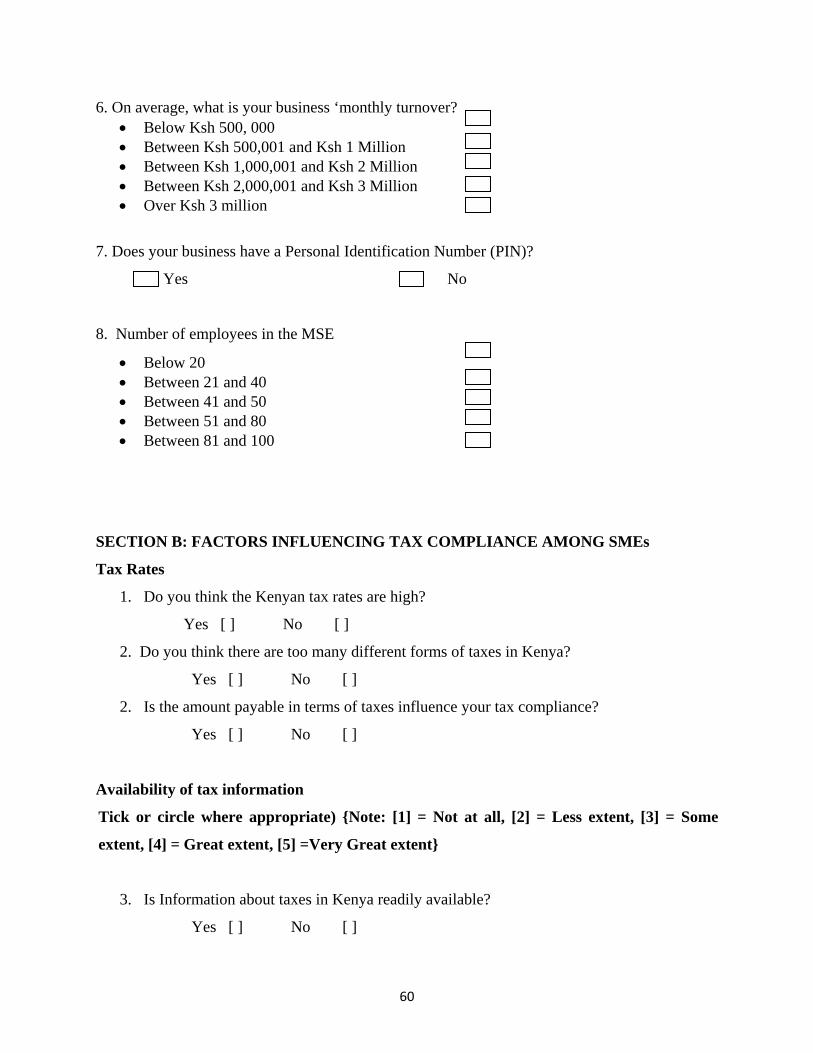
60
6. On average, what is your business ‘monthly turnover? Below Ksh 500, 000 Between Ksh 500,001 and Ksh 1 Million Between Ksh 1,000,001 and Ksh 2 Million Between Ksh 2,000,001 and Ksh 3 Million Over Ksh 3 million
7. Does your business have a Personal Identification Number (PIN)?
Y Yes No
8. Number of employees in the MSE
Below 20 Between 21 and 40 Between 41 and 50 Between 51 and 80 Between 81 and 100
SECTION B: FACTORS INFLUENCING TAX COMPLIANCE AMONG SMEs
Tax Rates
1. Do you think the Kenyan tax rates are high?
Yes [ ] No [ ]
2. Do you think there are too many different forms of taxes in Kenya?
Yes [ ] No [ ]
2. Is the amount payable in terms of taxes influence your tax compliance?
Yes [ ] No [ ]
Availability of tax information
Tick or circle where appropriate) {Note: [1] = Not at all, [2] = Less extent, [3] = Some
extent, [4] = Great extent, [5] =Very Great extent}
3. Is Information about taxes in Kenya readily available?
Yes [ ] No [ ]
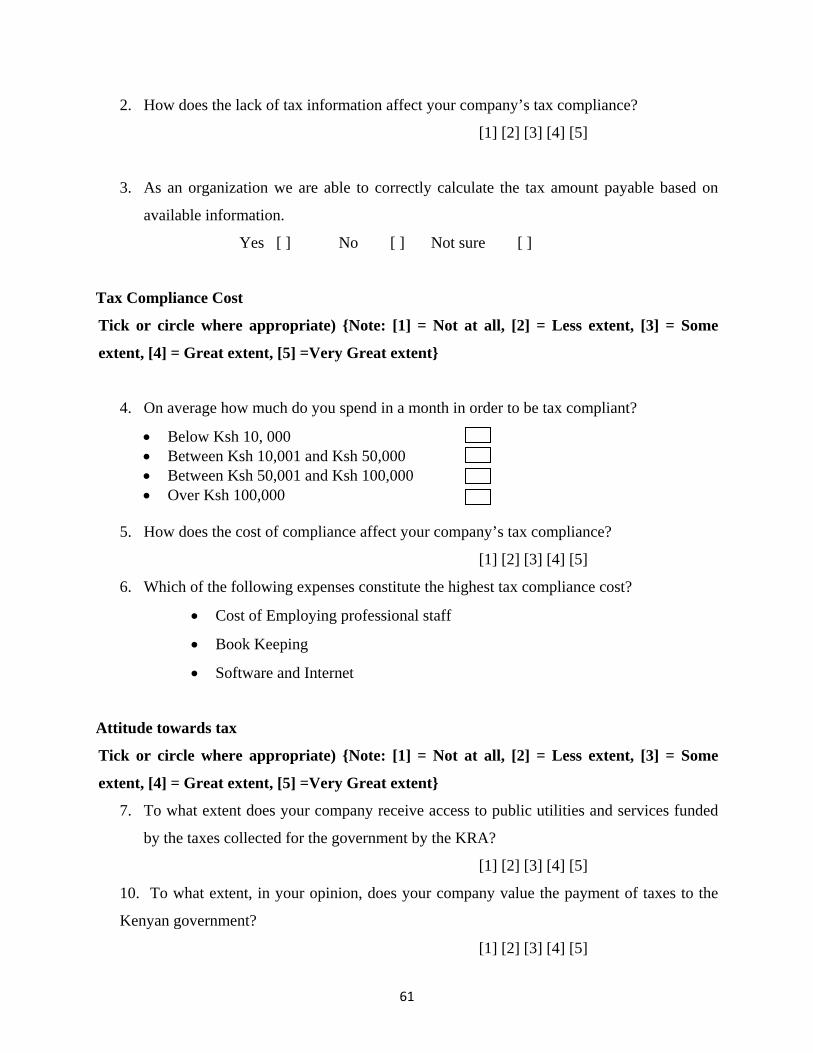
61
2. How does the lack of tax information affect your company’s tax compliance?
[1] [2] [3] [4] [5]
3. As an organization we are able to correctly calculate the tax amount payable based on
available information.
Yes [ ] No [ ] Not sure [ ]
Tax Compliance Cost
Tick or circle where appropriate) {Note: [1] = Not at all, [2] = Less extent, [3] = Some
extent, [4] = Great extent, [5] =Very Great extent}
4. On average how much do you spend in a month in order to be tax compliant?
Below Ksh 10, 000 Between Ksh 10,001 and Ksh 50,000 Between Ksh 50,001 and Ksh 100,000 Over Ksh 100,000
5. How does the cost of compliance affect your company’s tax compliance?
[1] [2] [3] [4] [5]
6. Which of the following expenses constitute the highest tax compliance cost?
Cost of Employing professional staff
Book Keeping
Software and Internet
Attitude towards tax
Tick or circle where appropriate) {Note: [1] = Not at all, [2] = Less extent, [3] = Some
extent, [4] = Great extent, [5] =Very Great extent}
7. To what extent does your company receive access to public utilities and services funded
by the taxes collected for the government by the KRA?
[1] [2] [3] [4] [5]
10. To what extent, in your opinion, does your company value the payment of taxes to the
Kenyan government?
[1] [2] [3] [4] [5]

62
11. To what extent do you view other SMEs value the payment of taxes?
[1] [2] [3] [4] [5]
SECTION C: STRATEGIES THAT CAN IMPROVE TAX COMPLIANCE AMONG
SMEs
1. Are there strategies that can improve the tax compliance by SMEs in Kenya? If so kindly
list them down
................................................................................................................................................
................................................................................................................................................
................................................................................................................................................
................................................................................................................................................
................................................................................................................................................
2. Is there a need to improve the Kenya’s tax system
Strongly Agree Agree
Not Sure Disagree
Strongly Disagree
3. What other challenges do you view affect the tax compliance among SMEs?
………………………………………………………………………………………………………
………………………………………………………………………………………………………
………………………………………………………………………………………………………
……………………………………………………………………………………………………..
4. Please give recommendations of how these challenges can be addressed.
………………………………………………………………………………………………………
………………………………………………………………………………………………………
………………………………………………………………………………………………………
……………………………………………………………………………………………………

63
APPENDIX III: INDEPTH INTERVIEW GUIDE 1. What kind of experiences have you had with KRA?
2. What things would you make you be willing to pay tax regularly and in full?
3. What things discourage you from meeting your tax obligations?
4. What factors do you think promote tax compliance among SMEs in Kenya?
5. What is your take on online filling of returns?
6. What would you wish the KRA would do in order to understand your business?
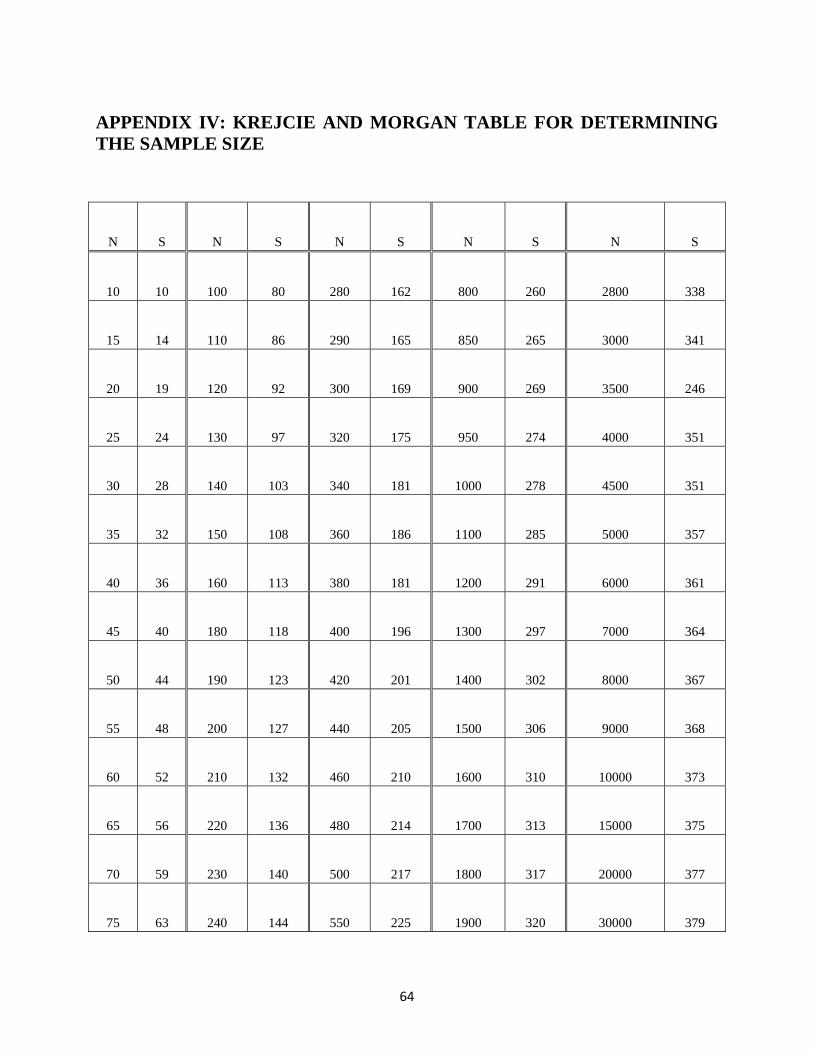
64
APPENDIX IV: KREJCIE AND MORGAN TABLE FOR DETERMINING THE SAMPLE SIZE
N S N S N S N S N S
10 10 100 80 280 162 800 260 2800 338
15 14 110 86 290 165 850 265 3000 341
20 19 120 92 300 169 900 269 3500 246
25 24 130 97 320 175 950 274 4000 351
30 28 140 103 340 181 1000 278 4500 351
35 32 150 108 360 186 1100 285 5000 357
40 36 160 113 380 181 1200 291 6000 361
45 40 180 118 400 196 1300 297 7000 364
50 44 190 123 420 201 1400 302 8000 367
55 48 200 127 440 205 1500 306 9000 368
60 52 210 132 460 210 1600 310 10000 373
65 56 220 136 480 214 1700 313 15000 375
70 59 230 140 500 217 1800 317 20000 377
75 63 240 144 550 225 1900 320 30000 379
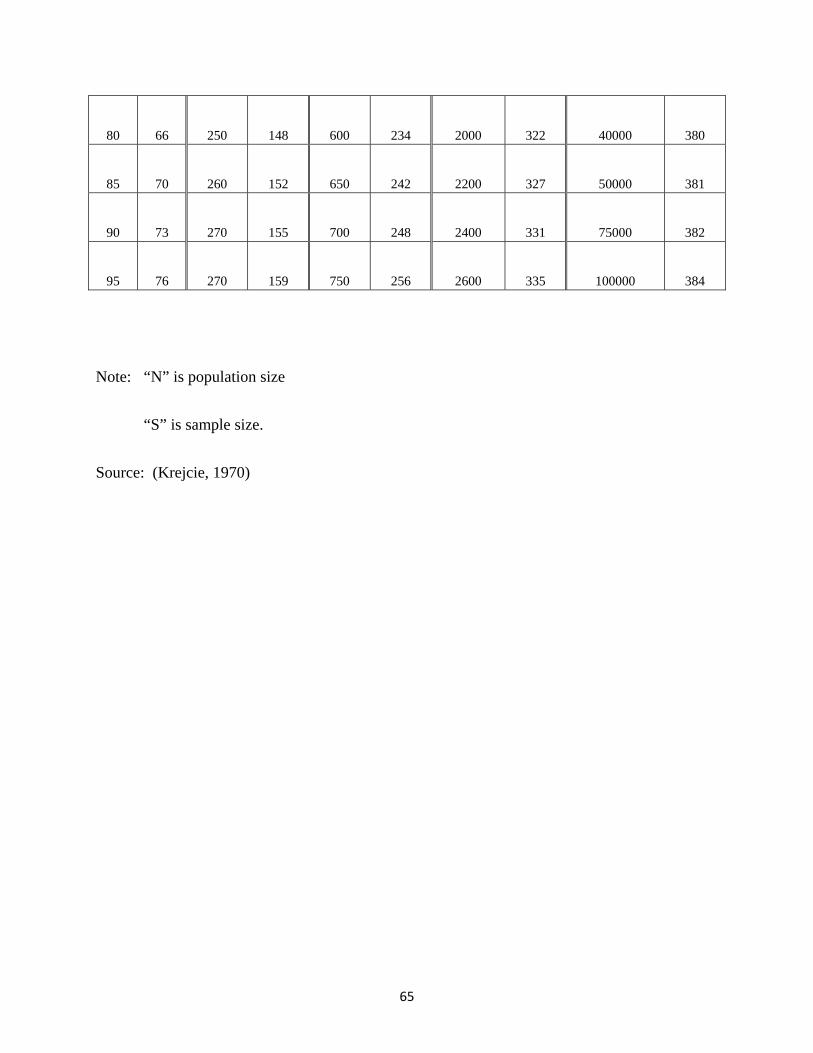
65
80 66 250 148 600 234 2000 322 40000 380
85 70 260 152 650 242 2200 327 50000 381
90 73 270 155 700 248 2400 331 75000 382
95 76 270 159 750 256 2600 335 100000 384
Note: “N” is population size
“S” is sample size.
Source: (Krejcie, 1970)