factors influencing young peoples’ perceptions of personal ... · factors infiuencing young...
TRANSCRIPT

1
Factors Influencing Young Peoples’ Perceptions of Personal Safety on Public Transport
Factors Influencing Young Peoples’ Perceptions of Personal Safety on
Public TransportGraham Currie and Alexa Delbosc, Monash University Sarah Mahmoud, Royal Automobile Club of Victoria
Abstract
This paper explores factors influencing perceptions of safety on public transport using an empirical analysis of a survey of young people in Melbourne, Australia. In the literature, some studies disagree as to the extent to which perceptions of safety are affected by actual experience of crime. Some suggest perceptions of personal safety are not justified by actual crime rates, whereas others find that direct experience of unsafe incidents results in greater safety concerns. Related research suggests that psychological factors can make some people feel uncomfortable on public transport and that this may increase perceptions of poor personal safety. However, these links have not yet been tested empirically in the public transport context. In this study, three statistically reliable MANOVA models demonstrated that psychological influ-ences, i.e., “feeling comfortable with people you don’t know on public transport,” had the largest individual influence on perceptions of safety with a medium-size effect. Gender and actual experiences of a personal safety incident also influenced percep-tions of personal safety but with a small effect size. Overall, the research suggests that feelings of anxiety and discomfort associated with traveling with people you do not know is the most influential factor driving negative feelings of personal safety on public transport. Gender and actual experience of unsafe incidents were not as important. Areas for further research are identified.
Journal of Public Transportation, Vol. 16, No. 1, 2013
2
IntroductionFear of crime is now widely recognized as a barrier to public transport use (Crime Concern 2002; Booz Allen Hamilton 2007). For example, research in the UK has identified that an additional 10.5 percent of rail trips would be generated if people felt more secure when traveling and waiting at stations (Crime Concern 2002). A majority of car drivers in inner Los Angeles claimed they would use transit if public buses were perceived as safe and clean (Loukaitou-Sideris 1997). Concerns about personal safety on public transport are frequently mirrored in media coverage (e.g., Sexton 2009; van den Berg 2009).
Although fear of crime on public transport is clearly an important issue, some stud-ies disagree as to the extent to which perceptions of safety are affected by actual experience of crime. Some researchers suggest perceptions are not related to expe-rience (Box, Hale, and Andrews 1988; Feltes 2003; Toseland 1982), whereas others demonstrate a direct relationship (Crime Concern 2002, 2004; Reed, Wallace, and Rodriguez 2000; Mawby and Gill 1987). A range of related research shows that psy-chological influences, notably personal stress and anxiety associated with traveling in confined spaces with others, is important to travelers (Thomas 2009). However, links between these influences and perceptions of crime on public transport have not been established in published research to date.
There is clearly a role for research that can isolate which factors influence user per-ceptions of safety on public transport. This paper explores these influences using a survey of young people using public transport in Melbourne, Australia.
The paper starts with a short review of the research literature in this field. This is followed by a description the methodology adopted to collate and analyze survey evidence. The results are then described. The paper concludes by summarizing key findings and a discussion of their implications for research and policy.
Research ContextIn Melbourne, traveling on public transport is, statistically speaking, a relatively safe undertaking. In 2010/2011, there were 1,284 assaults recorded on public transport (Victoria Police 2011); far more assaults are committed in homes, on public foot-paths, and even in places of business. With over 500 million trips taken annually on public transport (Public Transport Victoria 2012), the statistical chance of being assaulted is extremely low.

3
Factors Influencing Young Peoples’ Perceptions of Personal Safety on Public Transport
There is some degree of disagreement within the research literature regarding links between the fear of crime and actual risk of crime. In some cases, those who have direct experience of crime (as a victim or as an observer) have greater concerns about personal safety. Studies in both the UK and the U.S. have found that people who experienced or observed crime on public transport were more likely to rate their personal safety as poor or very poor (Crime Concern 2002, 2004; Reed, Wal-lace, and Rodriguez 2000; Mawby and Gill 1987). Other studies have found that people who had been victims of crime were generally no more fearful than people who were not victims and that fears are unrelated to risk (Feltes 2003; Toseland 1982; Box, Hale, and Andrews 1988). One study of crime surveys and empirical studies suggests that fear of crime and victimization is not well justified when compared to crime rates that show low rates of reported crime against groups such as women in public spaces (Loukaitou-Sideris et al. 2009). Another study found that although personal experience had little influence on fears, people who knew somebody who had been a victim exhibited far higher levels of fear and anxiety, suggesting a sense of “victimization through hearsay” (Feltes 2003). The media has also been identified as over-emphasising the relative risk of travel on public trans-port (Crime Concern 2002).
Psychological research suggests that fear is related to unpredictability and lack of control of exposure to potential crime. Fears of darkness, disorderly spaces, and strangers are all powerful psychological triggers (Feltes 2003). There is a rich design literature that demonstrates that lighting, sight lines, and other design features of rail and bus stations can have real impacts on fear of crime (e.g., Wallace et al. 1999; Cozens et al. 2003). Unfamiliar strangers behaving in an unusual way are particu-larly likely to trigger distrust and fear (Feltes 2003). To date, however, no literature in transport has empirically measured the influence of psychological fear of strang-ers on fear of crime on public transport.
The invasion of personal space when traveling on public transport vehicles has also been linked to general feelings of anxiety (Thomas 2009). Humans generally prefer to limit access to personal space, but traveling on public transport forces strangers into intimate social distances that are commonly reserved for those with stronger personal relationships (Hall 1966). The invasion of personal space in general has been shown to lead to greater self-reported anxiety (Greenberg and Firestone 1977) and physiological stress (Nicosia et al. 1979).
Certain demographic groups are more likely to fear crime in public spaces, even if they are less likely to be victims themselves. Older people are more likely to fear
Journal of Public Transportation, Vol. 16, No. 1, 2013
4
crime, and this anxiety can lead to social isolation (Crime Concern 2004; Feltes 2003). Women, people with disabilities, and people born overseas also demonstrate higher-than-average concerns for personal safety (Crime Concern 2002; Loukaitou-Sideris et al. 2009; Toseland 1982; Wasfi and Levinson 2007). One study found that demographic variables were more important than crime-related or psycho-social variables in predicting feelings of fear (Toseland 1982). However, specific research in this area related to public transport users has not been published to date.
Overall, previous research suggests a need to directly compare the influence of actual experience of crime, demographics, and psychological influences on percep-tions of safety on public transport.
MethodologyThe aim of the research was to empirically test factors linked to negative percep-tions of personal safety on public transport, including experience of crime and psychological factors.
The focus for the analysis is a survey of young people in Melbourne undertaken in May 2009. The survey targeted young people between ages 18–25 and was promoted through a local university newsletter (Monash Memo), Facebook, and also through word of mouth promotion within a range of transport planning and support groups in Melbourne.
Unfortunately, this age range limits the ability to explore the influence of age on perceptions of safety. Several studies have noted particularly high ratings of safety concerns in older adult riders (Booz Allen Hamilton 2003; Crime Concern 2002). Nevertheless, young people have also been found to be concerned about safety issues, and they represent a significant market group in transit ridership. They also represent potential riders of the future (Charles River Associates Inc 1997) and have been shown to be a good target market for ridership growth initiatives (Yoh, Haas, and Taylor 2003). From a personal safety research perspective, they are also an under-researched market group.
An online survey approach was adopted with a short five-minute questionnaire aimed to increase response rates. The survey was not marketed with a “personal safety” emphasis; rather, general questions on public transport were said to be the focus. This was to avoid self-selection bias in the returns. The survey was designed to understand general usage characteristics of public transport and to assess per-sonal safety factors and respondent views on improvements to personal safety.

5
Factors Influencing Young Peoples’ Perceptions of Personal Safety on Public Transport
Results of the survey are reported in full in a separate paper (Mahmoud and Currie 2010). This analysis concerns the survey results in relation to factors influencing personal safety perceptions.
Particular questions that were the focus of this analysis included:
• PerceptionsofPersonalSafety–respondentswereaskedtoratehoweasyor difficult they found feeling safe on public transport (in general), feeling safe on public transport at night, and feeling safe on public transport dur-ing the day. Responses were categorized into five groups—Very Easy, Easy, Neutral, Difficult and Very Difficult.
• Aseparatemoredirectquestionasked,“Howsafedoyoufeelusingpublictransport?” in various contexts such as at night, during the day, waiting at a bus stop, or walking to a train station. Again, there were five response categories, including Very Unsafe, Unsafe, Neutral, Safe and Very Safe.
• PublicTransportSafetyExperience–Respondentswereaskedif(onpublictransport) they had ever been attacked, threatened, observed an attack, observed someone being threatened, or felt threatened.
The analysis explored the results of the above variables but also sought to under-stand links between them and a series of dependent or explanatory variables, including:
• Frequencyofpublictransportuse–Increasedfamiliaritywithpublictrans-port may increase or even decrease feelings of safety.
• Gender–Arangeofpreviousresearchdemonstratesthatyoungwomentend to feel more unsafe on public transport than young men (Loukaitou-Sideris et al. 2009)
• Countryofbirth–Previousresearchandmorerecentmediacoveragesug-gests that overseas students and immigrants may have worse perceptions and more experience of safety issues on public transport (Crime Concern 2002; Booz Allen Hamilton 2007).
• Feelingcomfortablewithpeopleyoudonotknowonpublictransport–This is essentially a psychological personality variable; people who are not comfortable around strangers may feel unsafe in a shared environment such as public transport. Inclusion of this variable tested the influence of psychological factors in feelings of safety about public transport.
Journal of Public Transportation, Vol. 16, No. 1, 2013
6
Because this analysis involves several dependent variables, a Multivariate Analysis of Variance (MANOVA) was chosen as the analysis method. In addition, analysis explored the distribution of survey responses to better inform the analysis of influ-ences on personal safety perceptions.
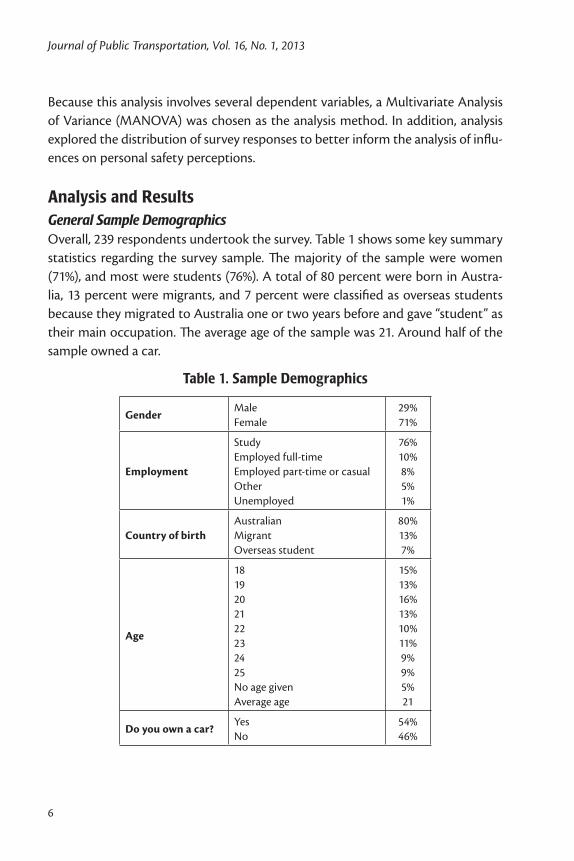
Analysis and ResultsGeneral Sample DemographicsOverall, 239 respondents undertook the survey. Table 1 shows some key summary statistics regarding the survey sample. The majority of the sample were women (71%), and most were students (76%). A total of 80 percent were born in Austra-lia, 13 percent were migrants, and 7 percent were classified as overseas students because they migrated to Australia one or two years before and gave “student” as their main occupation. The average age of the sample was 21. Around half of the sample owned a car.
Table 1. Sample Demographics
GenderMaleFemale
29%71%
Employment
StudyEmployed full-timeEmployed part-time or casualOtherUnemployed
76%10%8%5%1%
Country of birthAustralianMigrantOverseas student
80%13%7%
Age
1819202122232425No age givenAverage age
15%13%16%13%10%11%9%9%5%21
Do you own a car?YesNo
54%46%

7
Factors Influencing Young Peoples’ Perceptions of Personal Safety on Public Transport
Perceptions of Safety on Public TransportFigure 1 shows the responses to the question “How easy or difficult do you find feeling safe traveling on public transport at night,” “in general,” and “during the day.” It also considers the response to the question “How easy or difficult do you find feeling comfortable traveling with people you don’t know?”
Figure 1. How easy or difficult do you find ...
Nearly 40 percent of the sample found it difficult or very difficult to feel safe travel-ing on public transport at night. This compares to 14 percent during the day and 12 percent in general. Some 14 percent said they found “Feeling comfortable with people you do not know on public transport” to be difficult or very difficult.
Figure 2 shows responses to the more direct safety question “How safe do you feel?” in various contexts of public transport usage. This suggests that over 40 percent of young people felt unsafe or very unsafe using public transport at night. Waiting at or traveling to/from train stops were the next most common concerns, followed by waiting at bus stops. Using public transport during the day was the least common concern, with 90 percent of respondents feeling safe or very safe. In

Journal of Public Transportation, Vol. 16, No. 1, 2013
8
general, these patterns are fairly typical of those found in previous studies (Crime Concern 2002; Booz Allen Hamilton 2003).
Figure 2. How safe do you feel ...
Experience of Unsafe Circumstances on Public Transport Figure 3 shows the responses concerning actual experiences of safety events on public transport. Very few young people in the sample have ever experienced a direct attack on themselves (4%), although over one-quarter said they had been directly threatened at some point. Over 30 percent had seen someone attacked, and over 60 percent had seen someone threatened. Although experiencing an actual attack was rare, over 70 percent said they had felt threatened at some time.

9
Factors Influencing Young Peoples’ Perceptions of Personal Safety on Public Transport
Figure 3. Experience of unsafe conditions on public transport
Direct experience is not the only way people learn about safety on public trans-port. The survey also explored how respondents had found out about safety issues (Figure 4). Some 98 percent of respondents had heard about attacks on public transport through the media. This was the most common source of information about personal safety issues.
Figure 4. Hearing about unsafe conditions on public transport

Journal of Public Transportation, Vol. 16, No. 1, 2013
10
Exploring Factors Influencing Safety Perceptions Dependent Variables: Feelings of Safety on Public TransportFive variables from two different sets of questions directly measured feelings of safety on public transport:
A. How easy or difficult you find ...
1. Feeling safe traveling on public transport?2. Feeling safe traveling on public transport at night?3. Feeling safe traveling on public transport during the day?
B. How safe you feel ...
4. Using public transport at night?5. Using public transport during the day?
There are a further nine questions measuring feelings of safety on specific modes and locations, but these five questions measure feelings of safety on public trans-port more generally.
Because this analysis involves several dependent variables, a Multivariate Analysis of Variance (MANOVA) was chosen as the analysis method.
Initial modeling of these variables quickly revealed that two variables (“feeling safe traveling on public transport” and “feeling safe traveling on public transport dur-ing the day”) violated a basic assumption of statistical analysis: the error variance between groups was not equal (shown in Levene’s Test of Equality of Error Vari-ance). That is, for these two variables, the random variance of responses was much greater in some groups than others.
There are very few options available to MANOVA when this assumption is not met. Because there were five variables from which to choose, it was decided that these two variables would be excluded from the analyses.
Independent Variables: Predictors of Feelings of SafetyThe survey contains a range of questions that may influence feelings of safety. The primary explanatory variables of interest are the five variables measuring actual experience of safety issues on public transport. For the sake of parsimony, two variables were combined into a measure of whether they had been attacked or threatened. Similarly, another two were combined into whether they had seen someone attacked or threatened. The final explanatory variable set examining the issue of actual experience were:

11
Factors Influencing Young Peoples’ Perceptions of Personal Safety on Public Transport
1. Ever been attacked or threatened?2. Ever seen someone attacked or threatened?3. Ever felt threatened?
In addition to these variables, the following explanatory variables were also con-sidered:
• Frequency of public transport use • Gender • Country of birth • Feeling comfortable with people you do not know on public transport
Table 2 shows the average ratings of feelings of safety on public transport cross-tabulated with different categories of the dependent variables. The score of each safety variable can range between 1 to 5, with a 5 being high and 1 being a low score. Feelings of safety are considerably higher when people travel during the day (average rating 4.2) than when they travel at night (average rating 2.9 and 2.8).
Table 2. Feelings of Safety by Dependent Variables
Easy/Difficult How Safe You Feel?
Feeling safe on PT at night
Using PT at night
Using PT during the day
Overall Average Rating 2.9 2.8 4.2
Ever been threatened/ attacked?
Yes 2.7 2.5 4.1
No 3.0 2.9 4.3
Ever seen someone threatened/attacked?
Yes 2.7 2.7 4.2
No 3.2 2.9 4.4
Ever felt threatened? Yes 2.7 2.6 4.2
No 3.4 3.2 4.5
PT trips in last 3 days(average = 3.6)
Below avg. 2.9 2.8 4.2
Above avg. 3.0 2.8 4.2
Frequency of PT use < weekly 2.9 2.8 4.2
> weekly 2.9 2.8 4.2
Gender Female 2.8 2.7 4.2
Male 3.3 3.0 4.4
Country of birth Australia 2.9 2.7 4.3
Overseas 2.9 2.9 4.2
Comfortable with people you don’t know on PT (average = 3.5)
Below avg. 2.5 2.4 4.0
Above avg. 3.3 3.1 4.5

Journal of Public Transportation, Vol. 16, No. 1, 2013
12
From this simple table, several patterns are already clear. Feelings of safety are slightly lower among those who have experienced unsafe behaviors, although the MANOVA analysis will show if these differences are significant. Gender and being comfortable with people you do not know also appear to have an influence on feelings of safety with the latter having the larger effect. Interestingly, another vari-able that may have an effect is ‘”Ever felt threatened?” This is a related psychologi-cal influence variable since it considers the respondents’ feelings, not their direct experience of events.
Use of public transport does not appear to have any effect on feelings of safety. For this reason and for the sake of parsimony, public transport use was not included in the MANOVA.
Interestingly, country of birth did not appear to have an effect on feelings of safety. This contrasts considerably with the findings of previous research and the view suggested by media reports. Due to the sample size, it would be impractical to include both country of birth and gender into a single analysis. For example, there were only nine participants who were male and born overseas, and of those, only one or two had ever experienced, witnessed, or felt threatened or attacked. In this context, country of birth was also excluded from MANOVA analysis.
This analysis also demonstrated fairly consistent findings across the explanatory variables for each of the three dependent variables. Feeling safe on public transport during the day had higher ratings of safety compared to the others, but the relative ratings of individual explanatory variables were fairly consistent between the two safety at night factors.
The Final Models: What Predicts Feelings of Safety?Based on initial explorations in the previous sections, three MANOVA models were run (Table 3). All three models had the same three dependent variables and the independent variables “gender” and “feeling comfortable with strangers.” But each model contained only one of the following independent variables:
• Ever been attacked or threatened?
• Ever seen someone attacked or threatened?
• Ever felt threatened?

13
Factors Influencing Young Peoples’ Perceptions of Personal Safety on Public Transport
Table 3. Variables included in the Three MANOVA Analyses Models
Independent Variables Model 1 Model 2 Model 3
Ever been attacked or threatened? *
Ever seen someone attacked or threatened? *
Ever felt threatened? *
Gender * * *
Feel comfortable around people you do not know on PTa? * * *
Dependent Variables
Feeling safe while traveling on public transport at night * * *
[How safe you feel] using public transport at night? * * *
[How safe you feel] using public transport during the day? * * *a As a continuous variable, this was included as a covariate.
All three models met Box’s Test of Equality of Covariance Matrices and Levene’s Test of Equality of Error Variances.
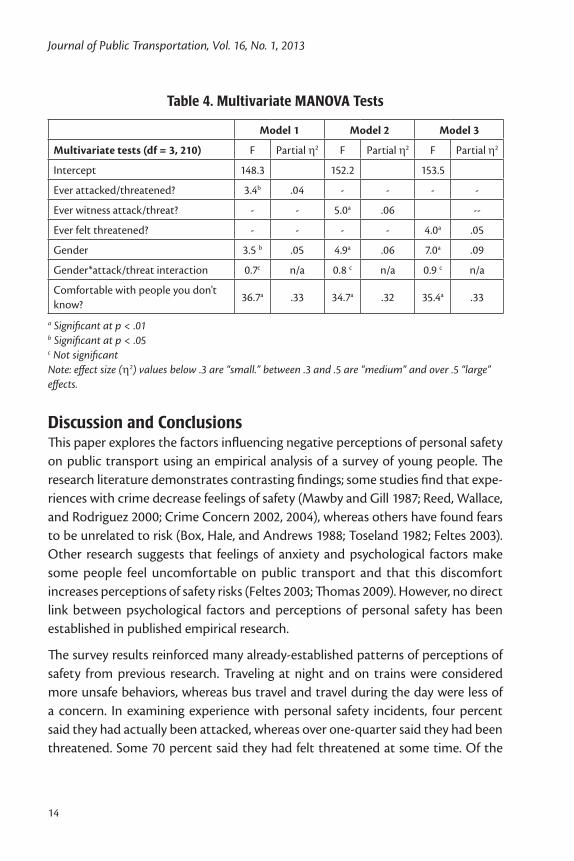
Table 4 shows the results from the multivariate tests. In general, the results of three models are very similar. Factors influencing perceptions of safety are equally influential if safety is measured as having been attacked/threatened (Model 1), ever witnessed an attack/threat (Model 2), or ever felt threatened (Model 3).
The partial η2 shows the effect size of the influence variable on perceptions of safety. As with other measures of effect size, values below 0.3 are considered “small,” values between 0.3 and 0.5 are “medium,” and values over 0.5 are generally considered “large” effects. Overall, these results suggest that the psychological variable “feeling comfortable with people you do not know” was of medium size across all three models. It is, by far, the largest influence on feelings of safety on public transport: the more comfortable people felt being with strangers, the safer they felt on public transport. By comparison, gender and experiences of unsafe behavior had only a small effect size (all less than .10).
Journal of Public Transportation, Vol. 16, No. 1, 2013
14
Table 4. Multivariate MANOVA Tests
Model 1 Model 2 Model 3
Multivariate tests (df = 3, 210) F Partial η2 F Partial η2 F Partial η2
Intercept 148.3 152.2 153.5
Ever attacked/threatened? 3.4b .04 - - - -
Ever witness attack/threat? - - 5.0a .06 --
Ever felt threatened? - - - - 4.0a .05
Gender 3.5 b .05 4.9a .06 7.0a .09
Gender*attack/threat interaction 0.7c n/a 0.8 c n/a 0.9 c n/a
Comfortable with people you don't know?
36.7a .33 34.7a .32 35.4a .33
a Significant at p < .01 b Significant at p < .05 c Not significant Note: effect size (η2) values below .3 are “small.” between .3 and .5 are “medium” and over .5 “large” effects.
Discussion and ConclusionsThis paper explores the factors influencing negative perceptions of personal safety on public transport using an empirical analysis of a survey of young people. The research literature demonstrates contrasting findings; some studies find that expe-riences with crime decrease feelings of safety (Mawby and Gill 1987; Reed, Wallace, and Rodriguez 2000; Crime Concern 2002, 2004), whereas others have found fears to be unrelated to risk (Box, Hale, and Andrews 1988; Toseland 1982; Feltes 2003). Other research suggests that feelings of anxiety and psychological factors make some people feel uncomfortable on public transport and that this discomfort increases perceptions of safety risks (Feltes 2003; Thomas 2009). However, no direct link between psychological factors and perceptions of personal safety has been established in published empirical research.
The survey results reinforced many already-established patterns of perceptions of safety from previous research. Traveling at night and on trains were considered more unsafe behaviors, whereas bus travel and travel during the day were less of a concern. In examining experience with personal safety incidents, four percent said they had actually been attacked, whereas over one-quarter said they had been threatened. Some 70 percent said they had felt threatened at some time. Of the

15
Factors Influencing Young Peoples’ Perceptions of Personal Safety on Public Transport
potential sources where individuals had learned about personal safety incidents, the most common was media reports.
Factors influencing personal safety perceptions were explored using a series of three MANOVA models to predict personal feelings of safety on public transport. In each model, psychological influences, i.e., “feeling comfortable with people you do not know,” had the largest individual influence on perceptions of safety (partial η2 were over 0.30, representing a medium-size effect). Gender and actual experi-ences of a personal safety incident also influenced perceptions of personal safety. However, the size of these effects was small relative to the influence of feeling com-fortable with people you do not know (partial η2 were under 0.10, representing a small effect size).
Overall, the research suggests that feelings of anxiety and discomfort associated with traveling with people you do not know is the most influential factor driving negative feelings of personal safety on public transport. Gender and actual experi-ence of unsafe incidents were not as important. And interestingly, the effect of being attacked or threatened on feelings of safety was quite small (partial η2 = .04) and no larger than the effect of witnessing an attack/threat or feeling threatened.
No link was found in the modeling between frequency of use of public transport and perceptions of personal safety.
An important implication of these findings from a policy perspective is the need to consider psychological factors in addressing safety concerns among existing and potential public transport users. Although only around 14 percent of the survey sample had difficulties feeling comfortable traveling with other people on public transport, and these feelings appear to be important in influencing safety barriers to travel. Design measures to engender feelings of space on public transport vehi-cles and measures to promote more positive social interaction and understanding about other passengers should have a positive impact on feeling comfortable with others and, thus, perceptions of safety. It seems likely the targeting of these mea-sures to women would be worthwhile, as they are slightly more likely to feel unsafe on public transport.
There is also a role for additional research exploring the links between perceptions and experience of personal safety concerns in greater depth. This research was based on a modest sample of young people and, hence, could not explore influ-ences at a high degree of disaggregation. A large sample in future research may remove this barrier.

Journal of Public Transportation, Vol. 16, No. 1, 2013
16
Furthermore it may be that negative psychological feelings, feelings of anxiety, and stress will also influence interpretation of events that are observed. There is much scope for misinterpretation of events when these contexts are mixed with an indi-vidual’s personal beliefs, mores, and social standards and how these contrast with those of other races, ages, and genders. Measures to enhance understanding and consideration of others who are different have been suggested in recent research (Moore 2011). There is much room to explore these concepts further through an expansion of research considering psychological influences on the perceptions of public transport users.
References
Booz Allen Hamilton. 2003. Investigation into public transport passenger safety and security on the arterial road network. Melbourne, Australia: VicRoads R&D Project.
Booz Allen Hamilton. 2007. Personal security in public transport travel – Problems issues and solution. Land Transport New Zealand Research Report.
Box, S., C. Hale, and G. Andrews. 1988. Explaining fear of crime. British Journal of Criminology 28(3):340-356.
Charles River Associates Inc. 1997. Building Transit ridership: An exploration of transit’s market share and the public policies that influence it. Transit Coopera-tive Research Program. Washington, D.C.
Cozens, Paul, Richard Neale, Jeremy Whitaker, and David Hillier. 2003. Managing crime and fear of crime at railway stations – A case study in South Wales (UK). International Journal of Transport Management 1: 121-132.
Crime Concern. 2002. People perceptions of personal security and their concerns about crime on public transport: Literature review. London, UK: Department for Transport.
Crime Concern. 2004. People perceptions of personal security and their concerns about crime on public transport: Research findings. London, UK: Department for Transport.
Feltes, Thomas. 2003. Public safety and public spaces: The citizen's fear of strangers. In Vandalism, Terrorism and Security in Urban Public Transport, Round Table
17
Factors Influencing Young Peoples’ Perceptions of Personal Safety on Public Transport
123, edited by European Conference for Ministers of Transport: Economic Research Centre.
Greenberg, C. I., and I. J. Firestone. 1977. Compensatory responses to crowding: Effects of personal space instrusion and privacy reduction. Journal of Personal-ity and Social Psychology 35(9): 637-644.
Hall, E. 1966. The Hidden Dimension. New York: Doubleday.
Loukaitou-Sideris, A. 1997. Inner city commercial strips: Evolution decay or retrofit? Town Planning Review 68(1): 1-29.
Loukaitou-Sideris, A., A. Bornstein, C. Fink, L. Samuels, and S. Germai. 2009. How to ease women's fear of transportation environments: Case studies and best practices. Mineta Transportation Institute.
Mahmoud, S., and G. Currie. 2010. The relative priority of personal safety concerns for young people on public transport - Nature of concerns and user priorities for action. Australasian Transport Research Forum. Canberra, Australia.
Mawby, R., and M. Gill. 1987. Crime Victims: Needs, Services and the Voluntary Sec-tor. London UK: Routledge Kegan & Paul (November 1987).
Moore, Stephen. 2011. Understanding and managing anti-social behaviour on public transport through value change: The considerate travel campaign. Transport Policy 18: 53-59.
Nicosia, Gregory J., Douglas Hyman, Robert A Karlin, Yakov M. Epstein, and John R. Aiello. 1979. Effects of bodily contact on reactions to crowding. Journal of Applied Social Psychology 9(6): 508-523.
Public Transport Victoria. Track record annual results - Metropolitan and regional patronage 2010-11 2012 [cited 3 April 2012. Available from http://corp.ptv.vic.gov.au/managing-victoria-s-public-transport-network/track-record.
Reed, Thomas B., Richard R. Wallace, and Daniel A. Rodriguez. 2000. Transit passen-ger perceptions of transit-related crime reduction measures. Transportation Research Record 1731: 130-141.
Sexton, R. 2009. Scary Night trains rated network's biggest problem. The Age, 28 Nov.
Thomas, Jared. 2009. The social environment of public transport. Victoria Univer-sity of Wellington, Wellington.
Journal of Public Transportation, Vol. 16, No. 1, 2013
18
Toseland, Ronald W. 1982. Fear of crime: Who is most vulnerable? Journal of Crimi-nal Justice 10: 199-209.
van den Berg, L. 2009. Young fear attack on late-night trains. Herald Sun, 14-12-2009.
Victoria Police. 2011. Crime statistics 2010/2011.
Wallace, Richard R., Daniel A. Rodriguez, Christopher White, and Jonathan Levine. 1999. Who noticed, who cares? Passenger reactions to transit safety measures. Transportation Research Record 1666: 133-138.
Wasfi, Rania, and David Levinson. 2007. The transportation needs of people with developmental disabilities. University of Minnesota Center for Transportation Studies.
Yoh, A. C. , P. J. Haas, and D. B. Taylor. 2003. Understanding transit ridership growth case studies of successful transit systems in the 1990s. Transportation Research Record 1835.
About the Authors
Graham Currie ([email protected]) holds Australia’s first professorship in public transport where he researches and provides training in public transport planning. He has over 27 years’ experience as a transit planner and has worked for some of the world’s leading operators including London Transport. He has led numerous research projects in public transport in all states and territories of Aus-tralia as well as assignments in Europe, Asia, and North America and has a unique range of experience in relation to the development of public transport strategies for special events. He developed the public transport plan for the successful 1996 Australian Grand Prix, led independent reviews of both the Atlanta and Sydney sum-mer Olympic Games transport systems, and was an advisor to the Athens Olympic Committee for the design of transport services for the 2004 Olympic Games.
Alexa Delbosc ([email protected]) is a research fellow in the Institute of Transport Studies. Her research interests include public transport ridership, traveler behavior, the social implications of public transport, and transport disadvantage. Her background is in social research from her studies in social psychology at Har-vard University. Her work at Harvard culminated in a collaborative project on the egocentric estimation of God’s beliefs, which was published in the Proceedings of the National Academy of Sciences.

19
Factors Influencing Young Peoples’ Perceptions of Personal Safety on Public Transport
Sarah Mahmoud ([email protected]) is a Senior Public Transport and Mobility Officer at the Royal Automobile Club of Victoria. Her key roles include project management, writing Government submissions, transport research, member correspondence, building stakeholder relationships, and policy development. She studied civil engineering at Monash University, majoring in transport engineering and graduated with first class honors in 2009. Prior of joining RACV, she was a transport consultant, working on projects for the Australian Government, State government, statutory bodies, local Councils, and private organizations. Her main interests include policy development, transport planning, sustainable transport, travel behavior change programs, and project management.