factors related to college enrollment - u.s. department of education
TRANSCRIPT

MATHTECH, INC.
See, for example, Leslie and Brinkman (1987), Savoca (1990), Schwartz (1986), and Mortenson and Wu1
(1990).
SECTION I. INTRODUCTION 1
I. INTRODUCTION
Income inequality has been increasing for the past 20 years. A substantial part of the
increase in income differences can be explained by changes in the return to education. In dollar
terms, 1973 college graduates earned 45 percent more than high school graduates; by 1994 they
earned 65 percent more, based on real average hourly wages for college and high school
graduates (Baumol and Blinder, 1997). The increasing income disparities between groups of
differing educational attainment raises concern that access to postsecondary education (PSE) may
not be as widespread as desired. President Clinton urged for the goal of universal college access
in his 1997 State of the Union address, “We must make the thirteenth and fourteenth years of
education—at least two years of college—just as universal in America by the 21st century as a
high school education is today, and we must open the doors of college to all Americans.”
Using data from the National Education Longitudinal Study of 1988 (NELS) and the
National Postsecondary Student Aid Study (NPSAS), this study examines access to
postsecondary education by individuals in different income and test score groups. While many
studies have found a statistically significant effect of income on college enrollment, less attention1
has been paid to the effect of family income after controlling for student achievement. This study
specifically addresses this issue. We also explore differences in the decision of whether or not to
attend PSE or in the type of PSE attended. We are interested in whether students are substituting
less expensive alternatives (such as public or 2-year institutions) for high cost institutions, or
whether they are not attending PSE at all. However, we do not examine selectivity of institutions
attended.
Another goal of this study is to determine which factors, including high school experi-
ences, are especially important in determining college enrollment patterns. Hossler and Maple
(1993) find that information on individual background factors allows them to predict, with a high
degree of accuracy, which ninth-graders will go to college. The emphasis in our study is on how

MATHTECH, INC.
An NCES study, not yet released, has focused on the “pipeline to higher education” using the NELS data2
(NCES, 1997).
SECTION I. INTRODUCTION 2
early indicators, such as expectations and course-taking behavior in the eighth grade, are related
to college attendance six years later.2
Last, we explore whether financial aid availability is a critical factor in determining PSE
attendance. The combined effects of shifting federal support from grants to loans, and college
tuition increasing at a rate faster than inflation are expected to have a large impact on enrollment
patterns for low income youth. This report examines knowledge of and attitudes toward financial
aid, and the relationship between such factors and PSE attendance. We also examine the effect of
financial aid receipt on PSE attendance.
In summary, the main research questions addressed in this report are:
1. What percentage of students attend PSE, and what types of PSE do they attend?
2. How are income and test score related to who goes to college?
3. What factors, including high school experiences, are especially important indetermining college enrollment patterns?
4. Is financial aid availability a critical factor for determining PSE attendance?
The rest of the report proceeds as follows. Section II describes the literature on individual
and institutional factors that affect PSE attendance. Section III provides an overview of the data
used in this report. It describes the NELS data, the NPSAS data, samples and weights used in the
study, and correction of standard errors for sampling techniques. Section IV examines who goes
to college. The section highlights the main answers to the first two research questions posed
above, in a univariate or multivariate framework. Section V examines factors related to PSE
attendance. Section VI explores the importance of financial aid, including knowledge of financial
aid, financial aid applications, and the relationship between being offered financial aid and PSE
attendance. Last, we include a bibliography of cited references. The executive summary (at the
beginning of the report) highlights our findings and provides policy implications.

MATHTECH, INC.
SECTION I. INTRODUCTION 3
One subset of analysis for this study is the group of low income, high test score students.
Low income, high test score students may have the potential to benefit greatly from PSE
attendance and, therefore, we want to identify factors or constraints, particularly financial ones,
that might limit the students’ educational opportunities beyond high school.

MATHTECH, INC.
SECTION II. LITERATURE REVIEW 4
II. LITERATURE REVIEW
Much of the research on college enrollment patterns is founded upon the “human capital”
model Gary Becker advanced. According to this theory, one decides to enroll in college as an
investment in future earning power. Individuals calculate the value of attending college by
comparing costs (direct and indirect) with expected income gains, and they make the decision that
will maximize their utility over the long term. To understand enrollment behavior according to
this model, it is necessary to look at such factors as tuition levels, student financial aid, average
wages for high school graduates, and the difference in lifetime earnings between high school and
college graduates.
Economists and others agree, however, that non-monetary factors also play a major part in
the college enrollment decision. Sociologists’ models of status attainment have suggested a
number of background variables that join with economic factors to influence college plans. These
include both personal traits (e.g., academic ability) and interpersonal factors, such as the level of
encouragement a student receives from parents and teachers. Hossler and Maple (1993) suggest
that individual decisions on enrollment can be broken down into three stages: predisposition,
search, and choice. According to their research, students who will ultimately attend college can
be differentiated from those who will not as early as the ninth grade.
Within the econometric and sociological models outlined above, the factors affecting
enrollment in college can be divided into two general types: those specific to individual students,
such as academic achievement and parental education levels, and those specific to educational or
vocational alternatives, such as college tuition, financial aid, and unemployment levels. Students’
enrollment decisions can be viewed as jointly determined by their individual characteristics and the
institutional or societal conditions that prevail. We first review individual traits that affect college
enrollment, and then institutional determinants.

MATHTECH, INC.
SECTION II. LITERATURE REVIEW 5
A. INDIVIDUAL FACTORS THAT AFFECT COLLEGE ENROLLMENT
Several studies have used data from the National Longitudinal Study of the High School
Class of 1972 (NLS72), the National Longitudinal Survey of Labor Market Experience, Youth
Cohort (NLSY), and the High School and Beyond Survey (HSB) to examine the factors affecting
college enrollments. Manski and Wise (1983), Rouse (1994), and a number of others have used
the variables included in these data sets to estimate multinomial logit models of enrollment deci-
sions. Among the researchers, there seems to be considerable agreement regarding the individual
traits that help to determine enrollment. These traits are discussed below.
Manski and Wise (1983) presented a key point, namely that the enrollment process begins
with the student’s decision to apply to college. This is much more important than the decisions
made by college admissions personnel, since most would-be college students are likely to be
admitted to some postsecondary institution of average quality. Jackson (1988) reports that in
1972, more than 97 percent of college applicants were admitted to at least one of their top three
choices. The factors of greatest interest, then, are those that cause the student to seek to enroll.
Both Manski and Wise (1983) and Rouse (1994) find that individual traits such as
achievement levels, high school class rank, and parental education levels are of primary impor-
tance in determining the likelihood of a student’s applying to college. They state that higher
family income levels increase the probability of application as well, but to a lesser extent. Manski
and Wise also cite a “ ‘peer’ or high school quality effect,” such that the larger the share of a high
school senior’s classmates who attend 4-year schools, the more likely he or she will be to do the
same. A recent NCES report (1997) describes the relationship among six risk factors (such as
changing schools two or more times) and PSE attendance rates.
St. John and Noell (1989) and St. John (1990) draw similar conclusions from the NLS72
and HSB data sets. St. John and Noell state that certain “social background variables” appear to
make college enrollment more likely. These include higher test scores, higher grades, higher

MATHTECH, INC.
St. John and Noell do not include paternal education levels as a variable in their study. Manski and Wise and3
Rouse consider maternal and paternal education levels as separate variables, but present their conclusions in terms ofparental education levels as a whole. Most of the studies reviewed here do not distinguish between mother’s andfather’s education levels. One exception is the study by Kohn, Manski and Mundel (1976). This study estimates amodel using subsamples of the SCOPE survey from two different states. While one group shows that the father’seducation level has a greater effect on the likelihood of college attendance than does the mother’s, the other group showsthe mother’s education level as having a greater effect.
SECTION II. LITERATURE REVIEW 6
maternal education levels, and family income, as cited by Manski and Wise and Rouse. Other3
key variables include participation in an academic track during high school and “high post-
secondary aspirations,” as measured by students’ reporting of the highest level of schooling they
expect to achieve.
Hossler and Maple (1993) find that parental education levels have a stronger effect on
enrollment plans than student ability or income level. Other background factors that researchers
have found to be significant include the level of parental encouragement (Hossler, Braxton, and
Coopersmith, 1989) and students’ own expectations about the college decision (Borus and
Carpenter, 1984). Jackson (1988) concludes that test scores, grades, taking part in a college
preparatory program, and attending a school with many college-going peers are the student
attributes most important for college enrollment. Kohn, Manski, and Mundel (1976) report that
parents’ education level has a positive effect on a student’s likelihood of enrollment, but state that
this effect decreases as family income rises.
A number of researchers have examined the effects of family income levels on college
enrollment. Manski (1992:16) concludes that there are “persistent patterns of stratification of
college enrollments by income.” Both Manski (1992) and Kane (1995) present census data for
multi-year periods that show, for ascending income levels, a steadily increasing percentage of 18-
to 19-year-old dependent family members enrolled in college. Using the same data source,
Clotfelter (1991) and Mortenson and Wu (1990) cite positive income effects for the 18- to 24-
year-old group as well. Hauser (1993) finds large family income effects on college enrollment for
White and Hispanic families, but he finds no such effects for Black families.
MATHTECH, INC.
SECTION II. LITERATURE REVIEW 7
B. INSTITUTIONAL FACTORS THAT AFFECT COLLEGE ENROLLMENT
In addition to the factors that operate at an individual level, researchers have found a
variety of institutional factors, or factors pertaining to educational and vocational alternatives, that
affect college enrollment levels. Manski and Wise (1983) include among these factors tuition
level, “quality of school” (as measured by the average combined SAT score of incoming fresh-
men), and the availability of government and institutional financial aid. Rouse (1994) examines
the factor of proximity by estimating changes in enrollments that would result from decreasing the
average distance to the nearest 2-year college. She also considers the effects of tuition levels and
financial aid availability, as well unemployment rates, which serve as a measure of competing
opportunities available to high school seniors.
Tuition levels are another institutional factor with a significant effect on college enroll-
ment. Leslie and Brinkman (1987) review 25 studies on this subject, and find a general consensus
that a $100 increase in tuition nationwide, in 1982–1983 academic year dollars, would result in a
6 percent decline in the college participation rate for the 18- to 24-year-old group. Savoca (1990)
makes the point that high tuition levels may lessen postsecondary enrollments in the
aggregate by discouraging some students from ever applying to college. The effects of tuition
levels are moderated in many cases by the effects of financial aid. McPherson and Schapiro
(1991) state that the variable of interest should be net cost, or tuition less financial aid. At the
initial stages of the enrollment decision, however, students often lack information on their
eligibility for financial aid and the amount of aid they would be likely to receive.
Researchers have differing views regarding the effects of financial aid on enrollment at
different types of institutions. Reyes (1994) finds that increases in financial aid positively affect
both 2-year and 4-year college enrollment rates, based on information from the NLSY and HSB.
Manski and Wise (1983), using the NLS72, conclude that financial aid affects students’ decisions
to attend 2-year institutions, as opposed to not going to college at all. However, this study finds
that enrollments at 4-year schools have little sensitivity to the availability of financial aid. Manski
and Wise do not consider the effect of financial aid on the student’s choice between a 2-year and a
4-year institution.

MATHTECH, INC.
SECTION II. LITERATURE REVIEW 8
Other researchers have compared the effects of decreasing tuition with the effects of
increasing financial aid. Manski and Wise (1983) find that for those attending 2-year schools, an
additional dollar of financial aid would be worth more than a one dollar reduction in tuition. St.
John (1990:172) also finds that “college applicants...[are] more responsive to changes in student
aid than to changes in tuition,” except for those in the upper income group. Kane (1995),
however, argues that while financial aid increases may be more equitable because they are means
tested, they are not as effective as decreases in tuition. This is a consequence of the complexity of
the financial aid application process and the unwillingness of low income families to borrow to
finance a college education.
When studying the effect of tuition and financial aid on PSE enrollment, the group to be
especially concerned about is low income students. Leslie and Brinkman (1987) and Savoca
(1990) find that tuition levels affect enrollment decisions for low income students much more than
for middle and upper income groups. By the same token, the availability of financial aid is a much
more crucial factor for those at lower income levels. Orfield (1992) notes that the maximum Pell
grant is less than one-fifth of the tuition at an elite university. Such a gap between aid and costs,
he contends, may steer many low income students toward lower cost schools. Hearn’s 1991
study supports this hypothesis. He finds that when academic ability, achievement, and other
factors are controlled for, lower income students are especially likely to choose institutions of
lower selectivity.
Schwartz (1985) finds that low income students are affected differently by publicly pro-
vided financial aid and aid supplied by institutions. He states that public grants tend to promote
greater equity among income groups in college enrollment. Private grants, however, are often
awarded on the basis of academic ability, and they tend to favor students who could afford to go
to college without them. Clotfelter (1991) expresses the same concern about the effects of
institutional aid. Manski and Wise (1983) note that even public aid is not always awarded where
the need is greatest. They state that in 1979, 59 percent of Basic Educational Opportunity Grants
were awarded to students who would probably have gone to college in the absence of such aid.
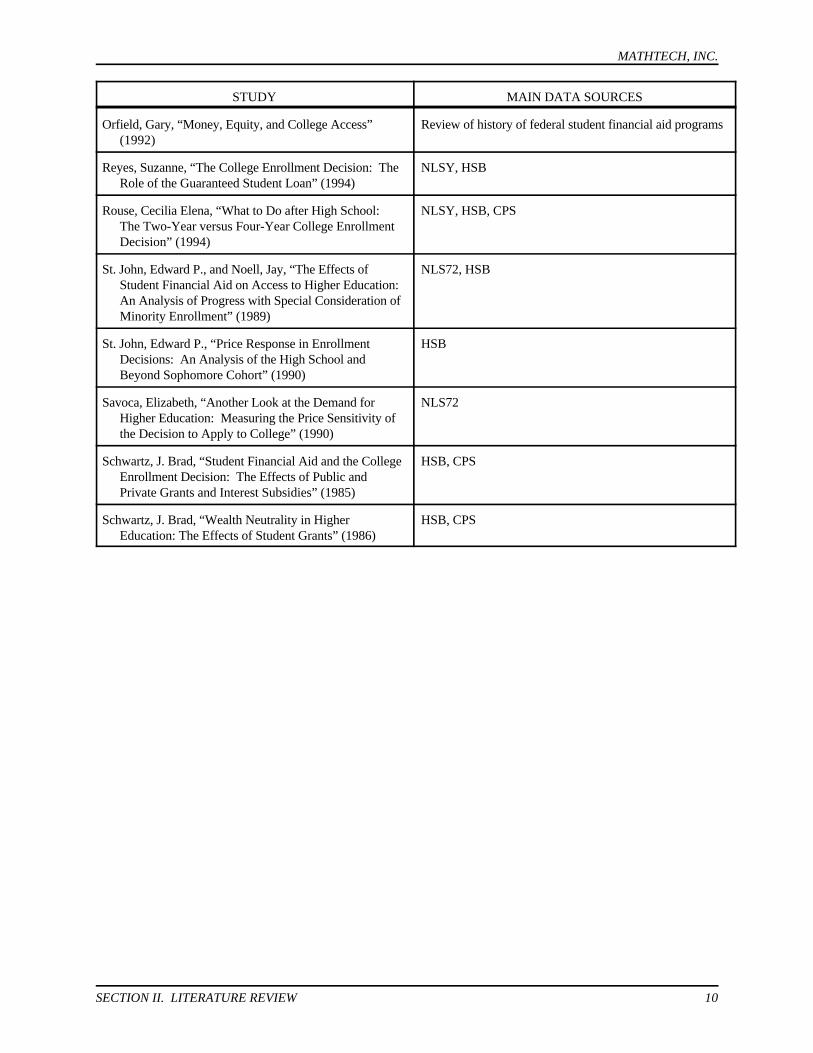
Table 1 summarizes the data sources used in the studies mentioned here.

MATHTECH, INC.
SECTION II. LITERATURE REVIEW 9
Table 1
MAIN DATA SOURCES FOR WORKS CITED IN LITERATURE REVIEW
STUDY MAIN DATA SOURCES
Borus, Michael E. and Carpenter, Susan A., “Factors 1979 and 1980 National Longitudinal Surveys of LaborAssociated with College Attendance of High-School Market Experience, Youth Cohort (NLSY)Seniors” (1984)
Clotfelter, Charles T., “Demand for Undergraduate Review of studies done by others, with data from CurrentEducation” (1991) Population Survey (CPS) and High School and Beyond
(HSB)
Hauser, Robert M., “Trends in College Entry among CPSWhites, Blacks, and Hispanics” (1993)
Hearn, James C., “Academic and Nonacademic Influences HSB, Higher Education Research Institute (HERI) dataon the College Destinations of 1980 High SchoolGraduates” (1991)
Hossler, Don, Braxton, John and Coopersmith, Georgia, Review of studies done by others“Understanding College Choice” (1989)
Hossler, Don and Maple, Sue, “Being Undecided about Cluster sample of 5,000 Indiana ninth gradersPostsecondary Education” (1993)
Jackson, Gregory A., “Did College Choice Change during National Longitudinal Study of the High School Class ofthe Seventies?” (1988) 1972 (NLS72), HSB
Kane, Thomas, “Rising Public College Tuition and NLSY, HSB, CPSCollege Entry: How Well Do Public SubsidiesPromote Access to College?” (1995)
Kohn, Meir G., Manski, Charles F., and Mundel, David S., School to College: Opportunities for Postsecondary“An Empirical Investigation of Factors which Education (SCOPE) SurveyInfluence College-going Behavior” (1976)
Leslie, Larry L., and Brinkman, Paul T., “Student Price Meta-analysis of studies done by othersResponse in Higher Education” (1987)
Manski, Charles F., and Wise, David A., College Choicein America (1983)
NLS72
Manski, Charles F., “Income and Higher Education” NLS72, HSB, CPS(1992)
McPherson, Michael S., and Schapiro, Morton Owen, Cooperative Institutional Research Program (CIRP) data,“Does Student Aid Affect College Enrollment? New CPSEvidence on a Persistent Controversy” (1991)
Mortenson, Thomas G., and Wu, Zhijun, “High School HSB, Current Population Report, CPSGraduation and College Participation of Young Adultsby Family Income Backgrounds 1970 to 1989” (1990)
National Center for Education Statistics. “Confronting the NELSOdds: Students At Risk and the Pipeline to HigherEducation” (1997).
MATHTECH, INC.
STUDY MAIN DATA SOURCES
SECTION II. LITERATURE REVIEW 10
Orfield, Gary, “Money, Equity, and College Access” Review of history of federal student financial aid programs(1992)
Reyes, Suzanne, “The College Enrollment Decision: The NLSY, HSBRole of the Guaranteed Student Loan” (1994)
Rouse, Cecilia Elena, “What to Do after High School: NLSY, HSB, CPSThe Two-Year versus Four-Year College EnrollmentDecision” (1994)
St. John, Edward P., and Noell, Jay, “The Effects of NLS72, HSBStudent Financial Aid on Access to Higher Education: An Analysis of Progress with Special Consideration ofMinority Enrollment” (1989)
St. John, Edward P., “Price Response in Enrollment HSBDecisions: An Analysis of the High School andBeyond Sophomore Cohort” (1990)
Savoca, Elizabeth, “Another Look at the Demand for NLS72Higher Education: Measuring the Price Sensitivity ofthe Decision to Apply to College” (1990)
Schwartz, J. Brad, “Student Financial Aid and the College HSB, CPSEnrollment Decision: The Effects of Public andPrivate Grants and Interest Subsidies” (1985)
Schwartz, J. Brad, “Wealth Neutrality in Higher HSB, CPSEducation: The Effects of Student Grants” (1986)

MATHTECH, INC.
SECTION III. DATA 11
III. DATA
A. NELS DATA
While a number of studies have used data from the National Longitudinal Survey, Youth
Cohort (NLSY), the National Longitudinal Study of the High School Class of 1972 (NLS72), and
the High School and Beyond Survey (HSB) to examine the factors affecting college enrollments,
this work effort is among the first to use NELS to analyze these types of issues. In 1988, NELS
initially surveyed over 24,000 public and private school eighth graders throughout the United
States. The nationally representative eighth grade cohort was tested in four subjects
(mathematics, reading, science, and social studies). Two teachers of each student (representing
two of the four subjects) were also surveyed, as was an administrator from each school. On
average, each of the 1,052 participating schools was represented by 24 students and five teachers.
Parents were also surveyed, providing researchers with detailed information on family background
variables.
Since 1988, the initial eighth grade cohort has been re-surveyed three times (and has been
“freshened” with new sample members). The first follow-up of NELS (spring, 1990), included
the same components as the base year study, with the exception of the parent survey, which was
not implemented in the 1990 round. It also included a component on early dropouts (those who
left school between the end of eighth grade and the end of 10th grade). The second follow-up
(spring, 1992), repeated all components of the first follow-up study and also included a parent
questionnaire. However, this time only one teacher of each student (either a mathematics or a
science teacher) was asked to complete a teacher questionnaire. High school transcript data were
also collected for these students.
A subsample of the NELS:88 second follow-up sample was again followed-up in the
spring of 1994, when most sample members had been out of high school for 2 years. In all,
14,915 students were surveyed, most through computer-assisted telephone interviewing. Major
content areas for the third follow-up questionnaire were: education histories; work experience
histories; work-related training; family formation; opinions and other experiences; occurrence or

MATHTECH, INC.
SECTION III. DATA 12
non-occurrence of significant life events; and income. Data collection for this wave began on
February 4, and ended on August 13, 1994. At the time the data were collected, most of the
respondents were 2 years out of high school. Table 2 summarizes the components of the different
waves of the surveys.
Table 2
OVERVIEW OF NELS
NELS Base Year First Follow-up Second Follow-up Third Follow-upComponents Spring term 1988 Spring term 1990 Spring term 1992 Spring 1994
Grades included grade 8 modal grade = modal grade = senior H.S. + 2 yearssophomore
Cohort students: students, dropouts: students, dropouts: all individuals:questionnaire, tests questionnaire, tests questionnaire, tests, questionnaire
H.S. transcripts
Parents questionnaire none questionnaire none
Principals questionnaire questionnaire questionnaire none
Teachers two teachers per two teachers per student one teacher per nonestudent (taken from (taken from reading, student (taken fromreading, mathematics, mathematics, science, or mathematics orscience, or social social studies) science)studies)
B. NPSAS DATA
Because the NELS database does not contain detailed information on financial aid, the
National Postsecondary Student Aid Study (NPSAS) database is used to supplement our study
with additional financial aid information. This database is used to predict financial aid for the
respondents in NELS based on demographic and other characteristics that are available in both
databases. NPSAS is constructed specifically to provide information on financing of post-
secondary education, so it is a good candidate for this use. This database surveys a nationally
representative sample of undergraduate, graduate, and first-professional students attending less
than 2-year, 2-year, 4-year, and doctoral granting institutions. Both students who receive and
those who do not receive financial aid are surveyed.

MATHTECH, INC.
Those who were tenth graders in 1990 but were not in the base-year sampling frame, either because they were4
not in the country or because they were not in the eighth grade in the spring term of 1988.
Those who were 12th graders in 1992 but were not in either the base year or first follow-up sampling frames,5
either because they were not in the country or because they were not in the eighth (10th) grade in the spring term of1988 (1990).
Students excluded in 1988 due to linguistic, mental, or physical obstacles to participation.6
SECTION III. DATA 13
The 1993 NPSAS study collected information on more than 78,000 undergraduate and
graduate students at about 1,100 institutions. To be eligible, students must have been enrolled
between May 1, 1992 and April 30, 1993 at a postsecondary institution in the United States or
Puerto Rico. The students had to be enrolled in courses for credit, and in a program of 3 months
or longer. Also eligible for inclusion were students who received a bachelor’s degree between
July 1, 1992 and June 30, 1993. Students who were enrolled in a GED program or who were
also enrolled in high school were not included.
C. SAMPLE AND WEIGHTS
Of the 14,915 respondents in the third NELS follow-up, 13,120 are represented in all four
waves of the NELS data. The remaining 1,795 respondents are either first follow-up “freshened”
students, second follow-up freshened students, base-year ineligibles, or base-year 4 5 6
eligible students who declined to participate in one or more of the survey waves, but who did
participate in the third survey wave. The breakdown of these 1,795 respondents is as follows:
501 first follow-up freshened students, 102 second follow-up freshened students, 271 base-year
ineligibles, and 921 base-year eligibles with missing survey waves.
To take advantage of the longitudinal nature of the NELS data and to be consistent across
models and issues in the report, we focus our work on the sample of 13,120 respondents
represented in all four waves of the NELS data. Consequently, the weight used in our analyses,
(“F3PNLWT”) applies to sample members who completed questionnaires in all four rounds of
NELS:88. As a result, the longitudinal analyses that we conduct, and the estimates that are
produced in this study can only be used to make projections to the population of spring 1988
eighth graders. In the descriptive tables, all percentages are weighted using F3PNLWT, including
the analyses with the high school transcript data.

MATHTECH, INC.
SECTION III. DATA 14
This sample includes dropouts, since the purpose of this study is to examine the overall
question of what characteristics of eighth graders in 1988 are related to PSE attendance. We
focus on early indicators, such as educational expectations and course-taking behavior in the
eighth grade, and not on the “pipeline” of high school experiences that a dropout would lack
access to. However, the dropouts were not asked the same set of survey questions as the other
respondents, and, therefore, some of the analysis does not include dropouts. For each of our
tables or figures, we note whether or not the dropouts are included in the analysis.
D. CORRECTED STANDARD ERRORS
Because NELS data are collected through a multi-stage sampling scheme, calculation of
standard errors through standard methods can understate these errors. The sampling technique
used in NELS is a selection of schools, and then within schools, a selection of students. With this
sampling method, the observations of different students may not be independent from one
another. Stata™, the statistical software used for analysis in this report, corrects the standard
errors for these sampling techniques. Except for multinomial logit models, for which this
correction is not available, survey correction techniques are used, and we note whenever the
corrections are not used. However, we have found that such corrections do not have a large
effect on our results, and therefore, we present all results with confidence.
E. VARIABLE DEFINITIONS
The appendix to this study contains definitions of the key variables used in our analysis.
For each key variable, we describe how we constructed the variable and we list the names of the
NELS variables used in the construction.

MATHTECH, INC.
SECTION IV. WHO GOES TO COLLEGE? 15
IV. WHO GOES TO COLLEGE?
A. WHAT PROPORTION OF STUDENTS ATTEND COLLEGE, AND WHAT TYPEOF COLLEGE DID THEY ATTEND?
We begin our analysis by examining the demographics of postsecondary school choice and
discussing our main findings regarding college attendance rates and types of postsecondary
education (PSE) attended. As shown in Table 3, a majority of 1988 eighth graders attend some
type of PSE by 1994. Overall, 62.7 percent of the respondents attend PSE. (Note that in all of
the tables in this report, all percentages are weighted.)
Students are most likely to attend a 4-year public or a less than 4-year public school.
Approximately 24 percent of the students attend each of these types of schools. Next most
common are 4-year private schools. Just over 11 percent of the respondents attend 4-year private
schools. Only 4 percent of the respondents attend less than 4-year private schools. Thirty-seven
percent of the respondents do not attend any type of PSE.
Women are slightly more likely than men to attend PSE. While 60 percent of men attend
PSE, 65 percent of women attend. Women are more likely than men to attend 4-year private
schools and less than 4-year private schools.
Native Americans, Blacks, and Hispanics are least likely to attend PSE and Asians and
Pacific Islanders are most likely to attend PSE. Hispanics are most likely to attend less than 4-
year private schools.
Students whose parents have higher education levels are much more likely to attend PSE.
While only 33 percent of students whose parents have less than a high school education attend
PSE, 90 percent of students whose parents have an advanced degree attend PSE.

MATHTECH, INC.
SECTION IV. WHO GOES TO COLLEGE? 16
Table 3
DEMOGRAPHICS OF POSTSECONDARY SCHOOL CHOICE1
No PSE 4-Year Public 4-Year Private <4-Year Public <4-Year Private2
All observations (weighted distribution) 37.3 24.0 11.1 23.7 4.0
By Sex
male (50.1) 40.0 23.6 9.7 23.8 2.93
female (49.9) 34.7 24.3 12.4 23.6 5.0
By Race
Asian/ Pacific Islander (3.5) 21.0 29.8 17.6 27.5 4.1
Hispanic (10.3) 47.1 16.1 5.7 25.1 5.9
Black (13.3) 48.0 20.4 7.7 18.9 5.0
White (71.4) 34.2 25.8 12.3 24.2 3.5
Native American (1.4) 62.2 10.1 3.6 22.0 2.2
By Parents’ Highest Education
< high school (10.8) 66.6 8.5 2.7 15.7 6.6
high school diploma or GED (20.3) 55.8 13.1 5.0 22.9 3.2
some college (41.2) 38.2 22.9 8.2 26.7 4.1
4-year college graduate (14.5) 13.3 40.5 18.9 23.6 3.7
advanced degree (13.2) 9.6 39.7 30.4 17.8 2.6
By Region
northeast (19.3) 27.9 26.1 24.0 17.3 4.6
midwest (25.7) 35.6 28.0 10.6 21.6 4.2
south (35.7) 40.2 24.8 7.3 24.2 3.4
west (19.4) 36.1 19.3 8.1 32.4 4.1
By Urbanization
urban (28.4) 34.3 24.9 13.8 23.0 4.0
suburban (40.5) 31.7 25.7 12.3 25.7 4.5
rural (31.1) 42.5 23.7 8.5 22.1 3.3
This analysis includes high school dropouts.1
Private schools less than 4-years include private for profit schools. 2
An example of the way this table should be read is that 40 percent of males who were eighth graders in 1988 do not3
go to PSE by 1994, 23.6 percent of males go to a 4-year public college, 9.7 percent of males go to a 4-year privatecollege, 23.8 percent of males go to less than 4-year public school, and 2.9 percent of males go to a less than 4-yearprivate school. Rows sum to 100 percent (approximately because of rounding). In addition, 50.1 percent of oursample is male and 49.9 percent is female.

MATHTECH, INC.
We tested three other definitions of low income, besides the bottom third: bottom fourth of income7
distribution; family income below 150 percent of the poverty threshold; and family income below the Pell grantmaximum eligibility level. Using these alternative definitions, the percentage asigned to the low income, high test scoregroup did not vary significantly. For example, the (weighted) percentage of low income, high test score studentsattending PSE ranged from 70 to 72 percent and the percentage attending a 4-year institution ranged from 45 to 47percent.
This test is described in the Appendix.8
SECTION IV. WHO GOES TO COLLEGE? 17
B. HOW ARE INCOME AND TEST SCORE RELATED TO WHO GOES TOCOLLEGE?
This section first describes how we divided the NELS sample into income and test score
groups, and then describes how income and test score are related to who goes to college.
Family income level is defined using total family income, as provided by the parents in the
base-year and second follow-up questionnaires. We divided the family income levels in the base
year into bottom, middle, and top groups. Since family income is only available in ranges, and not
as exact amounts, we were unable to divide the sample into three groups of equal size. Rather,
the low income, middle income, and high income groups represent 38 percent, 39 percent and 23
percent of our sample, respectively.
When the base-year family income was not available, students were placed according to
second follow-up family income ranking. The rationale for this method was to ensure a sufficient7
number of observations in the low income group. Since the income groups are only used to
assign a respondent to one of the three groups, and are not used to assign an actual dollar amount
of family income, this approach is reasonable. Further, we found that, for those with both data
points of family income, a person in a given income group in the base year was most likely to be
in the same income group in the second follow-up year.
As a proxy measure of ability, we used the composite reading/math test score administered
in each wave of the survey. We divided the scores from the base year into bottom, middle, and8
top groups, with approximately one-third of the students in each category. If the base-year test
score was not available, then students were placed according to their ranking in the first follow-up
test, and if both the base-year test and the first follow-up test were missing, then students were

MATHTECH, INC.
SECTION IV. WHO GOES TO COLLEGE? 18
placed according to their ranking in the second follow-up test. Again, the rationale for this
method is to ensure a reasonable number of observations, and is only used to assign a person to
one of the three groups. As with income, test scores for an individual are highly correlated across
the survey waves. A person in a given test score group in the base year is most likely to be in the
same test score group in the first and second follow-ups.
Table 4 and Figure 1 depict key points regarding the relationship among income, test
score, and PSE attendance for all 1988 eighth graders, including dropouts. We find that
individuals with the lowest test scores are least likely to attend PSE. While 38 percent of the
lowest test score group attends PSE, 63 percent of the middle test score group attends PSE and
87 percent of the highest test score group attends PSE. PSE attendance also increases with
family income. Nearly 44 percent of the bottom family income group attends PSE, 69 percent of
the middle income group attends PSE, and 86 percent of the top income group attends PSE.
When we examine only the high test score students, income differences are greatly
reduced but are not eliminated. Of those in the top test group, 75 percent of the low income
group attend PSE. This compares with 86 percent of those in the middle income, top test score
group and 95 percent in the top income, top test score group. However, the low income, high
test score individuals do attend PSE at a higher rate than the high income, low test score
individuals (75 percent versus 64 percent).
Income effects tend to diminish in magnitude as test scores increase. For example, within
the bottom test group, the difference in PSE attendance rates for low income and high income
individuals is 35 percent (29 percent versus 64 percent). This contrasts with the 20 percent
difference in PSE attendance rates for low income and high income individuals within the top test
group, (75 percent versus 95 percent).

MATHTECH, INC.
SECTION IV. WHO GOES TO COLLEGE? 19
Table 4
POSTSECONDARY SCHOOL CHOICE, BY INCOME AND TEST SCORE1
No PSE 4-Year Public 4-Year Private <4 Year Public <4 Year Private
All observations (weighted distribution) 37.3 24.0 11.1 23.7 4.0
By Test Score
bottom (33.8) 61.7 8.8 2.8 21.9 4.82
middle (33.4) 36.6 21.9 8.2 28.8 4.5
top (32.8) 13.0 41.6 22.4 20.5 2.5
By Family Income Level
bottom (38.4) 56.1 14.5 5.3 19.6 4.5
middle (38.8) 31.2 25.6 10.9 28.3 4.1
top (22.8) 14.4 38.1 21.5 23.2 2.9
By Test Score and Family Income
bottom test, bottom income (18.8) 70.9 6.7 1.6 16.1 4.8
bottom test, middle income (10.8) 53.4 10.8 4.1 26.8 4.8
bottom test, top income (3.8) 36.4 15.8 4.8 38.3 4.8
middle test, bottom income (12.9) 50.6 15.9 5.6 23.5 4.4
middle test, middle income (13.9) 31.9 21.8 7.4 34.2 4.7
middle test, top income (6.7) 19.2 33.1 15.0 28.4 4.3
top test, bottom income (6.8) 25.3 33.7 14.9 22.4 3.7
top test, middle income (14.2) 13.9 40.3 19.4 23.5 2.9
top test, top income (12.2) 4.8 47.7 30.1 15.9 1.6
Dropouts are included.1
An example of how to read this table is that 61.7 percent of those 1988 eighth graders who were in the bottom test2
score group do not attend PSE, 8.8 percent attend a 4-year public college, 2.8 percent attend a 4-year private college,21.9 percent attend a less than 4-year public school, and 4.8 percent attend a less than 4-year private schools. Rowssum to 100 percent (approximately because of rounding). In addition, 33.8 percent of our sample is in the bottom testscore group.

MATHTECH, INC.
SECTION IV. WHO GOES TO COLLEGE? 20
FIGURE 1 HERE

MATHTECH, INC.
Here we examine activities that students engage in 2 years after the normal high school graduation rate9
regardless of whether they graduated from high school at the normal time. As such, dropouts are included in the table.
SECTION IV. WHO GOES TO COLLEGE? 21
C. HOW ARE INCOME AND ABILITY RELATED TO THE TYPE OF PSEATTENDED?
Figure 2 examines PSE attendance at 4-year schools for those students who attend PSE.
As shown, for those in PSE, low income students are less likely to attend 4-year schools than
higher income students, even among high test score students. While 65 percent of those
individuals in the bottom income, top test score group who attend PSE attend a 4-year college, 69
percent of those in the middle income, top test score group and 82 percent of those in the top
income, top test score group attend a 4-year college. Thus, controlling for test score, low income
students are less likely to attend 4-year schools than higher income students.
For those in PSE, low income students are disproportionately found in public institutions
relative to higher income students, even within the group of high test score students. Further
examination of Table 4 shows that while 31 percent of low income, high test score students who
attend 4-year institutions attend private schools; 39 percent of high income, high test score
students attend private schools.
D. WHAT POST HIGH SCHOOL ACTIVITIES ARE STUDENTS INVOLVED IN?
Next we examine educational and other activities that students engage in after high school
by income and test score groups. Table 5 describes the full range of activities a respondent might
be involved in after high school.9
Students in the bottom income, top test score group are most commonly combining work
and academic courses 2 years after they would be expected to have graduated from high school.
The same is true of the respondents in the middle income, top test score group. This compares
with students in the top income, top test score group, who are most likely to be taking academic
courses and not working. Relative to the top income, top test score group, the bottom and

MATHTECH, INC.
SECTION IV. WHO GOES TO COLLEGE? 22
[FIGURE 2 HERE]

MATHTECH, INC.
SECTION IV. WHO GOES TO COLLEGE? 23
Table 5
POST HIGH SCHOOL ACTIVITIES, BY INCOME AND TEST SCORE1
Bottom Family Income Middle Family Income Top Family Income
Bottom Middle Top Bottom Middle Top Bottom Middle Top test test score test score test score test score test score test score test score test scorescore
Work and academic courses 9.2 18.9 36.4 17.8 29.8 38.4 31.1 30.9 34.6
Work and vocational courses 3.0 3.7 2.2 4.8 4.4 1.8 2.2 3.3 1.2
Work and no school 48.6 43.9 24.8 48.5 31.6 20.5 37.5 19.3 9.62
Academic courses and no work 5.8 10.7 19.3 8.5 16.5 28.2 11.2 28.9 45.2
Vocational courses and no work 1.9 1.5 1.0 1.8 1.8 0.5 3.2 2.4 0.3
Academic courses and looking for work 0.8 2.0 2.0 1.5 3.2 2.5 0.9 3.7 3.3
Vocational courses and looking for work 1.5 0.3 0.1 0.8 0.3 0.3 0.0 0.0 0.0
Looking for work and no school 12.8 7.3 4.3 6.3 4.3 1.9 4.0 5.4 1.7
Military and academic or vocational courses 0.0 0.1 0.1 0.1 0.1 0.1 0.0 0.1 1.0
Military and work 0.6 1.3 1.3 0.7 1.4 0.5 0.6 0.9 0.6
Military only 1.3 2.8 3.9 1.6 2.8 1.8 0.6 1.5 0.3
Training and academic or vocational courses 0.4 0.0 0.4 0.1 0.1 0.3 0.6 0.2 0.2
Training only 0.5 0.2 0.0 0.2 0.1 0.1 0.0 0.0 0.1
Keeping house only 7.9 4.1 2.1 4.8 2.8 1.6 3.8 1.3 0.6
Other 5.9 3.3 2.2 2.5 0.8 1.6 4.3 2.2 1.3
Dropouts are included in this analysis.1
An example of how to read this table is that 48.6 percent of bottom income, bottom test score respondents reported that they worked, 43.9 percent of bottom2
income, middle test score respondents reported that they worked, 24.8 percent of bottom income, top test score respondents reported that they worked, 48.5percent of middle income, bottom test score respondents reported that they worked, 31.6 percent of middle income, middle test score respondents reported thatthey worked, 20.5 percent of middle income, top test score respondents reported that they worked, 37.5 percent of top income, bottom test score respondentsreported that they worked, 19.3 percent of top income, middle test score respondents reported that they worked, and 9.6 percent of top income, top test scorerespondents reported that they worked. Columns sum to 100 percent (approximately due to rounding).

MATHTECH, INC.
SECTION IV. WHO GOES TO COLLEGE? 24
middle income, top test score groups are more likely to be working and not attending PSE (25
percent and 21 percent compared to 10 percent for the high income, high test score group). This
suggests that forgone earnings may be a bigger factor affecting the enrollment decision of lower
and middle income students, even high test score students who likely could succeed in college.
Those in the bottom income, top test score group are the most likely to enter the armed
forces. While 4 percent of those in the bottom income, top test score group are in the “military
only” category, 2 percent of those in the middle income, top test score group, and less than 1
percent of those in the top income, top test score group are in this category. This indicates that a
small fraction of lower income students choose to enter the military as an alternative to PSE,
perhaps because of lack of financial resources.
MATHTECH, INC.
SECTION V. FACTORS RELATED TO PSE ATTENDANCE 25
V. FACTORS RELATED TO PSE ATTENDANCE
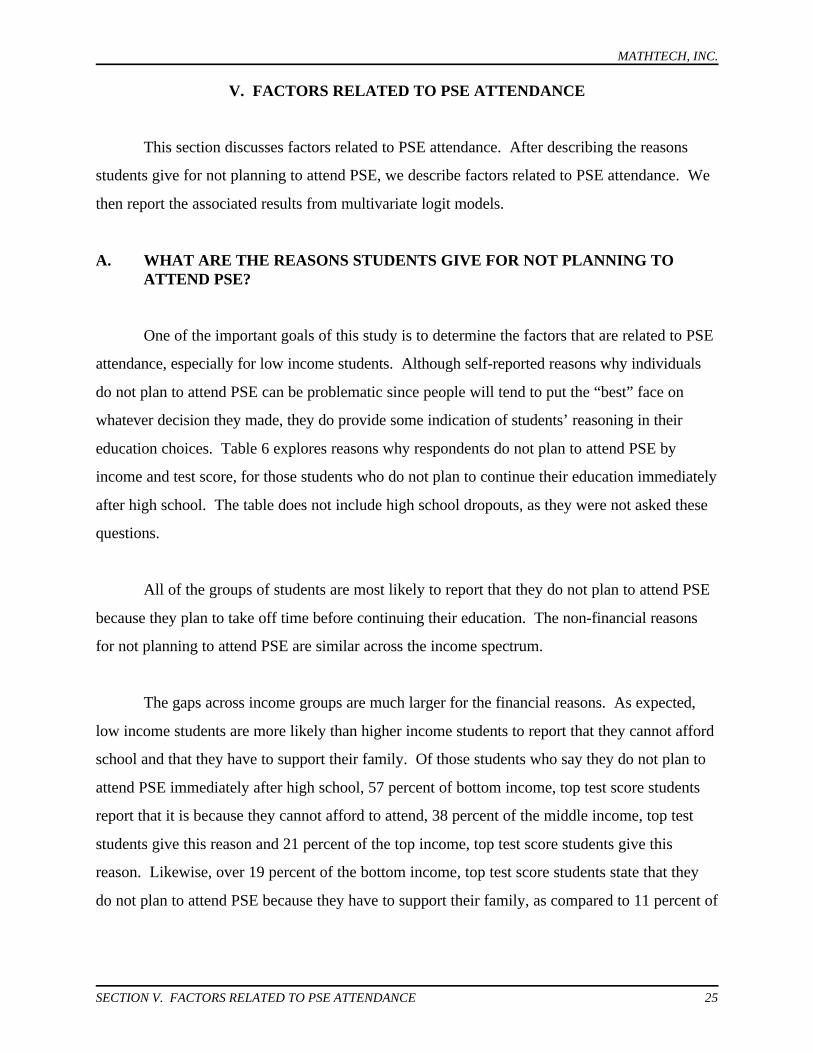
This section discusses factors related to PSE attendance. After describing the reasons
students give for not planning to attend PSE, we describe factors related to PSE attendance. We
then report the associated results from multivariate logit models.
A. WHAT ARE THE REASONS STUDENTS GIVE FOR NOT PLANNING TOATTEND PSE?
One of the important goals of this study is to determine the factors that are related to PSE
attendance, especially for low income students. Although self-reported reasons why individuals
do not plan to attend PSE can be problematic since people will tend to put the “best” face on
whatever decision they made, they do provide some indication of students’ reasoning in their
education choices. Table 6 explores reasons why respondents do not plan to attend PSE by
income and test score, for those students who do not plan to continue their education immediately
after high school. The table does not include high school dropouts, as they were not asked these
questions.
All of the groups of students are most likely to report that they do not plan to attend PSE
because they plan to take off time before continuing their education. The non-financial reasons
for not planning to attend PSE are similar across the income spectrum.
The gaps across income groups are much larger for the financial reasons. As expected,
low income students are more likely than higher income students to report that they cannot afford
school and that they have to support their family. Of those students who say they do not plan to
attend PSE immediately after high school, 57 percent of bottom income, top test score students
report that it is because they cannot afford to attend, 38 percent of the middle income, top test
students give this reason and 21 percent of the top income, top test score students give this
reason. Likewise, over 19 percent of the bottom income, top test score students state that they
do not plan to attend PSE because they have to support their family, as compared to 11 percent of

MATHTECH, INC.
SECTION V. FACTORS RELATED TO PSE ATTENDANCE 26
Table 6
REASONS RESPONDENTS DID NOT PLAN TO ATTEND PSE, BY INCOME AND TEST SCORE1
Reasons Respondents Do not Plan to Attend PSE Bottom Family Income Middle Family Income Top Family Income
Bottom Middle Top Bottom Middle Top Bottom Middle Top test score test score test score test score test score test score test score test score test score
Percentage not planning to continue education right 40.1 30.7 16.0 31.6 21.8 11.7 25.5 14.7 4.3after high school
Cannot afford school 49.7 49.2 57.2 45.0 42.5 37.7 27.8 37.8 21.2
Has to support family 26.7 18.7 19.3 15.4 12.3 10.7 14.1 15.6 0.6
Does not like school 29.5 31.5 32.2 33.2 30.6 36.6 40.5 30.8 43.22
Grades not good enough 37.0 29.9 28.8 34.4 23.4 13.5 29.4 19.6 21.6
Test scores too low 17.3 7.3 7.9 13.3 9.4 2.8 13.7 5.8 6.2
Will not need more school for job 27.6 15.9 13.3 23.8 14.6 13.1 20.4 11.6 9.6
Not accepted to schools applied to 10.5 1.9 6.9 6.8 3.9 2.9 9.0 2.3 2.1
Has not taken the right courses 25.1 15.0 10.8 19.8 11.9 7.4 18.7 12.7 9.1
No one in the family has gone to college 23.1 14.8 13.9 13.3 9.1 7.7 7.8 5.1 2.5
Plans to take off time before school 64.4 68.4 78.5 62.5 72.4 78.3 54.4 76.1 69.5
Would rather work and earn money 47.9 37.4 42.9 43.4 45.4 38.3 36.9 24.2 40.6
Plans to be full-time homemaker 8.4 4.6 3.9 5.0 4.5 6.4 5.1 1.6 7.5
Does not think school is important 16.2 7.1 11.1 16.2 12.3 9.8 15.7 7.2 15.8
Teacher recommended work 9.8 3.8 4.3 6.8 2.4 2.2 6.5 4.2 0
This analysis does not include high school dropouts, as they were not asked these questions.1
An example of how to read this table is that 29.5 percent of bottom income, bottom test score respondents who do not plan to attend PSE immediately after high2
school say it is because they do not like school, 31.5 of bottom income, middle test score respondents give this reason and 32.2 percent of bottom income, top testscore respondents give this reason.
MATHTECH, INC.
Of both low and middle income students who said that they did not plan to attend PSE because they had to10
support their family, 65 percent were working and not attending PSE 2 years after high school.
Rigorous high school programs are defined by the courses taken, as shown in the high school transcript. 11
Students who take at least 4 units of English, 3 units of social studies, 3 units of science, 3 units of math, 5 units ofcomputer science, and 2 units of foreign languages are defined to be in a rigorous academic track.
SECTION V. FACTORS RELATED TO PSE ATTENDANCE 27
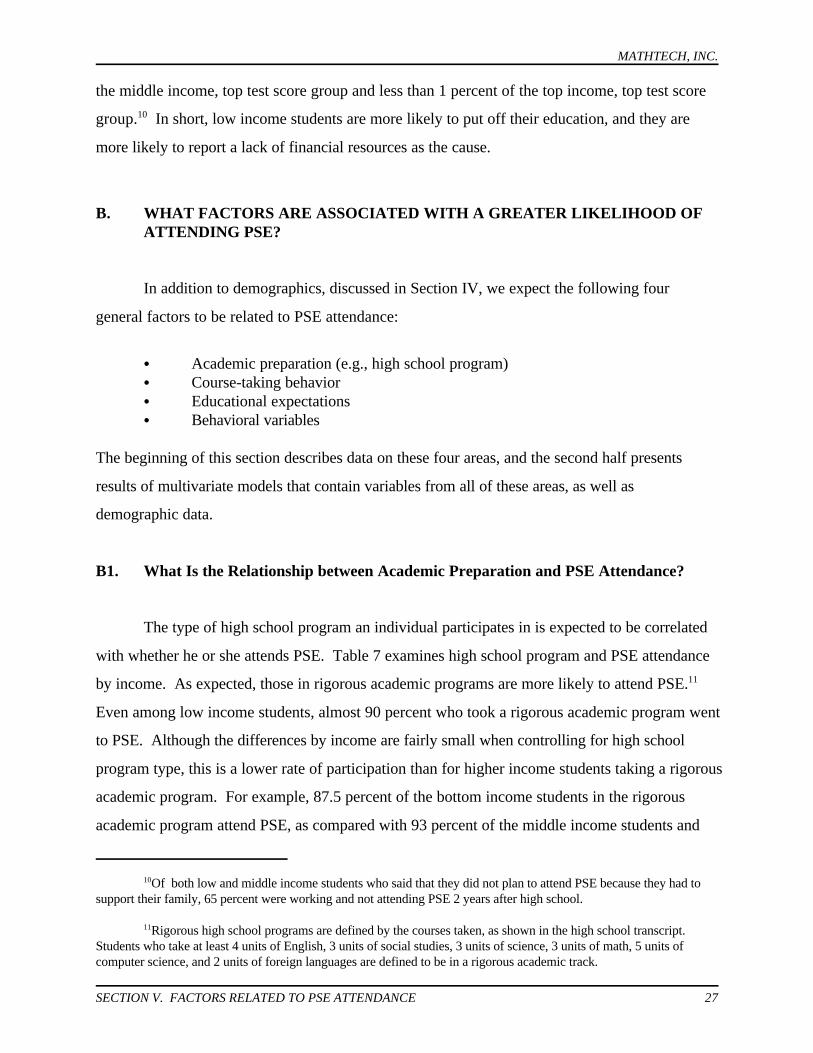
the middle income, top test score group and less than 1 percent of the top income, top test score
group. In short, low income students are more likely to put off their education, and they are10
more likely to report a lack of financial resources as the cause.
B. WHAT FACTORS ARE ASSOCIATED WITH A GREATER LIKELIHOOD OFATTENDING PSE?
In addition to demographics, discussed in Section IV, we expect the following four
general factors to be related to PSE attendance:
C Academic preparation (e.g., high school program)C Course-taking behaviorC Educational expectationsC Behavioral variables
The beginning of this section describes data on these four areas, and the second half presents
results of multivariate models that contain variables from all of these areas, as well as
demographic data.
B1. What Is the Relationship between Academic Preparation and PSE Attendance?
The type of high school program an individual participates in is expected to be correlated
with whether he or she attends PSE. Table 7 examines high school program and PSE attendance
by income. As expected, those in rigorous academic programs are more likely to attend PSE. 11
Even among low income students, almost 90 percent who took a rigorous academic program went
to PSE. Although the differences by income are fairly small when controlling for high school
program type, this is a lower rate of participation than for higher income students taking a rigorous
academic program. For example, 87.5 percent of the bottom income students in the rigorous
academic program attend PSE, as compared with 93 percent of the middle income students and

MATHTECH, INC.
SECTION V. FACTORS RELATED TO PSE ATTENDANCE 28
Table 7
TYPE OF HIGH SCHOOL PROGRAMAND POSTSECONDARY EDUCATION ATTENDANCE
BY FAMILY INCOME1
High School % in each Low Income Middle Income High IncomeProgram program3
No 4-Yr 4-Yr <4-Yr <4-Yr No 4-Yr 4-Yr <4-Yr <4-Yr No 4-Yr 4-Yr <4-Yr <4-YrPSE public private public private PSE public private public private PSE public private public private2
Rigorous 18.2 12.5 45.4 16.8 21.4 3.9 7.0 47.0 21.0 20.6 4.4 3.6 52.4 28.7 14.9 0.4academic
Academic 43.7 33.9 24.0 6.9 30.1 5.2 19.5 31.3 12.9 32.7 3.6 6.5 38.1 25.0 27.1 3.3
Vocational 5.2 73.7 2.5 2.5 15.5 6.0 61.7 3.5 1.2 29.2 4.3 58.7 6.4 4.7 27.1 3.1
Academic/ 6.2 55.7 9.5 3.4 23.6 7.8 32.8 16.6 3.4 41.5 5.7 31.0 22.7 8.6 35.2 2.5vocational
None of the 26.0 80.1 3.2 1.2 11.9 3.6 61.1 6.4 2.4 24.5 5.7 41.0 19.5 5.2 29.8 4.4above
While this analysis does include dropouts, almost all of the dropouts were in the “none of the above” category.1
The less than 4-year private category includes private for profit schools with an unspecified time length.2
Additionally, 0.7 were classified to be in vocational and rigorous academic.3
MATHTECH, INC.
This analysis includes dropouts who may have left high school before they had the opportunity to take some12
of these courses.
SECTION V. FACTORS RELATED TO PSE ATTENDANCE 29
96.4 percent of the top income students. Likewise, controlling for being in the rigorous academic
program, the low income students are less likely to attend a 4-year institution, and are more likely
to attend a less than 4-year school than their higher income counterparts.
B2. What Is the Relationship between Course-Taking Behavior and PSE Attendance?
Above we found that the type of high school program a student is enrolled in is related to
PSE attendance. Here we examine the relationship between individual courses taken and PSE
attendance.
Table 8 examines high school courses and PSE attendance by family income. Individuals in
the top family income group are more likely than those in lower income groups to take the math and
science courses associated with PSE attendance. These courses include calculus, pre-calculus,
algebra, geometry, physics, chemistry, and biology. For example, only 46 percent of low income
students took geometry in high school, while 69 percent of middle income students and 82 percent
of high income students did.12
There is also evidence that students who take advanced math and science courses are
more likely to go to college. For example, 76 percent of low income students who took algebra
II in high school went on to college, while only 32 percent of low income students who did not
take algebra II went to college.
While the relationship between taking advanced courses and PSE attendance is strong for
all students, the correlation appears to be greater for lower income students. For example, taking
chemistry in high school is associated with a greater likelihood that a student will go to college.
The difference in the rate of college-going between those who do and do not take chemistry in
high school is greater for low income students (79 percent versus 31 percent) than for middle
income students (89 percent versus 50 percent) or high income students (95 percent versus 68
percent).

MATHTECH, INC.
SECTION V. FACTORS RELATED TO PSE ATTENDANCE 30
Table 8
HIGH SCHOOL CURRICULUMAND POSTSECONDARY EDUCATION ATTENDANCE
BY FAMILY INCOME1
Type of Courses Was coursetaken?
Family Income
Bottom Middle Top
% Taking % Who % Taking % Who % Taking % Who course attend PSE course attend PSE course attend PSE
Calculus Yes 4.6 93.8 9.1 93.5 17.7 99.42
No 95.4 44.5 90.9 68.3 82.3 84.8
Pre-calculus Yes 7.1 91.9 14.5 94.9 25.8 98.2
No 92.9 43.4 85.6 66.5 74.2 83.6
Algebra 1 Yes 77.8 58.0 88.8 75.0 93.8 90.53
No 22.2 15.4 11.2 41.1 6.2 50.4
Algebra 2 Yes 34.0 75.9 51.3 85.5 62.1 94.7
No 66.0 31.9 48.7 54.9 37.9 75.3
Geometry Yes 46.2 70.7 69.1 83.6 81.6 93.9
No 53.9 26.4 30.9 41.6 18.4 58.5
Physics Yes 12.9 83.5 23.0 91.4 38.0 97.6
No 87.1 41.4 77.0 64.4 62.0 81.1
Chemistry Yes 33.3 79.2 52.2 89.1 71.6 95.1
No 66.7 30.7 47.8 50.4 28.4 67.8
Biology Yes 81.1 53.9 89.3 74.3 94.9 89.1
No 19.0 16.5 10.7 40.0 5.1 54.4
Foreign language Yes 52.4 67.5 71.8 81.2 85.9 93.3
No 47.6 24.1 28.2 43.7 14.1 51.2
Vocational Yes 26.8 47.1 25.1 65.7 18.2 81.5
No 73.3 46.7 74.9 72.3 81.8 88.7
Technical Yes 1.2 48.7 1.7 83.8 1.7 92.6
No 98.8 46.8 98.3 70.4 98.3 87.3
Basic skills Yes 22.4 46.0 19.9 66.1 15.2 83.1
No 77.6 47.1 80.1 71.7 84.8 88.1
This analysis includes dropouts.1
An example of how to read this table is that 4.6 percent of the bottom income group of students who were eighth2
graders in 1988 take calculus. Of those students in the bottom income group who take calculus, 93.8 percent attendPSE. Of those students in the bottom income group who do not take calculus, 44.5 percent attend PSE.Algebra 1 includes students who took the course in eighth grade (as self-reported) or in high school (as reported in3
their transcript).

MATHTECH, INC.
SECTION V. FACTORS RELATED TO PSE ATTENDANCE 31
Even when course-taking patterns are accounted for, income effects on PSE attendance
remain. For example, within the group of all students who take geometry, higher income students
are more likely to attend PSE than middle income students (94 percent versus 84 percent) or low
income students (94 percent versus 71 percent).
The previous analysis showed that courses taken in high school are strongly related to the
probability of attending PSE. Here we examine the relationship between courses attended in
eighth grade and PSE attendance, as these courses lay groundwork for courses that can be taken
in high school.
Table 9 examines classes attended at least once per week by eighth graders and PSE atten-
dance, by family income. Students who take algebra I or who take science laboratory at least
once a week in eighth grade are more likely to attend PSE than those who do not, and individuals
with higher income are more likely to be taking these courses. The relationship between taking
algebra I in the eighth grade and attending PSE is greater for the low income students than for
middle or high income students. (But low income students are less likely to take algebra 1 in the
eighth grade.) The rate of college attendance is 20 percentage points higher for low income
students who take algebra I as compared to those who do not (61 percent as compared to 40
percent) compared to only 15 percentage points for middle income students (78 percent as
compared to 64 percent) and 10 percentage points for high income students (91 percent as
compared to 81 percent). However, even accounting for the course-taking behavior of eighth
graders, income effects remain. The high income students who take algebra are more likely than
the low income students who take algebra to attend PSE. While 61 percent of the low income
students who take algebra attend PSE, 78 percent of the middle income students who take algebra
attend PSE, and 91 percent of the top income students who take algebra attend PSE.
B3. What Is the Relationship between Educational Expectations and PSE Attendance?
Educational expectations, which are formed early in the school experience, are highly
correlated with PSE attendance. Table 10A explores educational expectations in eighth grade and
PSE attendance associated with those expectations. Over 65 percent of eighth graders

MATHTECH, INC.
There is also a slight decline in expectations over time. In the eighth grade, 43 percent expected to receive a13
bachelor’s degree (and 23 percent a master’s degree or higher), while in the 12th grade (not shown in table), 32 percentwere expecting to receive a bachelor’s degree (and 30 percent a master’s degree or higher).
SECTION V. FACTORS RELATED TO PSE ATTENDANCE 32
Table 9
CLASSES REPORTED TO BE ATTENDED AT LEAST ONCE PER WEEK BY EIGHTH GRADERS AND PSE ATTENDANCE
BY FAMILY INCOME1
Type of Course Was course Family Incometaken? Bottom Middle Top
% of % Who % of % Who % of % WhoStudents attend Students attend Students attend
PSE PSE PSE
Remedial math Yes 9.7 27.0 6.3 58.3 6.1 73.12
No 90.3 47.0 93.7 69.9 93.9 86.9
Regular math Yes 76.4 41.1 67.1 66.2 53.6 82.1
No 23.6 54.3 32.9 75.3 46.4 90.3
Algebra 1 Yes 28.6 61.3 39.2 78.4 54.3 90.73
No 71.4 39.6 60.8 63.5 45.7 80.9
Science laboratory Yes 24.0 50.8 29.7 72.2 37.7 90.5
No 76.0 44.4 70.3 67.8 62.3 83.7
Science Yes 60.4 43.3 60.6 67.9 59.4 84.2
No 39.6 46.6 39.4 71.1 40.6 88.6
Biology Yes 18.1 47.6 19.8 67.4 19.0 88.1
No 81.9 45.2 80.3 69.9 81.0 85.8
Earth science Yes 54.3 44.8 50.3 69.6 47.6 87.5
No 45.7 46.0 49.7 69.5 52.4 85.1
This analysis includes dropouts.1
An example of how to read this table is that 9.7 percent of the bottom income students take remedial math. Of those2
students in the bottom income group who take remedial math, 27 percent attend PSE.Numbers for regular math, remedial math, and algebra do not sum to 100 because some students take more than one3
type of math.
expected to complete at least a bachelor’s degree while an additional 13 percent expected to
attend college. The higher one’s educational expectations, the more likely one is to attend PSE.
While 19 percent of eighth graders who expect to just graduate high school actually attend PSE,
73 percent of those who in eighth grade expect to obtain a bachelor’s degree attend college, and
83 percent of those who expect to obtain a master’s degree or higher attend college. 13

MATHTECH, INC.
SECTION V. FACTORS RELATED TO PSE ATTENDANCE 33
Table 10B examines eighth grade educational expectations and PSE attendance by
income. Students with higher family income expect higher levels of educational attainment.
While 51 percent of those in the bottom income group expect to complete a bachelor’s degree or
higher, 69 percent in the middle income group and 85 percent in the top income group expect to
complete a bachelor’s degree or higher. Even among those students who expect to complete a
bachelor’s degree, high income students are more likely to attend PSE than are low income
students. While 58 percent of bottom income students who expect to complete a bachelor’s
degree attend PSE, 75 percent of middle income and 90 percent of top income students who
expect to complete a bachelor’s degree attend PSE.
Table 10A
EIGHTH GRADE EDUCATIONAL EXPECTATIONS AND PSE ATTENDANCE1
% % Attending PSE
Less than high school 1.5 20.9
High school graduate 10.4 19.4
Trade school 9.2 36.5
Some college 13.2 51.4
Bachelor’s degree 43.1 73.4
Master’s degree or higher 22.6 83.1
This analysis includes dropouts.1
Table 10B
EIGHTH GRADE EDUCATIONAL EXPECTATIONS AND PSE ATTENDANCEBY INCOME1
Bottom Income Middle Income Top Income
% % % % % % Attending Attending Attending
PSE PSE PSE
Less than high school 2.2 13.3 1.0 48.8 1.2 *
High school graduate 16.9 15.6 7.6 26.7 3.8 31.1
Trade school 13.1 27.7 8.9 46.5 3.3 53.4
Some college 16.8 42.7 13.2 55.8 7.1 73.8
Bachelor’s degree 36.7 57.8 47.0 75.4 48.1 90.2
Master’s degree or higher 14.3 65.4 22.4 86.4 36.5 92.9
* Too few observations to make any inferences.
MATHTECH, INC.
SECTION V. FACTORS RELATED TO PSE ATTENDANCE 34
This analysis includes dropouts.1
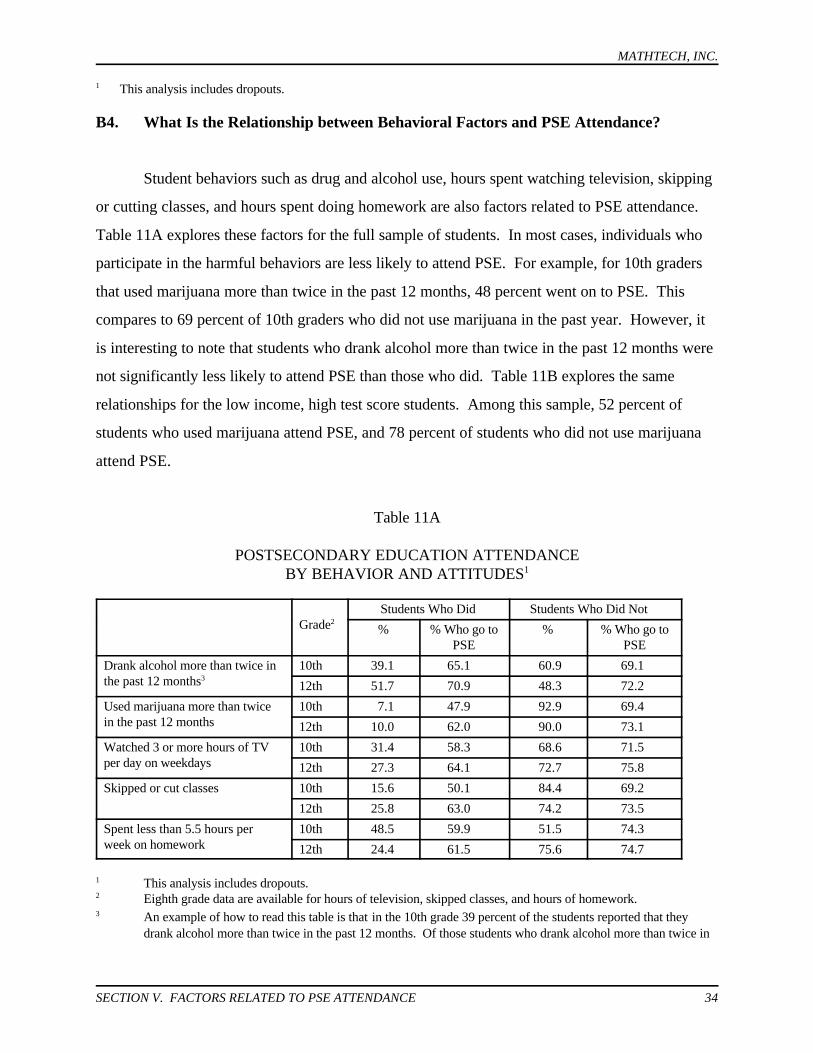
B4. What Is the Relationship between Behavioral Factors and PSE Attendance?
Student behaviors such as drug and alcohol use, hours spent watching television, skipping
or cutting classes, and hours spent doing homework are also factors related to PSE attendance.
Table 11A explores these factors for the full sample of students. In most cases, individuals who
participate in the harmful behaviors are less likely to attend PSE. For example, for 10th graders
that used marijuana more than twice in the past 12 months, 48 percent went on to PSE. This
compares to 69 percent of 10th graders who did not use marijuana in the past year. However, it
is interesting to note that students who drank alcohol more than twice in the past 12 months were
not significantly less likely to attend PSE than those who did. Table 11B explores the same
relationships for the low income, high test score students. Among this sample, 52 percent of
students who used marijuana attend PSE, and 78 percent of students who did not use marijuana
attend PSE.
Table 11A
POSTSECONDARY EDUCATION ATTENDANCEBY BEHAVIOR AND ATTITUDES1
Grade2
Students Who Did Students Who Did Not
% % Who go to % % Who go toPSE PSE
Drank alcohol more than twice in 10th 39.1 65.1 60.9 69.1the past 12 months3
12th 51.7 70.9 48.3 72.2
Used marijuana more than twice 10th 7.1 47.9 92.9 69.4in the past 12 months 12th 10.0 62.0 90.0 73.1
Watched 3 or more hours of TV 10th 31.4 58.3 68.6 71.5per day on weekdays 12th 27.3 64.1 72.7 75.8
Skipped or cut classes 10th 15.6 50.1 84.4 69.2
12th 25.8 63.0 74.2 73.5
Spent less than 5.5 hours per 10th 48.5 59.9 51.5 74.3week on homework 12th 24.4 61.5 75.6 74.7
This analysis includes dropouts.1
Eighth grade data are available for hours of television, skipped classes, and hours of homework.2
An example of how to read this table is that in the 10th grade 39 percent of the students reported that they3
drank alcohol more than twice in the past 12 months. Of those students who drank alcohol more than twice in

MATHTECH, INC.
SECTION V. FACTORS RELATED TO PSE ATTENDANCE 35
the past 12 months, 65 percent attend PSE. Of those students who did not drink alcohol more than twice in thepast 12 months, 69 percent attend PSE.
Table 11B
POSTSECONDARY EDUCATION ATTENDANCEBY BEHAVIOR AND ATTITUDES
FOR LOW INCOME, HIGH TEST SCORE STUDENTS1
GradeStudents Who Did Students Who Did Not
% % Who go to % % Who go toPSE PSE
Drank alcohol more than twice in 10th 38.5 71.4 61.5 78.6the past 12 months 12th 50.7 77.1 49.3 78.4
Used marijuana more than twice 10th 5.9 51.9 94.1 78.2in the past 12 months 12th 8.9 64.6 91.1 79.0
Watched 3 or more hours of TV 10th 27.5 68.4 72.5 78.3per day on weekdays 12th 25.5 68.4 74.5 80.5
Skipped or cut classes 10th 13.2 61.0 86.8 78.1
12th 22.2 71.4 77.8 79.5
Spent less than 5.5 hours per 10th 37.8 66.1 62.2 81.4week on homework 12th 20.1 63.2 79.9 81.3
This analysis includes dropouts.1
Table 12A displays marriage, childbearing behavior, and PSE attendance of all students.
Students who are married, have children, or expect these events by age 21 are less likely to attend
PSE than those who do not. For example, for students who expected to be married by age 21, 46
percent went on to PSE. This compares to 76 percent of students who did not expect to be
married by age 21. Table 12B shows the same relationships for the low income, high test score
sample.
Table 12A
POSTSECONDARY EDUCATION ATTENDANCEBY MARRIAGE AND CHILDBEARING BEHAVIOR1
Students Who Were Students Who Were Not
% % Who go to % % Who go toPSE PSE
Married by second follow-up 1.7 36.1 98.3 72.12
Expected to be married by age 21 14.3 45.8 85.7 76.13
Had child by second follow-up 4.5 31.5 95.5 72.5
Expected to have child by age 21 8.2 36.3 91.8 75.2
This analysis does not include dropouts.1

Pr(PSE|xt)'e B )x
1%e B )x
MATHTECH, INC.
SECTION V. FACTORS RELATED TO PSE ATTENDANCE 36
An example of how to read this table is that 2 percent of the students were married by the second follow-up survey. 2
Of those students who were married by the second follow-up survey, 36 percent attend PSE. Of those students whowere not married by the second follow-up survey, 72 percent attend PSE.This number includes those who are already married, and the number of those who expect to have a child by age 213
includes those who already have a child.
Table 12B
POSTSECONDARY EDUCATION ATTENDANCEBY MARRIAGE AND CHILDBEARING BEHAVIOR
FOR LOW INCOME, HIGH TEST SCORE STUDENTS1
Students Who Were Students Who Were Not
% % Who go to PSE % % Who go to PSE
Married by second follow-up 1.4 * 98.6 78.31
Expected to be married by age 21 12.3 64.5 87.7 80.32
Had child by second follow-up 2.2 * 97.8 78.9
Expected to have child by age 21 5.5 44.6 94.5 80.3
* Too few observations to draw inferences.This analysis does not include dropouts.1
C. USING A MULTIVARIATE FRAMEWORK, WHAT FACTORS ARE RELATEDTO PSE ATTENDANCE?
This section attempts to better define the factors important for college enrollment. While
the descriptive information provides key data on factors related to PSE attendance, many of the
factors examined are correlated with one another. To identify the dominant factors in the
determination of PSE attendance, we study the problem in a multivariate framework, where we
can examine the effect of each variable on PSE attendance, holding all other factors constant.
The probability that an individual attends PSE is
In this equation, x is a vector of the characteristics of the person making the choice. Mostt
educational choice models relate the choice to the future earnings and benefits that stem from the
choice. However, the NELS data contain little or no information on future earnings and, even in
the most recent wave of the survey, the respondents are just beginning their postsecondary
careers. Furthermore, recent research by Manski (1993) raises questions about the ability of

MATHTECH, INC.
We use the characteristics of the “individual” in the broadest sense so that it includes characteristics of the14
individuals’ families, communities, and attended schools.
This is a count of the number of the following courses that the student took: pre-calculus, calculus, biology,15
chemistry, physics, and foreign language. This information comes from the NELS transcript file.
SECTION V. FACTORS RELATED TO PSE ATTENDANCE 37
educational choice models to separately identify the roles of individual expectations about future
earnings and the individual’s academic ability.
Because of the difficulties in estimating an educational choice model in the tradition of
Willis and Rosen (1979), Manski and Wise (1983), and others, we estimate what may be thought
of as a reduced form educational choice model. The independent variables include only charac-
teristics of the individuals making the choice. We will be unable to determine the motivation for14
the student’s choice, but we will be able to determine the ultimate importance of the individual’s
characteristics in making the choice.
In this model, x includes demographic variables, such as gender, marital status, whether
the student has children, race, and information on the student’s family; academic factors;
behavioral factors; and characteristics of the student’s high school. The variables included in the
model are:
C Asian, Hispanic, Black, and Native American are the controls included for race. Theomitted comparison group is White.
C Information on the student’s family includes whether the parents’ highest educationlevel is a bachelor’s degree or higher, indicator variables for family incomecategories, and family size.
C High school academic characteristics of the student include test score, the number ofcollege preparatory courses taken, whether the student was in a college15
preparatory program in high school, and whether the student expected to achieve aneducation level of a bachelor’s degree or higher.
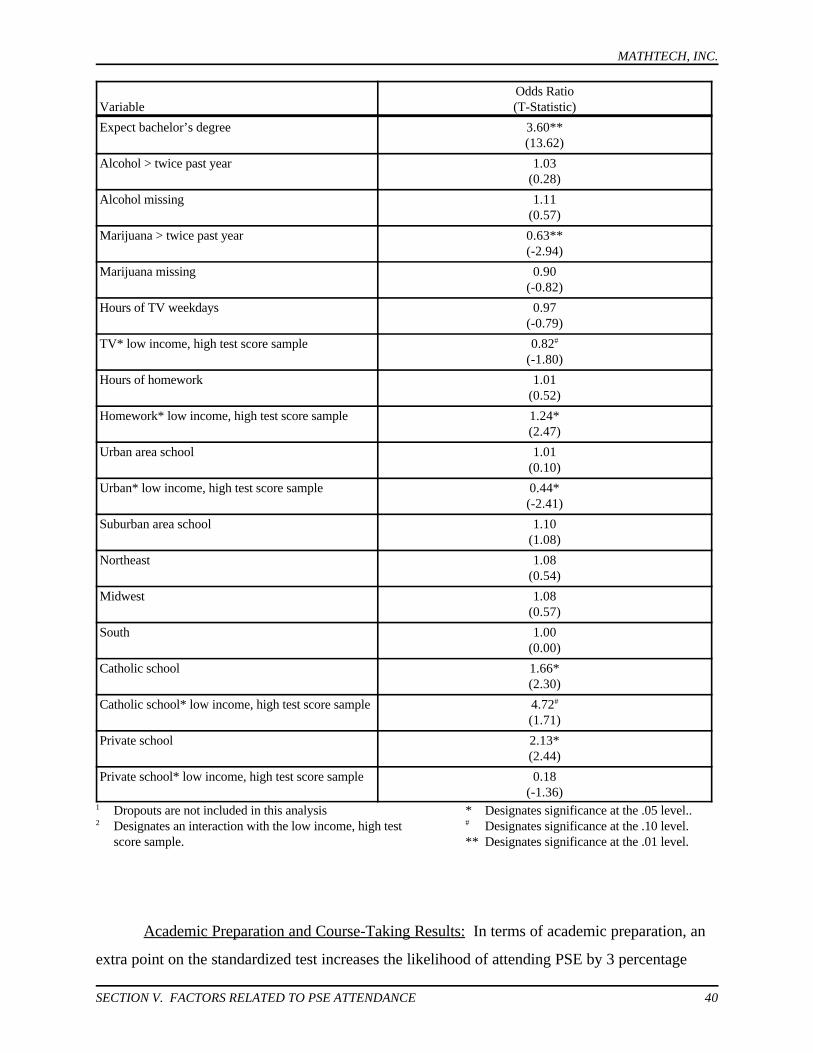
C Behavioral variables of the student include whether the student used alcohol andmarijuana more than twice in the past year, the hours of television the studentwatches on weekdays, and the hours of homework the student does.
C Characteristics of the high school include whether it is in an urban or suburban area(where the omitted comparison group is rural area), what region the school is in

MATHTECH, INC.
The odds ratio is calculated as the coefficient in the logit model multiplied by the probability of attending PSE16
(evaluated at the mean of the sample) and by the probability of not attending PSE (or one minus the probability ofattending PSE). This can be written as $*{P(Y=1)}*{P(Y=0)} where $ is the coefficient estimated in the logit model.
SECTION V. FACTORS RELATED TO PSE ATTENDANCE 38
(where the included regions are Northeast, Midwest, and South, and the omittedcomparison group is West), and whether the school is a Catholic school or anothertype of private school (where the omitted comparison group is public school.)
C Also considered are interactions between whether the individual was in the lowincome, high score test sample and the following variables: female; whether theparents’ highest degree is a bachelor’s degree or higher; family size; number of hoursof television watched; number of hours spent on homework; whether the school is inan urban area; whether the student went to a Catholic school; and whether thestudent went to another type of private school. These interactions indicate theadditional effect these factors have for the low income, high test score sample overand above the effect they have for the sample as a whole.
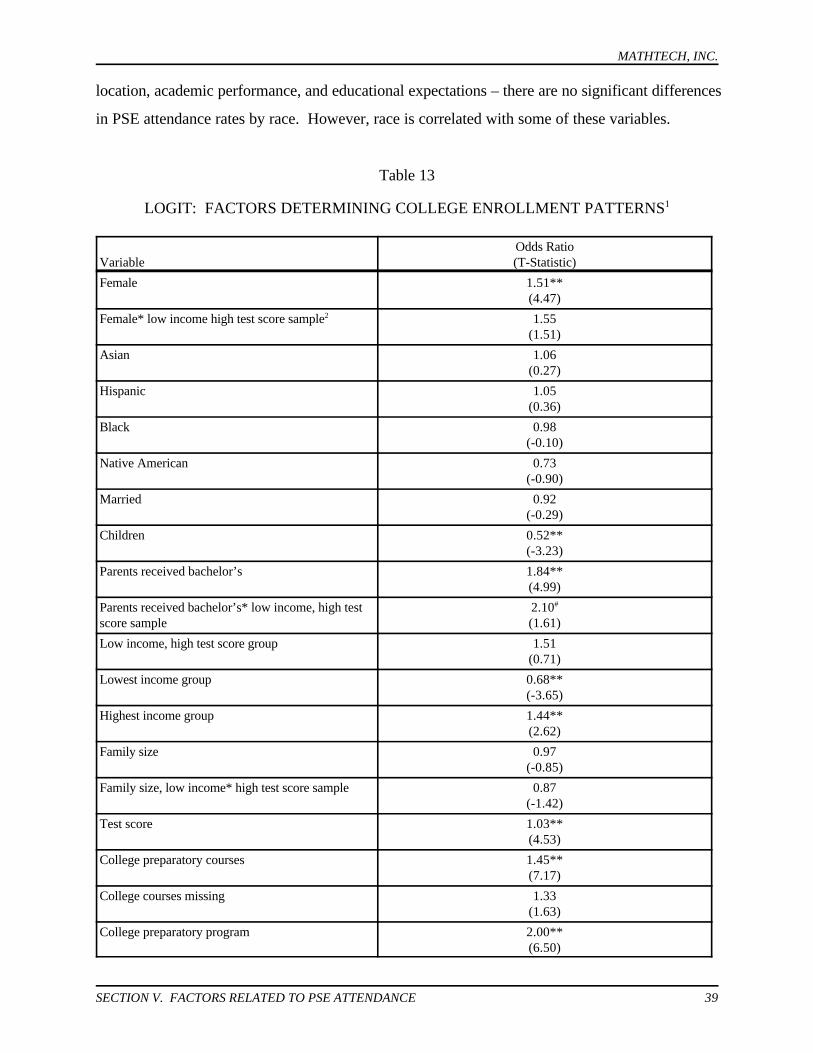
Table 13 presents results from a logit model which predicts PSE attendance. The number
of observations used in this analysis is smaller than the original 13,120 due to item non-response.
The dependent variable is a zero-one variable, with one equal to PSE, and zero equal to no PSE
attended. Results are weighted and corrected for survey sampling techniques. The results are
shown as odds ratios, which are the change in the likelihood of attending PSE as the variable in
question changes by one unit. In the text, we discuss only the effects that are statistically16
significant.
C1. What Factors Are Important for the Group as a Whole?
Demographic Results: The results show that, all other things equal, women are 50 percent
more likely than men to attend PSE. As expected, respondents whose parents received a bachelor’s
degree or higher are more likely to attend PSE; students in the lowest income group are least likely
to attend PSE; and students in the highest income group are most likely to attend PSE.
Other things equal, including income and test score, race does not have a statistically signif-
icant effect on PSE attendance. In other words, for students in similar income and test groups, and
with other similar demographic characteristics – such as parental education, high school type and
MATHTECH, INC.
SECTION V. FACTORS RELATED TO PSE ATTENDANCE 39
location, academic performance, and educational expectations – there are no significant differences
in PSE attendance rates by race. However, race is correlated with some of these variables.
Table 13
LOGIT: FACTORS DETERMINING COLLEGE ENROLLMENT PATTERNS1
Variable (T-Statistic)Odds Ratio
Female 1.51**(4.47)
Female* low income high test score sample 1.552
(1.51)
Asian 1.06(0.27)
Hispanic 1.05(0.36)
Black 0.98(-0.10)
Native American 0.73(-0.90)
Married 0.92(-0.29)
Children 0.52**(-3.23)
Parents received bachelor’s 1.84**(4.99)
Parents received bachelor’s* low income, high test 2.10score sample (1.61)
#
Low income, high test score group 1.51(0.71)
Lowest income group 0.68**(-3.65)
Highest income group 1.44**(2.62)
Family size 0.97(-0.85)
Family size, low income* high test score sample 0.87(-1.42)
Test score 1.03**(4.53)
College preparatory courses 1.45**(7.17)
College courses missing 1.33(1.63)
College preparatory program 2.00**(6.50)
MATHTECH, INC.
Variable (T-Statistic)Odds Ratio
SECTION V. FACTORS RELATED TO PSE ATTENDANCE 40
Expect bachelor’s degree 3.60**(13.62)
Alcohol > twice past year 1.03(0.28)
Alcohol missing 1.11(0.57)
Marijuana > twice past year 0.63**(-2.94)
Marijuana missing 0.90(-0.82)
Hours of TV weekdays 0.97(-0.79)
TV* low income, high test score sample 0.82#
(-1.80)
Hours of homework 1.01(0.52)
Homework* low income, high test score sample 1.24*(2.47)
Urban area school 1.01(0.10)
Urban* low income, high test score sample 0.44*(-2.41)
Suburban area school 1.10(1.08)
Northeast 1.08(0.54)
Midwest 1.08(0.57)
South 1.00(0.00)
Catholic school 1.66*(2.30)
Catholic school* low income, high test score sample 4.72#
(1.71)
Private school 2.13*(2.44)
Private school* low income, high test score sample 0.18(-1.36)
Dropouts are not included in this analysis * Designates significance at the .05 level..1
Designates an interaction with the low income, high test Designates significance at the .10 level.2 #
score sample. ** Designates significance at the .01 level.
Academic Preparation and Course-Taking Results: In terms of academic preparation, an
extra point on the standardized test increases the likelihood of attending PSE by 3 percentage
MATHTECH, INC.
When we say that a particular characteristic increases the likelihood of attending PSE we mean that the17
characteristic is associated with an increased likelihood of attending PSE. Causality cannot be inferred because ofpossible selection effects.
SECTION V. FACTORS RELATED TO PSE ATTENDANCE 41
points (where the mean test score is 50 and the standard deviation is 10), taking college17
preparatory classes increases the likelihood of PSE attendance by 45 percent, and being in a
college preparatory program increases the likelihood of PSE attendance by 100 percent.
There also appears to be a difference in PSE attendance between public and private school
attendees. Individuals who attend Catholic school are 66 percent more likely to attend PSE than
those who attend public school, and respondents who attend other private schools are 113 percent
more likely to attend PSE than those who attend public school. These results, in themselves, are
not an argument that private schools are of superior quality to public schools. While we do
observe correlations between private schools and PSE attendance, unobserved variables
correlated with private school attendance may bias these results. For example, individuals whose
parents are more concerned and involved in their children’s education may choose to send their
children to private school if they do not believe that the public schools are of high enough quality.
Therefore, children whose parents value education may be more likely to go to private school.
But parental concern about education is probably correlated with PSE attendance, and this may be
the result that is measured by the private school variables. Because all of the possible
confounding variables are not available to be used as controls in the model, it is not possible to
determine the cause of increased PSE attendance without a controlled experiment.
Expectations and Behavioral Results: Expecting to receive a bachelor’s degree increases
the likelihood of attending PSE by 260 percent. Behavior also has the expected relationship to
PSE attendance. Respondents with children are less likely to attend PSE. Use of marijuana more
than two times in the past year decreases the likelihood of attending PSE by nearly 40 percent.
However, hours spent watching television and hours spent doing homework are not significantly
related to PSE attendance for the group as a whole.

MATHTECH, INC.
SECTION V. FACTORS RELATED TO PSE ATTENDANCE 42
C2. What Factors Are Especially Important for Low Income, High Test Score Students?
To determine the effects of these factors on just the low income, high test score group, we
can examine the magnitude and significance of interactions between these variables and the low
income, high test score sample. The data in Table 13 show that watching television, doing an
extra hour of homework, and living in an urban area are all statistically significant for the low
income, high test score group, but not for the overall group of students. Watching an extra hour
of television per evening decreases the likelihood of attending PSE by 15 percent for the low
income, high test score sample, and doing an extra hour of homework increases the likelihood of
attending PSE by 27 percent for the low income, high test score sample. Low income, high test
score respondents who live in urban areas are 56 percent less likely to attend PSE than those who
live in rural areas. Differences for low income, high test score students who attend Catholic
schools are even larger than for the sample as a whole.
D. USING A MULTIVARIATE FRAMEWORK, WHAT FACTORS ARE RELATEDTO THE TYPE OF PSE ATTENDED?
Next we increase the choices to separately model five distinct PSE attendance choices.
Table 14 separately examines the probability of attending a 4-year public, 4-year private, less than
4-year public, and less than 4-year private institution. Here, the dependent variable is an indicator
for whether the respondent attended no PSE or one of the four types of institutions listed above.
Because this model requires a multinomial logit, survey corrected results are not available.
However, results are weighted.
Women are more likely than men to attend all four types of schools, but the largest
difference is seen in the less than 4-year private schools. Women are 150 percent more likely to
attend less than 4-year private schools than are men. Women in the low income, high test score
sample are much more likely than men to attend 4-year public institutions. Blacks are more likely
than Whites to attend 4-year private institutions. Respondents whose parents received a
bachelor’s degree or higher are most likely to attend a 4-year private institution.

MATHTECH, INC.
SECTION V. FACTORS RELATED TO PSE ATTENDANCE 43
Higher test scores, taking college preparatory courses, being in a college preparatory
program, and expecting a bachelor’s degree or higher are associated with increased attendance at
all four types of schools, but increase the likelihood of attending a 4-year private institution by the
largest amount. Attending a Catholic school is associated with increased attendance at all types
of schools except less than 4-year private, and attending another type of private high school is
correlated with attending a 4-year private or less than 4-year public institution.
Table 14
MULTINOMIAL LOGIT: TYPE OF POSTSECONDARY INSTITUTION ATTENDED1
Variable
Odds Ratio(T-statistic)
4-Year public 4-Year private < 4-Year public < 4-Year private
Female 1.34** 1.72** 1.42** 2.48**(3.66) (5.67) (5.04) (7.01)
Female* low income, high test score sample 2.05* 1.39 1.44 1.262
(2.55) (1.00) (1.32) (0.45)
Asian 1.02 0.98 1.02 1.56(0.08) (-0.09) (0.08) (1.32)
Hispanic 1.08 1.10 0.96 1.52*(0.56) (0.53) (-0.34) (2.04)
Black 1.32* 1.69** 0.74* 1.47(2.13) (3.16) (-2.56) (1.87)
#
Native American 0.97 0.61 0.82 0.00(-0.08) (-0.85) (-0.62) (0.00)
Married 0.98 0.43 0.72 1.49(-0.06) (-0.99) (-1.17) (1.08)
Children 0.21** 0.34* 0.57** 0.79(-4.84) (-2.41) (-3.38) (-0.92)
Parents received bachelor’s 2.38** 3.27** 1.37** 1.77**(8.51) (10.02) (3.28) (3.51)
Parents received Bachelor’s* low income, high test 1.50 2.04 2.17 3.74*score sample (0.90) (1.52) (1.74) (2.14)
#
Low income, high test score group 0.93 1.84 1.79 2.79(-0.13) (0.88) (1.05) (0.99)
Lowest income group 0.77* 0.68* 0.63** 0.81(-2.50) (-2.55) (-5.64) (-1.38)
Highest income group 1.60** 1.67** 1.28* 1.24(4.30) (4.11) (2.45) (1.19)
Family size 0.96 1.01 0.96 1.01(-1.45) (0.21 (-1.52) (0.29)
Family size* low Income, high test score sample 0.89 0.89 0.87 0.69*(-1.36) (-1.19) (-1.67) (-1.91)
Test score 1.06** 1.08** 1.01 1.02**(10.02) (10.39) (1.87) (2.73)
#

MATHTECH, INC.
Variable
Odds Ratio(T-statistic)
4-Year public 4-Year private < 4-Year public < 4-Year private
SECTION V. FACTORS RELATED TO PSE ATTENDANCE 44
College preparatory courses 1.81** 1.82** 1.32** 1.18*(14.08) (12.14) (7.41) (2.54)
College courses missing 3.03** 2.63** 1.01 0.67(7.33) (4.90) (0.07) (-1.66)
#
College preparatory program 2.41** 2.45** 1.70** 1.52**(10.09) (8.52) (6.48) (2.83)
Expect bachelor’s degree 9.13** 9.42** 2.81** 0.83(21.43) (13.92) (14.10) (-1.36)
Alcohol > twice past year 1.08 0.79* 1.05 1.01(0.95) (-2.42) (0.69) (0.08)
Alcohol missing 1.53* 1.46 0.91 1.19(2.23) (1.62) (-0.59) (0.59)
Marijuana > twice past year 0.60** 0.44** 0.70** 0.55**(-3.76) (-4.48) (-3.07) (-2.63)
Marijuana missing 0.68** 0.60** 1.09 0.89(-2.79) (-2.82) (0.74) (-0.54)
Hours of TV weekdays 0.95 0.92* 0.99 0.99#
(-1.75) (-2.25) (-0.56) (-0.19)
TV* low income, high test score sample 0.81 0.76* 0.83 0.80#
(-1.91) (-2.09) (-1.69) (-1.40)
Hours of homework 1.03 1.05 1.00 0.97(1.29) (1.88) (-0.10) (-0.73)
#
Homework* low income, high test score sample 1.27** 1.26** 1.20* 1.33**(2.97) (2.65) (2.35) (2.04)
Urban area school 0.80 0.83 1.07 1.32#
(-1.94) (-1.30) (0.71) (1.48)
Urban* low income, high test score sample 0.49* 0.38* 0.33** 1.06(-2.24) (-2.56) (-3.48) (0.12)
Suburban area school 0.77** 0.79* 1.20* 1.70**(-2.88) (-2.16) (2.33) (3.67)
Northeast 1.65** 3.91** 0.65** 1.62*(3.88) (9.23) (-3.74) (2.44)
Midwest 1.74** 1.77** 0.78* 1.38(4.73) (3.97) (-2.51) (1.76)
#
South 1.48** 1.13 0.86 0.94(3.51) (0.88) (-1.66) (-0.36)
#
Catholic school 1.55* 2.65** 1.55* 1.16(2.18) (4.49) (2.26) (0.42)
Catholic school* low income, high test score sample 8.80 4.81 2.11 0.00#
(1.94) (1.34) (0.59) (0.00)
Private school 1.38 4.50** 2.18** 1.63(1.12) (5.18) (2.87) (0.99)
Private school* low income, high test score sample 0.12 0.13 0.15 0.00(-1.58) (-1.65) (-1.38) (0.00)
Dropouts are not included in this analysis * Designates significance at the .05 level..1
Designates an interaction with the low income, high test Designates significance at the .10 level.2 #
score sample. ** Designates significance at the .01 level.

MATHTECH, INC.
SECTION V. FACTORS RELATED TO PSE ATTENDANCE 45
E. A SUMMING UP AND SYNTHESIS OF THE FINDINGS FROM THIS SECTION
Both the descriptive findings and the multivariate model results point to the importance of
four general factors in determining PSE attendance: academic preparation, course-taking
behavior, educational expectations, and behavioral variables. However, even holding all of these
factors constant, income effects remain. For example, even within the entire group of students in
a rigorous academic high school program, or within the entire group of students taking advanced
math or science courses in high school, low income students are still less likely to attend PSE than
their higher income counterparts. However, differences among income groups drop significantly
when we control for academic preparation or test score.
The importance of income effects on PSE attendance, controlling for other characteristics,
is also illustrated in the logit model. In the multivariate regression model — which controls for
academic preparation, course-taking behavior, educational expectations, and behavioral variables
— income still has a statistically significant effect on PSE attendance. Those in the highest
income group are 43 percent more likely to attend PSE and those in the lowest income group are
32 percent less likely to attend PSE, relative to the middle income group. This suggests that
financial constraints to college may be more binding for the low income students.
These findings also illustrate the importance of early intervention on PSE attendance.
Students form their educational expectations early, and courses taken early on in high school and
junior high (or middle school) are closely related to PSE attendance. This indicates that by the
end of high school it may be too late to attempt to inform students of the importance of a college
education. Rather, information on the importance of college and the requirements for college
admission should be distributed to students and their parents as early as possible in the educational
system. Additional research should be done in this area. One possible topic that could be
explored further in the NELS:88 database is factors related to the determination and the evolution
of educational expectations from the eighth grade through the 12th grade.

MATHTECH, INC.
SECTION VI. THE ROLE OF FINANCIAL AID 46
VI. THE ROLE OF FINANCIAL AID
This section discusses the role of financial aid in PSE attendance. We discuss parents’ and
students’ attitudes toward financial aid and college expenses, use of available resources to obtain
information about financial aid, and reasons students do not apply for financial aid. We then
examine the effect of being offered financial aid on PSE attendance in a multivariate framework.
Lastly, we predict expected financial aid for all students using the NPSAS data set, and examine
the effect of predicted financial aid on PSE attendance.
A. HOW DO PARENTS PERCEIVE COLLEGE EXPENSES AND FINANCIALAID?
Parental views on financial aid and their ability to afford a college education are likely to
have a large effect on students’ expectations about their education and, ultimately, their PSE
attendance. Table 15 examines parental attitudes toward college expenses and financial aid when
their children are in eighth grade. Of the parents, 17 percent say they are not willing to go into
debt for their child’s schooling, and 13 percent say there is too much paperwork required to apply
for financial aid. Nearly one-quarter of the parents say they have not been able to get much
information about financial aid. Over 11 percent of the parents say they do not believe they will
be able to get enough money to allow their child to go to college.
The percentage of parents with these opinions declines, in general, as income and test
score increase. Of parents with children in the top test score, bottom income group, 25 percent
say they have not been able to get much information on how to apply for financial aid, while 21
percent of those in the top test score, middle income group and 14 percent of those in the top test
score, top income group said this was true. Interestingly, among low income students, the
percentage of parents indicating they did not see any way of getting enough money for college
declined substantially as test scores increased. Within the bottom income group, 28 percent of the
low test score group parents said they did not see any way of getting enough money for college,

MATHTECH, INC.
As expected, bottom income group students and parents are most likely to view college expenses and18
financial aid as an important element in their choice of college. Whereas 26 percent of top income group parents viewfinancial aid as very important, 57 percent of middle income group parents view financial aid as very important, and 80percent of bottom income group parents view financial aid as very important in choosing a college.
SECTION VI. THE ROLE OF FINANCIAL AID 47
but only 20 percent of those in the middle test score group and only 12 percent of those in the top
test score group said this was true.18
Table 15
PARENTAL ATTITUDES TOWARD COLLEGE EXPENSES AND FINANCIAL AID:PERCENTAGE OF PARENTS ANSWERING TRUE1
Fullsample
Bottom Family Income Middle Family Income Top Family Income
Bottom Middle Top Bottom Middle Top Bottom Middle Top test test test test test test test test test
score score score score score score score score score
The family is not 16.5 19.4 16.8 15.3 13.5 15.8 16.5 13.6 18.4 16.5willing to go into debtfor schooling
Too much paperwork is 13.0 15.1 13.0 10.2 15.6 11.8 11.4 13.7 13.9 12.9required to apply forfinancial aid
I have not been able to 23.8 32.2 29.8 25.4 25.7 25.9 20.6 18.6 15.9 14.2get much informationon how and where toapply for financial aid
I do not see any way of 11.4 28.0 19.8 12.4 9.8 9.1 5.7 2.2 7.1 2.8getting enough moneyfor my eighth grader togo to college
Note: questions are asked of parents in 1988 when their child is in the eighth grade. Dropouts are included in this analysis.1
Next we analyze the relationship between these attitudes and PSE attendance. For certain
income and test score groups these parental attitudes appear to be somewhat related to PSE
attendance. As indicated in Table 16, for both the bottom and top income groups, middle test
score students whose parents say they are not willing to go into debt for college are less likely to
attend PSE than those who have parents who do not indicate they are debt averse. Table 16

MATHTECH, INC.
SECTION VI. THE ROLE OF FINANCIAL AID 48
shows that while 46 percent of those in the bottom income, middle test group who say they are not willing to go into debt for college
expenses, have children who attend PSE, 55 percent of those parents who
Table 16
PARENTAL ATTITUDES TOWARD COLLEGE EXPENSES AND FINANCIAL AIDAND PSE ATTENDANCE:
PERCENTAGE IN EACH CATEGORY ATTENDING PSE1
Bottom Family Income Middle Family Income Top Family Income
Bottom test Middle test Top test Bottom test Middle test Top test Bottom test Middle test Top testscore score score score score score score score score
True NT True NT True NT True NT True NT True NT True NT True NT True NT2
Family not 34.1 32.2 45.9 54.8 73.9 77.1 51.5 51.5 68.3 70.2 88.1 86.9 68.5 70.2 68.9 86.1 95.9 95.6willing to gointo debt forschooling3
Too much 30.0 33.6 66.5 51.6 63.0 78.3 66.1 48.2 60.6 71.0 86.8 87.1 73.9 69.8 84.2 82.5 93.6 96.0paperwork toapply forfinancial aid
I have not been 31.7 33.9 55.8 52.5 78.8 76.1 42.8 54.1 65.4 71.1 86.0 87.4 75.1 69.1 81.3 82.9 93.9 95.9able to getmuchinformation on financial aid
I do not see 27.1 35.2 43.1 55.8 76.7 76.9 46.1 51.5 59.7 70.6 83.1 87.3 *** 70.5 *** 86.2 *** 95.7any way ofgetting enoughmoney forcollege
Dropouts are included in this analysis.1
NT denotes false or “haven’t thought about.”2

MATHTECH, INC.
SECTION VI. THE ROLE OF FINANCIAL AID 49
An example of how to read this table is that 34 percent of bottom income, bottom test score students whose parents say the family is not willing to go into debt for3
college attend PSE, and 32 percent of students whose parents say the statement is false or that they have not thought about it attend PSE.***Observations in these cells are too few to draw inferences from.

MATHTECH, INC.
Those students who answer “no” to the question, “Do you plan to continue your education past high school19
some time in the future?” are not asked questions about reading information or speaking with someone about financialaid. Those parents who answer “no” to the question, “Does your teenager plan to continue his/her education?” are notasked these questions either. Students and parents are both surveyed when the student is in the 12th grade as to whetherthey used these information sources.
SECTION VI. THE ROLE OF FINANCIAL AID 50
say that this is false or that they have not thought about it have children who attend PSE. Of
parents in the top income, middle test score group who say they are not willing to go into debt, 69
percent have children who attend PSE and 86 percent of parents who do not answer “true” to this
question have children who attend PSE. The fact that parents who are debt-averse have children
who are less likely to attend PSE is potentially important, because a large part of college costs are
financed through loans.
Students in the bottom income, bottom and middle test score group whose parents say
they do not see any way of getting enough money for college are less likely to attend PSE than
those who say this is not true or that they have not thought about it. While 27 percent of bottom
income, bottom test score group students whose parents say they do not see any way of getting
enough money for college attend PSE, 35 percent whose parents say this is false or have not
thought about it attend PSE. Similarly, while 43 percent of bottom income, middle test score
students whose parents say they do not see any way of getting enough money for college attend
PSE, 56 percent of those who say this is false or have not thought about it attend PSE.
B. HOW MUCH INFORMATION DO PARENTS ATTEMPT TO OBTAIN ABOUTFINANCIAL AID?
Students and their parents can learn about financial aid by several avenues. These include
talking to teachers, counselors, school representatives, or loan officers, and reading information
from the U.S. Department of Education, from high schools or colleges, or from the military.
Table 17 examines the extent to which students and their parents, among those planning to attend
college in the 12th grade, take advantage of such resources and how their use varies by family
income. We find that middle income parents and bottom and middle income students are most19
likely to use these resources. While 55 percent of bottom income parents spoke to someone
about financial aid, 67 percent of middle income parents spoke to someone, and 62 percent of top

MATHTECH, INC.
SECTION VI. THE ROLE OF FINANCIAL AID 51
income parents spoke to someone. While 59 percent of students in the bottom income group read
information about financial aid, 58 percent of the students in the middle income group read
information about financial aid, and 50 percent of students in the top income group read
information about financial aid.
Table 17
KNOWLEDGE ABOUT FINANCIAL AID BY FAMILY INCOME1
Full sample
Family Income
Bottom Middle Top
Talked to teacher, counselor, school Student 74.8 77.3 78.0 66.8representative, loan officer, or knowledgeableadult about financial aid
2
Parent 61.6 54.8 67.2 61.7
Read information from U.S. Department of Student 56.5 59.4 58.3 49.7Education, from school or college, or frommilitary about financial aid Parent 61.2 54.4 66.2 62.2
Dropouts are included in the parent information.1
An example of how to read this table is that 75 percent of all students spoke to someone about financial aid, 772
percent of low income students spoke to someone about financial aid, 78 percent of middle income students spoke tosomeone about financial aid, and 67 percent of high income students spoke to someone about financial aid.
Next we examine use of these resources by test score. Table 18 shows that among those
planning to attend PSE in the 12th grade, students in the top test score group and parents with
children in the top test score group are most likely to take advantage of these resources. While
79 percent of students in the top test score group spoke to someone about financial aid, 70
percent of students in the bottom test score group spoke to someone. While 73 percent of
parents in the top test score group read information about financial aid, 47 percent of parents in
the bottom test score group read information.

MATHTECH, INC.
SECTION VI. THE ROLE OF FINANCIAL AID 52
Table 18
KNOWLEDGE ABOUT FINANCIAL AID BY TEST SCORE1
Full sampleTest Score
Bottom Middle Top
Talked to teacher, counselor, school Student 74.8 69.9 73.3 79.3representative, loan officer, or knowledgeableadult about financial aid
2
Parent 61.6 49.2 60.4 72.2
Read information from U.S. Department of Student 56.5 50.6 53.6 62.8Education, from school or college, or frommilitary about financial aid Parent 61.2 47.2 60.0 73.0
Dropouts are included in the parent information.1
An example of how to read this table is that 75 percent of all students spoke to someone about financial aid, 702
percent of low test score students spoke to someone about financial aid, 73 percent of middle test score students spoketo someone about financial aid, and 79 percent of high test score students spoke to someone about financial aid.
Next we examine the relationship between use of these resources and applications for
financial aid. Individuals who learn more about financial aid are expected to be more likely to
apply for financial aid. Table 19 shows that, in some cases, the use of these resources has a
strong relationship to knowledge about financial aid. Parents who planned on their child
attending college in the 12th grade and who read information about financial aid are more likely to
say that their child did not apply because too much paperwork was required. Parents who read
information are less likely to say that they did not apply for financial aid because they had not
been able to get much information. While 24 percent of parents who do not read information give
this as a reason why their child did not apply for financial aid, only 15 percent who do read
information give this reason. Parents who read information or speak to someone about financial
aid are also less likely to say their child did not apply because they did not know how. While 26
percent of parents who did not read information say they did not apply because they did not know
how, only 13 percent of parents who did read information give this reason. All of these results
may be because the available material was useful, or because the people who read the materials
are more likely to understand and participate in the financial aid application process.
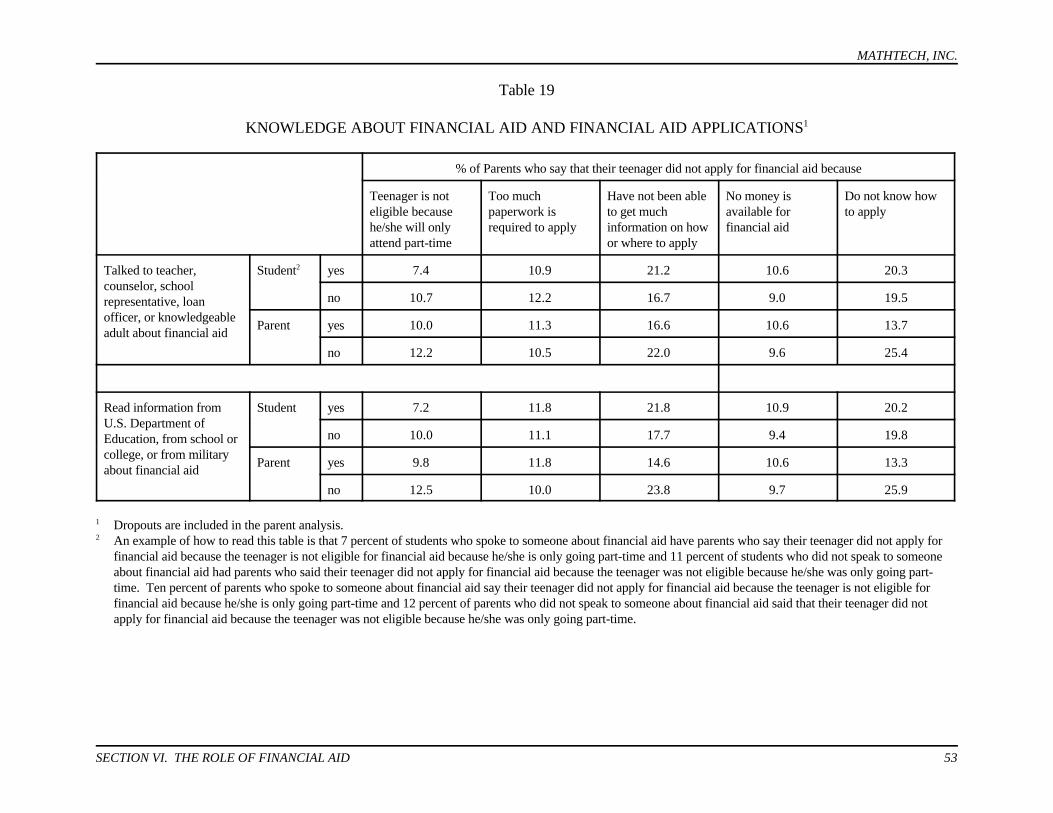
MATHTECH, INC.
SECTION VI. THE ROLE OF FINANCIAL AID 53
Table 19
KNOWLEDGE ABOUT FINANCIAL AID AND FINANCIAL AID APPLICATIONS1
% of Parents who say that their teenager did not apply for financial aid because
Teenager is not Too much Have not been able No money is Do not know howeligible because paperwork is to get much available for to applyhe/she will only required to apply information on how financial aidattend part-time or where to apply
Talked to teacher, Student yes 7.4 10.9 21.2 10.6 20.3counselor, schoolrepresentative, loanofficer, or knowledgeableadult about financial aid
2
no 10.7 12.2 16.7 9.0 19.5
Parent yes 10.0 11.3 16.6 10.6 13.7
no 12.2 10.5 22.0 9.6 25.4
Read information from Student yes 7.2 11.8 21.8 10.9 20.2U.S. Department ofEducation, from school orcollege, or from militaryabout financial aid
no 10.0 11.1 17.7 9.4 19.8
Parent yes 9.8 11.8 14.6 10.6 13.3
no 12.5 10.0 23.8 9.7 25.9
Dropouts are included in the parent analysis.1
An example of how to read this table is that 7 percent of students who spoke to someone about financial aid have parents who say their teenager did not apply for2
financial aid because the teenager is not eligible for financial aid because he/she is only going part-time and 11 percent of students who did not speak to someoneabout financial aid had parents who said their teenager did not apply for financial aid because the teenager was not eligible because he/she was only going part-time. Ten percent of parents who spoke to someone about financial aid say their teenager did not apply for financial aid because the teenager is not eligible forfinancial aid because he/she is only going part-time and 12 percent of parents who did not speak to someone about financial aid said that their teenager did notapply for financial aid because the teenager was not eligible because he/she was only going part-time.

MATHTECH, INC.
SECTION VI. THE ROLE OF FINANCIAL AID 54
The relationship between the use of these resources and PSE attendance is shown in Table
20. Students who planned to attend college in the 12th grade and who talked or read about
financial aid, or have parents who did so, are more likely to attend PSE than those who do not.
This is probably largely due to the fact that individuals who do so are more interested in attending
PSE. While 79 percent of students who speak to someone about financial aid attend PSE, only 60
percent of students who do not speak to someone about financial aid attend PSE. While 80
percent of students whose parents speak to someone about financial aid attend PSE, only 54
percent of students whose parents do not speak to someone about financial aid attend PSE.
Table 20
KNOWLEDGE ABOUT FINANCIAL AIDAND THE DECISION TO ATTEND POSTSECONDARY EDUCATION1
Percent Attending PSE
Talked to teacher, counselor, school Student yes 78.6representative, loan officer, orknowledgeable adult about financialaid
2
no 59.7
Parent yes 80.4
no 54.3
Read information from U.S. Student yes 79.4Department of Education, fromschool or college, or from militaryabout financial aid
no 66.7
Parent yes 79.9
no 55.6
Dropouts are included in the parent analysis.1
An example of how to read this table is that 79 percent of students who spoke to someone about financial aid2
attended PSE and 60 percent of students who did not speak to someone about financial aid attended PSE.
Table 21 examines this relationship for low income, high test score students. The
difference among these students is even larger, probably because these students are more likely to
need financial aid. While 84 percent of these low income, high test score students who planned to
attend college in the 12th grade and who spoke to someone about financial aid attend PSE, only
53 percent of these students who did not speak to someone about financial aid attend PSE. While
88 percent of low income, high test score students whose parents spoke to someone about

MATHTECH, INC.
SECTION VI. THE ROLE OF FINANCIAL AID 55
financial aid attend PSE, only 61 percent of these students whose parents did not speak to
someone about financial aid attend PSE.
Table 21
KNOWLEDGE ABOUT FINANCIAL AIDAND THE DECISION TO ATTEND POSTSECONDARY EDUCATION:
BY LOW INCOME, HIGH TEST SCORE RESPONDENTS1
% Attending PSE
Talked to teacher, counselor, school Student yes 84.0representative, loan officer, orknowledgeable adult about financialaid
2
no 52.9
Parent yes 88.0
no 60.7
Read information from U.S. Student yes 84.3Department of Education, fromschool or college, or from militaryabout financial aid
no 67.8
Parent yes 86.4
no 64.7
Dropouts are included in the parent analysis.1
An example of how to read this table is that 84 percent of low income, high test score students who spoke to some-2
one about financial aid attended PSE and 53 percent who did not speak to someone about financial aid attended PSE.
C. WHY DO SOME STUDENTS FAIL TO APPLY FOR FINANCIAL AID?
While we may expect some students in the top income group not to apply for financial aid,
we also find that many low income students do not apply for financial aid. We next examine
reasons why students who plan to continue their education do not apply for financial aid, as
reported by parents when students are in the 12th grade. Table 22 shows that the reason those in
the top income group are most likely to give for not applying for financial aid is that they did not
need it. The reason individuals in the bottom income, low and middle test score groups are most
likely to give is that the teenager’s grades were not high enough to qualify for a loan or scholar-
ship. The reason those in the bottom income, top test score group are most likely to give is that

MATHTECH, INC.
SECTION VI. THE ROLE OF FINANCIAL AID 56
Table 22
WHY STUDENTS HAVE NOT APPLIED FOR FINANCIAL AID, AS REPORTED BY PARENTS:BY INCOME AND TEST SCORE1
Bottom Family Income Middle Family Income Top Family Income
Bottom Middle Top test Bottom Middle test Top test Bottom Middle Top testtest score test score score test score score score test score test score score
Family and teenager can pay without 11.5 15.2 21.8 29.6 38.8 41.6 65.9 64.1 80.8assistance
Teenager’s grades are not high 28.3 31.5 18.7 38.8 32.0 18.9 33.7 39.1 17.5enough to qualify for a loan orscholarship
Neither we nor our teenager wishes 14.3 12.2 18.1 12.6 9.4 9.7 14.9 14.0 10.4to report our financial information
Our teenager is not eligible because 17.9 13.7 8.4 14.7 9.1 7.2 14.7 11.0 2.6he/she will only attend part-time
Too much paperwork is required to 9.4 7.9 11.5 9.2 11.0 14.1 12.4 9.8 13.3apply for financial aid
Have not been able to get much 25.7 22.7 24.0 19.7 21.7 19.7 16.6 13.4 10.8information on how or where toapply for financial aid
No money is available for financial 15.2 12.2 9.0 6.8 9.3 8.0 7.9 8.5 9.8aid
Other relatives will help pay for my 5.6 9.8 10.6 5.8 6.4 9.3 5.6 9.5 6.0teen’s college expenses
We missed the deadline for 9.5 16.1 15.5 10.2 10.9 14.9 6.2 7.3 5.1application
I do not know how to apply 24.6 29.0 25.3 19.5 23.6 17.9 19.9 14.9 8.7
Dropouts are included in this analysis.1

MATHTECH, INC.
Twelve percent of low income students are not awarded financial aid at private 4-year institutions, and 2020
percent of low income students are not awarded financial aid at public 4-year institutions.
SECTION VI. THE ROLE OF FINANCIAL AID 57
they did not know how to apply. Of low income, high test score parents, 25 percent say that they
did not apply because they did not know how, and 24 percent say that they did not apply because
they had not been able to get much information on how to apply for financial aid. This compares
to 18 percent of the middle income, high test score parents and 9 percent of the high income, high
test score parents who say that they did not know how to apply, 20 percent of the middle income,
high test score parents, and 11 percent of the high income, high test score parents who said that
they had not been able to get enough information.
D. IS FINANCIAL AID AVAILABILITY A CRITICAL FACTOR FORDETERMINING PSE ATTENDANCE?
D1. Use of Data Available in NELS
Next we explore the effect of financial aid availability on PSE attendance. Because of data
limitations, we first explore the effect of being awarded financial aid for only those respondents
who apply to PSE, are accepted, and apply for financial aid at private 4-year or public 4-year
institutions. Twenty-five percent of those who apply to private 4-year institutions, are accepted,
and apply for financial aid are not awarded financial aid, and 35 percent of those who apply to
public 4-year institutions, are accepted, and apply for financial aid are not awarded financial aid. 20
If students who are not awarded financial aid are less likely to attend PSE, this may provide some
indication of the effect of financial aid on PSE attendance.
There are many problems with this type of analysis, however. First, this analysis does not
begin to explore the effect of finances and student aid on the initial decision to apply to college.
This is a potential problem because individuals who do not believe they can afford PSE may not
even apply. This analysis only addresses the small group of students who apply to PSE, are
accepted, and apply for financial aid, but do not attend any PSE or do not attend the type of PSE
where they were not offered financial aid. In addition, it is not clear why these students,
especially the low income students, do not receive financial aid. One possible explanation is that

MATHTECH, INC.
SECTION VI. THE ROLE OF FINANCIAL AID 58
the students did not pursue the financial aid application process to completion. In that case,
students who did not attend PSE would be those who did not receive financial aid, because of
lack of interest and incomplete applications, rather than because they were denied financial aid.
Another potential problem with this method of analysis is that many colleges award some financial
aid based on ability as well as on need. Therefore, those students who are awarded more financial
aid may be those of higher ability who are more likely to go to college anyway. However, since
we can control for ability with test scores in the multivariate model, this may not be a significant
problem. Also, schools may use ability more to decide how much aid to give a student, relative to
his or her need, rather than whether or not to give aid at all. If that is the case, then we would
expect the bias caused by this problem to be less significant, because we are only modeling the
effect of whether or not any financial aid was awarded on PSE attendance, rather than the effect
of different amounts of financial aid on PSE attendance.
We begin with a univariate analysis of financial aid awards and PSE attendance. Table
23A examines the relationship between being offered aid at private 4-year institutions and
attending PSE for students who apply to private 4-year institutions, are accepted, and apply for
financial aid at these types of schools. We find that students who are offered financial aid at
private 4-year institutions are more likely to attend private 4-year institutions than are respondents
who apply, are accepted, and apply for aid, but are not offered aid at private 4-year institutions.
While 72 percent of those who are offered aid at private 4-year institutions attend private 4-year
institutions, 61 percent of those who are not offered aid at private 4-year institutions attend this
type of PSE. Respondents who are not offered aid at private 4-year institutions are more likely to
attend public 4-year institutions than those who are offered aid at private 4-year institutions.
While 15 percent of those who are offered aid at private 4-year institutions attend public 4-year
institutions, 20 percent of those who are not offered aid at private 4-year institutions attend public
4-year institutions. However, we find that being offered financial aid at a private 4-year
institution does not appear to be related to the decision of whether to attend any type of PSE.
While 3 percent of those who are offered aid at a private 4-year institution do not attend PSE, 5
percent of those who are not offered aid at a private 4-year institution do not attend PSE.

MATHTECH, INC.
SECTION VI. THE ROLE OF FINANCIAL AID 59
Table 23A
PERCENTAGE ATTENDING PSEBY WHETHER OFFERED AID AT A PRIVATE 4-YEAR INSTITUTIONFOR THOSE WHO APPLY, ARE ACCEPTED, AND APPLY FOR AID
AT A PRIVATE 4-YEAR INSTITUTION1
Percent Attending PSE
Offered Financial Aid at Private 4-Year Not Offered Financial Aid at Private 4-Year
All AllIncome Group Income Group
Bottom Middle Top Bottom Middle Top
No PSE 3.3 3.3 3.9 2.5 5.4 * 8.2 2.8
Public 4-year 14.5 11.5 17.3 12.7 20.2 * 23.1 17.7
Private 4-year 71.6 72.1 67.4 77.4 60.9 * 55.4 70.1
Less than 4-year public 10.3 12.8 11.4 6.6 12.0 * 12.0 9.4
Less than 4-year private 0.3 0.3 0.0 0.9 1.5 1.4 0.0** Denotes too few observations.
Some dropouts are included in this analysis.1
Table 23B explores the same relationships for students who apply, are accepted, and apply
for financial aid at public 4-year institutions. We find similar differences between those offered
aid and those not offered aid as in private institutions. While 77 percent of those who are offered
aid at public 4-year institutions attend public 4-year institutions, 68 percent of those who are not
offered financial aid at public 4-year institutions attend public 4-year institutions. There are
interesting differences by income in the types of schools attended by students who do not receive
aid at public 4-year institutions. While low income respondents who are not offered financial aid
at public 4-year institutions are more likely not to attend any type of PSE, high income
respondents who are not offered aid at public 4-year institutions are more likely to attend less than
4-year public institutions. While 4 percent of bottom income students who are offered financial
aid at 4-year public institutions do not attend PSE, 13 percent of bottom income students who are
not offered financial aid at 4-year public institutions do not attend PSE. While 14 percent of top
income students who are not offered financial aid at public 4-year institutions attend less than 4-
year public institutions, 22 percent of top income students who are not offered financial aid at 4-
year public institutions attend less than 4-year public institutions.

MATHTECH, INC.
SECTION VI. THE ROLE OF FINANCIAL AID 60
Table 23B
PERCENTAGE ATTENDING PSEBY WHETHER OFFERED AID AT A PUBLIC 4-YEAR INSTITUTIONFOR THOSE WHO APPLY, ARE ACCEPTED, AND APPLY FOR AID
AT A PUBLIC 4-YEAR INSTITUTION1
Percent Attending PSE
Offered Financial Aid at Public 4-Year Not Offered Financial Aid at Public 4-Year
All AllIncome Group Income Group
Bottom Middle Top Bottom Middle Top
No PSE 3.5 4.2 3.2 1.6 6.5 13.1 5.7 4.6
Public 4-year 76.5 72.7 78.4 81.2 67.5 62.1 68.8 67.0
Private 4-year 3.3 2.5 4.3 2.3 3.6 0.6 3.2 6.0
Less than 4-year public 15.9 19.2 13.5 14.3 21.3 22.2 20.9 22.3
Less than 4-year private 0.9 1.4 0.7 0.6 1.1 2.0 1.5 0.2
Some dropouts are included in this analysis.1
We next incorporate a modeling framework to examine the effect of financial aid on PSE
attendance. In this model, we control for family income and ability (using test scores). We also
control for all of the other factors examined in our earlier analysis of the determinants of PSE
attendance. The independent variable of interest is an indicator of whether the student was
offered financial aid at a public or private 4-year institution. Table 24A shows that respondents
who are offered financial aid at a private 4-year institution are more likely to attend a private 4-
year institution than those who apply, are accepted, and apply for aid but are not offered aid at a
private 4-year institution. As a whole, those students who are offered financial aid at a private 4-
year institution are 80 percent more likely to attend a private 4-year institution. Table 24B
examines the same relationships at public 4-year institutions. We find similar results for this type
of institution. Respondents who are offered financial aid at a public 4-year institution are more
likely to attend a public 4-year institution than those who apply, are accepted, and apply for aid
but are not offered aid at a public 4-year institution. As a whole, students who are offered
financial aid at a public 4-year institution are 80 percent more likely to attend a public 4-year
institution. Middle income students are 125 percent more likely to attend a public 4-year
institution if they are offered financial aid at a public 4-year institution.
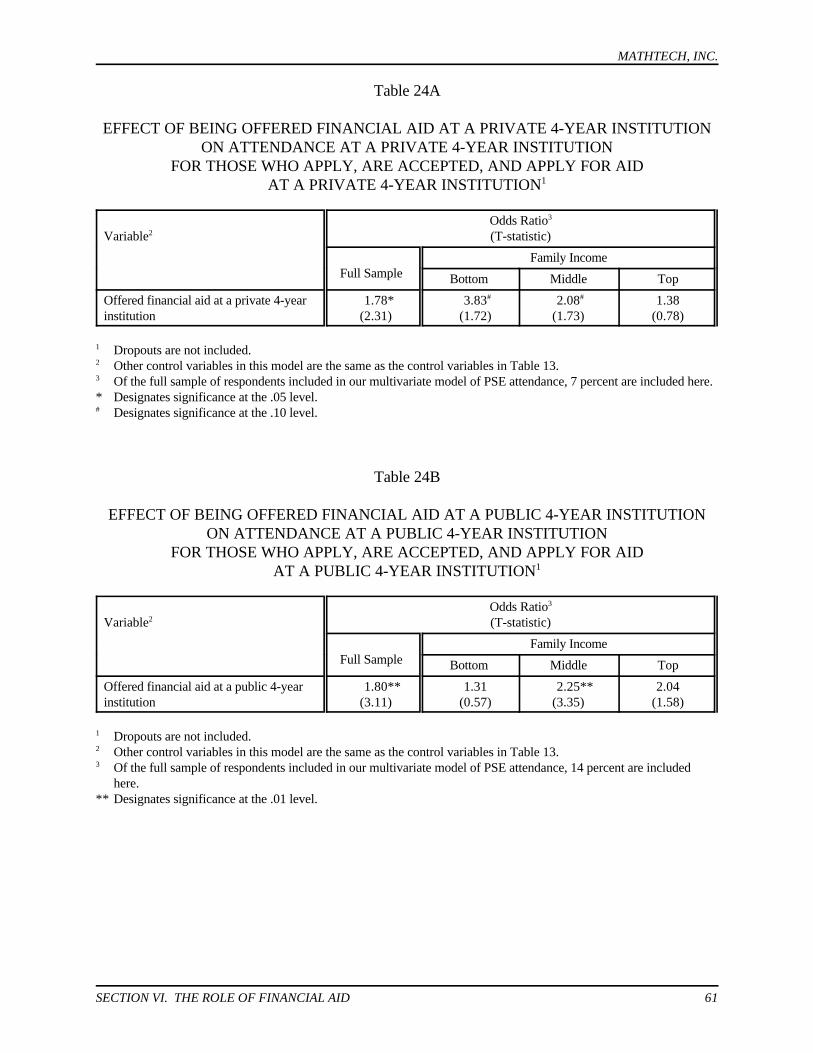
MATHTECH, INC.
SECTION VI. THE ROLE OF FINANCIAL AID 61
Table 24A
EFFECT OF BEING OFFERED FINANCIAL AID AT A PRIVATE 4-YEAR INSTITUTIONON ATTENDANCE AT A PRIVATE 4-YEAR INSTITUTION
FOR THOSE WHO APPLY, ARE ACCEPTED, AND APPLY FOR AIDAT A PRIVATE 4-YEAR INSTITUTION1
Variable (T-statistic)2Odds Ratio3
Full SampleFamily Income
Bottom Middle Top
Offered financial aid at a private 4-year 1.78* 3.83 2.08 1.38institution (2.31) (1.72) (1.73) (0.78)
# #
Dropouts are not included.1
Other control variables in this model are the same as the control variables in Table 13.2
Of the full sample of respondents included in our multivariate model of PSE attendance, 7 percent are included here.3
* Designates significance at the .05 level.Designates significance at the .10 level.#
Table 24B
EFFECT OF BEING OFFERED FINANCIAL AID AT A PUBLIC 4-YEAR INSTITUTIONON ATTENDANCE AT A PUBLIC 4-YEAR INSTITUTION
FOR THOSE WHO APPLY, ARE ACCEPTED, AND APPLY FOR AIDAT A PUBLIC 4-YEAR INSTITUTION1
Variable (T-statistic)2Odds Ratio3
Full SampleFamily Income
Bottom Middle Top
Offered financial aid at a public 4-year 1.80** 1.31 2.25** 2.04institution (3.11) (0.57) (3.35) (1.58)
Dropouts are not included.1
Other control variables in this model are the same as the control variables in Table 13.2
Of the full sample of respondents included in our multivariate model of PSE attendance, 14 percent are included3
here.** Designates significance at the .01 level.

MATHTECH, INC.
SECTION VI. THE ROLE OF FINANCIAL AID 62
D2. Use of NPSAS Data to Predict Financial Aid
Next we use predictions of financial aid from the 1993 NPSAS database to estimate the
effect of varying levels of financial aid on PSE attendance. This is necessary because the NELS
database contains information only on the total amount of financial aid received by those students
who actually attend PSE and whether or not certain types of financial aid were received. Thus,
NELS does not contain the amount of financial aid received by type of award, nor does NELS
contain the expected financial aid for those not attending PSE. Furthermore, using these
imputations we can analyze the effect that expected financial aid may have on PSE attendance for
all students. This is important because students’ expectations for educational attainment may be
affected early on by whether they expect to be eligible for financial aid. These expectations may
affect behavior much before the student is ready to attend PSE.
Unlike the analysis in D1 above, here we examine the effect of financial aid on PSE
attendance for all students, and we examine financial aid amounts rather than only whether
financial aid was awarded. This analysis also addresses the larger problem of the full group of
students who do not attend PSE, rather than just the 11 percent of students who apply, are
accepted, and do not receive financial aid.
Two different matching techniques were employed to predict financial aid for respondents
in the NELS sample. The first was regression analysis to predict financial aid, and the second was
a statistical matching procedure where respondents from NELS were matched with respondents
from NPSAS based on a number of characteristics.
a. Prediction of Financial Aid through Regression Analysis
The first method used to predict financial aid involves estimation of ordinary least squares
models using the NPSAS data. The resulting coefficients from these estimates were used to
calculate predicted financial aid for NELS respondents. Variables available in both datasets which
were used in the prediction were: gender, race, marital status, whether the students’ parents’
highest level of education was a bachelor’s degree or higher, state of residence, income level,

MATHTECH, INC.
SECTION VI. THE ROLE OF FINANCIAL AID 63
number of family members, whether the student expected to receive a bachelor’s degree or higher,
Catholic school attendance, and other type of private school attendance. All undergraduates
between the ages of 17 and 24 were included in the estimation. The only ability measures
included in NPSAS are SAT and ACT scores, and these scores are not available for a large
number of NELS and NPSAS respondents. Therefore, no ability measures were used in the
match.
Data from NPSAS were used to predict three variables: the total need-based aid received;
Pell grant amount received; and total federal grants received. These variables were chosen
because they were thought to be least likely to be correlated with ability. Total grant aid was not
predicted because it is correlated with ability. If financial aid measures that were correlated with
ability were employed, effects on financial aid may have been upwardly biased. Consequently,
these financial aid variables may have measured the effect of ability on PSE attendance, as well as
the effect of receipt of financial aid on PSE attendance.
Results from the first stage regression were used in a logit model to determine the effect
of financial aid on PSE attendance. In the many different specifications run, financial aid was not
found to have a significant effect on PSE attendance. These specifications included:
C Effect of the different types of financial aid on PSE attendance for the entiresample.
C Effect of the different types of financial aid on PSE attendance, separately for eachof the three income groups.
C Effect of the different types of financial aid on attendance at 4-year public schools.
C Effect of the different types of financial aid on attendance at 4-year privateschools.
There are several possible explanations for the lack of significant effects. The first, of course, is
that financial aid received does not really have an effect on the decision to attend PSE or to attend
a private school rather than a public school or a 4-year institution rather than a 2-year institution.
However, another plausible explanation is that the predicted financial aid amounts are not very
good predictions of financial aid received. These predictions may be the best that can be made,

MATHTECH, INC.
SECTION VI. THE ROLE OF FINANCIAL AID 64
given the available data. Evidence of the inadequacy of the predictions is the r-squared scores
from the first stage regressions. The r-squared tells us how well the financial aid has been
predicted on a scale from 0 to 1. These values range from 0.05 to 0.48, which means that over
half of the variation in financial aid was not explained by the included independent variables.
Additionally, a reason for a lack of significant results may be the entitlement nature of the financial
aid programs — students with similar financial characteristics receive similar amounts of financial
aid. Therefore, it may not be possible to find a control group that is similar except for the amount
of financial aid received. These results may also be pointing out the limitations of combining two
very different data sets.
b. Prediction of Financial Aid through Statistical Matching
Westat employed a statistical matching procedure to estimate different types of financial
aid received. This procedure involved matching NELS respondents with NPSAS respondents
with similar characteristics. All first-year full-time undergraduate students in the NPSAS sample
were included in the matching procedure. The sample was divided into dependent and
independent students. The NPSAS dataset divided the sample into these two groups, and in
NELS, individuals were considered independent if they were married or had children. Dependent
students were matched by age, region of family residence, family income, family size, and parents’
marital status. Independent students were matched only by age and region of residence.
Information on aid receipt was predicted separately for students attending public 4-year colleges,
private 4-year colleges, public less than 4-year colleges, and private less than 4-year colleges.
Each student in the NELS panel was separately matched to an NPSAS student attending each of
the four types of institutions.
The predicted financial aid variables were then used in logit models to determine the effect
of financial aid on PSE attendance. The predicted financial aid variables included Pell grants, total
institutional grants, total state grants, total federal grants, total financial aid, and total loans.
Logit models employed included:
C Effect of the different measures of financial aid on 4-year public or private PSEattendance as compared to no PSE or other types of PSE attendance.

MATHTECH, INC.
SECTION VI. THE ROLE OF FINANCIAL AID 65
C Effect of the different measures of financial aid on 4-year private PSE attendanceas compared to 4-year public PSE attendance.
C Effect of the different measures of financial aid on 4-year PSE attendance ascompared to 2-year PSE attendance.
C Effect of the different measures of financial aid on 2-year PSE attendance ascompared to no PSE attendance.
Results were estimated for the sample as a whole and for the three different income groups. In
virtually all of the models employed, financial aid was not found to have a significant effect on
PSE attendance. Again, either financial aid has no effect on PSE decisions, or the model’s
limitations, the entitlement nature of the financial aid programs, and the combining of two very
different data sets, are preventing accurate predictions of financial aid received.
E. A SUMMING UP AND SYNTHESIS OF THE FINDINGS FROM THIS SECTION
In this section we have found some evidence for the importance of financial aid
knowledge, information, and receipt on PSE attendance. The NELS data showed that nearly a
quarter of the parents reported that they had not been able to get enough information about
financial aid when their children were in the eighth grade, and that the percentage of the parents
who had not been able to get enough information declined as income increased. While complete
financial aid information is not necessary in the eighth grade, it may be important for parents to
realize that financial aid is available at this point so they believe they can afford to send their child
to PSE. In fact, there does appear to be some inverse relationship between negative attitudes by
parents toward college expenses and financial aid in the eighth grade and PSE attendance.
When deciding among institutions, both students and their parents view financial aid as
more important than college expenses. Low income group individuals are more likely to view
these factors as important in the choice of a college. Parents who have children in the higher test
score groups are less likely to view college expenses and financial aid as very important in
choosing a college.

MATHTECH, INC.
SECTION VI. THE ROLE OF FINANCIAL AID 66
Students in the lower and middle income groups and the higher test score groups are more
likely to attempt to obtain information about financial aid. The relationship between use of these
resources and knowledge about financial aid appears to be strong, and the relationship between
use of these resources and PSE attendance, even stronger. Those who do not use these resources
are less likely to attend PSE. This may be because students and parents who are more interested
in PSE are more likely to make the effort to obtain information about financial aid.
The most common reason parents give that low income students do not apply for financial
aid are because their grades are not high enough, they did not know how to apply, and they were
not able to obtain enough information. This suggests that more education about financial aid
should be provided in the schools to address these problems.
After controlling for income, test socre, and other personal characteristics, we found that
among students applying to PSE, those who are offered financial aid at public and private 4-year
institutions are more likely to attend these types of institutions than those who are not offered
financial aid. However, this analysis does not address the problem of individuals who do not
apply to PSE or who do not apply for financial aid. Individuals who do not believe they can
afford PSE may not apply, and individuals who do not believe financial aid is available may not
apply for financial aid. To examine the effect of the amount of financial aid received on PSE
attendance for the entire sample, we predicted financial aid with the NPSAS data set using two
different statistical methods. Predicted financial aid was not found to have a significant effect on
PSE attendance.

MATHTECH, INC.
APPENDIX 67
APPENDIX
VARIABLE DEFINITIONS
College Preparatory Courses: Used in the logit model, this is a count of the number of thefollowing courses that the student took: pre-calculus, calculus, biology, chemistry, physics, andforeign language. (Uses NELS variables F2RPRE_C, F2RCAL_C, F2RBIO_C, F2RCHE_C,F2RPHY_C, F2R16_C.)
College Preparatory Program: This variable is used in the logit model. Students are asked inthe second follow-up survey to describe their current high school program. If the studentdescribes the program as “college prep,” then this variable is equal to one. If the studentdescribes a different type of high school program, this variable is equal to zero. (Uses NELSvariables BYS49, F1S20, F2S12A.)
High School Program: This variable is used in table 7. The high school program is defined inthe following categories rigorous academic, academic, vocational, academic/vocational, or noneof the above. A rigorous academic high school program is defined as at least 4 units of English,at least 3 units of social studies, at least 3 units of science, at least 3 units of math, and at least .5units of computer science. An academic high school program is defined as a total of 12 units inenglish, social studies, science, and math. A vocational track is defined as at least 3 units in oneof several vocation subjects. An academic/vocational track is defined as meeting the requirementsfor both the academic and the vocational programs. (Uses NELS variable F2RTRPR6.)
Income Group: Family income level is defined using total family income, as provided by theparents in the base-year and second follow-up questionnaires. We divided the family incomelevels in the base and second follow-up years into bottom, middle, and top groups withapproximately one-third of the students in each category. Because the income was provided inlevels, rather than exact amounts, the groups could not be divided into exact thirds. In the baseyear, the weighted percents in the three groups were 38 percent in the bottom, 39 percents in themiddle, and 23 percent in the top. In the second follow-up, the weighted percents in the threegroups were 34 percent in the base group, 34 percent in the middle group, and 32 percent in thetop group. Because the income data is missing for many respondents, we use the base yearincome group when available, and when the base year income group is not available, we use thesecond follow-up income group. (Uses NELS variables BYP8O, F2P74.)
PSE Attendance: Postsecondary attendance is defined using the variable which documents thetype of the valid postsecondary institution with the latest initial enrollment date. Individuals whoare coded as a legitimate skip are defined as not attending PSE. Private schools less than 4 yearsare defined to include private for profit schools. (Uses NELS variable PSELASTY.)
Test Score Group: Multiple choice tests were administered to NELS respondents in readingcomprehension, mathematics, science, and history/citizenship/geography. While all studentsreceived the same set of tests in the base year, multiple forms of the math and reading tests wereadministered in the follow-up years. These tests were targeted to the students’ ability levels. Thetest score used in our analyses is the composite reading/math test score. We divided the base year

MATHTECH, INC.
APPENDIX 68
test scores into the bottom, middle, and top groups, with one-third of the students in eachcategory. If the base-year test score was not available, then the students were placed according tothe first follow-up test, and if both the base-year test and the first follow-up test were missing,then the students were placed according to their ranking in the second follow-up test. (UsesNELS variables BY2XCOMP, F12XCOMP, F22XCOMP.)

MATHTECH, INC.
BIBLIOGRAPHY 69
BIBLIOGRAPHY
Arenson, Karen W. “Aid Cuts Put College Beyond Reach of Poorest Students,” The New YorkTimes (January 27, 1997):B6.
Baumol, William J., and Blinder, Alan S. Economics, Principles and Policy, 7th edition, FortWorth: The Dryden Press, 1997.
Becker, Gary S. Human Capital: A Theoretical and Empirical Analysis with Special Referenceto Education. Chicago: University of Chicago Press, 1964.
Borus, Michael E., and Carpenter, Susan A. “Factors Associated with College Attendance ofHigh-School Seniors.” Economics of Education Review 3(3):169 (1984).
Clotfelter, Charles T. “Demand for Undergraduate Education.” In Economic Challenges inHigher Education, by Charles T. Clotfelter, Ronald G. Ehrenberg, Malcolm Getz, and JohnJ. Siegfried. Chicago: University of Chicago Press, 1991.
Geraghty, Mary. “Finances are Becoming More Crucial in Students’ College Choice, SurveyFinds.” The Chronicle of Higher Education (January 17, 1997):A4.
Gottschalk, Peter. “Inequality, Income Growth, and Mobility: The Basic Facts.” The Journal ofEconomic Perspectives (Spring 1997):21-40.
Hauser, Robert M. “Trends in College Entry among Whites, Blacks, and Hispanics.” In Studiesof Supply and Demand in Higher Education, Charles T. Clotfelter and Michael Rothschild,eds. Chicago: University of Chicago Press, 1993.
Hearn, James C. “Academic and Nonacademic Influences on the College Destinations of 1980High School Graduates.” Sociology of Education 64:158 (1991).
Hossler, Don, and Maple, Sue. “Being Undecided about Postsecondary Education.” Review ofHigher Education 16:285 (1993).
Hossler, Don, Braxton, John, and Coopersmith, Georgia. “Understanding Student CollegeChoice.” In Higher Education: Handbook of Theory and Research, vol. V, John C.Smart, ed. New York: Agathon Press, 1989.
Jackson, Gregory A. “Did College Choice Change during the Seventies?” Economics ofEducation Review 7(1):15 (1988).
Johnson, George E. “Changes in Earnings Inequality: The Role of Demand Shifts.” The Journalof Economic Perspectives (spring 1997):41-54.

MATHTECH, INC.
BIBLIOGRAPHY 70
Kane, Thomas J. “Rising Public College Tuition and College Entry: How Well do PublicSubsidies Promote Access to College?” NBER Working Paper no. 5164. Cambridge,Mass: National Bureau of Economic Research, 1995.
Kohn, Meir G., Manski, Charles F., and Mundel, David S. “An Empirical Investigation of Factorswhich Influence College-going Behavior.” Annals of Economic and Social Measurement5:391 (1976).
Leslie, Larry L., and Brinkman, Paul T. “Student Price Response in Higher Education.” Journalof Higher Education 58(2):181 (1987).
Manski, Charles F. “Adolescent Econometricians: How Do Youth Infer the Returns toSchooling?” In Studies of Supply and Demand in Higher Education, Charles Clotfelter andMichael Rothschild, eds., Chicago: National Bureau of Economic Research, 1993.
Manski, Charles F. “Income and Higher Education.” Focus 14(3):14 (1992).
Manski, Charles F., and Wise, David A. College Choice in America. Cambridge, Mass: HarvardUniversity Press, 1983.
McPherson, Michael S., and Schapiro, Morton Owen. “Does Student Aid Affect CollegeEnrollment? New Evidence on a Persistent Controversy.” American Economic Review81(1):309 (1991).
Mortenson, Thomas G., and Wu, Zhijun. “High School Graduation and College Participation ofYoung Adults by Family Income Backgrounds 1970 to 1989.” ACT Student Financial AidResearch Report Series. Iowa City, Iowa: ACT, 1990.
National Center for Education Statistics. Methodology Report. NCES 95-174, January 1996.
National Center for Education Statistics. Descriptive Summary Report, with an Essay on Accessand Choice in Postsecondary Education. NCES 96-175, May 1996.
National Center for Education Statistics. Access to Postsecondary Education for the 1992 HighSchool Graduates. NCES 98-105, October 1997.
National Center for Education Statistics. Confronting the Odds: Students at Risk and thePipeline to Higher Education. NCES 98-094, December 1997.
Orfield, Gary. “Money, Equity, and College Access.” Harvard Educational Review 62(3):337(1992).
Reyes, Suzanne. “The College Enrollment Decision: The Role of the Guaranteed Student Loan.” Unpublished paper, Harvard University, Cambridge, Mass, 1994.

MATHTECH, INC.
BIBLIOGRAPHY 71
Rouse, Cecilia Elena. “What to Do after High School: The Two-Year versus Four-Year CollegeEnrollment Decision.” In Choices and Consequences: Contemporary Policy Issues inEducation, Ronald G. Ehrenberg, ed. Ithaca, NY: ILR Press, 1994.
St. John, Edward P. “Price Response in Enrollment Decisions: An Analysis of the High Schooland Beyond Sophomore Cohort.” Research in Higher Education 31(2):161 (1990).
St. John, Edward P., and Noell, Jay. “The Effects of Student Financial Aid on Access to HigherEducation: An Analysis of Progress with Special Consideration of Minority Enrollment.” Research in Higher Education 30(6):563 (1989).
Savoca, Elizabeth. “Another Look at the Demand for Higher Education: Measuring the PriceSensitivity of the Decision to Apply to College.” Economics of Education Review 9(2):123(1990).
Schwartz, J. Brad. “Wealth Neutrality in Higher Education: The Effects of Student Grants.” Economics of Education Review 5(2):107 (1986).
Schwartz, J. Brad. “Student Financial Aid and the College Enrollment Decision: The Effects ofPublic and Private Grants and Interest Subsidies.” Economics of Education Review 4(2):129(1985).
Willis, Robert J., and Rosen, Sherwin. “Education and Self-Selection.” Journal of PoliticalEconomy 87(5):S7 (1979).