factory built housing heating and cooling distribution · pdf file ·...
TRANSCRIPT

Factory Built Housing Heating and Cooling Distribution Systems Research

BUILDING ENERGY RESEARCH GRANT (BERG) PROGRAM
BERG FINAL REPORT - DRAFT
FACTORY BUILT HOUSING HEATING AND COOLING DISTRIBUTION SYSTEMS RESEARCH
BERG AWARDEE Manufactured Housing Research Alliance
2109 Broadway Suite 200 New York, NY 10023 Phone: (212) 496-0900
Email: [email protected]
AUTHORS Emanuel Levy, Executive Director
Jordan Dentz, Senior Program Manager

Legal Notice This report was prepared as a result of work sponsored by the California Energy Commission (Commission). It does not necessarily represent the views of the Commission, its employees, or the State of California. The Commission, the State of California, its employees, contractors, and subcontractors make no warranty, express or implied, and assume no legal liability for the information in this report; nor does any party represent that the use of this information will not infringe upon privately owned rights. This report has not been approved or disapproved by the Commission nor has the Commission passed upon the accuracy or adequacy of the information in this report.
Inquires related to this final report should be directed to the Awardee (see contact information on cover page) or the BERG Program Administrator at (619) 594-1049 or email [email protected].

i
Table of Contents Abstract .......................................................................................................................................... iii Executive Summary ........................................................................................................................ 1 Introduction..................................................................................................................................... 4 Project Objectives ........................................................................................................................... 7 Project Approach ............................................................................................................................ 8 Conclusions................................................................................................................................... 34 Recommendations......................................................................................................................... 38 Public Benefits to California......................................................................................................... 42 References..................................................................................................................................... 43 Appendix I ...............................................................................................................................API-1 Appendix II ............................................................................................................................ APII-1 Appendix III..........................................................................................................................APIII-1 Appendix IV..........................................................................................................................APIV-1 Appendix V............................................................................................................................ APV-1 Appendix VI..........................................................................................................................APVI-1 Appendix VII ...................................................................................................................... APVII-1 Appendix VIII.................................................................................................................... APVIII-1 Appendix IX..........................................................................................................................APIX-1 Appendix X............................................................................................................................ APX-1 Appendix XI..........................................................................................................................APXI-1 Appendix XII ...................................................................................................................... APXII-1 Development Status Questionnaire.............................................................................................. Q1
List of Figures Figure 1. Schematic layout of crossover duct................................................................................. 4 Figure 2. In-floor loop system using fiberboard ducts through the rim joist .................................. 9 Figure 3. Central flex crossover under the floor ............................................................................. 9 Figure 4. Floor plan showing registers of new construction evaluation home ............................. 13 Figure 5. Installing the rigid crossover ......................................................................................... 14 Figure 6. Retrofit homes 1, 2 and 3 .............................................................................................. 14 Figure 7. Mastic location at floor register..................................................................................... 15 Figure 8. Measuring airflow ......................................................................................................... 15 Figure 9. Rigid under-floor system............................................................................................... 19 Figure 10. Sleeve with integral gasket.......................................................................................... 21 Figure 11. Crossover duct components......................................................................................... 22 Figure 12. Connecting the rigid to the flex duct ........................................................................... 22 Figure 13. Assembled rigid crossover .......................................................................................... 22 Figure 14. Rigid crossover installed under the home ................................................................... 22 Figure 15. Pressure drop through the crossover at each fan speed ............................................... 24 Figure 16. Total system airflow at each fan speed........................................................................ 24 Figure 17. Register pressure at each fan speed and crossover type .............................................. 24 Figure 18. Changing system resistance and fan speed.................................................................. 25 Figure 19. Old crossovers ............................................................................................................. 28 Figure 20. Assembling and installing rigid duct........................................................................... 28

ii
Figure 21. Airflow by register number ......................................................................................... 29 Figure 22. Removed crossovers showing deterioration................................................................ 30
List of Tables
Table 1. Advantages and disadvantages of under-floor and in-floor crossovers............................ 5 Table 2. Gasket evaluation attributes............................................................................................ 11 Table 3. Retrofit home profiles..................................................................................................... 14 Table 4. Duct leakage reported from ENERGY STAR testing .................................................... 16 Table 5. Simulated annual HVAC energy consumption............................................................... 17 Table 6. Estimated costs for crossover systems............................................................................ 18 Table 7. Advantages and disadvantages of the rigid/flex crossover system concept ................... 20 Table 8. Rigid concept compared to the design goals .................................................................. 20 Table 9. Improved gasket concept compared to the design goals................................................. 21 Table 10. Summary of gasket air tightness evaluations................................................................ 25 Table 11 Comparison of prototype crossover properties.............................................................. 27 Table 12. Summary of duct leakage testing.................................................................................. 29 Table 13. Projected energy savings from retrofit application....................................................... 30 Table 14. Sum of register airflow measurements in feet per minute ............................................ 31 Table 15. Retrofit costs ................................................................................................................. 31 Table 16. Summary of objective outcomes................................................................................... 32

iii
Abstract Factory built homes are an important part of California’s housing landscape and present unique opportunities to improve energy performance. One area of construction, in particular, is ripe for innovation and improvement: the inter-module heating and cooling air distribution system connection (the crossover duct) common to most of the approximately ten thousand manufactured homes built in the state annually and many of the half million existing manufactured homes in California.
In developing a new crossover system, researchers established design benchmarks using published sources, home inspections, and other data. Researchers developed and evaluated design concepts and prototyped and tested a rigid crossover system.
This under-floor rigid crossover system is more robust and durable than the standard flexible duct used in most homes, and is more likely to be installed properly. The rigid crossover is also suitable for retrofit on existing homes and, in combination with a simple system of duct sealing, can save substantial amounts of energy used in older manufactured homes.
Another crossover system type uses in-floor ducts passing through the home’s rim joist. This design can be superior but installation defects can compromise its performance. Researchers evaluated this type of system and provide a series of recommendations for ensuring performance.
A market transformation strategy must emphasize the performance and durability benefits, as well as ease of installation, in order to gain acceptance of the new design by manufacturers, retailers and installers. For existing homes, reaching homeowners in communities with the assistance of community operators is the most promising marketing strategy.
Keywords Manufactured home Duct systems Crossover ducts Energy savings Duct leakage

1
Executive Summary Introduction Each year about ten thousand new factory built homes are sold in California.1 Over ninety-four percent of these typically highly affordable2 homes are built in factories as two or more fully finished modules that are shipped to and finished at the site.3 Nearly all factory built homes provide heating and cooling through ducts connecting a central air handler with the living spaces of the home.4 The design of the air distribution system (ADS) has changed little in the past three decades and varies little among companies. ADS improvements offer the single greatest potential for energy use reduction and at the lowest possible cost.
The goal of this project was to reduce energy use in California homes by improving the ADS inter-module connection (crossover) in factory built homes by curing three common system defects: air leaks to the exterior due to poor field connections; inefficient airflow due to bends and constrictions in the duct; and thermal losses due to contact with the ground and resulting deterioration of insulation. These defects can result in immediate and dramatic problems requiring expensive service calls or can go undetected for years eroding energy and overall building performance.
Objectives The main project objectives were as follows:
1. Characterize whole system performance for air distribution designs typically used in factory built homes.
2. Calculate costs of current practices. 3. Understand the factors that result in variations from this average. 4. Develop two preliminary ADS crossover designs that compete on cost with current designs
but promise superior performance. 5. Complete mock-ups and evaluations of the two designs. 6. Compare and evaluate the concepts based on performance, cost, manufacturability and other
criteria. 7. Modify the design approaches for further testing. 8. Prototype the modified designs. 9. Performance-test the prototypes. 10. Demonstrate that, under typical conditions, the proposed crossover systems can achieve
leakage and energy loss of less than 3 percent and installed costs are comparable to existing systems.
11. Demonstrate that, under typical conditions, thermal comfort and air quality are superior or comparable to existing systems.
12. Write a report documenting the development process, testing and evaluation results, design 1 Three-year average [Source: Institute for Building Technology and Science, http://www.census.gov/const/mhs/stship.html] 2 The manufactured housing industry provides nearly three-quarters of the nation’s new affordable, unsubsidized housing according to Meeting Our Nation’s Housing Challenges: Report of the Bipartisan Millennial Housing Commission Appointed by the Congress of the United States, May 30, 2002. [http://govinfo.library.unt.edu/mhc/MHCReport.pdf]. 3 Data provided by the California Manufactured Housing Institute. 4 While the primary target for this project is manufactured (HUD-code) homes, many modular homes built to local codes are constructed in a similar manner (often by the same companies) and are also a target for the proposed project.

2
specifications, and recommended fabrication, manufacturing and site assembly procedures. 13. Provide the report to all manufacturers selling homes in California. 14. Write a report that includes a market transformation strategy.
Outcomes The main project outcomes were as follows:
1. The literature survey, review of ENERGY STAR manufactured home data, simulations, home inspections, and field tests duct leakage levels from a couple percent up to mid-twenties; energy consumption strongly correlated with leakage level; and all homes inspected had some crossover deficiencies.
2. Typical installed costs for crossover ducts range from $34 to $141 depending on type and other factors.
3. Except for extreme cases such as in flood zones, variations in crossover cost are mainly due to crossover type.
4. Two design concepts were developed after an initial review of three preliminary designs. 5. The components for the rigid-flex system were mocked up at a manufactured housing plant. 6. The rigid crossover was found to have superior performance but cost more than current
practice. 7. A modified design drawing is shown in Appendix X. 8. Installation procedures were modified based on the pilot installation. 9. The new construction test demonstrated similar air distribution performance compared to a
new, well-installed flex crossover. 10. The retrofit test demonstrated that the package of duct sealing and rigid crossover can reduce
typical duct leakage by approximately 20 percent. Pricing of the rigid crossover design is estimated to be $142 for new construction - comparable to in-floor crossover systems.
11. The rigid crossover can reduce air quality and comfort problems that may result from the significant deterioration and contamination found in old crossovers removed from test homes.
12. This final project report documents the development process. Pricing of the rigid crossover design is estimated to be $142 for new construction and $388 for a retail retrofit.
13. This final report will be made available to all manufacturers shipping homes to California. 14. A market transformation strategy was prepared and is presented under the Recommendations
section of this report. Conclusions The major project conclusions were as follows:
• Manufactured home air distribution performance is highly variable. New homes can perform well. Older homes sometimes perform much worse – because they were built without modern methods of duct construction, and because of deterioration.
• Costs of current systems are very low.
• A number of possible alternative design solutions exist, however meeting the cost criteria is challenging.

3
• While the rigid duct had somewhat superior air distribution performance compared to a flex crossover, the real benefit intended by the rigid design is its installation reliability and durability.
• In-floor through-the-rim crossover ducts can result in a well-performing system. The potential exists for failures, but these can be avoided with proper installation procedures.
• While more expensive than existing solutions and therefore more difficult for low-cost manufacturers to adopt, the proposed technology is a superior solution that has potential for higher-end plants and a market segment not originally intended – the large existing home segment.
• A market transformation strategy is presented in the Recommendations section of this report.
Recommendations There are two separate, but parallel opportunities for effecting manufactured home air distribution system performance: new home placements and retrofit/refurbishment of older, existing homes. Although the new home market was originally targeted by the research, the affordability of the design, ease of installation and compatibility with original factory installed duct components, offer the prospect of improving the performance of many of the state’s more than half million older manufactured homes. New and existing homes are attractive and viable market opportunities, but they involve different industry players and marketing approaches. Strategies for reaching each market segment are discussed in the report.
Strategies for reaching the new home market should focus on home manufacturers and retailers, with a secondary focus on home installers. Strategies focusing on existing homes should emphasize manufactured home communities.
Public Benefits to California Based on simulations, savings for retrofit application in 100,000 homes can be estimated at 400,000 MMBtu from reduced gas heating and five gigawatt hours per year in electric cooling. This approximates to five million dollars in annual energy cost. This assumes a rough average of the energy savings data for the energy prices and climate locations simulated.
This estimated energy savings converts to approximately 26,000 metric tons per year of carbon dioxide emissions (assuming 117 pounds per MMBtu for gas5 and one metric ton per gigawatt for electricity6).
5 From http://www.eia.doe.gov/oiaf/1605/coefficients.html, accessed May 12, 2009 6 From http://www.eia.doe.gov/cneaf/electricity/page/co2_report/co2report.html, accessed May 12, 2009

4
Introduction The goal of this project is to save substantial amounts of electric energy in California homes by improving the air distribution system (ADS) inter-module connection (crossover duct) in factory built homes, while at the same time improving the comfort and durability of those homes. The term factory built homes as used in this report includes both manufactured homes built to the national Manufactured Home Construction and Safety Standards (the HUD Code) and similarly built modular homes built to state and local codes. The project PIER subject area is Energy related research and development.
This assessment focuses on the under-floor flexible crossover duct system (used in over 95 percent of homes in California) in factory built homes with two or more modules (multi-section homes represent over 94 percent of total new factory built homes placed in California7). This research sets performance benchmarks by providing baseline data of state-of-the-art ADS against which future system designs are compared. The performance benchmarks are drawn from published sources, inspections of homes in the field and the ongoing data collection from homes built under the Manufactured Home ENERGY STAR program.
The other key benchmark to which proposed designs are measured is the fully burdened cost associated with installing the current crossover system. Success in future commercialization will depend upon demonstrating that new approaches have a low or otherwise justifiable incremental first cost and yield significant benefits.
Design Goals The goal of the research was to develop an improved crossover duct system. Two main types of manufactured home air distribution systems exist: up-flow (ducts in the attic) and down-flow (ducts in the floor). This research focuses on down-flow duct systems, which are dominant in California (Figure 1).
Crossover duct
In-floor ducts
A-Side B -Side
Figure 1. Schematic layout of crossover duct
7 Three-year average [Source: Institute for Building Technology and Science, http://www.census.gov/const/mhs/stship.html

5
The design goals of the new crossover system were as follows:
1. Energy efficient, by keeping the duct within the home’s thermal envelope and/or ensuring that it is well insulated and tightly sealed against leaks.
2. Minimally restrictive of airflow by minimizing bends and making the duct not susceptible to kinks.
3. Robust by being resistant to poor installation quality that could lead to air leaks. 4. Durable for the lifetime of the home by being resistant to damage from the elements or
animals. 5. Inexpensive for the housing manufacturer by using low-cost materials and minimal labor
in the factory. 6. Compatible with existing production process in terms of production speed, using existing
tools and skills. 7. Fast to install in the field, requiring as little labor as possible. 8. Easy to install in the field with minimal training or special skills required. 9. Compatible with existing set-up processes and requiring minimal changes to set-up
process or requirements.
Commonly Used Crossover Systems The two most common categories of down-flow crossover systems are in-floor and under-floor crossover using a flexible insulated duct (with some variants on each). Table 1 summarizes the main advantages and disadvantages of each. Appendix I contains a summary of major features of six specific system types.
Table 1. Advantages and disadvantages of under-floor and in-floor crossovers
Crossover type Advantages Disadvantages
Under-floor
− Low plant cost
− Relatively low site cost
− Commonly used. Installers have tools/ materials
− Field connections often made inadequately. − Support often installed inadequately or not at all. Insulation-
filled bottom board makes it hard to fasten to joist. Need to open up the belly at site possible creating other problems.
− Requires home (top of I-beams) at least 32” above grade or even higher in flood zone.
− Often duct is pinched or kinked, restricting airflow. − Exposure to elements (including animals) and poor installation
can cause rapid deterioration. − Can be complex with three- and four-section homes − Duct often not cut to length. − Weak duct assembly at flex crossover locations. − Collar to trunk duct connection not robust; can be
compromised when installer connects to collar. − Under furnace trunk duct is weak due to opening for plenum
box above and collar below; entire area can be bent/crushed by

6
Crossover type Advantages Disadvantages
installer’s work (especially for metal ducts). − Y (V-box) connectors present other challenges.
In-floor/ through rim
− Minimal site labor
− Not exposed to elements, improving lifespan
− Less subject to installation error
− Allows home to be lower in flood zone
− Higher plant labor − Higher plant materials costs − Hard to inspect crossover connection − Potential for failure when gasket not installed properly or if
duct is blocked − Penetration of rim joists may structurally compromise home, in
some cases requiring extra piers, reinforcing, or restricting location to avoid mate wall openings
− Some designs may not provide adequate airflow − Requires precise alignment between sections in plant − Through rim gasket seal not tested. Hard to verify good
connection or to repair

7
Project Objectives The project objectives were to:
1. Characterize whole system performance (thermal losses, duct tightness, overall engineering proficiency and system balancing) for air distribution designs typically used in factory built homes through a combination of testing of five homes, field inspection of fifteen homes and simulation of three home designs.
2. Calculate typical and average installed cost of current practices, working with manufacturers, including materials, labor (calculate for three representative home designs) and service costs related to system problems (collect relevant service data on at least ten homes).
3. Understand the factors that result in variations from this average.
4. Develop two preliminary ADS crossover designs that compete on cost with current designs but promise superior performance.
5. Complete mock-ups and evaluations of the two designs.
6. Compare and evaluate the concepts based on performance, cost, manufacturability and other criteria. Produce a comparison table with these data.
7. Modify the design approaches for further testing. Create modified design drawings.
8. Prototype the modified designs in partnership with home manufacturers and industry suppliers.
9. Performance-test the prototypes at the building site and/or the laboratory to confirm superior performance.
10. Demonstrate that, under typical conditions, the proposed crossover systems can achieve leakage and energy loss of less than 3% of total energy put into the distribution system by the air handler and installed costs are comparable to existing systems.
11. Demonstrate that, under typical conditions, thermal comfort and air quality are superior or comparable to existing systems.
12. Write a report documenting the development process, testing and evaluation results, design specifications, and recommended fabrication, manufacturing and site assembly procedures.
13. Provide the report to all manufacturers selling homes in California.
14. Write a report that includes a market transformation strategy suggesting an approach for moving the advanced designs into the market; a list of the prime market movers and proposed steps that can be taken to help these companies embrace and champion the system design.

8
Project Approach The project consisted of seven tasks. The approach for each task is described below.
Approach for Task 1: Characterize current system performance Performance of existing air distribution systems was characterized by reviewing the literature, reviewing duct leakage data from the Manufactured Home ENERGY STAR program and by inspecting and testing a sample of homes. The results of these investigations are presented in the sections that follow.
ENERGY STAR Manufactured Homes Duct performance data was extracted from duct leakage test reports generated as part of the manufactured home ENERGY STAR quality control program. ENERGY STAR manufactured homes are among the most energy efficient manufactured homes built but represent a small fraction of manufactured homes built in California and nationwide. They are built to strict duct leakage standards of a maximum of 7 percent duct leakage to the outside8 depending on the combination of construction characteristics selected by the factory.
Home Inspections To assess the condition of crossover ducts on existing manufactured homes, fifteen multi-section manufactured homes of various ages were inspected. The inspection protocol and data collection forms are provided in Appendix II.
Field Tests To evaluate duct leakage and crossover condition together in a sample of homes, five multi-section manufactured homes were inspected and tested to assess the performance of their duct systems. The testing protocol and data collection forms are provided in Appendix III.
Home Simulations In order to quantify the energy consumption impact of the duct leakage results found in these investigations, researchers used REM/Rate software to model a popular home design (double section, three bedrooms, 1,387 square feet). The home was modeled in Sacramento, CA with three different commonly used crossover duct systems (with differing thermal characteristics) at three different duct leakage levels with the goal of estimating the relative energy cost of each system at a range of leakage levels. The three systems were an in-floor loop system using fiberboard ducts through the rim joist (Figure 2); a central flex crossover under the floor (Figure 3); and an in-floor system using a single metal duct through the rim joist.
8 Throughout this report, duct leakage is expressed in terms of cubic feet per minute (cfm) at 25 pa pressurization using the Duct Blaster calibrated blower system divided by the home’s conditioned floor area. Total leakage is all air leaking from the duct system; leakage to the outside is that air leakage that finds it way outside the home.

9
Approach for Task 2: Quantify Total Cost of Current Practices Developing a fairly accurate estimate of the costs of current crossover system construction is possible because most manufacturing plants use similar or identical designs, materials and methods of installation, limiting cost variability. The costs are divided among several components, including: materials used in the plant (duct fittings and fasteners); materials used at the building site (flex ducts, mastic, fasteners); labor required to fabricate and install components in the plant and at the site; and service calls related to system problems.
Factory built housing is a highly competitive and price-sensitive market and therefore the impact on first cost of any improvements to the crossover duct system is of paramount importance. Success in future commercialization will depend upon demonstrating that new approaches have little or no incremental first cost and yield significant customer benefits.
Material costs for crossover duct system components and the factory labor hours required to install these components and labor rates was collected from three manufacturers, each operating multiple plants in California (Fleetwood Enterprises, Clayton Homes and Champion Enterprises). Field labor hours required to install crossover ducts and labor rates was collected from seven installers operating in California as well as the southern states and the northeast. Manufacturing and installation costs were estimated for three common system designs: in-floor loop system crossover with fiberboard ducts, under-floor flex system crossover, and in-floor single crossover with metal ducts. Service costs related to the air distribution system were gathered from seventeen plants for the year 2007.
Approach for Task 3: Develop preliminary advanced ADS crossover designs Design concepts were developed to be cost competitive with current designs but promise superior performance. The designs were shaped by the design goals described in the introduction. A peer review was conducted to get feedback from industry experts knowledgeable in the field of air distribution systems.
Figure 2. In-floor loop system using fiberboard ducts through the rim joist
Figure 3. Central flex crossover under the floor

10
The design concepts (a rigid under-floor system and an improved gasket for through-the-rim crossovers) were mocked up and evaluated. These two designs were selected based on their individual merits as determined by the industry committee and because it was desired to have both an under-floor and an in-floor solution. Both types of systems will likely continue to be used, with under-floor systems remaining the dominant type for the foreseeable future, but in-floor systems increasing in use.
Key components of both systems were fabricated and tested. The rigid crossover was evaluated through full-scale prototype construction. Industry supplier LaSalle Bristol provided the prototype rigid crossover system components pre-assembled and ready for installation on the prototype test home. Through-the-rim gasket materials were produced and provided by gasket manufacturers Nomaco Inc., CenterSeal Inc. and LaSalle Bristol. The gasket connections were mocked up and evaluated qualitatively using a test apparatus described below in Task 4.
Approach for Task 4: Evaluate options and beta test The concepts developed in Task 3 were compared and evaluated based on performance, cost, manufacturability and other criteria. The manufacturer team members played a central role in evaluating the options. A testing and fabrication plan was developed including full-scale mock ups and testing.
Rigid Crossover A series of tests were conducted to evaluate and refine the rigid crossover design. The first set of tests was of a prototype installed on a new home located at a manufacturing plant to determine the overall viability of the concept.
The test house was a two-section manufactured home with central trunk ducts in each section and crossover collars located approximately at the mid-point of each duct. Two short branch flex ducts served registers at either end of the A-side trunk duct. The home was set up temporarily outside the manufacturing plant where it was constructed.
Researchers installed a standard twelve-inch diameter flex duct between the two crossover collars. The duct was installed straight with no kinks or unnecessary bends. A typical flex duct consists of an inner liner that is covered with insulation and an outer plastic covering. For the tests, only the inner plastic liner was secured to the collar with a zip tie. Air supply registers were sealed and total duct system leakage was measured with a calibrated blower using the 25 Pa protocol.
Next, researchers set up the home for airflow and duct pressure measurements. Air supplies were unsealed and pressure probes installed along the longest duct run from the air handler to the B-side of the home. Probes were placed at each end of the crossover duct (through the collar) and at four B-side register. In addition, a probe was located in an A-side register to serve as a reference pressure. All probes were connected to a multi-channel pressure measurement and data logging system with software configured to log data at two-second intervals.
Baseline pressures were established and recorded at the instrumented A-side register with the air distribution system running in its normal configuration at each of three fan speeds (low, medium, high). These three pressures became the reference pressure for the subsequent system airflow tests. To measure total system airflow, a duct blaster was taped to an opening in the sealed return

11
air grille and activated until the reference pressure reached its pre-established baseline reading (thereby canceling out the resistance on the system imposed by the duct blaster).
The airflow into the system was measured using the duct blaster and digital monometer. The data logging system simultaneously measured and logged pressures at the seven pressure probes in the duct system with reference to the outside pressure.
The measurements were repeated at each fan speed in three configurations: the flex duct crossover; a compromised flex installation (representing a substandard installation with kinks and bends); and, the rigid crossover system. Photographs and diagrams of rigid crossover prototype tests are in Appendix IV.
Through-Rim Gasket At the point where an in-floor crossover duct terminates at the marriage line (through the rim joist) there is typically a gasket whose purpose is to prevent air leakage at this critical juncture. The gasket is most often applied to the outside surface of the rim joist on one or (in at least one case) both halves of the home. There also is typically a gasket used to seal around the entire perimeter of the home (walls, floor and ceiling) at the mate line to prevent envelope air leakage. This marriage line gasket and the crossover duct gasket may or may not be the same material.
Gaskets used for through-rim duct crossovers (in some cases also used for marriage lines) were evaluated with respect to six attributes. Table 2 describes each attribute, notes where the information came from and the criteria for evaluation.
Table 2. Gasket evaluation attributes
Attribute Description Information source Criteria Air tightness Resistance to air
leakage at various levels of compression
Testing in jig with smoke visualization
Must resist air leakage at gaps up to
one inch Compressibility Ease with which the
gasket can be compressed
Interviews with manufacturers and
installers
Should not hinder mating of the home
Field installation durability
How well the gasket holds up to the
stresses of transportation and
installation
Interviews with manufacturers and
installers
Should not become dislodged during
appropriate transport or installation
procedures Factory assembly Ease with which the
product can be applied to the home in
the factory
Interviews with manufacturers
Should be installed in 10 minutes or less
Cost Price per linear foot delivered to the manufacturer
Home manufacturers and gasket suppliers
Price similar to existing gaskets
Availability How readily is the gasket available in a
Gasket suppliers Available as a class 2 fire rated product
12
form suitable for through-rim duct
crossovers Air tightness is the most critical gasket performance attribute. A series of leakage tests was conducted to evaluate the relative air tightness of a variety of gaskets – some currently in use, some not in common use.
The main issue with through-rim gaskets is that they may not produce a tight seal at the crossover location. Inspecting and repairing a through-rim gasket seal is difficult to do after the home sections have been married together. Installers attempt to maneuver the home sections to achieve as tight a joint as possible along the floor and roof joints; however gaps of up to one inch are possible.9 Gaps between structural elements (such as the rim joist) are required to be closed with shims; however it is not clear how thoroughly this is typically done. Most likely, the location of the crossover duct does not receive shims because fasteners would not be installed there due to the lack of rim joist dimension above and below the duct cut out. Also, shims pushed into this location would likely dislodge the gasket and even push it into the duct itself, restricting airflow. This preliminary evaluation focused on examining the seal produced by a variety of duct materials at marriage line gaps of up to one inch wide.
Matching sections of two by eight rim joists with five-inch by fifteen-inch through-rim duct openings cut out of them were fabricated. A variety of gasket types were attached to the openings and evaluated for tightness of fit using smoke visualization. Each gasket-joist assembly was placed in a jig that permitted adjustment of the marriage line gap up to one inch. A smoke blower introduced smoke to the rear of the jig through a short flexible duct. The maximum pressure in the jig’s flex duct was substantially lower (7.5 pa) than would occur in a reasonably well sealed in-service crossover duct (up to 75 pa) to ensure that the test did not exaggerate leakage. A list of gaskets evaluated and photo of each type is included in Appendix IV.
Four manufacturers, each with multiple plants, were queried regarding their experiences with gaskets. Information was collected on marriage line gaskets as well as crossover duct gaskets because plants often use the same gasket for both purposes, and because plants that do not use thru-rim crossover ducts may have insights into gasket materials that they use for the marriage line but that others use for crossover ducts.
The objective of the interviews was to gather information on what gaskets each plant uses for each of the two applications and how various gaskets fare during home transport and installation. Specifically, plants were asked about the frequency and cause of instances where a gasket was dislodged during home transport or installation, and if the compressibility or thickness of their marriage line gasket ever interferes with the ease of pulling the home tightly together. Information was gathered through interviews and an emailed survey.
Approach for Task 5: Pilot test with manufacturers
9 The HUD installation standards (24 CFR 3285) permit a maximum marriage line gap between structural elements of one inch prior to close up of the home. The gap must be filled with shims prior to close-up of the home.

13
A new home set up at a sales center was selected for installation and testing of the rigid crossover duct. The purpose of this test was to evaluate the installation of the rigid duct as modified based on feedback from the prototype installation. A secondary goal was to measure the relative airflow differences between the home set up with the rigid crossover duct and with a standard flex crossover (Figure 4).
Figure 4. Floor plan showing registers of new construction evaluation home
First a standard flex duct was installed and airflow from each register was recorded using a vane anemometer. During the test, all interior doors were opened, all register vanes were set to maximum opening and the air handler was operated at the default speed. The flex duct was cut to proper length (no excess duct was present) and installed with nylon ties.
Next, a rigid crossover was installed using the following procedure (Figure 5): 1. The twenty-five-foot flex duct was trimmed to approximately the length needed for the
home. 2. One pipe duct was cut down as approximately eleven feet were needed for the crossover.
The cut end of the duct was crimped with a crimping tool to reduce its diameter so that the flex duct would slip over it.
3. The inner liner of the flexible duct was pulled over the end of one of the pipe ducts and taped in place. The liner was then cut off, leaving a sufficient amount to bridge the gap and overlap the other pipe duct by approximately one foot. It was then pulled over the other pipe duct and taped in place.
4. The insulation and outer liner was pulled over the entire duct. 5. The completed assembly was slid into place under the home. 6. The elbows were slipped over and screwed to the crossover collars, forming a tight fit. 7. The duct was supported on blocks. As this was a temporary installation, no zip ties,
mastic or tape were used to make a permanent connection.

14
Figure 5. Installing the rigid crossover (exterior of the test house, flex crossover, installing the rigid crossover) While new homes were targeted by the research, it was evident that the under-floor design could be used in older homes. Testing in existing structures helped characterize this option’s benefit for retrofit. The goals of the tests were to assess ease of component assembly, durability and basic performance parameters of the concept designs.
Three homes were identified for an evaluation of a retrofit application of the rigid crossover duct. All homes were two-section manufactured homes set on piers, with original flex crossovers connected between collars located directly under the furnace at one side and under the trunk duct on the other side (Table 3 and Figure 6).
Table 3. Retrofit home profiles Home ID Size Year built Crossover inside
diameter Crossover insulation
1 24 x 48 1988 10” R-4 2 24 x 48 1991 12” R-4 3 26 x 60 1988 10” R-4
Figure 6. Retrofit homes 1, 2 and 3 The retrofit process consisted of the following improvements:
• Replacing the existing flexible crossover with a rigid crossover duct of the same inside diameter, but insulated to R-8.
• Using duct sealant to seal leaks accessible through the floor registers Duct sealant was used at each register at the trunk duct to riser connection and at the riser-floor interface (Figure 7). Other potential leakage sites commonly found in manufactured homes were not sealed because they were difficult to access. This includes the plenum area under the furnace, the connections between the trunk duct and crossover collar, the ends of the trunk duct and

15
connections to branch ducts. This research attempted to discover how large an impact on duct leakage could be made by sealing easily accessible leaks.
A vane anemometer was used to measure airflow from each register (all registers were identically sized) while the air handler fan operated at its default speed (Figure 8).
Figure 7. Mastic location at floor register
Figure 8. Measuring airflow with a vane anemometer
Approach for Task 6: Quantify costs and benefits and report findings A final report was developed that documents the work completed in Tasks one through four. The report compares the proposed crossover system with current practice, records the development process, specifications, testing and evaluation results (including energy use) and provides recommended fabrication, manufacturing and site procedures. The report will be made available to all manufacturers of factory built homes in California. Each manufacturer will be contacted via email to announce the availability of the final report and provided with instructions for obtaining an electronic copy.
Approach for Task 7: Develop a market transformation strategy This market transformation strategy addresses the under-floor rigid crossover duct system described in this report. For manufacturers employing or considering in-floor crossover options, this report provides them with input when considering gasket options. The strategy was developed through multiple conversations with manufacturers, retailers, home installers, and manufactured home community owners during industry meetings and in person at test homes.

16
Project Outcomes Objective 1: Characterize whole system performance (thermal losses, duct tightness, overall engineering proficiency and system balancing) for air distribution designs typically used in factory built homes through a combination of testing of five homes, field inspection of fifteen homes and simulation of three home designs.
Outcome: The results from a literature survey, review of ENERGY STAR manufactured home data, home inspections, field tests and simulations yielded the following results.
• Duct leakage levels from a couple percent up to mid-twenties • Energy consumption strongly correlated with leakage level • All homes inspected had some crossover deficiencies
More detailed results follow:
Literature Summary Very little literature exists focusing on factory built home crossover ducts. Some literature describes the performance of the entire duct systems of factory built homes. Average leakage levels for individual studies range from 3.4 percent to 11.66 percent with some homes measuring in the mid-twenties. Results of four manufactured home field duct leakage studies are summarized in of Appendix V.
ENERGY STAR Manufactured Homes The duct leakage data includes leakage from the entire duct system, not just the crossover. Homes tested for the ENERGY STAR program are generally a few months to at most one year old at the time of testing. Of sixty-six homes tested nationally in 2006 and 2007, the average duct leakage to the outside was 3.47 percent. Table 4 shows the average; high and low leakage levels by major crossover type. The complete data set is in Appendix V.
Table 4. Duct leakage reported from ENERGY STAR testing
Crossover type No. of homes High Low Average
External flex 38 5.96% 1.22% 3.11%
In-floor 26 5.12% 1.30% 4.13% Attic 2 1.80% 1.70% 1.75%
All types 66 5.96% 1.22% 3.47%
Home Inspections All fifteen homes inspected had some installation deficiencies including: poor or no support (12), tape only connections (7), or restricted airflow (3). At least two had been replaced for unknown reasons and four were visibly wet at the time of observation, which degrades thermal performance and accelerates deterioration. In four cases, the connections were visibly starting to deteriorate; two of these homes were only six years old. Photographs and a summary of findings from the inspections are included in Appendix V.

17
Field Tests All five of the tested homes employed under-floor flex crossovers. Detailed results by home and photographs are provided in Appendix V. Three homes had offset furnaces with flex ducts leading from boxes under the furnace to two or three trunk ducts. Four of the five homes had total duct leakage and leakage to the outside in excess of 10 percent. One home had leakage in excess of 20 percent. The crossover ducts and connections were in satisfactory condition so the bulk of the duct leakage is assumed to originate from the ducts within the floor system. The similar results for total and outside leakage indicate that the bottom board was not performing as an effective air leakage barrier and most of the air leaking from the ducts was finding its way to the outside rather than up into the home. Supply balance was generally good with the notable exception of one home where the furnace side received more than twice the air supply as the B- side. This is a possible indicator of a severe restriction in the crossover duct.
Home Simulations The results of the modeling are summarized in Table 5. Table 5. Simulated annual HVAC energy consumption
5% duct leakage to outside
12% duct leakage to outside
19% duct leakage to outside
System ID Heating, (MMBtu/
yr)
Cooling, (MMBtu/
yr)
Heating, (MMBtu/
yr)
Cooling, (MMBtu/
yr)
Heating, (MMBtu/
yr)
Cooling, (MMBtu/
yr) 1: In-floor loop 21.7 4.3 24.1 4.5 25.7 4.6 2: Under-floor flex 22.3 4.3 24.6 4.5 26.0 4.6
3: In-floor metal 21.7 4.3 24.3 4.5 25.7 4.6
As expected, Systems 1 and 3 performed almost identically with respect to energy consumption as predicted by the simulation. Both have crossovers located in the floor system within the thermal envelope (above the floor insulation). System 2 had slightly higher predicted energy consumption because the crossover is in the exposed crawlspace with R-4 insulation. Energy consumption increased substantially (approximately 17 percent) as duct leakage rose from 5 percent to 19 percent. Note that energy simulations do not capture the differences in air balance and resulting comfort or the durability and reliability of the systems. Comfort problems with unbalanced systems (for example an in-floor system with inadequate crossover capacity or a very leaky flex crossover duct connection) can cause occupants to adjust thermostats, leading to energy waste not accounted for in this analysis.
Objective 2: Calculate the typical and average installed cost of current practices, working with manufacturers, including materials, labor (calculate for three representative home designs) and service costs related to system problems (collect relevant service data on at least ten homes).
Outcome: Typical installed costs for crossover ducts range from $34 to $141 depending on type and other factors.
A breakdown of installed costs of current practices including materials and labor for three common system types are provided in Table 11. Service costs can be high for problem homes but

18
the industry does not posses sufficient data to calculate service costs over all systems. Appendix IV contains data on service costs related to the air distribution system gathered from 17 plants for the year 2007.
Material costs vary slightly by home size. An average size home (double section, 32 ft wide x 52 ft long) was assumed for the estimates. Data for the cost estimates was gathered from seven installers and three home manufacturers and summarized in Appendix IV. Material and labor costs are summarized on Table 6 below:
Table 6. Estimated costs for crossover systems
System type Materials Labor (plant)
Labor (site) Total
1: In-floor loop $134.42 $6.67 $0.00 $141.09 2: Under-floor flex $31.81 $3.33 $15.00 $50.14 3: In-floor metal $27.24 $6.67 $0.00 $33.91
Note: Assumes labor cost in the plant and field of 20 dollars per hour.
Objective 3: Understand the factors that result in variations from this average.
Outcome: Except for extreme cases such as in flood zones, variations in crossover cost are mainly due to crossover type.
The following factors may result in variation from the estimated average costs shown in Table 6.
In the Plant • Larger homes require slightly more crossover materials. For example, on average a 32
foot-wide home requires four more linear feet of crossover duct (per crossover) than a 24 foot-wide home. Homes shorter than 60 feet may in some cases be constructed with one instead of two through-the-floor crossovers because of the smaller volume of air that must be transported through the crossover. Homes with three and four sections typically need additional crossovers, potentially doubling or tripling the crossover cost. However, these cases are the exceptions; the vast majority of homes consist of two sections.
• Market fluctuation in materials and labor costs will have some impact, as will regional price differences. Regional price differences are minimal because many of the manufacturers operate nationally.
At the Site • If the home is located in a flood zone, the home may need to be raised on higher piers to
keep an under-floor flex duct above the flood level. This may increase the foundation cost on the order of two thousand dollars.
• More than two home sections requiring crossovers will increase labor at the site proportional to the number of connections required.
• Lack of clear installation instructions from the manufacturer, especially on three- and four-section homes, may require the installer to spend significant time communicating with the plant and interpreting the design.

19
• Cases where the crossover location conflicts with a chassis cross member or other structural element (as sometimes happens when homes are customized from standard plans) will require additional work by the installer.
Objective 4: Develop two preliminary ADS crossover designs that compete on cost with current designs but promise superior performance.
Outcome: Two design concepts were developed after an initial review of three preliminary designs.
Three initial design concepts were evaluated with respect to the design goals and reviewed by the industry panel. A description, a diagram and a list of advantages and disadvantages for each of the three concepts is provided in Appendix VII. Based on this review two additional concepts were developed. These are presented below:
Rigid Under-Floor System This concept uses a pair of insulated rigid metal ducts and elbows connected to the traditional dropout collars under the home and connected to each other by a short length of flex duct. It would contain the following components:
• Rigid round metal elbow duct connected to the crossover collars under the furnace in the A-side and under the trunk duct in the B-side
• Five-foot-long rigid 12 inch diameter round metal ducts extending from each elbow toward the marriage line
• Insulation jacket for round metal ductwork • Short length of flex duct bridging between rigid rounds
The elbows and five-feet-long pipe duct would be connected to each other and insulated in the plant or at a supplier. The two duct assemblies, an approximately five- to six-foot length of flex duct, nylon ties and tape would be shipped loose with the home (Figure 9).
A-Side B-Side
Trunk ductCrossover collar
Flex duct
Furnace/ Air-handler
Rigid elbow
Round metal ductSupport straps
Figure 9. Rigid under-floor system
The installer would connect the rigid assemblies to the collars on each half using three screws; fasten support straps to the underside of the home; and connect the flex duct between the ends of the rigid pipe duct using nylon ties and tape, pulling the flex duct tight over the pipe duct. The use of flexible duct, in combination with the ability to pivot the elbows around the collars and the generous overlap of the flex-pipe connection, would permit adjustment of the system to avoid marriage line piers and other under home obstructions. Table 7 summarizes the main advantages and disadvantages of this concept and Table 8 compares the concept to the design goals.

20
Table 7. Advantages and disadvantages of the rigid/flex crossover system concept Advantages Disadvantages
− Simpler connections (although more of them)
− More likely to be supported properly − No change to home construction in plant − Superior airflow through metal duct − Much more likely to be kink-free − Much less likely to have excess length − More durable − Potential retrofit solution for older homes
− Requires over 12 inches clearance between I-beams and ground (or flood level if applicable)
− Integral support system must be attached by installer
− More expensive compared to flex only − More field connects (although each is
simpler) − More parts to stock in the plant (and
possibly additional suppliers) − Some work in the plant to prepare duct
subassemblies
Table 8. Rigid concept compared to the design goals
Goal Rigid crossover
Energy efficient Insulated exterior duct; insulation less likely to degrade over time compared to traditional flex duct because it will more likely be supported off the ground.
Minimally restrictive of airflow
Rigid duct portion eliminates potential kinks; slight bend possible in central flex portion of crossover.
Robust Dependant on robustness of connections. Durable Rigid duct is an improvement over flex duct for durability. Inexpensive for manufacturer
Cost is one hundred to one hundred fifty dollars more than standard flex duct.
Compatible with existing production process
No change to existing production process.
Fast to install in the field Will take slightly longer than traditional flex crossover.
Easy to install in the field Requires no special skills.
Compatible with existing set-up processes
No change to home set up process.
Improved Gasket for Through-the-Rim Crossovers While in-floor crossover ducts are not suitable for all homes, they are increasingly used by some manufacturers. Many manufacturers connect in-floor crossover ducts using a through-the-rim connection. As discussed above, however, the reliability of this connection type is unknown and if leaky, inspection and repair is difficult.

21
The efficacy of this approach depends upon the use of a proven superior gasket/connector that is durable and not likely to tear when exposed to typical installation. Possible solutions include an alternative gasket material or profile and/or a short sleeve with integral gasket (Figure 10).
Figure 10. Sleeve with integral gasket
One possible outcome of this effort is that existing systems are found to be generally leak-free and satisfactory, requiring little or no improvements. This would be a valuable finding, however, suggesting to plants heretofore reluctant to use this system because of worries about leaks that they can have confidence in it. Table 9 compares the improved gasket concept to the crossover design goals.
Table 9. Improved gasket concept compared to the design goals Goal Improved through-rim gasket
Energy efficient Within the thermal envelope, although insulation under the in-floor duct may be compressed in the outrigger area.
Minimally restrictive of airflow Minimal bends and eliminates potential kinks.
Robust Gasket failure during installation is the potential weak link and focus of the improvement.
Durable With good initial installation and material quality, should be durable for the lifetime of the home.
Inexpensive for manufacturer New gasket solution may cost slightly more than existing through-rim gaskets.
Compatible with existing production process Similar to existing through-rim system.
Fast to install in the field No or minimal additional field labor. Easy to install in field Requires no special training or skills. Compatible with existing set-up processes
May require additional attention/care in mating the two sections of the home.
Objective 5: Complete mock-ups and evaluations of the two designs.
Outcome: The components for the rigid-flex system were mocked up at a manufactured housing plant.
The rigid components were assembled on the ground and connected to a home provided by the plant (Figure 11). The home’s duct system was tested for tightness. Ease of installation,
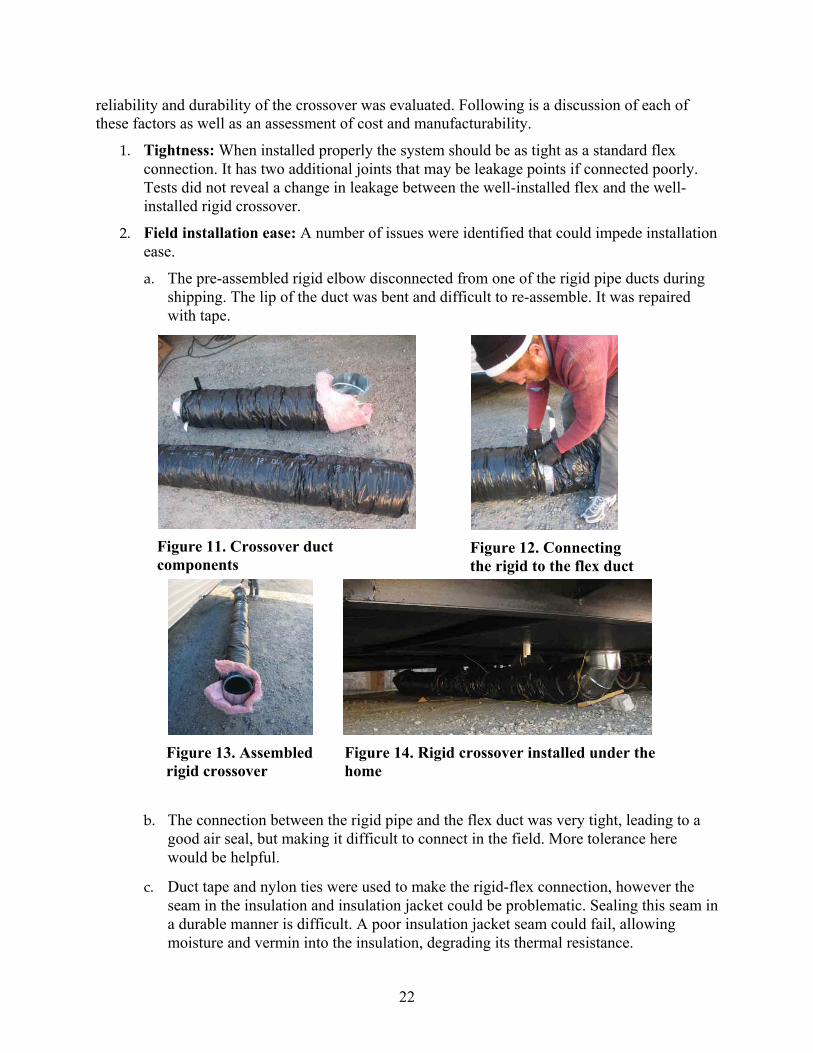
22
reliability and durability of the crossover was evaluated. Following is a discussion of each of these factors as well as an assessment of cost and manufacturability.
1. Tightness: When installed properly the system should be as tight as a standard flex connection. It has two additional joints that may be leakage points if connected poorly. Tests did not reveal a change in leakage between the well-installed flex and the well-installed rigid crossover.
2. Field installation ease: A number of issues were identified that could impede installation ease.
a. The pre-assembled rigid elbow disconnected from one of the rigid pipe ducts during shipping. The lip of the duct was bent and difficult to re-assemble. It was repaired with tape.
Figure 11. Crossover duct components
Figure 12. Connecting the rigid to the flex duct
Figure 13. Assembled rigid crossover
Figure 14. Rigid crossover installed under the home
b. The connection between the rigid pipe and the flex duct was very tight, leading to a good air seal, but making it difficult to connect in the field. More tolerance here would be helpful.
c. Duct tape and nylon ties were used to make the rigid-flex connection, however the seam in the insulation and insulation jacket could be problematic. Sealing this seam in a durable manner is difficult. A poor insulation jacket seam could fail, allowing moisture and vermin into the insulation, degrading its thermal resistance.

23
d. Installing the rigid elbow onto the home’s dropout collars was impossible until tape applied in the factory to the edge of the collar was removed. Even with the tape removed, it took two people to maneuver the elbow over the collar. Again, additional clearance would help here. (It was later determined that the crossover collars on this home were slightly oversized due to a production error. This problem was not encountered in subsequent tests.) Also, the thick insulation around the elbow made it more difficult to maneuver the duct into place – it would be better to have a rigid surface to push.
e. Installing screws to connect the elbow to the collar was difficult, particularly getting the screws started into the steel elbow. Pre-drilling three holes around the elbow would make screw installation much easier.
3. Field installation reliability: Installation issues noted above must be resolved to ensure a more reliable connection.
4. Durability: A well-installed system should be quite durable. There should be at least 18 inch clearance from bottom of collar to ground to ensure that the crossover duct is not resting on the ground.
5. Cost: Materials required on the site may be sourced in a pre-assembled kit including pipe duct, elbows, support straps, insulation, tape, nylon ties and applicator tool for approximately two hundred dollars; or as individual components for assembly on the site (or pre-assembled in the plant) for approximately one hundred to one hundred thirty dollars depending on whether a complete kit is desired (tape, straps, nylon ties and nylon tie applicator tool).
6. Manufacturability: Third-party suppliers can fabricate the rigid components using off-the-shelf parts and standard processes. Alternatively, home manufacturers can pre-assemble the components with relatively little effort or tooling. Specifying non-standard pipe and flex duct products to achieve additional installation tolerance would complicate materials sourcing.
Objective 6: Compare and evaluate the designs based on performance, cost, manufacturability and other criteria. Produce a comparison table with these data.
Outcome: The rigid crossover was found to have superior performance but cost more than current practice.
The results and analysis of the rigid crossover testing is presented below, followed by the results of the gasket evaluation.
Rigid Crossover Test Results and Analysis Pressures and airflows with good and poor flex crossovers and the rigid crossover were recorded at each of three fan speeds. Appendix VIII summarizes the key data.
The pressure drop through the rigid crossover was about half of that through the poorly installed flex duct and about 40 percent less than that through the well-installed flex crossover. This was true at all fan speeds. This result is consistent with the hypothesis that the rigid duct provided less resistance to air moving into and through the crossover, while the poorly installed flex duct provided the greatest barrier to air movement to the B-side of the home (Figure 15). Total system

24
airflow was highest with the well-installed flex crossover, followed by the poorly installed flex crossover. The rigid crossover had the lowest airflow, although by a small margin (Figure 16).
10
15
20
25
30
35
40
45
0 1 2 3 4
A/H Speed
Del
ta P
Bad flex
Good f lex
Good f lex
Rigid
Rigid
800
850
900
950
1000
1050
1100
1150
0 1 2 3 4
Fan Speed
Tota
l sys
tem
air
flow
Bad f lex
Good flex
Rigid
Figure 15. Pressure drop through the crossover at each fan speed
Figure 16. Total system airflow at each fan speed
Pressure at the A-side register was greatest for the poorly installed flex crossover, followed by the well-installed flex crossover and lowest for the rigid crossover. The rigid system resulted in about a 40 percent lower A-side register pressure compared to bad flex and 30 percent lower than good flex. The reverse was true for B-side registers. Pressures with the rigid crossover in place were 30 to 50 percent higher compared to the flex crossovers. The system with the rigid crossover duct installed had a more consistent pressure profile in general. The difference in pressure between the register with the highest pressure (the A-side supply) and the one with the lowest pressure (register B1) was about two pascals with the rigid system compared to about seven and eleven pascals for the good and poor flex crossover systems, respectively (Figure 17).
9.26.2
87.15.555.7
4.14
19.7
15.7
11.7
16.5
12.7
9.812
9.67.1
0
4
8
12
16
20
24
Fan Speed
Reg
iste
r Pre
ssur
e (P
a)
RigidGood FlexPoor Flex
Low Medium High
A
B1
Figure 17. Register pressure at each fan speed and crossover type

25
Reducing resistance to airflow through the crossover (via the rigid crossover compared to a flex crossover) yielded a lower total system flow. While counter-intuitive, the data is consistent as shown in Figure 18. The lower airflow with the rigid duct (circled points) is consistent with the observation of higher static pressure within the air handler. The measurement of airflow is consistent with this data – for there to have been greater total air flow with the rigid crossover, the pressure in the air handler (resistance) should have been lower.
100
120
140
160
180
200
600 800 1000 1200
Total System Airflow (CFM)
Ext
erna
l Sta
tic P
ress
ure
(AH
Com
partm
ent)
AH Hi
AH Med
AH Lo
Decreasing duct resistance
Figure 18. Changing system resistance and fan speed
The data also shows higher pressures at the various B-side supply registers with the rigid duct and lower pressures on the A-side. The data from the rigid duct test implies better distribution, even if at a lower total flow. One explanation is that a greater volume of air reaches the B-side by inertia (velocity pressure) than would have been the case with a pressure-dominated duct system. Because the crossover opening was directly under the blower outlet, more air flowed to the B-side (because of the lower resistance of the rigid crossover) that under a pressure-dominated system would have stayed on the A-side; and that once on the B-side it encountered relatively greater resistance because of the increased airflow there.
Thru-rim gasket
The results of the smoke visualization testing are summarized in Table 10. Photos and a description of the findings for each gasket type are presented in Appendix IX.
Table 10. Summary of gasket air tightness evaluations
Gasket type Tightness “P” gasket normal install
Leaky at gaps of one-half inch or greater; gasket bulb far from the duct cut-out due to width of gasket nailing fin; as a result, the gasket was not squeezed between opposing rim joists to form a seal.
“P” gasket reverse install
Superior to normal install; tight even at one inch gap except for leakage at gasket joint for all gaps.
Rectangular “T” gasket
Extremely leaky except at very small marriage line gap.
Foam pipe insulation Leakey at all gaps because fasteners compressed insulation at fastening points; not thick enough to bridge marriage line gap

26
over one-half inch. Center seal Performed well at all gaps. Fiberboard gasket Some leakage at fastener locations. Fasteners ripped through
gasket and held to foil facing leaving small pockets in gasket. High leakage at gaps greater than one inch.
Most plants and installers interviewed about gasket field installation experience reported no problems with dislodgement or compressibility of gaskets. One large manufacturer however had experienced both of these issues with the “P” gasket they were using for the marriage line in some of their plants.
The manufacturer received reports from the field that the gasket was becoming dislodged during home installation. This occurred when the modules were brought together laterally to touch and were then moved vertically or horizontally. The gasket was “scrubbed” off and typically dropped down into the home from the ceiling marriage line in a long arc. The setup crew would not be able to (or would be unwilling to) stuff the gasket back up into the gap. They would simply cut it off thereby leaving a gap in the gasket along the marriage line. The manufacturer concluded that the staples used to fasten the gasket to the home were ripping through the gasket nailing fin.
Another issue this same manufacturer had with this gasket was the resistance of the material to compression. They received complaints from installation crews saying that they were having problems pulling the units together due to the gasket.
Plants from all other manufacturers reported no problems with the “P” gasket used in both marriage line and crossover duct gasket applications. One other manufacturer noted the importance of stapling the gasket along the mating line perimeter framing with wide crown staples in the approximate center of the framing member. This is especially critical along the floor to let it "roll up or down" when units are put together. An installer for this same manufacturer noted that to prevent gasket problems, proper installation procedures must be followed when mating the home. A roller system should be used, bringing the two halves of the home together directly to minimizing lateral movement.
Regarding compression, this installer noted that the “P” gasket compress enough to meet the design requirements. Once again, proper equipment is essential. A minimum two-ton chain come-along (or two, one-ton units) must be used on each end of the home (plus one in middle for eighty-foot-long homes) in order to achieve adequate compressive pressure. Cable come-alongs (which are available only in a maximum of one-half ton capacity, which can be doubled to one ton) are not powerful enough. Using trucks or bolts to bring the home together will not work either.
Table 11 summarizes the crossover properties qualitatively based on the initial prototype evaluations.

27
Table 11 Comparison of prototype crossover properties
Property Rigid In-floor loop
Under-floor flex
In-floor metal
Thermal performance Good Excellent Poor Good Air tightness Good Variable Variable Variable Cost high Very high Low high Ease of mfg Good Poor Good Fair Ease of installation Fair Excellent Good Excellent Reliability Excellent Unknown Fair Unknown Durability Excellent Excellent Poor Excellent
Objective 7: Modify the design approaches for further testing in consultation with home manufacturers. Create modified design drawings.
Outcome: The design was revised to simplify installation. A modified design drawing is shown in Appendix X.
The following changes were made to rigid crossover design based on feedback from the prototype installation:
• The metal duct was not pre-insulated. Instead, the design calls for a standard flex duct to be supplied to bridge the small gap between the rigid ducts and to insulate the entire system without seams.
• Holes in the elbows were specified to be pre-drilled for assembly to the crossover collars. • As a design requirement, the crossover collar diameter was verified (11.75 inches)
avoiding an earlier problem of poor fit with the elbow.
Objective 8: Prototype the modified designs in partnership with home manufacturers and industry suppliers.
Outcome: Installation procedures were modified based on the pilot installation.
A second set of tests was performed to uncover additional installation issues. The rigid crossover was installed on a new home set up at a sales center. The installation proceeded without major difficulty. The only challenge was cutting the pipe duct to length with snips. It will be important to either get the proper length of pipe duct at the site to avoid the need to cut it or to cut the pipe while still flat (i.e., before being seamed into a tube). Another lesson learned was to position the seam in the flex duct insulation along the inside curve of the rigid duct so it does not separate at the bend.
A third set of tests was on three older homes in a manufactured home community to assess a retrofit application. Two workers needed approximately thirty minutes to assemble the rigid crossover from the constituent parts (rigid duct, elbows, insulated crossover) and approximately forty to sixty minutes to remove the old crossover and install the rigid crossover (Figure 19 and Figure 20). The variation was a function of the ease of access under the home and degree to which obstructions such as pipes interfered with the work.

28
Figure 19. Old crossovers
Figure 20. Assembling and installing rigid duct
Objective 9: Performance-test the prototypes to confirm superior performance.
Outcome: The new construction test demonstrated similar air distribution performance compared to a new, well-installed flex crossover.
The new construction test resulted in a slight increase in air flow through the crossover. Figure 21 shows the airflow results for the ten registers with the flex and rigid crossover ducts respectively. Overall flow with the rigid duct increased 1.2% compared to the flex duct based on a sum of vane anemometer readings. The B-side ducts saw an increase of 2.2% and the A-side saw a decrease of 0.5%. These relatively minor changes are consistent with the hypothesis that the rigid duct offered less resistance to air movement than the flex duct; however, the flex duct was relatively short and installed properly (no kinks or bend), so the differences were minor.
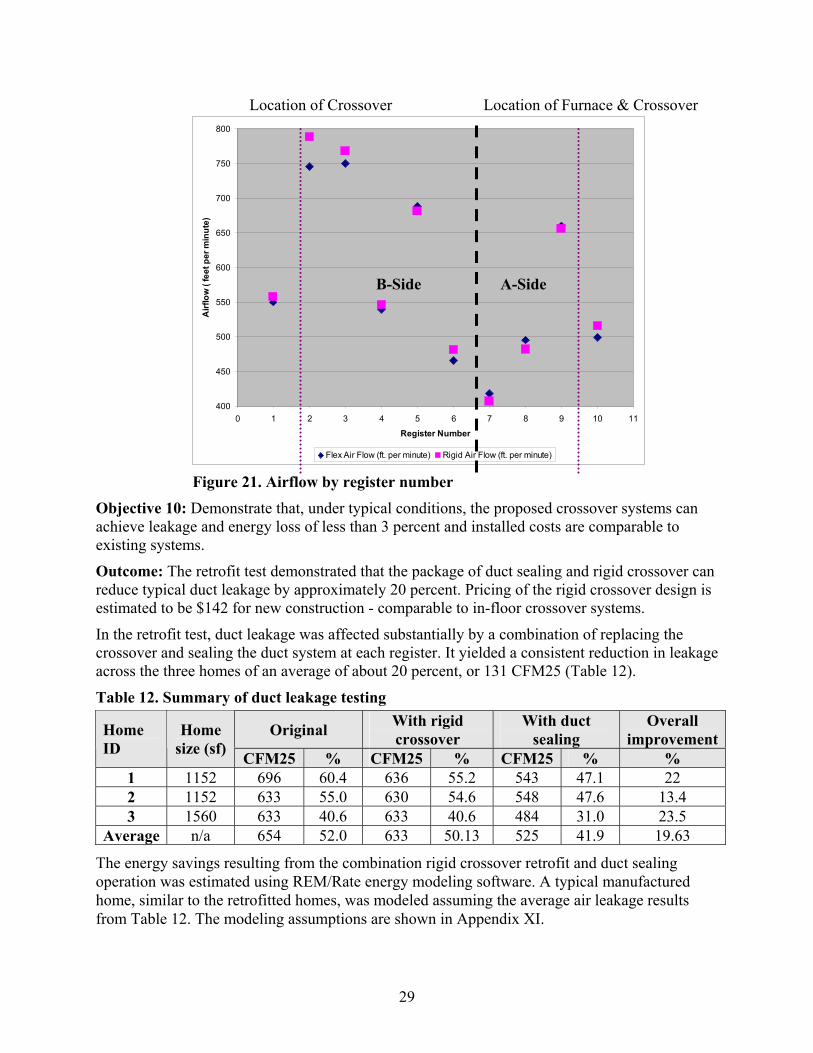
29
Location of Crossover Location of Furnace & Crossover
400
450
500
550
600
650
700
750
800
0 1 2 3 4 5 6 7 8 9 10 11
Register Number
Airf
low
( fe
et p
er m
inut
e)
Flex Air Flow (ft. per minute) Rigid Air Flow (ft. per minute) Figure 21. Airflow by register number
Objective 10: Demonstrate that, under typical conditions, the proposed crossover systems can achieve leakage and energy loss of less than 3 percent and installed costs are comparable to existing systems.
Outcome: The retrofit test demonstrated that the package of duct sealing and rigid crossover can reduce typical duct leakage by approximately 20 percent. Pricing of the rigid crossover design is estimated to be $142 for new construction - comparable to in-floor crossover systems.
In the retrofit test, duct leakage was affected substantially by a combination of replacing the crossover and sealing the duct system at each register. It yielded a consistent reduction in leakage across the three homes of an average of about 20 percent, or 131 CFM25 (Table 12).
Table 12. Summary of duct leakage testing
Original With rigid crossover
With duct sealing
Overall improvementHome
ID Home
size (sf) CFM25 % CFM25 % CFM25 % % 1 1152 696 60.4 636 55.2 543 47.1 22 2 1152 633 55.0 630 54.6 548 47.6 13.4 3 1560 633 40.6 633 40.6 484 31.0 23.5
Average n/a 654 52.0 633 50.13 525 41.9 19.63
The energy savings resulting from the combination rigid crossover retrofit and duct sealing operation was estimated using REM/Rate energy modeling software. A typical manufactured home, similar to the retrofitted homes, was modeled assuming the average air leakage results from Table 12. The modeling assumptions are shown in Appendix XI.
A-Side B-Side

30
Results of energy modeling indicate an annual energy savings of approximately two to eight MMBtu would be saved depending on the location and other characteristics of the home. Results are summarized in Table 13.
Table 13. Projected energy savings from retrofit application Annual energy use Sacramento El Toro Bakersfield Mt. Shasta Heating fuel savings (Btu/yr) 4,700,000 2,600,000 4,100,000 7,600,000 Cooling electrical savings (Kwh/yr) 29.30 29.30 29.30 29.30 Cost savings ($/yr) 50 29 51 81
Objective 11: Demonstrate that, under typical conditions, thermal comfort and air quality are superior or comparable to existing systems.
Outcome: The rigid crossover can reduce air quality and comfort problems that may result from deterioration and contamination such as that found in old crossovers removed from test homes.
In examining the old crossover ducts after removal, significant deterioration was found, especially in homes one and three where the original ducts were by and large resting on the bare ground (home two was slightly newer and had a full concrete slab). Figure 22 shows the condition of the removed ducts. When the deteriorated outer liner was removed, the fiberglass insulation fell away in small pieces, exposing holes in the inner liner. Numerous acorn husks were found embedded in the insulation, indicating that the crossover was home to squirrels or other small animals.
Figure 22. Removed crossovers showing deterioration
Site grading around homes one and three was poor. Rather than a crowned site where water would flow out from under and away from the home, the ground dropped sharply by approximately six or more inches a foot or so beyond the skirting, resulting in a large depression under the home. Nevertheless, conditions had been hot and dry for the previous week and while there was some dampness in the soil under the home, the crossover ducts were not wet.
Installing the rigid crossover had an overall modest affect on air distribution. Total air flow, as calculated by summing the anemometer readings of all registers, was slightly higher with the rigid crossover than with the existing flex crossover (Table 14).

31
Table 14. Sum of register airflow measurements in feet per minute
Home ID Original With rigid crossover With duct sealing Overall increase
1 4425 4697 4874 10% 2 2862 2882 2973 4% 3 5813 5757 6059 4%
Objective 12: Write a report containing the following information: documenting the development process, testing and evaluation results; specifications for the designs; recommended fabrication, manufacturing and site assembly procedures.
Outcome: This final project report documents the development process. Pricing of the rigid crossover design is estimated to be $142 for new construction and $388 or a retail retrofit.
Retail and wholesale costs of the retrofit are shown in Table 15. Labor is estimated at forty-five dollars per hour per person retail (the price that a homeowner would pay) or twenty dollars per hour wholesale (the hourly cost of labor to a manufactured home community or energy efficiency program). Materials costs are also shown for retail and wholesale buyers. These costs are similar to what an individual homeowner would pay for a similar retrofit. Costs would be substantially lower (probably less than half) if purchased in bulk by a community manager or efficiency program.
Table 15. Retrofit costs Item Retail Cost Wholesale Cost Labor for crossover (2 people x 1.33 hrs) $120 $53 Labor for duct sealing (2 people x 1 hr) $90 $40 Materials for crossover $178 $89 Total $388 $182
For the climates modeled, the simple payback for the retrofit ranges for a retail buyer from 4.8 to 13.4 years and for a wholesale buyer, from 2.2 to 6.3 years, depending on climate. The return on investment ranges from 7 to 21 percent at the retail level to 16 to 45 percent at the wholesale level.10 In addition to energy savings, the home’s comfort and durability are expected to be improved.
The recommended fabrication, manufacturing and site assembly procedures for the rigid crossover system are described in Appendix XII.
Objective 13: Provide the report to all manufacturers selling homes in California
Outcome: This final report will be made available to all manufacturers shipping homes to California.
Objective 14: Write a report that includes the following: a market transformation strategy suggesting an approach for moving the advanced designs into the market; a list of the prime market movers and proposed steps that can be taken to help these companies embrace and champion the system design. 10 Based on energy prices of $0.96 per therm for natural gas for heating and $0.10 (Sacramento), $0.12 (El Toro and Bakersfield) and $0.13 (Mt. Shasta) per kWh for cooling.
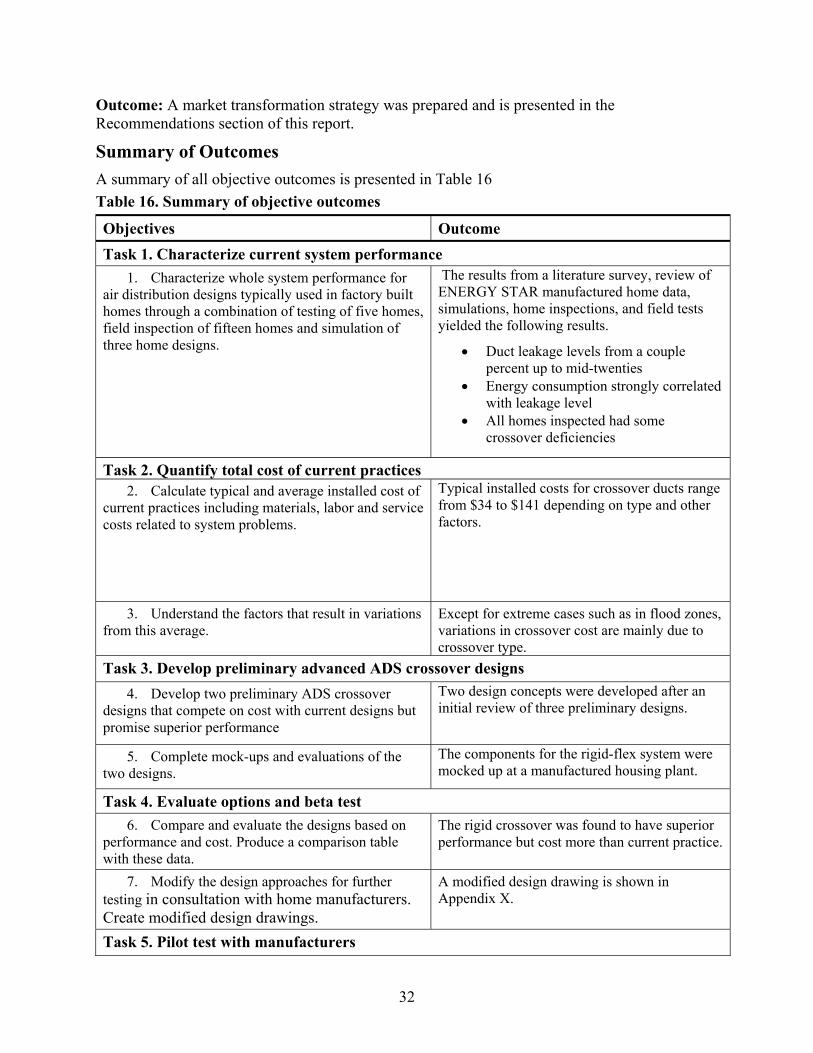
32
Outcome: A market transformation strategy was prepared and is presented in the Recommendations section of this report.
Summary of Outcomes A summary of all objective outcomes is presented in Table 16 Table 16. Summary of objective outcomes
Objectives Outcome Task 1. Characterize current system performance
1. Characterize whole system performance for air distribution designs typically used in factory built homes through a combination of testing of five homes, field inspection of fifteen homes and simulation of three home designs.
The results from a literature survey, review of ENERGY STAR manufactured home data, simulations, home inspections, and field tests yielded the following results.
• Duct leakage levels from a couple percent up to mid-twenties
• Energy consumption strongly correlated with leakage level
• All homes inspected had some crossover deficiencies
Task 2. Quantify total cost of current practices 2. Calculate typical and average installed cost of
current practices including materials, labor and service costs related to system problems.
Typical installed costs for crossover ducts range from $34 to $141 depending on type and other factors.
3. Understand the factors that result in variations from this average.
Except for extreme cases such as in flood zones, variations in crossover cost are mainly due to crossover type.
Task 3. Develop preliminary advanced ADS crossover designs 4. Develop two preliminary ADS crossover
designs that compete on cost with current designs but promise superior performance
Two design concepts were developed after an initial review of three preliminary designs.
5. Complete mock-ups and evaluations of the two designs.
The components for the rigid-flex system were mocked up at a manufactured housing plant.
Task 4. Evaluate options and beta test 6. Compare and evaluate the designs based on
performance and cost. Produce a comparison table with these data.
The rigid crossover was found to have superior performance but cost more than current practice.
7. Modify the design approaches for further testing in consultation with home manufacturers. Create modified design drawings.
A modified design drawing is shown in Appendix X.
Task 5. Pilot test with manufacturers
33
8. Prototype the modified designs in partnership with home manufacturers and industry suppliers
Installation procedures were modified based on the pilot installation.
9. Performance-test the prototypes to confirm superior performance.
The new construction test demonstrated similar air distribution performance compared to a new, well-installed flex crossover.
10. Demonstrate that, under typical conditions, the proposed crossover systems can achieve leakage and energy loss of less than 3 percent and installed costs are comparable to existing systems.
The retrofit test demonstrated that the package of duct sealing and rigid crossover can reduce typical duct leakage by approximately 20 percent. Pricing of the rigid crossover design is estimated to be $142 for new construction - comparable to in-floor crossover systems.
11. Demonstrate that, under typical conditions, thermal comfort and air quality are superior or comparable to existing systems.
The rigid crossover can reduce air quality and comfort problems that may result from the significant deterioration and contamination found in old crossovers removed from test homes.
Task 6. Quantify costs and benefits and report findings 12. Write a report containing the following
information: documenting the development process, testing and evaluation results; specifications for the designs; recommended fabrication, manufacturing and site assembly procedures.
This final project report documents the development process. Pricing of the rigid crossover design is estimated to be $142 for new construction and $388 for a retail retrofit.
13. Provide the report to all manufacturers selling homes in California
This final report will be made available to all manufacturers shipping homes to California.
Task 7. Develop a market transformation strategy 14. Write a report that includes the following: a
market transformation strategy suggesting an approach for moving the advanced designs into the market; a list of the prime market movers and proposed steps that can be taken to help these companies embrace and champion the system design.
A market transformation strategy was prepared and is presented under the Recommendations section of this report.

34
Conclusions
Objective 1. Characterize whole system performance for air distribution designs typically used in factory built homes.
Conclusion: Manufactured home air distribution performance is highly variable. ENERGY STAR homes generally perform well, especially when new. Older homes perform much worse – because they were built to lower standards and without modern methods of duct construction, and because of significant deterioration over time. This highlights the need for a lasting remedial solution for the hundreds of thousands of existing manufactured homes in California.
Objective 2. Calculate typical and average installed cost of current practices, including service costs related to system problems.
Conclusion: Costs of current systems are very low. Indeed, manufacturers have been successful in driving all excess costs out of the system, while maintaining a workable solution. The occasional crossover-duct related service call can be very expensive; however this occurrence has not been widespread enough to drive the industry to change.
Objective 3. Understand the factors that result in variations from this average.
Conclusion: Cost variations are primarily due to crossover type and to a lesser extent to home size.
Objective 4. Develop preliminary ADS crossover designs that compete on cost with current designs but promise superior performance.
Conclusion: A number of possible alternative design solutions exist, however meeting the cost criteria is challenging.
Objective 5. Complete mock-ups and evaluations of the designs.
Conclusion: The rigid crossover has promise as a well-performing, more durable solution, especially as a retrofit application.
Objective 6. Compare and evaluate the concepts based on performance, cost, manufacturability and other criteria.
Conclusion: The rigid crossover compares favorably with current system in terms of performance, durability, reliability and ease of manufacture. Its cost is similar to in-floor systems but higher than under-floor flex crossovers and somewhat more complex to install.
Objective 7. Modify the design approaches for further testing.
Conclusion: Conclusions from modifying and testing the designs are described below under objective 8.
Objective 8. Prototype the modified designs in partnership with home manufacturers and industry suppliers.
Conclusion: Conclusions for objective 8 are discussed with conclusions for objective 9 below.
Objective 9. Performance-test the prototypes at the building site and/or the laboratory to confirm superior performance.
Conclusion: Conclusions based on the prototype testing are described below.

35
Rigid Crossover In the prototype test the rigid crossover duct resulted in an increase in pressure at the registers on the B-side of the home relative to the A-side compared to a flex duct crossover. Air distribution was more evenly distributed and in general, more even air distribution is desirable.
With the blower positioned directly over the crossover opening and with a smoother and straighter crossover duct, more air flowed through the crossover and so less air was available to the A-side. By providing less resistance to air flow, the rigid crossover took air that would have fed the A-duct and supplied it to B-side duct. The higher air volume in the B-side duct increased pressure and air resistance there. The result was more even distribution of air throughout the system at a slightly lower total flow.
Is the more even distribution a significant benefit? Flow is proportional to the square root of pressure (Flow = Constant x ∆P½). A 25 percent increase in pressure in B-side registers (about what the rigid crossover achieved) yields about a 5 percent increase in flow from B-side registers. This is a minor increase and similar results may be achievable with simpler measures, such as a single elbow at the A-side crossover connection to smooth the transition into the crossover and/or turning vanes at B-side crossover connection to direct air laterally into the B-side trunk.
While the rigid duct had somewhat superior air distribution performance compared to a flex crossover, the real benefit intended by the rigid design is its installation reliability and durability. The rigid duct design is expected to suffer fewer installation problems, perform with greater consistency and not deteriorate at the same rate as the typical flex duct and is less susceptible to animal intrusion or moisture condensation problems. In order to realize this benefit, however, installation difficulties experienced in the prototype installation must first be solved. These were addressed as part of the subsequent testing in Task 5.
Gasket
In-floor through-the-rim crossover ducts can result in a well-performing system, requiring little or no labor at the site. However, a number of potential pitfalls exist that can severely compromise a through-the-rim installation. The following recommendations will help to ensure satisfactory performance of the through-the-rim crossover duct gasket seal.
The Gasket
• The gasket should have a nailing/stapling fin to avoid pinching the gasket with the fastener and thereby permitting leakage at that location.
• The gasket must be at least one inch thick (preferably thicker) so it compresses to form a seal at a one inch gap; but also must be sufficiently compressible to compress down to much smaller thicknesses without restricting the home sections from coming together.
In the Plant:
• Install the gasket such that the bulk of the gasket will be squeezed between ample sections of rim joist – not pushed out into the void below the floor. The thickest part of the gasket cross-section should be located close to the duct cut-out to form an effective seal.

36
• Overlap ends of gasket at joint around crossover duct opening to prevent leakage at seam. A joint in a linear gasket bent around the duct opening will have a tendency to leak at that location. A pre-formed rectangular gasket sized to the opening (such as the fiberboard gasket) or a linear gasket designed to form a seal by overlapping at the joint is more reliable
• Follow fastening instructions to ensure adequate connection while preventing rip-through. Wide crown staples are better suited than nails or narrow staples for fastening soft, tear-able gasket material.
• Protect the gasket during transport to avoid damage.
In the Field:
• Inspect gasket before installing home to ensure it is intact and will result in a complete seal.
• Align homes before bringing them together to avoid lateral and especially vertical movement of modules relative to each other once they are touching.
• Bring modules together tightly using proper equipment to exert enough pressure to compress gaskets.
The potential exists for gasket dislodgement that can be avoided with proper installation procedures. Likewise, proper procedures and equipment can mitigate any difficulties compressing the gasket. Dislodgement is the larger concern for crossover duct gaskets because of the severe impact of air leakage pathways directly from the duct system.
Objective 10. Demonstrate that, under typical conditions, the proposed crossover systems can achieve leakage and energy loss of less than 3 percent and installed costs are comparable to existing systems.
Conclusion: The rigid crossover can achieve superior performance compared to existing under-floor crossovers but costs are comparable to in-floor crossovers.
Objective 11. Demonstrate that, under typical conditions, thermal comfort and air quality are superior or comparable to existing systems.
Conclusion: The primary purpose of the new construction evaluation was to work out installation-related details. A number of issues were resolved and others identified that would further simplify installation on subsequent tests. Performance tests on airflow distribution were consistent with that found in the prototype tests.
All parts of the rigid crossover system are off-the-shelf and can be assembled in the field with readily available tools. The design does not alter the manufacturing processes. The diameter of the crossover collar (typically assembled in the factory) must be more accurate as the rigid elbow has offers slightly less tolerance than a flex duct. The site assembly procedures are detailed in the installation instructions in Appendix XII.
For new construction the rigid duct is a more robust and durable alternative to a standard flex duct. The rigid system is more likely to be installed properly because screws must be used to connect it to the home and because the rigid system is more difficult to kink. The rigid crossover

37
can be easily offered as an option for new homes. For higher-end homes, where the additional cost is not prohibitive, it could be a standard feature.
For retrofit on existing homes, the rigid crossover is an attractive solution for crossover replacement, particularly when combined with a duct sealing strategy. The additional installation labor for the rigid duct compared to a flex duct is negligible compared with set up and travel time, and the readily available parts make it simple to source.
Objective 12. Write a report documenting the development process, testing and evaluation results, design specifications, and recommended fabrication, manufacturing and site assembly procedures.
Conclusion: While more expensive than existing solutions and therefore more difficult for low-cost manufacturers to adopt, the proposed technology is a superior solution that has potential for higher-end plants and a market segment not originally intended – the large existing home segment.
Installing the rigid crossover is somewhat more involved than installing a standard flexible duct; however the time required is still within the range of acceptable. No change is required in the factory production process.
Objective 13. Provide the report to all manufacturers selling homes in California.
Conclusion: All home manufacturers serving California will receive the report when finalized.
Objective 14. Write a report that includes a market transformation strategy suggesting an approach for moving the advanced designs into the market; a list of the prime market movers and proposed steps that can be taken to help these companies embrace and champion the system design.
Conclusion: The market transformation strategy presented in the Recommendations section of this report is a viable approach to encouraging the adoption of the information developed in this project. Like any effort to change entrenched practices, it will require substantial resources. The existing homes segment of the strategy may be rolled into a larger effort promoting more comprehensive energy retrofits of manufactured homes, with the rigid crossover retrofit solution as one tool of many.

38
Recommendations The improved under-floor air distribution crossover design is a low cost solution that requires little retraining of installers and is ideal for both new and existing homes. The main stumbling block to wide acceptance is price—the existing flex duct designs are ultra-low cost—and recognition by the industry of its value in lowering energy use. While the new design, employing rigid duct components and more attention to connection detailing, is affordable, the cost is higher than the commonly-used flex system. Stressing the performance and durability benefits, as well as ease of installation, are key to acceptance of the new design.
A market transformation strategy This market transformation strategy addresses the two separate opportunities for effecting air distribution system performance: new home placements and retrofit/refurbishment of older, existing homes. Although the new home market was originally targeted by the development effort, representing some ten thousand California manufactured home sales in an average year, the affordability of the design, ease of installation and compatibility with original factory installed duct components, offer the prospect of improving the performance of many of the state’s more than half million older manufactured homes. New and existing homes are attractive and viable market opportunities, but they involve different industry players and marketing approaches. Strategies for reaching each market segment are discussed below.
New Homes—Empowering the Manufacturer The conventional process for new manufactured home sales is, in several key respects, quite different from the way site built homes are sold and completed. Buyers visit retail sales centers that frequently display homes from several manufacturers. These retailers are typically independent companies, not owned or controlled by a manufacturing company. Buyers purchase homes from retailers (generally a customized version of a display model) and the retailer in turn purchases the home from the manufacturer. The company building the home is, therefore, at arms length from the customer buying the home. The retailer usually arranges for home installation, contracting with the trades responsible for the completion of work at the site. The retailer may not have expertise in the finish work (including the site-completed air distribution system components) trusting the installer to complete what the manufacturer delivers.
While the separation of the retailer from the air distribution system design decisions presents challenges for changing practice (after all, the retailer would need to sell the customer on the benefits of the design), other aspects of the home completion process can work to support better practices. Here the involvement and commitment to the new system design by the manufacturer could prove decisive. Many but not all manufacturers routinely ship the site-completed duct components with the home, providing the installer with most of the materials needed to complete the air distribution system at the site. Manufacturers would simply need to be convinced that the proposed design is superior to the conventional flex duct and provide the necessary parts as ship loose with the home accompanied by installation instructions. By law, installers are required to follow the manufacturer’s installation instructions. Including the design in the instructions would add support to the transformation effort. These two steps, adopted broadly by the industry, would be sufficient to transform current practice. Finally and equally important, motivating installers, those responsible for actually assembling the system at the site, to adopt the new design, will complete the transformation effort. Although the installer can take the initiative by using the new

39
design without retailer or manufacturer encouragement, effecting market change is a more challenging transformation goal. Rather, with the installer in control of installation quality, the ultimate performance (and reputation) of the new design is in their hands.
Strategies for reaching these prime movers—manufacturers, retailers and installers—should include the following elements:
Manufacturing plants—the goal with the manufacturing plants is to turn them into advocates for the new design and, where possible, to agree to ship the required materials and installation instructions with the home. Specific strategies include the following:
• Face-to-face meetings: One of the advantages of effecting change in an industry consisting of a few relatively large companies is the ability for direct outreach. About 16 manufacturing plants produce nearly all of the state’s manufactured homes. A primary market strategy ought to be face-to-face meetings with all of these plants, describing the logic and value of the new design, furnishing information they would need to procure and assemble the components and instructions for directing the finish work at the building site for the installers. Manufacturers that don’t currently provide the ship loose air distribution system parts, would be encouraged to do so.
• Changes in the model installation requirements: Since installers are required to use the manufacturer’s installation instructions, including the new design into this document is vitally important. Most plants adopt and adapt the national Model Manufacturer’s Installation Instructions developed by MHRA in 2008. The MHRA committee responsible for updates to the manual will consider the new design as part of its regular update process.
• Media releases: Announcements in the trade and general press can be a useful tool for motivating industry to act quickly in embracing new practices. A coordinated program of media announcements is suggested. Publications that should be part of dissemination effort include: local newspapers, Automated Builder magazine, MHI NewsWire and the California Manufactured Housing Institute newsletter.
Retailers—with plants as the main drivers in getting the new design into practice, the retailers can be a valuable advocate, encouraging or requiring their installers to adopt the technology and explaining the benefits to prospective buyers. Specific strategies targeting the 200+ California-based retailers include the following:
• Briefings at industry events: Most retailers in the state are active in the state manufactured housing association, the California Manufactured Housing Institute. CMHI holds regular membership meetings around the state providing an ideal venue for reaching out to retailers and manufacturers.
• Media releases: As discussed above for manufacturing plants, articles in the trade press can be an effective supplement to face-to-face meetings and briefings.
Installers—Effectively reaching out directly to installers, typically small companies that are not members of industry groups or tied together through common networks, is best accomplished through installer training programs provided by the Department of Housing and Community Development (HCD) and the Manufactured Housing Educational Institute, the industry’s national research arm. The other logical conduit to installers is retailers that hire installers to complete new home placements. The best strategies, therefore, are those

40
outlined above: making retailers and plants the primary means for delivering guidance on changes in installation practice.
Existing Homes—Reaching Out to Communities Although the project began with the goal of improving duct practices for new homes, the technology developed can be successfully used to improve air distribution performance of existing homes. With over 535,000 families living in manufactured homes in California, the potential retrofit market is considerable and the energy savings potential enormous. Prior MHRA studies of air distribution systems in older homes have indicated that typical leakage levels are considerable and account for 15 percent and 40 percent of total heating and cooling energy use, respectively. With new construction pushing toward zero energy use (2020 state performance target), this represents a highly accessible and high return energy efficiency investment for the state and manufactured home owners.
As with new homes, the demographic profile of existing homes dictates the options for reaching out to these households and motivating owners to evaluate the benefits of replacing old duct systems. Of the existing homes, about 68 percent are in communities (the vast majority corporately-owned and operated) scattered across the state with substantial concentrations in counties with high cooling loads. The bulk of the rest of the homes are individually owned on private property. In regard to the potential retrofit market, communities are the proverbial low-hanging fruit. While communities vary in size from a few to hundreds of homes, the profile of the average community is a fairly large aggregation of homes under a single community ownership. The relatively small number of communities—4,100 in total of which about 1,700 contain the majority of manufactured homes—is manageable as a conduit for reaching a large number of homes without the need for exhaustive resources. While the homes on private property represent substantial energy savings potential, and strategies exist for reaching out to these homeowners, effectively doing so would likely be prohibitively expensive and time consuming. The focus here is on impacting homes in communities.
Communities mainly consist of individually owned homes on rented or leased lots. The majority of homeowners pay for their own energy consumption. Homebuyers, many of which are on fixed or modest incomes, would derive considerable economic benefit from reduced energy costs. Many older communities have limited electrical service; fifty or one hundred amp service is not uncommon. Reducing equipment capacity, a potential byproduct of improving the distribution system performance, would yield additional benefits.
Communities—Reaching homeowners in communities through with the assistance of community operators is the most promising marketing strategy. The following are recommended dissemination options:
• Briefings at industry events: Many communities are active in associations; the main trade organization in the state is the Western Manufactured Housing Communities Association (WMA). As with the retailers of new homes, one option is to provide briefings to association members as part of their regular meetings and provide informational brochures for distribution to the families in their communities.
• Maintenance staff training: Many communities employ part- or full-time staff to maintain homes in their community and in some cases refurbish homes at resale. Providing this staff with training and the construction information mentioned above

41
should be explored. Replacing the air distribution systems on a large scale basis (i.e., many or most of the homes in a community) would reduce the cost of installation.
• Media releases: Articles in the trade press can be an effective supplement to face-to-face meetings and briefings and many communities. Some of the larger communities have internal news outlets that are effective channels for communicating the benefits of air distribution system refurbishment.
• Dovetailing with existing retrofit programs: Several utilities with the state have retrofit programs and the funding for the state’s weatherization is growing. An effort should be undertaken to explore how the new design can be incorporated into these existing programs.
Dissemination Materials Materials that will help in the dissemination and transformation process include the following:
• For all target audiences a pamphlet describing the benefits of the innovative air distribution system.
• Construction documents describing procedures for installing the design, along with a list of materials and construction steps, information that can be included in the manufacturer’s installation instructions.
• Press releases and promotional materials describing the work and the benefits of the new design.

42
Public Benefits to California Based on the software simulations summarized earlier in this final report, savings for retrofit application in 100,000 homes (approximately 20 percent of the existing manufactured home market in California) can be estimated at 400,000 MMBtu from reduced gas heating and five gigawatt hours per year in electric cooling. This approximates to five million dollars in annual energy cost. This assumes a rough average of the energy savings data for the energy prices and climate locations simulated.
The above estimated energy savings converts to approximately 26,000 metric tons per year of carbon dioxide emissions (assuming 117 pounds per MMBtu for gas11 and one metric ton per gigawatt for electricity12).
11 From http://www.eia.doe.gov/oiaf/1605/coefficients.html, accessed May 12, 2009 12 From http://www.eia.doe.gov/cneaf/electricity/page/co2_report/co2report.html, accessed May 12, 2009

43
References Conlin, F., Davis, B., Levy, E., Tyson, J. (1996). “Air of Importance: A Study of Air Distribution Systems in Manufactured Homes,” Alternative Energy Corporation, Research Triangle Park, North Carolina.
Hales, D., Davis, B., Peeks, R., (2007). “Effect of Mastic on Duct Tightness in Energy-Efficient Manufactured Homes,” ASHRAE Transactions, Volume 113, Part 2, American Society of Heating, Refrigerating and Air-Conditioning Engineers, Atlanta, GA.
Lubliner, M., Gordon, A., Persily, A., Moyer, N., Richins, W., Blakeley, J (2003). “Building Envelope, Duct Leakage and HVAC System Performance in HUD-Code Manufactured Homes,” 23 rd Annual AIVC Conference Proceedings.
Manufactured Housing Research Alliance (2003). “Alternatives for Minimizing Moisture Problems in Homes Located in Hot, Humid Climates: Interim Report,” MHRA, New York, New York.
Moyer, N., Beal, D., Chasar, D., McIlvaine, J., Withers, C, & Chandra, S. (2001). “Moisture Problems in Manufactured Housing: Probable Causes and Cures,” ASHRAE - IAQ 2001 Conference Proceedings, San Francisco, CA, American Society of Heating, Refrigerating and Air-Conditioning Engineers, Atlanta, GA.
Tyson, J., Gu, L., Anello, M., Swami, M., Chandra, S., Moyer, N., (1996). “Manufactured Housing Air Distribution Systems: Field Data and Analysis for the Southeast,” Florida Solar Energy Center, Clearlake, Florida.
Withers, C., Moyer, N., Chasar, D., & Chandra, S. (2001). “Performance and Impact from Duct Repair and Ventilation Modifications of Two Newly Constructed Manufactured Houses Located in a Hot and Humid Climate,” Paper presented at the 13th Symposium on Improving Building Systems in Hot and Humid Climates, Houston, TX.

API-1
Appendix I
Commonly used crossover systems

API-2
Table 17. Commonly used crossover systems in multi-section homes
# System type Thermal Air Flow (No. of bends)
Robustness Durability Plant work
Field work
1
Rectangular fiberglass duct with round metal drop out (for crawlspace/ basements only)
R-4.3 Exterior
Four (4) Site-fabricated and sealed
Dependant on life of tape
Install collars
Extensive duct fabrication; install duct supports
2 Flex duct between trunk tap-outs
R-4 to R-8 Exterior
Four (4) min. plus
kinks
Two connections to collar; supports off ground
Susceptible to animals, water
Install collars
Must follow connection procedure, two (2) connections, install duct supports
3
Flex ducts between trunk tap-outs and off-set furnace (with mixing box, V-connector or Y-connector)
R-4 to R-8 Exterior
Four (4) min. plus
kinks
Four connections to collar, supports off ground
Susceptible to animals, water
Install collars and boxes
Must follow connection procedures, four (4) connections, install duct supports
4
Loop system: two through-floor ducts (fiberboard or metal) connecting trunks in each side, passing through rim
Inside thermal
envelope depending on floor
insulation configurati
on
Six (6) Dependant on gaskets
Not exposed
Reinforce floors at each location, precise opening in rim joists
May require additional pier at each location
5
Loop system: two through-floor fiberboard ducts connecting trunks in each side, with metal sleeve installed on site
Inside thermal
envelope depending on floor
insulation configurati
on
Six (6)
Dependant on sleeve installation and filed sealing
Not exposed but dependant on life of tape
Reinforce floors at each location, precise opening in rim joists
Substantial care required, may require additional pier at each location

API-3
# System type Thermal Air Flow (No. of bends)
Robustness Durability Plant work
Field work
6
One through-floor metal duct connecting trunks in each side, passing through rim
Inside thermal
envelope depending on floor
insulation configurati
on
Three (3) Dependant on gaskets
Not exposed
Reinforce floors at crossover, precise opening in rim joists
May require additional pier at crossover

APII-1
Appendix II
Field Inspection Protocol for Crossover Ducts

APII-2
Field Inspection Protocol for Crossover Ducts Inspect and test homes in the field. Select homes based on the following criteria:
• Must be multi-section homes
• At least a portion of the crossover duct must be exposed (may be in-floor with under rim portions)
• Choose homes of a variety of ages
o 2 to 5 years old: approx 5 homes
o 5 to 15 years old: approx 5 homes
o More than 15 years old: approx 5 homes
o No homes less than 2 years old
• Otherwise randomly select homes to get a range of conditions including soil types, site prep, etc.
• Choose homes scattered around the community so they are not all grouped together
Gather the following information:
1. Home data:
o Address:____________________________________________________________________________________________________________________________________________________________________________________________
o Appox. length and width of home (conditioned area only):__________________
o Number of floors:______________
o Manufacturer (if known):_____________________________________________
o Year home installed:____________
2. Type of duct system – main ducts (gather this information if possible given that you may not have access to inside the home)
o Material (circle one): metal | ductboard | flex duct | other or combination (describe)_________________________________________________________
o Configuration (circle one): trunk with in-line registers | trunk with perimeter registers | other:____________________________________________________
o Furnace location (circle one): over trunk duct | off-set | remote system | other_____________________________________________________________
3. Type of duct system – crossover ducts
o Material (circle one): metal | ductboard | flex duct | other or combination (describe)_________________________________________________________
o Crossover location (circle one): under floor | in-floor through rim | in-floor under rim) | other:_______________________________________________________
o Crossover configuration (circle one): loop | single central | offset furnace | other:____________________________________________________________
4. Thermal assessment

APII-3
o R-value of crossover duct(s):__________________________________________
o Insulation type/value on connectors (may vary - describe):__________________________________________________________________________________________________________________________
o Approximate surface area of exposed metal connectors (if any):_____________________________________________________________
5. Condition/durability assessment
o Crossover connections (if visible):
Method of connection (circle all used): mastic | tape | screws | nylon or metal ties | other (describe): ____________________________________ __________________________________________________________
Condition of connection (circle one): like new | worn but holding | starting to degrade | significant degradation | failure
Describe condition (be specific, note evidence of repairs): __________________________________________________________ __________________________________________________________
o Crossover duct (if visible)
Duct support (circle one): supported per requirements | supported inadequately | not supported
Condition of duct (circle one): like new | worn but holding | starting to degrade | significant degradation | failure.
Describe condition (be specific, note evidence of repairs): __________________________________________________________ ____________________________________________________________________________________________________________________
6. Photos (digital)
o Overall of home entry elevation
o Overall of crossover duct (if exposed)
o Detail of each crossover connection (if exposed)
APIII-1
Appendix III
Field Test Protocol for Crossover Ducts
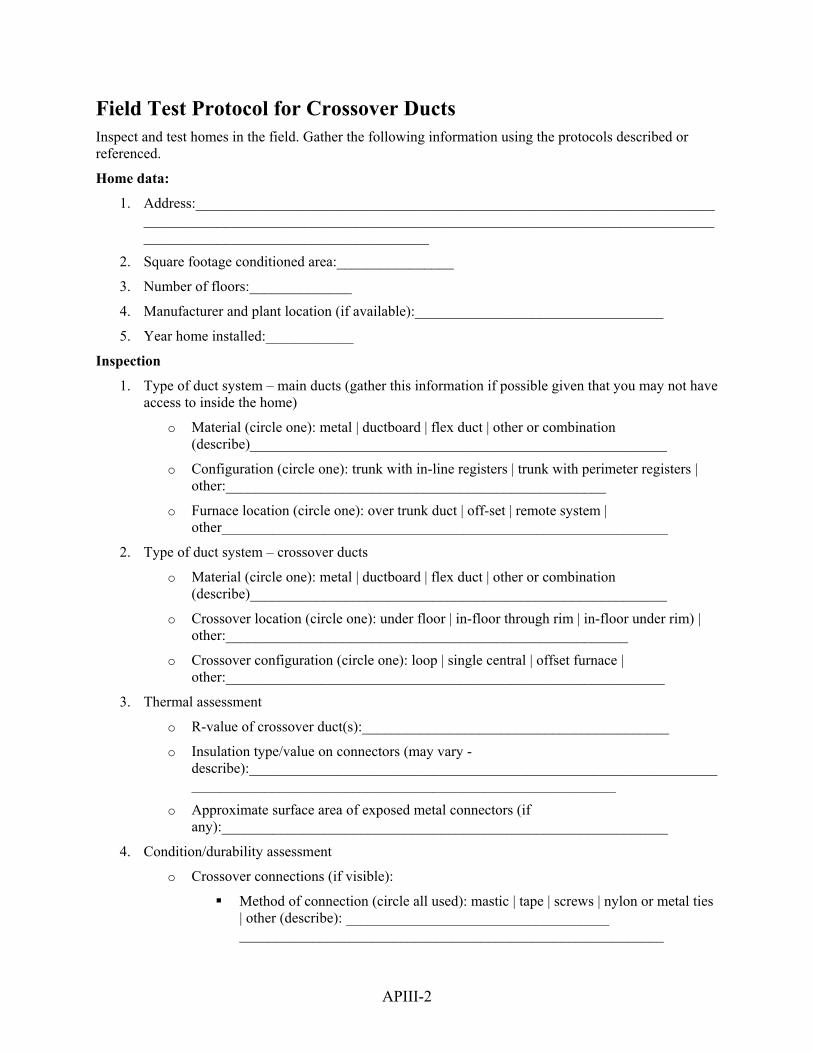
APIII-2
Field Test Protocol for Crossover Ducts Inspect and test homes in the field. Gather the following information using the protocols described or referenced.
Home data:
1. Address:____________________________________________________________________________________________________________________________________________________________________________________________
2. Square footage conditioned area:________________
3. Number of floors:______________
4. Manufacturer and plant location (if available):__________________________________
5. Year home installed:____________
Inspection
1. Type of duct system – main ducts (gather this information if possible given that you may not have access to inside the home)
o Material (circle one): metal | ductboard | flex duct | other or combination (describe)_________________________________________________________
o Configuration (circle one): trunk with in-line registers | trunk with perimeter registers | other:____________________________________________________
o Furnace location (circle one): over trunk duct | off-set | remote system | other_____________________________________________________________
2. Type of duct system – crossover ducts
o Material (circle one): metal | ductboard | flex duct | other or combination (describe)_________________________________________________________
o Crossover location (circle one): under floor | in-floor through rim | in-floor under rim) | other:_______________________________________________________
o Crossover configuration (circle one): loop | single central | offset furnace | other:____________________________________________________________
3. Thermal assessment
o R-value of crossover duct(s):__________________________________________
o Insulation type/value on connectors (may vary - describe):__________________________________________________________________________________________________________________________
o Approximate surface area of exposed metal connectors (if any):_____________________________________________________________
4. Condition/durability assessment
o Crossover connections (if visible):
Method of connection (circle all used): mastic | tape | screws | nylon or metal ties | other (describe): ____________________________________ __________________________________________________________
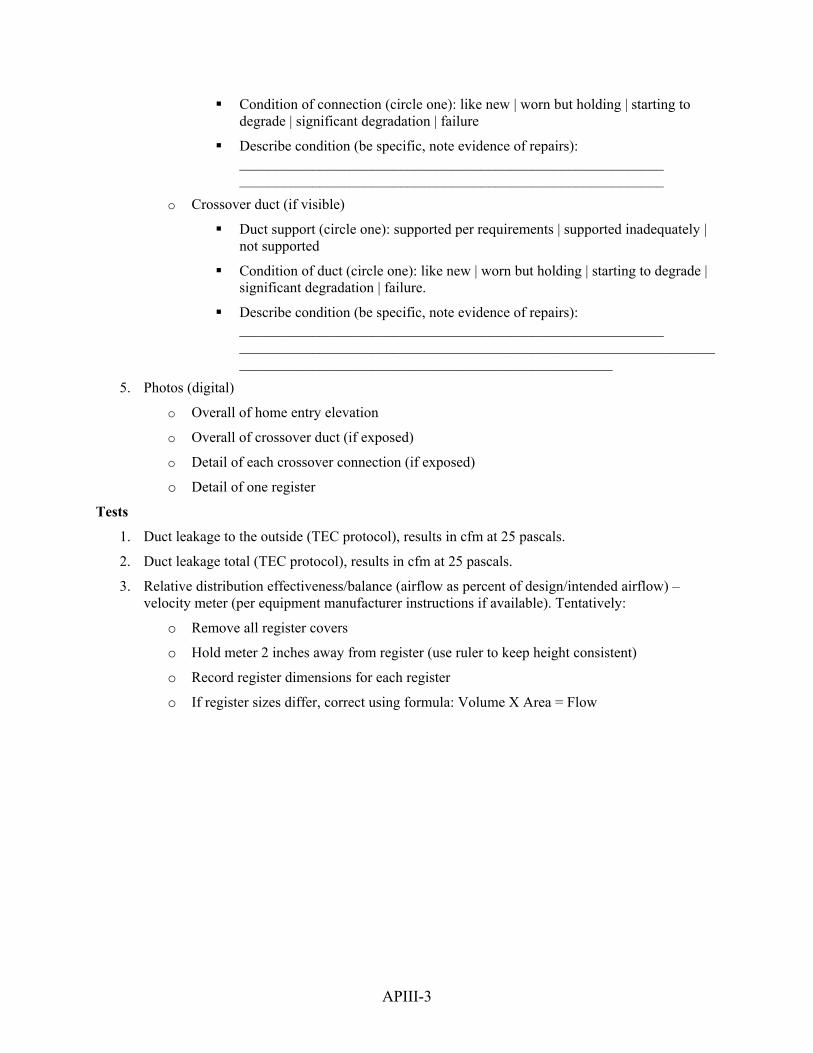
APIII-3
Condition of connection (circle one): like new | worn but holding | starting to degrade | significant degradation | failure
Describe condition (be specific, note evidence of repairs): __________________________________________________________ __________________________________________________________
o Crossover duct (if visible)
Duct support (circle one): supported per requirements | supported inadequately | not supported
Condition of duct (circle one): like new | worn but holding | starting to degrade | significant degradation | failure.
Describe condition (be specific, note evidence of repairs): __________________________________________________________ ____________________________________________________________________________________________________________________
5. Photos (digital)
o Overall of home entry elevation
o Overall of crossover duct (if exposed)
o Detail of each crossover connection (if exposed)
o Detail of one register
Tests
1. Duct leakage to the outside (TEC protocol), results in cfm at 25 pascals.
2. Duct leakage total (TEC protocol), results in cfm at 25 pascals.
3. Relative distribution effectiveness/balance (airflow as percent of design/intended airflow) – velocity meter (per equipment manufacturer instructions if available). Tentatively:
o Remove all register covers
o Hold meter 2 inches away from register (use ruler to keep height consistent)
o Record register dimensions for each register
o If register sizes differ, correct using formula: Volume X Area = Flow

APIV-1
Appendix IV
Prototype Testing Figures

APIV-2
Rigid Crossover
Figure 23. Floor system and air distribution system plan for prototype test home
Figure 24. The prototype test home set up outside the factory

APIV-3
Figure 25. Flex crossover installation
Figure 26. Poorly installed flexible crossover duct (left) and rigid crossover (right)
Figure 27. Floor plan showing crossover duct, register and pressure probe locations

APIV-4
Figure 28. Pressure probe being installed in register (left) and crossover collar (right)
Figure 29. APT connected to pressure probes (left); Duct Blaster fan connected to return air grill (right)
Through-the-Rim Gasket
Figure 30. Inside marriage walls showing varying gap sizes (photos taken by placing
camera through a light switch opening)

APIV-5
Figure 31. The front of the test jig with test specimens arrayed below
Figure 32. the rear of the jig showing the smoke blower
Figure 33. Gaps of up to one inch were tested
The following gasket types were evaluated:
• “P”-shaped gasket in use by some plants and installed with the flange facing inward (common practice) (Figure 34)
• “P”-shaped gasket installed in reverse (Figure 35) • Rectangular “T” gasket (Figure 36) • Foam pipe insulation (Figure 37) • Plastic wrapped foam square gasket (Figure 38) • Fiberboard gasket (Figure 39)
Figure 34. “P”-gasket typical installation
Figure 35. “P”-gasket reverse installation
Figure 36. Rectangular “T” gasket
Figure 37. Pipe insulation gasket

APIV-6
Figure 38. Square gasket
Figure 39. Fiberboard gasket

APV-1
Appendix V
Crossover Characterization Data

APV-2
Table 18. Duct leakage reported in the literature
Report Average High Low Note
Conlin (1996) 11.66% 20.22% 4.88% 14 homes tested in North Carolina and
New York Tyson (1996) 7.49% 26.10% 2.04% Nine homes tested in Florida and Alabama
Withers (2001) 10.7% 12.7% 8.7% Two homes set up for research study with
leakage reported before repairs were made MHRA (2003) 10% see note see note 70 homes tested primarily in the Southeast.
Hales (2007) 3.4% n/a n/a 66 homes in the Northwest built after
January 2004 Hales (2007) 7.9% n/a n/a 89 homes in the Northwest built 2001-2002
Hales (2007) 7.2% n/a n/a 150 homes in the Northwest built 1992-
1993
Notes: 1. In the MHRA study (2003), two homes with extreme duct leakage measurements (64% and
72%) were not included in the average. Approximately 23% of the homes in the sample achieved leakage to the outside of less than 5%, while 18% had leakage in excess of 15%.
2. While Moyer, et. al. (2001) does not provide leakage data, the researchers reported that in three out of the twenty-five homes inspected during the course of the project there was complete or nearly complete separation of the crossover duct.
Table 19. ENERGY STAR Manufactured Home Duct Leakage Data
Home ID Year built Crossover type
Home area (sf)
Duct leakage to outside (cfm)
Duct leakage to outside (%)
IN1 2006 In-floor 1,749 61 3.50% IN2 2006 In-floor 1,749 47 2.70% IN3 2006 In-floor 1,529 75 4.90% IN4 2006 In-floor 1,312 63 4.80% IN5 2006 In-floor 1,421 59 4.15% IN6 2006 In-floor 1,747 23 1.30% IN7 2006 In-floor 1,749 87 4.98% IN8 2006 In-floor 1,749 63 3.60% IN9 2006 In-floor 2,077 69 3.30% IN10 2006 In-floor 1,421 60 4.20% IN11 2006 In-floor 1,640 81 4.94% IN12 2006 In-floor 1,749 66 3.80% IN13 2006 In-floor 1,531 67 4.40% IN14 2006 In-floor 1,604 67 4.20% IN15 2006 In-floor 2,305 101 4.38% IN16 2007 In-floor 1,421 70 4.93%

APV-3
Home ID Year built Crossover type
Home area (sf)
Duct leakage to outside (cfm)
Duct leakage to outside (%)
IN17 2007 In-floor 1,644 79 4.80% IN18 2007 In-floor 1,644 81 4.93% IN19 2005 In-floor 1,535 76 4.95% IN20 2006 In-floor 1,749 85 4.86% IN21 2006 In-floor 1,859 71 3.80% IN22 2006 In-floor 2,305 110 4.77% IN23 2007 In-floor 1,776 91 5.12% IN24 2006 In-floor 1,800 36 2.00% IN25 2007 In-floor 1,531 70 4.60% IN26 2007 In-floor 1,859 65 3.50% A1 2006 Attic 2,356 40 1.70% A2 2006 Attic 1,984 36 1.80% F1 2006 Flex 1,440 43 2.99% F2 2006 Flex 1,920 63 3.28% F3 2006 Flex 1,056 48 4.50% F4 2006 Flex 1,754 37 2.10% F5 2006 Flex 1,722 52 3.00% F6 2006 Flex 1,802 38 2.10% F7 2006 Flex 1,450 29 2.00% F8 2006 Flex 1,296 38 2.93% F9 2006 Flex 1,605 43 2.68% F10 2006 Flex 1,476 88 5.96% F11 2006 Flex 999 53 5.30% F12 2006 Flex 1,555 44 2.80% F13 2006 Flex 1,526 32 2.10% F14 2006 Flex 1,509 38 2.50% F15 2006 Flex 2,135 26 1.22% F16 2006 Flex 960 40 4.20% F17 2006 Flex 1,096 15 1.40% F18 2006 Flex 1,404 34 2.40% F19 2006 Flex 3,116 79 2.50% F20 2006 Flex 1,230 68 5.50% F21 2006 Flex 1,241 50 4.00% F22 2006 Flex 1,116 32 2.90% F23 2006 Flex 1,407 70 5.00% F24 2006 Flex 1,228 50 4.00% F25 2006 Flex 1,421 43 3.00% F26 2007 Flex 1,859 35 1.90% F27 2006 Flex 1,206 35 2.90% F28 2007 Flex 1,590 25 1.60% F29 2006 Flex 1,440 35 2.40%

APV-4
Home ID Year built Crossover type
Home area (sf)
Duct leakage to outside (cfm)
Duct leakage to outside (%)
F30 2007 Flex 1,431 43 3.00% F31 2007 Flex 1,594 44 2.76% F32 2007 Flex 1,469 44 2.98% F33 2007 Flex 2,076 40 1.93% F34 2007 Flex 1,748 50 2.86% F35 2007 Flex 1,290 40 3.10% F36 2007 Flex 1,564 40 2.56% F37 2007 Flex 1,264 52 4.10% F38 2005 Flex 1,461 83 5.68%
Home Inspection Photos and Data
Figure 40. Duct supported off the ground with nylon strapping (left); duct resting on wood blocks and ground due to lack of vertical clearance under home (right)
Figure 41. Duct compressed to pass under gas line (left); flex ducts connected to metal branch connector in triple section home (right) – neither duct is properly supported off ground due to lack of clearance

APV-5
Figure 42. Replacement duct can be seen behind the old duct left lying under the home (left); a nylon tie can bee seen on the near connection, although at far side a sharp bend kinks the duct (right)
Figure 43. Duct blaster connected to furnace for testing (left); velocity meter used to measure relative airflow through registers (right)
Figure 44. One of the triple-section (left) and double-section (right) homes tested

APV-6
Table 20. Crossover duct inspection results
Home ID
Home age
(yrs)
Crossover type Condition Observations
I1 <1 Multiple flex ducts to offset furnace
New Tight crossover connections, duct not supported off ground due to limited clearance
I2 <1 Multiple flex ducts to offset furnace
New
Duct supported off ground for most part, , but low clearance prevented in some areas; obstructions in crawlspace compressed duct
I3 8 Flex under floor
Duct like new; connection worn but holding
Crossover duct recently replaced; metal collar poorly insulated; duct supported inadequately
I4 8 Flex under floor
Duct and connections worn but holding
Duct supported adequately; tape only used for connection
I5 8 Flex under floor with offset furnace
Duct worn but holding; connection starting to degrade
Substantial amount of exposed metal connectors; duct supported inadequately
I6 9 Flex under floor Worn but holding Duct not supported; not restricted
I7 2 Flex under floor Like new Duct not supported; not restricted
I8 15 Flex under floor Like new Supported on blocks; appears
duct has been replaced
I9 3 Flex under floor; offset furnace
Worn but holding Supported on blocks; tape only connection
1I0 16 Flex under floor Starting to degrade
Loose connections; damp; restricted airflow; tape only connection
I11 5 Flex under floor Worn but holding Restricted airflow; tape only
connection; not supported
I12 6 Flex under floor
Duct starting to degrade; connections worn but holding
Duct laying in water
I13 8 Flex under floor
Duct worn but holding; connections starting to degrade
Duct not supported (laying on damp ground); tape only connection – tape needs replacement
I14 6 Flex under Starting to degrade Duct wet; not supported; tape

APV-7
Home ID
Home age
(yrs)
Crossover type Condition Observations
floor only connection – tape needs replacement
I15 2 Flex under floor Like new Duct properly supported with
straps; tape only connections
Table 21. Duct system testing results
Home ID
Year built
Home type Observations
Duct leakage
total
Duct leakage
to outside
T1 2008
Three section, offset furnace
Tight crossover connections; duct not supported off ground due to limited clearance; good air supply balance.
9.1% 6.5%
T2 2008
Three section, offset furnace
Duct not supported off ground due to limited clearance, obstructions in crawlspace compressed duct.
15.6% 13.8%
T3 2000 Two section
Crossover duct recently replaced; metal collar poorly insulated; duct supported inadequately; good air supply balance between sides of the home.
15.3% 11.5%
T4 2000 Two section
Duct supported adequately; tape only used for connection; poor air supply balance with the side of the home with the furnace receiving 70% of the air.
28.6% 21.7%
T5 2000
Two section offset furnace
Substantial amount of exposed metal connectors; duct supported inadequately; low airflow from registers due to high leakage.
15.7% 13.2%

APVI-1
Appendix VI
Crossover Cost Data

APVI-2
Current Crossover Duct Material and Labor Costs Table 22. System 1: In-floor loop system crossover with fiberboard ducts - cost details
Item type Item description Cost
Component Duct board 6” X 18” X 120” 4318-R4 – 176 square feet $111.23
Component Crossover sleeve 4-3/8” X 15-7/8” X 6" – 4 units $11.24
Component 2 X 4 X 12' #3 SPF (lumber for reinforcing rim joists) – 5.34 board feet $1.92
Component 2 X 6 X 12' #2 SPF (lumber for reinforcing rim joists) – 2.68 board feet $1.05
Component Tape H1 heat aluminum 2.5" X 60' – 1 roll $8.98
Plant labor 1/3 labor hours at rate of $20.00 per hour (total cost of employee) $6.67 Site labor Negligible $0.00
Total $141.09 Table 23. System 2: Under-floor flex system crossover - cost details
Item type Item description Cost
Component Duct connector crossover collar – 2 units $7.38
Component Crossover flex duct 12” X 25' R-4 – 1 unit $23.65 Component Nylon straps for duct – 2 units $0.78
Plant labor 1/6 labor hours at rate of $20.00 per hour (total cost of employee) $3.33 Site labor ¾ labor hours at rate of $20.00 per hour (total cost of employee) $15.00
Total $50.14 Table 24. System 3: In-floor single crossover with metal ducts - cost details
Item type Item description Cost
Component Heat duct coil 21" – 18 linear feet $11.70
Component Heat duct coil combination 20"/21" – 18 linear feet $10.75 Component 5X14 Duct board gasket – 2 units $1.82
Component 2 X 4 X 12' #3 SPF (lumber for reinforcing rim joists) – 5.34 board feet $1.92
Component 2 X 6 X 12' #2 SPF (lumber for reinforcing rim joists) – 2.68 board feet $1.05
Plant labor 1/3 labor hours at rate of $20.00 per hour (total cost of employee) $6.67 Site labor Negligible $0.00
Total $33.91

APVI-3
Crossover Service Costs Service cost can dwarf the material and labor costs of the crossover duct. A reduction in the number of service problems may justify an additional expenditure for a more durable or reliable crossover duct system. Service costs related to the air distribution system were gathered from 17 plants for the year 2007.
Table 25. Service related to crossover duct problems
Plant ID Crossover type No. of homes Repair cost* Service issue
1 Loop, fiberboard ducts 6 $1,285.83 Crossover duct
2 $175.03 Crossover duct 2 Flex, under floor
6 $253.13 Unbalanced airflow 3 Flex, under floor 5 $500.04 Unbalanced airflow
1 $156.40 Crossover duct 4 Thru-floor, metal
ducts 25 $4,951.39 Unbalanced airflow 5 Flex, under floor 2 $240.00 Crossover duct 6 Flex, under floor 1 $151.00 Crossover duct 7 Flex, under floor 12 $1,088.40 Crossover duct 8 Flex, under floor 5 $324.00 Crossover duct 9 Flex, under floor 1 $35.00 Crossover duct 10 Through the rim 22 $1,291.40 Crossover duct 11 Flex, under floor 1 $60.00 Crossover duct 12 Flex, under floor 13 $1,014.00 Crossover duct 13 Flex, under floor 33 $1,122.00 Crossover duct 14 Flex, under floor 6 $928.20 Crossover duct 15 Flex, under floor 9 $360.00 Crossover duct 16 Through the rim 17 $2,033.20 Crossover duct 17 Flex, overhead 7 $237.30 Crossover duct
* Repair costs include labor and materials at the site; they do not include travel costs to get to and from the site.
Note that plant service data typically only reflects recently installed homes. Crossover duct problems may develop one or more years afterward if connections or supports were not properly made or installed. These problems, if discovered, would likely be repaired by local contractors and not reported to the plant.

APVII-1
Appendix VII
Design Process

APVII-2
Multiple Flex Duct Crossovers This design utilizes multiple flexible crossovers run from a trunk duct in the furnace side (A-side) directly to perimeter or centerline registers in the far side (B-side) (Figure 45). The crossovers are sized according to their distance from the furnace and the size of the area served. Each crossover arrives at the site in two sections, pre-installed in the home. The section in the A-side is connected to the trunk duct at one end and terminates at the marriage line. The section in the B-side is connected to a register at one end and terminates at the marriage line at the other end.
For shipping, the marriage-line ends of the crossover ducts are pushed into the floor cavity near the marriage line. The installer accesses them through an access point in the bottom board (ideally without cutting the bottom board) and joins them under the marriage line using a simple connection method not requiring specialized skills or tools). Table 266 summarizes the main advantages and disadvantages of this design.
Figure 45. Multiple crossover system (showing through-rim crossovers with perimeter registers) Table 26. Advantages and disadvantages of the multiple crossover system concept
Advantages Disadvantages − Direct air pathway from A-side trunk to
B-side register − Only one trunk duct − Short exposed (under the home) crossover
length would not need site-installed support
− Kinks and excess length not likely to be a problem
− Bends are gradual in flex duct
− Installer must know about and locate numerous crossover ducts
− The bottom board must be sealed at access points
− Exposed crossover duct sections should be insulated
− More labor required on the production line (as opposed to off-line labor to assemble trunk ducts)

APVII-3
Reviewer Comments • Graduated trunk duct would be required for this type of system. • On paper, I think that it would perform relatively the same or better as an air distribution
system. I would expect far worse issues with installation. The crossover connections are a primary concern and adding crossovers will likely result in air leaks and reductions of flow that would affect performance.
• Based upon experience testing duct systems, many of our plants currently have issues connecting flex ducts, so compounding this with flex duct connections at crossovers may be a service nightmare. However, this could also be relative to the type of product being produced. The higher-end plants that frequently use perimeter flex ducts are experienced in these connections and may not have any issues with this type of system. The one item that would need to change would be the size of the main trunk.
• It does seem like a lot more potential for error (compared to a single flex crossover between two trunks), but I would think the air distribution would be better than what we are currently providing (assuming the one main trunk is increased in size) because all of the air is being distributed from one trunk instead of connecting two trunks and distributing air from each of these. The multiple flex system is one step closer to a graduated duct because the flex ducts closest to the furnace could be small and increase in diameter as they move further away.
• [Variation on concept] The flex connections could be made in the plant at the register location and the excess could be left in the belly of the floor containing the register. The site installer could then attach the excess flex to the main trunk on site, preventing an extra "crossover" connection. However, this would require a thorough site installer to make the connections properly, again probably relative to the type of product (i.e., price point of the home).
• Requires more labor/time on main line whereas traditional trunk duct is built off-line. Total labor content may be similar.
Pan In-Floor Crossover This design uses dual in-floor crossovers configured in a loop (one crossover at each end of the main trunk ducts) or a single central in-floor crossover. The crossovers terminate with a special fitting at each side of the rim joist (Figure 46). The special fitting directs air downward through an opening in the bottom board. The installer connects the special “pan” fitting to bridge between the two sections of crossover. Table 27 summarizes the main advantages and disadvantages of this concept.

APVII-4
Figure 46. Pan system detail at rim joist
Table 27. Advantages and disadvantages of the pan system concept Advantages Disadvantages
− Accessible, repairable crossover connection location
− Short, rigid exposed crossover length self supported
− Kinks and excess length not a problem − Does not penetrate rim joist
− Relies on installer to make good connection − Space constraints (limited cross sectional
area of in-floor crossover) not addressed − Exposed pan must be insulated − Costly components (currently)
Reviewer Comments • Insulating and sealing the pan protruding under the home may be difficult and result in a
weak point in the system. • Difficult to ship the pan with a gasket pre-installed because it may not stay on during
shipping.
Reviewer Comments on In-Floor Systems Generally • Ideally you would want a larger cross sectional area for the crossover than is commonly
used. The size of the plant’s metal duct rolling machines constrains potential duct cross sectional area.
• Furnaces available to industry provide 1100 or 1200 cfm of airflow, larger than the 800 cfm needed for many homes. The higher cfm requires larger ducts. If smaller blowers were available, smaller duct sizes may work, alleviating difficulties with through-rim crossovers.
• With a loop system, the closer the in-floor crossovers are to the end of the house, the better the air balance. With a single crossover, the crossover should originate under the furnace.

APVII-5
• One manufacturer uses an in-floor crossover under the furnace with a special fitting to join furnace, trunk and in-floor crossovers.
Flex Duct with Improved Connector and Support System This concept would employ the traditional flex duct crossover Figure 47 with special fittings or hardware at the connection points to ensure an easy, reliable and durable connection. Fitting options may include a snap-fit or screw-on connection or utilize a special clamp ( Figure 48). Support straps would be connected at the plant to the bottom of the home at the appropriate locations. Table 28 summarizes the main advantages and disadvantages of flex connector design.
Figure 47. Flex duct crossover with improved connector
Figure 48. Clamp duct connector
Table 28. Advantages and disadvantages of the improved flex connector concept Advantages Disadvantages
− More robust and error-proof connection − More likely to be supported properly if
support straps are pre-installed under home − Minimal change to existing practice in plant
and field − Simpler to install in the field
− Does not address increased height requirements of under-floor systems
− Integral support system will still need to be attached by installer and may not be in the right location if piers affect crossover route
− May be subject to excess length and kinking problems
− Connector will add cost − May complicate cutting flex to length if
fittings are pre-connected to the ends of the flex duct
Reviewer Comments • A clamp connector would likely be very expensive relative to the benefits. • This concept only addresses the connection issue and leaves other problems with under-
floor flex unaddressed.

APVIII-1
Appendix VIII
Rigid Crossover Prototype Test Data

APVIII-2
Table 29. Summary of pressure data
X-over Speed Air H Supply
A X In
X Out
Supply B1
Supply B2
Supply B3
Supply B4
CFM
X out - X in
Flex bad (Oct 27)
hi -171 20 13 53 6 7 8 8 1122 40
Flex good
(Oct 27) hi -177 17 14 47 7 8 9 9 1125 33
Flex good
(Oct 28) hi -177 16 13 43 9 10 11 12 30
Rigid (Oct 27)
hi -165 12 19 40 10 11 12 13 20
Rigid (Oct 28)
hi -189 12 17 35 9 10 11 12 1050 18
Rigid (Oct 27)
hi2 -175 13 18 36 9 11 12 13 18
Flex bad (Oct 27)
med -149 16 10 41 5 5 6 6 990 31
Flex good
(Oct 27) med -124 13 11 39 5 6 7 7 1030 28
Flex good
(Oct 28) med -144 12 9 34 6 7 7 8 25
Rigid (Oct 27)
med -127 9 14 30 7 8 9 10 16
Rigid (Oct 28)
med -149 10 14 30 7 8 9 10 930 15
Flex bad (Oct 27)
lo -113 12 8 30 4 4 5 5 845 22
Flex good
(Oct 27) lo -115 10 8 27 4 5 5 5 859 19
Rigid (Oct 27)
lo -91 7 11 23 6 7 8 8 12
Rigid (Oct 28)
lo -120 7 10 21 5 6 7 7 11

APIX-1
Appendix IX
Gasket Test Photos

APIX-2
“P”-shaped gasket typical installation (nail fin on opening side of gasket)
1” gap showing extensive leakage
½” gap showing leakage where gasket has squeezed away from joist
¼” gap showing localized leakage from left lower corner
“P”-shaped gasket reverse installation (nail fin away from duct opening)
1” gap showing leakage at gasket joint
1/2” gap showing leakage at gasket joint
1/4” gap showing slight leakage at gasket joint
Custom fabricated rectangular “T” gasket
1” gap showing extreme leakage
½” gap showing extreme leakage
1/4” gap showing localized leakage at lower left

APIX-3
Foam pipe insulation
Not Tested
1” gap was not tested due to extreme leakage at ½”
½” gap showing extreme leakage at fastener locations
1/4” gap showing no leakage
Plastic wrapped foam square shaped cross sectional gasket
1” gap showing slight leakage
½” gap showing minimal leakage
1/4” gap showing no leakage
Rectangular fiberboard gasket
1” gap showing some leakage
½” gap showing slight leakage
3/8” gap showing minimal leakage
Figure 49. Gasket air tightness testing photos

APX-1
Appendix X
Design Drawing

APX-2
Support strap
26 Gauge round metal duct
Flex duct inner linerFlex duct outer liner Flex duct insulation
26 Gauge metal elbow
Trunk duct (by homemanufacturer)
Crossover collar (by homemanufacturer)
Sheet metal screw(3 min.)Nylon tie
Foil Tape
Nylon tie
Sheet metal screw (3 min.)
End of metal duct
End of flex ductinner liner
Figure 50. Rigid Crossover Design Drawing

APXI-1
Appendix XI
Energy Analysis Assumptions

APXI-2

APXI-3

APXI-4

APXI-5

APXI-6

APXI-7

APXI-8

APXI-9

APXI-10

APXI-11

APXI-12

APXII-1
Appendix XII
Rigid Crossover Installations Instructions

APXII-2
Rigid Crossover Duct – Installation Procedure
For installation on new homes or to replace existing crossover ducts You will need the following materials:
• Metal duct elbows – diameter to match crossover collar (2)
• Round metal pipe duct diameter to match crossover collar; length determined below (2);
• Flex duct – diameter to match crossover collar; length sufficient to reach between collars (per step 1).
• Duct support strap and saddles (4)
• Listed foil tape for duct (1 roll)
• Sheet metal screws for ducts (1 box)
• Nylon ties sufficient length to wrap around duct (4) and nylon tie applicator tool
Prepare the home as follows:
• For existing homes, remove existing crossover duct – do not damage or bend existing crossover collars or bottom board.
• For new homes, remove temporary shipping cover over dropout collars.
• Remove any tape around edge of collar if it impedes attachment of elbow.
• Make sure crossover collar is secured to trunk and does not rotate or move. Install fasteners if necessary.
Installing the Rigid Duct
The completed crossover should look similar to the drawing below:
A-Side B-Side
Trunk ductCrossover collar
Flex duct
Furnace/ Air-handler
Rigid elbow
Round metal ductSupport straps
1. Determine the overall length needed for the crossover duct(s). This is the distance
between crossover collars plus any additional length needed to bend around any obstructions.
2. Determine component lengths. Plan on at least one foot between ends of the pipe ducts (to be bridged by flex duct). If the overall crossover length is less than approximately

APXII-3
twelve feet, than trim one of the pipe ducts (or use a two-foot piece). If cutting a pipe duct, do so while still flat – BEFORE seaming it into a tube.
3. After trimming the pipe duct to length, bend the duct into a tube bringing together the two grooves to slide and lock with a ‘click’, so that the joint resists being pulled apart.
Cutting pipe duct to length
Fastening elbow to pipe duct Taping joint between elbow
and pipe duct
4. Connect the crimped end of each elbow to the smooth end of each pipe duct. Secure with at least three screws and seal the joint with foil tape.
5. Take the flexible duct and, pushing back the insulation and outer liner from one end, pull the inner liner over one end of pipe duct at least one foot. Tape the end of the liner to the pipe duct and fasten a nylon tie around the liner approximately two inches in from the end of the pipe duct.
6. Slide the insulation and outer liner along the pipe duct towards the attached elbow, exposing the other end of the flex duct inner liner.
7. Determine the length of inner liner needed to bridge the gap between pipe ducts and add approximately one foot. Cut the second end of the inner liner to this length and fasten it to the end of the second pipe duct using tape and a nylon tie as above.
8. Pull the flex duct insulation and outer liner over the pipe duct and elbow on each side. Place the insulation seam on the upper side of duct (curved concave at the elbow).Check that the resulting length is that which was planned for in Step 1.
Inner liner connected to pipe duct with tape and nylon tie
Pulling flex duct insulation
over pipe duct Insulation and outer liner of flex duct covering rigid duct
9. Slide entire crossover assembly into position under the home such that each elbow is below a crossover collar. (Note: if necessary, to avoid obstructions under home, assembly may be angled laterally/bent as needed.)
10. Slide one elbow over the crossover collar to overlap as far as possible.

APXII-4
11. With elbow/pipe temporarily supported on blocks/boards, install minimum 3 sheet metal screws through pre-drilled holes in elbow, into crossover collar.
12. Bring the insulation up over the crossover collar. Push crossover duct insulation into the floor cavity. Temporarily duct tape it against the base of the trunk duct.
13. Pull the outer liner of the flex duct over the top of the flex duct insulation and temporarily secure it to the ductwork with duct tape.
14. Place a nylon zip tie over the crossover collar to permanently secure the insulation and outer wrap.
15. Seal the bottom board to the crossover duct with bottom board tape (and mastic if available).
16. Follow the same procedure for the other end(s) of the crossover. There should not be excess length of flexible duct in the system.
17. Once installed, the crossover duct must not touch the ground. Nylon or metal straps and saddles may be used for support. If clearance is not sufficient for straps, rigid foam insulation board may be placed between the ground and the crossover duct. Support the crossover duct near the mid-point of each pipe duct and once near the center of the flexible portion of the crossover duct at a minimum.
Assembled rigid duct
Screwing elbow to crossover
collar Completed connection to
home
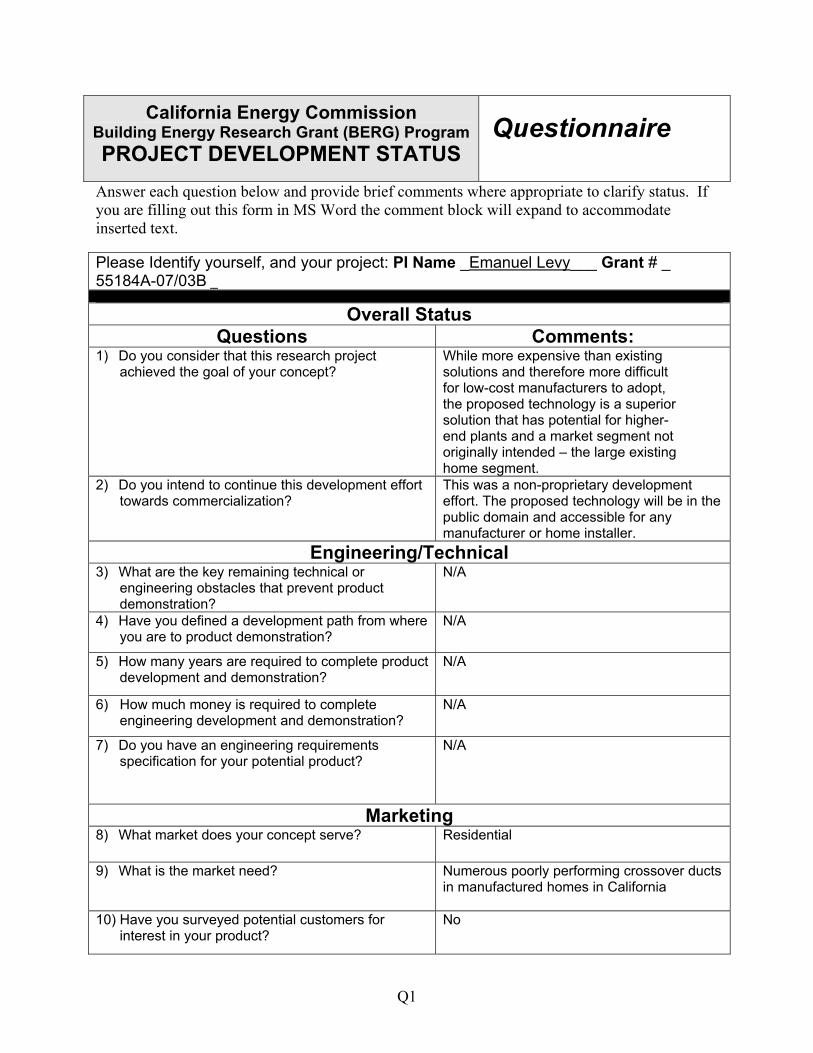
Q1
California Energy Commission Building Energy Research Grant (BERG) ProgramPROJECT DEVELOPMENT STATUS
Questionnaire
Answer each question below and provide brief comments where appropriate to clarify status. If you are filling out this form in MS Word the comment block will expand to accommodate inserted text. Please Identify yourself, and your project: PI Name _Emanuel Levy___ Grant # _ 55184A-07/03B _
Overall Status Questions Comments:
1) Do you consider that this research project achieved the goal of your concept?
While more expensive than existing solutions and therefore more difficult for low-cost manufacturers to adopt, the proposed technology is a superior solution that has potential for higher-end plants and a market segment not originally intended – the large existing home segment.
2) Do you intend to continue this development effort towards commercialization?
This was a non-proprietary development effort. The proposed technology will be in the public domain and accessible for any manufacturer or home installer.
Engineering/Technical 3) What are the key remaining technical or
engineering obstacles that prevent product demonstration?
N/A
4) Have you defined a development path from where you are to product demonstration?
N/A
5) How many years are required to complete product development and demonstration?
N/A
6) How much money is required to complete engineering development and demonstration?
N/A
7) Do you have an engineering requirements specification for your potential product?
N/A
Marketing 8) What market does your concept serve? Residential
9) What is the market need? Numerous poorly performing crossover ducts
in manufactured homes in California
10) Have you surveyed potential customers for interest in your product?
No

Q2
11) Have you performed a market analysis that takes external factors into consideration?
No
12) Have you identified any regulatory, institutional or legal barriers to product acceptance?
None exist
13) What is the size of the potential market in California for your proposed technology?
Approx 10,000 new manufactured homes per year (based on three-year average manufactured home shipments to California from Institute for Building Technology and Safety; http://www.census.gov/const/mhs/stship.html) and 500,000 existing homes (Statistics & Figures on Mobilehomes, Manufactured Homes and Mobilehome Parks in California from http://sinet2.sen.ca.gov/mobilehome/)
14) Have you clearly identified the technology that can be patented?
No
15) Have you performed a patent search? No
16) Have you applied for patents? No
17) Have you secured any patents? No
18) Have you published any paper or publicly disclosed your concept in any way that would limit your ability to seek patent protection?
N/A
Commercialization Path 19) Can your organization commercialize your
product without partnering with another organization?
N/A
20) Has an industrial or commercial company expressed interest in helping you take your technology to the market?
N/A
21) Have you developed a commercialization plan? N/A
22) What are the commercialization risks? N/A
Financial Plan 23) If you plan to continue development of your
concept, do you have a plan for the required funding?
N/A
24) Have you identified funding requirements for each of the development and commercialization phases?
N/A
25) Have you received any follow-on funding or commitments to fund the follow-on work to this grant?
No. None sought.

Q3
26) What are the go/no-go milestones in your commercialization plan?
N/A
27) How would you assess the financial risk of bringing this product/service to the market?
N/A
28) Have you developed a comprehensive business plan that incorporates the information requested in this questionnaire?
No
Public Benefits 29) What sectors will receive the greatest benefits as
a result of your concept? Residential
30) Identify the relevant savings to California in terms of kWh, cost, reliability, safety, environment etc.
Based on software simulations (assumptions provided in final report), savings for retrofit application in 100,000 homes (approximately 20 percent of the market) can be estimated at 400,000 MMBtu from reduced gas heating; five gigawatt hours per year in electric cooling; and five million dollars in energy cost (assuming a rough average of the locations simulated in the final report).
31) Does the proposed technology reduce emissions from power generation?
The above estimated energy savings converts to approximately 26,000 metric tons per year of carbon dioxide emissions (assuming 117 pounds per MMBtu of gas (http://www.eia.doe.gov/oiaf/1605/coefficients.html) and 1 metric ton per gigawatt for electricity (http://www.eia.doe.gov/cneaf/electricity/page/co2_report/co2report.html).
32) Are there any potential negative effects from the application of this technology with regard to public safety, environment etc.?
No
Competitive Analysis 33) What are the comparative advantages of your
product (compared to your competition) and how relevant are they to your customers?
1. Durability 2. Energy efficiency 3. Simple product sourcing Durability and energy efficiency are highly relevant to a portion of the market.
34) What are the comparative disadvantages of your product (compared to your competition) and how relevant are they to your customers?
1. Higher cost 2. Additional labor 3. New technology requires learning curve Cost is highly relevant to a portion of the market.
Development Assistance The BERG Program may in the future provide follow-on services to selected Awardees that would assist them in obtaining follow-on funding from the full range of funding sources (i.e. Partners, PIER, NSF, SBIR, DOE etc.). The types of services offered could include: (1) intellectual property assessment; (2) market assessment; (3) business plan development etc. 35) If selected, would you be interested in receiving
development assistance? No