facts 2015 - forsiden · facts 2015 energy and water resources in norway facts ... 3 .2 energy...
TRANSCRIPT

ENERGY AND WATER RESOURCES IN NORW
AYFACTS
2015
ENERGY AND WATER RESOURCES IN NORWAY
FACTS2015
Published by:The Ministry of Petroleum and Energywww.regjeringen.no/oedPublic institutions can place bulk orders with:Government Administration ServicesInternet: www.publikasjoner.dep.noE-mail: [email protected]: +47 22 24 20 00ISSN: 0809-9464Publication code: Y-0102/9ELayout and printing: 07 Media, 02/2015Circulation: 2000

ENERGY AND WATER RESOURCES IN NORWAY
FACTS2015

2
Editor: Kjersti Aarrestad, Liv Mari HatlenEditing completed: December 2014
Design: iteraGAZZETTE
Cover photo: Front and back: KvilesteinsvatnetPhoto: Statkraft
Layout and printing: 07 MEDIACirculation: 2000
Publication code: Y-0102/9E
Photos Facts 2015:
Chapter 1Chapter start page 7: Ytre Alsåker power station, HordalandPhoto: Pål Martin Sand / Ministry of Petroleum and Energy
Chapter 2Chapter start page 23: SolbergfossPhoto: E-CO Energi
Chapter 3Chapter start page 33: FireplacePhoto: ColourBox
Chapter 4Chapter start page 47: Street in SkrovaPhoto: Hilde Totland Harket
Chapter 5Chapter start side 51: BergenPhoto: Scandinavian Stockphoto
Chapter 6Chapter start page 59: Salmon runPhoto: iStock Photo
Chapter 7Chapter start page 63: Historical turbines, TyssedalPhoto: Statkraft
Appendices:Chapter start page 69: Norwegian windpowerPhoto: iStock Photo
3FORORD
We were able to start building the Norwegian society of today when we learnt to use rivers and waterfalls to produce electric-ity. Hydropower has provided the basis for Norwegian industry and the development of a welfare society ever since the late 1800s. This is a long and proud tradition.
Hydropower is still the mainstay of our power supply system, with other renewable energy sources such as wind and bioen-ergy providing an important supplement. In the public debate, we often hear that Norway must become greener and make a transition to greater use of renewable energy. In fact, Norway is already leading the way in this field, since almost all our electricity production is based on renewable sources. Our power resources have been crucial for value creation, welfare and growth in Norway for over a hundred years, and will continue to play a vital role in future.
But this will require continued development of renewable energy sources and steps to ensure that we always have an effec-tive and satisfactory electricity grid and other infrastructure. It is not enough to generate electricity; it must also be distributed to consumers. All important societal functions, all branches of
business and industry and all households are dependent on a well-functioning electricity supply system and reliable electric-ity supplies. We must therefore ensure that the electricity grid is properly maintained and expanded to meet the challenges of the future.
Developing the electricity grid involves more than building pylons and cables. Consumers, institutions and the business sector must be able to rely on having the power they need when they need it, and it must be possible to feed new renewable power into the grid. As we build the grid, we are building the country too.
This publication is intended to give an overview of energy pro-duction, transmission and consumption in Norway. It includes a review of the national regulatory framework for energy supplies and the most important legislation for the public administration. It is an updated version of the 2013 edition.
Norwegian petroleum activities are described in a separate fact sheet published by the Ministry of Petroleum and Energy and the Norwegian Petroleum Directorate.
Minister of Petroleum and Energy
PREFACETord LienMinister of Petroleum and Energy

4
INNHOLD
1 FRAMEWORK, ORGANISATION AND PLAYERS . . . . . . . . . . . . . 7 1 .1 Introduction . . . . . . . . . . . . . . . . . . . . . . . . . . . . . . . . . . . . . . . . 8 Ministry of Petroleum and Energy . . . . . . . . . . . . . . . . . . . . 8 Norwegian Water Resources and
Energy Directorate (NVE) . . . . . . . . . . . . . . . . . . . . . . . . . . . . 8 Enova SF . . . . . . . . . . . . . . . . . . . . . . . . . . . . . . . . . . . . . . . . . . . . 8 Statnett SF . . . . . . . . . . . . . . . . . . . . . . . . . . . . . . . . . . . . . . . . . . 8 Research Council of Norway . . . . . . . . . . . . . . . . . . . . . . . . . 9 1 .2 Legal framework . . . . . . . . . . . . . . . . . . . . . . . . . . . . . . . . . . . . 9 Overview of important legislation . . . . . . . . . . . . . . . . . . . 9 Industrial Licensing Act . . . . . . . . . . . . . . . . . . . . . . . . . . . . . 9 Watercourse Regulation Act . . . . . . . . . . . . . . . . . . . . . . . . . 9 Water Resources Act . . . . . . . . . . . . . . . . . . . . . . . . . . . . . . . . 9 Energy Act . . . . . . . . . . . . . . . . . . . . . . . . . . . . . . . . . . . . . . . . 10 Offshore Energy Act . . . . . . . . . . . . . . . . . . . . . . . . . . . . . . . 10 The Electricity Certificate Act . . . . . . . . . . . . . . . . . . . . . . . 11 Protection Plan for Watercourses and Master Plan
for Hydropower Development . . . . . . . . . . . . . . . . . . . . . 11 Other relevant legislation . . . . . . . . . . . . . . . . . . . . . . . . . . 12 Relevant EU legislation . . . . . . . . . . . . . . . . . . . . . . . . . . . . . 12 The EU’s three energy market packages . . . . . . . . . . . . 12 The Renewables Directive . . . . . . . . . . . . . . . . . . . . . . . . . . 14 The Energy Performance of Buildings Directive . . . . . 14 The CHP Directive . . . . . . . . . . . . . . . . . . . . . . . . . . . . . . . . . . 14 The Ecodesign Directive . . . . . . . . . . . . . . . . . . . . . . . . . . . 15 The Energy Labelling Directive . . . . . . . . . . . . . . . . . . . . . 15 The Security of Electricity Supply Directive . . . . . . . . . 15 The Water Framework Directive . . . . . . . . . . . . . . . . . . . . 15 The Environmental Liability Directive . . . . . . . . . . . . . . . 15 Licensing procedures . . . . . . . . . . . . . . . . . . . . . . . . . . . . . . 15 Procedures under the Watercourse Regulation
Act and the Water Resources Act . . . . . . . . . . . . . . . . . . . . 15 Large hydropower projects . . . . . . . . . . . . . . . . . . . . . . . . 16 Small hydropower projects . . . . . . . . . . . . . . . . . . . . . . . . . 16 Procedures under the Energy Act
(licences for installations) . . . . . . . . . . . . . . . . . . . . . . . . . . 17 Processing time for licence applications . . . . . . . . . . . . 18 1 .3 Companies and ownership . . . . . . . . . . . . . . . . . . . . . . . . . 19 Companies within various areas of activity . . . . . . . . . 20
Production companies . . . . . . . . . . . . . . . . . . . . . . . . . . . . . 20 Grid companies . . . . . . . . . . . . . . . . . . . . . . . . . . . . . . . . . . . . 20 Trading companies . . . . . . . . . . . . . . . . . . . . . . . . . . . . . . . . 21 Vertically integrated companies . . . . . . . . . . . . . . . . . . . . 21 District heating companies . . . . . . . . . . . . . . . . . . . . . . . . 21 Ownership in the power sector . . . . . . . . . . . . . . . . . . . . . 21
2 ENERGY AND POWER SUPPLY . . . . . . . . . . . . . . . . . . . . . . . . . . . 23 2 .1 Production of electricity . . . . . . . . . . . . . . . . . . . . . . . . . . . 24 Hydropower . . . . . . . . . . . . . . . . . . . . . . . . . . . . . . . . . . . . . . . 24 Capacity and production . . . . . . . . . . . . . . . . . . . . . . . . . . . 25 Different types of hydropower production . . . . . . . . . . 26 Intermittent hydropower production . . . . . . . . . . . . . . . 26 Flexible hydropower production . . . . . . . . . . . . . . . . . . . . 26 Pumped-storage power plants . . . . . . . . . . . . . . . . . . . . . 27 Hydropower potential . . . . . . . . . . . . . . . . . . . . . . . . . . . . . 27 Wind power . . . . . . . . . . . . . . . . . . . . . . . . . . . . . . . . . . . . . . . 27 Capacity and production . . . . . . . . . . . . . . . . . . . . . . . . . . . 28 Gas-fired and other thermal power production . . . . . . 28 Capacity and production . . . . . . . . . . . . . . . . . . . . . . . . . . . 29 Other thermal power . . . . . . . . . . . . . . . . . . . . . . . . . . . . . . 29 Other electricity production . . . . . . . . . . . . . . . . . . . . . . . 30 2 .2 Production of heat . . . . . . . . . . . . . . . . . . . . . . . . . . . . . . . . . 30 District heating . . . . . . . . . . . . . . . . . . . . . . . . . . . . . . . . . . . . 30 Capacity and production . . . . . . . . . . . . . . . . . . . . . . . . . . . 30 Oil for stationary combustion . . . . . . . . . . . . . . . . . . . . . . 30 Biomass . . . . . . . . . . . . . . . . . . . . . . . . . . . . . . . . . . . . . . . . . . . 30 Natural gas . . . . . . . . . . . . . . . . . . . . . . . . . . . . . . . . . . . . . . . . 31
3 ENERGY CONSUMPTION . . . . . . . . . . . . . . . . . . . . . . . . . . . . . . . . . 33 3 .1 Factors that influence energy consumption . . . . . . . . . 34 3 .2 Energy consumption trends . . . . . . . . . . . . . . . . . . . . . . . . 34 Stationary energy consumption . . . . . . . . . . . . . . . . . . . . 35 Stationary energy consumption by energy carrier . . . 36 3 .3 Shift in energy consumption and production . . . . . . . 36 Enova SF and management of the Energy Fund . . . . . 37 Objectives of Enova’s activities . . . . . . . . . . . . . . . . . . . . . 37 Enova’s market areas . . . . . . . . . . . . . . . . . . . . . . . . . . . . . . . 38 Renewable heating . . . . . . . . . . . . . . . . . . . . . . . . . . . . . . . . 38
5INNHOLD
Industry . . . . . . . . . . . . . . . . . . . . . . . . . . . . . . . . . . . . . . . . . . . 38 Non-residential buildings . . . . . . . . . . . . . . . . . . . . . . . . . . 39 Installations . . . . . . . . . . . . . . . . . . . . . . . . . . . . . . . . . . . . . . . . 39 Residential buildings . . . . . . . . . . . . . . . . . . . . . . . . . . . . . . 39 New energy and climate technologies . . . . . . . . . . . . . . 39 Enova’s advisory and information activities . . . . . . . . . 39 Results of Enova’s work, 2012-2013 . . . . . . . . . . . . . . . . . 40 Results of Enova’s work, 2001 to 2011 . . . . . . . . . . . . . . 40 Other policy instruments that affect energy
consumption . . . . . . . . . . . . . . . . . . . . . . . . . . . . . . . . . . . . . 40 The carbon tax, the emissions trading system
and the tax on electricity consumption . . . . . . . . . . . . . 40 Guarantees of origin . . . . . . . . . . . . . . . . . . . . . . . . . . . . . . . 41 The Technical Regulations for Buildings . . . . . . . . . . . . . 41 Regulatory measures resulting from
EU directives and decrees . . . . . . . . . . . . . . . . . . . . . . . . . . 41 Energy labelling of household appliances . . . . . . . . . . . 41 Ecodesign . . . . . . . . . . . . . . . . . . . . . . . . . . . . . . . . . . . . . . . . . 41 Energy performance of buildings . . . . . . . . . . . . . . . . . . . 41
4 THE ELECTRICITY GRID . . . . . . . . . . . . . . . . . . . . . . . . . . . . . . . . . . 47 4 .1 The electricity is critical infrastructure . . . . . . . . . . . . . . 48 4 .2 Description of the electricity grid . . . . . . . . . . . . . . . . . . . 48 4 .3 The electricity grid is a natural monopoly . . . . . . . . . . . 48 4 .4 Statnett SF . . . . . . . . . . . . . . . . . . . . . . . . . . . . . . . . . . . . . . . . 49
5 THE POWER MARKET . . . . . . . . . . . . . . . . . . . . . . . . . . . . . . . . . . . . 51 5 .1 Introduction . . . . . . . . . . . . . . . . . . . . . . . . . . . . . . . . . . . . . . . 52 5 .2 Organisation of the power market . . . . . . . . . . . . . . . . . . 52 5 .3 How the power market works . . . . . . . . . . . . . . . . . . . . . . 54 5 .4 About price formation . . . . . . . . . . . . . . . . . . . . . . . . . . . . . 54 Price formation . . . . . . . . . . . . . . . . . . . . . . . . . . . . . . . . . . . . 54 Area prices . . . . . . . . . . . . . . . . . . . . . . . . . . . . . . . . . . . . . . . . 55 End user price . . . . . . . . . . . . . . . . . . . . . . . . . . . . . . . . . . . . . 56 5 .5 Power trading between countries . . . . . . . . . . . . . . . . . . . 56 5 .6 Pricing of grid services . . . . . . . . . . . . . . . . . . . . . . . . . . . . . 57 Revenue cap regulation . . . . . . . . . . . . . . . . . . . . . . . . . . . . 57 Grid tariffs . . . . . . . . . . . . . . . . . . . . . . . . . . . . . . . . . . . . . . . . . 58
6 THE ENVIRONMENT . . . . . . . . . . . . . . . . . . . . . . . . . . . . . . . . . . . . . 59 6 .1 Local environmental impacts . . . . . . . . . . . . . . . . . . . . . . . 60 6 .2 Emissions to air . . . . . . . . . . . . . . . . . . . . . . . . . . . . . . . . . . . . 60
7 RESEARCH, TECHNOLOGY AND EXPERTISE . . . . . . . . . . . . . . . 63 7 .1 The Ministry of Petroleum and Energy’s use
of funding instruments within energy research . . . . . 64 7 .2 Energi21 . . . . . . . . . . . . . . . . . . . . . . . . . . . . . . . . . . . . . . . . . . 65 7 .3 Research programmes . . . . . . . . . . . . . . . . . . . . . . . . . . . . . 65 ENERGIX . . . . . . . . . . . . . . . . . . . . . . . . . . . . . . . . . . . . . . . . . . 65 Centres for Environment-friendly Energy Research . . 66 CLIMIT . . . . . . . . . . . . . . . . . . . . . . . . . . . . . . . . . . . . . . . . . . . . 66 Public-sector oriented research and
development programmes . . . . . . . . . . . . . . . . . . . . . . . . . 66 7 .4 International R&D cooperation . . . . . . . . . . . . . . . . . . . . . 66 Horizon 2020 . . . . . . . . . . . . . . . . . . . . . . . . . . . . . . . . . . . . . . 66 The International Energy Agency . . . . . . . . . . . . . . . . . . . 67 Nordic Energy Research . . . . . . . . . . . . . . . . . . . . . . . . . . . . 67 Other international R&D cooperation . . . . . . . . . . . . . . . 67 7 .5 Norwegian hydropower expertise . . . . . . . . . . . . . . . . . . 67
APPENDIX . . . . . . . . . . . . . . . . . . . . . . . . . . . . . . . . . . . . . . . . . . . . . . . . . 69
Appendix 1The Ministry of Petroleum and Energy’s legislation within the energy sector and water resources management . . . . . . . . 70 1 .1 The Industrial Licensing Act . . . . . . . . . . . . . . . . . . . . . . . . 70 1 .2 The Watercourse Regulation Act . . . . . . . . . . . . . . . . . . . . 71 1 .3 The Water Resources Act . . . . . . . . . . . . . . . . . . . . . . . . . . . 71 Groundwater . . . . . . . . . . . . . . . . . . . . . . . . . . . . . . . . . . . . . . 72 Special provisions concerning measures
in protected river systems . . . . . . . . . . . . . . . . . . . . . . . . . . 72 Safety measures in river systems . . . . . . . . . . . . . . . . . . . 72 1 .4 The Energy Act . . . . . . . . . . . . . . . . . . . . . . . . . . . . . . . . . . . . 73 Local area licence . . . . . . . . . . . . . . . . . . . . . . . . . . . . . . . . . . 73 Construction and operating licence . . . . . . . . . . . . . . . . 73 Trading licence . . . . . . . . . . . . . . . . . . . . . . . . . . . . . . . . . . . . 73 Marketplace licence . . . . . . . . . . . . . . . . . . . . . . . . . . . . . . . 74 Licence for power trading with other countries . . . . . . 74

6
District heating plants . . . . . . . . . . . . . . . . . . . . . . . . . . . . . 74 System responsibility, rationing and quality
of supply . . . . . . . . . . . . . . . . . . . . . . . . . . . . . . . . . . . . . . . . . . 74 Energy planning . . . . . . . . . . . . . . . . . . . . . . . . . . . . . . . . . . . 75 Power supply preparedness . . . . . . . . . . . . . . . . . . . . . . . . 75 1 .5 The Offshore Energy Act . . . . . . . . . . . . . . . . . . . . . . . . . . . 75 1 .6 The Electricity Certificate Act . . . . . . . . . . . . . . . . . . . . . . . 76 1 .7 Other legislation . . . . . . . . . . . . . . . . . . . . . . . . . . . . . . . . . . . 76 The Planning and Building Act . . . . . . . . . . . . . . . . . . . . . 76 The Nature Diversity Act . . . . . . . . . . . . . . . . . . . . . . . . . . . 77 The Expropriation Act . . . . . . . . . . . . . . . . . . . . . . . . . . . . . . 77 Competition legislation . . . . . . . . . . . . . . . . . . . . . . . . . . . . 77 The Natural Gas Act . . . . . . . . . . . . . . . . . . . . . . . . . . . . . . . . 78 The Consumer Purchases Act . . . . . . . . . . . . . . . . . . . . . . 78 The Pollution Control Act . . . . . . . . . . . . . . . . . . . . . . . . . . 78 The Neighbouring Properties Act . . . . . . . . . . . . . . . . . . . 79 The Cultural Heritage Act . . . . . . . . . . . . . . . . . . . . . . . . . . 79 The Outdoor Recreation Act . . . . . . . . . . . . . . . . . . . . . . . . 79 The Reindeer Husbandry Act . . . . . . . . . . . . . . . . . . . . . . . 79 The Public Administration Act . . . . . . . . . . . . . . . . . . . . . . 79 Other statutes . . . . . . . . . . . . . . . . . . . . . . . . . . . . . . . . . . . . . 79
Appendix 2 Definition of energy terms, conversion factors and
theoretical energy content of various fuel sources . . . . . . . . 80 Power units . . . . . . . . . . . . . . . . . . . . . . . . . . . . . . . . . . . . . . . . . . . . . 80 Energy units . . . . . . . . . . . . . . . . . . . . . . . . . . . . . . . . . . . . . . . . . . . . 80 The following units are also used for electric energy . . . . . . 80
Appendix 3 Electricity – key figures for 2013 (TWh) . . . . . . . . . . . . . . . . . . 81
Appendix 4 Transmission capacity in the Nordic region . . . . . . . . . . . . . . 82
Appendix 5 Definitions . . . . . . . . . . . . . . . . . . . . . . . . . . . . . . . . . . . . . . . . . . . . . 83
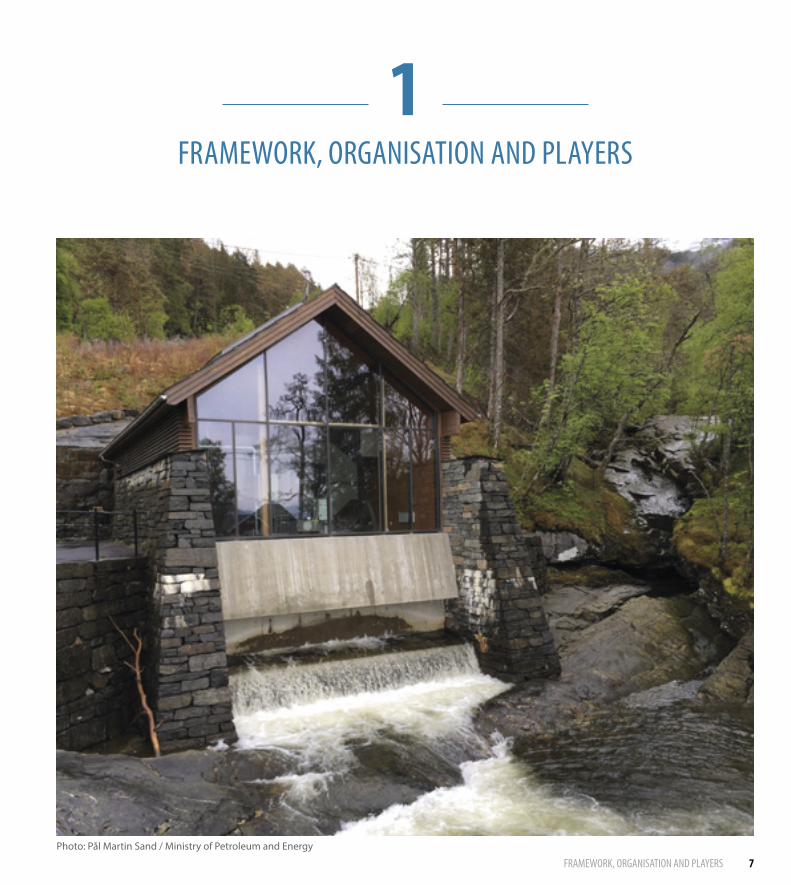
7FRAMEWORK, ORGANISATION AND PLAYERS
FRAMEWORK, ORGANISATION AND PLAYERS
1
Photo: Pål Martin Sand / Ministry of Petroleum and Energy
8
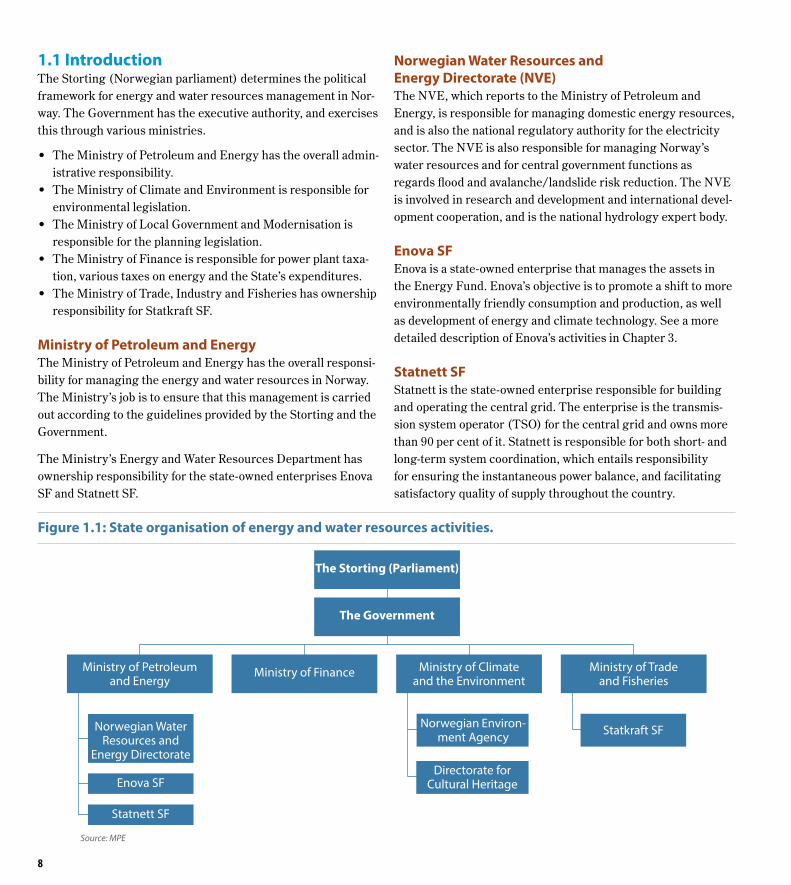
1.1 IntroductionThe Storting (Norwegian parliament) determines the political framework for energy and water resources management in Nor-way. The Government has the executive authority, and exercises this through various ministries.
• The Ministry of Petroleum and Energy has the overall admin-istrative responsibility.
• The Ministry of Climate and Environment is responsible for environmental legislation.
• The Ministry of Local Government and Modernisation is responsible for the planning legislation.
• The Ministry of Finance is responsible for power plant taxa-tion, various taxes on energy and the State’s expenditures.
• The Ministry of Trade, Industry and Fisheries has ownership responsibility for Statkraft SF.
Ministry of Petroleum and EnergyThe Ministry of Petroleum and Energy has the overall responsi-bility for managing the energy and water resources in Norway. The Ministry’s job is to ensure that this management is carried out according to the guidelines provided by the Storting and the Government.
The Ministry’s Energy and Water Resources Department has ownership responsibility for the state-owned enterprises Enova SF and Statnett SF.
Norwegian Water Resources and Energy Directorate (NVE) The NVE, which reports to the Ministry of Petroleum and Energy, is responsible for managing domestic energy resources, and is also the national regulatory authority for the electricity sector. The NVE is also responsible for managing Norway’s water resources and for central government functions as regards flood and avalanche/landslide risk reduction. The NVE is involved in research and development and international devel-opment cooperation, and is the national hydrology expert body.
Enova SFEnova is a state-owned enterprise that manages the assets in the Energy Fund. Enova’s objective is to promote a shift to more environmentally friendly consumption and production, as well as development of energy and climate technology. See a more detailed description of Enova’s activities in Chapter 3.
Statnett SFStatnett is the state-owned enterprise responsible for building and operating the central grid. The enterprise is the transmis-sion system operator (TSO) for the central grid and owns more than 90 per cent of it. Statnett is responsible for both short- and long-term system coordination, which entails responsibility for ensuring the instantaneous power balance, and facilitating satisfactory quality of supply throughout the country.
Figure 1.1: State organisation of energy and water resources activities.
Source: MPE
The Storting (Parliament)
The Government
Ministry of Climate and the Environment
Directorate for Cultural Heritage
Norwegian Environ-ment Agency Statkraft SF
Ministry of Petroleum and Energy
Norwegian Water Resources and
Energy Directorate
Enova SF
Statnett SF
Ministry of Trade and Fisheries
Ministry of Finance
9FRAMEWORK, ORGANISATION AND PLAYERS
Research Council of NorwayThe Research Council of Norway reports to the Ministry of Edu-cation and Research and its responsibilities include managing the ministries’ appropriations for energy research. The Ministry of Petroleum and Energy is the ministry that provides by far the largest amount of funding for energy research and development through the Research Council’s programmes.
1.2 Legal frameworkThis chapter provides an overview of the legal framework for the energy sector and water resources management. It has been necessary to develop a comprehensive legislative framework containing requirements to obtain official permits (licences) for various purposes. The official controls required as part of the licensing system ensure assessment of the legality and impacts of projects on a case-by-case basis.
Conflicts may arise between various user and environmental interests in connection with the planning, construction and operation of generation or transmission facilities for electrical energy and district heating and in water resource management. For example, biological diversity, landscapes and outdoor rec-reation, fishing, tourism, cultural heritage, local communities and reindeer husbandry may all be affected. Such interests are often called “public interests” in legislation. Energy and river system measures can also affect private economic interests.
One of the objectives of Norway’s legislation is to ensure that these different interests are heard and considered, and that the various measures are subject to government control and conditions that safeguard these interests. The legislation is also intended to ensure effective management of our resources. Security of energy supply and a well-functioning power market are key considerations here.
Overview of important legislationComprehensive legislation applies to the energy sector and to water resource management. The most important legislation governing these areas is briefly described below, and further details are provided in Appendix 1.
Industrial Licensing Act The purpose of the Act relating to acquisition of waterfalls of 14 December 1917 No. 16 (the Industrial Licensing Act) is to
ensure that hydropower resources are managed in the best interests of the general public. This is to be ensured through public ownership of the hydropower resources at national, county and municipal levels. The Act sets out requirements to obtain a licence if parties other than the State acquire owner-ship interests to waterfalls that if regulated could presumably provide an output of more than 4 000 natural horsepower1. New licences and licences for transfer of existing licences are only granted to public-sector purchasers. This means that licences can only be granted to state-owned enterprises, municipalities and county authorities. Licences can also be awarded to compa-nies that are partly owned by state-owned enterprises or one or more municipalities or county authorities, as long as the public sector holds at least two-thirds of the capital and the votes in the company, and the organisation clearly indicates genuine public ownership.
Watercourse Regulation Act Even if someone has the right of ownership of a waterfall, a sepa-rate permit is required under the Act relating to the regulation of watercourses of 14 December 1917 No. 17 (the Watercourse Regulation Act) to make use of the water in a regulation reser-voir for power generation. Transferring water in a watercourse also requires a licence. The purpose of the Watercourse Regula-tion Act is to safeguard public and private interests in water-courses. Normally, licences may only be granted if the damage to these interests is considered to be less than the advantages entailed by the regulation. The Act also gives the licensee the authority to expropriate necessary property and rights in order to carry out the regulation measures.
Water Resources Act Smaller power plants that do not involve regulation of a river and other measures in river systems may require a licence under the Act relating to river systems and groundwater of 24 November 2000 No. 82 (Water Resources Act). It follows from the Act that no developer without a licence may initiate watercourse meas-ures that may cause damage or nuisance to public interests in watercourses or the sea. The objective of the Act is to ensure socially responsible use and management of river systems and groundwater. Environmental concerns, maintenance of natural processes in river systems, and their intrinsic value as land-scape elements are some of the important factors the Act deals with.
1 A unit of power equivalent to ~75 kgm/s = 0.736 kW
10
Energy Act The Act relating to the generation, conversion, transmission, trading, distribution and use of energy etc. of 29 June 1990 No. 50 (the Energy Act) sets the framework for organisation of the power supply in Norway.
The Energy Act contains provisions on requirements to obtain a licence for all installations for generation, transmission and distribution of electric energy, all the way from the power sta-tion to the consumer. The Energy Act also requires a licence for trading electric energy, and includes licensing rules for district heating plants. The purpose of the Act is to ensure that genera-
tion, conversion, transmission, trading, distribution and use of energy are conducted in a way that efficiently promotes the interests of society, which includes taking into consideration any public and private interests that will be affected.
Offshore Energy Act The Act relating to renewable offshore energy production of 4 June 2010 No. 21 (the Offshore Energy Act) relates to renew-able energy production and conversion and transmission of electric energy offshore. The purpose of the Act is to facilitate exploitation of offshore renewable energy resources in accord-ance with the goals of society. The Act is also intended to
Box 1.1: Electricity certificates
The joint Norwegian-Swedish electricity certificate scheme is intended to boost renewable electricity production in both countries. Norway and Sweden have a common goal of increasing electricity production based on renewable energy sources by 26.4 TWh by 2020, using the joint electricity certificate market.
The Norwegian and Swedish authorities are cooperating closely on the electricity certificate scheme. A checkpoint review of the scheme is to be completed by the end of 2015. This involves discussions between the Norwegian and Swed-ish authorities on whether amendments or adjustments are needed in the legislation and quota system. Any changes that are made will enter into force in both countries on 1 January 2016.
The electricity certificate market is a market-based support scheme. In this system, producers of renewable electricity receive one certificate per MWh of electricity they produce for a period of 15 years. All renewable production facilities that started construction after 7 September 2009, and hydro-power plants with an installed capacity of up to 1 MW that started construction after 1 January 2004, will receive elec-tricity certificates. Facilities that are put into operation after 31 December 2020 will not receive electricity certificates. The electricity certificate scheme is technology-neutral, i.e. all forms of renewable electricity are entitled to electricity certificates, including hydropower, wind power and bioen-
ergy. Norway and Sweden are responsible for financing half of the support scheme each, regardless of where the invest-ments take place. The authorities have therefore obliged all electricity suppliers and certain categories of end-users to purchase electricity certificates for a specific percentage of their electricity consumption (their quota). This was 3 per cent in 2012 and will gradually be increased to approxi-mately 18 per cent in 2020, and then reduced again towards 2035. The scheme will be terminated in 2036. A demand for electricity certificates is created by the quota obligations imposed by the government, so that electricity certificates have a value. In other words, the market determines the price of electricity certificates and which projects are developed. Producers of renewable electricity gain an income from the sale of electricity certificates, in addition to revenues from the sale of electricity. The income from the electricity certifi-cates is intended to make it more profitable to develop new electricity production based on renewable energy sources. The end-users contribute to this through their electricity bills. In Norway, the framework for the scheme is governed by the Act relating to electricity certificates.
The NVE is the administrative and supervisory authority for the electricity certificate scheme. Its responsibilities include approving facilities for electricity certificates. The electric-ity certificates exist only in electronic format. Statnett SF is responsible for the electronic registry where the electricity certificates are issued and cancelled.
11FRAMEWORK, ORGANISATION AND PLAYERS
ensure that energy facilities are planned, built and managed in a manner that takes into account considerations related to energy supply, the environment, safety, and commercial and other interests.
The Electricity Certificate Act The purpose of the Act relating to electricity certificates of 24 June 2011 No. 39 (the Electricity Certificate Act) is to contrib-ute to increased production of electric energy from renewable energy sources. The Act establishes a Norwegian market for electricity certificates which, from 1 January 2012, was linked to the Swedish electricity certificate market. An electricity certificate market is a constructed market in the sense that the demand for electricity certificates arises from a statutory obliga-tion to purchase them. See Box 1.1 for more information on the system of electricity certificates.
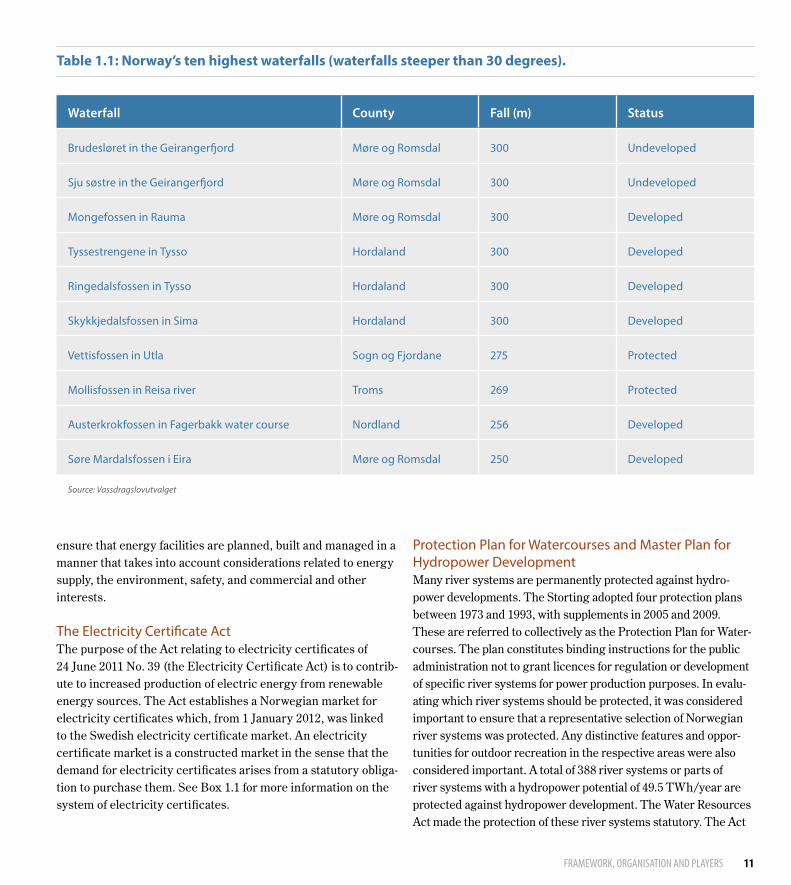
Protection Plan for Watercourses and Master Plan for Hydropower Development Many river systems are permanently protected against hydro-power developments. The Storting adopted four protection plans between 1973 and 1993, with supplements in 2005 and 2009. These are referred to collectively as the Protection Plan for Water-courses. The plan constitutes binding instructions for the public administration not to grant licences for regulation or development of specific river systems for power production purposes. In evalu-ating which river systems should be protected, it was considered important to ensure that a representative selection of Norwegian river systems was protected. Any distinctive features and oppor-tunities for outdoor recreation in the respective areas were also considered important. A total of 388 river systems or parts of river systems with a hydropower potential of 49.5 TWh/year are protected against hydropower development. The Water Resources Act made the protection of these river systems statutory. The Act
Waterfall County Fall (m) Status
Brudesløret in the Geirangerfjord Møre og Romsdal 300 Undeveloped
Sju søstre in the Geirangerfjord Møre og Romsdal 300 Undeveloped
Mongefossen in Rauma Møre og Romsdal 300 Developed
Tyssestrengene in Tysso Hordaland 300 Developed
Ringedalsfossen in Tysso Hordaland 300 Developed
Skykkjedalsfossen in Sima Hordaland 300 Developed
Vettisfossen in Utla Sogn og Fjordane 275 Protected
Mollisfossen in Reisa river Troms 269 Protected
Austerkrokfossen in Fagerbakk water course Nordland 256 Developed
Søre Mardalsfossen i Eira Møre og Romsdal 250 Developed
Source: Vassdragslovutvalget
Table 1.1: Norway’s ten highest waterfalls (waterfalls steeper than 30 degrees).

12
defines protected river systems, and lays down rules for their pro-tection both against hydropower developments and against other types of disturbance. In the 2005 supplement to the protection plan, the Storting permitted processing of licence applications for power plants up to 1 MW in protected river systems.
Six of Norway’s ten highest waterfalls have been developed, cf. Table 1.1.
The Master Plan for Hydropower Development is a recommenda-tion in the form of a white paper from the Government to the Stort-ing (most recently Report No. 60 (1991-92) to the Storting). The plan sets out an order of priority for projects that can be consid-ered for licensing, and divides them into two categories. Category I includes projects where licensing procedures may be started immediately. In addition, licensing procedures may be started immediately for some projects that are exempted from the plan. Projects in Category II and projects not covered in the plan may not be submitted for licensing at present. The order of priority is based on economic considerations and assessments of the degree of conflict with other interests. The intention was to ensure that the river systems that will provide the cheapest power and where development will have the smallest environmental impact are developed first. However, the fact that a project has been approved in the Master Plan does not entail a binding advance commitment to grant a licence, only that the application may be processed.
The licensing authorities have turned down applications for projects in Category I. They have the legal authority to reject applications that are in conflict with the plan. When the Stort-ing considered the 2005 supplement to the Protection Plan, it was decided that hydropower projects with a planned reservoir capacity of up to 10 MW or with an annual production of up to 50 GWh would be exempted from processing in the Master Plan. Many of the relevant developments will fall into this category.
Since the Storting considered the Master Plan in 1993, the framework for hydropower development has altered in a number of ways. Most of the projects that are notified today are differ-ent in technical, environmental and economic terms from those described in the Master Plan.
Other relevant legislation In addition to the Water Resources Act, the Watercourse Regula-tion Act, the Industrial Licensing Act, the Electricity Certificate
Act, the Offshore Energy Act and the Energy Act, there are a number of other statutes that are significant for energy and water resources. With the exception of the natural gas legisla-tion, these statutes are administrated by authorities other than the Ministry of Petroleum and Energy and the NVE.
Appendix 1 provides a more detailed description of the following statutes:
• Planning and Building Act (Ministry of Local Government and Modernisation)
• Nature Diversity Act (Ministry of Climate and Environment)• Expropriation Act (Ministry of Justice and Public Security)• Competition Act (Ministry of Government Administration,
Reform and Church Affairs)• Natural Gas Act (Ministry of Petroleum and Energy)• Consumer Purchases Act (Ministry of Justice and Public
Security)• Pollution Control Act (Ministry of Climate and Environment)• Neighbouring Properties Act (Ministry of Justice and Public
Security)• Cultural Heritage Act (Ministry of Climate and Environment)• Outdoor Recreation Act (Ministry of Climate and Environ-
ment)• Reindeer Husbandry Act (Ministry of Agriculture and Food)• Public Administration Act (Ministry of Justice and Public
Security)
Relevant EU legislationEnergy policy is an important area for the EU, and a number of directives and regulations in this field have been incorporated into the EEA Agreement. These are briefly described below.
The EU’s three energy market packages The work of opening EU electricity markets to competition has been in progress for a number of years. Council Directive 96/92/EC on common rules for the internal market in electricity (the Electricity Market Directive) was the first step towards an open, common European electricity market. At the same time, the development of a common set of rules for the internal elec-tricity market and a common set of rules for the internal natural gas market has been under way.
The second energy market package was adopted on 26 June 2003, and constituted a significant new step in the direction of
13FRAMEWORK, ORGANISATION AND PLAYERS
a more open energy market. Directive 2003/54/EC of the Euro-pean Parliament and of the Council (Electricity Market Direc-tive II) includes minimum requirements relating to deadlines for opening the market to industrial and household customers and for ensuring a legal separation between transmission functions2 and activities related to generation and trading. The Directive also contains consumer protection provisions.
The regulation on cross-border exchanges in electricity (Regu-lation (EC) No 1228/2003 of the European Parliament and of the Council) was also part of the second energy market package. Its purpose is to stimulate cross-border power trade, and thus enhance competition in the internal electricity market. The regulation also provides a framework for further harmonisation of the principles on exploitation of the transmission capacity
2 Transmission level is the highest grid level. Transmission in the sense of the Directive is the transmission of electric energy at the central grid level.
between countries, and provided the legal basis for Commis-sion Regulation (EU) No 774/2010. The latter introduced the inter-transmission system operator compensation mechanism (the ITC mechanism) based on the costs associated with transit of electricity.
The European Parliament and Council Directive 2003/55/EC of the European Parliament and of the Council (Gas Market Direc-tive II) contains very similar provisions to Electricity Market Directive II. The EU subsequently adopted Regulation (EU) No 1775/2005 of the European Parliament and of the Council on conditions for access to the natural gas transmission networks.
The second energy market package was incorporated into the EEA Agreement on 2 December 2005. The package has been implemented in the Norway’s Energy Act and Natural Gas Act with appurtenant regulations.
Box 1.2: Renewable energy action plan
The Norwegian target of 67.5 per cent in 2020 will be achieved through existing policy instruments and the policy that the Government described in the 2012 white paper on Norwegian climate policy (Meld. St. 21 (2011–2012)). The electricity certificate scheme is the most important single measure for achieving the target. Norway will be credited for half of the overall target for the joint certificate market between Norway and Sweden, regardless of where the pro-duction takes place, i.e. 13.2 TWh (26.4 TWh in total). The Norwegian-Swedish electricity certificate scheme is the first example of a joint support scheme between member states under the Renewables Directive. Joint support schemes are regulated in Article 11 of the Directive. Enova’s use of policy instruments and the introduction of new construction stand-ards also contribute towards target attainment.
However, the transport target will require additional measures in the years ahead. The measures described in the white paper on climate policy will be used as a basis for possible ways of reaching the target, without any commitment to a specific mix of measures or implementation date. The transport target and policy instruments in this sector fall within the Ministry of Transport and Communications’ area of responsibility.
Article 4 of the Renewables Directive requires each state to draw up an action plan for achieving its national targets. The Norwegian renewable energy action plan was submitted to the EFTA Surveillance Authority at the end of June 2012. The action plan lays out how Norway can achieve an overall renew-able share of 67.5 per cent, and a renewable share of 10 per cent in the transport sector, by 2020.
The action plan is based on filling in a detailed template prepared by the European Commission which all states are required to use. This makes the action plan a standardised and detailed document that consists of a large number of questions and answers. The purpose of the template is to ensure that the national action plans cover all requirements in the Directive, that they are comparable and that they are in concordance with the reports the member states must submit every other year regarding the implementation status for the Directive.
The action plan consists, in part, of a highly detailed description of the use of policy instruments in all areas with significance for energy use and production in Norway, and, in part, of detailed tables and calculations for developments in energy use, energy production and renewable shares from 2005 leading up to 2020.

14
The EU’s third energy market package was adopted on 13 July 2009. It consists of five legislative acts. Four of these amended existing legislative acts: Directive 2009/72/EC of the European Parliament and of the Council (Electricity Market Directive III), Directive 2009/73/EC of the European Parliament and of the Council (Gas Market Directive III), the Regulation (EC) No 714/2009 of the European Parliament and of the Council (Cross-Border Exchanges Regulation II), and Regulation (EC) No 715/2009 of the European Parliament and of the Council (Gas Transmission Regulation II)). In addition, Regulation (EC) No 713/2009 of the European Parliament and of the Council lays down new rules establishing an Agency for the Cooperation of Energy Regulators (ACER).
The legislative acts in the third package have not yet been incorporated into the EEA Agreement. A new regulation has also been adopted on the inter-transmission system operator compensation mechanisms which replaces Regulation (EU) No 774/2010, but like the previous regulation it is not part of the actual package.
New elements in the third package, in addition to ACER, include the establishment of two organisations for national transmission system operators: ENTSO-E for electricity and ENTSOG for gas.
A central element of the Electricity Directive and the Gas Direc-tive is new, more rigorous requirements for the independence of national regulatory authorities. Regulators must be independent both from the industry and from political authorities. In addi-tion, the directives give regulators a wider area of responsibility and additional tasks.
The two directives also set new, more stringent requirements for organising network activities at the transmission level. As a gen-eral rule, they require ‘unbundling’ (separation of ownership of transmission systems and generation and supply systems). They also include more extensive consumer protection provisions.
The Renewables Directive Directive 2009/28/EC of the European Parliament and of the Council of 23 April 2009 (the Renewables Directive) establishes a common framework for the promotion of energy from renewable energy sources, and was incorporated into the EEA Agree-ment on 19 December 2011. It applies to electricity, heating/cooling and transport, and thus has a wider scope than the 2001
Directive, which applied to electricity only. Each member state is required to ensure that it achieves its target for the share of energy from renewable sources in its consumption by 2020, thus contributing to the achievement of the overall EU target, which is a renewables share of 20 per cent in 2020. Norway’s target follows from a decision by the EEA Joint Committee. In 2020, the share of energy from renewable sources in Norway is to amount to 67.5 per cent of its gross end consumption of energy. The Renewables Directive requires member states to draw up renewable energy action plans that set out targets for the three sub-sectors (electricity, heating/cooling and transport). Imple-mentation of the Directive in Norway has resulted in amend-ments to regulations under the Energy Act. See Box 1.2 provides more information on Norway’s renewable energy action plan.
The Energy Performance of Buildings Directive Directive 2002/91/EC of the European Parliament and of the Council of 16 December 2002 on the energy performance of buildings was incorporated into the EEA Agreement on 23 April 2004. The Directive defines a common methodology for calculating the energy performance of buildings, and requires member states to set national requirements for the energy performance of new and renovated buildings. It includes provi-sions concerning energy performance certificates for new and existing buildings and on the inspection of air-conditioning and heating systems above a certain capacity. The Directive’s requirements for energy performance certificates for buildings have been implemented in Norway in the Energy Labelling Regulation of 18 December 2009 No. 1665. From 1 July 2010, it has been mandatory to hold an energy performance certificate whenever a building is constructed, sold or rented out. Non-resi-dential buildings exceeding 1000 m2 in size must have an energy certificate that is displayed for the building’s users.
The CHP DirectiveDirective 2004/8/EC of the European Parliament and of the Council of 11 February 2004 on the promotion of cogeneration based on a useful heat demand in the internal energy market was incorporated into the EEA Agreement on 8 December 2006. The Directive aims to improve energy efficiency and security of supply through promotion of highly efficient combined heat and power generation (cogeneration or CHP) where there is a useful heat demand. The Directive has been incorporated into Norwegian law through the Energy Act and the Regulations relating to guarantees of origin for generation of electric energy

15FRAMEWORK, ORGANISATION AND PLAYERS
of 14 December 2007. Commission Decision 2007/74/EC sets out harmonised efficiency values for separate production of electricity and heat.
The Ecodesign Directive Directive 2009/125/EC of the European Parliament and of the Council of 21 October 2009 establishing a framework for the setting of ecodesign requirements for energy-related products (such as light bulbs and household appliances) was incorpo-rated into the EEA Agreement on 1 July 2011. The Directive is a revision of the previous Ecodesign Directive from 2005. The Directive has been implemented in Norway through the Ecodesign Regulations of 23 February 2011 No. 190, which are administered by the NVE. Further provisions for specific products are laid down in implementing regulations, which also apply in Norway.
The Energy Labelling Directive Directive 2010/30/EU of the European Parliament and of the Council of 19 May 2010 on the indication by labelling and stand-ard product information of the consumption of energy and other resources by energy-related products was incorporated into the EEA Agreement on 7 December 2012. The Directive is a refor-mulation of the previous Energy Labelling Directive from 1992. The Directive has been implemented in Norwegian law through the Energy Labelling Regulations for Products of 27 May 2013 No. 534. Further provisions for specific products are laid down in implementing regulations, which also apply in Norway.
The Security of Electricity Supply Directive Directive 2005/89/EC of the European Parliament and of the Council concerning measures to safeguard security of electric-ity supply and infrastructure investment was incorporated into the EEA Agreement on 8 June 2007. The Directive requires each member state to implement a policy for security of electric-ity supply. The Directive did not result in any amendments to Norwegian law.
The Water Framework Directive The Water Framework Directive (Directive 2000/60/EC of the European Parliament and of the Council) aims to promote inte-grated water resource management on the basis of standards for the ecological status of freshwater and coastal waters. The Directive has been implemented in Norwegian law through the Water Management Regulations.
The standard environmental objectives are the achievement of “good ecological status” no later than 15 years after the entry into force of the Directive. However, the Directive allows for adaptation, both through exemption provisions and through the designation of certain water bodies as “heavily modified”. The environmental objectives for these are less ambitious. They include water bodies where extensive physical alterations have been made for the benefit of society, so that they will not be able to achieve the standard environmental objectives. In Norway, these are typically water bodies that have been regulated for hydropower production.
The Environmental Liability Directive Directive 2004/35/EC of the European Parliament and of the Council on environmental liability was incorporated into the EEA Agreement on 5 February 2009. The Directive aims to establish a framework for environmental liability based on the “polluter-pays” principle in order to prevent and remedy environ-mental damage. Environmental damage covered by the Direc-tive includes damage to protected species and natural habitats, water damage and land damage. However, it follows from a deci-sion by the EEA Joint Committee that the rules regarding dam-age to protected species and natural habitats do not apply to the EFTA EEA states Norway, Liechtenstein and Iceland. Norway will make some minor amendments to the Water Resources Act and the Watercourse Regulation Act as a result of the Directive.
Licensing procedures The licensing authorities are the bodies responsible for processing licence applications and issuing licences. They include the Stort-ing, the King in Council3, the Ministry of Petroleum and Energy and the NVE. Below follows a description of licensing procedures under the Watercourse Regulation Act and the Water Resources Act, and for electrical installations under the Energy Act.
Procedures under the Watercourse Regulation Act and the Water Resources ActIn the following, a distinction is made between large and small hydropower projects. Small projects are dealt with under the Water Resources Act and concern power plants with an installed capacity under 10 MW that do not involve regulatory measures exceeding the limit that triggers licensing requirements under the Watercourse Regulation Act. Large projects are those dealt
3 When the Government makes decisions as a plenary body, this takes place as the Council of State, presided over by the King.

with pursuant to the Water Resources Act with an installed capacity exceeding 10 MW, and projects dealt with pursuant to the Watercourse Regulation Act.
The NVE has also prepared guidelines for administrative proce-dures for a number of different types of works in river systems. These include aquaculture facilities, the construction of small power plants, upgrades and remodelling of existing power plants, construction in or across river systems, gravel pits and flood protection measures.
Large hydropower projects The King in Council is the licensing authority for projects dealt with under the Watercourse Regulation Act and developments with an installed capacity exceeding 10 MW pursuant to the Water Resources Act. Nevertheless, the NVE is responsible for procedures during the application phase.
Proposals for hydropower plants larger than 10 MW or with an annual production exceeding 50 GWh must always first be assessed vis-à-vis the criteria of the Master Plan for Hydro-power Development, unless they have already been placed in Category I. For such projects, an application must be submitted to the NVE. The Norwegian Environment Agency makes a deci-sion on the application in consultation with the NVE.
If a project is approved under the Master Plan for Hydropower Development, the actual application process can start. Under the Regulations of 19 December 2014 relating to environmental impact assessment of projects under sectoral legislation (in this document referred to as the EIA Regulations), an EIA is manda-tory for power plants with an annual production exceeding 40 GWh. For other installations, an EIA that meets the require-ments of the regulations is required if the project may have significant effects on the environment and society.
If a project comes under Appendix II of the EIA Regulations, the developer is not required to send notification under the regu-lations. As a general rule, the ordinary licensing procedures under the Watercourse Regulation Act and the Water Resources Act are followed in such cases. An EIA must meet the require-ments of Appendix IV of the EIA Regulations. The developer may be required to submit supplementary studies if the applica-tion does not provide sufficient information. The impacts of a
project must be thoroughly described in the application even in cases no EIA is required under the Regulations.
If Appendix I of the EIA Regulations applies to a project (an EIA is mandatory), the NVE will determine the final impact assess-ment programme after submitting it to the Ministry of Climate and Environment. The consultation bodies receive a copy of the final assessment programme for information purposes.
Once an EIA is completed, it is submitted together with the licence application. The application, along with the EIA if one has been carried out, is submitted to affected authorities, organ-isations and landowners for comment. The NVE then makes an overall assessment of the project and submits its recommenda-tion to the Ministry of Petroleum and Energy.
The Ministry prepares the matter for the King in Council and presents its recommendation. The recommendation is based on the application, the NVE’s recommendation, the views of affected ministries and local authorities and the Ministry’s own assessments. The King in Council then makes a deci-sion regarding development and regulation in the form of a Royal Decree. In the case of a major (more than 20 000 natural horsepower) and/or controversial water regulation and power development project, a Proposition to the Storting is submitted first so that the Storting can debate the matter before a licence is formally awarded by the King in Council. Figure 1.2 illus-trates the procedures.
Decisions regarding major development projects cannot be appealed, as the licensing authority rests with the King in Council.
Small hydropower projects Licensing authority pursuant to the Water Resources Act has been delegated to the NVE for power plants with an installed capacity below 10 MW and that do not involve regulatory measures exceeding the limit that triggers licensing require-ments under the Watercourse Regulation Act. The procedures for small hydropower plants are somewhat simpler than those for large projects, so that they can be processed more quickly. From 1 January 2010, the licensing authority for power plants below 1 MW (mini and micro power plants) has been delegated to the county authorities, except in cases involving the develop-ment of such plants in protected river systems.
16

In June 2007, the Ministry published guidelines for small hydro-power plants with the aim of facilitating regional planning of such power plants and strengthening the basis for comprehen-sive, efficient and predictable licensing procedures.
For power plants of between 1 and 10 MW, a study of biodiver-sity that may be affected by the development is required. Pursu-ant to the rules of the Planning and Building Act, public notice of the application is given in the local media, and it is deposited for public inspection and circulated to affected authorities, organisations and landowners for comment. Following the con-sultation process, the area will be inspected before a decision is made.
The Ministry is the appeals body for the NVE’s decisions. If an NVE licensing decision is appealed, an ordinary appeals process is started in accordance with the rules of the Public Administra-tion Act. The Ministry of Petroleum and Energy’s decision is final and cannot be appealed to a higher authority. Figure 1.3 illustrates the procedure.
Procedures under the Energy Act (licences for installations) Under the Energy Act, installations for production, transforma-tion, transmission and distribution of electric energy may not be built, owned or operated without a licence. This means that, even if a licence has already been granted for a power plant pursuant to the Water Resources Act, the electrical installations are still subject to the licensing requirements of the Energy Act. The NVE has the authority to make decisions regarding licences for installations, except for new major power lines longer than 20 kilometres carrying a voltage of 300 kV or more, for which the licensing authority has been transferred to the King in Council. The Ministry of Petroleum and Energy is the appeals body for decisions made by the NVE.
Licence applications must be submitted to the NVE. If the rules of the Planning and Building Act regarding impact assessments apply to the project, the impact assessment must be enclosed with the application. The EIA Regulations specify the limits above which an impact assessment is mandatory or may be
17RAMMEVERK, ORGANISERING OG AKTØRER
Source: MPE
Figure 1.2: Procedure for major hydropower projects under the Water Resources Act and regulation of river systems under the Watercourse Regulation Act, subject to EIA-regulation, appendix I.
Application with IA submitted to the NVE
Very large/controversial projects are presented
to the Storting
NVE stipulates IA programme
The MPE submits the NVE’s recommendation
for a limited consultation
NVE submits the project for consultation
Consultation for potential additional studies
The King in Council makes a decision in the form of a Royal Decree
Proposal with proposed IA programme submitted
to the NVE
NVE submits the project for consultation
The MPE submits the project to the King in
Council
>
>
>
>
>
>
>
>>

18
required. Overhead electrical power lines and subsea cables with a voltage of 132 kV or more and a length of more than 15 km are included in Appendix I. Power lines that require a licence under the Energy Act are included in Appendix II.
If an EIA is not mandatory under Appendix I of the EIA Regula-tions, the first step in the process is an application to the NVE pursuant to the Energy Act. In such cases, the impacts of the project must be assessed in connection with the application and the NVE’s processing of it pursuant to the Energy Act and the EIA Regulations. As a general rule, the NVE holds consultations and makes information available to stakeholders, and may also organise public meetings, etc as part of the licensing procedure. If screening under the EIA Regulations indicates that the pro-ject may have significant effects, the requirements for an EIA must be met and any supplementary information required must be obtained and made subject to consultation procedures.
If an NVE licensing decision is appealed, the Ministry of Petroleum and Energy starts an ordinary appeal process in accordance with the rules of the Public Administration Act. If necessary, the Ministry will carry out an inspection of the site as part of the appeal process. The Ministry’s decision is final and cannot be appealed to a higher authority. Figure 1.4 illus-trates the procedure.
Decisions on licences for new major power lines longer than 20 kilometres carrying a voltage of 300 kV or more are now made by the King in Council, as mentioned above. The NVE is still responsible for normal licensing procedures, but not for mak-ing a decision on whether to grant a licence. Instead, consider applications in a normal way, but will not make decisions as the authority of first instance. Instead, the NVE submits its recom-mendation to the Ministry. The Ministry holds a public consulta-tion on the recommendation for consultation, and prepares the matter for the King in Council, who makes a decision on licens-ing. Such decisions cannot be appealed.
Under this the new system, a grid company must subject its needs analysis and assessment of the choice of concept to external quality assurance before it can submit a project proposal. Once quality assurance has been completed, the full documentation must be submitted to the Ministry of Petroleum and Energy. After reviewing the documentation, the Ministry decides whether to allow the company to submit a proposal.
Processing time for licence applications Many factors affect the time spent on licence processing, for example the conflict level and complexity of the individual pro-ject. Hydropower and energy projects are most likely to affect commerce and industry, local communities, the environment and other user interests. The licensing authority is responsi-ble for ensuring that a project has been thoroughly assessed
Figure 1.3: Procedure pursuant to the Water Resources Act for small-scale power projects (under 10 MW).
Source: MPE
The NVE grants or rejects the application
The MPE grants or rejects the appeal . Affected
ministries will be involved
Consultation for potential additional studies
If the NVE upholds the decision, the appeal is submitted to the MPE
The NVE submits the project for consultation
The NVE considers the appeal
Application submitted to the NVE
Potential appeal of the NVE’s decision is
submitted to the NVE
>
>
>
> >
>
>

19FRAMEWORK, ORGANISATION AND PLAYERS
and described before a decision is made, and must during the application procedure consider the need for additional studies of various topics and supplementary statements on issues raised during the process. The processing of licence applications pur-suant to the energy and water resources legislation must meet the need for sound, comprehensive assessment, and must also be efficient.
1.3 Companies and ownership The Norwegian power sector consists of a large number of actors within different areas of activity. The sector is organised around the generation, transmission and trading of power. In addition, a considerable number of district heating suppliers have been established over the last ten years.
Public bodies own considerable assets in this sector; for exam-ple, about 90 per cent of Norwegian hydropower production is owned by public entities. The combination of considerable public ownership and a diversity of stakeholders is distinctive for the Norwegian power sector.
Figure 1.4: Procedure for electrical installations pursuant to the Energy Act, subject to EIA-regulation, appendix I.
Source: MPE
Application with IA submitted to the NVE
Potential appeal of the NVE’s decision is
submitted to the NVE
The NVE stipulates the IA programme
The NVE grants or rejects the application
The MPE grants or rejects the appeal . Affected
ministries will be involved
The NVE submits the project for consultation
Consultation for potential additional
studies
If the NVE upholds the decision, the appeal will be submitted to the MPE
Proposal with propsed IA programme submitted
to the NVE
The NVE submits the project for consultation
The NVE considers the appeal
>
>
>
>
>
> > >
>>
Source: NVE
Figure 1.5: Licensees by activity, as of 31.12.2013.
Production
54 59
55
38
89
47
15
Grid
Trading
20
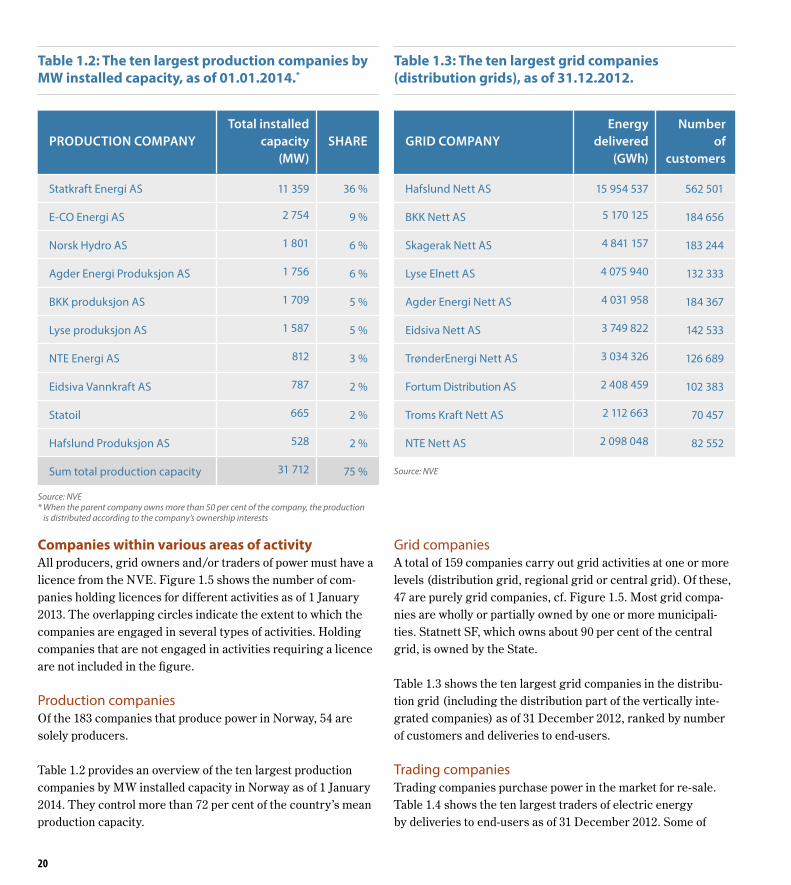
Companies within various areas of activity All producers, grid owners and/or traders of power must have a licence from the NVE. Figure 1.5 shows the number of com-panies holding licences for different activities as of 1 January 2013. The overlapping circles indicate the extent to which the companies are engaged in several types of activities. Holding companies that are not engaged in activities requiring a licence are not included in the figure.
Production companies Of the 183 companies that produce power in Norway, 54 are solely producers.
Table 1.2 provides an overview of the ten largest production companies by MW installed capacity in Norway as of 1 January 2014. They control more than 72 per cent of the country’s mean production capacity.
Grid companies A total of 159 companies carry out grid activities at one or more levels (distribution grid, regional grid or central grid). Of these, 47 are purely grid companies, cf. Figure 1.5. Most grid compa-nies are wholly or partially owned by one or more municipali-ties. Statnett SF, which owns about 90 per cent of the central grid, is owned by the State.
Table 1.3 shows the ten largest grid companies in the distribu-tion grid (including the distribution part of the vertically inte-grated companies) as of 31 December 2012, ranked by number of customers and deliveries to end-users.
Trading companies Trading companies purchase power in the market for re-sale. Table 1.4 shows the ten largest traders of electric energy by deliveries to end-users as of 31 December 2012. Some of
PRODUCTION COMPANY
Total installed capacity
(MW)
SHARE
Statkraft Energi AS 11 359 36 %
E-CO Energi AS 2 754 9 %
Norsk Hydro AS 1 801 6 %
Agder Energi Produksjon AS 1 756 6 %
BKK produksjon AS 1 709 5 %
Lyse produksjon AS 1 587 5 %
NTE Energi AS 812 3 %
Eidsiva Vannkraft AS 787 2 %
Statoil 665 2 %
Hafslund Produksjon AS 528 2 %
Sum total production capacity 31 712 75 %
Source: NVE* When the parent company owns more than 50 per cent of the company, the production
is distributed according to the company’s ownership interests
Table 1.2: The ten largest production companies by MW installed capacity, as of 01.01.2014.*
GRID COMPANY
Energy delivered
(GWh)
Number of
customers
Hafslund Nett AS 15 954 537 562 501
BKK Nett AS 5 170 125 184 656
Skagerak Nett AS 4 841 157 183 244
Lyse Elnett AS 4 075 940 132 333
Agder Energi Nett AS 4 031 958 184 367
Eidsiva Nett AS 3 749 822 142 533
TrønderEnergi Nett AS 3 034 326 126 689
Fortum Distribution AS 2 408 459 102 383
Troms Kraft Nett AS 2 112 663 70 457
NTE Nett AS 2 098 048 82 552
Source: NVE
Table 1.3: The ten largest grid companies (distribution grids), as of 31.12.2012.

21FRAMEWORK, ORGANISATION AND PLAYERS
the companies in the table also engage in production and/or transmission activities. Of the 241 companies involved in power trading, 89 have trading as their sole activity. Trading in the financial market does not require a trading licence. See Chapter 5 for further information.
Vertically integrated companies Vertically integrated companies engage in both electricity gen-eration and transmission and/or trading.
In all, 112 companies are involved both in activities that are exposed to competition (production and/or trading) and in grid management and operation. Of these, 59 companies are engaged in all three types of activities. The figures cover vertically integrated companies where the same legal entity is engaged in production, transmission and trading activities, not corporations with separate activities in different subsidiaries.
District heating companies District heating has been developed or is being planned and developed in most larger Norwegian towns. More than 60 com-panies have been granted licences for district heating. Certain companies operate district heating plants in several towns. Table 1.5 shows the five largest district heating companies, measured by district heating deliveries in 2013.
Ownership in the power sector Municipalities, county authorities and the State own about 90 per cent of Norway’s production capacity. The State is the owner through Statkraft, and owns about one-third 4 of the production capacity. Statkraft is a state-owned enterprise means that the State must be the sole owner. Many companies have several owners and there is a significant level of cross-ownership.
One characteristic of the Norwegian hydropower sec-tor has been the right of reversion to the State for licences granted to private players after 1917. The right of reversion means that the State assumes ownership of waterfalls and any hydropower installations free of charge when a licence expires. As the date of reversion stated in the licences approaches, pri-vate power plants will either be sold to publicly-owned compa-nies or ownership will revert to the State on the specified date. The right of reversion to the State has thus resulted in restruc-
4 The State also owns 34.26 per cent of Norsk Hydro, which owns a capacity of 8.7 TWh/year.
Table 1.4: The ten largest power traders as of 31.12. 2012.
Trading company Value GWh
Statkraft Energi AS 4 515 444 16288
Norsk Hydro Produksjon AS 2 756 200 11478
LOS AS 2 936 122 10248
Fjordkraft AS 3 249 400 9288
Hafslund Strøm AS 2 211 768 7333
NorgesEnergi AS 1 784 895 6423
Ishavskraft AS 1 072 461 3326
Lyse Handel AS 777 470 2849
Eidsiva Energi Marked AS 713 428 2404
Norske Shell AS 671 078 2239
Source: NVE
Company GWh delivered in 2013
Hafslund Varme AS 1617
Statkraft Varme AS 626
Eidsiva Bioenergi AS 235
BKK Varme AS 224
Fortum Fjernvarme AS 215
Source: Norsk Fjernvarme
Table 1.5: The five largest district heating companies measured by district heating deliveries in 2013.

turing of the ownership of Norwegian power production and is continuing to do so. In 2008, amendments were also made to the water resources legislation in order to ensure and strengthen public ownership of national hydropower resources. This means that new licences for the ownership of waterfalls, as well as licences for transferring existing licensed waterfalls, can only be granted to public developers. As a result, no new licences will be issued including the right of reversion. Current licences of limited duration will run as normal until the date of reversion. This is discussed in more detail in the section on the Industrial Licensing Act in Appendix 1.
The State owns about 90 per cent of the central grid. Private companies, county authorities and municipalities also own parts of the central grid. The State ownership of the central grid is managed through Statnett SF. Municipalities and county author-ities own most of the regional grids and distribution grids.
There are private ownership interests within all activity areas: production, grid activity and trading. Foreign ownership inter-ests are relatively limited in the Norwegian power supply sector, but some foreign companies have been granted trading licences in Norway.

23ENERGY AND POWER SUPPLY
ENERGY AND POWER SUPPLY
2
Photo: E-CO Energi

24
2.1 Production of electricity Norwegian electricity production totalled 134 TWh in 2013. Of this, approximately 129 TWh was produced in hydropower plants, 1.9 TWh in windpower plants and 3.3 TWh in gas-fired power plants and other thermal power plants. The average elec-tricity production has been approximately 135 TWh/year over the last 15 years.
At the start of 2013, the total installed production capacity in Norway was 32 860 MW. Of this, installed capacity in hydro-power plants was 30 509 MW, wind farms 705 MW and gas-fired and other thermal power plants 1646 MW. Norway also has two backup gas-fired power plants with an installed capacity totalling 300 MW. These plants can only be used in special situ-ations and require permits from the Norwegian authorities.
Hydropower Hydropower is production of electricity based on water. The volume of water and the head determine the potential energy in a waterfall. The head is the difference in height between the
water intake and the outlet from the power plant. The water is led from the intake, through pressure shafts, down into the power station. The water reaches the turbine wheel at high pres-sure. The kinetic energy in the water is transferred through the turbine’s drive shaft to a generator that converts it into electrical energy. The water is led from the turbine back into the river at the outlet.
The volume of water that can be led into a hydropower plant depends on the useful inflow and the regulation reservoir’s stor-age capacity.
The water inflow is the volume of water from the drainage basin that can be utilised for electricity generation in the power plant. Precipitation, and thus the useful inflow, varies from one part of the country to another, between seasons and between years. Inflow is highest during the spring snow-melt, and normally declines towards the end of summer. Autumn floods normally provide increased inflow. During the winter months, inflow is normally very low. Over the last 23 years, the annual useful
Figure 2.1: Installed capacity in hydropower plants. As of 01.01.2014.
0
5000
10000
15000
20000
25000
30000
35000
20142013201220102005200019951990198519801975197019601950
Source: NVE
MW
25ENERGY AND POWER SUPPLY
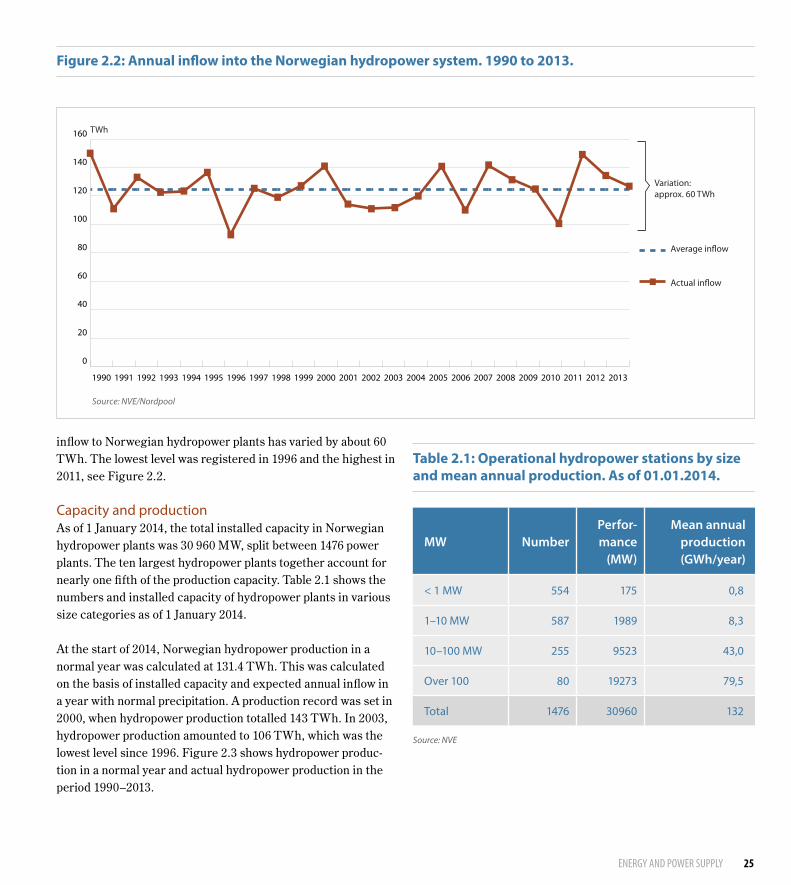
inflow to Norwegian hydropower plants has varied by about 60 TWh. The lowest level was registered in 1996 and the highest in 2011, see Figure 2.2.
Capacity and production As of 1 January 2014, the total installed capacity in Norwegian hydropower plants was 30 960 MW, split between 1476 power plants. The ten largest hydropower plants together account for nearly one fifth of the production capacity. Table 2.1 shows the numbers and installed capacity of hydropower plants in various size categories as of 1 January 2014.
At the start of 2014, Norwegian hydropower production in a normal year was calculated at 131.4 TWh. This was calculated on the basis of installed capacity and expected annual inflow in a year with normal precipitation. A production record was set in 2000, when hydropower production totalled 143 TWh. In 2003, hydropower production amounted to 106 TWh, which was the lowest level since 1996. Figure 2.3 shows hydropower produc-tion in a normal year and actual hydropower production in the period 1990–2013.
0
20
40
60
80
100
120
140
160
Average inflow
Actual inflow
201320122011201020092008200720062005200420032002200120001999199819971996199519941993199219911990
Variation: approx. 60 TWh
Source: NVE/Nordpool
TWh
Figure 2.2: Annual inflow into the Norwegian hydropower system. 1990 to 2013.
MW NumberPerfor-mance
(MW)
Mean annual production (GWh/year)
< 1 MW 554 175 0,8
1–10 MW 587 1989 8,3
10–100 MW 255 9523 43,0
Over 100 80 19273 79,5
Total 1476 30960 132
Source: NVE
Table 2.1: Operational hydropower stations by size and mean annual production. As of 01.01.2014.

26
Figure 2.3: Hydropower production in a normal year and actual hydropower production, 1990 to 2013.
Hydropower production in a normal year
0
20
40
60
80
100
120
140
160
201320122011201020092008200720062005200420032002200120001999199819971996199519941993199219911990
Actual hydropower production
TWh
Source: NVE
Different types of hydropower production Intermittent hydropower productionHydropower plants without storage capacity provide intermit-tent power. They typically include run-of-river hydropower plants and small-scale power plants.
It is difficult to regulate the flow of water in run-of-river hydro-power plants, and the water must generally be used when it is available. Power production will therefore increase considerably during snow-melt or when precipitation is high. In other words production varies with water inflow.
Power plants with an installed capacity of up to 10 MW are called small hydropower plants and are normally divided into the following sub-groups: micro power plants (installed capac-ity up to 0.1 MW), mini power plants (installed capacity up to 1 MW) and small-scale power plants (installed capacity up to 10 MW). Small hydropower plants are often established in small streams and rivers without regulation reservoirs.
Traditional small hydropower plants do not involve any water regulation measures and are therefore only subject to the Water
Resources Act. This may also be the case for larger power plants.
Flexible hydropower productionProduction from power plants connected to regulation reser-voirs is flexible. The potential energy of the water is stored in regulation reservoirs established in lakes or artificial basins made by building dams across a river. In periods when there is high inflow and low consumption, surplus water is collected in the reservoirs. When inflow is low and consumption is high, water can be drawn from the reservoirs to generate power. In particular, water can be retained when rivers are in spate and released during dry periods. Water storage in reservoirs allows a greater share of the run-off to be used in power production, and production can be adjusted to demand.
The reservoir capacity is the amount of power that can be produced from a full reservoir. Rules for reservoir drawdown are set out in a permit which defines the highest and lowest water level, taking into account factors such as topographic and environmental conditions. Dry-year or multi-year regulation is possible by large regulation reservoirs which can store water in

27
years with heavy precipitation for use in years of light precipita-tion. Storing water over the summer for use during the winter when demand for power is highest is called seasonal regulation. Daily and weekly regulation is called short-term regulation.
Table 2.2 shows the ten largest hydropower plants in Norway as of 1 January 2014.
Pumped-storage power plants In pumped-storage power plants, water is pumped up to regula-tion reservoirs with a greater head. A financial return can be achieved because the water’s potential energy increases propor-tionally with the head. If power prices are low, it may be profitable for producers to use power to move the water to a higher reservoir in order to use the water for production when prices are high.
Hydropower potential The hydropower potential is the energy in the Norwegian river systems that it is technically and economically feasible to develop to generate electricity. The NVE has calculated that the Norwegian hydropower potential is 214 TWh/year as of 1 January 2014, using the 1981-2010 inflow period. Of the total hydropower potential, about 49.5 TWh/year can be found in protected river systems and 0.9 TWh/year is in projects where licence applications have been rejected, see Figure 2.4. This potential is therefore not available for development. There is currently a remaining hydropower potential of about 33.8 TWh/year that has not been protected against hydropower develop-ment. The mean annual developed production capacity is 131.4 TWh, in addition to projects under development totalling 1.5 TWh and licences granted for development of an additional 3.6 TWh. A particularly large number of licences has been granted for small hydropower plants.
Most major remaining projects were discussed and classified in the white papers on the Master Plan for Hydropower Develop-ment. The plan sets out an order of priority for projects that can be considered for licensing, and attaches importance to devel-oping the least controversial and less costly projects first. The Master Plan is discussed in more detail in Chapter 1.
Part of the hydropower potential can be developed by upgrad-ing and expanding existing hydropower plants. Upgrades of hydropower plants involve modernising existing power plants in order to utilise more of the water’s potential energy, for example
by using newer turbine or generator technology. Expansion involves larger-scale measures such as transferring water from other drainage basins.
Wind power A wind turbine converts the kinetic energy of wind into electric energy. The main components of a modern wind turbine include a rotor with three blades driving a generator that supplies electricity. The rotor is attached to the nacelle, which is a closed capsule. The nacelle is located at the top of the tower, which is attached to a foundation on the ground, or on the seabed in the case of offshore wind power. Floating offshore wind turbines are under development, but are not yet commercially available.
A modern wind turbine produces electric energy when the wind speed at hub height is between 3-4 and 25 m/s (gentle breeze to
ENERGY AND POWER SUPPLY
Power station
CountyMax
capacity (MW)
Mean annual production (GWh/year)
Kvilldal Rogaland 1 240 3 583
Tonstad Vest-Agder 960 4 357
Aurland I Sogn og Fjordane 840 2 508
Saurdal Rogaland 640 1 334
Sy-Sima Hordaland 620 2 158
Lang-Sima Hordaland 500 1 358
Rana Nordland 500 2 168
Tokke Telemark 430 2 328
Tyin Sogn og Fjordane 374 1 450
Svartisen Nordland 350 2 430
Source: NVE
Table 2.2: The ten largest hydropower plants in Norway, ranked by maximum installed capacity. As of 01.01.2014.

28
storm). At high wind speeds, the blades are rotated so that the force on the wind turbine is not too great, and at wind speeds above 25 m/s, the blades are rotated directly into the wind and locked in place. The effect of the wind passing over a surface is proportional to the wind speed cubed. This means that if the wind speed is doubled, the power output will increase eightfold. Energy production is thus highly dependent on wind conditions. In practice, a wind turbine can utilise up to 40-45 per cent of the kinetic energy in the wind passing the rotor blades.
A wind farm is a facility containing more than one wind turbine. It is advantageous to place the turbines in large farms to make use of economies of scale in turbine installation, road construc-tion, grid connection, the number of structures, operations and maintenance.
Wind power is an inflexible energy source that only supplies energy when the wind is blowing. Other, flexible forms of pro-duction are therefore needed so that production can be adjusted to variations in consumption.
Offshore wind power is a less mature technology and has higher costs than onshore wind power, as installation and operation is more complicated and more expensive than on land. Technol-ogy development and pilot projects for offshore wind power are underway in Norway.
Wind power development in Norway has, so far, not been commercially profitable, and developments have depended on public funding. Until 31 December 2011, Enova funded wind power development. From 1 January 2012, this funding has been replaced by electricity certificates.
Capacity and productionNorway generally has good wind resources, compared with other countries. The average annual wind speed 50 metres above ground in an exposed coastal area in Norway can be 7-9 m/s. As a rule of thumb, an average wind speed of 6.5 m/s is needed for an area to be viable for wind power.
At the start of 2014, Norway had 811 MW of installed wind power, provided by 356 turbines in 20 registered wind farms, see Figure 2.5. In 2013, total production was 1898 GWh. Half way through 2014, 0.1 TWh of wind power was under construc-tion whilst another 9.1 TWh had been licenced. It is unclear whether all this production capacity will be built.
Gas-fired and other thermal power productionThe term gas-fired power plant is often used generically of all power plants where natural gas is used in the production of electricity, and in some cases also heat. There are several types of gas-fired power plants.
A power plant in which all the power is generated by gas tur-bines is called a simple-cycle gas turbine plant. A gas turbine plant can be started and stopped at short notice, and is therefore suitable for production at times of peak demand. Electricity production in gas turbines also generates heat.
In combined cycle gas turbine (CCGT) plants and combined heat and power (CHP) plants, the heat is also utilised, which makes them significantly more efficient than simple-cycle gas turbine plants. Combined cycle power plants use waste heat from the gas turbines to produce additional power using steam turbines. Together, these turbines yield an efficiency of nearly 60 per cent.
Figure 2.4: Overview of hydropower potential. As of 01.01.2014. TWh/year.
Protected/rejected
New power production exceeding 10 MW, incl. upgrades/expansions
Small power plants,incl. upgrades/expansions
Licence applied for/application notified
Development permit granted
Under development
Developed
Source: NVE
131,4
4,8
50,9
13,9
7,7
3,61,5
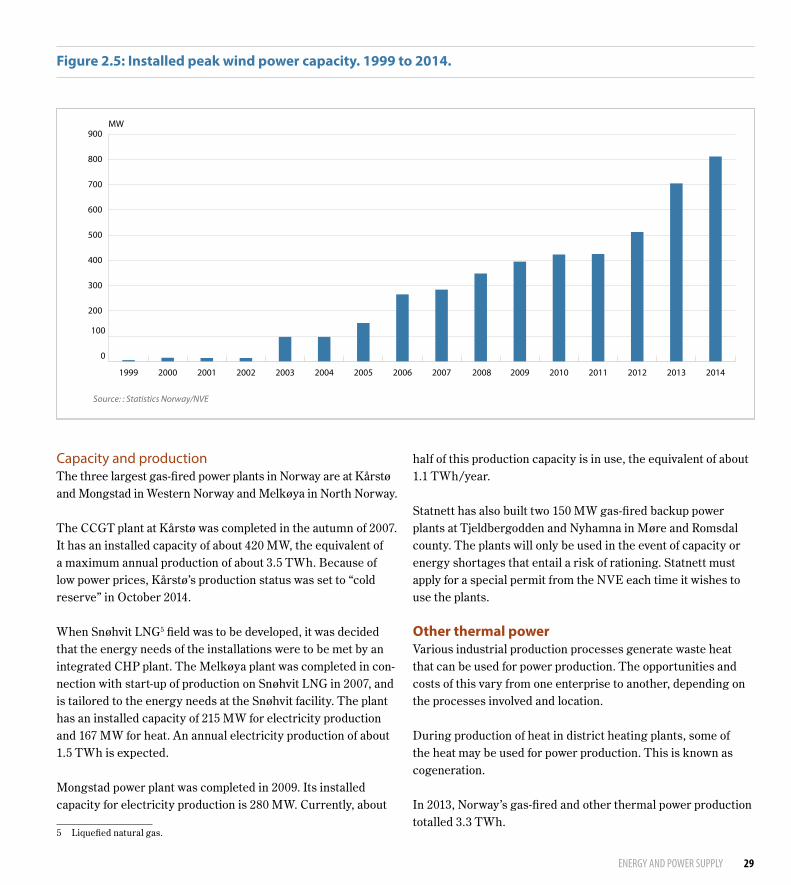
29ENERGY AND POWER SUPPLY
Capacity and production The three largest gas-fired power plants in Norway are at Kårstø and Mongstad in Western Norway and Melkøya in North Norway.
The CCGT plant at Kårstø was completed in the autumn of 2007. It has an installed capacity of about 420 MW, the equivalent of a maximum annual production of about 3.5 TWh. Because of low power prices, Kårstø’s production status was set to “cold reserve” in October 2014.
When Snøhvit LNG5 field was to be developed, it was decided that the energy needs of the installations were to be met by an integrated CHP plant. The Melkøya plant was completed in con-nection with start-up of production on Snøhvit LNG in 2007, and is tailored to the energy needs at the Snøhvit facility. The plant has an installed capacity of 215 MW for electricity production and 167 MW for heat. An annual electricity production of about 1.5 TWh is expected.
Mongstad power plant was completed in 2009. Its installed capacity for electricity production is 280 MW. Currently, about
5 Liquefied natural gas.
half of this production capacity is in use, the equivalent of about 1.1 TWh/year.
Statnett has also built two 150 MW gas-fired backup power plants at Tjeldbergodden and Nyhamna in Møre and Romsdal county. The plants will only be used in the event of capacity or energy shortages that entail a risk of rationing. Statnett must apply for a special permit from the NVE each time it wishes to use the plants.
Other thermal power Various industrial production processes generate waste heat that can be used for power production. The opportunities and costs of this vary from one enterprise to another, depending on the processes involved and location.
During production of heat in district heating plants, some of the heat may be used for power production. This is known as cogeneration.
In 2013, Norway’s gas-fired and other thermal power production totalled 3.3 TWh.
Figure 2.5: Installed peak wind power capacity. 1999 to 2014.
0
100
200
300
400
500
600
700
800
900MW
201420132012201120102009 2008200720062005200420032002200120001999
Source: : Statistics Norway/NVE

30
Other electricity production Norway’s long coastline and large sea areas mean that it has vast offshore energy resources. There are many technological concepts for utilising energy from the sea, including tidal power, osmotic power, tidal barrages and tidal currents. With the exception of tidal barrages, these technologies are still in the development phase. In Norway, solar energy is mainly gener-ated from solar panels mounted on holiday homes in areas not connected to the electrical grid.
2.2 Production of heat In stationary electricity supply, energy sources such as oil, natural gas and biomass are primarily used to produce thermal energy. Geothermal energy, ambient heat and solar energy can also be used to produce thermal energy. The energy can be transported through district heating systems or smaller distribution systems for waterborne heat, or it can be consumed on site. Thermal energy is used to heat buildings and water sup-plies in commercial buildings, housing and industrial buildings. Industry also uses thermal energy for various processes, and district heating is also, in certain cases, used to melt snow off football pitches, pavements, etc.
The consumption figures for oil, natural gas and bioenergy which are presented in the following sub-chapters reflect energy input. The energy output from these energy sources depends on efficiency, which varies with different energy sources and combustion processes.
District heating The technology used to supply consumers with hot water or steam from a central heat source via insulated pipelines is called district heating.
In most cases, district heating plants are constructed where there is access to a low-cost heat source such as heat from waste incineration or other heat which would otherwise be wasted. Waste is the most important energy source in district heating production, but bioenergy, heat pumps, electricity, gas and oil are also used.
Capacity and production Figures for 2012 show that the consumption of district heating totalled 4.2 TWh, see Figure 2.6. Consumption has varied some-
what in recent years, but has nearly tripled since 2000. District heating accounts for about 3 per cent of energy consumption in the domestic stationary sector. In 2012, 67 per cent of district heating was used within the service sector, while households accounted for about 22 per cent and industry 11 per cent.
District heating has been established or is under development in most major cities in Norway.
Oil for stationary combustion The oil used for stationary combustion consists of the following products: heating kerosene, light fuel oil, special distillate and heavy fuel oil. Heating kerosene is primarily used in stoves in private households. Light fuel oil is used both in small house-hold systems and large industrial facilities. Light fuel oil is largely used in water-based central heating systems. Heavy fuel oils are used in large incineration facilities.
Oil products are being used less and less to heat buildings, but consumption varies considerably from year to year due to varia-tions in temperature and energy prices.
Over the last twenty years, the consumption of oil products as a share of stationary energy consumption has declined from about 17.5 per cent to about 12.5 per cent. In 2012, the industrial sector used oil products for stationary purposes corresponding to 3 TWh. Households, the service sector and others used 3.7 TWh of oil products for stationary purposes.6
Biomass Converting biomass through combustion, fermentation or chemical processes yields bioenergy. Biomass includes fire-wood, black liquor from the paper industry7, bark and other wood waste, and also waste from households and commercial activities which is used in the production of district heating. Fuels such as gas, oil, pellets and briquettes can be manufac-tured from biomass.
The extent to which biofuels are used and the purposes for which they are used depend on the availability and quality of the fuel and the emission abatement requirements that apply. The pulp and paper and wood and wood products industries require
6 Includes all petroleum products, including liquefied gas and petroleum coke used for fuel purposes.
7 Black liquor is a residual product of cellulose production, consisting of wood pulp and lye.

31ENERGY AND POWER SUPPLY
large amounts of heat for various curing/drying processes, which makes it possible to utilise the energy in wood waste such as bark and woodchips in large incineration facilities without further processing. Heat from waste incineration can be used to produce district heating and/or electricity. Biofuels used in households and small incineration plants often require more processing to be suitable for transport, storage and handling.
Wood pellets and briquettes are suitable for storage, transport and use in automated incineration plants.
In 2012, registered use of bioenergy in the stationary sector was about 13.7 TWh. The industrial sector accounted for about one-third of this, 4.1 TWh. The remaining 9.6 TWh was primar-ily used in households, in addition to biomass used to produce district heating.
Natural gasNatural gas consists mainly of methane and can be distributed by pipeline, as CNG8 or as LNG. Natural gas has become widely
8 Compressed natural gas.
used in Norway over the last ten years, primarily to replace heavy fuel oils in industry.
In 2013, domestic use of natural gas9 amounted to 506 million Sm3, corresponding to 5 TWh in energy input. This was 12.5 per cent higher than the previous year. The use of propane and butane is not included. Pipelines supplied 41.3 per cent of domestic consumption of natural gas in 2013, while LNG and CNG accounted for 58 and 0.8 per cent respectively.
The industrial sector is the largest consumer of natural gas. The chemical industry used 1.26 TWh for energy purposes in 2013. The metal industry used 0.4 TWh, while the food, beverages and tobacco industry used natural gas equivalent to 0.5 TWh for energy purposes. Households used natural gas cor-responding to 40 GWh in 2013.
9 Net domestic end-user consumption of natural gas (not including natural gas used in the energy sector), excluding natural gas used as raw material. The 2011 figures are preliminary (source: Statistics Norway).
Figure 2.6: Consumption of district heating by different consumer groups (including district heating delive-red to intra-group companies), 1991 to 2013.
0
500
1000
1500
2000
2500
3000
3500
4000
4500
5000
Services
Industries etc
Households
20132012201120102009200820072006200520042003200220012000199919981997199619951994199319921991
Source: : Statistics Norway


ENERGY CONSUMPTION
3
Photo: ColourBox
33ENERGY CONSUMPTION

34
3.1 Factors that influence energy consumption Developments in energy consumption are influenced by general trends in society. Demographic factors such as population development and settlement patterns have an impact on energy demand. On the one hand, population growth leads to an increase in energy consumption because more homes, schools and commercial buildings are built, and all need heating and lighting. Population growth also results in higher consumption of goods and services produced using energy. On the other hand, centralisation of the population as people move from sparsely populated to densely populated areas reduces con-sumption, partly as a result of higher occupant density.
Economic growth entails increased production of goods and services, which in turn leads to higher energy consumption. Energy efficiency measures and changes in industrial structure, with a shift from energy-intensive to less energy-intensive indus-tries, tend to reduce the level of energy consumption. Techno-logical developments usually reduce energy consumption as production processes and products become more energy-effi-cient. Various policy instruments also curb energy consumption,
for example taxes on energy consumption, the EU emissions trading system, regulations relating to technical requirements for buildings and support schemes for investments in energy efficiency measures.
Energy consumption is also influenced by energy prices. Higher energy prices result in higher production costs for industry and the cost of using electricity and other energy carriers in households also rises. This normally moderates consumption. Temperature also has an influence on energy consumption, and temperature variations result in consumption fluctuations from year to year. This is because a large share of energy consump-tion goes towards heating, especially in the service industries and households.
3.2 Energy consumption trends Per capita energy consumption in Norway is somewhat higher than the OECD average, see Figure 3.1. Electricity accounts for a significantly higher share of energy consumption in Norway than in other countries. One of the main reasons for this is the large energy-intensive manufacturing sector in Norway. In addi-
Figure 3.1: Per capita energy consumption in OECD countries in 2012.
0
10
20
30
40
50
60
70
80
Geothermal and solar energy
District heating
Coal/coke
Bioenergy
Natural gas
Petroleum products
Electricity
ItaliaStorbritanniaFrankrikeDanmarkTysklandOECDSverigeNorgeUSAFinlandCanada
Source: OECD
MWh per innbygger
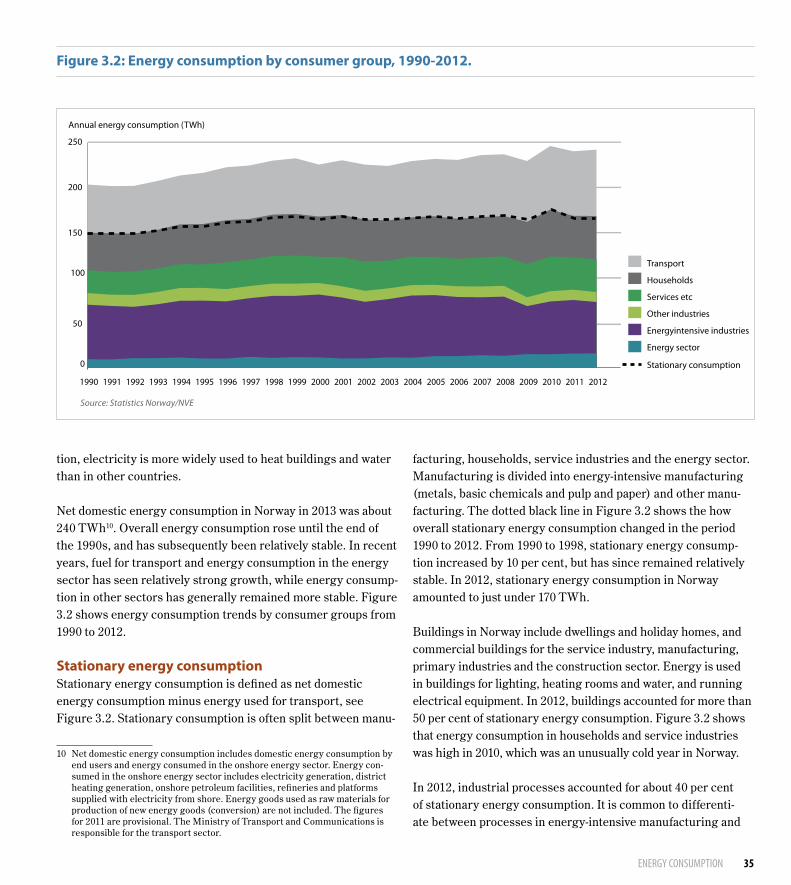
35ENERGY CONSUMPTION
Figure 3.2: Energy consumption by consumer group, 1990-2012.
0
50
100
150
200
250
Transport
Households
Services etc
Other industries
Energyintensive industries
Energy sector
Stationary consumption
20122011201020092008200720062005200420032002200120001999199819971996199519941993199219911990
Source: Statistics Norway/NVE
Annual energy consumption (TWh)
tion, electricity is more widely used to heat buildings and water than in other countries.
Net domestic energy consumption in Norway in 2013 was about 240 TWh10. Overall energy consumption rose until the end of the 1990s, and has subsequently been relatively stable. In recent years, fuel for transport and energy consumption in the energy sector has seen relatively strong growth, while energy consump-tion in other sectors has generally remained more stable. Figure 3.2 shows energy consumption trends by consumer groups from 1990 to 2012.
Stationary energy consumption Stationary energy consumption is defined as net domestic energy consumption minus energy used for transport, see Figure 3.2. Stationary consumption is often split between manu-
10 Net domestic energy consumption includes domestic energy consumption by end users and energy consumed in the onshore energy sector. Energy con-sumed in the onshore energy sector includes electricity generation, district heating generation, onshore petroleum facilities, refineries and platforms supplied with electricity from shore. Energy goods used as raw materials for production of new energy goods (conversion) are not included. The figures for 2011 are provisional. The Ministry of Transport and Communications is responsible for the transport sector.
facturing, households, service industries and the energy sector. Manufacturing is divided into energy-intensive manufacturing (metals, basic chemicals and pulp and paper) and other manu-facturing. The dotted black line in Figure 3.2 shows the how overall stationary energy consumption changed in the period 1990 to 2012. From 1990 to 1998, stationary energy consump-tion increased by 10 per cent, but has since remained relatively stable. In 2012, stationary energy consumption in Norway amounted to just under 170 TWh.
Buildings in Norway include dwellings and holiday homes, and commercial buildings for the service industry, manufacturing, primary industries and the construction sector. Energy is used in buildings for lighting, heating rooms and water, and running electrical equipment. In 2012, buildings accounted for more than 50 per cent of stationary energy consumption. Figure 3.2 shows that energy consumption in households and service industries was high in 2010, which was an unusually cold year in Norway.
In 2012, industrial processes accounted for about 40 per cent of stationary energy consumption. It is common to differenti-ate between processes in energy-intensive manufacturing and

36
other manufacturing. The sector other manufacturing consists of many small enterprises, where it is uncertain how energy consumption is split between industrial processes and industrial buildings. From 2008 to 2009, energy consumption in manu-facturing fell by about 18 per cent as a result of the economic downturn following the financial crisis. The drop in energy con-sumption in 2009 was particularly marked in energy-intensive manufacturing. Energy consumption in manufacturing rose again in 2010 and has remained quite stable since then.
Energy consumption in the onshore energy sector includes elec-tricity generation, district heating generation, onshore petroleum facilities, refineries and platforms supplied with electricity from shore. The greatest proportional growth in consumption has been in the energy sector, with an increase of more than 50 per cent since the early 1990s. This is linked with factors including higher natural gas exports. In 2012, onshore production of energy goods accounted for 10 per cent of stationary energy consumption.
Stationary energy consumption by energy carrier Electricity accounts for the largest share of stationary energy consumption, around 70 per cent. Figure 3.3 shows stationary
energy consumption trends from 1990 to 2012 by energy carrier. The proportion of oil products used in stationary energy con-sumption has declined since the 1990s11. Consumption of coal and coke has declined gradually in recent years, while consump-tion of biomass, gas and district heating has increased.
3.3 Shift in energy consumption and production Many countries are working towards a shift in energy consump-tion and production. What this means in practice may vary depending on the characteristics of the energy supply in the respective countries. Many European countries are seeking to limit the use of electricity based on coal because it entails high CO2 emissions, and some countries are phasing out nuclear power. In Norway, electricity production is based on hydro-power, which means that the supply system is vulnerable to fluctuations in water inflow. In addition, heating of buildings in
11 Energy use for tools and construction machinery such as tractors, excavators, industrial forklifts and private lawnmowers is classified as stationary energy consumption in the energy balance, but is not included here. Energy used as raw material, for transport purposes and in fishing vessels and military air-craft and vehicles is not classified as energy consumption and is not included.
Figure 3.3: Stationary energy consumption by energy carrier, 1990-2012.
0
20
40
60
80
100
120
140
160
180
District heating
Gas
Wood, paper industry waste
Coal/Coke
Oil
Electricity
20122011201020092008200720062005200420032002200120001999199819971996199519941993199219911990
Source: Statistics Norway, NVE
Annual energy consumption (TWh)
36

37ENERGY CONSUMPTION
for actors to find and consider different options. Taxes encour-age a shift in energy production and consumption by making it more expensive to use energy, while support schemes make it cheaper to carry out projects. EU directives and regulations also set a framework for goals and policy instruments available to the Government.
Enova SF and management of the Energy Fund The Energy Fund is a policy instrument intended to promote a shift to more environmentally friendly consumption and produc-tion of energy in Norway and the development of energy and climate technologies. The Energy Fund is a government fund
established to ensure a long-term, predictable and stable source of finance for the energy efficiency and renewable energy initia-tive. The state-owned enterprise Enova manages the Energy Fund. Its management of the fund is governed by a four-year agreement between the Ministry of Petroleum and Energy and Enova. The Energy Fund is financed by means of a levy on the grid tariff, allocations over the state budget and the return on the Fund’s capital in the previous year.
Objectives of Enova’s activities The task of managing the assets in the Energy Fund is set out in a four-year agreement between the Ministry and Enova, which
Norway is largely based on electricity, making the country par-ticularly vulnerable during cold winters. An important aspect of Norway’s shift in energy production and consumption is therefore to limit the use of electricity and fossil energy sources for new applications, in existing buildings and in industry.
In Norway, the rationale for a shift in energy consumption and production is that it is necessary to take into account security of supply, greenhouse gas emissions and the fact that even renew-able electricity generation and transmission has environmental impacts. The work is focusing on:
• Making use of energy carriers other than electricity and fos-sil fuels for heating
• Energy efficiency• Renewable energy production based on sources other than
hydropower.
Shifts in energy consumption and production are often a result of technological development. In addition, Norwegian authori-ties can make use of a range of policy instruments to influence energy consumption and promote energy efficiency. These include regulatory instruments such as technical construction standards; economic instruments such as taxes and support schemes; information and advisory services; and voluntary agreements between the authorities and market actors or industries. Laws and regulations limit the kinds of solutions that can be used, while information and advice make it easier
Box 3.1: Energy efficiency
Energy indicators such as energy consumption per unit of GDP are often used to measure the efficiency of the energy consumption. A simple indicator illustrates how energy-intensive an economy, industry or process is. However, if the energy intensity of a country declines, this does not necessar-ily mean that energy efficiency has improved. This is because changes in energy consumption over time are driven by other factors as well as energy efficiency, such as temperature, behaviour and structural changes in the economy. To estab-lish how much energy efficiency affects energy consumption, it is necessary to distinguish between these factors. Accord-ing to Statistics Norway, energy efficiency measures reduced Norwegian energy use by 18 per cent from 1990 to 2009.
Energy efficiency is a measure of how much output in the form of comfort or production is obtained from a certain input of energy. Energy efficiency rises if a given number of square metres in a home can be heated using a lower energy input, or if a given number of tonnes of paper can be produced with a lower energy input. However, if the area to be heated or the production increases at the same time, energy consumption may increase. Thus, energy efficiency is not the same as energy saving. Energy savings are associated with actions that reduce energy consumption as a consequence of a reduc-tion in output. Typical energy saving initiatives are lowering the room temperature or turning off the lights.

38
specifies the objectives of the activities, the tasks to be car-ried out, system requirements and requirements for reporting. The current agreement covers the period 1 January 2012 to 31 December 2015.
Enova’s activities are intended to promote a shift towards more environmentally friendly energy consumption and production, in the short and the long term, and the development of energy and climate technologies. The main objectives set out in the agreement indicate the areas in which Enova is to operate.
Enova’s management of the assets of the Energy Fund shall contribute to:
a. Development and market introduction of new energy and climate technologies.
b. More efficient and flexible use of energy.c. Greater use of energy carriers other than electricity, natural
gas and oil for heating purposes.d. Greater use of new energy resources, including energy
recovery and bioenergy.e. Better functioning markets for energy-efficient and environ-
mentally- and climate-friendly solutions.f. Public awareness about the opportunities to use energy-
efficient, environmentally- and climate-friendly solutions.
The agreement stipulates an overall energy target that Enova must meet by the end of the agreement period. For the period up to the end of 2015, Enova is required to achieve overall energy and climate results corresponding to at least 6.25 TWh. The agreement also requires that work on energy and climate technology must result in a reduction of greenhouse gas emis-sions and promote a long-term shift in energy consumption and production through the development and market introduction of new technologies and new solutions. Enova must focus its efforts on the development of new technology and support for techno-logies and solutions close to market introduction.
From 2015 onwards, Enova will also take over the tasks of Transnova, which was established to work for a reduction in greenhouse emissions from the transport sector. In addition, Enova will be responsible for managing a rights-based scheme for energy efficiency projects in private households. The new tasks will be included when the current agreement between the Ministry and Enova is revised.
SectorAllocated
(mill. NOK)Contracted
GWh/year
Industry 718 920
Buildings 1 326 1 097
Renewable power 770 741
Installations 17 27
New technology 292 72
Households 277 106
Sum 3 400 2 963
Source: Enova1 . All numbers have been corrected for cancelled projects
Table 3.1: Enova’s allocations and contractual energy results, 2012-2013.1
38
Enova’s market areas Enova’s approach varies according to the barriers that must be addressed and the conditions in different market areas. A brief description of the market areas is provided below.
Renewable heating Enova manages the assets in the Energy Fund to promote the use of energy carriers other than electricity, natural gas and oil for heating. Some schemes are for small heating plants and others for larger district heating plants. Enova also has a sup-port scheme for industrial production of biogas.
Industry Enova offers investment grants for energy efficiency measures, conversion to renewable energy sources and energy recovery in industry. It is also possible to apply for pre-project support. Grants are also available for introduction of energy management systems in industry.
Non-residential buildings Enova offers investment grants for projects to reduce energy consumption and for conversion to heat production based on

39
New energy and climate technologies Enova offers investment grants for full-scale demonstration pro-jects involving new energy and climate technology under real-life operating conditions. Enova has a particular responsibility for support for new energy and climate technologies in industry.
Enova’s advisory and information activities Enova runs a number of information and advisory activities targeting businesses, municipalities, households, children and young people. These include an answer service (Enova svarer), labelling of recommended products (Enova anbefaler), a website for children (regnmakerne.no) and courses for municipalities. Enova also participates in joint projects such as a low-energy programme involving central government agencies and the construction industry.
Results of Enova’s work, 2012-2013Enova reports the results of grants allocated to projects in the form of contractual, reported or achieved energy results. Many of the projects run over several years. The expected results of a project are specified in the contract between Enova and the
ENERGY CONSUMPTION
SectorAllocated
(mill. NOK)Contracted
GWh/yearInitiated
GWh/yearFinally reported
GWh/yearRealised
GWh/year
Industry 868 3 749 738 1 821 904
Buildings 1 807 3 252 1 213 1 077 876
Renewable power 2 422 2 107 1 005 846
Renewable heat 2 415 4 740 1 607 1 261 1 440
Bierefining 38 906 40 733
New technology 376 86 14 20 6
Households 422 52 49 2
Sum 8 348 14 892 3 661 5 186 4 805
Source: Enova1 . All numbers have been corrected for cancelled projects
Table 3.2: Enova’s allocations, contractual energy results, projects initiated, final reported and achieved energy results by market areas, 2001-20111
renewable energy sources in existing buildings and installa-tions. Support is also provided for the introduction of energy management. In addition, Enova has an initiative for anyone who wants to build or rehabilitate buildings to a higher stan-dard than required by Norway’s the Technical Regulations for buildings, which currently focuses on low-energy buildings and passive houses. Enova also offers grants to pre-project support for passive houses.
InstallationsEnova offers investment support for projects for various types of outdoor installations and for the introduction of energy manage-ment in companies running such installations.
Residential buildings Since 2006, Enova has managed a grant scheme promoting the deployment of mature technologies for environmentally friendly heating and electricity saving, that are currently not widely used. From 2015, this scheme has been made rights-based, so that there is a predefined set of measures for which costs will be refunded without the need to apply in advance.

40
recipient of the grant. When the project is completed, the figure is revised, and after the installations has been operating for a couple of years, the contractual result is corrected using the final reported figures to give the most accurate figure possible for what has actually been achieved.
Achieved energy results are actual figures from completed instal-lations. Once a project has been initiated and grant payments have been started, the risk of cancellation is considered to be low.
During the two first years of the current agreement period, Enova has achieved a contractual energy result of just under 3 TWh/year at a cost of NOK 3.4 billion, see table 3.1. These are the overall results from six different market areas. Non-residen-tial buildings contributed the largest share, closely followed by industry. The results were mainly achieved by energy efficiency measures, conversion from fossil to renewable energy sources and new energy production from renewable sources.
Results of Enova’s work, 2001 to 2011 From 2001 to 2011, Enova has provided grants for projects with a contractual result of 14.9 TWh/year. Total grant allocations to these projects are NOK 9.3 billion. About 75 per cent of the con-tractual energy result (10 TWh/year), has been finally reported or achieved, see Table 3.2. If a final report has been received for a project, construction of the installation is complete
Other policy instruments that affect energy consumption
The carbon tax, the emissions trading system and the tax on electricity consumptionEnergy consumption is also influenced by energy prices and taxes. Norway has several energy-related taxes.
Fuel oil, kerosene and natural gas are subject to the carbon tax. The rates for mineral oil (fuel oil, kerosene, etc.) are about NOK 220/tonne CO2 for light oil and about NOK 185/tonne for heavy oil. This results in a tax rate of NOK 0.59 per litre of oil. The carbon tax also applies to the use of natural gas and LPG12, at the same rate as for light oil. Other taxes include a base tax on fuel oil and a sulphur tax.
Norway is part of the EU Emissions Trading Scheme (EU ETS), and this also influences power prices in Norway. As the Norwe-gian and Nordic power markets are connected to the European power market, price increases in the European market influence Norwegian prices.
The tax on electricity consumption applies to electricity delivered to consumers and is collected by the grid companies. In 2012, the tax rate was NOK 0.1139/kWh. Industry is exempt from this tax. The Ministry of Finance publishes more details on energy taxes in connection with the budget (Prop. 1 LS (2012-2013)).
Guarantees of originUnder the scheme for guarantees of origin, all producers of electricity from renewable sources are entitled to obtain such guarantees. The EU introduced this scheme through the Renew-ables Directive, and Norway is required to implement it.
A guarantee of origin is merely a confirmation that one megawatt hour (MWh) of electricity has been produced from a specified energy source. Guarantees of origin are tradable. Participation in the scheme is voluntary for producers and buyers of electricity.
The Technical Regulations for Buildings The Technical Regulations for buildings (TEK10) under the Planning and Building Act set out energy requirements for buildings. These can be met either by implementing specific measures described in the regulations, or by meeting their requirements for total net energy need. For energy supply, it is a requirement that at least 60 per cent of the net heating need can
12 Liquefied petroleum gas.
Figure 3.4: Energy label for washing machines.
Kilde: NVE
40

41ENERGY CONSUMPTION
be obtained by energy supplies other than direct acting elec-tricity or fossil fuels in buildings exceeding 500 m2 in size. In buildings smaller than 500 m2, the requirement is at least 40 per cent of the net heating need. There is also a ban on installation of oil-fired boilers to provide base-load capacity.
Regulatory measures resulting from EU directives and decrees The Energy Labelling Directive, the Ecodesign Directive and the Energy Performance of Buildings Directive have been imple-mented in Norwegian legislation. Below is a brief description of the effect of these directives on energy consumption. See also Chapter 1 for a general description of the EU energy directives.
Energy labelling of household appliancesThe framework directive relating to energy labelling of house-hold appliances sets out information requirements for manu-facturers and suppliers. Products subject to the directive must be marked with their energy efficiency class to help consumers choose the most energy-efficient products. The products are rated on a seven-point scale (A+++ – D, A++ – E, A+ – F or A – G), which is displayed on the energy label on the product. Figure 3.4 shows an energy label for washing machines.
The EU is drawing up product-specific requirements under the directive on an ongoing basis. So far, rules have been drawn up and introduced in Norway for televisions, household refrigera-tors and freezers, household dishwashers, household washing machines, air conditioners, household tumble dryers, combined washing machine and tumble dryers, lighting and electric ovens.
EcodesignThe Ecodesign Directive sets requirements for improving the environmental performance of energy-related products for sale in the EEA. The directive is aimed at manufacturers/importers and covers the household sector, the service sector and industry (except means of transport). If products meet specified ecode-sign requirements, they qualify for CE marking, and can be sold throughout the EEA. Ecodesign requirements are intended to remove the least energy-efficient products from the market and reduce environmental impact of energy-related products at all stages of their life cycle.
As for products covered by the Energy Labelling Directive, the EU is drawing up product-specific rules under the Ecodesign
Directive on an ongoing basis. So far, rules have been drawn up and introduced in Norway for cover simple set-top boxes, electricity consumption in standby and off mode of electrical and electronic household an office equipment, household lamps, fluorescent lamps for office and street lighting, external power supplies, electric motors, household refrigerating and freezing appliances, circulators and water pumps, air conditioners and comfort fans, household dishwashers and washing machines, industrial fans, household tumble dryers and televisions.
Energy performance of buildingsThe 2002 Energy Performance of Buildings Directive contains provisions requiring minimum requirements for the energy performance of buildings, requirements for energy certification of buildings and requirements relating to inspection of boilers using fossil fuels and of air conditioning systems. To implement these provisions in Norway, a requirement was introduced on 1 July 2010 making it mandatory to hold an energy performance certificate whenever a building is constructed, sold or rented out. The energy certification scheme is intended to put energy performance on the agenda in the market for housing and other buildings, and when new buildings are planned, and to promote energy efficiency measures. Inspection of large heating, ventila-tion and air conditioning systems has also been made mandatory to encourage sound operation and inspection routines. In Nor-way, energy certificates can be obtained free of charge online13.
The heating rating on the energy performance certificate indi-cates the extent to which the building can be heated (rooms and hot water) by energy carriers other than fossil fuels and electricity.
The energy efficiency ratings on the certificate are between A (very energy-efficient) and G (low energy efficiency). The rat-ing gives an overall assessment of the building’s energy need, i.e. energy in kWh required per square metre for normal use. The rating process applies standard values for factors such as number of residents, indoor temperature and air quality. The energy rating is based on an estimate of delivered energy, and is independent of actual measured energy consumption. Buildings that meet the requirements of the 2010 Technical Regulations will normally be rated C or D, while older buildings built in accordance with less strict regulations will have lower ratings. Low-energy buildings and passive houses with efficient heating systems can achieve the rating A or B.
13 See www.energimerking.no

42
Box 3.2: Household energy consumption trends – a historical perspective
Electricity simplified the work and improved family hygiene. Close connections were established between housewife organisations, manufacturers of electrical appliances and power plants. Hotplates, heaters and irons were the most common electrical appliances in Norwegian homes in the 1920s and 1930s. Housework became significantly easier with electrical appliances. It was said that with an electric iron, you could iron as much in one hour as you could manage in a whole day before.
In 1945, one fifth of the Norwegian population still had no access to electricity. The differences between regions were significant. Nearly all households in Oslo, Akershus and Bergen had electricity. In the northernmost counties, the situ-ation was very different. In Nordland and Troms, only 42 per cent of the population had access to electricity, while only one in five in Finnmark had access to electricity at the end of the
This text was prepared by Statistics Norway.
The incandescent light bulb was invented in the late 1870s, and lighting was the first electrical application of interest in Norway. Until the first power plants were built in the late 1800s, kerosene lamps were the dominant source of lighting in Norway. At the beginning of the 1900s, only 10 per cent of Norwegian population had electric lighting at home.
As lighting was the first and most important electrical appli-cation in Norway, the number of lamps was recorded in the earliest electricity statistics. In 1911, there were about 805 000 incandescent lamps in Norway, used by industrial and commercial enterprises and 2.4 million inhabitants. In 1923, the number of incandescent lamps had risen to 5 million.
As time went on, electricity was used in for increasing num-ber of applications. The kitchen was an important workplace.
Table 3.3: Percentage of households owning various electrical appliances. 1974–2012.
1974–1976
1980–1982
1983–1985
1986–1988
1989–1991
1997–1999
2000–2002
2003–2005
2005–2007
2007–2009
2012
Freezer compartment, freezer (separate)
67 75 76 92 92 91 92 91 93 92 93
Dishwasher 6 17 20 32 37 59 61 66 72 75 80
Washing machine
74 79 83 87 89 88 89 88 90 89 91
Tumble dryer, drying cabinet
: : : 26 32 39 40 42 45 45 47
TV 24 72 81 93 95 95 95 95 96 95 95
VCR : : 9 23 37 68 71 72 74 78 75
Camcorder : : : : 5 23 24 26 31 31 32
PC : : : : 10 53 59 71 78 84 91
Source: The Consumer Survey, Statistics Norway

43ENERGY CONSUMPTION
Second World War. In addition, the power supply was insuf-ficient to meet consumer demand in the post-war period. By 1960, almost all Norwegians had access to electricity, except in Finnmark where 10 per cent were still without electricity.
Fully automatic washing machines came on the market in the late 1930s, but neither washing machines nor refrigerators became common until the late 1940s. A consumer boom in household appliances started in the 1950s. Electric refrigera-tors, washing machines and vacuum cleaners all became common. In 1967, three quarters of the population had refrigerators, while from the 1980s almost all households had refrigerators. Before refrigerators became common, outbuild-ings, larders and cold cellars were used to store food.
In time, electric shavers, record players, tape recorders and TVs also became more widespread. In 1975, one in four had a TV, rising to about 95 per cent from 1990. A large propor-tion of TVs were produced by Norwegian companies such as
Tandberg, Radionette and Luma. In the early 1970s, colour TVs became available in Norway. Personal computers are the appliances that have seen the most rapid rise in household penetration since 1990. In 2008, 84 per cent of households had a computer, as against with 10 per cent in 1990. Table 3.3 shows the percentage of households with different types of electrical appliances. However, many households have more than one of each appliance, particularly to TVs and comput-ers. Based on information about the number of electrical appliances per household and the number of households, the total numbers of various types of appliances have been calcu-lated, as shown in Figure 3.5. According to a report on power consumption of appliances (Xrgia 2011), the annual power consumption of a TV averages about 260 kWh per year. Given a total number of 3.4 million TVs, they consume about 890 GWh, or slightly less than 1 TWh a year (if all are used for the same amount of time). In 2009, there were roughly equal numbers of computers and TVs in Norwegian homes, but computers, especially laptops, use less electricity on average.
0,0
0,5
1,0
1,5
2,0
2,5
3,0
3,5
4,0
PC
TV
Tumble dryers
Washing machines
Dishwashers
Refrigerators/fridge-freezers
Freezers
201220092008200720062005200420032002200120001999199819971996199519941993199219911990
Source: Calculated on the basis of data from the consumer survey and household statistics, Statistics Norway
Figure 3.5: Inventory of electrical appliances in Norwegian households. 1990-2012. Millions1.

44
Total electricity consumption by computers will therefore be somewhat lower.
The development of power supplies which facilitated the consumer boom in electrical appliances and heaters in the 1950s is reflected in the rapid increase in per capita electricity consumption in the 1900s. Each person used about 600 kWh of electricity on average in the 1930s, rising to 2000 kWh in the 1960s and about 7000-8000 kWh from the 1990s onwards. The level of household electricity consumption in Norway is one of the highest in the world. However, we do not use more energy overall than other countries with a similar climate; the energy mix is different, with a very high proportion of electricity.
References:
Statistics Norway, Historical statistics
Statistics Norway, Survey of consumer expenditure
Directorate of Electricity 1923. Electricity statistics
Xrgia (2001). Main survey of electricity consumption in households;
http://www.nve.no/PageFiles/15092/Hovedrapport_Elbrukende_apparter.pdf
Norwegian Museum of Science and Technology
0
5000
10000
15000
20000
25000
Consumption per household
Consumption per capita
2012201120102005200019951990198519801975197019651960195519501945194019351930
Source: Annual electricity and demographic statistics, Statistics Norway
Figure 3.6: Electricity consumption by households 1930-2012. KWh per capita and per household.

45ENERGY CONSUMPTION
Box 3.3: Energy consumption in manufacturing and the energy sectors since 19701
1 Energy used as raw material is not included in the figures in this chapter. Energy used as raw material amounted to about 23 TWh in 2010 and was mainly used in industry.
ures and the closure of several plants in the energy-intensive manufacturing sector.
Electricity has been the most important energy commodity in manufacturing throughout the period. In 2013, electricity consumption was 42 TWh, corresponding to 63 per cent of the total energy consumption. Oil products, along with elec-tricity, were the dominant energy commodities in the 1970s, but the share of oil has fallen from 37 per cent of total energy consumption to 8 per cent. Instead, consumption of gas and biomass has risen.
This text was prepared by Statistics Norway.
Manufacturing is often divided into energy-intensive manu-facturing (metals, basic chemicals and pulp and paper) and other manufacturing. Figure 3.7 shows that energy consump-tion in manufacturing totalled 67 TWh in 2013, correspond-ing to 31 per cent of total domestic end-use. Energy-intensive manufacturing accounted for 50 TWh of this. In 1970, manu-facturing was responsible for almost half of total domestic end-use of energy. Energy consumption in manufacturing rose throughout the 1990s, but has been declining since then. This is linked to the introduction of energy efficiency meas-
Figure 3.7: Energy consumption in manufacturing by energy commodities, 1970–2013. TWh.
Source: Statistics Norway
0
10
20
30
40
50
60
70
80
90
Coal/Coke
Electricity
Gas
Oil
Wood, paper industry waste
Coal/Coke
20132000199019801970
Energy use in manufacturing and the energy sectors is related to industrial processes and mainly driven by produc-tion. Energy consumption in manufacturing has remained almost unchanged since 1970, the production measured in fixed NOK has increased by 150 per cent. New technology and efficiency measures may explain why the energy con-sumption has increased less than production. In addition, the industry mix has changed over time. The engineering
industry and food industry account for an increasing share of the production value, while using a small percentage of the total energy.
The energy sectors include producers (including refiner-ies), distributors and sellers of oil, gas, district heating and electricity. Consumption in the energy industries is not considered to be part of total domestic energy end-use, but

46
Figure 3.8: Energy consumption in the energy sectors by energy commodities, 1970–2013. TWh.
Source: Statistics Norway
0
10
20
30
40
50
60
70
District heating
Electricity
Gas
Oil
Coal/Coke
20132000199019801970
is included in consumption in energy-producing industries in the energy balance.
Figure 3.8 shows that the energy sectors used a total of 61 TWh of energy in 2013. Energy use in connection with oil and gas production accounted for 51 TWh of this. Oil refiner-ies used 8.6 TWh and the remainder is split among the other energy sectors.
Consumption was low in 1970 because Norway did not start producing oil and gas until 1971. Oil refineries, coal mining and coke plants were the energy consumers in 1970.
There has been substantial growth in energy consumption in oil and gas production since 1970, and gas accounted for 81 per cent of total consumption in 2013. Today, platforms on the Norwegian shelf are mainly powered by gas turbines, except for a few that are supplied with electricity from shore.
Oil and gas production is power-intensive. Considerable amounts of energy are required to pump oil and gas from the ground and to process and compress the products.
Physical oil production peaked in 2000 and has fallen every year since, but gas production has continued to rise. Over-all, energy consumption per unit of oil and gas physically produced has increased from 2000 to 2013. This can be partly explained by the increase in the share of gas production in the period. Gas is more energy-intensive to produce and transport to recipients than oil. The production phase is also important. It is more energy-intensive to produce oil and gas from a field in the start-up or late phase than in the plateau phase.
2 Ikke medregnet naturgass faklet på oljefelter og terminaler.
47THE ELECTRICITY GRID
THE ELECTRICITY GRID
4
Photo: Hilde Totland Harket

48
4.1 The electricity is critical infrastructure Generation, transmission and trading are the three fundamen-tal functions of the power supply system. A reliable supply of electricity is absolutely essential in modern society. In business and industry, the public service sector and households, reliable access to electricity is considered a matter of course. Almost all important public services and functions are critically dependent on a well-functioning power system with a reliable supply of elec-tricity. The electricity grid provides one of the basic functions of the power supply system, and constitutes key infrastructure in any modern society.
The function of the electricity grid is to transport electricity from producers to consumers, in the volumes and at the time requested by consumers. Electricity must be generated in the same second as it is consumed. Consequently, a vital feature of the power system is the maintenance of a balance between total generation and total consumption of power at all times, called the instantaneous balance. This means that very high grid capacity is required.
4.2 Description of the electricity grid The distribution grid consists of the local electricity grids that normally supply power to end users such as households, ser-vices and industry. The distribution grid has a normal voltage of up to 22 kV, but this voltage is reduced to 230 V for delivery to ordinary consumers. The length of the distribution grid carry-ing over 1 kV constitutes just under 100 000 km.
The regional grid is often the link between the central grid and the distribution grid, but may also include production and consumption radials carrying higher voltages. The total length of the regional grid is approximately 19 000 km.
The central grid constitutes the “highways” of the power system, which link producers and consumers in a nationwide system. The central grid also includes interconnectors, which provide links to other countries’ networks and make it physically possible to export and import power as needed, see Chapter 5. The capacity of the central grid is high. It normally carries a voltage of 300 to 420 kV, but in certain parts of the country there are also lines carrying 132 kV. The total length of the central grid is about 11 000 km.
The extent to which underground and subsea cables are used rather than overhead lines differs between the three grids. Cables make up three per cent of the central grid, eight per cent of the regional grid and 40 per cent of the high-voltage distribu-tion grid.
Large power plants can be connected to the central grid, while smaller plants can be connected to either the regional grid (small wind farms and small-scale power plants) or the distribu-tion grid (the smallest categories of power plants). Small-scale consumers are connected to the distribution grid while major consumers such as power-intensive manufacturing may be con-nected directly to the regional or central grid.
During electricity transmission, some energy is lost from the system. Transmission losses are lower at high voltages than at lower voltages. This is one reason why long-distance transmis-sion, which is the primary function of the central grid, is carried out at high voltages. The quantity of electrical energy lost from all parts of the Norwegian electricity grid is normally about 10 TWh/year, or about eight per cent of the normal annual produc-tion.
4.3 The electricity grid is a natural monopoly Building electricity grids is expensive, but the average cost per unit transported declines as the degree of utilisation of the grid increases until it approaches maximum capacity. This means that it is inefficient for society to build parallel power lines if the existing lines provide sufficient transmission capacity. Parallel lines may also result in undesirable land use patterns and be unnecessary eyesores. The power grid is therefore a natural monopoly, and grid operations are therefore not open to compe-tition.
Because the grid is a natural monopoly, users are tied to their local grid company. The authorities have established extensive control of monopoly operations to prevent the grid companies from exploiting their position and to regulate their activities. The goal is to ensure that users do not pay too much for the grid and at the same time ensure that investments in the grid are sufficient to ensure capacity and quality. Grid operations are regulated using a combination of direct and indirect policy instruments. The Energy Act and associated regulations set out the framework for transmission operations. Direct regulation
48
49THE ELECTRICITY GRID
of this kind involves explicit requirements or orders relating to grid operations, for example as regards quality and reliability of supply. Indirect regulation of grid operations is based on economic incentives, see Chapter 5.
Inspection and enforcement is also of key importance. The NVE is responsible for inspection and enforcement for grid opera-tions, and may issue orders for compliance with regulations and licencing terms. Grid services must be offered at non-discrimi-natory and objective point tariffs and conditions, and all custom-ers must have access to the power market, see Chapter 5.
Grid companies that are also engaged in activities other than grid operations must keep separate accounts for their monopoly operations. Monopoly controls are designed to ensure that costs related to generation and sale of electricity are not charged to grid operations.
4.4 Statnett SF Statnett is the transmission system operator in Norway, and is responsible for maintaining the balance between generation and consumption of electricity at all times. Statnett is also respon-sible for the sound economic operation and development of the central grid. Statnett is subject to monopoly controls by the NVE.
Statnett is responsible for continuously assessing and develop-ing the necessary tools to maintain the instantaneous balance even when there is a severe energy or capacity shortage. These include energy option to reduce consumption and the use of reserve power plants. Statnett is also required to assess regu-larly whether new tools are needed to ensure that the instanta-neous balance is better maintained than today.
Furthermore, Statnett has a key role in the development and operation of cross-border interconnectors. This includes extensive cooperation with transmission system operators and regulators in other European countries. The transmission system operators cooperate through the European Network of Transmission System Operators for Electricity, ENTSO-E.
Nord Pool Spot AS organises physical trade in power on the Nordic power exchange. The Nordic transmission system opera-tors have the largest ownership interests in Nord Pool Spot, and other owners are the transmission system operators in Estonia, Latvia and Lithuania.


51THE POWER MARKET
THE POWER MARKET
5
Photo: Scandinavian Stockphoto

52
5.1 Introduction Norway is part of a joint Nordic power market with Sweden, Denmark and Finland, and this is in turn integrated into the European power market through interconnectors to Germany, the Netherlands, Estonia, Poland and Russia. Several other interconnectors between the Nordic countries and the rest of Europe are also planned.
The Energy Act, which provides the overall framework for the organisation of the power supply in Norway, is based on the principle of market-based power trading. Sweden, Denmark and Finland, and most other EU countries, have similar legislation.
An electricity grid that provides a continuous well-developed power grid with access for all players is an essential basis for a well-functioning power market, and thus power system. There are no opportunities for competition within grid operations as there are in the rest of the power market, because grid opera-tions are considered to be a natural monopoly. The grid com-panies are regulated by the authorities, for example through revenue cap regulation and rules for setting grid tariffs. All consumers and producers connected to the electricity grid pay tariffs to their local grid company for electricity transmission.
Power supplied to the grid follows the laws of physics and flows down the path of least resistance. It is not possible to separate different power deliveries from each other. A consumer who switches on the power has no way of knowing who produced the electricity or how far it has been transported through the grid. The grid companies keep account of how much power each producer delivers and how much each consumer uses, and this forms the basis for settlement. Producers are paid for the volume of power they deliver and end users pay for their consumption.
Statnett is the transmission system operator in Norway, and is responsible for the overall physical coordination and manage-ment of the country’s power system. For more information about Statnett, see Chapter 4.4.
5.2 Organisation of the power market The power market is an important tool for ensuring cost-efficient utilisation of the power system. Electricity is different from other goods in that it cannot easily be stored. There must
therefore always be an exact balance between generation and consumption. In market-based trading, the power exchange sets daily prices that give a planned balance between overall genera-tion and consumption for every hour of the next day. Thus, the market and all its players contribute to reliable and efficient operation of the power supply system.
All producers who supply power to the grid and all consum-ers who utilise power from the grid are players in the power market. Power suppliers who trade power on behalf of small and medium-sized end users, households and small-scale busi-nesses and industry, also participate.
The power market can be divided into wholesale market and end-user markets. Large volumes are bought and sold in the wholesale market, and the players are power producers, power suppliers, brokers, energy companies and large-scale consum-ers. In the Nordic countries, these players trade on the Nord Pool Spot energy exchange, or bilaterally. In 2013, 84 per cent of Nordic and Baltic power production was traded on Nord Pool Spot. In the end-user market, individual consumers enter into agreements to purchase power from a power supplier of their choice. Norway’s end-user market consists of about one-third household customers, one-third industry and one-third medium-sized consumers, such as hotels and chain stores. See Box 5.1 for a more detailed discussion of the financial markets.
The market price of power, which is determined each day on the Nord Pool Spot power exchange, is a result of supply and demand. Variations in precipitation and temperature result in considerable fluctuations in power prices, both within 24-hour periods and through seasons and years. The prices also depend on transmission conditions, both between areas and countries within the Nordic region and between the Nordic region and the rest of Europe. Since there are periodic capacity limitations in the grid, power prices may vary from one area to another.
Efforts are currently under way to establish an integrated power market in Europe. In recent years, European system operators and power exchanges have worked on projects to establish price coupling in the European power markets. In winter 2014, the North-Western European Price Coupling project was launched, involving Central Western Europe, the United Kingdom, the Nordic and Baltic countries, and a link between Sweden and Poland. Price coupling between the North-Western Europe and
52

53THE POWER MARKET
Box 5.1: Financial power tradingThe system price determined on Nord Pool Spot is used as the reference price in the financial contracts on NASDAQ OMX. The financial products include future and forward contracts, contracts for difference and options.
Future and forward contracts are agreements on financial set-tlement of an agreed power volume for an agreed time period at an agreed price. For future contracts, settlements takes place during both the trading and the delivery period, while settlements are only made during the delivery period for forward contracts. Future and forward contracts only hedge against fluctuations in the system price. Contracts for differ-ence (CfDs) are forward contracts that cover the difference between the area price and system price. Options involve the right to buy or sell a forward contract in the future at an agreed price. NASDAQ OMX only lists European options.
Financial power trading includes trading with financial instru-ments used for risk management, price hedging and specula-tion. All contracts in the financial power exchange are settled financially without any physical power deliveries. Financial products are often called long-term contracts because they last for more than one day.
Financial power trading can take place both bilaterally and on the power exchanges. For exchange trading, the day-ahead market on the physical power exchange forms the basis for the financial power market. In the Nordic countries, financial trad-ing takes place mainly on the NASDAQ OMX Commodities AS (NASDAQ OMX) exchange. NASDAQ OMX has a licence from the Financial Supervisory Authority of Norway, which also conducts audits. At NASDAQ OMX, players can hedge prices for purchase and sale of power for up to six years ahead, split by days, weeks, months, quarters and years.
Figure 5.1: The different power markets.
Source: OED
South-Western Europe markets was implemented in the spring of 2014. The EU is also preparing legislation that will make mar-ket coupling binding and provide a framework for an integrated European electricity market. Market coupling is intended to
ensure that the power flows in accordance with prices, thus ensuring optimal use of capacity and production resources.
Financial market
6 years – 24 hrs before hour of operation
36 hrs – 1 hr before hour of operation
Hour of operation (current hour)
After the hour of operation
Physical market
Time
Balance accounting
NASDAQ OMX NORDPOOL spot Statnett Statnett
Balancing power market- Primary regulation- Secondary regulation- Regulating power market(tertiary regulation)
Elspot –day-ahead market
Elbas –intraday-market
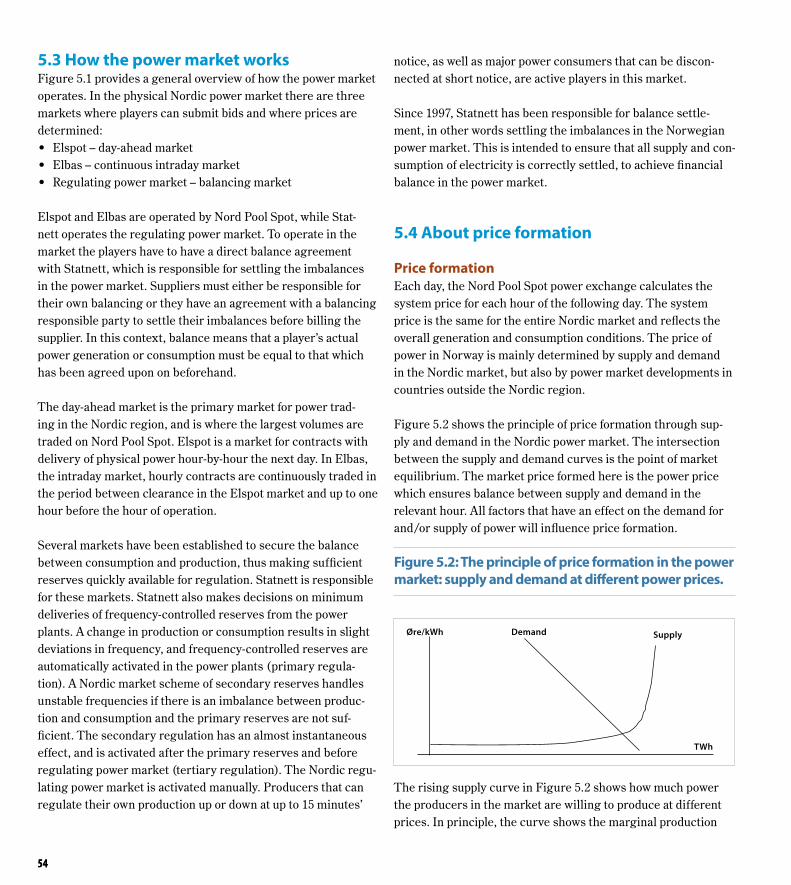
54
5.3 How the power market works Figure 5.1 provides a general overview of how the power market operates. In the physical Nordic power market there are three markets where players can submit bids and where prices are determined:• Elspot – day-ahead market• Elbas – continuous intraday market• Regulating power market – balancing market
Elspot and Elbas are operated by Nord Pool Spot, while Stat-nett operates the regulating power market. To operate in the market the players have to have a direct balance agreement with Statnett, which is responsible for settling the imbalances in the power market. Suppliers must either be responsible for their own balancing or they have an agreement with a balancing responsible party to settle their imbalances before billing the supplier. In this context, balance means that a player’s actual power generation or consumption must be equal to that which has been agreed upon on beforehand.
The day-ahead market is the primary market for power trad-ing in the Nordic region, and is where the largest volumes are traded on Nord Pool Spot. Elspot is a market for contracts with delivery of physical power hour-by-hour the next day. In Elbas, the intraday market, hourly contracts are continuously traded in the period between clearance in the Elspot market and up to one hour before the hour of operation.
Several markets have been established to secure the balance between consumption and production, thus making sufficient reserves quickly available for regulation. Statnett is responsible for these markets. Statnett also makes decisions on minimum deliveries of frequency-controlled reserves from the power plants. A change in production or consumption results in slight deviations in frequency, and frequency-controlled reserves are automatically activated in the power plants (primary regula-tion). A Nordic market scheme of secondary reserves handles unstable frequencies if there is an imbalance between produc-tion and consumption and the primary reserves are not suf-ficient. The secondary regulation has an almost instantaneous effect, and is activated after the primary reserves and before regulating power market (tertiary regulation). The Nordic regu-lating power market is activated manually. Producers that can regulate their own production up or down at up to 15 minutes’
notice, as well as major power consumers that can be discon-nected at short notice, are active players in this market.
Since 1997, Statnett has been responsible for balance settle-ment, in other words settling the imbalances in the Norwegian power market. This is intended to ensure that all supply and con-sumption of electricity is correctly settled, to achieve financial balance in the power market.
5.4 About price formation
Price formation Each day, the Nord Pool Spot power exchange calculates the system price for each hour of the following day. The system price is the same for the entire Nordic market and reflects the overall generation and consumption conditions. The price of power in Norway is mainly determined by supply and demand in the Nordic market, but also by power market developments in countries outside the Nordic region.
Figure 5.2 shows the principle of price formation through sup-ply and demand in the Nordic power market. The intersection between the supply and demand curves is the point of market equilibrium. The market price formed here is the power price which ensures balance between supply and demand in the relevant hour. All factors that have an effect on the demand for and/or supply of power will influence price formation.
Figure 5.2: The principle of price formation in the power market: supply and demand at different power prices.
The rising supply curve in Figure 5.2 shows how much power the producers in the market are willing to produce at different prices. In principle, the curve shows the marginal production
Øre/kWh Demand Supply
TWh
54

55THE POWER MARKET
costs for power in for each type of plant, in ascending order. Hydropower, nuclear power and wind power have the low-est marginal costs in the Nordic region, and can therefore be offered at the lowest price. Technologies such as biopower, gas and coal-based power have higher marginal costs and are there-fore located further to the right on the supply curve.
The high proportion of hydropower in the Norwegian power system means that precipitation levels and inflow to reservoirs set the framework for the overall generation potential and are decisive for the power price and its fluctuations through the seasons and years. When precipitation is high, the power sup-ply increases in the Norwegian market, and the price usually declines.
Norway is part of the Nordic and European power markets. Power generation in Europe is dominated by thermal power such as nuclear power, coal-based power and gas. Coal and gas have relatively high production costs. Production costs depend primarily on the prices of the input factors coal and gas, and also on the price of carbon in the emissions trading system. As coal-fired power and gas power often constitute the marginal production both in the Nordic region and elsewhere in Europe, this also has an impact on power prices in Norway.
The downward-sloping curve in Figure 5.2 shows the demand for power in the Nordic market at different prices. The demand for power is equal to the consumption of power, and depends among other things on temperature and weather conditions. During cold periods, consumption increases and, in isolation, this leads to higher power prices.
The general activity level in the economy also influences the power demand. Power consumption increases during periods of economic growth because power is an important input fac-tor in the production of many goods and services. In Norway, where power-intensive manufacturing accounts for a substantial proportion of electricity consumption, the global market price of power-intensive goods is one factor of importance for domestic power demand. Economic expansion in Europe typically leads to an increase in power consumption and higher power prices in Norway as a result of higher prices for Norwegian industrial products, higher gas, coal and carbon prices and increased direct demand for power in Europe.
Area prices The system price for power provides a balance between the total supply and demand in the entire Nordic market, but does not take into account grid congestion (capacity constraints). In addition to the system price, Nord Pool Spot therefore sets area prices, which take into account congestion in the grid and create a balance between the purchase and sales reported by the play-ers in the different bidding areas in the Nordic region. In recent years, Norway has been divided into five bidding areas, Sweden into four and Denmark into two, while Finland constitutes one bidding area. In Norway, the division into bidding areas can be changed if there are any fundamental changes in the grid or in the geographical distribution of generation or consumption.
The underlying cause of congestion and different power prices between areas is that the power situation differs from one region to another, and this can also vary on an hourly basis and between seasons and years. Some regions may experience a power surplus, while others experience a power deficit. Power must be imported to areas with a deficit and exported from areas with a surplus. If there is insufficient grid capacity to import and export power as needed, there are bottlenecks between the areas.
When bidding areas are determined, different market areas are defined on each side of a bottleneck. This means that the area price is higher in areas with a deficit of power than in those with a surplus. Power flows from low-price areas to high-price areas, thus increasing the power supply where the need is greatest. Furthermore, area prices help the players determine where it is most beneficial to increase or reduce generation and consump-tion. In areas with a power deficit, generation is increased at the same time as consumption is reduced, which improves access to power and security of supply.
In addition to being a vital tool for short-term balancing, the area price system highlights where longer-term measures are needed in the power system. The area prices help producers and consumers identify where new generation capacity or new major consumers should be sited.
The division into bidding areas does not mean that there will automatically be different area prices. This will only be the case during periods where the grid capacity actually restricts the flow between the areas. When there are no capacity constraints in the Nordic power grid, area prices will be the same through-out the Nordic region and will correspond to the system price.
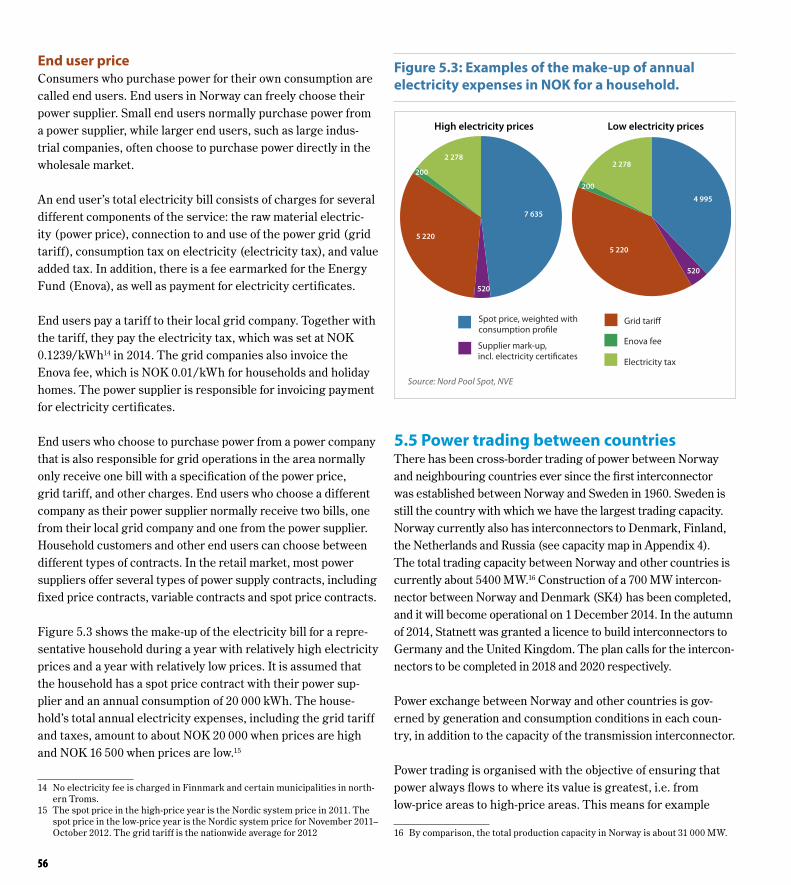
56
End user price Consumers who purchase power for their own consumption are called end users. End users in Norway can freely choose their power supplier. Small end users normally purchase power from a power supplier, while larger end users, such as large indus-trial companies, often choose to purchase power directly in the wholesale market.
An end user’s total electricity bill consists of charges for several different components of the service: the raw material electric-ity (power price), connection to and use of the power grid (grid tariff), consumption tax on electricity (electricity tax), and value added tax. In addition, there is a fee earmarked for the Energy Fund (Enova), as well as payment for electricity certificates.
End users pay a tariff to their local grid company. Together with the tariff, they pay the electricity tax, which was set at NOK 0.1239/kWh14 in 2014. The grid companies also invoice the Enova fee, which is NOK 0.01/kWh for households and holiday homes. The power supplier is responsible for invoicing payment for electricity certificates.
End users who choose to purchase power from a power company that is also responsible for grid operations in the area normally only receive one bill with a specification of the power price, grid tariff, and other charges. End users who choose a different company as their power supplier normally receive two bills, one from their local grid company and one from the power supplier. Household customers and other end users can choose between different types of contracts. In the retail market, most power suppliers offer several types of power supply contracts, including fixed price contracts, variable contracts and spot price contracts.
Figure 5.3 shows the make-up of the electricity bill for a repre-sentative household during a year with relatively high electricity prices and a year with relatively low prices. It is assumed that the household has a spot price contract with their power sup-plier and an annual consumption of 20 000 kWh. The house-hold’s total annual electricity expenses, including the grid tariff and taxes, amount to about NOK 20 000 when prices are high and NOK 16 500 when prices are low.15
14 No electricity fee is charged in Finnmark and certain municipalities in north-ern Troms.
15 The spot price in the high-price year is the Nordic system price in 2011. The spot price in the low-price year is the Nordic system price for November 2011–October 2012. The grid tariff is the nationwide average for 2012
5.5 Power trading between countriesThere has been cross-border trading of power between Norway and neighbouring countries ever since the first interconnector was established between Norway and Sweden in 1960. Sweden is still the country with which we have the largest trading capacity. Norway currently also has interconnectors to Denmark, Finland, the Netherlands and Russia (see capacity map in Appendix 4). The total trading capacity between Norway and other countries is currently about 5400 MW.16 Construction of a 700 MW intercon-nector between Norway and Denmark (SK4) has been completed, and it will become operational on 1 December 2014. In the autumn of 2014, Statnett was granted a licence to build interconnectors to Germany and the United Kingdom. The plan calls for the intercon-nectors to be completed in 2018 and 2020 respectively.
Power exchange between Norway and other countries is gov-erned by generation and consumption conditions in each coun-try, in addition to the capacity of the transmission interconnector.
Power trading is organised with the objective of ensuring that power always flows to where its value is greatest, i.e. from low-price areas to high-price areas. This means for example
16 By comparison, the total production capacity in Norway is about 31 000 MW.
Figure 5.3: Examples of the make-up of annual electricity expenses in NOK for a household.
Source: Nord Pool Spot, NVE
Electricity tax
Enova fee
Grid tariff
Supplier mark-up, incl. electricity certificates
Spot price, weighted with consumption profile
7 635
2002 278
200
4 995
5 220
5 220
520
520
High electricity prices Low electricity prices
2 278
56
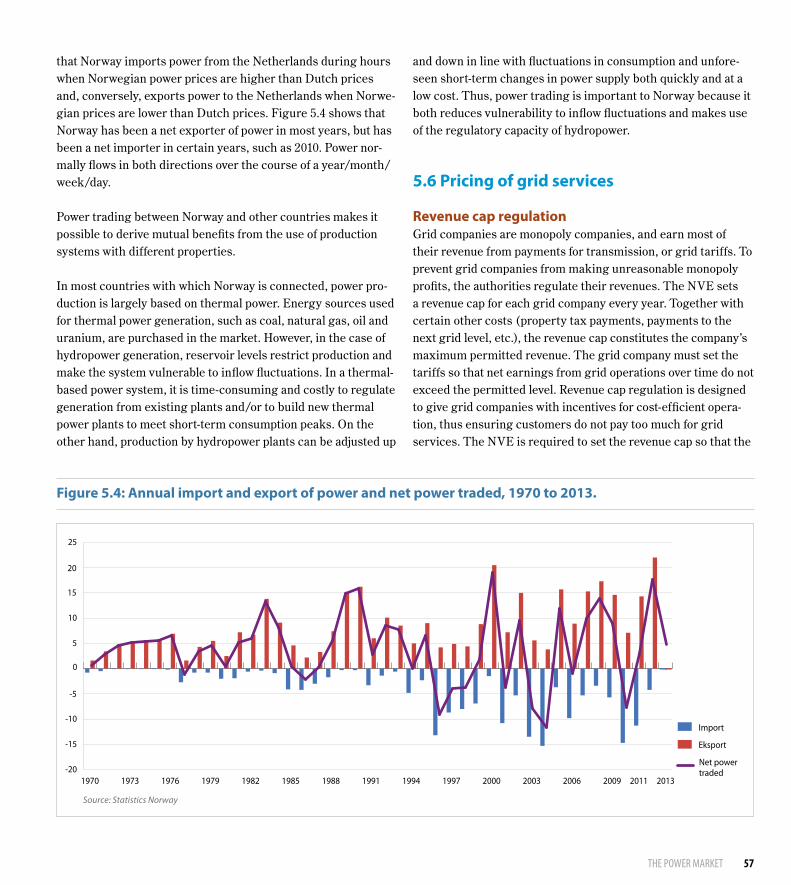
57THE POWER MARKET
that Norway imports power from the Netherlands during hours when Norwegian power prices are higher than Dutch prices and, conversely, exports power to the Netherlands when Norwe-gian prices are lower than Dutch prices. Figure 5.4 shows that Norway has been a net exporter of power in most years, but has been a net importer in certain years, such as 2010. Power nor-mally flows in both directions over the course of a year/month/week/day.
Power trading between Norway and other countries makes it possible to derive mutual benefits from the use of production systems with different properties.
In most countries with which Norway is connected, power pro-duction is largely based on thermal power. Energy sources used for thermal power generation, such as coal, natural gas, oil and uranium, are purchased in the market. However, in the case of hydropower generation, reservoir levels restrict production and make the system vulnerable to inflow fluctuations. In a thermal-based power system, it is time-consuming and costly to regulate generation from existing plants and/or to build new thermal power plants to meet short-term consumption peaks. On the other hand, production by hydropower plants can be adjusted up
and down in line with fluctuations in consumption and unfore-seen short-term changes in power supply both quickly and at a low cost. Thus, power trading is important to Norway because it both reduces vulnerability to inflow fluctuations and makes use of the regulatory capacity of hydropower.
5.6 Pricing of grid services
Revenue cap regulation Grid companies are monopoly companies, and earn most of their revenue from payments for transmission, or grid tariffs. To prevent grid companies from making unreasonable monopoly profits, the authorities regulate their revenues. The NVE sets a revenue cap for each grid company every year. Together with certain other costs (property tax payments, payments to the next grid level, etc.), the revenue cap constitutes the company’s maximum permitted revenue. The grid company must set the tariffs so that net earnings from grid operations over time do not exceed the permitted level. Revenue cap regulation is designed to give grid companies with incentives for cost-efficient opera-tion, thus ensuring customers do not pay too much for grid services. The NVE is required to set the revenue cap so that the
Figure 5.4: Annual import and export of power and net power traded, 1970 to 2013.
-20
-15
-10
-5
0
5
10
15
20
25
Eksport
Import
2013201120092006200320001997199419911988198519821979197619731970
Source: Statistics Norway
Net power traded

58
grid company’s revenues over time cover the costs of grid opera-tion and depreciation of the grid and give a reasonable return on invested capital, given efficient grid operation, utilisation and development.
The revenue cap regulation also gives grid companies incen-tives to maintain an optimal level of reliability of supply. In the event of power supply interruptions, grid companies’ permitted revenues are reduce by means of a quality-adjusted revenue cap for energy not supplied (known as the KILE scheme). End users who experience power cuts that last for more than 12 hours may claim compensation from the grid company.
Grid tariffsGrid customers pay point tariffs for electricity transmission. This means that they only pay a tariff to their local grid com-pany to gain access to the entire power market. Consumers pay to draw power from their connection point to the grid, while power producers pay to feed power into the grid at their connec-tion point.
Grid companies are responsible for setting their own tariffs. Over time, the grid companies’ total tariff revenues must not exceed the revenue cap set by the NVE, and the tariffs must be in compliance with the provisions of the Energy Act and associ-ated regulations. General requirements are that grid tariffs must be objective and non-discriminatory, and that they must be designed and differentiated on the basis of relevant grid condi-tions. To the extent possible, the tariffs should also be designed to provide long-term signals encouraging efficient utilisation and development of the grid.
The tariffs for consumption are intended to cover a share of the costs that accrue at the relevant grid level and higher levels. Consumers directly connected to the central grid, for example power-intensive industry, pay a tariff based solely on costs at this level, whereas consumers connected to the distribution grid contribute to costs at all three grid levels. Grid tariffs are therefore normally higher for consumers who are connected to the distribution grid than for those who are connected to the regional and central grids.
The tariffs also vary from one grid company to another. This is partly because of variations in factors that influence the costs of supplying power to customers. Difficult natural conditions
and a scattered settlement pattern can result in high transmis-sion costs. There is also some variation in the efficiency of grid operations between companies.
There is a government grant scheme17 to reduce the differences between tariffs for customers of different grid companies. The grid companies with the highest transmission costs in the coun-try receive the grants, which are used directly to reduce their customers’ tariffs.
17 The allocation to the grant scheme was NOK 30 million in 2014, and included 11 grid companies with about 32 000 customers.
58
Box 5.2: Improving organisation of the power grid Most of Norway’s power grid was built between the 1950s and the 1980s. After the liberalisation of the power market in the 1990s, there has been a greater focus on cost efficiency. Many years of efficiency measures and moderate investments in the power grid have led to a need to increase capacity again and rebuild parts of the grid. This need has been enhanced by factors such as an aging grid, population growth and urbanisation, higher investments in renewable power and a general increase in consumption. People are less and less willing to accept for power cuts, and we are more vulnerable if supplies are interrupted. Overall investments of NOK 120-140 billion are planned in the Norwegian power grid for the period 2014- 2023. Grid costs are mainly covered through the tariffs. As the electricity grid is considered to be a natural monopoly, it is strictly regulated. The electricity grid fulfils a critical social function, and the large number of grid companies and other players have resulted in a grid structure that is both fragmented and complex. There has been uncertainty as to whether the companies will be able to meet future needs, and this was one of the reasons why the Ministry of Petroleum and Energy appointed an expert group chaired by Eivind Reiten to look into better ways of organising grid operations in Norway. In spring 2014, the expert group submitted its report, which focused particu-larly on the organisation of the regional and distribution grids. The expert group also proposed concrete measures to improve the organisation of the electricity grid.

59THE ENVIRONMENT
THE ENVIRONMENT
6
Photo: iStock Photo

60
6.1 Local environmental impacts The development of renewable energy sources and the electric-ity grid has impacts on the natural environment in Norway. In addition, energy projects can come into conflict with various commercial and recreational interests. In general, the negative local environment impacts will be most important, but species and habitats of national and international value may also be affected.
Renewable energy projects can affect the environment in various ways, for example through abstraction of water, the construction of regulation reservoirs and direct physical altera-tions. Such developments may have negative impacts on species, habitats and landscapes. They may also reduce the value of areas for recreational activities including hunting/fishing and other outdoor activities. In general, upgrading and expanding existing hydropower plants has less environmental impact than new projects in more or less undisturbed areas.
In the case of wind power developments, the landscape and visual impact are of key importance. Land occupation and the physical footprint of wind farms may also have negative impacts on species and habitats. Birds are also prone to collisions with wind turbines. Noise can be a local problem for both people and wildlife.
Land occupation is the most controversial issue when build-ing central grid power lines. Some planned power line projects are in or near undisturbed areas where biodiversity is high. For distribution grid projects, conflicts are to a greater extent related to potential impacts on birds. Conflicts of interest and disturbance of the natural environment are often unavoidable in connection with projects for energy generation and transport. Negative impacts must be weighed against considerations such as security of supply and value creation. The challenge is to strike the right balance and minimise negative impacts.
Applications for licences for power generation and transmis-sion infrastructure go through extensive procedures. These include a thorough assessment of negative impacts. Unless the advantages of a project outweigh the drawbacks, the licence application will be rejected. The authorities may also require the developer to take action to mitigate any damage caused by the project. Licensing procedures are described in more detail in Chapter 1.
In the case of hydropower and other developments in river systems, the authorities can choose between various mitigation measures, including minimum water discharge, habitat improve-ments and weirs to reduce environmental impact.
There are fewer options for mitigating the impacts of wind power developments. However, studies indicate that the effects on bird life can be limited by appropriate siting. Thus, the actual position both of the entire wind farm and of each wind turbine within an area with favourable wind conditions plays a crucial role in limiting adverse impacts. Other possibilities include marking turbines so that birds see them more easily and limit-ing disturbance during the breeding season.
For power lines, the most important mitigation measure is to route them away from conflict areas. Other options include camouflage, pylon design, adjustments to take birds into con-sideration and use of underground or subsea cables. The use of underground cables for lower voltage lines is increasing, but is more restricted at higher voltages.
6.2 Emissions to air Norway differs from other countries in using electricity, primar-ily based on hydropower, for most of its domestic stationary energy consumption. Norway has the world’s highest per capita hydropower production. Hydropower is a renewable energy source and hydropower generation does not result in emissions to air. Emissions of CO2 equivalents, NOx and SO2 from domestic energy generation are shown in Figure 6.1.
Greenhouse gas emissions from domestic energy generation increased sharply in 2009 due to a high activity level at the Kårstø gas-fired power plant. Emissions rose further in 2010 and 2011 after the new combined heat and power heating plant at Mongstad came on stream. Since then there has been a decline in emissions, mainly because the Kårstø plant has produced very little electricity.
Emissions to air from heating of buildings and domestic energy supply account for only a small proportion of total Norwegian emissions to air because of the large share of hydropower in the Norwegian energy supply system. In 2013, heating accounted for 2.6 per cent of total greenhouse gas emissions, 3.8 per cent
60
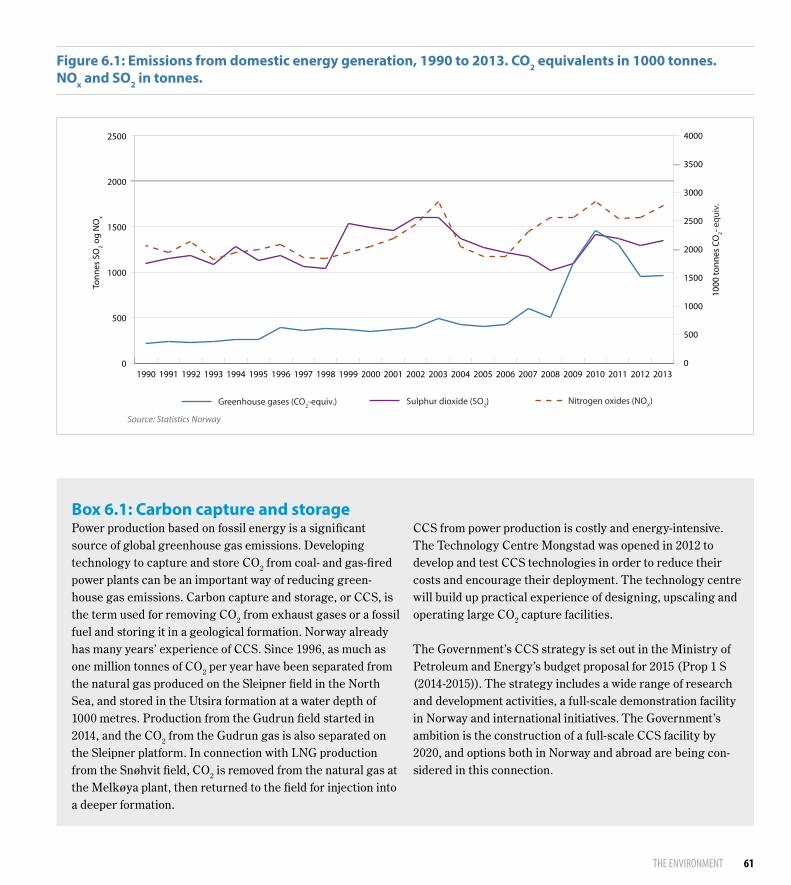
61THE ENVIRONMENT
Figure 6.1: Emissions from domestic energy generation, 1990 to 2013. CO2 equivalents in 1000 tonnes. NOx and SO2 in tonnes.
0
500
1000
1500
2000
2500
Nitrogen oxides (NOX)Sulphur dioxide (SO
2)Greenhouse gases (CO
2-equiv.)
2013201220112010200920082007200620052004200320022001200019991998199719961995199419931992199119900
500
1000
1500
2000
2500
3000
3500
4000
Source: Statistics Norway
Tonn
es S
O2 o
g N
Ox
1000
tonn
es C
O2- e
quiv
.
Box 6.1: Carbon capture and storageCCS from power production is costly and energy-intensive. The Technology Centre Mongstad was opened in 2012 to develop and test CCS technologies in order to reduce their costs and encourage their deployment. The technology centre will build up practical experience of designing, upscaling and operating large CO2 capture facilities.
The Government’s CCS strategy is set out in the Ministry of Petroleum and Energy’s budget proposal for 2015 (Prop 1 S (2014-2015)). The strategy includes a wide range of research and development activities, a full-scale demonstration facility in Norway and international initiatives. The Government’s ambition is the construction of a full-scale CCS facility by 2020, and options both in Norway and abroad are being con-sidered in this connection.
Power production based on fossil energy is a significant source of global greenhouse gas emissions. Developing technology to capture and store CO2 from coal- and gas-fired power plants can be an important way of reducing green-house gas emissions. Carbon capture and storage, or CCS, is the term used for removing CO2 from exhaust gases or a fossil fuel and storing it in a geological formation. Norway already has many years’ experience of CCS. Since 1996, as much as one million tonnes of CO2 per year have been separated from the natural gas produced on the Sleipner field in the North Sea, and stored in the Utsira formation at a water depth of 1000 metres. Production from the Gudrun field started in 2014, and the CO2 from the Gudrun gas is also separated on the Sleipner platform. In connection with LNG production from the Snøhvit field, CO2 is removed from the natural gas at the Melkøya plant, then returned to the field for injection into a deeper formation.
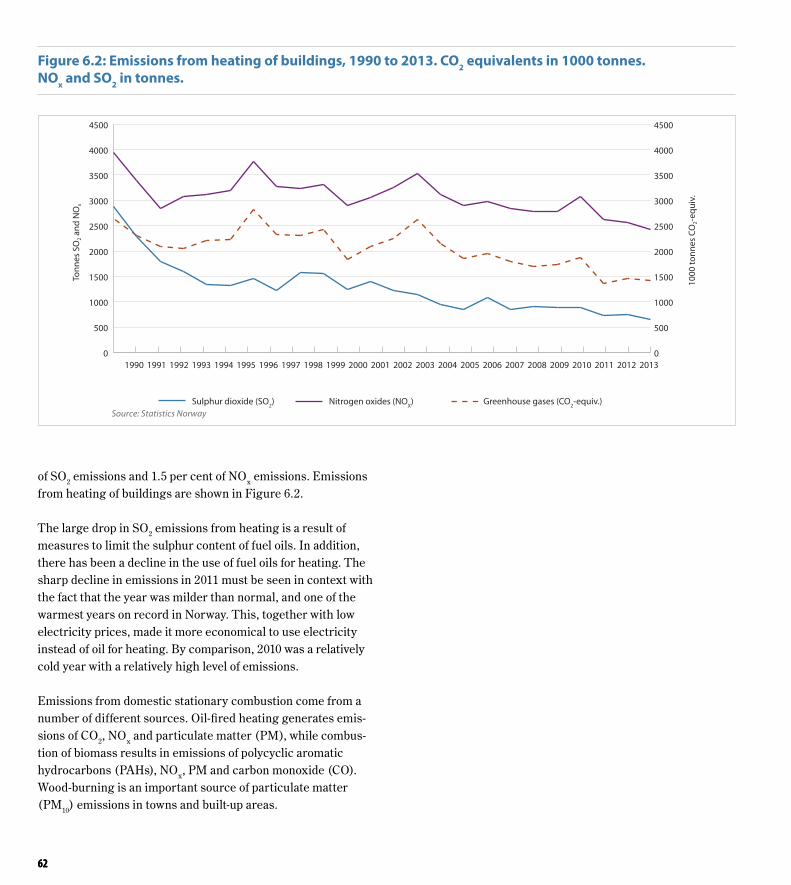
62
of SO2 emissions and 1.5 per cent of NOx emissions. Emissions from heating of buildings are shown in Figure 6.2.
The large drop in SO2 emissions from heating is a result of measures to limit the sulphur content of fuel oils. In addition, there has been a decline in the use of fuel oils for heating. The sharp decline in emissions in 2011 must be seen in context with the fact that the year was milder than normal, and one of the warmest years on record in Norway. This, together with low electricity prices, made it more economical to use electricity instead of oil for heating. By comparison, 2010 was a relatively cold year with a relatively high level of emissions.
Emissions from domestic stationary combustion come from a number of different sources. Oil-fired heating generates emis-sions of CO2, NOx and particulate matter (PM), while combus-tion of biomass results in emissions of polycyclic aromatic hydrocarbons (PAHs), NOx, PM and carbon monoxide (CO). Wood-burning is an important source of particulate matter (PM10) emissions in towns and built-up areas.
Figure 6.2: Emissions from heating of buildings, 1990 to 2013. CO2 equivalents in 1000 tonnes. NOx and SO2 in tonnes.
Source: Statistics Norway
0
500
1000
1500
2000
2500
3000
3500
4000
4500
0
500
1000
1500
2000
2500
3000
3500
4000
4500
Greenhouse gases (CO2-equiv.)Nitrogen oxides (NO
X)Sulphur dioxide (SO
2)
201320122011201020092008200720062005200420032002200120001999199819971996199519941993199219911990
Tonn
es S
O2 a
nd N
Ox
1000
tonn
es C
O2-
equi
v.
62
63RESEARCH, TECHNOLOGY AND EXPERTISE
RESEARCH, TECHNOLOGY AND EXPERTISE
7
Photo: Statkraft

64
7.1 The Ministry of Petroleum and Energy’s use of funding instruments within energy research The Ministry of Petroleum and Energy concentrates its research allocations in areas where the Norwegian research community, Norwegian business and industry and other user groups possesses special expertise and comparative advan-tages, where Norwegian energy resources give us long-term competitive advantages and where there are special Norwegian research needs. The Energi21 strategy provides input for how the Ministry targets its research allocations.
The primary objective of the research, development and demon-stration initiative in the energy field is to boost long-term value creation and to promote safe, rational, cost-efficient and sustain-able exploitation of Norwegian energy and petroleum resources. Under this, the goals are to:
• Meet the need for long-term development of knowledge, expertise and technology
• Develop competitive products and services that can promote more business development and value creation in Norway
• Reduce potential negative environmental and climate impacts of activities in this field through knowledge development and new technological solutions
• Enhance knowledge as a basis for policy development and sound management of Norway’s energy and petroleum resources.
The Research Council of Norway is responsible for managing most of the public funding for energy research. The funding goes to long term, basic and applied research, technology devel-opment, pilot projects and social science research.
Figure 7.1: Organisation of energy research.
Source: MPE
64
Ministry of Petroleum and Energy Energy21
NVEResearch Council of NorwayGassnova
Demo R&D
CLIMITENERGIX
Various ministries Ministry of Education and
Research
FME
Mandate
Strategy/advice

65RESEARCH, TECHNOLOGY AND EXPERTISE
In order to enjoy the benefits of research and technology devel-opment, the initiative must include the entire innovation chain. Enova plays a part in maturation and market introduction of new energy and climate technology, and offers investment grants for full-scale demonstration projects for energy and climate technology. Enova has a special responsibility for focusing on new energy and climate technologies in industry. The overall objective is to reduce greenhouse gas emissions and promote a long-term shift towards more environmentally friendly energy consumption and production.
In addition to national research activities, Norway and Norwe-gian research groups play an active part in international energy research cooperation in various forums. Figure 7.1 provides an overview of the organisation of energy research under the Ministry of Petroleum and Energy.
7.2 Energi21 Energi21 is the national strategic body for research, develop-ment, demonstration and commercialisation in the energy sector, and was established by the Ministry of Petroleum and Energy in 2008. A revised strategy document was presented in the autumn of 2014. The strategy is targeted towards increased value creation and effective utilisation of resources in the energy sector through investment in R&D and new technol-ogy. It is intended to ensure coordinated, effective and targeted research and technology initiatives, and the commitment and active involvement of the energy industry will be a key factor. The Energi21 strategy sets out objectives and ambitions for Norwegian R&D initiatives for renewable energy technologies, energy -efficiency and CCS. The Energi21 board appointed by the Ministry is responsible for following up the strategy and providing advice on the allocation of research funding.
The guiding principles for national and international strategies in the energy sector revolve around the need to address climate challenges and safeguard both security of energy supply and competitiveness. These drivers, together with assessment of the potential to meet targets and of Norway’s national competi-tive advantages, form the basis for the recommended strategic priority areas and proposed measures. In its revised strategy report, Energi21 recommends strong growth in public funding for research, development and demonstration within six priority focus areas.
• Hydropower• Flexible energy systems• Solar power• Offshore wind power• Raising energy efficiency• Carbon capture and storage
The Energi21 board recommends devoting special attention to two of these, hydropower and flexible energy systems. These two areas represent the very foundation of Norway’s energy sys-tem and are vitally important for current as well as future value creation, nationally and internationally.
7.3 Research programmes
ENERGIX The Research Council of Norway’s large-scale programme for energy research, ENERGIX, is the successor to the RENERGI programme (2004-2013). The new programme will span a ten-year period and provide funding for research on renewable energy, efficient use of energy, energy systems and energy pol-icy. The ENERGIX programme will help to achieve key energy and industrial policy objectives, and is an important instrument in the implementation of the national Energi21 RD&D strategy. The programme encompasses technological, natural science and social science-based research and development.
The programme is targeted towards Norwegian companies and research and educational institutions that can enhance long-term development of expertise to further the development of the energy industry and related industries, such as the energy processing industry and the supplier industry. The program will support the development of an integrated energy system that promotes sustainability and protects the natural environment. ENERGIX will promote the broadest possible range of research activities to open the door to new thinking and innovative con-cepts and ensure they are put to use.
Activities under the programme are designed to:
• Achieve sustainable utilisation and efficient consumption of Norway’s renewable energy resources
• Reduce Norwegian and global greenhouse gas emissions• Ensure Norway’s security of supply
66
• Strengthen innovation in Norwegian business and industry in areas where Norwegian actors have competitive advantages
• Develop Norwegian research communities
Centres for Environment-friendly Energy Research The Centres for Environment-friendly Energy Research (FME scheme) conduct concentrated long-term research on renew-able energy, energy efficiency and CCS. The Research Council of Norway administers the system, which provides funding for research centres involving partners from research institutions, the business community and the public administration. The research centres help to bring about broad-based, binding coop-eration between leading research institutions and innovative companies in Norway, and also cooperation with international actors. The main criterion for designating new centres is their potential for innovation and value creation. They must be able to conduct research of high international calibre. The centres will have a life span of up to eight years, with a mid-term assessment after five years.
Centres have been established in the following areas: carbon capture and storage (two centres), offshore wind power (two centres), energy consumption in buildings, photovoltaic cells, bioenergy and the environmental impacts of renewable energy. The research centres make it possible for selected research groups to join forces to focus on specific areas of technology.
Three centres for social science-related energy research have also been established, two of which receive funding over the Ministry of Petroleum and Energy’s budget. These centres are intended to provide a better knowledge base for national and international energy policy development and dealing with energy policy challenges, and to study the dynamics between technology and society.
CLIMIT CLIMIT is a national programme for research, development and demonstration of technologies for capture, transport and stor-age of carbon from fossil-based power production and industry. The programme supports projects in all stages of the develop-ment chain, from long-term basic research to build expertise to demonstration projects for CCS technologies. The main focus is on technology development, but it is also considered important to identify opportunities for future commercialisation and value creation in Norwegian industry.
The CLIMIT programme involves collaboration between Gassnova SF and the Research Council of Norway. The Research Council manages research and development, while Gassnova manages piloting and demonstration activities. The board for the CLIMIT programme makes decisions on funding awards.
The programme focuses on technologies and solutions that can yield considerable cost reductions and promote international realisation of CCS. The programme targets Norwegian compa-nies, research institutions, universities and colleges, often in cooperation with international companies and research institu-tions, which can help to accelerate commercialisation of CCS.
Public-sector oriented research and development programmesEnergy and water resources research targeted towards the public sector is administered by the NVE. The objective is for research activities to support the NVE’s work and promote the development of new knowledge which strengthens its manage-ment expertise. Activities include projects on energy and river systems, hydrology, landslide processes and licence process-ing. They supplement research run by the Research Council of Norway and are coordinated with them. The NVE also cooper-ates closely with Energy Norway, the Norwegian Environment Agency and Enova SF.
7.4 International R&D cooperation Participation in international cooperation on energy R&D is a high priority and an important supplement to national research programmes. Cross-border cooperation is vital, not only to maintain the high calibre of research activities at Norwegian institutions, but also to establish contacts and alliances with other countries. International projects help build expertise and give scientific and financial support in solving key research tasks. At the same time, international cooperation provides a showcase for Norwegian technology and know-how suppliers.
Horizon 2020Under the EEA Agreement, Norway participates as a full member of Horizon 2020, the EU’s framework programme for research and innovation for the period 2014-2020. The programme replaces the EU’s 7th framework programme for research, technology development and demonstration activi-
66

67RESEARCH, TECHNOLOGY AND EXPERTISE
ties, and will also include the innovation-related activities of the Competitiveness and Innovation Framework Programme and the European Institute of Innovation & Technology.
A budget of EUR 77 billion makes Horizon 2020 the world’s largest research and innovation programme. “Safe, clean and efficient energy” is one of the global societal challenges defined by the programme. This programme section has a budget of about EUR 6 billion, and its priorities are:
• Energy efficiency• Low-carbon technologies (renewable energy, electricity
grids, energy storage, CCS, social science research)• Smart cities and communities (energy efficiency, transport
and ICT)• Support for small and medium-sized enterprises (SMEs) in
the energy field
The overall aim of the energy programme sector is to support the EU’s energy policy objectives and assist in the transition to a sustainable, innovative and competitive European energy sector by providing funding for renewable energy, efficient energy sys-tems and carbon capture and storage. The Norwegian activities are coordinated by the Research Council of Norway and include various funding instruments to strengthen Norwegian participa-tion. The Ministry of Petroleum and Energy provides a share of the funding for these instruments.
The International Energy Agency The International Energy Agency has established a number of multilateral technology initiatives (called Implementing Agreements) that are working on research, development and deployment introduction of energy and petroleum technolo-gies. Norway is a member of 24 of these initiatives, in several areas: end-use technologies, renewable energy technologies, petroleum technology and information exchange. The Research Council of Norway coordinates the Norwegian activities.
Nordic Energy Research Nordic Energy Research (NEF) is an institution under the Nordic Council of Ministers whose objective is to promote Nordic cooperation in energy research. NEF draws up a joint strategy for research and development in energy research topics that are of interest in the Nordic region. Financing of research and innovation projects and studies and analyses of energy and
energy-related topics are the institute’s core activities, along with international networking. NEF is jointly financed by the Nordic countries according to a distribution formula based on the countries’ gross domestic product.
Other international R&D cooperation • Norway also participates in other forums, for example:• the Carbon Sequestration Leadership Forum (CSLF), which
promotes cooperation on research and further development of technologies for the capture, transport, storage and use of CO2.
• the International Partnership for Hydrogen and Fuel Cells in the Economy (IPHE), which is a mechanism for coordinating and implementing international R&D and demonstration pro-jects relating to hydrogen as an energy carrier and fuel cells.
7.5 Norwegian hydropower expertise Norway is the world’s sixth largest hydropower producer and the largest hydropower producer in Europe. The Norwegian hydropower industry is more than a century old. By carrying out so many projects of all sizes, we have acquired expertise in all aspects of hydropower projects, from planning, engineering and construction to supply and installation of equipment. The focus throughout is on finding both efficient and environmentally-friendly solutions. The authorities and power companies have developed expertise in regulating and managing hydropower resources, and Norway is a world-leader in operating an efficient power market.
Norway has already developed most of its available hydropower potential, and Norwegian industrial and consulting companies are therefore increasingly focusing on projects abroad. They are providing consultancy services in the fields of planning, design and other engineering services as well as turbines and electro-mechanical products. There is also an increasing demand for Norwegian expertise in system operation and power market development. Moreover, there is growing interest in investing in hydropower projects abroad; for example, Statkraft and SN Power are engaged in extensive operations in South America and Asia and are increasingly investing in central and southeast-ern Europe.
The International Centre for Hydropower was established about 15 years ago as a way of sharing Norway’s unique hydropower

68
expertise. It involves collaboration between power companies, the supply industry, consultancy companies and authorities. It is active in all areas of hydropower generation and electricity sup-ply, including financing and the environment.18
The association INTPOW, or Norwegian Renewable Energy Partners, was established in cooperation between the authori-ties and the energy industry in 2009. Through cooperation between the authorities and industry, INTPOW seeks to increase value creation and employment in the Norwegian-based energy industry and thus give it a stronger international position. INTPOW focuses on renewable energy sources such as hydropower, wind and solar power, and on ICT for the power sector.
18 Read more at www.ich.no

69APPENDIX
APPENDIX
Photo: iStock Photo

70
The following provides a detailed description of each act which the Ministry of Petroleum and Energy is responsible for within the energy sector and water resources management.
1.1 The Industrial Licensing Act In order to use water for generation of electricity, one needs a waterfall where the potential energy in the water can be utilised. The owner of the waterfall owns the land. Acquisi-tion of ownership rights of the waterfall by anyone other than the State requires a licence in accordance with the Industrial Licensing Act if, when harnessed, it can be expected to produce more than 4 000 natural horsepower. This limit is high enough to exclude small hydropower stations without regulation from the Act. Acquisition of other rights than property rights can only take place in accordance with Chapter 1, cf. section 4. The other rights discussed in Chapter 1 are regulated in section 4. Section 4 states that the Ministry can make a licence decision following an application for use of waterfalls that have already been developed for up to 30 years at a time. Leasing of property rights to developed waterfalls and power plants for a period of up to 15 years is regulated in section 5 and the regulations relating to lease of hydropower generation of 25 June 2010 No. 939.
When the Act was passed in 1917, it was drawn up in a way that adequately safeguarded the interests of the state and the general public. This included provisions on the right of pre-emption, licences of limited duration and the right of reversion to the State when a licence expires. The right of reversion means that the state takes over a waterfall and any hydropower installations free of charge when a licence expires. Pre-emption means that the state or alternatively the county authority has a right to enter into the purchase agreement instead of the purchaser, but with the original purchaser’s rights and obligations as set out in the contract.
The EFTA Surveillance Authority instituted legal proceedings against Norway before the EFTA Court in 2006. The ruling from the EFTA Court from 2007 stated that Norway’s system conflicted with the EEA Agreement. However, it stated that public ownership of the hydropower resources could be an inde-pendent goal, but that the legislation needed to be consistent with this goal. The EFTA Court noted four issues needed to be rectified in the system that applied at the time.
In the spring of 2008, the government submitted a bill amend-ing the Industrial Licensing Act (Proposition to the Odelsting no. 61 (2007-2008)) and following up the EFTA Court ruling. The amendments entered into force on 25 September 2008. The amendments entailed establishing by law that the country’s hydropower resources belong to and should be managed in the best interests of the general public. This is ensured through an ownership structure based on public ownership at State, county and municipal levels. Amendments related to the four aspects noted by the EFTA Court involved the following:
• New licences for acquisition of waterfall rights may only be granted to public owners.
• Only public bodies may acquire waterfalls and power plants after reversion to the State.
• Private undertakings could no longer renew their licences in the event of reverse repurchase/lease after expected rever-sion.
• Sale of more than one-third of publicly owned waterfalls and power plants to private players is prohibited.
It was proposed that the scheme allowing private owners to own up to one-third in public companies should be continued. Current licences of limited duration were to run as normal until the date of reversion. The last major reversion will take place in 2057. The
The Ministry of Petroleum and Energy’s legislation within the energy sector and water resources management
APPENDIX 1

71APPENDIX
former possibility of applying for removal of conditions of time limitation and right of reversion was made statutory. This means that private power plants owners subject to terms and conditions relating to reversion and time limitations can sell or merge the power plant with public owners, so long as the private ownership interest in the joint company does not exceed one-third, and the organisation clearly indicates genuine public ownership. In such cases, the transition to public ownership is accelerated, because reversal must take place before the date of reversion.
The Industrial Licensing Act contains mandatory provisions relating to licence fees and obligatory electricity sales to the municipalities where the waterfalls are located. The provision on sales gives the municipality, or alternatively the county authority, to acquire 10 per cent of the produced power at production cost. The Act also authorises the introduction of licensing conditions relating for instance to environmental con-siderations and the local community
1.2 The Watercourse Regulation Act In order to regulate production from hydropower plants throughout the year according to varying needs, it can be of crucial economic importance to be able to use a regulation reservoir to store the water supply, see Chapter 2.1.2. A separate licence under the Watercourse Regulation Act is required to utilise the water in a regulation reservoir for power generation.
The Watercourse Regulation Act covers regulatory measures that even out fluctuations in the rate of flow in a river over the year. As a general rule, it provides the authority to prescribe similar conditions to those that follow from the Industrial Licenc-ing Act, but special conditions may also be set to reduce the damage caused by regulation. For example, rules requiring the establishment of a fish fund may be included if regulation harms the fish stocks in a watercourse. Rules for reservoir drawdown are also laid down, and contain provisions on the minimum per-mitted rate of flow and on the volumes of water can be released at different times of the year. The maximum and minimum allowed permitted water levels are also laid down in these rules. Licences for regulatory measures may be revised after 30 or 50 years, depending on when the licence was awarded. The NVE will decides whether revision is to be initiated after a non-state authority (as a general rule the municipality) or others represent-ing the public interest have required revision of the conditions in
a licence. This procedure primarily provides opportunities to lay down new conditions to mitigate environmental damage that has occurred as a result of regulatory measures.
The Watercourse Regulation Act has separate provisions regard-ing expropriation for regulation purposes.
Regulation licences can also require obligatory sales and payment of an annual licence fee to the State and the municipality(ies) in which the regulated watercourse is located. The size of the fee is calculated according to the volume of the power increase as a result of the regulatory measures, and is intended to provide compensation for nuisance inflicted. Furthermore, the establishment of a business development fund for the municipality is generally required. The objective of the fund is partly to provide compensation for nuisance inflicted and partly to provide the municipality with a share of the value crea-tion. The establishment of business development funds may also be required under the Industrial Licencing Act.
1.3 The Water Resources Act Even if a power developer already owns the rights to a head of water and does not want to regulate the watercourse, measures that are necessary to exploit utilise the hydropower potential will normally require a separate licence under the Water Resources Act.
The Water Resources Act is a general statute which covers all types of measures in watercourses. The Act came into force on 1 January 2001, and replaced most of the Watercourses Act of 1940. The purpose of the Act is to ensure socially responsi-ble use and management of river systems and ground water. It gives weight both to natural resource considerations and to user interests, and is more resource-oriented than the previous Watercourses Act.
The licence obligation pursuant to the Water Resources Act applies to all types of works if they may cause significant damage or nuisance to public interests. The main criterion for awarding a licence for implementing measures is that its advantages out-weigh exceed the damage and nuisance for the general public and private interests that are affected in the river system. A number of licence conditions may be laid down to compensate for and mitigate the adverse impacts of developments. If there is a licence obligation pursuant to both the Watercourse Regulation Act
72
and Water Resources Act, the Watercourse Regulation Act will supersede the Water Resources Act, thus eliminating the need for a permit pursuant to the Water Resources Act. New developments that will cause deterioration of environmental status must also be assessed in relation to the Water Management Regulations. These implement the EU Water Framework Directive in Norway, and set criteria for the exercise of discretion according to the water resource legislation and other relevant sector legislation
Previously, licences were generally only needed for hydropower development. In more recent years, the licensing requirements have been interpreted more widely, so that other projects that could involve damage or nuisance to the public interest have also become subject to the licensing process. For example, this includes major water supply and drainage measures and the abstraction of water for aquaculture facilities.
Certain micro and mini power plants could have such negligible impact that they may be exempt from licencing. The impact is often difficult to assess without special water resource exper-tise. A developer should therefore have the project assessed by the NVE to determine whether a licence is required before carrying out the project.
Water resources themselves are in principle renewable, but parts of the ecological system along and in watercourses are not. Protection of the environment has an important place in the Water Resources Act. There are has general provisions on con-duct in watercourses, and the Act sets out general requirements and restrictions as regards use, planning and implementation of measures in watercourses. Most of the requirements follow from the general provisions, and are laid down on the basis of conditions in river systems.
The Water Resources Act is primarily intended to promote sus-tainable development and maintain biodiversity and natural pro-cesses in river systems. The key concern is the intrinsic value of river systems both as landscape elements and as habitats for plants and animals.
The principle of sustainable development underpins several provisions of the Act, for example rules concerning the mainte-nance of riparian vegetation and minimum water flow. Both of these provisions aim to provide suitable conditions for biological productivity and diversity in river systems.
The penal provisions in the Water Resources Act have been significantly reinforced in comparison with previous rules. For example, there are more severe penal measures to deal with environmental crime in river systems.
Groundwater Before the Water Resources Act entered into force, there were no legal rules concerning groundwater abstraction. Groundwa-ter must be protected against pollution and overconsumption, and we must ensure fair distribution when resources are scarce. The Pollution Control Act deals mainly with the qualitative aspects of environmental pressures, while the Water Resources Act deals primarily with quantitative issues.
The Act has retained a general rule giving the landowner rights to river systems. Nevertheless, it lays down certain general restrictions on their right to use groundwater, among other things to ensure that abstraction is limited to what the ground-water body can provide sustainably. Rules have also been laid down concerning licence obligation for abstraction and other pressures on of groundwater.
Special provisions concerning measures in protected river systems The objective of including river systems in the Protection Plan for Watercourses protection through protection plans has been to prevent any reduction of their conservation value as a result of hydropower developments. Even if a river system is protected against hydropower developments, other types of developments may also reduce its conservation value. In order to prevent this, the Water Resources Act includes several special provisions on the management of protected river systems, which also apply to measures other than hydropower developments. The most important of these provisions is the statutory principle that any decisions under the Water Resources Act that is of importance to a protected river system must give considerable weight to its conservation value. Among other things, this will result in stricter treatment of applications for licences in protected river systems than in with other river systems.
Safety measures in river systems The Water Resources Act contains provisions intended to pro-tect against damage, whether cause by measures in rivers or by the river system itself.
73APPENDIX
There are a large number of dams in Norway. A dam failure could have major consequences. The large dams in Norway have a high level of structural safety and are regularly inspected by owners and the NVE. The Regulations relating to the safety of hydrologi-cal structures (the Dam Safety Regulations of 18 December 2009 No. 1600) were adopted under the Water Resources Act.
The NVE also has administrative responsibility for flood and land-slide risk reduction. The Water Resources Act provides the legal authority to prevent loss of life and material assets due to flooding, erosion and river-related landslides. The NVE can order the owner of installations in river systems to take steps to limit harm, or may take such steps itself if there is a high risk of serious damage.
1.4 The Energy Act The Energy Act sets out the framework for organisation of the Norwegian power supply system. The Energy Act made Norway the first country in the world to allow customers to freely choose their supplier of electricity. Various licensing schemes under the Act regulate matter such as the construction and operation of electrical installations, district heating plants, power trad-ing and control of monopoly operations, foreign trade in power, metering, settlement and invoicing, the physical market for trade in power, system responsibility, rationing, quality of sup-ply, energy planning and power supply preparedness.
Below you can find a review of the content listed by licence type and main topics in the Act.
Local area licence A local area licence is required in order to construct, own and operate power lines and electrical installations for distribution of electricity carrying a voltage of 22 kV or less. Local area licences are awarded by the NVE. The holder of a local area licence does not need to apply for a licence pursuant to the Energy Act for each individual installation. This makes proce-dures simpler than is the case for construction and operating licences. One of the conditions of local area licences is that the grid companies are obliged to deliver electric energy to custom-ers within the geographical area covered by a licence.
Construction and operating licence In order to construct, own and operate power plants, transformer stations and power lines which are not covered by a local area
licence as described above, a separate installation licence must be obtained required for each individual installation. This applies to all electrical installations that are larger than the limits set in the legislation, including gas-fired power plants, wind farms and electrical installations associated with hydropower plants.
The purpose of this licensing system scheme aims to ensure a uniform practice for construction and operation of electrical installations. High-voltage power lines and transformer stations often has substantial impacts. In accordance with the purpose of the Energy Act, licensing procedures take into account both socio-economic considerations and public and private interests, for example as regards environmental impacts.
Various conditions may be set in licences, as set out in sec-tion 3-5 of the Energy Act and regulations under the Act. They include a requirement for the installation to contribute to rational energy supplies, provisions concerning the time of start-up, construction, technical operations, conditions regard-ing utilisation of capacity at each plant, conditions intended to avoid or limit damage to the natural environment and cultural heritage, conditions relating to the form of organisation and expertise of the licensee, and other conditions that may be required in the individual case.
Trading licence Entities that trade electricity or that may be involved in monop-oly operations must hold a trading licence. Only the State may trade electric energy without a licence. Trading licences are awarded by the NVE.
The largest group covered by these arrangements consists of entities involved in retail sales of power they have generated or purchased transmitted via their own grid to end-users for general consumption in a specific area, and other grid owners. Purely trading companies that purchase power from produc-ers or over the power exchange for resale are also covered. If operations requiring a licence are limited in extent, an entity can obtain a trading licence on simplified conditions. Power brokers that handle brokerage only, i.e. that do not assume any responsibility for the financial aspects of a contract, do not need a trading licence.
Trading licences are an essential part of the market-based power trading system. The scheme is intended to safeguard custom-
74
ers’ interests by contributing to economically sound electricity trading and to control grid management and operations, which form a natural monopoly.
The system of trading licences provides a legal basis for inspect-ing grid operations. The grid companies may not set higher prices than what is necessary, over time, to cover the costs of operation and depreciation of the grid, in addition to a reasonable return on investments, given efficient operations. Vertically inte-grated companies that have trading licences must keep separate accounts for their grid operations and the competitive activities (trade and production). This enables the NVE, which is responsi-ble for control of monopoly operations, to evaluate whether prices for power transmission are reasonable. Moreover, licence-holders are required to provide market access for all customers for grid services by offering non-discriminatory and objective point tariffs and conditions. The act was amended in 2006 to require clear divisions in terms of business organisation and functions in vertically integrated enterprises that have been assigned system responsibility or that have more than 100 000 grid customers. Through regulations, the NVE has laid down further provisions on revenue caps, tariffs, metering and settlement of power trades. Chapter 5 gives a more detailed account of monopoly controls.
Marketplace licence Organisation and operation of a physical market for trade in power requires a marketplace licence. The marketplace plays a key role in market-based trade in electricity. Marketplace licences make it possible for the energy authorities to lay down conditions and carry out inspection and enforcement activi-ties as regards factors including pricing, the marketplace’s obligations vis-à-vis the system coordinator, transparency, requirements for the trading partners, neutral conduct and non-discrimination. Chapter 5 gives a more detailed account of power trading.
Licence for power trading with other countriesA licence under the Energy Act is required to facilitate foreign trade in power. Such licences are awarded by the Ministry of Petroleum and Energy. The system is intended to ensure that the cross-border exchange of power is as secure and efficient as possible. Statnett SF and Nord Pool Spot AS have licences for facilitating foreign power trading Chapter 5.5 gives a more detailed account of discussion of power trading between Norway and other countries.
District heating plants A licence pursuant to the Energy Act is required for district heating plants whose output exceeds 10 MW. It is also possible to apply for a licence for smaller plants. District heating licences are awarded by the NVE.
If a district heating plant has a licence, the municipality may decide to make connection to the system mandatory under pro-visions for legally binding plans pursuant to the Planning and Building Act. Mandatory connection may apply new buildings and buildings undergoing general renovation. The municipali-ties can lay down provisions to determine which buildings are subject to mandatory connection and which are not. The munici-palities may also grant exemptions from mandatory connection duty to connect.
The Energy Act also regulates the price for delivering district heating. The district heating price must not exceed the price for electric heating in the supply area in question. Customers to whom mandatory connection applies can appeal to the NVE as regards prices and other delivery conditions.
System responsibility, rationing and quality of supply The responsibilities of the transmission system operator (TSO) include ensuring a balance between total production and overall consumption of power at all times and taking steps to provide a satisfactory quality of supply throughout the country. The authority to designate Norway’s TSO and lay down conditions for its operations has been delegated to the NVE. Statnett SF is the TSO in Norway. The Ministry of Petroleum and Energy has laid down further rules on system responsibility in regulations under the Energy Act, and the NVE has adopted other regula-tions relating to system responsibility. Statnett SF is further described in Chapter 4.4.
The Energy Act also contains provisions on rationing of electric-ity, including enforced reductions in supply and requisitioning, if this is warranted by extraordinary circumstances. Under these provisions, the NVE has been designated as the rationing authority, and is responsible for planning and administrative implementation of measures in connection with power rationing. The NVE has adopted separate regulations relating to rationing.
Regulations relating to quality of supply have also been adopted pursuant to the Act.

75APPENDIX
Energy planning The Energy Act contains a separate chapter on energy planning. According to the Act, energy planning should ensure that differ-ent options for the development of a rational public energy sup-ply system are considered. Anyone who holds a construction and operating licence or a licence for a district heating plant under the Act for electrical installations and district heating plants is required to participate in energy planning.
In December 2012, the NVE adopted regulations relating to energy system analyses both for the regional and central grid and for local areas.
The power system analyses describe the current power grid, consumption and production data, current and future trans-mission conditions, as well as expected measures. They are intended to ensure systematic, robust and transparent assess-ment of alternative options for the grid. The country has been divided into 18 areas for this purpose, one covering the whole country for the central grid and 17 areas for the regional grid. Statnett has been designated as responsible for analyses of the central grid, while 17 different grid companies have been made responsible for the regional analyses.
Power supply preparedness On 9 January 2012, a bill (Prop. 112 L (2010-2011)) contain-ing amendments to the Energy Act and certain other acts was adopted by the Storting. It included amendments to and clarifi-cation of the chapter of the Energy Act dealing with prepared-ness. These amendments entered into force on 1 January 2013.
After the amendments, the Energy Act’s provisions on prepared-ness apply in extraordinary circumstances in peacetime which may harm or prevent the production, conversion, transmission, trading and distribution of electric energy or district heating, as well as in wartime. As the preparedness authority, the NVE is authorised to implement preparedness measures vis-à-vis those who own or operate installations and systems which are critical for the supply of electric energy or district heating. These actors have also been assigned an independent duty to ensure effective security and preparedness, and to take steps to prevent, handle and mitigate the effects of extraordinary situations.
The Power Supply Preparedness Organisation consists of the entities that own or operate installations or other equipment
with material significance for operations or for maintaining or restoring security of production, conversion, transmission, trading or distribution of electric energy or district heating. As a general rule, entities that hold licences under to the Energy Act must be part of the Preparedness Organisation, but others entities may be required to take part by regulations or individual decisions.
During extraordinary situations which may harm or prevent production, conversion, transmission, trading or distribution of electric energy or district heating, the Preparedness Organisa-tion may be required to take on responsibilities and duties. In emergency situations and during wartime, the NVE can make the power supply system subject to the authority of the Prepar-edness Organisation KBO. The entities that form part of the Preparedness Organisation must ensure that their operations are appropriately planned and that they have the resources nec-essary to carry out their responsibilities and tasks as described in the preparedness chapter of the Energy Act.
In June 2012, the NVE submitted new regulations relating to protective security and preparedness in the energy supply system for consultation 2012. The proposed regulations bring all provisions on preparedness in the energy supply system together in one statute.
1.5 The Offshore Energy Act The Act relating to offshore renewable energy production of 4 June 2010 No. 21 (the Offshore Energy Act) regulates offshore renewable energy production and offshore conversion and transmission of electricity. The Act establishes that the right to utilise offshore energy resources belongs to the State. The Act applies within Norwegian territorial waters outside the base-lines and on the continental shelf, but provisions of the Act can also be made applicable to coastal waters. The establishment of installations for production, conversion or transmission of power in areas covered by the scope of the Act requires a licence. The general rule is that a governmental strategic impact assessment must be carried out and the King in Council must subsequently decide to opening areas for licence applications before any applications can be considered. However, exceptions from the general rule can be made for time-limited pilot projects or simi-lar projects. Applications for licences for installations within the baselines can also be processed pursuant to the Energy Act.

76
1.6 The Electricity Certificate Act An electricity certificate is a confirmation issued by the State that one megawatt hour of renewable energy has been produced pursuant to the Electricity Certificate Act. The electricity cer-tificate system is intended to promote investments in renewable energy. Electricity customers finance the scheme through their electricity bills. The electricity certificate market is a statutory market in that the market would not have established itself natu-rally, but that the need and demand has been created through the Electricity Certificate Act.
The electricity certificate market is based on an international agreement with Sweden, and the joint market makes use of a cooperation mechanism under the Renewables Directive, see the discussion of the Directive in Chapter 1. The goal is for the joint electricity certificate market to increase electricity production based on renewable energy sources in Norway and Sweden by 26.4 TWh by 2020. To establish the joint market, it was necessary to ensure that electricity certificate obligations in Sweden can be fulfilled using Norwegian electricity certificates and vice versa.
The owner of a production facility is entitled to electricity certificates if specific conditions in Chapter 1 of the Electric-ity Certificate Act have been fulfilled. The production facility must produce electricity based on renewable energy sources (this is a technology-neutral requirement), be approved by the NVE and satisfy requirements for metering and reporting. Both expansion of existing facilities and new facilities may satisfy the conditions for receiving electricity certificates. Production facilities which become operational after 31 December 2020 will not be entitled to electricity certificates. Those subject to the electricity certificate obligation are primarily suppliers of electric energy to end-users. But, in certain cases, end-users themselves may themselves be subject to an electricity certifi-cate obligation.
Producers entitled to electrical certificates must apply for approval of the facility to the NVE, which administers the elec-trical certificate scheme in Norway. In addition, the producer, or a registrar authorised by the producer, must apply for an account in the electronic electricity certificate registry.
Statnett SF is responsible for the electricity certificate registry, and has established and operates the registry. Statnett SF is responsible for registration and cancellation of electricity certifi-
cates in the registry. The electricity certificates are issued after production has taken place on the basis of actual metering data. Electricity certificates are issued by Statnett SF registering the electricity certificate in the certificate account of the entity enti-tled to electricity certificates. The scheme will be terminated on 1 April 2036 through the cancellation of electricity certificates for the year 2035.
The electricity certificate scheme is based on trading of the certificates, so that the entities entitled to electricity certificates can capitalise the value represented by the certificates. Those subject to an electricity certificate obligation will have access to the electricity certificates that are necessary in order to fulfil their electricity certificate obligation.
The Electricity Certificate Act has been supplemented by the regulations relating to electricity certificates of 16 December 2011 No. 1398.
1.7 Other legislation The following provide a further description of other legisla-tion of importance for the energy sector and water resources management. The Natural Gas Act is the only one of these acts which is administered by the Ministry of Petroleum and Energy/NVE.
The Planning and Building Act The Act relating to planning and processing of building applica-tions of 27 June 2008 No. 71 (the Planning and Building Act pri-marily applies in parallel with the energy and water resources legislation, but important exemptions have been made.
The planning section of the Planning and Building Act entered into force on 1 July 2009. The Act introduced certain new provi-sions which apply to energy measures. Only the chapters of the Act which concern impact assessments and the requirement for basic map data and spatial data apply to the central grid and regional grids. Otherwise, these are exempt from the provisions of the Act. There is no requirement under the Act to prepare a zoning plan in connection with installations for the production of electric power. In order to ensure that such production facilities can be established in instances where the municipality does not facilitate the project through the adoption of a zoning plan, by amending a plan or through an exemption, a provision has been

77APPENDIX
included which allows the Ministry of Climate and Environment to decide that a final licence shall have the effect of a central government land-use plan. The Ministry of Climate and Envi-ronment’s authority in this regard has been delegated to the Ministry of Petroleum and Energy by Royal Decree.
Regulations relating to environmental impact assessment entered into force on 1 July 2009. These set out the limits above which an EIA is mandatory for a project and detailed rules for carrying out an EIA. On 19 December 2014, two new sets of regulations were adopted to replace the 2009 regulations: one for environmental impact assessment of projects under sectoral legislation, and the other for projects under the Planning and Building Act. Briefly, their provisions make an EIA manda-tory for larger-scale projects, while an EIA is only required for smaller-scale projects if screening indicates that they may have significant effects. The procedures to be followed are different for large- and small-scale projects.
As a general rule, the provisions of the Planning and Building Act relating to building applications do not apply to projects under to the energy and water resources legislation. This fol-lows from the regulations relating to processing and oversight of building applications under the Planning and Building Act.
The Water Management Regulations implements the EU Water Framework Directive and its legal authority is partly provided by the Planning and Building Act. The Regulation contains provisions on the preparation of river basin management plans with the objective of maintaining and improving environmen-tal status in inland and coastal water bodies. The plans must indicate environmental objectives for each water body, and must include a programme of measures.
The Nature Diversity Act The Act relating to the management of biological, geological and landscape diversity of 19 June 2009 No. 100 (Nature Diversity Act) repealed the Nature Conservation Act and resulted in amendments to certain other acts. The purpose of the Nature Diversity Act is to protect biological, geological and landscape diversity and ecological processes through conservation and sustainable use, and in such a way that the environment pro-vides a basis for human activity, culture, health and well-being, now and in the future, including a basis for Sami culture.
In addition to rules regarding various forms of protection, the Act includes provisions on sustainable use. It also sets out prin-ciples for decision-making in matters affecting the environment, which apply to the exercise of public authority in all sectors when decisions may affect biological, geological and landscape diversity. This applies, for example, to the licensing of projects for wind power, hydropower and power from other renewable energy sources, which must therefore be assessed in accord-ance with these provisions. The principles (set out in sections 8–12) are to be used as guidelines when discretionary judgment needs to be exercised. Decisions must state how the principles have been applied and weighted.
The Expropriation Act When an energy facility is to be built, the developer must acquire the necessary land and licences for the facilities. This can be done either through voluntary agreements or through expropriation. When the developer applies for a licence, this is usually accompanied by an application for an expropriation licence in the event that it is not possible to reach agreement with the affected landowners and rights-holders.
Rules relating to expropriation and advance possession are founded in the Act relating to expropriation of real property of 23 October 1959 No. 3 (the Expropriation Act). Consent can only be granted for expropriation if there appears to be no doubt that the measure will result in greater advantages than disadvantages.
If the developer cannot achieve voluntary agreements with affected landowners and licensees, expropriation is imple-mented through a subsequent discretionary judgement case before the courts, in order to stipulate possible compensation for the expropriation measure. If the construction work needs to start before such a discretionary judgement has been rendered, the developer can apply for advance possession.
Competition legislation The Act of 5 March 2004 No. 12 relating to competition between undertakings and control of concentrations of undertakings (the Competition Act) provides a framework for the parts of the power market which are subject to competition, and applies in this area alongside the Energy Act.
The purpose of the Act is to further competition and thereby contribute to the efficient utilisation of society’s resources.

78
When applying the Act, special consideration shall be given to the interests of consumers.
The Act prohibits collaboration that restricts competition and abuse of a dominant position. The Act also allows the competition authorities to issue substantial fines in the event of breach of the Act’s prohibitions, and introduces the opportunity to reduce fines for undertakings which assist the competition authorities in clearing up infringements. There is also a general duty to report mergers and acquisitions. The Norwegian Compe-tition Authority handles competition issues in the power market.
The Natural Gas Act The implementation of Directive 98/30/EC (the Gas Market Directive) in Norwegian law necessitated the establishment of a legal framework for such activities in Norway. The Act relat-ing to common rules for the internal market in natural gas of 28 June 2002 No. 61 (the Natural Gas Act) covers transmission, distribution, supply and storage of natural gas.
Chapter 2 of the Natural Gas Regulations of 14 November 2003 No. 1342 contains further provisions on licences for certain types of downstream natural gas infrastructure. Facilities for transmission of natural gas, including transmission pipelines, LNG plants and associated facilities that will primarily supply natural gas to natural gas enterprises in another region may not be constructed or operated without a licence from the Ministry. Smaller LNG plants, smaller plants for transmission of natural gas or facilities for distribution of natural gas do not require a licence. The authority to make decisions pursuant to the Natural Gas Regulations has been delegated to the NVE.
On 26 June 2003, the EU adopted Gas Market Directive II (Directive No. 2003/55/EC). This Directive has been in turn replaced by Directive 2009/73/EF (Gas Market Directive III), which was adopted on 13 July 2009. Gas Market Directive III has not yet been incorporated into the EEA Agreement. The Directive will require certain amendments to the natural gas legislation. The third energy market package is further dis-cussed in Chapter 1.
Within the framework of Gas Market Directive II, it is possi-ble to take into account special conditions in countries where the gas markets are underdeveloped. The implementation of this Directive in Norway has taken into consideration the fact
that the Norwegian downstream gas market is considered an emergent market in line with Article 28, No. 2 of the Directive. This entails an exemption from all but the most important of the Directive’s provisions until 2014. Gas Market Directive III also allows for exemptions from key Directive provisions in emergent markets.
The Consumer Purchases Act The Act of 21 June 2002 No. 34 relating to consumer purchases (the Consumer Purchases Act) applies to the transmission and supply of electric energy. As a general rule, this provides con-sumers with the same protection as regards the electricity sup-ply as for other services within the scope of the Act. This means that the consumer, on specified conditions can withhold pay-ment or demand price reductions or reimbursement as a result of breach of contract on the part of grid companies. Application of the rules in the Consumer Purchases Act has been adapted to the particular characteristics of the service in the case of elec-tricity supplies. Among other things, this applies to the issue of the grid companies’ liability in the event of supply disruptions. There are also clear guidelines for the grid companies’ right to shut off the electricity if a consumer defaults on payments, and the Act provides the statutory basis for the activities of the Electricity Appeals Board.
The Pollution Control Act The Act relating to protection against pollution and to waste of 13 March 1981 No. 6 (the Pollution Control Act) covers most sources of pollution within the energy and water resources sec-tor.
The Pollution Control Act prohibits pollution unless a permit has been issued. Permits are issued for certain activities and on specified conditions pursuant to section 11 of the Act or v regulations concerning polluting activities.
The general rule is that any polluting activity must have an individual permit from the pollution authorities.
The Pollution Control Act is administered by the Ministry of Climate and Environment. Applications for permits for indus-trial and other activities must be submitted to the Norwegian Environment Agency or the relevant county department of environmental affairs in cases where the county governor is the pollution control authority.

79APPENDIX
Energy and water resource projects may require permits pursu-ant to the Pollution Control Act. This applies for example to gas-fired power plants and hydropower plants. Pollution and its impacts in connection with large-scale hydropower plants and regulatory measures will be assessed during licensing procedures under the Watercourse Regulation Act, and pol-lution permits are included in licences issued pursuant to the Watercourse Regulation Act. Routines have been developed for coordinating permits for smaller developments. For example, the Water Resources Act allows for licences pursuant to the Water Resources Act to replace permits pursuant to the Pollu-tion Control Act and vice versa.
The Neighbouring Properties Act The Act relating to the legal relationship between neighbouring properties of 16 June 1961 No. 15 (the Neighbouring Proper-ties Act) regulates the legal relationship between neighbours, not only the relationship between adjacent properties. The Act applies as long as “special legal considerations” do not indicate otherwise. The Neighbouring Properties Act is primarily appli-cable to measures which affect neighbours in river systems.
The Cultural Heritage Act The Act concerning the cultural heritage of 9 June 1978 No. 50 (the Cultural Heritage Act) has significance for measures pursuant to the energy and water resources legislation. The Ministry of Climate and Environment is the highest administra-tive authority and has delegated authority in some matters to the Directorate for Cultural Heritage and, the county authori-ties, and to the Sámediggi (Sami parliament) as regards Sami cultural heritage. Archaeological and architectural monuments and sites will be considered during licensing procedures, and their presence may result in a decision that a licence is required for a project or be one of the factors behind a refusal to issue a licence. Licences issued under the water resources legisla-tion include conditions requiring safeguarding of automatically protected monuments and sites, and licences pursuant to the Energy Act take cultural heritage considerations into account by requiring an environment, transport and construction plan.
The Outdoor Recreation Act The Act relating to outdoor recreation of 28 June 1957 No. 16 (the Outdoor Recreation Act) regulates the access rights to land owned by others. The Water Resources Act regulates actual access to river systems, but other activities (bathing, landing
and mooring boats) are regulated by the Outdoor Recreation Act. The highest administrative authority is the Ministry of Climate and Environment, with the Norwegian Environment Agency as its subordinate agency.
The Reindeer Husbandry Act According to section 22 of the Act relating to reindeer hus-bandry of 15 June 2007 No. 40, the closure of migration routes is prohibited. In addition to complete blockage of migration routes, the provisions may apply to their partial obstruction of and to construction near routes, and to any disturbance resulting from construction if this prevents hinders reindeer movement along the migration route. This must be assessed in each individual case. The Ministry of Agriculture and Food may grant consent for realignment of migration routes and opening new migration routes. However, migration routes may be affected or closed in connection with large-scale projects if the conditions for expro-priation are satisfied.
If it proves not to be possible to move reindeer past an energy facility or underneath a power line which crosses a migration path, the developer may be required to compensate for any damage or to implement measures to mitigate the situation for the reindeer husbandry industry, as determined by the licensing authority following consultations with the Sámediggi and the affected reindeer migration district.
The Public Administration Act The Act relating to procedure in cases concerning the public administration of 2 October 1967 No. 10 (the Public Administra-tion Act) establishes a framework for how administrative proce-dures by the authorities. It contains general rules on procedures for administrative decisions and other matters, and supplements the specific procedural rules in legislation for specific sectors such as the Energy Act.
Other statutes Other statutes which may affect energy and water resource measures include the Act relating to wildlife and wildlife habi-tats of 29 May 1981 No. 38, the Act relating to salmonids and fresh-water fish, etc., of 15 May 1992 No. 47 and the Act relating to aquaculture, etc., of 14 June 1985 No. 68.
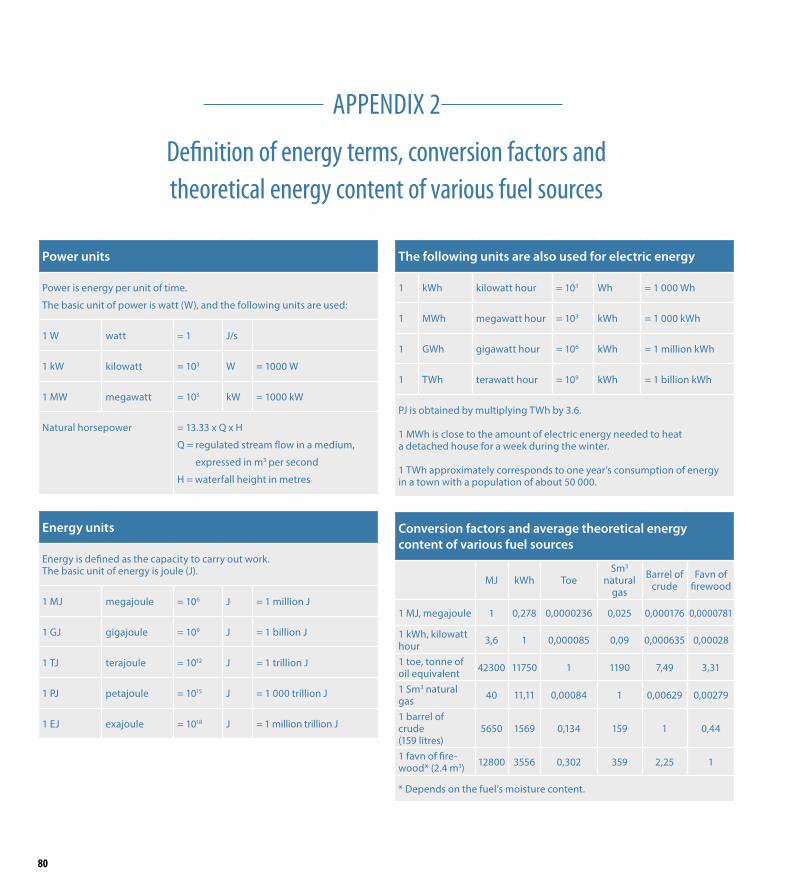
80
Definition of energy terms, conversion factors and theoretical energy content of various fuel sources
APPENDIX 2
Power units
Power is energy per unit of time .
The basic unit of power is watt (W), and the following units are used:
1 W watt = 1 J/s
1 kW kilowatt = 103 W = 1000 W
1 MW megawatt = 103 kW = 1000 kW
Natural horsepower = 13 .33 x Q x H
Q = regulated stream flow in a medium,
expressed in m3 per second
H = waterfall height in metres
Energy units
Energy is defined as the capacity to carry out work .The basic unit of energy is joule (J) .
1 MJ megajoule = 106 J = 1 million J
1 GJ gigajoule = 109 J = 1 billion J
1 TJ terajoule = 1012 J = 1 trillion J
1 PJ petajoule = 1015 J = 1 000 trillion J
1 EJ exajoule = 1018 J = 1 million trillion J
The following units are also used for electric energy
1 kWh kilowatt hour = 103 Wh = 1 000 Wh
1 MWh megawatt hour = 103 kWh = 1 000 kWh
1 GWh gigawatt hour = 106 kWh = 1 million kWh
1 TWh terawatt hour = 109 kWh = 1 billion kWh
PJ is obtained by multiplying TWh by 3 .6 .
1 MWh is close to the amount of electric energy needed to heat a detached house for a week during the winter .
1 TWh approximately corresponds to one year’s consumption of energy in a town with a population of about 50 000 .
Conversion factors and average theoretical energy content of various fuel sources
MJ kWh ToeSm3
natural gas
Barrel of crude
Favn of firewood
1 MJ, megajoule 1 0,278 0,0000236 0,025 0,000176 0,0000781
1 kWh, kilowatt hour 3,6 1 0,000085 0,09 0,000635 0,00028
1 toe, tonne of oil equivalent 42300 11750 1 1190 7,49 3,31
1 Sm3 natural gas 40 11,11 0,00084 1 0,00629 0,00279
1 barrel of crude (159 litres)
5650 1569 0,134 159 1 0,44
1 favn of fire-wood* (2 .4 m3) 12800 3556 0,302 359 2,25 1
* Depends on the fuel’s moisture content .
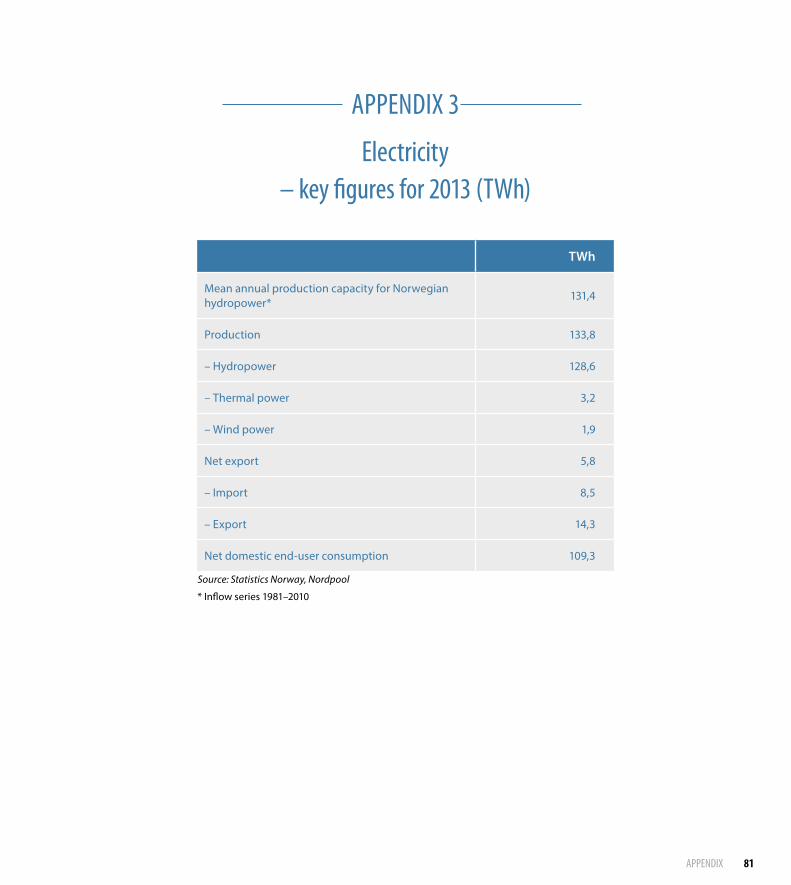
81APPENDIX
Electricity – key figures for 2013 (TWh)
APPENDIX 3
TWh
Mean annual production capacity for Norwegian hydropower*
131,4
Production 133,8
– Hydropower 128,6
– Thermal power 3,2
– Wind power 1,9
Net export 5,8
– Import 8,5
– Export 14,3
Net domestic end-user consumption 109,3
Source: Statistics Norway, Nordpool
* Inflow series 1981–2010

82
Transmission capacity in the Nordic region
APPENDIX 4
A 700 MW interconnector between Norway and Denmark (SK4) has been completed and will according to plan be operational from 1 December 2014. This will increase the exchange capacity between Norway and Denmark to 1700 MW.
In the autumn of 2014, Statnett received a licence to build interconnectors to Germany and the UK. Each of the intercon-nectors will have a capacity of 1400 MW, and Statnett has scheduled their comple-tion for 2018 and 2020 respectively.
Source: Regional Investment Plan 2014 Baltic Sea, ENTSO-E

83APPENDIX
APPENDIX 5
Definitions
Term/expression Definition
Operational time
Power balance Difference between supply and consumption of power at a given time .
Bottleneck Transmission restrictions between geographical areas .
Installed (production) capacity The power (MW) a power plant can supply .
(Domestic) power balance Difference between production and overall consumption of power over a year .
Hydropower production in a nor-mal year
Calculated, average annual production capacity in a hydropower plant . The 1981–2010 inflow series is currently used as a basis for the calculation . Production per station is normally listed in GWh . Each power plant’s volume of water forms the basis for production simulations for the individual power plant .
Natural horsepower Natural horsepower is used in energy legislation as a unit of power in hydropower plants .
Drainage basin The geographic area which collects precipitation running into a river system .
Grid loss Energy loss in the grid during transmission of electricity .
Area priceElectricity price established in an individual bidding area on Nord Pool Spot . The area prices consider bottlenecks in the grid and provide balance between supply and demand within each bidding area .
Bidding areaA defined market area for buying and selling power . Norway is currently divided into 5 bidding areas .
Regulating powerReserves in the power system which can be used in the event of faults or imbalances in the operating hour to achieve secure operation .
End-user Anyone who purchases power for personal consumption .
Stationary energy consumption Net domestic energy consumption minus the use of energy for transport purposes .
System priceJoint Nordic electricity price set on Nord Pool Spot . The price balances overall supply and demand in Scandinavia, but does not consider potential bottlenecks in the grid .
Water inflow The volume of water which flows into the reservoirs from a river system’s entire drainage basin .
Hydropower potentialThe energy in Norwegian river systems which can be developed for power purposes within technical and economic .
River system A continuous system of rivers from source to sea, including any lakes, snowfields and glaciers .
Operational time (h) = Energy produced over a year (MWh)
Installed turbine capacity (MW)
ENERGY AND WATER RESOURCES IN NORW
AYFACTS
2015
ENERGY AND WATER RESOURCES IN NORWAY
FACTS2015
Published by:The Ministry of Petroleum and Energywww.regjeringen.no/oedPublic institutions can place bulk orders with:Government Administration ServicesInternet: www.publikasjoner.dep.noE-mail: [email protected]: +47 22 24 20 00ISSN: 0809-9464Publication code: Y-0102/9ELayout and printing: 07 Media, 02/2015Circulation: 2000