facts and figures on organic farming in italy 2018
TRANSCRIPT

FACTS AND FIGURES ON ORGANIC FARMING IN ITALY 2018 THEMATIC VOLUME 2


FACTS AND FIGURES ON ORGANIC FARMING IN ITALY 2018 THEMATIC VOLUME 2

February 2019
This report can be downloaded from the
SINAB website: www.sinab.it
Graphic design
Studio Ruggieri Poggi
Chieco Sistemi

FOREWORD AREAS, OPERATORS AND CROPS MARKET, PRICES AND CONSUMPTION IMPORT FROM THIRD COUNTRIES
5 7 21 33
CONTENT
Riccardo Meo
Maria Nucera
Massimo Paschino
Patrizia Nocella
WORKING GROUP ISMEA Delizia Del Bello
Antonella Giuliano
Maria Rosaria Napoletano
Fabiana Catania
CIHEAM Bari Marie Reine Bteich
Fabiana Crescenzi
Luigi Guarrera
Patrizia Pugliese
Francesco Solfanelli
(Università Politecnica
delle Marche)
PROJECT STEERING COMMITTEE Francesco Saverio Abate (MiPAAFT)
Roberta Cafiero (MiPAAFT)
Fabio Del Bravo (ISMEA)
Maurizio Raeli (CIHEAM Bari)
TECHNICAL COORDINATION Francesco Giardina (CIHEAM Bari)
Acknowledgements
Special thanks to Marina Marini and Luigi Guarrera for translation into English


5
FOREWORD
"Facts and Figures on Organic Farming in Italy
2018" is the second thematic volume of a series
of publications within the Project for the deve-
lopment and implementation of activities aimed
at defining the economic dimension of organic
farming across the supply chain: DIMECOBIO
III, funded by the Ministry of Agriculture, Food,
Forestry Policies and Tourism, with which
ISMEA and CHIEAM Bari collaborate to gather
data and information available to analyze the
sector as a whole and some specific segments
that have a comparable economic importance
or can have a significant development potential.
Each thematic volume is intended as a working
or informative tool with different targets, to ba-
sically provide a background for reflections and
exchange among practitioners (operators, pro-
fessionals, experts) and a reference for further
investigation or analyses to support institutional
decisions and strategies.
The series comprises a total of six publications.
Three thematic volumes are focused on speci-
fic sectors. The scenarios outlined for each
segment of the organic industry will include
economic and market data, a review of the re-
search projects that have been carried out and
some good practices useful for the dissemina-
tion of ideas, innovations and practical solu-
tions to specific problems. The editorial choices
and the content organization seek to provide
practical insights also to evaluate business de-
cisions and strategies, identify information
needs and expectations not only from a techni-
cal and agricultural point of view.
In addition, the aim is also to interpret the cur-
rent state of innovation within the industry, and
assess whether the “landscape” is suitable for
the adoption or improvement of modern agro-
nomic approaches related, for instance, to pre-
cision economy, circular economy, sustainability
of all the components, digitization or even to
identify the actual growth prospects, analyze
how far research has gone and understand to
what extent the results achieved have been dis-
seminated or, finally, to reconcile new demands
and research.
Three more volumes present, every year, in En-
glish for wider circulation and visibility, the stati-
stics of the Italian organic sector focusing on
structural aspects, including operators, areas
and crops, and market aspects, with further de-
tails on prices and consumption and on the im-
port of organic products from third countries.


AREAS, OPERATORS AND CROPS FIGURES ON ORGANIC FARMING
Data
MiPAAFT Ministry of Agriculture, Food, Forestry Policies and Tourism
Source
Control Bodies Regions and SIB (Organic Information System)
Data processed by
SINAB National Information System on Organic Farming Delizia Del Bello
Fabiana Crescenzi
Francesco Giardina

FACTS AND FIGURES ON ORGANIC FARMING IN ITALY 2018
8
Since 2010, the area under organic farming in
Italy has increased by almost 800,000 hec-
tares. The comparison between 2017 and
2010 shows an increase of 71% in organic
areas and of 59% in organic operators (Chart 3).
Data as at 31 december 2017 confirm the sec-
tor growth, maintaining positive trend.
Based on SINAB estimates, in 2017 the culti-
vated areas in Italy exceeded 1.9 million hec-
tares, with a 6.3% growth compared to 2016.
Overall, in 2017, more than 110,000 hectares
were farmed organically (Table 1).
Grassland (544,049 ha), Plants harvested
green (376,573 ha) and cereals (305,871 ha)
represent the main Italian organic farming
crops. These categories are followed, accord-
ing to size, by areas planted with olive trees
(235,741 ha) and vineyards (105,384 ha).
Compared to 2016, it is worth noting that some
crops have increased: common wheat and
spelt (+22.6), vegetables (+25.4%) - a sector
where areas under tomato have reached 6,241
ha, with a 53.8% growth of nuts (+16.7%) and
temperate fruit (+10.9%), while the growth of
wine grapes was more limited (only 1.9%)
(Tables 1 and 2).
As regards the regional distribution of or-
ganic areas, the largest surface area was re-
ported in Sicily, with 427,294 ha, followed by
Apulia with 252,341 ha, and Calabria with
202,119 ha. The organic area in these three
Regions accounts for 46% of the whole na-
tional organic area, confirming the value of
2016. Compared to 2016, only Sicily con-
tinues to grow (with an increase of 17.5%),
while Apulia and Calabria show a slight de-
crease (Tables 3 and 4).
Emilia-Romagna ranking among the top five
Italian Regions (based on surface area) with a
total of 134,509 ha, and the performance of
Lombardy, which is the region that grows the
most with +21.4% (Tables 3 and 4), are two key
points that indicate how organic plant produc-
tion is attracting growing interest also from the
North of the country.
As of 31 december 2017, 75,873 holdings
were included in the Italian organic agriculture
certification system, which means a 5.2% in-
crease compared to 2016. These figures can
be broken down as follows: 57,370 exclusive
producers (farmers), 3.2% more than 2016;
8,689 exclusive processors (involved in pre-
serving/processing and marketing, also includ-
ing retail sales), gaining an additional 14.6%;
9,403 producers/processors (carrying out pro-
duction, processing and marketing activities),
that grew by 8.8%; 411 importers (who can
also be producers and processors), with a
13.2% increase compared to 2016 (Table 5).
The Regions that continue to keep the lead of
the number of operators, even in 2017, are all
located in the South: Sicily (11,626 operators,
with a 1.5% increase), Calabria (11,167 oper-
ators, with a slight decline of 1.4%, despite the
sharp increase recorded in 2016), and Apulia
(9,378 operators, with a situation comparable
to that in Calabria, showing a 6.5% decrease
despite an increase of 50% in 2016) (Table 6).
National data (ISTAT FSS 2013) on the percen-
tage incidence of organic farming indicate that
organic agriculture accounted for 15.4% of the
Italian UAA in 2017, given that it gained one
point more compared to 2016 (Table 7).
Processing of area data by geographical loca-
tion shows that every 100 hectares of UAA,
about 20 hectares are organically farmed in
the Centre, the South and the Islands, while
the organic UAA does not exceed 7 hectares
in the North.
On the other hand, organic farms in Italy ac-
count for 4.5% of the total number of all agri-
cultural holdings: this incidence is fairly
homogeneous across the country and remains
substantially stable compared to 2016 (Table 7).

AREAS, OPERATORS AND CROPS
9
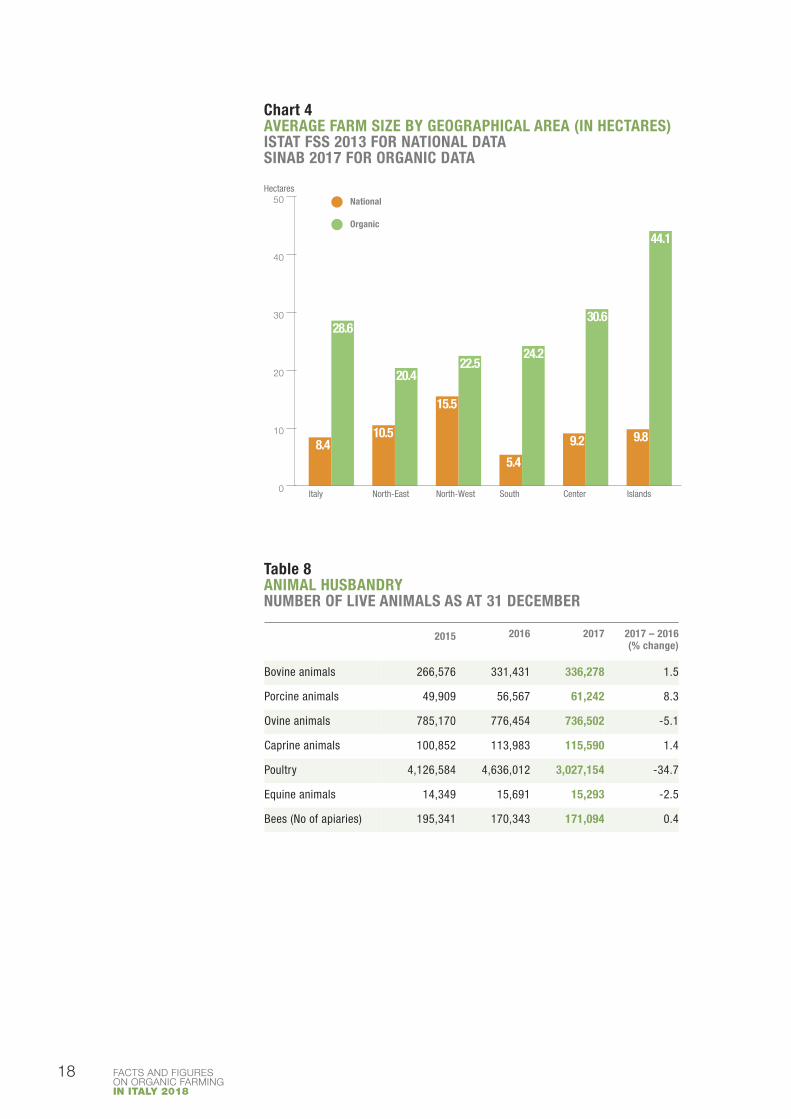
The percentage of organic farms on the total
(4.5%) is lower than the percentage of organic
land on the total UAA (15.4%), because the
average farm size is very high in organic agri-
culture (Chart 4). The average size of an organic
farm in Italy in 2017 was 29 ha, compared with
the national average of 8,4 ha for conventional
holdings.
The data presented were compiled by the Na-
tional Information System on Organic Farming
- SINAB, a project funded by the Ministry of
Agriculture, Food, Forestry Policies and Tourism
(MiPAAFT) and managed by ISMEA and CI-
HEAM Bari - on the basis of the figures pro-
vided by the Control Bodies, the Regions and
the Organic Information System (SIB) up until
31 december 2017.
Table 1 AREAS AND CROP TYPES IN ORGANIC FARMING AS AT 31 DECEMBER 2017 IN HECTARES
Under conversion 2017
Organic 2017
TOTAL 2017
TOTAL as at 31
december 2016
2017 – 2016 (% change)
TOTAL - CROPS 536,314 1,372,340 1,908,653 1,796,363 6.3
Cereals 90,466 215,405 305,871 299,639 2.1
Dried pulses and protein crops for grain production
13,516 36,214 49,730 43,986 13.1
Root crops 608 1,199 1,807 1,582 14.2
Industrial crops 9,185 20,001 29,186 25,278 15.5
Plants harvested green 97,786 278,787 376,573 342,653 9.9
Other arable land crops 6,540 14,644 21,185 18,106 17.0
Vegetables* 16,872 38,184 55,056 43,914 25.4
Fruit** 11,078 22,683 3,761 29,920 12.8
Nuts 12,877 34,575 47,452 40,665 16.7
Citrus fruit 7,795 31,861 39,656 36,125 9.8
Vineyards 34,593 70,791 105,384 103,545 1.8
Olives 63,510 172,232 235,741 222,452 6.0
Other permanent crops 1,252 3,650 4,902 16,296 -69.9
Permanent grassland (excl. rough grazing)
110,099 280,784 390,883 321,011 21.8
Rough grazing 39,566 113,599 153,166 185,142 -17.3
Fallow land 20,572 37,729 58,301 66,047 -11.7
Other categories not included in the total: not grazed forest and/or wild collection areas (mushrooms, truffles, wild berries) notified by the operator; other.
93,347 166,531 259,878 176,628 47.1
* “Strawberries” and “cultivated mushrooms” are included in vegetables ** Fruit includes “fruit of temperate climate zones”, “fruit of sub-tropical climate zones”, “berries (soft fruit)

FACTS AND FIGURES ON ORGANIC FARMING IN ITALY 2018
10
Table 2 DETAILS OF MAIN CROPS IN HECTARES
Area under conversion 2017
Organic area 2017
TOTAL 2017
TOTAL 2016
2017 – 2016 (% change)
Cereals for grain production (inc. seeds) 90,466 215,405 305,871 299,639 2.1
Wheat total 49,811 130,154 179,964 179,753 0.1
Durum wheat 37,636 90,302 127,938 137,321 -6.8
Common wheat and spelt 12,174 39,851 52,026 42,432 22.6
Rye 69 324 393 284 38.5
Barley 12,433 27,223 39,657 33,720 17.6
Oats 6,325 15,246 21,571 21,781 -1.0
Grain maize 5,824 9,566 15,390 12,203 26.1
Triticale 1,034 2,991 4,025 4,300 -6.4
Other cereals 10,408 19,056 29,464 30,997 -4.9
Rice 4,562 10,845 15,407 16,602 -7.2
Root crops 608 1,199 1,807 1,582 14.2
Potatoes (incl. early and seed potatoes) 454 851 1,305 1,189 9.8
Sugar beet (excl. seeds) 59 20 79 46 72.0
Other root crops 96 327 423 348 21.7
Industrial crops 9,185 20,001 29,186 25,278 15.5
Oil seeds total 6,998 14,770 21,768 16,133 34.9
Sunflower seed 2,594 5,475 8,069 6,028 33.9
Soya 3,579 5,628 9,207 8,354 10.2
Rape and turnip rape 420 1,625 2,045 614 233.3
Linseed 297 1,882 2,179 1,034 110.7
Other oil seeds 108 160 268 103 160.0
Tobacco 67 37 104 136 -23.5
Hops 3 5 8 3 135.0
Textile crops total 159 270 429 237 80.9
Cotton 0 0 0 1 -100.0
Other textile crops 159 270 429 237 81.4
Aromatic plants, medicinal and culinary plants 1,523 3,682 5,205 5,368 -3.0
Other industrial crops 435 1,236 1,671 3,401 -50.9
Plants harvested green 97,786 278,787 376,573 342,653 9.9
Annual plants harvested green - Total 21,364 57,578 78,941 72,505 8.9
Green maize 1,086 1,222 2,308 1,586 45.5
Other annual plants harvested green 20,277 56,356 76,633 70,919 8.1
Temporary grasses and grazings 28,500 87,475 115,974 94,773 22.4
Other plants harvested green 47,922 133,735 181,657 175,375 3.6
Lucerne (Alfalfa) 29,630 83,395 113,024 99,766 13.3
Other 18,293 50,340 68,633 75,609 -9.2
Fresh vegetables, melons, strawberries, cultivated mushrooms
16,872 38,184 55,056 43,914 25.4

AREAS, OPERATORS AND CROPS
11
Table 2 DETAILS OF MAIN CROPS IN HECTARES
Area under conversion 2017
Organic area 2017
TOTAL 2017
TOTAL 2016
2017 – 2016 (% change)
All brassicas (excl. roots) 1,731 4,545 6,276 3,146 99.5
Cauliflower and broccoli 848 2,139 2,987 1,707 75.0
Cabbage (white) 489 1,256 1,745 700 149.2
Other brassicas 394 1,150 1,544 739 109.1
Leafy or stalk vegetables (excl. brassicas) 3,255 5,558 8,814 6,761 30.4
Celery 20 68 88 67 31.5
Leaks 19 74 93 99 -5.5
Lettuces 100 273 373 307 21.4
Endives 156 144 299 254 17.9
Spinach 250 501 751 692 8.4
Asparagus 646 1,044 1,690 1,263 33.8
Chicory 423 505 928 284 226.8
Artichokes 462 720 1,181 1,235 -4.3
Other leafy or stalk vegetables (excl. brassicas) 1,180 2,230 3,411 2,561 33.2
Vegetables cultivated for fruit 2,857 7,287 10,144 9,141 11.0
Tomatoes 1,876 4,365 6,241 4,057 53.8
Cucumbers 7 27 35 36 -4.9
Gherkins 0 0 0 0 -
Melons 249 746 995 967 2.9
Water melons 85 185 270 350 -22.9
Other vegetables cultivated for fruit 639 1,964 2,604 3,731 -30.2
Root tuber and bulb vegetables 507 1,656 2,163 1,792 20.7
Carrots 175 692 867 836 3.7
Garlic 44 115 159 141 12.2
Onions 231 433 663 559 18.7
Shallots 1 13 14 10 32.0
Other root tuber and bulb vegetables 57 404 460 246 87.4
Pulses 6,503 15,503 22,006 18,877 16.6
Peas 2,043 3,846 5,889 5,574 5.7
Beans 546 912 1,458 1,101 32.4
Other pulses 3,914 10,744 14,658 12,203 20.1
Other vegetables 1,897 3,419 5,316 3,929 35.3
Strawberries 92 162 255 239 6.7
Cultivated mushrooms 30 54 84 29 186.1
Fruit * 11,078 22,683 33,761 29,920 12.8
Fruit of temperate climate zones 8,226 16,601 24,827 22,378 10.9
* Fruit includes “fruit of temperate climate zones”, “fruit of sub-tropical climate zones”, “berries (soft fruit)

FACTS AND FIGURES ON ORGANIC FARMING IN ITALY 2018
12
Table 2 DETAILS OF MAIN CROPS IN HECTARES
Area under conversion 2017
Organic area 2017
TOTAL 2017
TOTAL 2016
2017 – 2016 (% change)
Apples 2,311 3,890 6,201 5,182 19.7
Pears 679 1,354 2,033 1,732 17.4
Peaches 783 1,453 2,236 1,907 17.3
Apricots 867 2,115 2,982 2,675 11.5
Nectarines 129 196 325 386 -15.8
Cherries 1,091 2,819 3,910 3,749 4.3
Plums 286 941 1,227 686 78.7
Other fruit of temperate climate zones 2,078 3,833 5,911 6,061 -2.5
Berries (soft fruit) 183 332 515 450 14.4
Black currents 18 31 49 47 5.6
Raspberries 41 77 119 109 8.5
Other berries 124 223 347 294 18.0
Fruit of subtropical climate zones 2,668 5,750 8,419 7,092 18.7
Figs 208 349 557 528 5.5
Kiwis 1,852 3,584 5,437 4,718 15.2
Avocados 7 57 64 58 10.9
Bananas 0 0 0 0 -40.3
Other fruit of subtropical climate zones 601 1,760 2,361 1,788 32.0
Nuts 12,877 34,575 47,452 40,665 16.7
Walnuts 501 982 1,483 1,308 13.3
Hazel nuts 3,599 8,700 12,299 10,122 21.5
Almonds 4,085 13,405 17,491 13,985 25.1
Chestnuts 4,423 10,925 15,348 14,215 8.0
Other nuts 269 563 832 1,035 -19.6
Citrus fruit 7,795 31,861 39,656 36,125 9.8
Pomelos and grapefruit 19 90 108 127 -14.5
Lemons and acid limes 1,687 6,295 7,982 7,343 8.7
Oranges 4,127 16,824 20,951 18,218 15.0
Other citrus fruit (small citrus fruit) 1,962 8,652 10,614 10,437 1.7
Vineyards 34,593 70,791 105,384 103,545 1.8
Wine grape vineyards 33,782 69,425 103,207 101,289 1.9
Table grape vineyards 810 1,367 2,177 2,257 -3.5
Vineyards for raisin production 0 0 0 0 -
Olives 63,510 172,232 235,741 222,452 6.0
Table olives 277 702 979 799 22.5
Oil olives 63,233 171,529 234,762 221,653 5.9

AREAS, OPERATORS AND CROPS
13
Table 3 REGIONAL AREA DISTRIBUTION: % CHANGE 2017 - 2016 IN HECTARES
Chart 1 CHANGE IN ORGANIC AREAS BY REGION COMPARISON 2017 – 2016
TOTAL as at 31 december 2016 TOTAL as at 31 december 2017 2017 – 2016 (% change)
Total 1,796,363 1,908,653 6.3
Sicily 363,688 427,294 17.5
Apulia 255,853 252,341 -1.4
Calabria 204,527 202,119 -1.2
Latium 132,923 138,278 4.0
Emilia-Romagna 117,290 134,509 14.7
Sardinia 140,648 132,188 -6.0
Tuscany 131,003 130,115 -0.7
Basilicata 95,371 102,070 7.0
Marche 78,408 87,341 11.4
Campania 46,758 52,649 12.6
Piedmont 45,732 46,580 1.9
Lombardy 37,210 45,176 21.4
Umbria 37,994 43,540 14.6
Abruzzo 38,369 38,758 1.0
Veneto 23,654 27,979 18.3
Friuli Venezia Giulia 14,016 15,418 10.0
Molise 11,104 10,735 -3.3
A.P. Bolzano 8,362 9,209 10.1
A.P. Trento 6,337 4,869 -23.2
Liguria 3,910 4,309 10.2
Aosta Valley 3,206 3,178 -0.9
0 Sicily Calabria Emilia- Romagna
Tuscany Marche Piedmont Umbria Veneto Molise A.P.Trento
Aosta ValleyApulia Latium
SardiniaBasilicata Campania Lombardy Abruzzo Friuli
Venezia Giulia
A.P.Bolzano Liguria
50
100
150
200
250
300
350
400
450
Hectares(thousand) 2016
2017

FACTS AND FIGURES ON ORGANIC FARMING IN ITALY 2018
14
Table 4 REGIONAL AREA DISTRIBUTION BY CROP TYPE (HECTARES) YEAR 2017
Cereals Protein crops*
Root crops
Industrial crops
Plants harvested
green
Other arable
land crops
Vegetables **
Fruit*** Nuts Citrus fruit
Vineyards Olives Crops total
Italy 305,871 49,730 1,807 29,186 376,573 21,185 55,056 33,761 47,452 39,656 105,384 235,741 1,908,653
Sicily 57,881 15,406 123 760 69,232 3,544 6,048 4,261 14,425 25,339 35,939 42,101 427,294
Apulia 52,659 10,124 174 3,160 27,588 5,382 13,515 6,165 7,053 1,868 16,327 7,590 252,341
Calabria 16,908 1,325 120 505 33,375 4,697 1,654 3,501 2,731 11,208 4,443 67,482 202,119
Latium 14,822 1,748 133 917 39,327 810 3,670 2,434 8,268 18 2,453 8,665 138,278
Emilia-Romagna 26,853 1,279 356 3,820 53,993 1,161 6,229 2,683 1,409 2 3,704 779 134,509
Sardinia 4,710 186 32 245 22,743 435 687 255 197 70 1,611 3,752 132,188
Tuscany 23,242 2,620 217 3,041 38,969 779 3,861 1,018 1,140 19 13,477 14,478 130,115
Basilicata 34,175 9,753 7 1,092 17,834 160 3,286 1,747 367 991 993 5,522 102,070
Marche 17,245 3,689 95 3,629 23,750 1,801 4,119 405 192 0 5,325 2,562 87,341
Campania 6,401 1,125 30 352 8,796 358 3,062 2,023 7,699 123 1,505 7,156 52,649
Piedmont 11,170 456 78 2,041 5,101 270 1,499 2,437 2,855 15 3,331 111 46,580
Lombardy 19,127 384 39 2,713 9,044 291 2,391 548 79 0 3,680 314 45,176
Umbria 6,001 655 28 1,574 7,630 182 1,343 207 499 0 915 5,469 43,540
Abruzzo 4,062 380 192 307 8,139 393 1,163 199 110 2 3,955 3,183 38,758
Veneto 6,358 28 94 3,300 4,598 74 1,236 2,487 154 0 4,728 305 27,979
Friuli Venezia Giulia 1,565 18 11 904 2,530 712 391 308 44 0 1,127 46 15,418
Molise 2,533 555 2 678 2,883 68 694 236 101 0 440 893 10,735
A.P. Bolzano 79 0 66 14 138 1 52 2,202 19 0 441 4 9,209
A.P. Trento 43 0 3 31 77 14 94 596 32 0 921 68 4,869
Liguria 32 0 4 106 90 31 56 41 75 1 41 263 4,309
Aosta Valley 6 0 2 1 734 22 5 7 2 0 28 0 3,178
*Dried pulses and protein crops for grain production
**Fresh vegetables, melons, strawberries, cultivated mushrooms
***Fruit includes “fruit of temperate climate zones”, “fruit of sub-tropical climate zones”, “berries (soft fruit)

AREAS, OPERATORS AND CROPS
15
Table 5 OPERATORS CHANGE BY CATEGORY COMPARISON 2017 – 2016
2016 2017 2017 – 2016 (% change)
Exclusive producers 55,567 57,370 3.2
Exclusive processors* 7,581 8,689 14.6
Producers/ Processors 8,643 9,403 8.8
Importers** 363 411 13.2
Operators total 72,154 75,873 5.2
* ‘processors’ include operators who carry out preserving and processing activities **’Importers’ include importers who also carry out production and preserving/ processing activities (Source: SIB)
Table 6 NUMBER OF OPERATORS BY TYPE AND REGION % CHANGE 2017 – 2016
Exclusive producers
Producers / Processors
Exclusive processors
Importers* Total as at 31 december
2016
Total as at 31 december
2017
2017 – 2016 (% change)
Italy 57,370 9,403 8,689 411 72,154 75,873 5.2
Sicily 9,385 1,327 896 18 11,451 11,626 1.5
Calabria 9,812 1,040 310 5 11,330 11,167 -1.4
Apulia** 7,331 1,199 839 9 10,029 9,378 -6.5
Tuscany** 2,962 1,478 671 30 5,004 5,141 2.7
Emilia-Romagna** 3,361 553 954 72 4,571 4,940 8.1
Latium 3,690 492 468 14 4,118 4,664 13.3
Campania 3,386 340 467 22 3,719 4,215 13.3
Veneto** 2,045 471 985 55 2,715 3,556 31.0
Marche** 2,494 286 264 7 2,638 3,051 15.7
Piedmont** 1,812 503 536 55 2,803 2,906 3.7
Lombardy** 1,258 443 881 79 2,235 2,661 19.1
Basilicata 2,038 107 90 - 2,254 2,235 -0.8
Sardinia 1,852 131 112 - 2,230 2,095 -6.1
Umbria** 1,333 307 176 8 1,217 1,824 49.9
Abruzzo 1,324 225 246 4 1,788 1,799 0.6
A.P. Bolzano 1,010 164 279 11 1,280 1,464 14.4
A.P. Trento 968 113 137 2 929 1,220 31.3
Friuli Venezia Giulia 632 102 149 7 854 890 4.2
Molise 375 33 66 - 452 474 4.9
Liguria 231 75 151 13 444 470 5.9
Aosta Valley 71 14 12 - 93 97 4.3
*“Importers” include importers who also carry out production and preserving/processing activities (Source: SIB) **Data are provided by the Regional Authorities

FACTS AND FIGURES ON ORGANIC FARMING IN ITALY 2018
16
Chart 2 CHANGE IN OPERATORS’ NUMBER BY REGION COMPARISON 2017 – 2016
2016
2017
0
2
4
6
8
10
12
Number ofoperators
(thousand)
Sicily Calabria Emilia- Romagna
Tuscany Marche Piedmont Umbria Veneto Molise A.P.Trento
Aosta ValleyApulia Latium
SardiniaBasilicata Campania Lombardy Abruzzo Friuli
Venezia Giulia
A.P.Bolzano Liguria
Chart 3 HISTORICAL TREND OF OPERATORS AND SURFACE AREAS IN ITALY FROM 1990 TO 2017 (ABSOLUTE VALUES)
Organic Operators
Utilised Agricultural Area
Number ofoperators
(thousand)
0
10
20
30
40
50
60
70
80
0
500
1,000
1,500
2,000
2,500
1990 ‘91 ‘92 ‘93 ‘94 ‘95 ‘96 ‘97 ‘98 ‘99 2000 ‘01 ‘02 ‘03 ‘04 ‘05 ‘06 ‘07 ‘08 ‘09 ‘10 ‘11 ‘12 ‘13 ‘14 ‘15 ‘16 ‘17
Hectares(thousand)

AREAS, OPERATORS AND CROPS
17
Table 7 PERCENTAGE INCIDENCE OF ORGANIC AGRICULTURAL HOLDINGS AND ORGANIC AREAS AT 31 DECEMBER 2017 ON TOTAL FARMS AND CULTIVATED AREAS BY GEOGRAPHICAL REGION (ISTAT FSS 2013)
% Organic area % Organic agricultural holdingsas
Italy 15.4 4.5
North 6.6 3.9
North-West 5.0 3.4
Piedmont 4.9 3.9
Aosta Valley 6.0 3.0
Liguria 10.3 1.9
Lombardy 4.9 3.5
North-East 7.9 4.1
A.P. Bolzano 4.0 6.1
A.P. Trento 3.6 7.0
Veneto 3.4 2.3
Friuli Venezia Giulia 7.2 3.6
Emilia-Romagna 13.0 6.1
Centre 19.4 5.8
Tuscany 18.4 6.7
Umbria 14.2 4.8
Marche 19.5 6.8
Latium 23.3 5.1
South 19.1 4.3
Abruzzo 8.8 2.5
Molise 6.1 1.9
Campania 9.7 3.2
Apulia 20.2 3.3
Basilicata 20.6 4.6
Calabria 37.4 8.4
Islands 22.2 5.0
Sicily 31.1 5.3
Sardinia 11.6 3.8
FACTS AND FIGURES ON ORGANIC FARMING IN ITALY 2018
18
Chart 4 AVERAGE FARM SIZE BY GEOGRAPHICAL AREA (IN HECTARES) ISTAT FSS 2013 FOR NATIONAL DATA SINAB 2017 FOR ORGANIC DATA
Italy North-East North-West South Center Islands
Hectares
0
10
20
30
40
50
8.4
28.6
20.422.5
24.2
30.6
44.1
10.5
15.5
5.4
9.2 9.8
National
Organic
Table 8 ANIMAL HUSBANDRY NUMBER OF LIVE ANIMALS AS AT 31 DECEMBER
2015 2016 2017 2017 – 2016 (% change)
Bovine animals 266,576 331,431 336,278 1.5
Porcine animals 49,909 56,567 61,242 8.3
Ovine animals 785,170 776,454 736,502 -5.1
Caprine animals 100,852 113,983 115,590 1.4
Poultry 4,126,584 4,636,012 3,027,154 -34.7
Equine animals 14,349 15,691 15,293 -2.5
Bees (No of apiaries) 195,341 170,343 171,094 0.4

AREAS, OPERATORS AND CROPS
19
Table 9 ORGANIC AQUACULTURE FARMS YEARS 2016 AND 2017
2016 2017
Italy 40 40
Veneto 15 15
Emilia-Romagna 15 11
Apulia 3 2
Friuli Venezia Giulia 1 2
Lombardy 1 2
Sardinia 1 1
Calabria 1 1
Trentino Alto Adige 1 1
Umbria 1 1
Campania 0 1
Latium 0 1
Marche 0 1
Piedmont 1 0
Source: SIB


MARKET AND CONSUMPTION FIGURES ON ORGANIC FARMING
Data
ISMEA Istituto di Servizi per il Mercato Agricolo Alimentare
Source
ISMEA DB and Nielsen DB
Data processed by
ISMEA Istituto di Servizi per il Mercato Agricolo Alimentare Riccardo Meo
Antonella Giuliano

22 FACTS AND FIGURES ON ORGANIC FARMING IN ITALY 2018
Organics in the food department
The annual report on consumption of organic
products does not reveal unexpected findings
for 2018: the sector has consolidated its weight
in the Italian consumer agri-food spend.
Sales of organic products continue to grow all
over the country with a +4% increase compared
to last year. ISMEA estimates, which do not in-
clude monitoring of Ho.Re.Ca channels, public
canteens and the export value, confirm that the
organic market is nearing EUR 2.5 billion, with a
turnover increase for the surveyed segments of
about EUR 100 million compared to 2017.
The incidence of certified products in the Italian
consumer shopping basket, amounting to 3%,
is also the same.
The main categories of organic spend
Compared to 2017, the distribution of sales by
purchase category remains unchanged.
Fruit and vegetables are the agri-food segment
where spending is highest. Cereal products fol-
low, with organic pasta driving the sector, and
then breakfast cereals and organic cookies.
The purchase share of milk, yoghurt, cheese
and other milk products is stable at 13%.
Excellent results are reported for the consump-
tion of eggs, a category that in the organic
shopping basket weighs more than 5% com-
pared to 1% totaled by the conventional agri-
food produce.
Chart 1 DISTRIBUTION OF CONSUMPTION OF ORGANIC PRODUCTS BROKEN DOWN IN MAIN CATEGORIES %
13.0
16.0
19.4 25.7
4.1
2.13.3
11.4
5.1
Milk products
Cereal products
Vegetables
Fruit
Other sectors*
Vegetable oils and fats
Non-Alcoholic beverages
Other food products
Fresh eggs
* Other segments include: Meat, Fish, Honey, Charcuterie, Beer, Wines and Sparkling Wines and Other Alcoholic Beverages Source: ISMEA- Nielsen based on mixed methods surveys (RMS-CPS)

MARKET AND CONSUMPTION
23
The same holds true for honey, while the inci-
dence of organic wine is still low (1.3%) al-
though, in terms of turnover, annual growth
exceeded 40%.
The wine industry dynamics are complex and
"non-organic" consumption also includes types
of commodities (e.g. bulk wine and wine in car-
tons) which are not currently available in the or-
ganic sector.
On the other hand, organic certification still
struggles to gain ground in the meat sector,
where products sold loose over the counter
are hardly monitored by the consumption sur-
vey system, and supply shortage and inad-
equate product promotion are known to
persist.
A distinction should be made for organic poul-
try meat, a sector that is being better organized
along the supply chain, distributing fairly the
greater added value of the certified product to
all actors involved and effectively promoting the
packaged product in Italy and abroad
The agri-food industry's performance for 2018
(+1.5%) is a counterbalance to ISTAT's prelim-
inary estimates that point to a recession in the
Country. In this context, the organic sector is
doing even better. In addition to the final figure
of +4%, the individual categories, compared
to their conventional counterparts (Chart 2),
show positive growth trends (except for the
slight drop in vegetables caused by a supply
shortage due to the unfavourable crop season
in 2018).
Chart 2 ORGANIC AND NON-ORGANIC PRODUCT CONSUMPTION ITALY % CHANGE IN 2018/2017
-10 -5 0
%
5 10 15 20
Cerealproducts
Milk and milkproducts
Fresh eggs
Vegetables
Agrifood
Organic
Fruit
Vegetable oilsand fats
Other foodproducts
-0.34.9
-0.91.5
-1.2
-0.2
-7.6
-0.5
2.7
1.4
1.7
6.1
14.0
17.4
Source: ISMEA-Nielsen based on mixed methods surveys (RMS-CPS)

24 FACTS AND FIGURES ON ORGANIC FARMING IN ITALY 2018
Organic distribution channels
When breaking down consumption distribution
into various sales channels, large-scale retailing
proves to be the main outlet for organic products.
Chart 3 DISTRIBUTION OF ORGANIC PRODUCT SALES BY TYPES OF SALES CHANNELS AND CATEGORY ITALY 2018
Total Organic
Fruit
Vegetables
Cerealproducts
Milk and milk products
Other food products
Fresh eggs
Non-alcoholicbeverages
Vegetable oilsand fats
Modern distribution
0.8
2.9
2.1
3.3
0 20 40 60 80 10010 30 50 70 90
Discount stores No supermarkets, Hypermarkets, Self-service stores, Discount stores
44.0
87.0
73.4
88.7
81.1
48.7
83.6
38.7
60.2 33.7
51.2
59.2
5.1
48.0
13.8
7.3
6.1
4.8
11.3
5.0
10.5
19.3
10.0
Source: ISMEA- Nielsen based on mixed methods surveys (RMS-CPS)
In 2018, sales in large-scale retail trade exceeded
60% of total turnover (in 2017, the incidence of
modern distribution was 58.5%), but also pur-
chases from discount stores grew, although
these stores remain the least representative dis-
tribution channel, mainly due to their limited array
of products and brands. Specialized stores and,
more generally, all the other distribution channels
that are not part of the retail sector lose market
share (-3.2%) and turnover (-5%).
A trend towards purchasing behaviour that
favours shopping time-saving and conveni-
ence offered by the large-scale retail trade
over the specialised retail trade is therefore
expected, despite the latter's wider range
and assortment.
The downturn can be seen in all product cat-
egories, even if the specialised stores main-
tain their leadership in fresh products, for
which the consumer has greater expectations
and is more demanding in terms of quality as-
surance.

MARKET AND CONSUMPTION
25
Chart 4 DISTRIBUTION OF ORGANIC SALES IN LARGE-SCALE RETAIL TRADE BY GEOGRAPHICAL AREAS (%) ITALY 2018
11.7
25.0
35.8
27.5South+Sicily
Central Italy+Sardinia
North-West
North-East
Source: ISMEA-Nielsen Panel on Retail
A snapshot of the Italian market
The Italian consumption distribution has not
fluctuated in 2018. Chart 4 shows the same sales
proportions as in the previous two years.
In fact, despite the efforts made with the rural
development promotion tools and through sev-
eral communication campaigns, organic con-
sumption remains concentrated in the North of
the country.
More specifically, the North-West regions,
driven by Lombardy, take the lion's share with
over 35% of sales in large-scale retailing.
The other northern regions, those in Central
Italy and in the South follow far behind, with a
market share of around 10% (11.7% for
Abruzzo, Basilicata, Calabria, Campania, Mo-
lise, Apulia and Sicily in 2018). Organic con-
sumption stagnation in the South is caused by
a number of negative factors, mainly the low
consumer purchasing power and the offer that
is often unstructured and inadequate for mod-
ern distribution.

26 FACTS AND FIGURES ON ORGANIC FARMING IN ITALY 2018
Chart 5 DISTRIBUTION OF ORGANIC PRODUCT SALES IN LARGE-SCALE RETAIL TRADE BY GEOGRAPHICAL AREAS AND COMPARISON WITH “NON-ORGANIC” AGRI-FOODSTUFFS ITALY 2018
%
0
10
20
30
40
50
60
70
80
90
100 Area 1Liguria, Lombardy, Piedmont, Aosta Valley
Area 2Emilia-Romagna, Friuli Venezia Giulia, Trentino Alto Adige, Veneto
Area 3Lazio, Marche, Sardinia, Tuscany, Umbria
Area 4Abruzzo, Basilicata, Calabria, Campania, Molise, Apulia, Sicily
Organic Share % in large scale retail 2018
Non organic Share % in large scale retail 2018
11.7
25.0
35.8
27.5
21.1
24.5
33.1
21.3
Source: ISMEA-Nielsen Panel on Retail
Chart 6 ORGANIC CONSUMPTION IN LARGE-SCALE RETAIL VALUE AND COMPARISON WITH THE AGRI-FOOD SECTOR ITALY ANNUAL % CHANGE IN 2018
Variation%
0.2
-4.1
9.2 8.5
5.26.7
11.7
8.87.3
6.9
11
20 19.5
16.5
9
0.31.5
4.4
0.6 1 0.6
-3.1-1.1
0.3
3.2
1.5
-0.6
4.4
-102003 2004 2005 2006 2007 2008 2009 2010 2011 2012 2013 2014 2015 2016 2017 2018
-5
0
5
10
15
20
25
-1 1.21.4
1.4
Tot. Agri-food
Organic
Source: ISMEA-Nielsen-GFK Eurisko Panel on Retail

MARKET AND CONSUMPTION
27
Chart 7 INCIDENCE OF THE MAIN ORGANIC SEGMENTS IN THE TOTAL AGRI-FOOD SECTOR (%) ITALY 2018
Beer
% Organic / Agri-food
Wines andsparkling wines
Alcoholicbeverages
Non-alcoholicbeverages
Honey
Other foodproducts
Vegetable oilsand fats
Fruit
Vegetables
Eggs
Fish and seafoodproducts
Milk and milkproducts
Charcuterie
Meats
Cereal products
0.1
0.0
0.2
0.2
0.2
0 2 4 6 8 10 12 14 16
1.1
4.1
2.5
3.3
8.5
5.7
2.8
3.4
13.8
14.7
Source: ISMEA-Nielsen Panel on Retail
Incidence of organics in the Italians’ spend
As mentioned above, in 2018 organic expendi-
ture value accounts for 3% of the total agri-food
sector; however, such estimates require distin-
guishing among different products in a very di-
verse landscape.
Whereas, for example, out of EUR 100 spent
on eggs almost 15 end up in the organic
chain, a few cents go to "certified" organic
spending on fresh and processed meat, fish
and beer.

28 FACTS AND FIGURES ON ORGANIC FARMING IN ITALY 2018
Chart 8 CONFIDENCE CLIMATE INDEX ITALY 2018*
Organic Agriculture
Δ
Agriculture
2014 2015 2016 2017 2018
T1 T2 T3 T4T1 T2 T3 T4T1 T2 T3 T4T1 T2 T3 T4T2 T3 T4-15
-10
-5
0
5
10
15
20
-2.7
6.37.9
10.59.3
7.2
7
12.9
3.9
-2.1-2.8
-0.8
1.42.4
5.1
1.5 2.3 2.5
-5.2-6.4
-9.1
-5.3
-2.6
-4.9
0 0
-9.2
-6.1
-3.3
-7.7
-4.3
-1.50.3
1.7 1.50.4
-5.5
0.6
*data reported in the charts are the balance between answer percentage shares (Positive answer share - Negative answer share) Source: ISMEA Panel on Agricultural holdings
Organic holdings and confidence climate
Consumer Confidence Index (Chart 8), calculated
by ISMEA, is based on the answers given by a
sample of 800 agricultural holdings to two
questions: the first concerning the business
performance and the second on the economic
expectations for the years ahead. The index is
included in a scale ranging from -100 to +100;
the highest value is reached when all respon-
dents express a positive opinion on their busi-
ness situation and future prospects.
Overall, the last figures of 2018 show the preva-
lence of moderate confidence (positive index)
in agriculture, which is somewhat greater for or-
ganic farming.
However, the gap between the answers given
by conventional and organic entrepreneurs is
narrowing from 2016 onwards. In particular,
they are all concerned by the evaluation of cur-
rent business, one of the two basic variables
used in the calculation of the confidence index.

MARKET AND CONSUMPTION
29
Chart 9 CONFIDENCE CLIMATE INDEX COMPONENTS: HOLDING'S CURRENT BUSINESS PERFORMANCE ITALY 2018
2014 2015 2016 2017 2018T1 T2 T3 T4T1 T2 T3 T4T1 T2 T3 T4T1 T2 T3 T4T2 T3 T4-25
-20
-15
-10
-5
0
5
-13.2
-5.4 -5
-12.4-12.2
-2.3
-9.6
-17.2
-10.6
-4.6
-8.9-10.7
-8
-11.5
-2.4
0.3
-3.2
1
-2,9
-13.5
-19.3
-16.5-13.6
-10.1-13.6
-8.5
-16.8-14.9 -15.3
-8.5
-11.7 -15.7
-15.2
-10.4 -7 -10.6
-6.4
-8.3
Organic Agriculture
Agriculture
Chart 10 CONFIDENCE CLIMATE INDEX COMPONENTS: EXPECTATIONS FOR FUTURE PERFORMANCE ITALY 2018
2014 2015 2016 2017 2018T1 T2 T3 T4T1 T2 T3 T4T1 T2 T3 T4T1 T2 T3 T4T2 T3 T4-5
0
5
10
15
20
25
30
9.2
19.422.5
25.1
19.118.7
26.2
11.29.6
7.7
17.2
8.8
8.6
16.217.3
15.7 15.3 15 14.3
1.42.4
7.69.8
4.6
10.5
4.15
9.36
1
8 8.2 8.5
12.510.4
12.311.2
-0.9
Organic Agriculture
Agriculture
Source: ISMEA Panel on Agricultural holdings
Source: ISMEA Panel on Agricultural holdings
In the past, organic entrepreneurs generally re-
ported less concern about their business per-
formance. In the fourth quarter of 2015, the
number of organic holdings that were satisfied
with their economic achievements even ex-
ceeded the number of those lacking confi-
dence. In contrast, from 2016 onwards, the
number of entrepreneurs getting discouraged
prevailed also in the organic sector and the dif-
ference in the assessment of "business solidity"
between organic and "traditional" holdings was
lowered to zero.
Despite the prevailing feeling of generalized dis-
content, the line that tracks farmers' future ex-
pectations remains positive and shows that
organic farming is a sector where they continue
to place confidence and invest more compared
to the traditional agricultural sector, that is,
however, on the rise.

30 FACTS AND FIGURES ON ORGANIC FARMING IN ITALY 2018
Organic product price trends
The selling price of organic products is one of
the main reasons that lead farmers to convert.
It is well-known that this price differential per-
sists through the whole processing and dis-
tribution chain until the sale to the final
consumer.
Here, we aim to explore whether the price gap
observed for the producer prices is comparable
with that of consumer prices or whether the
margins of the various players in the chain are
different.
Furthermore, the focus is on the quantification
of the price difference against conventional
agriculture.
This work is not meant to depict in detail a
complex, sectoral, territorial and rather volatile
market, but it can pave the way for further in-
vestigation, focusing on the possible strategies
to strengthen the supply chains.
Six agri-food products and their average prices
recorded by the ISMEA survey network and
collected by Nielsen databases in January
2017 and 2018 were used as examples.
The products were selected in order to keep
the historical series unchanged compared to
the previous editions of Bio in Cifre.
Producer price
As one might expect, the producer price of the
surveyed organic products is 34% higher than
that of the same produce which is not certified.
However, the average difference is important
and does in no way allow to make an assess-
ment without considering each single sector.
While, for example, organic citrus fruit was sold
at a price 10% higher than the non-organic
product, tomatoes were awarded a price that
was more than twice as high as the non certi-
fied produce.
The comparison with the prices collected in the
same period of the previous year shows, once
again, how the market dynamics and the grow-
ing season are reflected both in the conven-
tional and in the organic sector, although with
a different incidence.
In fact, in 2018, the producer price for both or-
ganic and non-organic lemons and kiwis rose
while the price of extra virgin olive oil and tom-
atoes dropped.

MARKET AND CONSUMPTION
31
Chart 11 PRODUCER PRICE DYNAMICS OF SOME ORGANIC PRODUCTS AND THEIR CONVENTIONAL COUNTERPARTS % CHANGE, 2018/2017
-60
-40
-20
0
20
40
60
80
Oranges
%
Lemons Kiwi Extra-virgin olive oil Red cluster tomatoesPotatoes
Conventional
-3
20
9
-26
-51
-2
Organic
3 14
68
-20 -23
0
Source: ISMEA Price Survey Network
Consumer prices
The prices of the surveyed organic products
that we find on the shelves are on average 56%
higher than their non-organic counterparts.
This shows how the price premium granted to the
farmer persists and rises along the supply chain.
Something that certainly does not reward the
weakest links in the chain, namely the farmer
and the consumer. Over the last years, farmers
have suffered from a lower price received for
their organic produce at the farm-gate resulting
from greater supply and domination by large re-
tailers, with their contract activities and pricing
power; on the other hand, consumers who
tend to prefer organic products, don’t buy them
easily because they are expensive. This state-
ment cannot be generalized, but it is clear that
it would be necessary to recognize a higher
price to the producer, who, more than any
other player in the supply chain, bears the
burden of producing with organic methods.

32 FACTS AND FIGURES ON ORGANIC FARMING IN ITALY 2018
Chart 12 CONSUMER PRICE DYNAMICS OF SOME ORGANIC PRODUCTS AND OF THEIR CONVENTIONAL COUNTERPARTS ITALY - JANUARY 2018
Oranges
€/Kg Δ organic/conventional price
Lemons Kiwi Extra-virgin olive oil Red cluster tomatoesPotatoes
Conventional (€/kg)
Organic/Conventional
Organic (€/kg)
0
1
2
3
4
5
6
7
8
9
10
0%
10%
20%
30%
40%
50%
60%
70%
80%
90%
100%
56%
46%
40%
69%
90%
36%
1.8
3.2
1.7
8.6
4.5
5.6
1.2
2.2
3.2
0.9
4.2
5.1
Source: Compiled by ISMEA based on data provided by Nielsen
Table 1 PRODUCER AND CONSUMER PRICE OF THE SURVEY PRODUCTS ITALY 2018
2018 (€/kg) Organic Conventional
Farm-gate Final consumption
Farm-gate Final consumption
Oranges Var. Tarocco Marketplace: Catania
0.4 1.8 0.3 1.2
Lemons Var. Primofiore Marketplace: Catania
0.5 3.2 0.4 2.2
Kiwi Marketplace: Forlì
1.6 4.5 1.4 3.2
EVO Marketplace: Bari
5.0 8.6 4.2 5.1
Common potatoes Marketplace: Ferrara
0.6 1.7 0.5 0.9
Red tomatoes Marketplace: Ragusa
1.7 5.6 0.7 4.2
Source: Compiled by ISMEA based on data provided by Nielsen and ISMEA Price Survey Network

IMPORTS FROM THIRD COUNTRIES FIGURES ON ORGANIC FARMING
This section is the result of the collaborative effort of a working group on import/export of or-
ganic products, in the framework of DIMECOBIO III project, and including Giacomo Mocciaro
(MiPAAFT), Patrizia Pugliese and Luca Romanini (CIHEAM Bari), Raffaele Zanoli (UNIVPM), as
well as the three aforementioned authors.
Data
MiPAAFT Ministry of Agriculture, Food, Forestry Policies and Tourism
Source
MiPAAFT Ministry of Agriculture, Food, Forestry Policies and Tourism
Data processed by
SINAB National Information System on Organic Farming in collaboration with
UNIVPM Università Politecnica delle Marche Marie Reine Bteich
Fabiana Crescenzi
Francesco Solfanelli

34 FACTS AND FIGURES ON ORGANIC FARMING IN ITALY 2018
Import of organic products from third countries
is regulated by Regulation (EC) No 834/07,
Regulation (EC) No 889/08 and Regulation (EC)
No 1235/08. These regulations stipulate that
import of organic products from third countries
can take place in two different ways:
a Imports from third countries recognised by
the EU Commission as having production
standards and control measures equival-
ent to the rules in force in the European
Union. Recognised third countries are
listed in Annex III to Regulation (EC) No
1235/2008, and subsequent amendments
and additions.
b Imports by operators from third countries
adopting a production method which is
deemed to be equivalent by Control Bodies
authorised by the EU Commission to oper-
ate in certain countries and for certain prod-
uct categories. The list of control bodies
recognized for the purpose of equivalence
in the various countries is reported in Annex
IV to Regulation (EC) No 1235/2008, and
subsequent amendments and additions.
The data presented in this publication consider
both imports under the equivalence system de-
scribed in point a) and imports under the equiv-
alence system described in point b). Moreover,
it should be specified that data compilation
does not take into account intra-Community
trade activities and, consequently, not all
amounts of organic products entering Italy from
third countries via other Community countries
are included. The following tables have been
prepared by the SINAB on the basis of the data
collected from the written notification that im-
porters are requested to send to MiPAAFT at
the end of each year (Ministerial Decree No
700/2011 Annex 1 and Annex 2; Ministerial De-
cree No 18378/2012 Annex 1 and Annex 2).
As of 31 december 2017, there were 411 com-
panies on the national list of importers of or-
ganic products from third countries. Data
relating to the volumes of products declared by
these companies themselves have been clas-
sified according to the TARIC customs tariffs
(Integrated Tariff of the European Communities),
as reported by the operators in their written no-
tification. TARIC1 is based on the Combined
Nomenclature (CN), whose subheadings (ident-
ified by an 8 digit code number) represent the
basic nomenclature for the Common Customs
Tariff as well as for the statistics relating to the
external trade of the Community and to trade
between Member States.
Import of organic products from third countries – Data analysis - 31 december 2017
Data on imports of organic products from third
countries indicate a limited increase in total vol-
umes in 2017, amounting to approximately
16.80% compared to 2016. This positive trend
was mainly driven by the fruit category, which
grew by 54.28% compared to 2016. Other pro-
duce categories that had substantial positive
variations compared to 2016 were vegetables
(+29.57%), coffee/cocoa/sugars (+79.56%) and
processed products (+104.62%). By contrast,
the group of edible oils, shows a slight decrease
in imported volumes, with a decrease of 6.55%
compared to 2016. Overall, the volumes of cer-
eals and industrial crops imported from third
countries remain almost unchanged: +2.65%
and -1.73% respectively, compared to 2016.
As far as supply markets are concerned, the
year 2017 featured a high prevalence of
supplies from Asia (30.43% in volume) and
non-EU European countries (28.42% in vol-
ume), up 8.34% and 2.60% respectively com-
pared to 2016. However, the situation in these
countries is very diverse, with China playing a
1See Article 3 of Regulation (EEC) No 2658/87

IMPORTS FROM THIRD COUNTRIES
35
particularly significant role in the import of in-
dustrial crops (soya beans and soybean meal)
and Pakistan in the import of rice. However, it
should be noted that imports of soya beans
and soybean meal from China decreased totally
by 33.22% compared to 2016. Among the
non-EU European countries, Turkey is charac-
terized by the import of cereals (durum wheat
and rice) and industrial crops (mainly sunflower
and rape).
Latin America continues to be a very important
geographical area for Italian organic imports:
overall, in 2017 20.32% of total volumes were
imported from this geographical area. From
Latin American countries imports mostly in-
clude fresh fruit (especially bananas, apples
and pears), cane sugar and coffee. Compared
to 2016, it is worth noting that banana imports
from South America have increased signifi-
cantly (+115.11% from Ecuador), while those
from Central America have decreased
(-50.04% from the Dominican Republic).
As regards the African countries (Egypt and
Tunisia above all), from which mainly processed
products and vegetables are imported, a slight
overall increase in imports was recorded (+4.81
compared to 2016). More specifically, in the
"processed products" category, there was a
moderate reduction in imports of olive oil from
Tunisia (-4.72 compared to the previous year).
On the other hand, the volumes of vegetables
imported from the African continent grew con-
siderably. This increase was mainly determined
by potatoes and onions from Egypt (+314.06%
compared to 2016).
Imports from North America are on the increase
(+58.12% compared to 2016) and mainly con-
cern agave syrup from Mexico (imports of this
product from Mexico account for 34.46% by
volume in the sugar segment). Other North
American supplier countries are Canada and
the USA, which remain two important sources
of supply of durum wheat and beans respect-
ively, for our country.

36 FACTS AND FIGURES ON ORGANIC FARMING IN ITALY 2018
Table 1 ORGANIC IMPORT VOLUMES BY PRODUCT CATEGORY AND GEOGRAPHICAL AREA ITALY 2016 - 2017 (VALUE IN TONNES)
Product Area of origin Volumes (t) 2016 Volumes (t) 2017 ‘17-‘16
Cereals Africa 0,00 0,00 -
Asia 13.492,19 22.850,03 69,36
Central America 0,00 0,00 -
Non-Eu Europe 28.076,68 19.185,04 -31,67
North America 3.130,16 3.276,40 4,67
Oceania 52,76 0,00 -100,00
South America 2.000,44 2.681,34 34,04
Total 46.752,23 47.992,81 2,65
Fresh and dried fruits Africa 684,03 358,69 -47,56
Asia 385,77 989,00 156,37
Central America 8.172,36 4.730,29 -42,12
Non-Eu Europe 2.981,25 4.186,60 40,43
North America 90,36 47,02 -47,97
Oceania 219,11 310,42 41,67
South America 10.513,32 24.934,76 137,17
Total 23.046,20 35.556,78 54,28
Vegetables and legumes Africa 805,53 2.883,94 258,02
Asia 8.132,86 5.687,12 -30,07
Central America 0,00 0,00 -
Non-Eu Europe 1.447,24 4.103,40 183,53
North America 388,21 429,13 10,54
Oceania 0,00 0,00 -
South America 216,97 1.137,10 424,08
Total 10.990,81 14.240,70 29,57
Industrial crops* Africa 6.230,23 6.065,55 -2,64
Asia 32.885,86 29.945,50 -8,94
Central America 0,00 0,00 -
Non-Eu Europe 22.596,04 24.333,35 7,69
North America 0,00 75,25 -
Oceania 0,00 0,00 -
South America 379,57 595,01 56,76
Total 62.091,71 61.014,66 -1,73

IMPORTS FROM THIRD COUNTRIES
37
Table 1 ORGANIC IMPORT VOLUMES BY PRODUCT CATEGORY AND GEOGRAPHICAL AREA ITALY 2016 - 2017 (VALUE IN TONNES)
Product Area of origin Volumes (t) 2016 Volumes (t) 2017 % Var ‘17-‘16
Vegetable oils and fats Africa 17.800,66 16.891,16 -5,11
Asia 28,59 74,79 161,58
Central America 0,00 0,00 -
Non-Eu Europe 316,55 20,38 -93,56
North America 79,36 60,25 -24,08
Oceania 0,00 0,00 -
South America 86,60 65,53 -24,34
Total 18.311,76 17.112,11 -6,55
Coffee, Cocoa, Sugars, Tea and Spices
Africa 161,50 331,52 105,27
Asia 1.574,77 1.430,24 -9,18
Central America 733,79 2.158,71 194,19
Non-Eu Europe 198,50 214,35 7,98
North America 1.480,92 4.274,53 188,64
Oceania 0,00 0,01 -
South America 7.036,42 11.675,69 65,93
Total 11.185,91 20.085,06 79,56
Processed products Africa 718,20 1.139,18 58,62
Asia 2.038,85 2.442,61 19,80
Central America 18,40 3,15 -82,88
Non-Eu Europe 2.115,00 7.189,41 239,92
North America 224,92 366,30 62,86
Oceania 0,46 0,51 10,64
South America 952,21 1.275,56 33,96
Total 6.068,04 12.416,71 104,62
Total 178.446,66 208.418,83 16,80
*This category also includes soybean meal

38 FACTS AND FIGURES ON ORGANIC FARMING IN ITALY 2018
Chart 1 ORGANIC IMPORTS BY PRODUCT CATEGORY ITALY 2016 - 2017 (VALUE IN TONNES)
Cereals Fresh and dried Fruit
Vegetables and legumes
Industrial crops
Vegetable oils and fats
Coffee, Cocoa, Sugars, Tea and Spices
Processed products
0
10,000
20,000
30,000
40,000
50,000
60,000
70,000 2016
2017
Chart 2 ORGANIC IMPORTS GEOGRAPHICAL AREA ITALY 2016 - 2017 (VALUE IN TONNES)
Asia Non-EU Europe South America Africa North America Central America Oceania0
10,000
20,000
30,000
40,000
50,000
60,000
70,000
2017
2016

IMPORTS FROM THIRD COUNTRIES
39
Chart 3 CEREAL IMPORTS ITALY 2016 - 2017 (VALUE IN TONNES)
CEREALS
Durum wheat Rice Common wheat Quinoa Maize Other Cereals0
5,000
10,000
15,000
20,000
25,000 2016
2017
Table 2 CEREAL IMPORTS: MAIN COUNTRIES OF ORIGIN ITALY 2017 (VALUE IN TONNES)
Continent Country Durum wheat
Rice Common wheat
Quinoa Maize Other Cereals
Total country
North America Canada 624.90 - 2,631.00 - - - 3,255.90
Mexico - - - - - 10.50 10.50
USA - 10.00 - - - - 10.00
South America Argentina - 443.45 - - - - 443.45
Bolivia - - - 186.22 - - 186.22
Brazil - 763.36 - - - - 763.36
Peru - - - 1,080.80 - 10.57 1,091.37
Uruguay - 196.94 - - - - 196.94
Asia Cambodia - 1,684.00 - - - - 1,684.00
China - - - - - 287.13 287.13
India - 5,150.01 - - - 8.00 5,158.01
Indonesia - 13.00 - - - - 13.00
Pakistan - 8,039.49 - - - - 8,039.49
Philippines - 5.55 - - - - 5.55
Russia - - 2,193.00 - 2,807.63 - 5,000.63
Thailand - 2,662.22 - - - - 2,662.22
Non-EU Europe Rep.of Moldova - - - - 2,498.56 176.04 2,674.60
Serbia - - 70.04 - - - 70.04
Switzerland - 78.00 - - - - 78.00
Turkey 6,016.98 2,840.00 - - - 36.00 8,892.98
Ukraine - - 20.11 - 7,449.31 - 7,469.42
Total 6,641.88 21,886.02 4,914.15 1,267.02 12,755.50 528.23 47,992.80

40 FACTS AND FIGURES ON ORGANIC FARMING IN ITALY 2018
Chart 4 IIMPORTS OF FRESH AND DRIED FRUIT ITALY 2016 - 2017 (VALUE IN TONNES)
FRESH AND DRIED FRUIT
Bananas Nuts Dates, figs, pineapples
Apples and pears
Grapes Frozen fruit Other fresh fruit
0
5,000
10,000
15,000
20,000
25,000
30,000 2016
2017

IMPORTS FROM THIRD COUNTRIES
41
Table 3 IMPORTS OF FRESH AND DRIED FRUIT; MAIN COUNTRIES OF ORIGIN ITALY 2017 (VALUE IN TONNES)
Continent Country Bananas Nuts Dates, Figs, Pineapples
Grapes Apples and pears
Frozen fruit
Other fresh fruit
Total country
Africa Burkina Faso - - - - - 18.00 - 18.00
Egypt - - 3.20 - - - - 3.20
Ghana - 1.01 0.50 - - - - 1.51
Ivory Coast - 83.38 - - - - - 83.38
Togo - - 3.40 - - - - 3.40
Tunisia - - 249.20 - - - - 249.20
Central America
Costa Rica 262.32 - 683.98 - - - - 946.30
Domenican Rep. 3,783.99 - - - - - - 3,783.99
North America
Canada - - - - - 27.04 - 27.04
USA - 19.98 - - - - - 19.98
South America
Argentina - 91.77 - - 892.92 - 23.76 1,008.45
Bolivia - 73.82 - - - - - 73.82
Brazil - 95.46 - - - - - 95.46
Chile - 148.41 - - 96.28 0.89 1,322.88 1,568.46
Colombia 1,194.66 0.60 1.20 - - 0.48 0.06 1,197.00
Ecuador 15,447.44 0.06 - - - - - 15,447.50
Peru 5,425.56 16.40 21.71 - - 80.40 - 5,544.07
Asia China - 188.00 - - - - - 188.00
India - 44.28 - - - - - 44.28
Israel - - 132.73 - - - - 132.73
Mongolia - 6.00 - - - - - 6.00
Philippines 90.00 - - - - - - 90.00
Sri Lanka - 16.20 - - - - - 16.20
Vietnam - 511.79 - - - - - 511.79
Non-EU Europe
Albania - 332.54 - - - 156.76 191.83 681.13
Rep. of Moldavia - 397.20 - - - - - 397.20
Rep. of San Marino - - - - - 200.00 - 200.00
Serbia - - - - - 140.05 - 140.05
Switzerland - - 3.84 - - - - 3.84
Turkey - 791.06 49.68 937.01 - 678.48 - 2,456.24
Ukraine - - - - - 308.15 - 308.15
Oceania New Zealand - - - - 261.90 - 48.52 310.42
Total 26,203.97 2,817.96 1,149.45 937.01 1,251.10 1,610.24 1,587.04 35,556.78

42 FACTS AND FIGURES ON ORGANIC FARMING IN ITALY 2018
Chart 5 IMPORTS OF VEGETABLES AND LEGUMES ITALY 2016 - 2017 (VALUE IN TONNES)
VEGETABLES AND LEGUMES
Legumes(lentils, beans, peas, chickpeas)
Onions, garlic, leek
Potatoes Other vegetables0
2,000
4,000
6,000
8,000
10,000
12,000 2016
2017
Table 4 IMPORTS OF VEGETABLES AND LEGUMES: MAIN COUNTRIES OF ORIGIN ITALY 2017 (VALUE IN TONNES)
Continent Country Potatoes Onions, garlic, leek
Legumes (lentils, beans, peas,
chickpeas)
Other vegetables Total country
Africa Egypt 624.80 1,786.35 469.19 - 2,880.34
Morocco - - - 3.60 3.60
North America Canada - - 128.50 - 128.50
USA - - 300.63 - 300.63
South America Argentina - 1,053.50 63.00 20.00 1,136.50
Ecuador - - 0.60 - 0.60
Asia China - 18.00 5,398.88 - 5,416.88
India - - 255.15 - 255.15
Japan - - 0.10 - 0.10
Kyrgyzstan - - 15.00 - 15.00
Non-EU Europe Rep. of Moldavia - - 169.10 - 169.10
Serbia - 4.35 3.06 - 7.41
Switzerland - - 0.08 - 0.08
Turkey - - 3,825.18 101.64 3,926.82
Total 624.80 2,862.20 10,628.47 125.24 14,240.70

IMPORTS FROM THIRD COUNTRIES
43
Chart 6 IMPORTS OF INDUSTRIAL CROPS ITALY 2016 - 2017 (VALUE IN TONNES)
INDUSTRIAL CROPS
Soya beans Sunflower seed
Soybean meal
Colza seed Linseed PeanutsOther industrial crops
0
5,000
10,000
15,000
20,000
25,000
30,000
35,000 2016
2017

44 FACTS AND FIGURES ON ORGANIC FARMING IN ITALY 2018
Table 5 IMPORTS OF INDUSTRIAL CROPS: MAIN COUNTRIES OF ORIGIN ITALY 2017 (VALUE IN TONNES)
Continent Country Soybean meal
Soya beans
Peanuts Linseed Colza seed
Sunflower seed
Other industrial
crops
Total country
Africa Egypt - - 913.65 - - - 10.47 924.12
Kenya - - - - - - 1.85 1.85
Morocco - - - - - - 185.50 185.50
Senegal - - - - - - 7.00 7.00
South Africa - - - - - - 5.86 5.86
Togo - 4,853.63 - - - - - 4,853.63
Tunisia - - - - - - 87.60 87.60
North America Canada - 75.20 - - - - - 75.20
USA - - - - - - 0.05 0.05
South America Argentina - - - - - 217.44 8.66 226.10
Bolivia - - - - - - 0.50 0.50
Brazil - - - - 159.71 9.59 - 169.30
Chile - - - - - - 48.00 48.00
Ecuador - - 1.50 - - - 0.03 1.53
Paraguay - - - - - - 78.50 78.50
Peru - - - - - - 71.08 71.08
Asia Arab Emirates - 6,100.00 - - - 5,305.35 - 11,405.35
China 6,642.38 10,621.13 119.50 25.00 - 367.50 299.70 18,075.20
India - - - 115.00 - - 229.18 344.18
Japan - - - - - - 3.72 3.72
Kazakhtan - - - - 81.00 - - 81.00
Pakistan - - - - - - 36.00 36.00
Sri Lanka - - - - - - 0.05 0.05
Non-EU Europe Albania - - - - - - 7.82 7.82
Bosnia and Herzegovina
- - - - - - 3.20 3.20
Rep. of Moldavia - 263.64 - - - - - 263.64
Switzerland - - - - - - 0.08 0.08
Turkey - 3,535.70 - 1,684.00 2,001.76 13,500.00 96.00 20,817.46
Ukraine - - - - 2,840.92 400.23 - 3,241.15
Total 6,642.38 25,449.30 1,034.65 1,824.00 5,083.39 19,800.11 1,180.84 61,014.66

IMPORTS FROM THIRD COUNTRIES
45
Chart 7 IMPORTS OF VEGETABLE OILS AND FATS ITALY 2016 - 2017 (VALUE IN TONNES)
VEGETABLE OILS AND FATS
Olive oil Other oils(sunflower, palm, soy,palm kernel)
0
2,000
4,000
6,000
8,000
10,000
12,000
14,000
16,000
18,000 2016
2017
Table 6 IMPORTS OF VEGETABLE OILS AND FATS: MAIN COUNTRIES OF ORIGIN ITALY 2017 (VALUE IN TONNES)
Continent Country Olive Oil Other oils (sunflower, palm, soy, palm kernel)
Total country
Africa Burkina Faso - 1.00 1.00
Morocco - 2.85 2.85
Tunisia 16,887.31 - 16,887.31
North America USA - 60.25 60.25
South America Brazil - 41.52 41.52
Ecuador - 23.02 23.02
Peru - 0.99 0.99
Asia China - 2.45 2.45
India - 6.00 6.00
Israel 1.12 - 1.12
Philippines - 15.77 15.77
Sri Lanka - 49.44 49.44
Thailand - 0.01 0.01
Non-EU Europe Switzerland - 20.38 20.38
Total 16,888.43 223.68 17,112.11

46 FACTS AND FIGURES ON ORGANIC FARMING IN ITALY 2018
Chart 8 IMPORTS OF COFFEE, TEA, SPICES, SUGARS AND COCOA ITALY 2016 - 2017 (VALUE IN TONNES)
COFFEE, TEA, SPICES, SUGARS AND COCOA
Coffee Tea Spices CocoaSugars0
2,000
4,000
6,000
8,000
10,000
12,000 2016
2017

IMPORTS FROM THIRD COUNTRIES
47
Table 7 IMPORTS OF COFFEE, TEA, SPICES, SUGARS AND COCOA: MAIN COUNTRIES OF ORIGIN ITALY 2017 (VALUE IN TONNES)
Continent Country Coffee Thea Spices Sugars* Cocoa Total country
Africa Egypt - - 20.00 - - 20.00
Ethiopia 76.80 - - - - 76.80
Ivory Coast - - - - 25.00 25.00
Madagascar - - - - 50.00 50.00
Morocco - - 0.00 - - 0.00
Tanzania 5.52 - - - - 5.52
Uganda 154.20 - - - - 154.20
Central America Costa Rica - - - 20.00 - 20.00
Domenican Rep. 1.29 - - - 1,425.00 1,426.29
Guatemala 83.15 - - - - 83.15
Honduras 629.28 - - - - 629.28
North America Canada 5.20 - - 62.65 - 67.85
Messico 372.25 - - 3,830.83 - 4,203.08
USA - - - 3.60 - 3.60
South America Argentina - - 0.82 48.00 - 48.82
Bolivia - - - - 9.00 9.00
Brazil 57.55 - 2.46 1,406.81 - 1,466.82
Colombia 15.05 - - 757.30 3.50 775.85
Ecuador - - - 397.59 92.81 490.40
Nicaragua 291.92 - - 36.00 - 327.92
Paraguay - - - 2,278.25 - 2,278.25
Peru 331.55 - 1,447.05 1,200.00 3,300.02 6,278.62
Asia Cambodia - - - 73.60 - 73.60
China - - 21.70 - - 21.70
India 94.40 132.48 88.76 60.00 - 375.64
Indonesia - - - 15.92 3.16 19.08
Japan - 12.10 - - - 12.10
Pakistan - - - 220.18 - 220.18
Philippines - - - 662.37 - 662.37
Sri Lanka - 0.44 0.14 - - 0.58
Thailandia - - - 45.00 - 45.00
Non-EU Europe Albania - - 1.00 - - 1.00
Bosnia and Herzegovina
- - 4.30 - - 4.30
Switzerland 25.19 - 0.41 - 183.45 209.04
Oceania New Zealand - - - 0.01 - 0.01
Total 2,143.33 145.02 1,586.65 11,118.11 5,091.95 20,085.06 *The sugar category also includes maple syrup and agave syrup.

48 FACTS AND FIGURES ON ORGANIC FARMING IN ITALY 2018
Chart 9 IMPORTS OF PROCESSED PRODUCTS ITALY 2016 - 2017 (VALUE IN TONNES)
OTHER PROCESSED PRODUCTS
Processed fruit and vegetables
Other processed products
Processed cereals
Dairy products and honey
Beverages0
1,000
2,000
3,000
4,000
5,000
6,000
7,000 2016
2017

IMPORTS FROM THIRD COUNTRIES
49
Table 8 IMPORTS OF PROCESSED PRODUCTS IN 2017: MAIN COUNTRIES OF ORIGIN ITALY 2017 (VALUE IN TONNES)
Continent Country Processed fruit and
vegetables*
Processed cereals
Dairy products
and honey
Beverages Other processed
products
Total country
Africa Benin 0.06 - - - - 0.06
Mali 722.40 - - - - 722.40
Morocco - - - - 21.39 21.39
Senegal 73.02 - - - 0.50 73.53
South Africa 316.80 - - - 5.00 321.80
Central America Costa Rica 2.03 - - - - 2.03
Cuba - - 1.13 - - 1.13
North America Mexico 23.58 - 148.45 1.60 181.04 354.67
USA - - - 1.84 9.79 11.63
South America Argentina - - 19.80 130.57 - 150.37
Bolivia - - - - 10.00 10.00
Brazil 455.00 - 41.53 493.68 - 990.20
Chile 20.76 - - 25.50 - 46.26
Colombia 0.29 - - - 0.56 0.85
Ecuador 11.19 - - - - 11.19
Peru 4.21 - - 1.81 - 6.01
Uruguay - - 10.78 - 49.88 60.66
Asia China 31.34 - 142.10 - 114.08 287.52
India 64.10 - - - 47.26 111.36
Israele 47.76 73.02 - - 0.30 121.08
Japan 5.50 6.72 - 7.75 69.18 89.16
Pakistan - - - - 40.69 40.69
Philippines - - - 164.80 55.00 219.80
Russia - - - 1.65 378.22 379.87
Sri Lanka - - - - 931.85 931.85
Thailand - - - - 245.30 245.30
Vietnam - - - - 16.00 16.00
Non-EU Europe Albania - - - - 8.39 8.39
Bosnia and Herzegovina
8.92 - - 9.80 - 18.72
Serbia 3,892.85 - - - - 3,892.85
Switzerlan 33.23 520.40 - 26.25 1,531.88 2,111.76
Turkey 1,134.69 3.00 - 15.90 4.10 1,157.69
Oceania New Zealand - - 0.51 - - 0.51
Total 6,847.73 603.15 364.29 881.14 3,720.40 12,416.71 *Processed fruit and vegetables also include fruit jams and juices


Via XX Settembre, 20
00187 Roma
Tel: +39 06 4665 6085
Email: [email protected]
Web: www.sinab.it
SINAB is a project by