factsheet - february2015an open-ended equity scheme) ... previous month end. ... which may have a...
TRANSCRIPT

PRODUCT SUITABILITY
Scheme Names This product is suitable for investors who are seeking~ Product Label Pg. No.
Principal Large Cap Fund • Long term Capital Growth. • Investment in equity & equity related securities High Risk (Brown) 8(An Open-ended Equity Scheme) including equity derivatives of large capitalization Companies
Principal Emerging Bluechip Fund • Long term Capital Growth. • Investment in equity & equity related securities High Risk (Brown) 9(An Open-ended Equity Scheme) including equity derivatives of mid & small capitalization Companies.
Principal Growth Fund • Long term Capital Growth. • Investment in equity & equity related securities High Risk (Brown) 10(An Open-ended Equity Scheme) including equity derivatives of companies across market capitalization.
Principal Dividend Yield Fund • Long term Capital Growth. • Investment in equity & equity related securities High Risk (Brown) 11(An Open-ended Equity Scheme) including equity derivatives of high dividend yield Companies.
Principal Index Fund - Nifty • Long term Capital Growth. • Investment in equity securities High Risk (Brown) 12(An Open-ended Index Scheme) including equity derivatives of CNX Nifty (NSE) Companies.
Principal Index Fund - Midcap • Long term Capital Growth. • Investment in equity securities High Risk (Brown) 13(An Open-ended Index Scheme) including equity derivatives of CNX Midcap Index.
Principal SMART Equity Fund • Long term Capital Growth. • Investment in equity & equity related securities High Risk (Brown) 14(An Open-ended Equity Scheme) including equity derivatives of large capitalization Companies as well as
Debt/Money Market securities through a systematic allocation of Fundsbetween Equity & Debt on the basis of the Price Earnings Ratio of CNX Nifty.
Principal Personal Tax Saver Fund • Long term Capital Growth with a three year lock-in. High Risk (Brown) 15(An Open-ended Equity Linked Savings Scheme) • Investment in equity & equity related securities including equity derivatives of
large capitalization Companies.
Principal Tax Savings Fund • Long term Capital Growth with a three year lock-in. High Risk (Brown) 16(An Open-ended Equity Linked Savings Scheme) • Investment in equity & equity related securities including equity derivatives of
companies across market capitalization.
Principal Balanced Fund • Income and Long term Capital Growth. • Investment in equity & equity Medium Risk (Yellow) 17(An Open-ended Balanced Scheme) related securities, debt/money market securities as well as derivatives.
Principal Debt Savings Fund - MIP • Income and Capital Growth over a medium term investment horizon. Medium Risk (Yellow) 18An Open-ended Income Fund • Investment primarily in debt/money market securities with exposure in(Monthly Income is not assured and is subject equity & equity related instruments including equity derivatives.to the availability of distributable surplus)
Principal Government Securities Fund • Income over a long term investment horizon. Low Risk (Blue) 19(An Open-ended dedicated Gilt Scheme • Investment in Government Securities.investing in Government Securities)
Principal Income Fund - Long Term Plan • Income over a long term investment horizon. Low Risk (Blue) 20(An Open-ended Income Scheme) • Investment in Debt & Money Market Instruments.
Principal Debt Opportunities Fund - • Income over a long term investment horizon. Low Risk (Blue) 21Corporate Bond Plan • Investment in Debt & Money Market Instruments of Private &(An Open-ended Debt Scheme) Public Sector Companies.
Principal Income Fund - Short Term Plan • Income over a medium term investment horizon. Low Risk (Blue) 22(An Open-ended Income Scheme) • Investment in Debt & Money Market Instruments.
Principal Bank CD Fund • Income over a medium term investment horizon. Low Risk (Blue) 23(An Open-ended Debt Scheme) • Investment in Bank CDs, Debt & Money Market Instruments.
Principal Debt Opportunities Fund - • Income over a short term investment horizon. Low Risk (Blue) 24Conservative Plan (An Open-ended Debt Scheme) • Investment in Debt & Money Market Instruments.
Principal Cash Management Fund • Income over a short term investment horizon. • Investment in Debt & Low Risk (Blue) 25(An Open-ended Liquid Scheme) Money Market Instruments, with maturity not exceeding 91 days.
Principal Global Opportunities Fund • Long term Capital Growth. High Risk (Brown) 26(An Open-ended Fund of Funds Scheme) • Investment in overseas mutual fund schemes.
Principal Retail Money Manager Fund • Income over a short term investment horizon. Low Risk (Blue) 26(An Open-ended Debt Scheme) • Investment in Debt & Money Market Instruments.
Principal Debt Savings Fund - Retail Plan • Income over a long term investment horizon. Low Risk (Blue) 27(An Open-ended Income Scheme) • Investment in Debt & Money Market Instruments.
~ Investors should consult their financial advisers if in doubt about whether the product is suitable for them.
Note: Risk may be represented as: Investors understand that their principal will be at Low Risk (Blue);
Investors understand that their principal will be at Medium Risk (Yellow);
Investors understand that their principal will be at High Risk (Brown)
INVEST KNOWHOW February 20153
Debt Markets
Fund Manager Commentary
February 2015
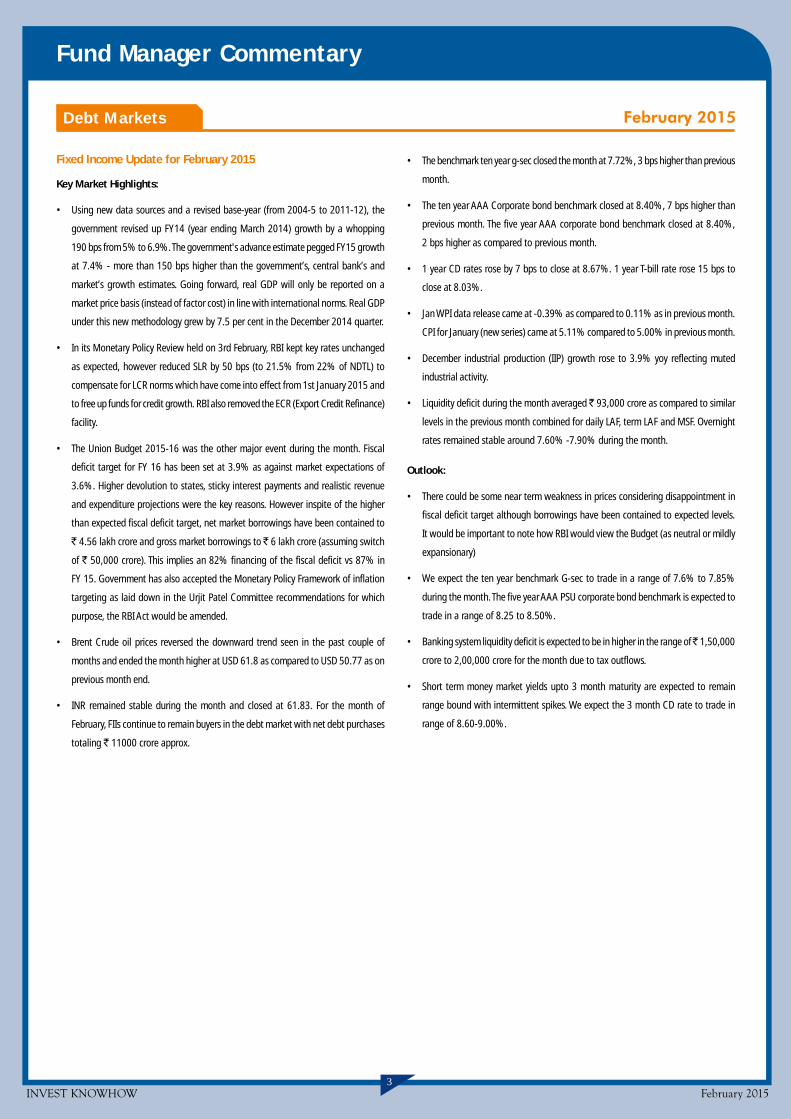
Fixed Income Update for February 2015
Key Market Highlights:
• Using new data sources and a revised base-year (from 2004-5 to 2011-12), the
government revised up FY14 (year ending March 2014) growth by a whopping
190 bps from 5% to 6.9%. The government's advance estimate pegged FY15 growth
at 7.4% - more than 150 bps higher than the government’s, central bank’s and
market’s growth estimates. Going forward, real GDP will only be reported on a
market price basis (instead of factor cost) in line with international norms. Real GDP
under this new methodology grew by 7.5 per cent in the December 2014 quarter.
• In its Monetary Policy Review held on 3rd February, RBI kept key rates unchanged
as expected, however reduced SLR by 50 bps (to 21.5% from 22% of NDTL) to
compensate for LCR norms which have come into effect from 1st January 2015 and
to free up funds for credit growth. RBI also removed the ECR (Export Credit Refinance)
facility.
• The Union Budget 2015-16 was the other major event during the month. Fiscal
deficit target for FY 16 has been set at 3.9% as against market expectations of
3.6%. Higher devolution to states, sticky interest payments and realistic revenue
and expenditure projections were the key reasons. However inspite of the higher
than expected fiscal deficit target, net market borrowings have been contained to
` 4.56 lakh crore and gross market borrowings to ` 6 lakh crore (assuming switch
of ` 50,000 crore). This implies an 82% financing of the fiscal deficit vs 87% in
FY 15. Government has also accepted the Monetary Policy Framework of inflation
targeting as laid down in the Urjit Patel Committee recommendations for which
purpose, the RBI Act would be amended.
• Brent Crude oil prices reversed the downward trend seen in the past couple of
months and ended the month higher at USD 61.8 as compared to USD 50.77 as on
previous month end.
• INR remained stable during the month and closed at 61.83. For the month of
February, FIIs continue to remain buyers in the debt market with net debt purchases
totaling ` 11000 crore approx.
• The benchmark ten year g-sec closed the month at 7.72%, 3 bps higher than previous
month.
• The ten year AAA Corporate bond benchmark closed at 8.40%, 7 bps higher than
previous month. The five year AAA corporate bond benchmark closed at 8.40%,
2 bps higher as compared to previous month.
• 1 year CD rates rose by 7 bps to close at 8.67%. 1 year T-bill rate rose 15 bps to
close at 8.03%.
• Jan WPI data release came at -0.39% as compared to 0.11% as in previous month.
CPI for January (new series) came at 5.11% compared to 5.00% in previous month.
• December industrial production (IIP) growth rose to 3.9% yoy reflecting muted
industrial activity.
• Liquidity deficit during the month averaged ` 93,000 crore as compared to similar
levels in the previous month combined for daily LAF, term LAF and MSF. Overnight
rates remained stable around 7.60% -7.90% during the month.
Outlook:
• There could be some near term weakness in prices considering disappointment in
fiscal deficit target although borrowings have been contained to expected levels.
It would be important to note how RBI would view the Budget (as neutral or mildly
expansionary)
• We expect the ten year benchmark G-sec to trade in a range of 7.6% to 7.85%
during the month. The five year AAA PSU corporate bond benchmark is expected to
trade in a range of 8.25 to 8.50%.
• Banking system liquidity deficit is expected to be in higher in the range of ̀ 1,50,000
crore to 2,00,000 crore for the month due to tax outflows.
• Short term money market yields upto 3 month maturity are expected to remain
range bound with intermittent spikes. We expect the 3 month CD rate to trade in
range of 8.60-9.00%.

INVEST KNOWHOW February 20154
Fund Manager Commentary
Equity Markets
Review of Equity Market for the Month of February 2015
February was a month with lot of policy related news and events, the key one being
of course, the Union Budget, besides the Railway budget and the Economic survey.
However, the markets closed virtually flat despite the heavy news flow. The MSCI India,
in USD terms (up 1.8%), underperformed both MSCI Emerging Markets and MSCI Asia
Pac Ex Japan. The US Dollar Index remained steady during the month, though it has
gained 19% since June 2014. The Rupee however, has been virtually rock steady during
the period, down less than 3% during this period. During the month, the sectors which
did badly were banks (asset quality issues remain and markets expect growth in
restructuring in Q4 FY15, being the last quarter before new norms for dealing with
such assets kick in), energy (inventory losses for the oil marketing companies) and
automobiles (where Commercial Vehicle numbers have shown some improvement
but motorcycle sales shown slowdown). In terms of flows, FIIs again were positive
(about $ 1.4 Billion) while insurance companies overall remained sellers. Mutual funds
were net buyers to the extent of USD 540 million.
In terms of earnings, the December quarter was tepid once again. The street had to
down grade its earning numbers again. The consensus is gradually moving to earnings
growth of 6%-7% for FY 15 now. About 30% of Nifty companies had yoy earnings
degrowth for the December quarter. Companies in the metals, PSU banks, energy and
capital goods were particularly impacted.
In terms of macroeconomic data, the inflation numbers remained in check, with January
WPI actually being (-) 0.4% yoy. The CPI was 5.1% for the month of January. IIP, which
is volatile, was 1.7% for the month of December (3.8% for the previous month).
The much anticipated union budget was not a big bang budget (which some quarters
of the market expected, an unfair expectation in our view) but a workmanlike budget
focused on infrastructure and execution. There were no proposals which stood out as
negative proposals on first sight. The spend on infrastructure (particularly roads) was
increased, while the government pushed back the fiscal consolidation by a year. The
target fiscal deficit for FY 16 is 3.9% of GDP, which is not too bad if the money is spent
on capital expenditure and asset creation. The government has proposed setting up a
body to facilitate funding of small enterprises through refinancing of MFIs (the MUDRA
bank) which may have a big potential since the SMEs are not well served by the lending
bodies. The proposal to reduce tax rates while doing away with the exemptions could
be a welcome move as it may reduce complexity and some distorted incentives in the
IT Act. Coming to the GST, the government plans to implement it from April 16, but a lot
of work remains to be done in terms of the IT backend, harmonizing the tax rate across
goods and services and getting the states to pass relevant legislation.
The railway budget also focused on increasing capital expenditure and it was proposed
to be raised to ̀ 1 lac crores from about ̀ 66,000 crores for FY 15. Overall, the hope is
that the economy may begin to see some activity over the next 2-3 quarters. Clearly
there could be activity picking up in the road and railway space.
During the month we bought or added to our positions in Abbott India, Bank of Baroda,
Colgate Palmolive, Dish TV, Federal Bank, Finolex Cable, HCL Technologies, HDFC Bank,
Indiabulls Housing Finance, Indian Hotels Co., Kaveri Seed Co., Motherson Sumi Systems,
MRF, Power Finance Corporation, Tata Consultancy Services, UPL and Yes Bank among
other stocks.
We sold or reduced our positions in Aditya Birla Nuvo, Andhra Bank, Apollo Tyres,
Aurionpro Solutions, Bajaj Auto, Bank of India, Bata India, Bharat Forge Co., Crompton
Greaves, Divis Laboratories, Hindustan Zinc, JK Tyre & Industries, Karur Vysya Bank, KEC
International, PC Jewellers, Sadbhav Engineering, State Bank of India, Symphony and
Jammu & Kashmir Bank among other stocks.
February 2015
PERFORMANCE AS ON FEBRUARY 27, 2015*
Index 1 Month 3 Months 6 Months 1 Year(%) (%) (%) (%)
Broad Markets
CNX Nifty Index 8845 -0.74 4.13 11.45 41.65
S&P BSE Sensex 29220 -1.19 2.75 10.01 39.12
S&P BSE 100 8946 -0.42 4.67 11.77 44.26
S&P BSE 200 3656 -0.41 5.31 13.20 47.42
S&P BSE 500 11405 -0.30 5.19 13.08 48.73
S&P BSE Mid Cap 10811 0.29 6.29 15.92 66.94
S&P BSE Small Cap 11320 -0.92 0.69 10.39 75.66
Sectoral Performance
S&P BSE AUTO 19770 -2.88 4.87 14.61 58.91
S&P BSE Bankex 21858 -7.03 6.00 21.50 78.21
S&P BSE CG 17825 2.86 9.98 21.24 73.63
S&P BSE CD 10605 2.84 11.22 15.29 76.80
S&P BSE FMCG 8573 4.41 11.17 16.68 31.69
S&P BSE Metal 10593 1.39 -5.88 -14.29 23.45
S&P BSE Oil & Gas 9602 -3.07 -11.69 -13.25 13.89
S&P BSE PSU 8129 -2.60 -1.49 0.72 48.58
S&P BSE Teck 6390 4.12 3.57 13.83 23.02
S&P BSE HC 15540 -0.13 4.26 15.99 46.48
*Performance for less than one year period are absolute returns and more than one year arecompounded annualized returns.
Source - MFI Explorer
INVEST KNOWHOW February 20155
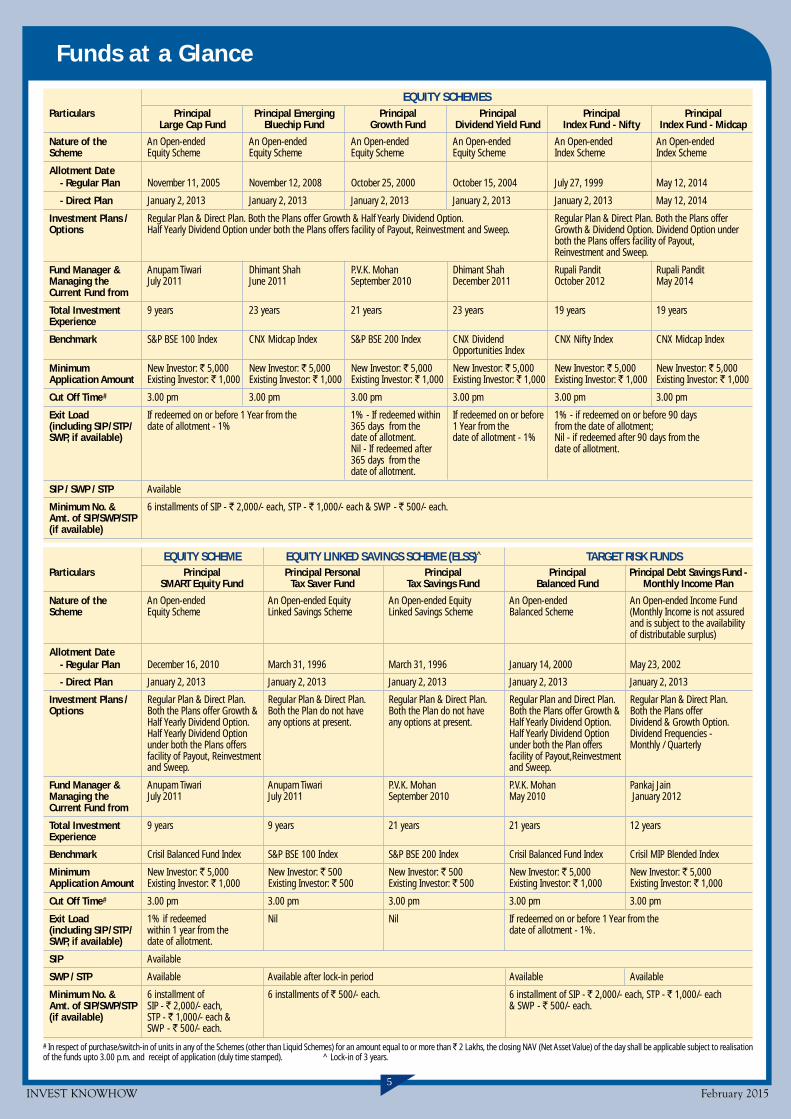
Funds at a Glance
EQUITY SCHEMES
Particulars Principal Principal Personal Principal Principal Principal Debt Savings Fund -SMART Equity Fund Tax Saver Fund Tax Savings Fund Balanced Fund Monthly Income Plan
Nature of the An Open-ended An Open-ended Equity An Open-ended Equity An Open-ended An Open-ended Income FundScheme Equity Scheme Linked Savings Scheme Linked Savings Scheme Balanced Scheme (Monthly Income is not assured
and is subject to the availabilityof distributable surplus)
Allotment Date- Regular Plan December 16, 2010 March 31, 1996 March 31, 1996 January 14, 2000 May 23, 2002
- Direct Plan January 2, 2013 January 2, 2013 January 2, 2013 January 2, 2013 January 2, 2013
Investment Plans / Regular Plan & Direct Plan. Regular Plan & Direct Plan. Regular Plan & Direct Plan. Regular Plan and Direct Plan. Regular Plan & Direct Plan.Options Both the Plans offer Growth & Both the Plan do not have Both the Plan do not have Both the Plans offer Growth & Both the Plans offer
Half Yearly Dividend Option. any options at present. any options at present. Half Yearly Dividend Option. Dividend & Growth Option.Half Yearly Dividend Option Half Yearly Dividend Option Dividend Frequencies -under both the Plans offers under both the Plan offers Monthly / Quarterlyfacility of Payout, Reinvestment facility of Payout,Reinvestmentand Sweep. and Sweep.
Fund Manager & Anupam Tiwari Anupam Tiwari P.V.K. Mohan P.V.K. Mohan Pankaj JainManaging the July 2011 July 2011 September 2010 May 2010 January 2012Current Fund from
Total Investment 9 years 9 years 21 years 21 years 12 yearsExperience
Benchmark Crisil Balanced Fund Index S&P BSE 100 Index S&P BSE 200 Index Crisil Balanced Fund Index Crisil MIP Blended Index
Minimum New Investor: ` 5,000 New Investor: ` 500 New Investor: ` 500 New Investor: ` 5,000 New Investor: ` 5,000Application Amount Existing Investor: ` 1,000 Existing Investor: ` 500 Existing Investor: ` 500 Existing Investor: ` 1,000 Existing Investor: ` 1,000
Cut Off Time# 3.00 pm 3.00 pm 3.00 pm 3.00 pm 3.00 pm
Exit Load 1% if redeemed Nil Nil If redeemed on or before 1 Year from the(including SIP /STP / within 1 year from the date of allotment - 1%.SWP, if available) date of allotment.
SIP Available
SWP / STP Available Available after lock-in period Available Available
Minimum No. & 6 installment of 6 installments of ` 500/- each. 6 installment of SIP - ` 2,000/- each, STP - ` 1,000/- eachAmt. of SIP/SWP/STP SIP - ` 2,000/- each, & SWP - ` 500/- each.(if available) STP - ` 1,000/- each &
SWP - ` 500/- each.
EQUITY SCHEME EQUITY LINKED SAVINGS SCHEME (ELSS)^ TARGET RISK FUNDS
Particulars Principal Principal Emerging Principal Principal Principal PrincipalLarge Cap Fund Bluechip Fund Growth Fund Dividend Yield Fund Index Fund - Nifty Index Fund - Midcap
Nature of the An Open-ended An Open-ended An Open-ended An Open-ended An Open-ended An Open-endedScheme Equity Scheme Equity Scheme Equity Scheme Equity Scheme Index Scheme Index Scheme
Allotment Date- Regular Plan November 11, 2005 November 12, 2008 October 25, 2000 October 15, 2004 July 27, 1999 May 12, 2014
- Direct Plan January 2, 2013 January 2, 2013 January 2, 2013 January 2, 2013 January 2, 2013 May 12, 2014
Investment Plans / Regular Plan & Direct Plan. Both the Plans offer Growth & Half Yearly Dividend Option. Regular Plan & Direct Plan. Both the Plans offerOptions Half Yearly Dividend Option under both the Plans offers facility of Payout, Reinvestment and Sweep. Growth & Dividend Option. Dividend Option under
both the Plans offers facility of Payout,Reinvestment and Sweep.
Fund Manager & Anupam Tiwari Dhimant Shah P.V.K. Mohan Dhimant Shah Rupali Pandit Rupali PanditManaging the July 2011 June 2011 September 2010 December 2011 October 2012 May 2014Current Fund from
Total Investment 9 years 23 years 21 years 23 years 19 years 19 yearsExperience
Benchmark S&P BSE 100 Index CNX Midcap Index S&P BSE 200 Index CNX Dividend CNX Nifty Index CNX Midcap IndexOpportunities Index
Minimum New Investor: ` 5,000 New Investor: ` 5,000 New Investor: ` 5,000 New Investor: ` 5,000 New Investor: ` 5,000 New Investor: ` 5,000Application Amount Existing Investor: ` 1,000 Existing Investor: ` 1,000 Existing Investor: ` 1,000 Existing Investor: ` 1,000 Existing Investor: ` 1,000 Existing Investor: ` 1,000
Cut Off Time# 3.00 pm 3.00 pm 3.00 pm 3.00 pm 3.00 pm 3.00 pm
Exit Load If redeemed on or before 1 Year from the 1% - If redeemed within If redeemed on or before 1% - if redeemed on or before 90 days(including SIP /STP / date of allotment - 1% 365 days from the 1 Year from the from the date of allotment;SWP, if available) date of allotment. date of allotment - 1% Nil - if redeemed after 90 days from the
Nil - If redeemed after date of allotment.365 days from thedate of allotment.
SIP / SWP / STP Available
Minimum No. & 6 installments of SIP - ` 2,000/- each, STP - ` 1,000/- each & SWP - ` 500/- each.Amt. of SIP/SWP/STP(if available)
# In respect of purchase/switch-in of units in any of the Schemes (other than Liquid Schemes) for an amount equal to or more than ` 2 Lakhs, the closing NAV (Net Asset Value) of the day shall be applicable subject to realisationof the funds upto 3.00 p.m. and receipt of application (duly time stamped). ^ Lock-in of 3 years.
INVEST KNOWHOW February 20156
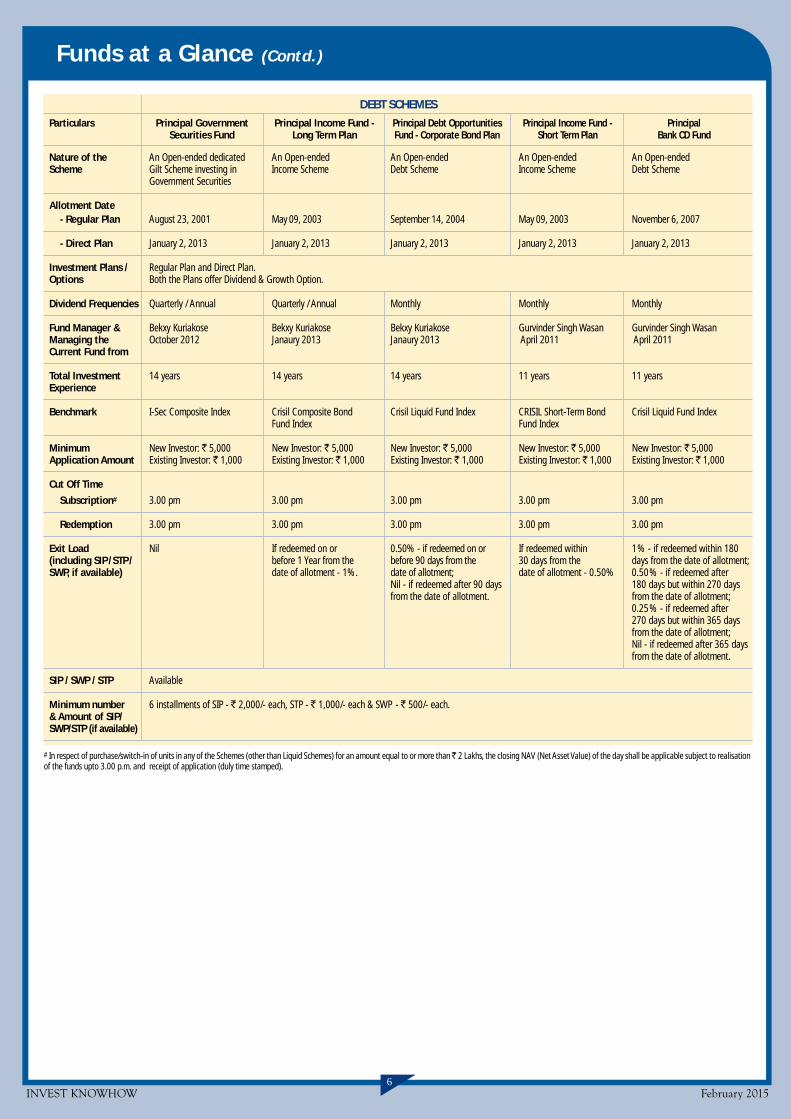
Funds at a Glance (Contd.)
Particulars Principal Government Principal Income Fund - Principal Debt Opportunities Principal Income Fund - PrincipalSecurities Fund Long Term Plan Fund - Corporate Bond Plan Short Term Plan Bank CD Fund
Nature of the An Open-ended dedicated An Open-ended An Open-ended An Open-ended An Open-endedScheme Gilt Scheme investing in Income Scheme Debt Scheme Income Scheme Debt Scheme
Government Securities
Allotment Date- Regular Plan August 23, 2001 May 09, 2003 September 14, 2004 May 09, 2003 November 6, 2007
- Direct Plan January 2, 2013 January 2, 2013 January 2, 2013 January 2, 2013 January 2, 2013
Investment Plans / Regular Plan and Direct Plan.Options Both the Plans offer Dividend & Growth Option.
Dividend Frequencies Quarterly / Annual Quarterly / Annual Monthly Monthly Monthly
Fund Manager & Bekxy Kuriakose Bekxy Kuriakose Bekxy Kuriakose Gurvinder Singh Wasan Gurvinder Singh WasanManaging the October 2012 Janaury 2013 Janaury 2013 April 2011 April 2011Current Fund from
Total Investment 14 years 14 years 14 years 11 years 11 yearsExperience
Benchmark I-Sec Composite Index Crisil Composite Bond Crisil Liquid Fund Index CRISIL Short-Term Bond Crisil Liquid Fund IndexFund Index Fund Index
Minimum New Investor: ` 5,000 New Investor: ` 5,000 New Investor: ` 5,000 New Investor: ` 5,000 New Investor: ` 5,000Application Amount Existing Investor: ` 1,000 Existing Investor: ` 1,000 Existing Investor: ` 1,000 Existing Investor: ` 1,000 Existing Investor: ` 1,000
Cut Off Time
Subscription# 3.00 pm 3.00 pm 3.00 pm 3.00 pm 3.00 pm
Redemption 3.00 pm 3.00 pm 3.00 pm 3.00 pm 3.00 pm
Exit Load Nil If redeemed on or 0.50% - if redeemed on or If redeemed within 1% - if redeemed within 180(including SIP /STP / before 1 Year from the before 90 days from the 30 days from the days from the date of allotment;SWP, if available) date of allotment - 1%. date of allotment; date of allotment - 0.50% 0.50% - if redeemed after
Nil - if redeemed after 90 days 180 days but within 270 daysfrom the date of allotment. from the date of allotment;
0.25% - if redeemed after270 days but within 365 daysfrom the date of allotment;Nil - if redeemed after 365 daysfrom the date of allotment.
SIP / SWP / STP Available
Minimum number 6 installments of SIP - ` 2,000/- each, STP - ` 1,000/- each & SWP - ` 500/- each.& Amount of SIP/SWP/STP (if available)
DEBT SCHEMES
# In respect of purchase/switch-in of units in any of the Schemes (other than Liquid Schemes) for an amount equal to or more than ̀ 2 Lakhs, the closing NAV (Net Asset Value) of the day shall be applicable subject to realisationof the funds upto 3.00 p.m. and receipt of application (duly time stamped).
INVEST KNOWHOW February 20157
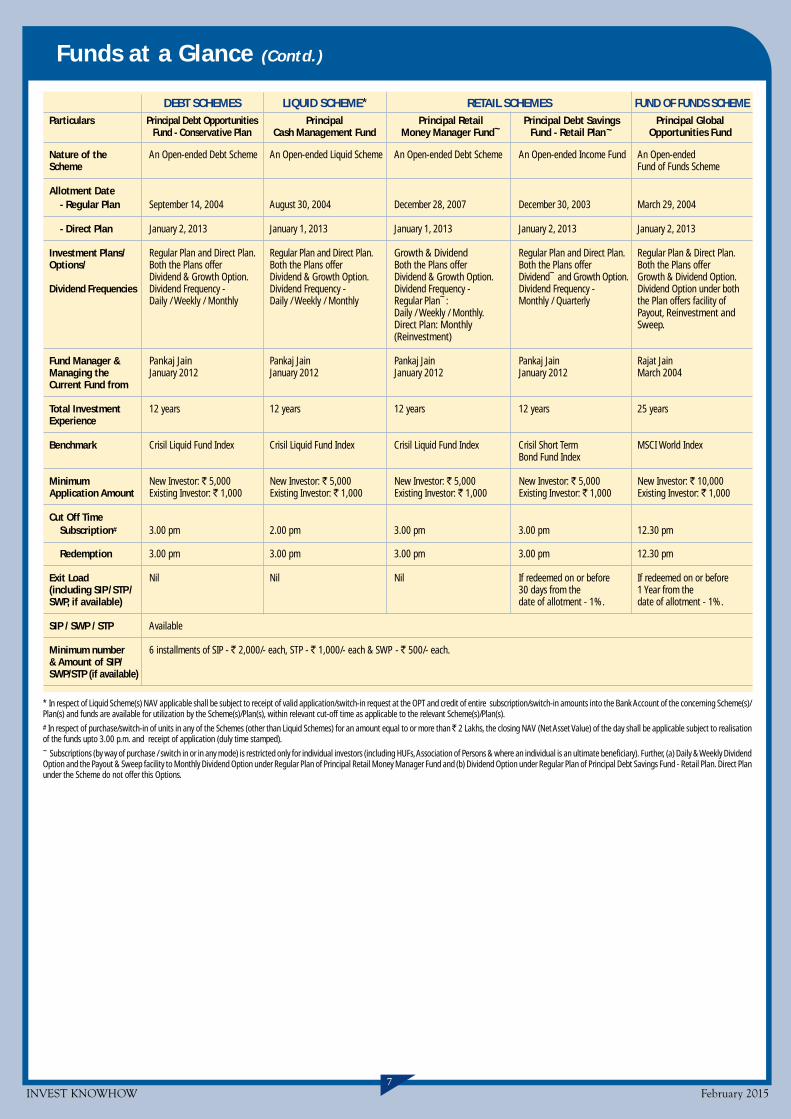
Particulars Principal Debt Opportunities Principal Principal Retail Principal Debt Savings Principal GlobalFund - Conservative Plan Cash Management Fund Money Manager Fund~ Fund - Retail Plan~ Opportunities Fund
Nature of the An Open-ended Debt Scheme An Open-ended Liquid Scheme An Open-ended Debt Scheme An Open-ended Income Fund An Open-endedScheme Fund of Funds Scheme
Allotment Date- Regular Plan September 14, 2004 August 30, 2004 December 28, 2007 December 30, 2003 March 29, 2004
- Direct Plan January 2, 2013 January 1, 2013 January 1, 2013 January 2, 2013 January 2, 2013
Investment Plans/ Regular Plan and Direct Plan. Regular Plan and Direct Plan. Growth & Dividend Regular Plan and Direct Plan. Regular Plan & Direct Plan.Options/ Both the Plans offer Both the Plans offer Both the Plans offer Both the Plans offer Both the Plans offer
Dividend & Growth Option. Dividend & Growth Option. Dividend & Growth Option. Dividend~ and Growth Option. Growth & Dividend Option.Dividend Frequencies Dividend Frequency - Dividend Frequency - Dividend Frequency - Dividend Frequency - Dividend Option under both
Daily / Weekly / Monthly Daily / Weekly / Monthly Regular Plan~: Monthly / Quarterly the Plan offers facility ofDaily / Weekly / Monthly. Payout, Reinvestment andDirect Plan: Monthly Sweep.(Reinvestment)
Fund Manager & Pankaj Jain Pankaj Jain Pankaj Jain Pankaj Jain Rajat JainManaging the January 2012 January 2012 January 2012 January 2012 March 2004Current Fund from
Total Investment 12 years 12 years 12 years 12 years 25 yearsExperience
Benchmark Crisil Liquid Fund Index Crisil Liquid Fund Index Crisil Liquid Fund Index Crisil Short Term MSCI World IndexBond Fund Index
Minimum New Investor: ` 5,000 New Investor: ` 5,000 New Investor: ` 5,000 New Investor: ` 5,000 New Investor: ` 10,000Application Amount Existing Investor: ` 1,000 Existing Investor: ` 1,000 Existing Investor: ` 1,000 Existing Investor: ` 1,000 Existing Investor: ` 1,000
Cut Off TimeSubscription# 3.00 pm 2.00 pm 3.00 pm 3.00 pm 12.30 pm
Redemption 3.00 pm 3.00 pm 3.00 pm 3.00 pm 12.30 pm
Exit Load Nil Nil Nil If redeemed on or before If redeemed on or before(including SIP /STP / 30 days from the 1 Year from theSWP, if available) date of allotment - 1%. date of allotment - 1%.
SIP / SWP / STP Available
Minimum number 6 installments of SIP - ` 2,000/- each, STP - ` 1,000/- each & SWP - ` 500/- each.& Amount of SIP/SWP/STP (if available)
DEBT SCHEMES RETAIL SCHEMESLIQUID SCHEME*
* In respect of Liquid Scheme(s) NAV applicable shall be subject to receipt of valid application/switch-in request at the OPT and credit of entire subscription/switch-in amounts into the Bank Account of the concerning Scheme(s)/Plan(s) and funds are available for utilization by the Scheme(s)/Plan(s), within relevant cut-off time as applicable to the relevant Scheme(s)/Plan(s).# In respect of purchase/switch-in of units in any of the Schemes (other than Liquid Schemes) for an amount equal to or more than ̀ 2 Lakhs, the closing NAV (Net Asset Value) of the day shall be applicable subject to realisationof the funds upto 3.00 p.m. and receipt of application (duly time stamped).~ Subscriptions (by way of purchase / switch in or in any mode) is restricted only for individual investors (including HUFs, Association of Persons & where an individual is an ultimate beneficiary). Further, (a) Daily & Weekly DividendOption and the Payout & Sweep facility to Monthly Dividend Option under Regular Plan of Principal Retail Money Manager Fund and (b) Dividend Option under Regular Plan of Principal Debt Savings Fund - Retail Plan. Direct Planunder the Scheme do not offer this Options.
Funds at a Glance (Contd.)
FUND OF FUNDS SCHEME
INVEST KNOWHOW February 20158
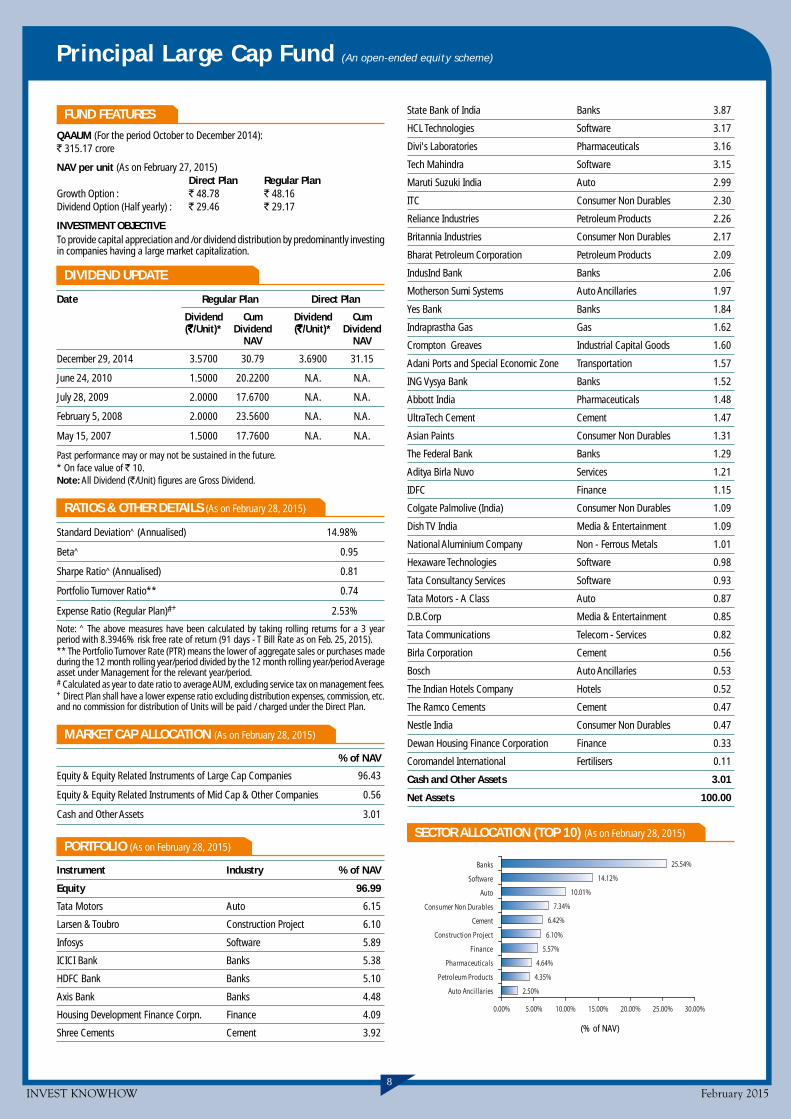
Principal Large Cap Fund (An open-ended equity scheme)
FUND FEATURES
QAAUM (For the period October to December 2014):` 315.17 crore
NAV per unit (As on February 27, 2015)Direct Plan Regular Plan
Growth Option : ` 48.78 ` 48.16Dividend Option (Half yearly) : ` 29.46 ` 29.17
INVESTMENT OBJECTIVETo provide capital appreciation and /or dividend distribution by predominantly investingin companies having a large market capitalization.
DIVIDEND UPDATE
Date Regular Plan Direct Plan
Dividend Cum Dividend Cum(`̀̀̀̀/Unit)* Dividend (`̀̀̀̀/Unit)* Dividend
NAV NAV
December 29, 2014 3.5700 30.79 3.6900 31.15
June 24, 2010 1.5000 20.2200 N.A. N.A.
July 28, 2009 2.0000 17.6700 N.A. N.A.
February 5, 2008 2.0000 23.5600 N.A. N.A.
May 15, 2007 1.5000 17.7600 N.A. N.A.
Past performance may or may not be sustained in the future.* On face value of ` 10.Note: All Dividend (`/Unit) figures are Gross Dividend.
RATIOS & OTHER DETAILS (As on February 28, 2015)
Standard Deviation^ (Annualised) 14.98%
Beta^ 0.95
Sharpe Ratio^ (Annualised) 0.81
Portfolio Turnover Ratio** 0.74
Expense Ratio (Regular Plan)#+ 2.53%
Note: ^ The above measures have been calculated by taking rolling returns for a 3 yearperiod with 8.3946% risk free rate of return (91 days - T Bill Rate as on Feb. 25, 2015).** The Portfolio Turnover Rate (PTR) means the lower of aggregate sales or purchases madeduring the 12 month rolling year/period divided by the 12 month rolling year/period Averageasset under Management for the relevant year/period.# Calculated as year to date ratio to average AUM, excluding service tax on management fees.+ Direct Plan shall have a lower expense ratio excluding distribution expenses, commission, etc.and no commission for distribution of Units will be paid / charged under the Direct Plan.
MARKET CAP ALLOCATION (As on February 28, 2015)
% of NAV
Equity & Equity Related Instruments of Large Cap Companies 96.43
Equity & Equity Related Instruments of Mid Cap & Other Companies 0.56
Cash and Other Assets 3.01
PORTFOLIO (As on February 28, 2015)
Instrument Industry % of NAV
Equity 96.99
Tata Motors Auto 6.15
Larsen & Toubro Construction Project 6.10
Infosys Software 5.89
ICICI Bank Banks 5.38
HDFC Bank Banks 5.10
Axis Bank Banks 4.48
Housing Development Finance Corpn. Finance 4.09
Shree Cements Cement 3.92
25.54%
14.12%
10.01%
7.34%
6.42%
6.10%
5.57%
4.64%
4.35%
2.50%
0.00% 5.00% 10.00% 15.00% 20.00% 25.00% 30.00%
Banks
Software
Auto
Consumer Non Durables
Cement
Construction Project
Finance
Pharmaceuticals
Petroleum Products
Auto Ancillaries
(% of NAV)
State Bank of India Banks 3.87
HCL Technologies Software 3.17
Divi's Laboratories Pharmaceuticals 3.16
Tech Mahindra Software 3.15
Maruti Suzuki India Auto 2.99
ITC Consumer Non Durables 2.30
Reliance Industries Petroleum Products 2.26
Britannia Industries Consumer Non Durables 2.17
Bharat Petroleum Corporation Petroleum Products 2.09
IndusInd Bank Banks 2.06
Motherson Sumi Systems Auto Ancillaries 1.97
Yes Bank Banks 1.84
Indraprastha Gas Gas 1.62
Crompton Greaves Industrial Capital Goods 1.60
Adani Ports and Special Economic Zone Transportation 1.57
ING Vysya Bank Banks 1.52
Abbott India Pharmaceuticals 1.48
UltraTech Cement Cement 1.47
Asian Paints Consumer Non Durables 1.31
The Federal Bank Banks 1.29
Aditya Birla Nuvo Services 1.21
IDFC Finance 1.15
Colgate Palmolive (India) Consumer Non Durables 1.09
Dish TV India Media & Entertainment 1.09
National Aluminium Company Non - Ferrous Metals 1.01
Hexaware Technologies Software 0.98
Tata Consultancy Services Software 0.93
Tata Motors - A Class Auto 0.87
D.B.Corp Media & Entertainment 0.85
Tata Communications Telecom - Services 0.82
Birla Corporation Cement 0.56
Bosch Auto Ancillaries 0.53
The Indian Hotels Company Hotels 0.52
The Ramco Cements Cement 0.47
Nestle India Consumer Non Durables 0.47
Dewan Housing Finance Corporation Finance 0.33
Coromandel International Fertilisers 0.11
Cash and Other Assets 3.01
Net Assets 100.00
SECTOR ALLOCATION (TOP 10) (As on February 28, 2015)
INVEST KNOWHOW February 20159
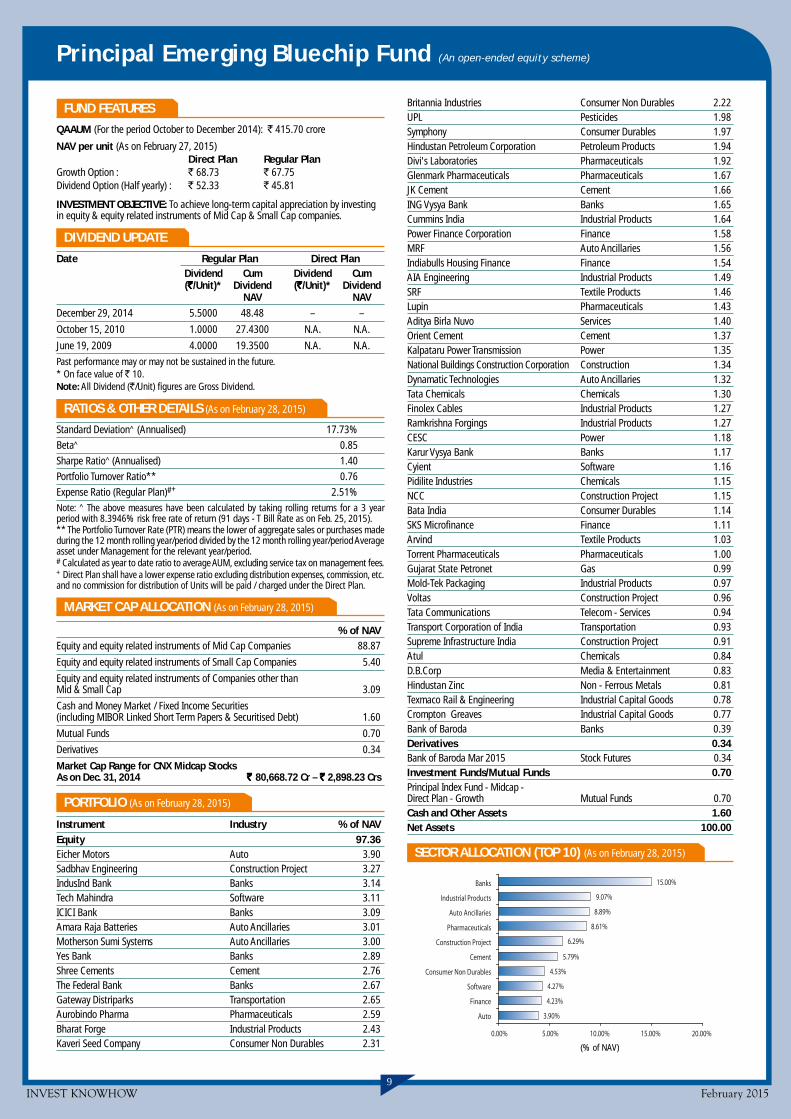
Principal Emerging Bluechip Fund (An open-ended equity scheme)
15.00%
9.07%
8.89%
8.61%
6.29%
5.79%
4.53%
4.27%
4.23%
3.90%
0.00% 5.00% 10.00% 15.00% 20.00%
Banks
Industrial Products
Auto Ancillaries
Pharmaceuticals
Construction Project
Cement
Consumer Non Durables
Software
Finance
Auto
FUND FEATURES
QAAUM (For the period October to December 2014): ` 415.70 crore
NAV per unit (As on February 27, 2015)Direct Plan Regular Plan
Growth Option : ` 68.73 ` 67.75Dividend Option (Half yearly) : ` 52.33 ` 45.81
INVESTMENT OBJECTIVE: To achieve long-term capital appreciation by investingin equity & equity related instruments of Mid Cap & Small Cap companies.
DIVIDEND UPDATE
Date Regular Plan Direct PlanDividend Cum Dividend Cum(`̀̀̀̀/Unit)* Dividend (`̀̀̀̀/Unit)* Dividend
NAV NAVDecember 29, 2014 5.5000 48.48 – –
October 15, 2010 1.0000 27.4300 N.A. N.A.
June 19, 2009 4.0000 19.3500 N.A. N.A.
Past performance may or may not be sustained in the future.* On face value of ` 10.Note: All Dividend (`/Unit) figures are Gross Dividend.
RATIOS & OTHER DETAILS (As on February 28, 2015)
Standard Deviation^ (Annualised) 17.73%
Beta^ 0.85
Sharpe Ratio^ (Annualised) 1.40
Portfolio Turnover Ratio** 0.76
Expense Ratio (Regular Plan)#+ 2.51%
Note: ^ The above measures have been calculated by taking rolling returns for a 3 yearperiod with 8.3946% risk free rate of return (91 days - T Bill Rate as on Feb. 25, 2015).** The Portfolio Turnover Rate (PTR) means the lower of aggregate sales or purchases madeduring the 12 month rolling year/period divided by the 12 month rolling year/period Averageasset under Management for the relevant year/period.# Calculated as year to date ratio to average AUM, excluding service tax on management fees.+ Direct Plan shall have a lower expense ratio excluding distribution expenses, commission, etc.and no commission for distribution of Units will be paid / charged under the Direct Plan.
MARKET CAP ALLOCATION (As on February 28, 2015)
% of NAVEquity and equity related instruments of Mid Cap Companies 88.87
Equity and equity related instruments of Small Cap Companies 5.40
Equity and equity related instruments of Companies other thanMid & Small Cap 3.09
Cash and Money Market / Fixed Income Securities(including MIBOR Linked Short Term Papers & Securitised Debt) 1.60
Mutual Funds 0.70
Derivatives 0.34
Market Cap Range for CNX Midcap StocksAs on Dec. 31, 2014 ` ` ` ` ` 80,668.72 Cr – `̀̀̀̀ 2,898.23 Crs
PORTFOLIO (As on February 28, 2015)
Instrument Industry % of NAVEquity 97.36Eicher Motors Auto 3.90Sadbhav Engineering Construction Project 3.27IndusInd Bank Banks 3.14Tech Mahindra Software 3.11ICICI Bank Banks 3.09Amara Raja Batteries Auto Ancillaries 3.01Motherson Sumi Systems Auto Ancillaries 3.00Yes Bank Banks 2.89Shree Cements Cement 2.76The Federal Bank Banks 2.67Gateway Distriparks Transportation 2.65Aurobindo Pharma Pharmaceuticals 2.59Bharat Forge Industrial Products 2.43Kaveri Seed Company Consumer Non Durables 2.31 (% of NAV)
Britannia Industries Consumer Non Durables 2.22UPL Pesticides 1.98Symphony Consumer Durables 1.97Hindustan Petroleum Corporation Petroleum Products 1.94Divi's Laboratories Pharmaceuticals 1.92Glenmark Pharmaceuticals Pharmaceuticals 1.67JK Cement Cement 1.66ING Vysya Bank Banks 1.65Cummins India Industrial Products 1.64Power Finance Corporation Finance 1.58MRF Auto Ancillaries 1.56Indiabulls Housing Finance Finance 1.54AIA Engineering Industrial Products 1.49SRF Textile Products 1.46Lupin Pharmaceuticals 1.43Aditya Birla Nuvo Services 1.40Orient Cement Cement 1.37Kalpataru Power Transmission Power 1.35National Buildings Construction Corporation Construction 1.34Dynamatic Technologies Auto Ancillaries 1.32Tata Chemicals Chemicals 1.30Finolex Cables Industrial Products 1.27Ramkrishna Forgings Industrial Products 1.27CESC Power 1.18Karur Vysya Bank Banks 1.17Cyient Software 1.16Pidilite Industries Chemicals 1.15NCC Construction Project 1.15Bata India Consumer Durables 1.14SKS Microfinance Finance 1.11Arvind Textile Products 1.03Torrent Pharmaceuticals Pharmaceuticals 1.00Gujarat State Petronet Gas 0.99Mold-Tek Packaging Industrial Products 0.97Voltas Construction Project 0.96Tata Communications Telecom - Services 0.94Transport Corporation of India Transportation 0.93Supreme Infrastructure India Construction Project 0.91Atul Chemicals 0.84D.B.Corp Media & Entertainment 0.83Hindustan Zinc Non - Ferrous Metals 0.81Texmaco Rail & Engineering Industrial Capital Goods 0.78Crompton Greaves Industrial Capital Goods 0.77Bank of Baroda Banks 0.39Derivatives 0.34Bank of Baroda Mar 2015 Stock Futures 0.34Investment Funds/Mutual Funds 0.70Principal Index Fund - Midcap -Direct Plan - Growth Mutual Funds 0.70Cash and Other Assets 1.60Net Assets 100.00
SECTOR ALLOCATION (TOP 10) (As on February 28, 2015)
INVEST KNOWHOW February 201510
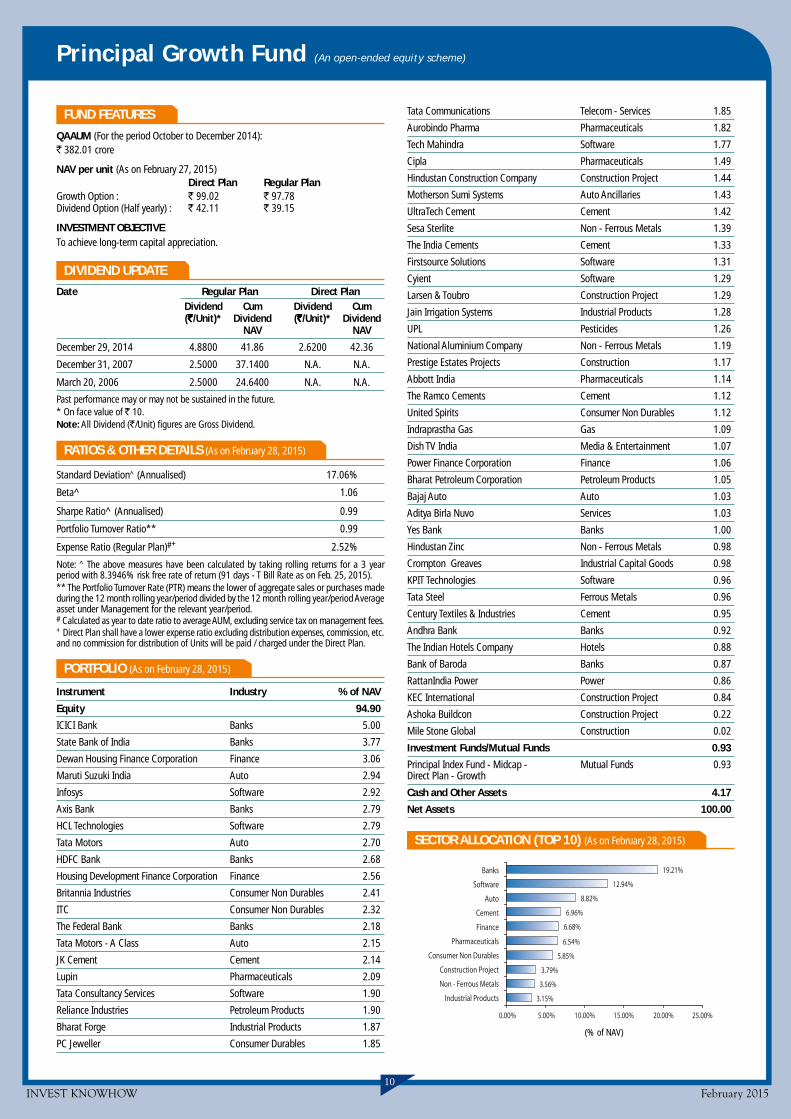
Principal Growth Fund (An open-ended equity scheme)
FUND FEATURES
QAAUM (For the period October to December 2014):` 382.01 crore
NAV per unit (As on February 27, 2015)Direct Plan Regular Plan
Growth Option : ` 99.02 ` 97.78Dividend Option (Half yearly) : ` 42.11 ` 39.15
INVESTMENT OBJECTIVETo achieve long-term capital appreciation.
DIVIDEND UPDATE
Date Regular Plan Direct PlanDividend Cum Dividend Cum(`̀̀̀̀/Unit)* Dividend (`̀̀̀̀/Unit)* Dividend
NAV NAV
December 29, 2014 4.8800 41.86 2.6200 42.36
December 31, 2007 2.5000 37.1400 N.A. N.A.
March 20, 2006 2.5000 24.6400 N.A. N.A.
Past performance may or may not be sustained in the future.* On face value of ` 10.Note: All Dividend (`/Unit) figures are Gross Dividend.
RATIOS & OTHER DETAILS (As on February 28, 2015)
Standard Deviation^ (Annualised) 17.06%
Beta^ 1.06
Sharpe Ratio^ (Annualised) 0.99
Portfolio Turnover Ratio** 0.99
Expense Ratio (Regular Plan)#+ 2.52%
Note: ^ The above measures have been calculated by taking rolling returns for a 3 yearperiod with 8.3946% risk free rate of return (91 days - T Bill Rate as on Feb. 25, 2015).** The Portfolio Turnover Rate (PTR) means the lower of aggregate sales or purchases madeduring the 12 month rolling year/period divided by the 12 month rolling year/period Averageasset under Management for the relevant year/period.# Calculated as year to date ratio to average AUM, excluding service tax on management fees.+ Direct Plan shall have a lower expense ratio excluding distribution expenses, commission, etc.and no commission for distribution of Units will be paid / charged under the Direct Plan.
PORTFOLIO (As on February 28, 2015)
Instrument Industry % of NAV
Equity 94.90
ICICI Bank Banks 5.00
State Bank of India Banks 3.77
Dewan Housing Finance Corporation Finance 3.06
Maruti Suzuki India Auto 2.94
Infosys Software 2.92
Axis Bank Banks 2.79
HCL Technologies Software 2.79
Tata Motors Auto 2.70
HDFC Bank Banks 2.68
Housing Development Finance Corporation Finance 2.56
Britannia Industries Consumer Non Durables 2.41
ITC Consumer Non Durables 2.32
The Federal Bank Banks 2.18
Tata Motors - A Class Auto 2.15
JK Cement Cement 2.14
Lupin Pharmaceuticals 2.09
Tata Consultancy Services Software 1.90
Reliance Industries Petroleum Products 1.90
Bharat Forge Industrial Products 1.87
PC Jeweller Consumer Durables 1.85
19.21%
12.94%
8.82%
6.96%
6.68%
6.54%
5.85%
3.79%
3.56%
3.15%
0.00% 5.00% 10.00% 15.00% 20.00% 25.00%
Banks
Software
Auto
Cement
Finance
Pharmaceuticals
Consumer Non Durables
Construction Project
Non - Ferrous Metals
Industrial Products
(% of NAV)
Tata Communications Telecom - Services 1.85
Aurobindo Pharma Pharmaceuticals 1.82
Tech Mahindra Software 1.77
Cipla Pharmaceuticals 1.49
Hindustan Construction Company Construction Project 1.44
Motherson Sumi Systems Auto Ancillaries 1.43
UltraTech Cement Cement 1.42
Sesa Sterlite Non - Ferrous Metals 1.39
The India Cements Cement 1.33
Firstsource Solutions Software 1.31
Cyient Software 1.29
Larsen & Toubro Construction Project 1.29
Jain Irrigation Systems Industrial Products 1.28
UPL Pesticides 1.26
National Aluminium Company Non - Ferrous Metals 1.19
Prestige Estates Projects Construction 1.17
Abbott India Pharmaceuticals 1.14
The Ramco Cements Cement 1.12
United Spirits Consumer Non Durables 1.12
Indraprastha Gas Gas 1.09
Dish TV India Media & Entertainment 1.07
Power Finance Corporation Finance 1.06
Bharat Petroleum Corporation Petroleum Products 1.05
Bajaj Auto Auto 1.03
Aditya Birla Nuvo Services 1.03
Yes Bank Banks 1.00
Hindustan Zinc Non - Ferrous Metals 0.98
Crompton Greaves Industrial Capital Goods 0.98
KPIT Technologies Software 0.96
Tata Steel Ferrous Metals 0.96
Century Textiles & Industries Cement 0.95
Andhra Bank Banks 0.92
The Indian Hotels Company Hotels 0.88
Bank of Baroda Banks 0.87
RattanIndia Power Power 0.86
KEC International Construction Project 0.84
Ashoka Buildcon Construction Project 0.22
Mile Stone Global Construction 0.02
Investment Funds/Mutual Funds 0.93
Principal Index Fund - Midcap - Mutual Funds 0.93Direct Plan - Growth
Cash and Other Assets 4.17
Net Assets 100.00
SECTOR ALLOCATION (TOP 10) (As on February 28, 2015)
INVEST KNOWHOW February 201511
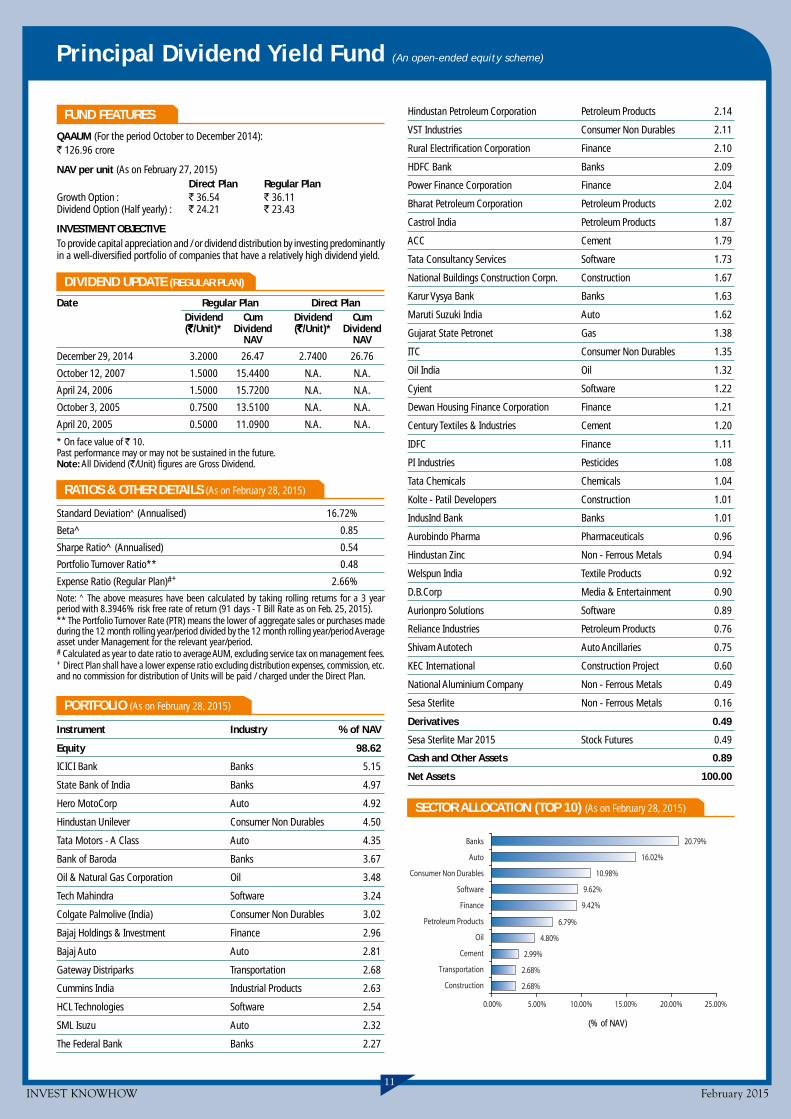
20.79%
16.02%
10.98%
9.62%
9.42%
6.79%
4.80%
2.99%
2.68%
2.68%
0.00% 5.00% 10.00% 15.00% 20.00% 25.00%
Banks
Auto
Consumer Non Durables
Software
Finance
Petroleum Products
Oil
Cement
Transportation
Construction
(% of NAV)
Principal Dividend Yield Fund (An open-ended equity scheme)
Hindustan Petroleum Corporation Petroleum Products 2.14
VST Industries Consumer Non Durables 2.11
Rural Electrification Corporation Finance 2.10
HDFC Bank Banks 2.09
Power Finance Corporation Finance 2.04
Bharat Petroleum Corporation Petroleum Products 2.02
Castrol India Petroleum Products 1.87
ACC Cement 1.79
Tata Consultancy Services Software 1.73
National Buildings Construction Corpn. Construction 1.67
Karur Vysya Bank Banks 1.63
Maruti Suzuki India Auto 1.62
Gujarat State Petronet Gas 1.38
ITC Consumer Non Durables 1.35
Oil India Oil 1.32
Cyient Software 1.22
Dewan Housing Finance Corporation Finance 1.21
Century Textiles & Industries Cement 1.20
IDFC Finance 1.11
PI Industries Pesticides 1.08
Tata Chemicals Chemicals 1.04
Kolte - Patil Developers Construction 1.01
IndusInd Bank Banks 1.01
Aurobindo Pharma Pharmaceuticals 0.96
Hindustan Zinc Non - Ferrous Metals 0.94
Welspun India Textile Products 0.92
D.B.Corp Media & Entertainment 0.90
Aurionpro Solutions Software 0.89
Reliance Industries Petroleum Products 0.76
Shivam Autotech Auto Ancillaries 0.75
KEC International Construction Project 0.60
National Aluminium Company Non - Ferrous Metals 0.49
Sesa Sterlite Non - Ferrous Metals 0.16
Derivatives 0.49
Sesa Sterlite Mar 2015 Stock Futures 0.49
Cash and Other Assets 0.89
Net Assets 100.00
SECTOR ALLOCATION (TOP 10) (As on February 28, 2015)
FUND FEATURES
QAAUM (For the period October to December 2014):` 126.96 crore
NAV per unit (As on February 27, 2015)Direct Plan Regular Plan
Growth Option : ` 36.54 ` 36.11Dividend Option (Half yearly) : ` 24.21 ` 23.43
INVESTMENT OBJECTIVETo provide capital appreciation and / or dividend distribution by investing predominantlyin a well-diversified portfolio of companies that have a relatively high dividend yield.
DIVIDEND UPDATE (REGULAR PLAN)
Date Regular Plan Direct PlanDividend Cum Dividend Cum(`̀̀̀̀/Unit)* Dividend (`̀̀̀̀/Unit)* Dividend
NAV NAV
December 29, 2014 3.2000 26.47 2.7400 26.76
October 12, 2007 1.5000 15.4400 N.A. N.A.
April 24, 2006 1.5000 15.7200 N.A. N.A.
October 3, 2005 0.7500 13.5100 N.A. N.A.
April 20, 2005 0.5000 11.0900 N.A. N.A.
* On face value of ` 10.Past performance may or may not be sustained in the future.Note: All Dividend (`/Unit) figures are Gross Dividend.
RATIOS & OTHER DETAILS (As on February 28, 2015)
Standard Deviation^ (Annualised) 16.72%
Beta^ 0.85
Sharpe Ratio^ (Annualised) 0.54
Portfolio Turnover Ratio** 0.48
Expense Ratio (Regular Plan)#+ 2.66%
Note: ^ The above measures have been calculated by taking rolling returns for a 3 yearperiod with 8.3946% risk free rate of return (91 days - T Bill Rate as on Feb. 25, 2015).** The Portfolio Turnover Rate (PTR) means the lower of aggregate sales or purchases madeduring the 12 month rolling year/period divided by the 12 month rolling year/period Averageasset under Management for the relevant year/period.# Calculated as year to date ratio to average AUM, excluding service tax on management fees.+ Direct Plan shall have a lower expense ratio excluding distribution expenses, commission, etc.and no commission for distribution of Units will be paid / charged under the Direct Plan.
PORTFOLIO (As on February 28, 2015)
Instrument Industry % of NAV
Equity 98.62
ICICI Bank Banks 5.15
State Bank of India Banks 4.97
Hero MotoCorp Auto 4.92
Hindustan Unilever Consumer Non Durables 4.50
Tata Motors - A Class Auto 4.35
Bank of Baroda Banks 3.67
Oil & Natural Gas Corporation Oil 3.48
Tech Mahindra Software 3.24
Colgate Palmolive (India) Consumer Non Durables 3.02
Bajaj Holdings & Investment Finance 2.96
Bajaj Auto Auto 2.81
Gateway Distriparks Transportation 2.68
Cummins India Industrial Products 2.63
HCL Technologies Software 2.54
SML Isuzu Auto 2.32
The Federal Bank Banks 2.27
INVEST KNOWHOW February 201512
Principal Index Fund - Nifty (An open-ended index scheme)
FUND FEATURES
QAAUM (For the period October to December 2014):` 14.09 crore
NAV per unit (As on February 27, 2015)Direct Plan Regular Plan
Growth Option : ` 61.2923 ` 60.7012Dividend Option : ` 36.0209 ` 35.6754
INVESTMENT OBJECTIVETo invest principally in securities that comprise CNX Nifty (NSE) and subject to trackingerrors endeavour to attain results commensurate with the Nifty.
DIVIDEND UPDATE (REGULAR PLAN)
Date Dividend (`̀̀̀̀/Unit)* Cum Dividend NAVDecember 24, 2008 3.7500 15.7934
* On face value of ` 10.Past performance may or may not be sustained in the future.Note: All Dividend (`/Unit) figures are Gross Dividend.
RATIOS & OTHER DETAILS (As on February 28, 2015)
Standard Deviation^ (Annualised) 14.60%
Beta^ 0.99
Sharpe Ratio^ (Annualised) 0.58
Portfolio Turnover Ratio** 0.37
Expense Ratio (Regular Plan)#+ 1.00%
Note: ^ The above measures have been calculated by taking rolling returns for a 3 yearperiod with 8.3946% risk free rate of return (91 days - T Bill Rate as on Feb. 25, 2015).** The Portfolio Turnover Rate (PTR) means the lower of aggregate sales or purchases madeduring the 12 month rolling year/period divided by the 12 month rolling year/period Averageasset under Management for the relevant year/period.# Calculated as year to date ratio to average AUM.+ Direct Plan shall have a lower expense ratio excluding distribution expenses, commission, etc.and no commission for distribution of Units will be paid / charged under the Direct Plan.
TRACKING DEVIATION
0.40%*
* Trailing 12 months ended February 27, 2015 (Annualized).
PORTFOLIO (As on February 28, 2015)
Instrument Industry % of NAV
Equity 99.88
Infosys Software 7.57
Housing Development Finance Corpn. Finance 6.88
HDFC Bank Banks 6.60
ITC Consumer Non Durables 6.59
ICICI Bank Banks 6.57
Larsen & Toubro Construction Project 4.73
Reliance Industries Petroleum Products 4.68
Tata Consultancy Services Software 4.51
Tata Motors Auto 3.49
Axis Bank Banks 3.43
State Bank of India Banks 3.06
Sun Pharmaceuticals Industries Pharmaceuticals 2.24
Hindustan Unilever Consumer Non Durables 2.10
Kotak Mahindra Bank Banks 1.99
Mahindra & Mahindra Auto 1.96
Oil & Natural Gas Corporation Oil 1.88 (% of NAV)
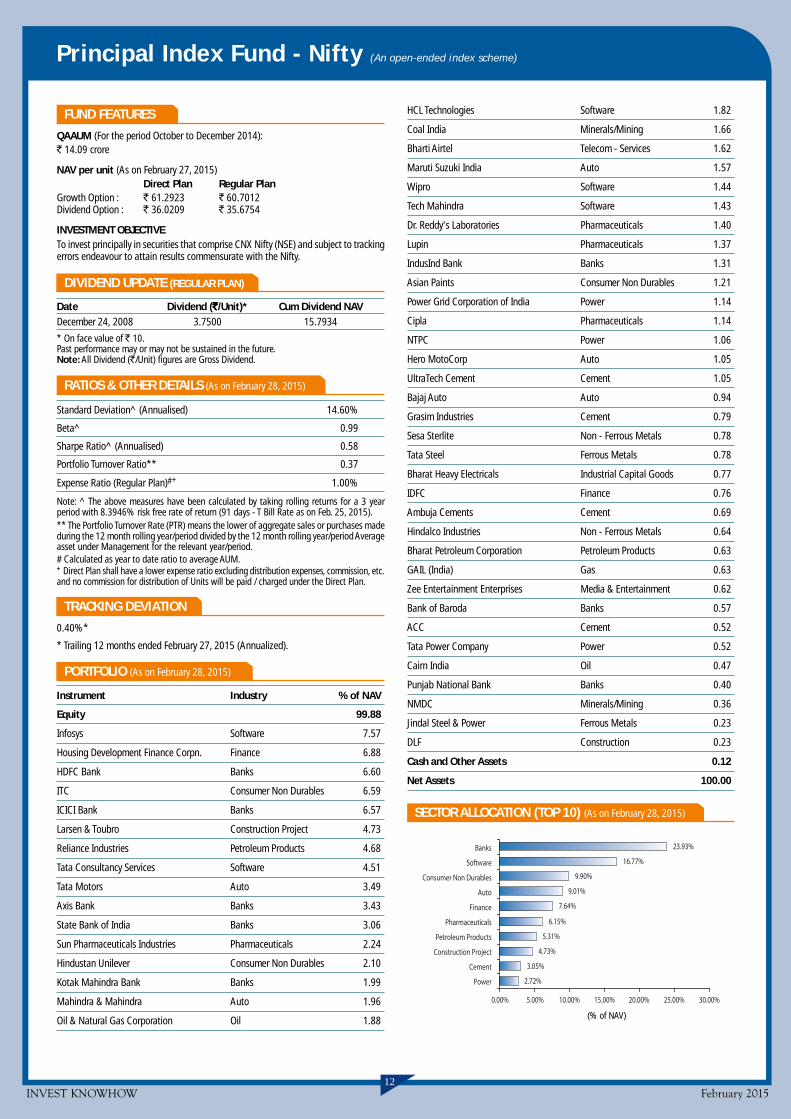
23.93%
16.77%
9.90%
9.01%
7.64%
6.15%
5.31%
4.73%
3.05%
2.72%
0.00% 5.00% 10.00% 15.00% 20.00% 25.00% 30.00%
Banks
Software
Consumer Non Durables
Auto
Finance
Pharmaceuticals
Petroleum Products
Construction Project
Cement
Power
HCL Technologies Software 1.82
Coal India Minerals/Mining 1.66
Bharti Airtel Telecom - Services 1.62
Maruti Suzuki India Auto 1.57
Wipro Software 1.44
Tech Mahindra Software 1.43
Dr. Reddy's Laboratories Pharmaceuticals 1.40
Lupin Pharmaceuticals 1.37
IndusInd Bank Banks 1.31
Asian Paints Consumer Non Durables 1.21
Power Grid Corporation of India Power 1.14
Cipla Pharmaceuticals 1.14
NTPC Power 1.06
Hero MotoCorp Auto 1.05
UltraTech Cement Cement 1.05
Bajaj Auto Auto 0.94
Grasim Industries Cement 0.79
Sesa Sterlite Non - Ferrous Metals 0.78
Tata Steel Ferrous Metals 0.78
Bharat Heavy Electricals Industrial Capital Goods 0.77
IDFC Finance 0.76
Ambuja Cements Cement 0.69
Hindalco Industries Non - Ferrous Metals 0.64
Bharat Petroleum Corporation Petroleum Products 0.63
GAIL (India) Gas 0.63
Zee Entertainment Enterprises Media & Entertainment 0.62
Bank of Baroda Banks 0.57
ACC Cement 0.52
Tata Power Company Power 0.52
Cairn India Oil 0.47
Punjab National Bank Banks 0.40
NMDC Minerals/Mining 0.36
Jindal Steel & Power Ferrous Metals 0.23
DLF Construction 0.23
Cash and Other Assets 0.12
Net Assets 100.00
SECTOR ALLOCATION (TOP 10) (As on February 28, 2015)

INVEST KNOWHOW February 201513
Principal Index Fund - Midcap (An open-ended index scheme)
FUND FEATURES
QAAUM (For the period October to December 2014):` 12.97 crore
NAV per unit (As on February 27, 2015)Direct Plan Regular Plan
Growth Option : ` 14.4922 ` 14.4312Dividend Option : ` 14.4922 ` 14.4312
INVESTMENT OBJECTIVETo invest principally in securities that comprise CNX Midcap Index and subject to trackingerrors endevour to attain results commensurate with the CNX Midcap Index.
RATIOS & OTHER DETAILS (As on February 28, 2015)
Portfolio Turnover Ratio** 0.65
Expense Ratio (Regular Plan)#+ 1.00%
** The Portfolio Turnover Rate (PTR) means the lower of aggregate sales or purchases madeduring the 12 month rolling year/period divided by the 12 month rolling year/period Averageasset under Management for the relevant year/period.# Calculated as year to date ratio to average AUM.+ Direct Plan shall have a lower expense ratio excluding distribution expenses, commission, etc.and no commission for distribution of Units will be paid / charged under the Direct Plan.
PORTFOLIO (As on February 28, 2015)
Instrument Industry % of NAV
Equity 99.64Eicher Motors Auto 2.58Bharti Infratel Telecom - Equipment & Accessories 2.56Indiabulls Housing Finance Finance 2.55Bharat Forge Industrial Products 2.49Aurobindo Pharma Pharmaceuticals 2.31Motherson Sumi Systems Auto Ancillaries 2.20UPL Pesticides 2.00Britannia Industries Consumer Non Durables 1.97Siemens Industrial Capital Goods 1.91Container Corporation of India Transportation 1.84Glenmark Pharmaceuticals Pharmaceuticals 1.77Divi's Laboratories Pharmaceuticals 1.74MRF Auto Ancillaries 1.68Power Finance Corporation Finance 1.68Hindustan Petroleum Corporation Petroleum Products 1.64Apollo Hospitals Enterprise Healthcare Services 1.60Ashok Leyland Auto 1.57Aditya Birla Nuvo Services 1.49Shree Cements Cement 1.46Pidilite Industries Chemicals 1.38Bajaj Finserv Finance 1.33Indian Oil Corporation Petroleum Products 1.33Exide Industries Auto Ancillaries 1.32MindTree Software 1.28Tata Chemicals Chemicals 1.27Cadila Healthcare Pharmaceuticals 1.27Bajaj Finance Finance 1.21Bharat Electronics Industrial Capital Goods 1.19ABB India Industrial Capital Goods 1.18Steel Authority of India Ferrous Metals 1.16Crompton Greaves Industrial Capital Goods 1.16Piramal Enterprises Pharmaceuticals 1.16Amara Raja Batteries Auto Ancillaries 1.15Oracle Financial Services Software Software 1.12Oil India Oil 1.12Karur Vysya Bank Banks 1.11Mahindra & Mahindra Financial Services Finance 1.08GlaxoSmithKline Consumer Healthcare Consumer Non Durables 1.07United Breweries Consumer Non Durables 1.06Procter & Gamble Hygiene and Health Care Consumer Non Durables 1.05Reliance Infrastructure Power 1.03Havells India Consumer Durables 1.03Tata Global Beverages Consumer Non Durables 0.99Emami Consumer Non Durables 0.95Canara Bank Banks 0.95
(% of NAV)
12.00%
11.40%
9.03%
7.15%
6.64%
6.23%
5.01%
4.45%
4.11%
3.25%
0.00% 2.00% 4.00% 6.00% 8.00% 10.00% 12.00% 14.00%
Finance
Pharmaceuticals
Consumer Non Durables
Auto Ancillaries
Banks
Industrial Capital Goods
Auto
Software
Power
Cement
Voltas Construction Project 0.93Max India Finance 0.93The Indian Hotels Company Hotels 0.90Jubilant Foodworks Consumer Non Durables 0.88Petronet LNG Gas 0.86TVS Motor Company Auto 0.86Torrent Pharmaceuticals Pharmaceuticals 0.83Reliance Capital Finance 0.82Bank of India Banks 0.80Apollo Tyres Auto Ancillaries 0.80CRISIL Finance 0.79Thermax Industrial Capital Goods 0.79JSW Energy Power 0.76SKS Microfinance Finance 0.73The Ramco Cements Cement 0.73IPCA Laboratories Pharmaceuticals 0.71Reliance Power Power 0.70Union Bank of India Banks 0.69Hindustan Zinc Non - Ferrous Metals 0.66Sun TV Network Media & Entertainment 0.64CESC Power 0.64Strides Arcolab Pharmaceuticals 0.63Bata India Consumer Durables 0.62Kansai Nerolac Paints Consumer Non Durables 0.61The Great Eastern Shipping Company Transportation 0.60Jaiprakash Associates Cement 0.59The South Indian Bank Banks 0.59Just Dial Software 0.55Gujarat State Petronet Gas 0.54IRB Infrastructure Developers Construction 0.53NHPC Power 0.53KPIT Technologies Software 0.52Housing Development and Infrastructure Construction 0.50Biocon Pharmaceuticals 0.50MphasiS Software 0.50Indraprastha Gas Gas 0.49Sanofi India Pharmaceuticals 0.48CMC Software 0.48Unitech Construction 0.47Century Textiles & Industries Cement 0.47Oriental Bank of Commerce Banks 0.47L&T Finance Holdings Finance 0.46GMR Infrastructure Construction Project 0.46Tata Communications Telecom - Services 0.45Torrent Power Power 0.45Godrej Industries Consumer Non Durables 0.45IDBI Bank Banks 0.44IFCI Finance 0.42The Jammu & Kashmir Bank Banks 0.41The Karnataka Bank Banks 0.40Allahabad Bank Banks 0.39Syndicate Bank Banks 0.39Jain Irrigation Systems Industrial Products 0.36TV18 Broadcast Media & Entertainment 0.33Bhushan Steel Ferrous Metals 0.12Cash and Other Assets 0.36Net Assets 100.00
SECTOR ALLOCATION (TOP 10) (As on February 28, 2015)
INVEST KNOWHOW February 201514
Principal SMART Equity Fund (An open-ended equity scheme)
Motherson Sumi Systems Auto Ancillaries 0.97
Yes Bank Banks 0.90
Indraprastha Gas Gas 0.79
Crompton Greaves Industrial Capital Goods 0.79
Adani Ports and Special Economic Zone Transportation 0.77
ING Vysya Bank Banks 0.75
Abbott India Pharmaceuticals 0.73
UltraTech Cement Cement 0.72
Asian Paints Consumer Non Durables 0.64
The Federal Bank Banks 0.63
Aditya Birla Nuvo Services 0.59
IDFC Finance 0.56
Colgate Palmolive (India) Consumer Non Durables 0.54
Dish TV India Media & Entertainment 0.53
National Aluminium Company Non - Ferrous Metals 0.50
Hexaware Technologies Software 0.48
Tata Consultancy Services Software 0.46
Tata Motors - A Class Auto 0.42
D.B.Corp Media & Entertainment 0.42
Tata Communications Telecom - Services 0.40
Birla Corporation Cement 0.27
Bosch Auto Ancillaries 0.26
The Indian Hotels Company Hotels 0.26
The Ramco Cements Cement 0.23
Nestle India Consumer Non Durables 0.23
Dewan Housing Finance Corpn. Finance 0.16
Coromandel International Fertilisers 0.05
Cash Future Arbitrage 34.05 -34.35Tata Consultancy Services Software 1.49
Tata Consultancy Services Mar 2015 Stock Futures -1.50
State Bank of India Banks 2.47
State Bank of India Mar 2015 Stock Futures -2.48
HDFC Bank Banks 6.80
HDFC Bank Mar 2015 Stock Futures -6.88
Reliance Industries Petroleum Products 7.44
Reliance Industries Mar 2015 Stock Futures -7.51
Maruti Suzuki India Auto 7.46
Maruti Suzuki India Mar 2015 Stock Futures -7.51
Lupin Pharmaceuticals 8.40
Lupin Mar 2015 Stock Futures -8.46
Commercial Paper 14.36Cox & Kings A1+ 13.08
Edelweiss Financial Services A1+ 1.28
Cash and Other Assets 4.03Net Assets 100.00
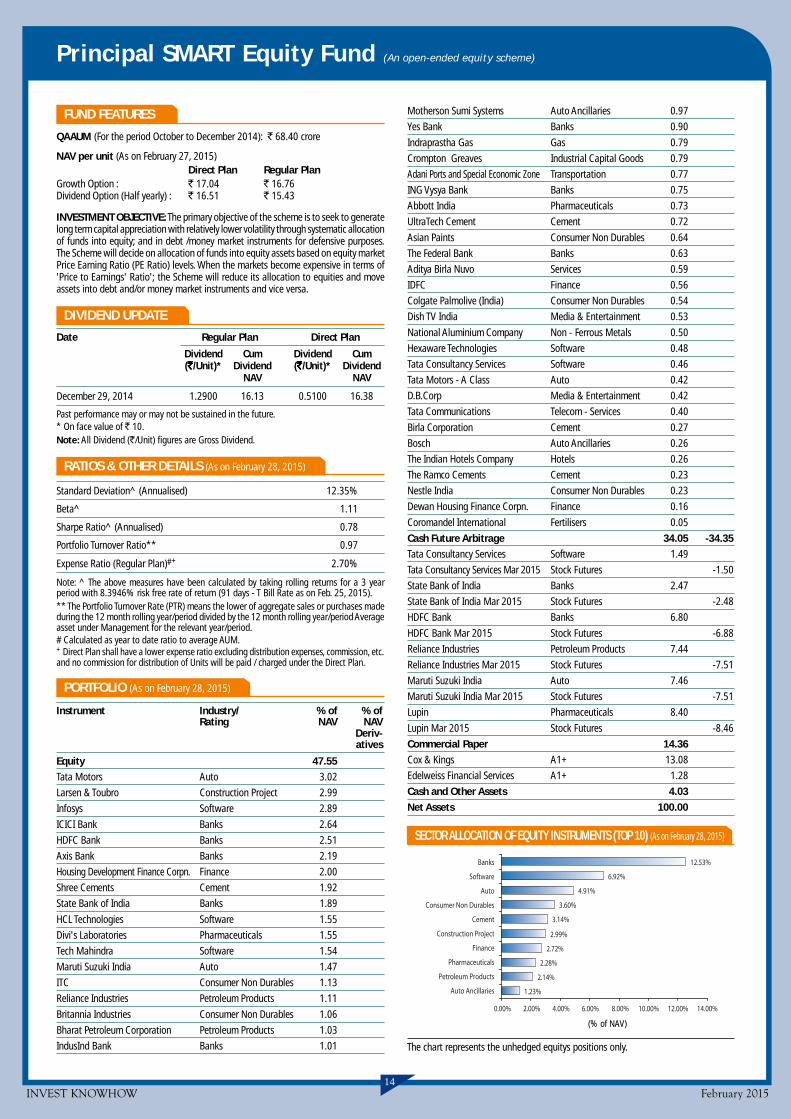
SECTOR ALLOCATION OF EQUITY INSTRUMENTS (TOP 10) (As on February 28, 2015)
FUND FEATURES
QAAUM (For the period October to December 2014): ` 68.40 crore
NAV per unit (As on February 27, 2015)Direct Plan Regular Plan
Growth Option : ` 17.04 ` 16.76Dividend Option (Half yearly) : ` 16.51 ` 15.43
INVESTMENT OBJECTIVE: The primary objective of the scheme is to seek to generatelong term capital appreciation with relatively lower volatility through systematic allocationof funds into equity; and in debt /money market instruments for defensive purposes.The Scheme will decide on allocation of funds into equity assets based on equity marketPrice Earning Ratio (PE Ratio) levels. When the markets become expensive in terms of'Price to Earnings' Ratio'; the Scheme will reduce its allocation to equities and moveassets into debt and/or money market instruments and vice versa.
DIVIDEND UPDATE
Date Regular Plan Direct Plan
Dividend Cum Dividend Cum(`̀̀̀̀/Unit)* Dividend (`̀̀̀̀/Unit)* Dividend
NAV NAV
December 29, 2014 1.2900 16.13 0.5100 16.38
Past performance may or may not be sustained in the future.* On face value of ` 10.Note: All Dividend (`/Unit) figures are Gross Dividend.
RATIOS & OTHER DETAILS (As on February 28, 2015)
Standard Deviation^ (Annualised) 12.35%
Beta^ 1.11
Sharpe Ratio^ (Annualised) 0.78
Portfolio Turnover Ratio** 0.97
Expense Ratio (Regular Plan)#+ 2.70%
Note: ^ The above measures have been calculated by taking rolling returns for a 3 yearperiod with 8.3946% risk free rate of return (91 days - T Bill Rate as on Feb. 25, 2015).** The Portfolio Turnover Rate (PTR) means the lower of aggregate sales or purchases madeduring the 12 month rolling year/period divided by the 12 month rolling year/period Averageasset under Management for the relevant year/period.# Calculated as year to date ratio to average AUM.+ Direct Plan shall have a lower expense ratio excluding distribution expenses, commission, etc.and no commission for distribution of Units will be paid / charged under the Direct Plan.
PORTFOLIO (As on February 28, 2015)
Instrument Industry/ % of % ofRating NAV NAV
Deriv-atives
Equity 47.55Tata Motors Auto 3.02
Larsen & Toubro Construction Project 2.99
Infosys Software 2.89
ICICI Bank Banks 2.64
HDFC Bank Banks 2.51
Axis Bank Banks 2.19
Housing Development Finance Corpn. Finance 2.00
Shree Cements Cement 1.92
State Bank of India Banks 1.89
HCL Technologies Software 1.55
Divi's Laboratories Pharmaceuticals 1.55
Tech Mahindra Software 1.54
Maruti Suzuki India Auto 1.47
ITC Consumer Non Durables 1.13
Reliance Industries Petroleum Products 1.11
Britannia Industries Consumer Non Durables 1.06
Bharat Petroleum Corporation Petroleum Products 1.03
IndusInd Bank Banks 1.01
(% of NAV)
12.53%
6.92%
4.91%
3.60%
3.14%
2.99%
2.72%
2.28%
2.14%
1.23%
0.00% 2.00% 4.00% 6.00% 8.00% 10.00% 12.00% 14.00%
Banks
Software
Auto
Consumer Non Durables
Cement
Construction Project
Finance
Pharmaceuticals
Petroleum Products
Auto Ancillaries
The chart represents the unhedged equitys positions only.
INVEST KNOWHOW February 201515
Principal Personal Tax Saver Fund (An open-ended equity linked savings scheme)
FUND FEATURES
QAAUM (For the period October to December 2014):` 371.89 crore
NAV per unit (As on February 27, 2015)Direct Plan : ` 160.79Regular Plan : ` 158.86
INVESTMENT OBJECTIVETo provide long term growth of capital. The Investment Manager will aim to achieve areturn on assets in excess of the performance of S&P BSE 100 Index.
DIVIDEND UPDATE (REGULAR PLAN)
Date Dividend (`̀̀̀̀/Unit)* Cum Dividend NAVMarch 25, 2008 40.0000 124.66
February 26, 2008 20.0000 172.57
December 31, 2007 11.0000 221.26
October 30, 2007 11.0000 190.53
March 13, 2006 10.0000 118.96
November 2, 2005 40.0000 124.43
* On face value of ` 10.Past performance may or may not be sustained in the future.Note: All Dividend (`/Unit) figures are Gross Dividend.
RATIOS & OTHER DETAILS (As on February 28, 2015)
Standard Deviation^ (Annualised) 15.03%
Beta^ 0.95
Sharpe Ratio^ (Annualised) 0.83
Portfolio Turnover Ratio** 0.74
Expense Ratio (Regular Plan)#+ 2.52%
Note: ^ The above measures have been calculated by taking rolling returns for a 3 yearperiod with 8.3946% risk free rate of return (91 days - T Bill Rate as on Feb. 25, 2015).** The Portfolio Turnover Rate (PTR) means the lower of aggregate sales or purchases madeduring the 12 month rolling year/period divided by the 12 month rolling year/period Averageasset under Management for the relevant year/period.# Calculated as year to date ratio to average AUM, excluding service tax on management fees.+ Direct Plan shall have a lower expense ratio excluding distribution expenses, commission, etc.and no commission for distribution of Units will be paid / charged under the Direct Plan.
PORTFOLIO (As on February 28, 2015)
Instrument Industry % of NAV
Equity 97.27
Tata Motors Auto 6.17
Larsen & Toubro Construction Project 6.12
Infosys Software 5.91
ICICI Bank Banks 5.40
HDFC Bank Banks 5.11
Axis Bank Banks 4.49
Housing Development Finance Corpn. Finance 4.10
Shree Cements Cement 3.93
State Bank of India Banks 3.88
HCL Technologies Software 3.18
Divi's Laboratories Pharmaceuticals 3.16
Tech Mahindra Software 3.16
Maruti Suzuki India Auto 3.00
ITC Consumer Non Durables 2.31
Reliance Industries Petroleum Products 2.27
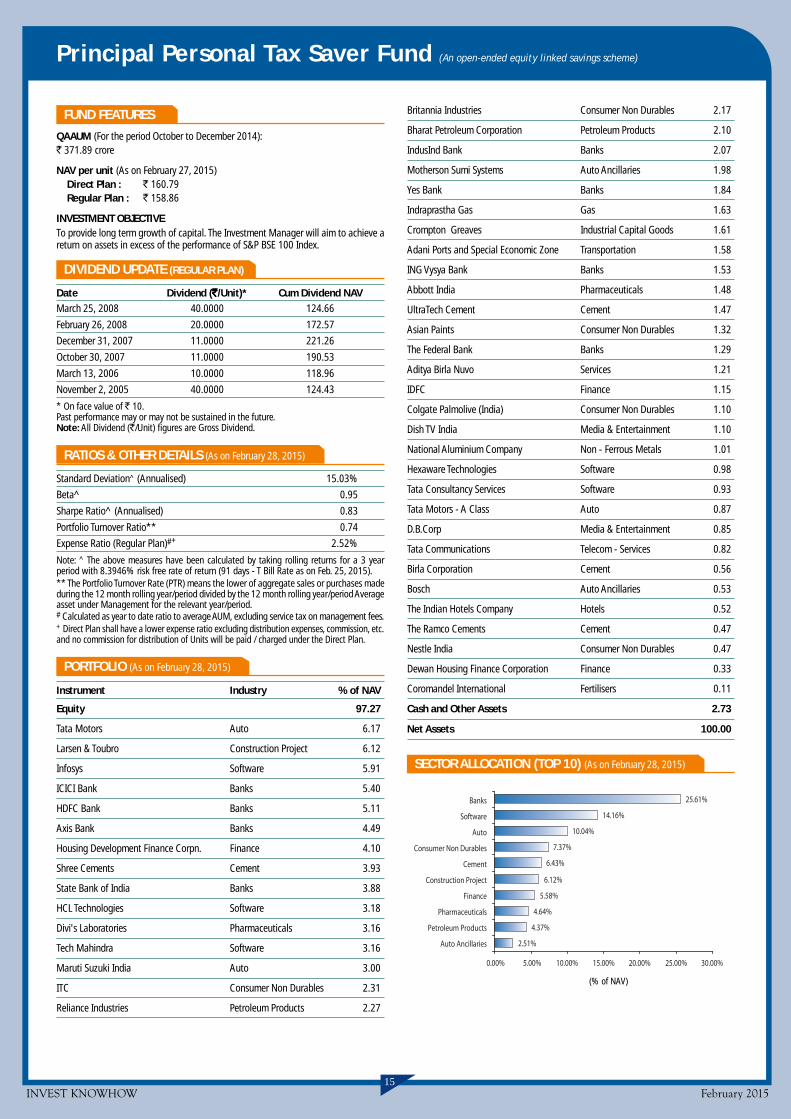
25.61%
14.16%
10.04%
7.37%
6.43%
6.12%
5.58%
4.64%
4.37%
2.51%
0.00% 5.00% 10.00% 15.00% 20.00% 25.00% 30.00%
Banks
Software
Auto
Consumer Non Durables
Cement
Construction Project
Finance
Pharmaceuticals
Petroleum Products
Auto Ancillaries
(% of NAV)
Britannia Industries Consumer Non Durables 2.17
Bharat Petroleum Corporation Petroleum Products 2.10
IndusInd Bank Banks 2.07
Motherson Sumi Systems Auto Ancillaries 1.98
Yes Bank Banks 1.84
Indraprastha Gas Gas 1.63
Crompton Greaves Industrial Capital Goods 1.61
Adani Ports and Special Economic Zone Transportation 1.58
ING Vysya Bank Banks 1.53
Abbott India Pharmaceuticals 1.48
UltraTech Cement Cement 1.47
Asian Paints Consumer Non Durables 1.32
The Federal Bank Banks 1.29
Aditya Birla Nuvo Services 1.21
IDFC Finance 1.15
Colgate Palmolive (India) Consumer Non Durables 1.10
Dish TV India Media & Entertainment 1.10
National Aluminium Company Non - Ferrous Metals 1.01
Hexaware Technologies Software 0.98
Tata Consultancy Services Software 0.93
Tata Motors - A Class Auto 0.87
D.B.Corp Media & Entertainment 0.85
Tata Communications Telecom - Services 0.82
Birla Corporation Cement 0.56
Bosch Auto Ancillaries 0.53
The Indian Hotels Company Hotels 0.52
The Ramco Cements Cement 0.47
Nestle India Consumer Non Durables 0.47
Dewan Housing Finance Corporation Finance 0.33
Coromandel International Fertilisers 0.11
Cash and Other Assets 2.73
Net Assets 100.00
SECTOR ALLOCATION (TOP 10) (As on February 28, 2015)
INVEST KNOWHOW February 201516
Principal Tax Savings Fund (An open-ended equity linked savings scheme)
FUND FEATURES
QAAUM (For the period October to December 2014):` 261.10 crore
NAV per unit (As on February 27, 2015)Direct Plan : ` 145.80Regular Plan : ` 144.27
INVESTMENT OBJECTIVETo build a high quality growth-oriented portfolio to provide long-term capital gains tothe investors. The scheme aims at providing returns through capital appreciation.
DIVIDEND UPDATE (REGULAR PLAN)
Date Dividend (`̀̀̀̀/Unit)* Cum Dividend NAV
November 30, 2008 8.0000 90.1200
January 15, 2007 5.0000 83.6600
* On face value of ` 10.Past performance may or may not be sustained in the future.Note: All Dividend (`/Unit) figures are Gross Dividend.
RATIOS & OTHER DETAILS (As on February 28, 2015)
Standard Deviation^ (Annualised) 17.07%
Beta^ 1.06
Sharpe Ratio^ (Annualised) 1.01
Portfolio Turnover Ratio** 0.98
Expense Ratio (Regular Plan)#+ 2.55%
Note: ^ The above measures have been calculated by taking rolling returns for a 3 yearperiod with 8.3946% risk free rate of return (91 days - T Bill Rate as on Feb. 25, 2015).** The Portfolio Turnover Rate (PTR) means the lower of aggregate sales or purchases madeduring the 12 month rolling year/period divided by the 12 month rolling year/period Averageasset under Management for the relevant year/period.# Calculated as year to date ratio to average AUM, excluding service tax on management fees.+ Direct Plan shall have a lower expense ratio excluding distribution expenses, commission, etc.and no commission for distribution of Units will be paid / charged under the Direct Plan.
PORTFOLIO (As on February 28, 2015)
Instrument Industry % of NAV
Equity 95.48
ICICI Bank Banks 5.03
State Bank of India Banks 3.80
Dewan Housing Finance Corporation Finance 3.07
Maruti Suzuki India Auto 2.95
Infosys Software 2.94
Axis Bank Banks 2.81
HCL Technologies Software 2.81
Tata Motors Auto 2.71
HDFC Bank Banks 2.70
Housing Development Finance Corporation Finance 2.57
Britannia Industries Consumer Non Durables 2.43
ITC Consumer Non Durables 2.34
The Federal Bank Banks 2.19
Tata Motors - A Class Auto 2.17
JK Cement Cement 2.16
Lupin Pharmaceuticals 2.10
PC Jeweller Consumer Durables 1.94
Reliance Industries Petroleum Products 1.92
Bharat Forge Industrial Products 1.87
Tata Consultancy Services Software 1.86
Tata Communications Telecom - Services 1.86
Aurobindo Pharma Pharmaceuticals 1.84
Tech Mahindra Software 1.79
Cipla Pharmaceuticals 1.50
Hindustan Construction Company Construction Project 1.45
Motherson Sumi Systems Auto Ancillaries 1.44
UltraTech Cement Cement 1.43
Sesa Sterlite Non - Ferrous Metals 1.39
The India Cements Cement 1.34
Firstsource Solutions Software 1.32
Cyient Software 1.30
Larsen & Toubro Construction Project 1.30
Jain Irrigation Systems Industrial Products 1.28
UPL Pesticides 1.20
National Aluminium Company Non - Ferrous Metals 1.19
Prestige Estates Projects Construction 1.18
Abbott India Pharmaceuticals 1.15
The Ramco Cements Cement 1.13
United Spirits Consumer Non Durables 1.12
Indraprastha Gas Gas 1.10
Dish TV India Media & Entertainment 1.08
Power Finance Corporation Finance 1.06
Bharat Petroleum Corporation Petroleum Products 1.06
Bajaj Auto Auto 1.04
Aditya Birla Nuvo Services 1.04
Yes Bank Banks 1.01
Hindustan Zinc Non - Ferrous Metals 0.99
Crompton Greaves Industrial Capital Goods 0.99
KPIT Technologies Software 0.97
Tata Steel Ferrous Metals 0.97
Century Textiles & Industries Cement 0.96
Andhra Bank Banks 0.93
The Indian Hotels Company Hotels 0.89
Bank of Baroda Banks 0.88
RattanIndia Power Power 0.87
KEC International Construction Project 0.84
Ashoka Buildcon Construction Project 0.22
Cash and Other Assets 4.52
Net Assets 100.00
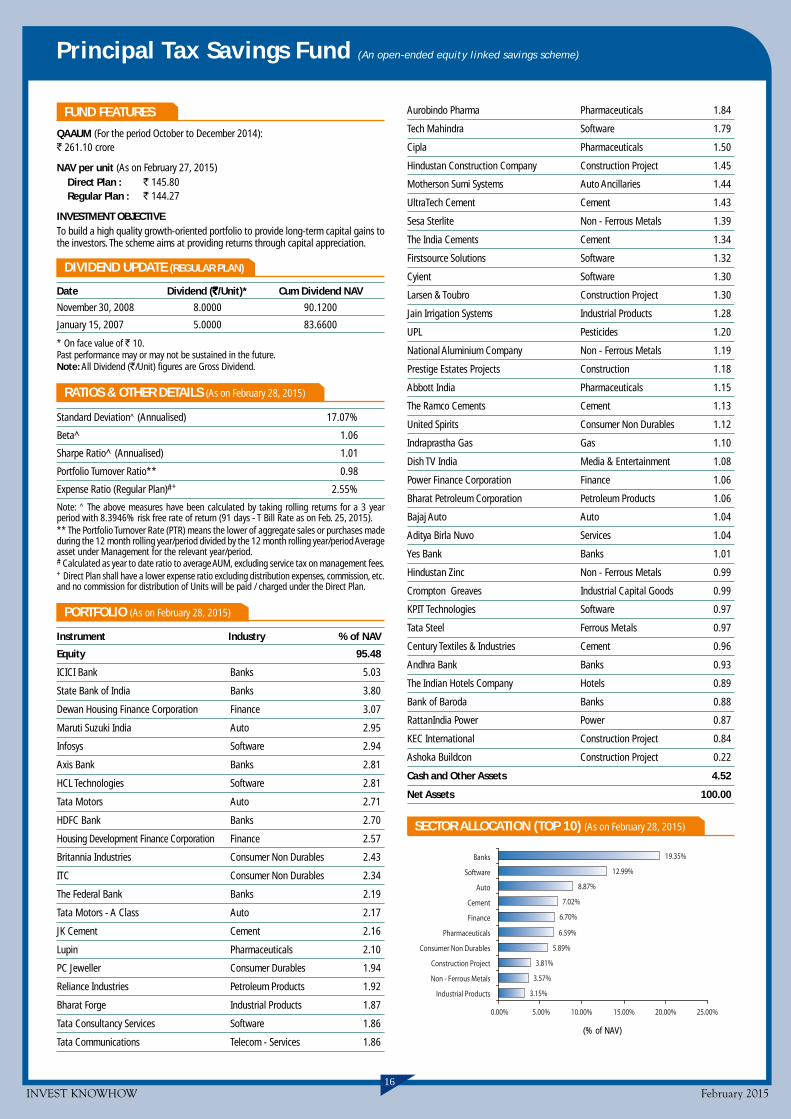
SECTOR ALLOCATION (TOP 10) (As on February 28, 2015)
(% of NAV)
19.35%
12.99%
8.87%
7.02%
6.70%
6.59%
5.89%
3.81%
3.57%
3.15%
0.00% 5.00% 10.00% 15.00% 20.00% 25.00%
Banks
Software
Auto
Cement
Finance
Pharmaceuticals
Consumer Non Durables
Construction Project
Non - Ferrous Metals
Industrial Products
INVEST KNOWHOW February 201517
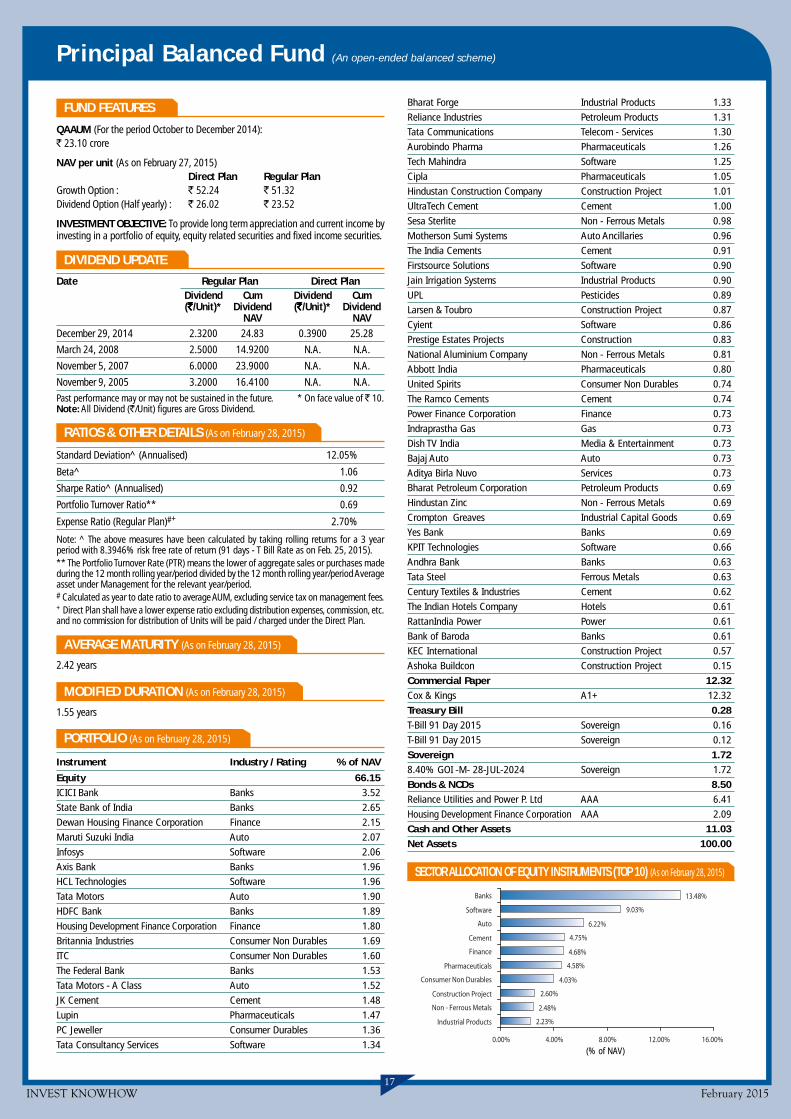
Principal Balanced Fund (An open-ended balanced scheme)
13.48%
9.03%
6.22%
4.75%
4.68%
4.58%
4.03%
2.60%
2.48%
2.23%
0.00% 4.00% 8.00% 12.00% 16.00%
Banks
Software
Auto
Cement
Finance
Pharmaceuticals
Consumer Non Durables
Construction Project
Non - Ferrous Metals
Industrial Products
(% of NAV)
Bharat Forge Industrial Products 1.33
Reliance Industries Petroleum Products 1.31
Tata Communications Telecom - Services 1.30
Aurobindo Pharma Pharmaceuticals 1.26
Tech Mahindra Software 1.25
Cipla Pharmaceuticals 1.05
Hindustan Construction Company Construction Project 1.01
UltraTech Cement Cement 1.00
Sesa Sterlite Non - Ferrous Metals 0.98
Motherson Sumi Systems Auto Ancillaries 0.96
The India Cements Cement 0.91
Firstsource Solutions Software 0.90
Jain Irrigation Systems Industrial Products 0.90
UPL Pesticides 0.89
Larsen & Toubro Construction Project 0.87
Cyient Software 0.86
Prestige Estates Projects Construction 0.83
National Aluminium Company Non - Ferrous Metals 0.81
Abbott India Pharmaceuticals 0.80
United Spirits Consumer Non Durables 0.74
The Ramco Cements Cement 0.74
Power Finance Corporation Finance 0.73
Indraprastha Gas Gas 0.73
Dish TV India Media & Entertainment 0.73
Bajaj Auto Auto 0.73
Aditya Birla Nuvo Services 0.73
Bharat Petroleum Corporation Petroleum Products 0.69
Hindustan Zinc Non - Ferrous Metals 0.69
Crompton Greaves Industrial Capital Goods 0.69
Yes Bank Banks 0.69
KPIT Technologies Software 0.66
Andhra Bank Banks 0.63
Tata Steel Ferrous Metals 0.63
Century Textiles & Industries Cement 0.62
The Indian Hotels Company Hotels 0.61
RattanIndia Power Power 0.61
Bank of Baroda Banks 0.61
KEC International Construction Project 0.57
Ashoka Buildcon Construction Project 0.15
Commercial Paper 12.32
Cox & Kings A1+ 12.32
Treasury Bill 0.28
T-Bill 91 Day 2015 Sovereign 0.16
T-Bill 91 Day 2015 Sovereign 0.12
Sovereign 1.72
8.40% GOI -M- 28-JUL-2024 Sovereign 1.72
Bonds & NCDs 8.50
Reliance Utilities and Power P. Ltd AAA 6.41
Housing Development Finance Corporation AAA 2.09
Cash and Other Assets 11.03
Net Assets 100.00
SECTOR ALLOCATION OF EQUITY INSTRUMENTS (TOP 10) (As on February 28, 2015)
FUND FEATURES
QAAUM (For the period October to December 2014):` 23.10 crore
NAV per unit (As on February 27, 2015)Direct Plan Regular Plan
Growth Option : ` 52.24 ` 51.32Dividend Option (Half yearly) : ` 26.02 ` 23.52
INVESTMENT OBJECTIVE: To provide long term appreciation and current income byinvesting in a portfolio of equity, equity related securities and fixed income securities.
DIVIDEND UPDATE
Date Regular Plan Direct PlanDividend Cum Dividend Cum(`̀̀̀̀/Unit)* Dividend (`̀̀̀̀/Unit)* Dividend
NAV NAVDecember 29, 2014 2.3200 24.83 0.3900 25.28
March 24, 2008 2.5000 14.9200 N.A. N.A.
November 5, 2007 6.0000 23.9000 N.A. N.A.
November 9, 2005 3.2000 16.4100 N.A. N.A.
Past performance may or may not be sustained in the future. * On face value of ` 10.Note: All Dividend (`/Unit) figures are Gross Dividend.
RATIOS & OTHER DETAILS (As on February 28, 2015)
Standard Deviation^ (Annualised) 12.05%
Beta^ 1.06
Sharpe Ratio^ (Annualised) 0.92
Portfolio Turnover Ratio** 0.69
Expense Ratio (Regular Plan)#+ 2.70%
Note: ^ The above measures have been calculated by taking rolling returns for a 3 yearperiod with 8.3946% risk free rate of return (91 days - T Bill Rate as on Feb. 25, 2015).** The Portfolio Turnover Rate (PTR) means the lower of aggregate sales or purchases madeduring the 12 month rolling year/period divided by the 12 month rolling year/period Averageasset under Management for the relevant year/period.# Calculated as year to date ratio to average AUM, excluding service tax on management fees.+ Direct Plan shall have a lower expense ratio excluding distribution expenses, commission, etc.and no commission for distribution of Units will be paid / charged under the Direct Plan.
AVERAGE MATURITY (As on February 28, 2015)
2.42 years
MODIFIED DURATION (As on February 28, 2015)
1.55 years
PORTFOLIO (As on February 28, 2015)
Instrument Industry / Rating % of NAV
Equity 66.15
ICICI Bank Banks 3.52
State Bank of India Banks 2.65
Dewan Housing Finance Corporation Finance 2.15
Maruti Suzuki India Auto 2.07
Infosys Software 2.06
Axis Bank Banks 1.96
HCL Technologies Software 1.96
Tata Motors Auto 1.90
HDFC Bank Banks 1.89
Housing Development Finance Corporation Finance 1.80
Britannia Industries Consumer Non Durables 1.69
ITC Consumer Non Durables 1.60
The Federal Bank Banks 1.53
Tata Motors - A Class Auto 1.52
JK Cement Cement 1.48
Lupin Pharmaceuticals 1.47
PC Jeweller Consumer Durables 1.36
Tata Consultancy Services Software 1.34
INVEST KNOWHOW February 201518
Principal Debt Savings Fund (An open-ended income fund)
- Monthly Income Plan (Monthly Income is not assured and is subject to the availability of distributable surplus.)
PORTFOLIO (As on February 28, 2015)
Instrument Industry/Rating % of NAV
Derivatives 2.20
NIFTY Index Future Mar 2015 Index Futures 2.20
Treasury Bill 2.34
T-Bill 91 Day 2015 Sovereign 1.32
T-Bill 91 Day 2015 Sovereign 1.02
Sovereign 63.94
8.40% GOI -M- 28-JUL-2024 Sovereign 63.94
Bonds & NCDs 22.97
Reliance Utilities and Power P. Ltd AAA 12.74
Rural Electrification Corporation AAA 6.11
LIC Housing Finance AAA 4.12
Investment Funds/Mutual Funds 10.91
Principal Index Fund - Direct - Growth Plan Mutual Funds 10.91
Cash and Other Assets -2.36
Net Assets 100.00
COMPOSITION BY ASSETS (As on February 28, 2015)
Industry / Ratings % of NAV
Sovereign 63.94
Bonds & NCDs 22.97
Investment Funds/Mutual Funds 10.91
Treasury Bill 2.34
Derivatives 2.20
Cash and Other Assets -2.36
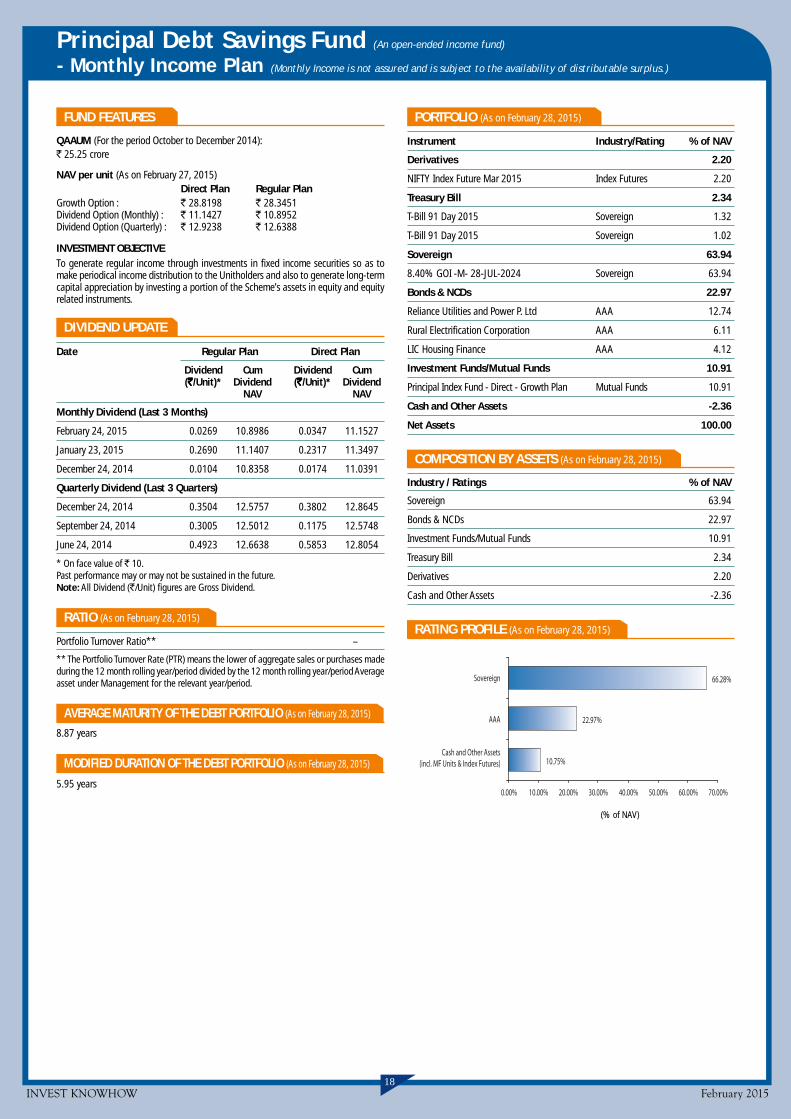
RATING PROFILE (As on February 28, 2015)
FUND FEATURES
QAAUM (For the period October to December 2014):` 25.25 crore
NAV per unit (As on February 27, 2015)Direct Plan Regular Plan
Growth Option : ` 28.8198 ` 28.3451Dividend Option (Monthly) : ` 11.1427 ` 10.8952Dividend Option (Quarterly) : ` 12.9238 ` 12.6388
INVESTMENT OBJECTIVETo generate regular income through investments in fixed income securities so as tomake periodical income distribution to the Unitholders and also to generate long-termcapital appreciation by investing a portion of the Scheme’s assets in equity and equityrelated instruments.
DIVIDEND UPDATE
Date Regular Plan Direct Plan
Dividend Cum Dividend Cum(`̀̀̀̀/Unit)* Dividend (`̀̀̀̀/Unit)* Dividend
NAV NAV
Monthly Dividend (Last 3 Months)
February 24, 2015 0.0269 10.8986 0.0347 11.1527
January 23, 2015 0.2690 11.1407 0.2317 11.3497
December 24, 2014 0.0104 10.8358 0.0174 11.0391
Quarterly Dividend (Last 3 Quarters)
December 24, 2014 0.3504 12.5757 0.3802 12.8645
September 24, 2014 0.3005 12.5012 0.1175 12.5748
June 24, 2014 0.4923 12.6638 0.5853 12.8054
* On face value of ` 10.Past performance may or may not be sustained in the future.Note: All Dividend (`/Unit) figures are Gross Dividend.
RATIO (As on February 28, 2015)
Portfolio Turnover Ratio** –
** The Portfolio Turnover Rate (PTR) means the lower of aggregate sales or purchases madeduring the 12 month rolling year/period divided by the 12 month rolling year/period Averageasset under Management for the relevant year/period.
AVERAGE MATURITY OF THE DEBT PORTFOLIO (As on February 28, 2015)
8.87 years
MODIFIED DURATION OF THE DEBT PORTFOLIO (As on February 28, 2015)
5.95 years
(% of NAV)
66.28%
22.97%
10.75%
0.00% 10.00% 20.00% 30.00% 40.00% 50.00% 60.00% 70.00%
Sovereign
AAA
Cash and Other Assets(incl. MF Units & Index Futures)

INVEST KNOWHOW February 201519
Principal Government Securities Fund(An open-ended dedicated gilt scheme investing in government securities)
PORTFOLIO (As on February 28, 2015)
Instrument Rating % of NAV
Sovereign 97.15
08.30% GOI -M- 31-DEC-2042 Sovereign 24.63
8.32% GOI -M- 02-AUG-2032 Sovereign 21.18
9.20% GOI -M- 30-SEP-2030 Sovereign 18.09
8.24% GOI -M- 15-FEB-2027 Sovereign 12.48
08.83% GOI -M- 25-NOV-2023 Sovereign 10.69
8.60% GOI -M- 02-JUN-2028 Sovereign 5.38
8.28% GOI -M- 21-SEP-2027 Sovereign 4.70
Cash and Other Assets 2.85
Net Assets 100.00
COMPOSITION BY ASSETS (As on February 28, 2015)
Ratings % of NAV
Sovereign 97.15
Cash and Other Assets 2.85
RATING PROFILE (As on February 28, 2015)
FUND FEATURES
QAAUM (For the period October to December 2014):` 46.37 crore
NAV per unit (As on February 27, 2015)Direct Plan Regular Plan
Growth Option : ` 28.2075 ` 27.9051Dividend Option (Quarterly) : ` 12.3074 ` 12.2640Dividend Option (Annual) : ` 14.8886 ` 14.4249
INVESTMENT OBJECTIVETo generate return through investment in sovereign securities and thus provide capitalgains and income distribution to its Unitholders.
DIVIDEND UPDATE
Date Regular Plan Direct Plan
Dividend Cum Dividend Cum(`̀̀̀̀/Unit)* Dividend (`̀̀̀̀/Unit)* Dividend
NAV NAV
Quarterly Dividend Option (Last 3 Quarters)
December 24, 2014 0.7755 12.6199 0.7930 12.6694
September 24, 2014 0.2602 12.0872 0.2747 12.1324
June 24, 2014 0.0717 11.8658 0.1317 11.9551
Annual Dividend Option (Last 3 Years)
September 24, 2014 1.1532 14.2079 1.2578 14.7028
September 24, 2013 0.7559 13.7794 0.4192 13.8300
September 24, 2012 0.8000 14.1275 – –
* On face value of ` 10.Past performance may or may not be sustained in the future.Note: All Dividend (`/Unit) figures are Gross Dividend.
AVERAGE MATURITY (As on February 28, 2015)
17.11 years
MODIFIED DURATION (As on February 28, 2015)
8.52 years
MATURITY PROFILE
Period Portfolio (%)
5 - 10 years 10.69
10 - 15 years 22.56
Above 15 years 63.90
Cash and Other Assets 2.85
97.15%
2.85%
0.00% 20.00% 40.00% 60.00% 80.00% 100.00%
Sovereign
Cash and Other Assets
(% of NAV)
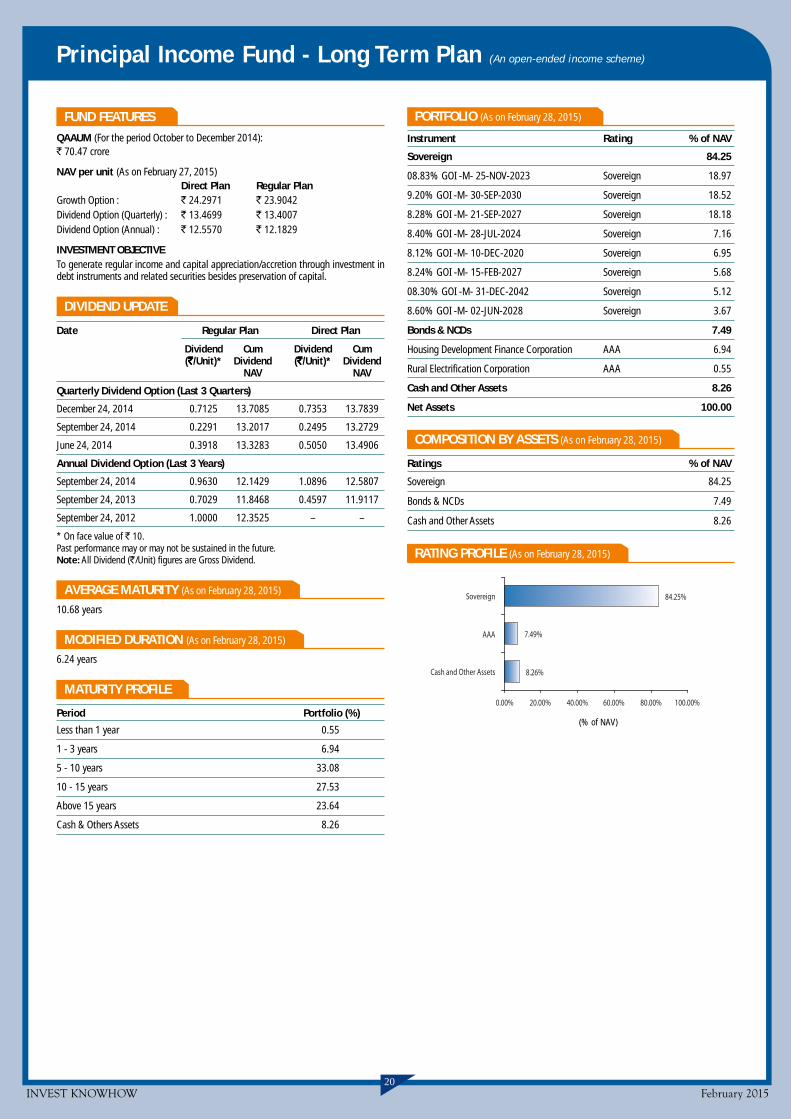
INVEST KNOWHOW February 201520
Principal Income Fund - Long Term Plan (An open-ended income scheme)
PORTFOLIO (As on February 28, 2015)
Instrument Rating % of NAV
Sovereign 84.25
08.83% GOI -M- 25-NOV-2023 Sovereign 18.97
9.20% GOI -M- 30-SEP-2030 Sovereign 18.52
8.28% GOI -M- 21-SEP-2027 Sovereign 18.18
8.40% GOI -M- 28-JUL-2024 Sovereign 7.16
8.12% GOI -M- 10-DEC-2020 Sovereign 6.95
8.24% GOI -M- 15-FEB-2027 Sovereign 5.68
08.30% GOI -M- 31-DEC-2042 Sovereign 5.12
8.60% GOI -M- 02-JUN-2028 Sovereign 3.67
Bonds & NCDs 7.49
Housing Development Finance Corporation AAA 6.94
Rural Electrification Corporation AAA 0.55
Cash and Other Assets 8.26
Net Assets 100.00
COMPOSITION BY ASSETS (As on February 28, 2015)
Ratings % of NAV
Sovereign 84.25
Bonds & NCDs 7.49
Cash and Other Assets 8.26
RATING PROFILE (As on February 28, 2015)
FUND FEATURES
QAAUM (For the period October to December 2014):` 70.47 crore
NAV per unit (As on February 27, 2015)Direct Plan Regular Plan
Growth Option : ` 24.2971 ` 23.9042Dividend Option (Quarterly) : ` 13.4699 ` 13.4007Dividend Option (Annual) : ` 12.5570 ` 12.1829
INVESTMENT OBJECTIVETo generate regular income and capital appreciation/accretion through investment indebt instruments and related securities besides preservation of capital.
DIVIDEND UPDATE
Date Regular Plan Direct Plan
Dividend Cum Dividend Cum(`̀̀̀̀/Unit)* Dividend (`̀̀̀̀/Unit)* Dividend
NAV NAV
Quarterly Dividend Option (Last 3 Quarters)
December 24, 2014 0.7125 13.7085 0.7353 13.7839
September 24, 2014 0.2291 13.2017 0.2495 13.2729
June 24, 2014 0.3918 13.3283 0.5050 13.4906
Annual Dividend Option (Last 3 Years)
September 24, 2014 0.9630 12.1429 1.0896 12.5807
September 24, 2013 0.7029 11.8468 0.4597 11.9117
September 24, 2012 1.0000 12.3525 – –
* On face value of ` 10.Past performance may or may not be sustained in the future.Note: All Dividend (`/Unit) figures are Gross Dividend.
AVERAGE MATURITY (As on February 28, 2015)
10.68 years
MODIFIED DURATION (As on February 28, 2015)
6.24 years
MATURITY PROFILE
Period Portfolio (%)
Less than 1 year 0.55
1 - 3 years 6.94
5 - 10 years 33.08
10 - 15 years 27.53
Above 15 years 23.64
Cash & Others Assets 8.26
84.25%
7.49%
8.26%
0.00% 20.00% 40.00% 60.00% 80.00% 100.00%
Sovereign
AAA
Cash and Other Assets
(% of NAV)

INVEST KNOWHOW February 201521
Principal Debt Opportunities Fund - Corporate Bond Plan(An open-ended debt scheme)
PORTFOLIO (As on February 28, 2015)
Instrument Rating % of NAV
Commercial Paper 75.19
IL&FS Transportation Networks A1 18.39
Edelweiss Financial Services A1+ 18.01
Indostar Capital Finance Private A1+ 10.25
Dewan Housing Finance Corporation A1+ 10.24
HCL Infosystems A1 10.11
Cox & Kings A1+ 8.19
Treasury Bill 0.48
T-Bill 91 Day 2015 Sovereign 0.35
T-Bill 91 Day 2015 Sovereign 0.13
Bonds & NCDs 2.67
Power Finance Corporation AAA 2.17
Cholamandalam Investment andFinance Company AA 0.21
Rural Electrification Corporation AAA 0.21
Power Finance Corporation AAA 0.08
Cash and Other Assets 21.66
Net Assets 100.00
COMPOSITION BY ASSETS (As on February 28, 2015)
Industry / Ratings % of NAV
Commercial Paper 75.19
Bonds & NCDs 2.67
Treasury Bill 0.48
Cash and Other Assets 21.66
RATING PROFILE (As on February 28, 2015)
FUND FEATURES
QAAUM (For the period October to December 2014):
` 105.85 crore
NAV per unit (As on February 27, 2015)Direct Plan Regular Plan
Growth Option : ` 2153.6151 ` 2130.7954Dividend Option (Monthly) : ` 1239.5080 ` 1236.5539
INVESTMENT OBJECTIVEThe primary objective is to generate income and capital gains through investments in aportfolio of securities issued by Private and Public Sector Companies.
DIVIDEND UPDATE
Date Regular Plan Direct Plan
Dividend Cum Dividend Cum(`̀̀̀̀/Unit)* Dividend (`̀̀̀̀/Unit)* Dividend
NAV NAV
Monthly Dividend (Last 3 Months)
February 24, 2015 9.3054 1244.8239 9.4754 1247.9393
January 23, 2015 9.1919 1244.7104 9.4820 1247.9459
December 24, 2014 9.4183 1244.9368 9.6466 1248.1105
* On face value of ` 1,000/-.Past performance may or may not be sustained in the future.All Dividend (`/Unit) figures are Gross Dividend.
AVERAGE MATURITY (As on February 28, 2015)
61 days
MODIFIED DURATION (As on February 28, 2015)
61 days
(% of NAV)
46.69%
28.50%
2.46%
0.21%
21.66%
0.48%
0.00% 10.00% 20.00% 30.00% 40.00% 50.00%
A1+
A1
AAA
Sovereign
AA
Cash and Other Assets

INVEST KNOWHOW February 201522
Principal Income Fund – Short Term Plan (An open-ended income scheme)
FUND FEATURES
QAAUM (For the period October to December 2014):` 104.36 crore
NAV per unit (As on February 27, 2015)Direct Plan Regular Plan
Growth Option : ` 24.6677 ` 24.3105Dividend Option (Monthly) : ` 12.8614 ` 12.8282
INVESTMENT OBJECTIVETo generate regular income and capital appreciation/ accretion through investment indebt instruments and related securities besides preservation of capital and has beendesigned to achieve stable returns over shorter-term investment horizons.
DIVIDEND UPDATE
Date Regular Plan Direct Plan
Dividend Cum Dividend Cum(`̀̀̀̀/Unit)* Dividend (`̀̀̀̀/Unit)* Dividend
NAV NAV
Monthly Dividend (Last 3 Months)
February 24, 2015 0.0593 12.8787 0.0678 12.9196
January 23, 2015 0.1686 12.9880 0.1769 13.0287
December 24, 2014 0.0915 12.9109 0.0996 12.9514
* On face value of ` 10.Past performance may or may not be sustained in the future.Note: All Dividend (`/Unit) figures are Gross Dividend.
AVERAGE MATURITY (As on February 28, 2015)
2.72 years
MODIFIED DURATION (As on February 28, 2015)
2.65 years
PORTFOLIO (As on February 28, 2015)
Instrument Rating % of NAV
Certificate of Deposit 1.66
Bank of India A1+ 0.95
Canara Bank A1+ 0.71
Commercial Paper 17.40
KEC International A1 7.03
IL&FS Transportation Networks A1 6.97
HCL Infosystems A1 3.40
Treasury Bill 1.67
T-Bill 91 DAY 2015 Sovereign 0.85
T-Bill 91 DAY 2015 Sovereign 0.82
32.29%
24.69%
17.40%
3.18%
1.66%
7.07%
13.71%
0.00% 10.00% 20.00% 30.00% 40.00%
AAA
Sovereign
A1
AA+
AA
A1+
Cash and Other Assets
(% of NAV)
Sovereign 23.02
8.27% GOI -M- 09-JUN-2020 Sovereign 14.44
8.12% GOI -M- 10-DEC-2020 Sovereign 3.59
7.28% GOI -M- 03-JUN-2019 Sovereign 3.48
08.83% GOI -M- 25-NOV-2023 Sovereign 1.51
Bonds & NCDs 42.54
Power Grid Corporation of India AAA 10.83
LIC Housing Finance AAA 7.18
Rural Electrification Corporation AAA 7.10
Tata Motors AA+ 7.07
Power Finance Corporation AAA 3.66
IDFC AAA 3.52
Cholamandalam Investment andFinance Company AA 3.18
Cash and Other Assets 13.71
Net Assets 100.00
COMPOSITION BY ASSETS (As on February 28, 2015)
Ratings % of NAV
Bonds & NCDs 42.54
Sovereign 23.02
Commercial Paper 17.40
Treasury Bill 1.67
Certificate of Deposit 1.66
Cash and Other Assets 13.71
RATING PROFILE (As on February 28, 2015)
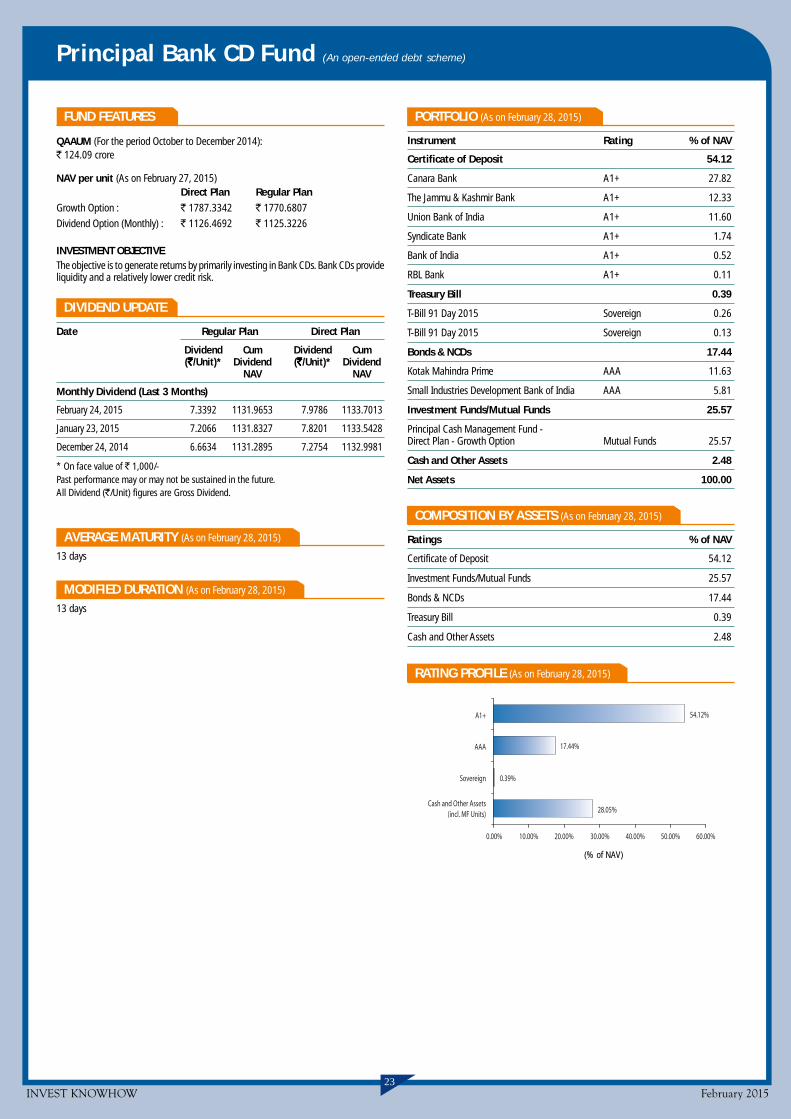
INVEST KNOWHOW February 201523
Principal Bank CD Fund (An open-ended debt scheme)
PORTFOLIO (As on February 28, 2015)
Instrument Rating % of NAV
Certificate of Deposit 54.12
Canara Bank A1+ 27.82
The Jammu & Kashmir Bank A1+ 12.33
Union Bank of India A1+ 11.60
Syndicate Bank A1+ 1.74
Bank of India A1+ 0.52
RBL Bank A1+ 0.11
Treasury Bill 0.39
T-Bill 91 Day 2015 Sovereign 0.26
T-Bill 91 Day 2015 Sovereign 0.13
Bonds & NCDs 17.44
Kotak Mahindra Prime AAA 11.63
Small Industries Development Bank of India AAA 5.81
Investment Funds/Mutual Funds 25.57
Principal Cash Management Fund -Direct Plan - Growth Option Mutual Funds 25.57
Cash and Other Assets 2.48
Net Assets 100.00
COMPOSITION BY ASSETS (As on February 28, 2015)
Ratings % of NAV
Certificate of Deposit 54.12
Investment Funds/Mutual Funds 25.57
Bonds & NCDs 17.44
Treasury Bill 0.39
Cash and Other Assets 2.48
RATING PROFILE (As on February 28, 2015)
FUND FEATURES
QAAUM (For the period October to December 2014):` 124.09 crore
NAV per unit (As on February 27, 2015)Direct Plan Regular Plan
Growth Option : ` 1787.3342 ` 1770.6807
Dividend Option (Monthly) : ` 1126.4692 ` 1125.3226
INVESTMENT OBJECTIVEThe objective is to generate returns by primarily investing in Bank CDs. Bank CDs provideliquidity and a relatively lower credit risk.
DIVIDEND UPDATE
Date Regular Plan Direct Plan
Dividend Cum Dividend Cum(`̀̀̀̀/Unit)* Dividend (`̀̀̀̀/Unit)* Dividend
NAV NAV
Monthly Dividend (Last 3 Months)
February 24, 2015 7.3392 1131.9653 7.9786 1133.7013
January 23, 2015 7.2066 1131.8327 7.8201 1133.5428
December 24, 2014 6.6634 1131.2895 7.2754 1132.9981
* On face value of ` 1,000/-Past performance may or may not be sustained in the future.All Dividend (`/Unit) figures are Gross Dividend.
AVERAGE MATURITY (As on February 28, 2015)
13 days
MODIFIED DURATION (As on February 28, 2015)
13 days
54.12%
17.44%
0.39%
28.05%
0.00% 10.00% 20.00% 30.00% 40.00% 50.00% 60.00%
A1+
AAA
Sovereign
Cash and Other Assets(incl. MF Units)
(% of NAV)
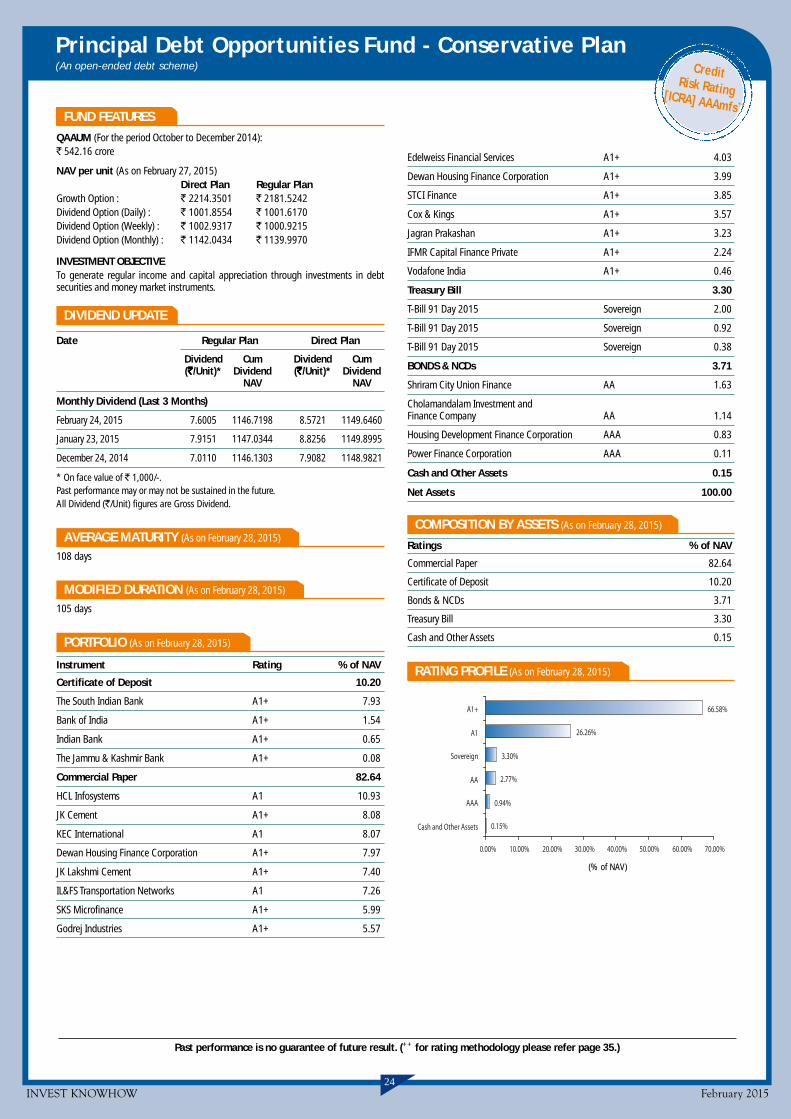
INVEST KNOWHOW February 201524
66.58%
26.26%
3.30%
0.94%
0.15%
2.77%
0.00% 10.00% 20.00% 30.00% 40.00% 50.00% 60.00% 70.00%
A1+
A1
Sovereign
AA
AAA
Cash and Other Assets
Principal Debt Opportunities Fund - Conservative Plan(An open-ended debt scheme)
FUND FEATURES
QAAUM (For the period October to December 2014):` 542.16 crore
NAV per unit (As on February 27, 2015)Direct Plan Regular Plan
Growth Option : ` 2214.3501 ` 2181.5242Dividend Option (Daily) : ` 1001.8554 ` 1001.6170Dividend Option (Weekly) : ` 1002.9317 ` 1000.9215Dividend Option (Monthly) : ` 1142.0434 ` 1139.9970
INVESTMENT OBJECTIVETo generate regular income and capital appreciation through investments in debtsecurities and money market instruments.
DIVIDEND UPDATE
Date Regular Plan Direct Plan
Dividend Cum Dividend Cum(`̀̀̀̀/Unit)* Dividend (`̀̀̀̀/Unit)* Dividend
NAV NAV
Monthly Dividend (Last 3 Months)
February 24, 2015 7.6005 1146.7198 8.5721 1149.6460
January 23, 2015 7.9151 1147.0344 8.8256 1149.8995
December 24, 2014 7.0110 1146.1303 7.9082 1148.9821
* On face value of ` 1,000/-.Past performance may or may not be sustained in the future.All Dividend (`/Unit) figures are Gross Dividend.
AVERAGE MATURITY (As on February 28, 2015)
108 days
MODIFIED DURATION (As on February 28, 2015)
105 days
PORTFOLIO (As on February 28, 2015)
Instrument Rating % of NAV
Certificate of Deposit 10.20
The South Indian Bank A1+ 7.93
Bank of India A1+ 1.54
Indian Bank A1+ 0.65
The Jammu & Kashmir Bank A1+ 0.08
Commercial Paper 82.64
HCL Infosystems A1 10.93
JK Cement A1+ 8.08
KEC International A1 8.07
Dewan Housing Finance Corporation A1+ 7.97
JK Lakshmi Cement A1+ 7.40
IL&FS Transportation Networks A1 7.26
SKS Microfinance A1+ 5.99
Godrej Industries A1+ 5.57
Edelweiss Financial Services A1+ 4.03
Dewan Housing Finance Corporation A1+ 3.99
STCI Finance A1+ 3.85
Cox & Kings A1+ 3.57
Jagran Prakashan A1+ 3.23
IFMR Capital Finance Private A1+ 2.24
Vodafone India A1+ 0.46
Treasury Bill 3.30
T-Bill 91 Day 2015 Sovereign 2.00
T-Bill 91 Day 2015 Sovereign 0.92
T-Bill 91 Day 2015 Sovereign 0.38
BONDS & NCDs 3.71
Shriram City Union Finance AA 1.63
Cholamandalam Investment andFinance Company AA 1.14
Housing Development Finance Corporation AAA 0.83
Power Finance Corporation AAA 0.11
Cash and Other Assets 0.15
Net Assets 100.00
COMPOSITION BY ASSETS (As on February 28, 2015)
Ratings % of NAV
Commercial Paper 82.64
Certificate of Deposit 10.20
Bonds & NCDs 3.71
Treasury Bill 3.30
Cash and Other Assets 0.15
RATING PROFILE (As on February 28, 2015)
(% of NAV)
Past performance is no guarantee of future result. (++ for rating methodology please refer page 35.)
CreditRisk Rating[ICRA] AAAmfs ++

INVEST KNOWHOW February 201525
Principal Cash Management Fund (An open-ended liquid scheme)
91.21%
4.04%
3.56%
1.19%
0.00% 20.00% 40.00% 60.00% 80.00% 100.00%
A1+
Sovereign
A1
Cash and Other Assets
(% of NAV)
CreditRisk Rating[ICRA] A1+mfs ++
Past performance is no guarantee of future result. (++ for rating methodology please refer page 35.)
Small Industries Development Bank of India A1+ 3.76
KEC International A1 3.56
JK Lakshmi Cement A1+ 2.76
Edelweiss Financial Services A1+ 2.16
Religare Housing DevelopmentFinancial Corporation A1+ 2.11
Aditya Birla Finance A1+ 1.98
Au Financiers (India) A1+ 1.98
HSIL A1+ 1.98
Fedbank Financial Services Ltd A1+ 1.97
JK Tyre & Industries A1+ 1.97
Supreme Industries A1+ 1.97
Bilt Graphic Paper Products Ltd A1+ 1.95
Export Import Bank of India A1+ 1.77
Vardhman Special Steels A1+ 1.58
SKS Microfinance A1+ 1.34
KEC International A1+ 0.99
JK Cement A1+ 0.99
TVS Credit Services A1+ 0.99
Avanse Financial Services Ltd A1+ 0.98
Jagran Prakashan A1+ 0.79
Sesa Sterlite A1+ 0.20
Treasury Bill 4.04
T-Bill 91 Day 2015 Sovereign 1.97
T-Bill 91 Day 2015 Sovereign 1.46
T-Bill 91 Day 2015 Sovereign 0.41
T-Bill 364 Day 2015 Sovereign 0.20
Cash and Other Assets 1.19
Net Assets 100.00
COMPOSITION BY ASSETS (As on February 28, 2015)
Ratings % of NAV
Commercial Paper 74.38
Certificate of Deposit 20.39
Treasury Bill 4.04
Cash and Other Assets 1.19
RATING PROFILE (As on February 28, 2015)
FUND FEATURES
QAAUM (For the period October to December 2014):` 1,481.96 crore
NAV per unit (As on February 27, 2015)Direct Plan Regular Plan
Growth Option : ` 1350.2771 ` 1347.6224Dividend Option (Daily) : ` 1000.3870 ` 1000.3037Dividend Option (Weekly) : ` 1007.2174 ` 1006.5018Dividend Option (Monthly) : ` 1023.4546 ` 1023.4324
INVESTMENT OBJECTIVETo provide investors with as high a level of income available from short-term investmentsas is considered consistent with preservation of capital and maintenance of liquidity, byinvesting in a portfolio of money market and investment grade debt instruments.
DIVIDEND UPDATE
Date Regular Plan Direct Plan
Dividend Cum Dividend Cum(`̀̀̀̀/Unit)* Dividend (`̀̀̀̀/Unit)* Dividend
NAV NAV
Monthly Dividend (Last 3 Months)
February 24, 2015 7.5186 1030.243 7.5822 1030.3234
January 23, 2015 7.1332 1029.8576 7.1922 1029.9334
December 24, 2014 7.0823 1029.8067 7.1417 1029.8829
* On face value of ` 1,000/-.Past performance may or may not be sustained in the future.All Dividend (`/Unit) figures are Gross Dividend.
AVERAGE MATURITY (As on February 28, 2015)
21 days
MODIFIED DURATION (As on February 28, 2015)
21 days
PORTFOLIO (As on February 28, 2015)
Instrument Rating % of NAV
Certificate of Deposit 20.39
Canara Bank A1+ 7.93
Dena Bank A1+ 3.91
Bank of India A1+ 1.98
Indian Bank A1+ 1.98
Syndicate Bank A1+ 1.92
Indian Bank A1+ 0.98
Bank of Baroda A1+ 0.98
Bank of Maharashtra A1+ 0.71
Commercial Paper 74.38
Housing Development Finance Corporation A1+ 5.94
CESC A1+ 5.92
ECL Finance A1+ 5.92
Gruh Finance A1+ 5.92
Cox & Kings A1+ 5.00
L&T Housing Finance A1+ 3.95
Tata Motors Finance A1+ 3.95
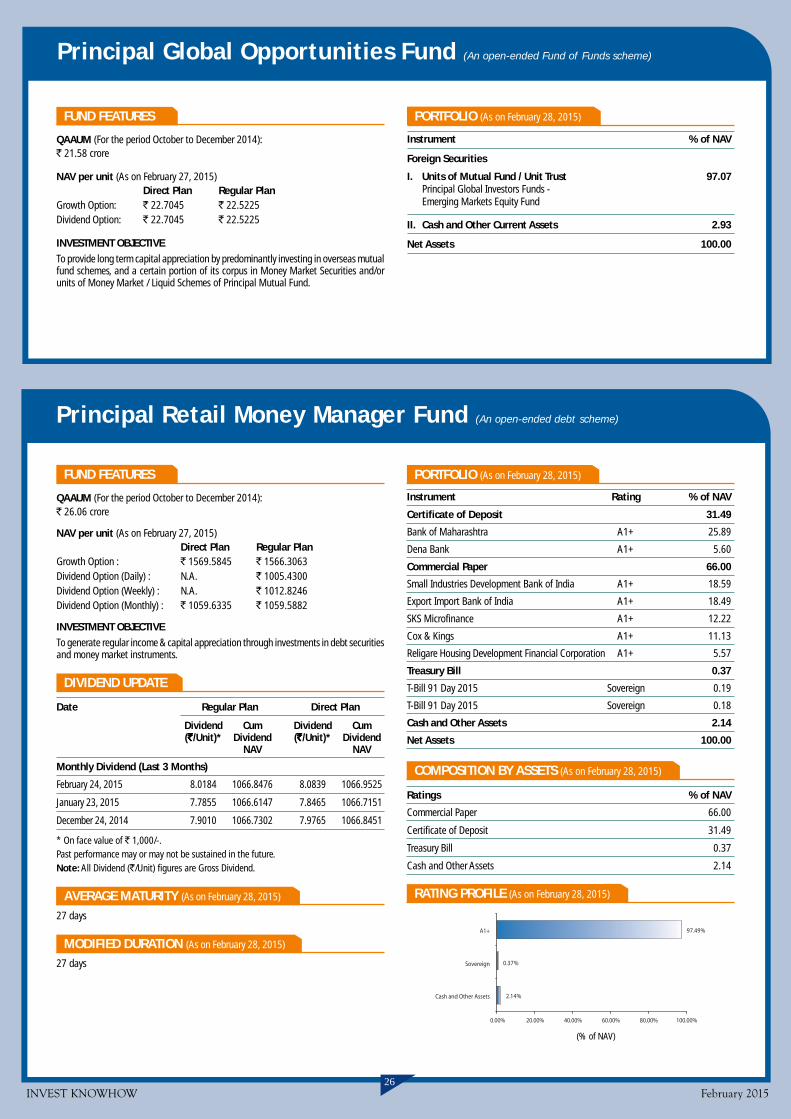
Principal Global Opportunities Fund (An open-ended Fund of Funds scheme)
FUND FEATURES
QAAUM (For the period October to December 2014):` 21.58 crore
NAV per unit (As on February 27, 2015)Direct Plan Regular Plan
Growth Option: ` 22.7045 ` 22.5225Dividend Option: ` 22.7045 ` 22.5225
INVESTMENT OBJECTIVETo provide long term capital appreciation by predominantly investing in overseas mutualfund schemes, and a certain portion of its corpus in Money Market Securities and/orunits of Money Market / Liquid Schemes of Principal Mutual Fund.
PORTFOLIO (As on February 28, 2015)
Instrument % of NAV
Foreign Securities
I. Units of Mutual Fund / Unit Trust 97.07Principal Global Investors Funds -Emerging Markets Equity Fund
II. Cash and Other Current Assets 2.93
Net Assets 100.00
Principal Retail Money Manager Fund (An open-ended debt scheme)
FUND FEATURES
QAAUM (For the period October to December 2014):` 26.06 crore
NAV per unit (As on February 27, 2015)Direct Plan Regular Plan
Growth Option : ` 1569.5845 ` 1566.3063Dividend Option (Daily) : N.A. ` 1005.4300Dividend Option (Weekly) : N.A. ` 1012.8246Dividend Option (Monthly) : ` 1059.6335 ` 1059.5882
INVESTMENT OBJECTIVETo generate regular income & capital appreciation through investments in debt securitiesand money market instruments.
DIVIDEND UPDATE
Date Regular Plan Direct Plan
Dividend Cum Dividend Cum(`̀̀̀̀/Unit)* Dividend (`̀̀̀̀/Unit)* Dividend
NAV NAV
Monthly Dividend (Last 3 Months)
February 24, 2015 8.0184 1066.8476 8.0839 1066.9525
January 23, 2015 7.7855 1066.6147 7.8465 1066.7151
December 24, 2014 7.9010 1066.7302 7.9765 1066.8451
* On face value of ` 1,000/-.Past performance may or may not be sustained in the future.Note: All Dividend (`/Unit) figures are Gross Dividend.
AVERAGE MATURITY (As on February 28, 2015)
27 days
MODIFIED DURATION (As on February 28, 2015)
27 days
97.49%
0.37%
2.14%
0.00% 20.00% 40.00% 60.00% 80.00% 100.00%
A1+
Sovereign
Cash and Other Assets
(% of NAV)
PORTFOLIO (As on February 28, 2015)
Instrument Rating % of NAV
Certificate of Deposit 31.49
Bank of Maharashtra A1+ 25.89
Dena Bank A1+ 5.60
Commercial Paper 66.00
Small Industries Development Bank of India A1+ 18.59
Export Import Bank of India A1+ 18.49
SKS Microfinance A1+ 12.22
Cox & Kings A1+ 11.13
Religare Housing Development Financial Corporation A1+ 5.57
Treasury Bill 0.37
T-Bill 91 Day 2015 Sovereign 0.19
T-Bill 91 Day 2015 Sovereign 0.18
Cash and Other Assets 2.14
Net Assets 100.00
COMPOSITION BY ASSETS (As on February 28, 2015)
Ratings % of NAV
Commercial Paper 66.00
Certificate of Deposit 31.49
Treasury Bill 0.37
Cash and Other Assets 2.14
RATING PROFILE (As on February 28, 2015)
INVEST KNOWHOW February 201526

INVEST KNOWHOW February 201527
Principal Debt Savings Fund (An open-ended income fund)
- Retail Plan
FUND FEATURES
QAAUM (For the period October to December 2014):` 23.05 crore
NAV per unit (As on February 27, 2015)Direct Plan Regular Plan
Growth Plan : ` 24.6957 ` 24.2647Dividend Plan (Monthly) : N.A. ` 10.2588Dividend Plan (Quarterly) : ` 12.1495 ` 12.0628
INVESTMENT OBJECTIVETo seek to generate stable returns and capital appreciation through investment in Debtinstruments and related securities over medium to long term investment horizon.
DIVIDEND UPDATE
Date Regular Plan Direct Plan
Dividend Cum Dividend Cum(`̀̀̀̀/Unit)* Dividend (`̀̀̀̀/Unit)* Dividend
NAV NAV
Monthly Dividend (Last 3 Months)
February 24, 2015 0.0463 10.2933 – –
January 23, 2015 0.1183 10.3653 – –
December 24, 2014 0.0554 10.3024 – –
Quarterly Dividend (Last 3 Quarters)
December 24, 2014 0.2850 12.1430 0.3077 12.2348
September 24, 2014 0.2332 12.0730 0.2557 12.1627
June 24, 2014 0.2491 12.0679 0.2714 12.1556
* On face value of ` 10.Past performance may or may not be sustained in the future.Note: All Dividend (`/Unit) figures are Gross Dividend.
RATIO (As on February 28, 2015)
Portfolio Turnover Ratio** –
** The Portfolio Turnover Rate (PTR) means the lower of aggregate sales or purchases madeduring the 12 month rolling year/period divided by the 12 month rolling year/period Averageasset under Management for the relevant year/period.
AVERAGE MATURITY (As on February 28, 2015)
4.11 years
MODIFIED DURATION (As on February 28, 2015)
2.84 years
PORTFOLIO (As on February 28, 2015)
Instrument Rating % of NAV
Certificate of Deposit 12.06
The Jammu & Kashmir Bank A1+ 12.06
Treasury Bill 2.36
T-Bill 91 Day 2015 Sovereign 1.42
T-Bill 91 Day 2015 Sovereign 0.94
Sovereign 20.03
8.40% GOI -M- 28-JUL-2024 Sovereign 20.03
Bonds & NCDs 42.94
Housing Development Finance Corporation AAA 19.05
Rural Electrification Corporation AAA 14.56
Bajaj Finance AA+ 4.23
Reliance Utilities and Power P. Ltd AAA 2.17
Power Grid Corporation of India AAA 2.09
Lafarge India Pvt. Ltd. AA+ 0.84
Cash and Other Assets 22.61
Net Assets 100.00
COMPOSITION BY ASSETS (As on February 28, 2015)
Industry / Ratings % of NAV
BONDS & NCDs 42.94
Sovereign 20.03
Certificate of Deposit 12.06
Treasury Bill 2.36
Cash and Other Assets 22.61
RATING PROFILE (As on February 28, 2015)
(% of NAV)
37.87%
22.39%
12.06%
22.61%
5.07%
0.00% 10.00% 20.00% 30.00% 40.00%
AAA
Sovereign
A1+
AA+
Cash and Other Assets

INVEST KNOWHOW February 201528
SCHEMES MANAGED BY MR. ANUPAM TIWARI
Returns (As on December 31, 2014)
SCHEMES MANAGED BY MR. RAJAT JAIN
SCHEMES MANAGED BY RUPALI PANDIT
PRINCIPAL LARGE CAP FUND
Performance Scheme Returns Scheme’s Benchmark Additional BenchmarkPlan - Regular Plan - Direct (S&P BSE 100 Index) (CNX Nifty Index)
Date ^Returns (%) $PTP Returns (`) ^Returns (%) $PTP Returns (`) ^Returns (%) $PTP Returns (`) ^Returns (%) $PTP Returns (`)31-Dec-13 to 31-Dec-14 43.43 14342.60 44.19 14418.97 32.28 13228.45 31.39 13138.8031-Dec-12 to 31-Dec-13 3.03 10302.83 N.A. N.A. 5.87 10587.34 6.76 10675.5230-Dec-11 to 31-Dec-12 33.99 13398.78 N.A. N.A. 29.96 12995.80 27.70 12769.72Since Inception 11-Nov-05 to 31-Dec-14 17.99 45380.00 N.A. N.A. 13.68 32283.00 13.76 32498.38Since Inception 02-Jan-13 to 31-Dec-14 N.A. N.A. 21.33 14705.32 17.45 13781.25 17.61 13820.05
PRINCIPAL SMART EQUITY FUND
Performance Scheme Returns Scheme’s Benchmark Additional BenchmarkPlan - Regular Plan - Direct (Crisil Balanced Fund Index) (CNX Nifty Index)
Date ^Returns (%) $PTP Returns (`) ^Returns (%) $PTP Returns (`) ^Returns (%) $PTP Returns (`) ^Returns (%) $PTP Returns (`)31-Dec-13 to 31-Dec-14 34.11 13410.60 35.06 13505.75 25.34 12534.46 31.39 13138.8031-Dec-12 to 31-Dec-13 5.41 10541.01 N.A. N.A 6.05 10604.69 6.76 10675.5230-Dec-11 to 31-Dec-12 30.67 13067.27 N.A. N.A 21.28 12127.97 27.70 12769.72Since Inception 16-Dec-10 to 31-Dec-14 12.67 16200.00 N.A. N.A 8.86 14094.79 8.53 13923.43Since Inception 02-Jan-13 to 31-Dec-14 N.A. N.A. 19.04 14156.63 14.72 13151.17 17.61 13820.05
PRINCIPAL GLOBAL OPPORTUNITIES FUND
Performance Scheme Returns Scheme’s Benchmark Additional BenchmarkPlan - Regular Plan - Direct (MSCI World Index) (CNX Nifty Index)
Date ^Returns (%) $PTP Returns (`) ^Returns (%) $PTP Returns (`) ^Returns (%) $PTP Returns (`) ^Returns (%) $PTP Returns (`)31-Dec-13 to 31-Dec-14 -2.62 9737.94 -2.22 9778.23 7.71 10770.53 31.39 13138.8031-Dec-12 to 31-Dec-13 5.39 10539.24 N.A. N.A 26.25 12625.21 6.76 10675.5230-Dec-11 to 31-Dec-12 21.47 12147.24 N.A. N.A 13.07 11306.68 27.70 12769.72Since Inception 29-Mar-04 to 31-Dec-14 7.69 22195.60 N.A. N.A 4.50 16055.08 15.46 47006.04Since Inception 02-Jan-13 to 31-Dec-14 N.A. N.A. 1.06 10211.59 15.49 13327.27 17.61 13820.05
Past performance may or may not be sustained in future. Since Inception Returns (in %) are calculated on Compounded Annualised Basis.$ PTP (Point to Point) Returns is based on standard investment of ` 10,000/- made at the beginning of relevant period.Performance of the dividend option for the investors would be net of dividend distribution tax, as applicable. ^ Growth Option# As the scheme has not completed one year, the performance/returns for this scheme is not provided
PRINCIPAL INDEX FUND - NIFTY
Performance Scheme Returns Scheme’s Benchmark Additional BenchmarkPlan - Regular Plan - Direct (CNX Nifty Index) (S&P BSE Sensex)
Date ^Returns (%) $PTP Returns (`) ^Returns (%) $PTP Returns (`) ^Returns (%) $PTP Returns (`) ^Returns (%) $PTP Returns (`)31-Dec-13 to 31-Dec-14 31.15 13115.21 31.81 13180.88 31.39 13138.80 29.89 12989.3931-Dec-12 to 31-Dec-13 7.71 10771.15 N.A. N.A 6.76 10675.52 8.98 10897.7230-Dec-11 to 31-Dec-12 27.24 12723.80 N.A. N.A 27.70 12769.72 25.70 12569.92Since Inception 27-Jul-99 to 31-Dec-14 11.92 56923.80 N.A. N.A 12.69 63233.96 12.29 59869.46Since Inception 02-Jan-13 to 31-Dec-14 N.A. N.A. 18.56 14043.82 17.61 13820.05 18.16 13949.01
PRINCIPAL PERSONAL TAX SAVER FUND
Performance Scheme Returns Scheme’s Benchmark Additional BenchmarkPlan - Regular Plan - Direct (S&P BSE 100 Index) (CNX Nifty Index)
Date ^Returns (%) $PTP Returns (`) ^Returns (%) $PTP Returns (`) ^Returns (%) $PTP Returns (`) ^Returns (%) $PTP Returns (`)31-Dec-13 to 31-Dec-14 43.58 14357.97 44.34 14434.16 32.28 13228.45 31.39 13138.8031-Dec-12 to 31-Dec-13 3.32 10332.18 N.A. N.A 5.87 10587.34 6.76 10675.5230-Dec-11 to 31-Dec-12 34.83 13482.62 N.A. N.A 29.96 12995.80 27.70 12769.72Since Inception 31-Mar-96 to 31-Dec-14 22.39 443193.50 N.A. N.A 12.63 93139.88 12.01 84062.72Since Inception 02-Jan-13 to 31-Dec-14 N.A. N.A. 21.52 14750.85 17.45 13781.25 17.61 13820.05
PRINCIPAL INDEX FUND - MIDCAP#
Performance ^Returns (%)
Date Plan - Regular Plan - Direct Scheme’s Benchmark Additional Benchmark(CNX Midcap Index) (CNX Nifty Index)
Since Inception 12-May-14 to 31-Dec-14 N.A. N.A. N.A. N.A.
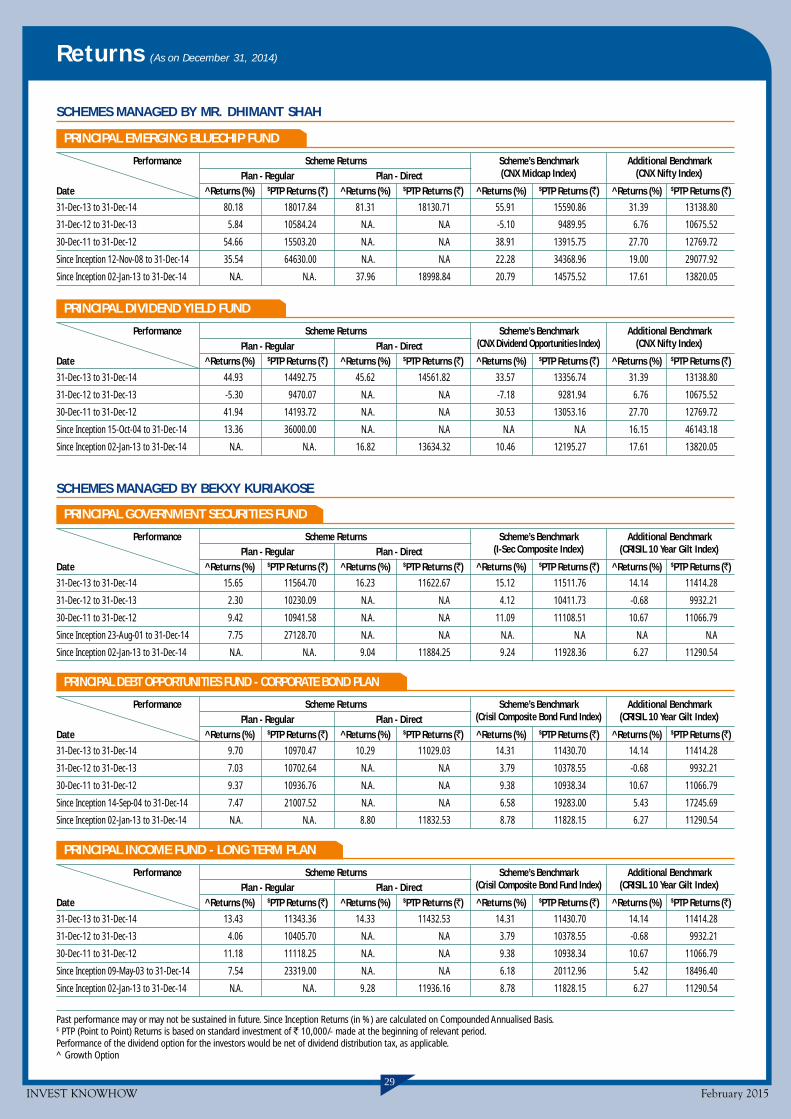
INVEST KNOWHOW February 201529
SCHEMES MANAGED BY BEKXY KURIAKOSE
PRINCIPAL GOVERNMENT SECURITIES FUND
Performance Scheme Returns Scheme’s Benchmark Additional BenchmarkPlan - Regular Plan - Direct (I-Sec Composite Index) (CRISIL 10 Year Gilt Index)
Date ^Returns (%) $PTP Returns (`) ^Returns (%) $PTP Returns (`) ^Returns (%) $PTP Returns (`) ^Returns (%) $PTP Returns (`)
31-Dec-13 to 31-Dec-14 15.65 11564.70 16.23 11622.67 15.12 11511.76 14.14 11414.28
31-Dec-12 to 31-Dec-13 2.30 10230.09 N.A. N.A 4.12 10411.73 -0.68 9932.21
30-Dec-11 to 31-Dec-12 9.42 10941.58 N.A. N.A 11.09 11108.51 10.67 11066.79
Since Inception 23-Aug-01 to 31-Dec-14 7.75 27128.70 N.A. N.A N.A. N.A N.A N.A
Since Inception 02-Jan-13 to 31-Dec-14 N.A. N.A. 9.04 11884.25 9.24 11928.36 6.27 11290.54
PRINCIPAL DEBT OPPORTUNITIES FUND - CORPORATE BOND PLAN
Performance Scheme Returns Scheme’s Benchmark Additional BenchmarkPlan - Regular Plan - Direct (Crisil Composite Bond Fund Index) (CRISIL 10 Year Gilt Index)
Date ^Returns (%) $PTP Returns (`) ^Returns (%) $PTP Returns (`) ^Returns (%) $PTP Returns (`) ^Returns (%) $PTP Returns (`)
31-Dec-13 to 31-Dec-14 9.70 10970.47 10.29 11029.03 14.31 11430.70 14.14 11414.28
31-Dec-12 to 31-Dec-13 7.03 10702.64 N.A. N.A 3.79 10378.55 -0.68 9932.21
30-Dec-11 to 31-Dec-12 9.37 10936.76 N.A. N.A 9.38 10938.34 10.67 11066.79
Since Inception 14-Sep-04 to 31-Dec-14 7.47 21007.52 N.A. N.A 6.58 19283.00 5.43 17245.69
Since Inception 02-Jan-13 to 31-Dec-14 N.A. N.A. 8.80 11832.53 8.78 11828.15 6.27 11290.54
PRINCIPAL INCOME FUND - LONG TERM PLAN
Performance Scheme Returns Scheme’s Benchmark Additional BenchmarkPlan - Regular Plan - Direct (Crisil Composite Bond Fund Index) (CRISIL 10 Year Gilt Index)
Date ^Returns (%) $PTP Returns (`) ^Returns (%) $PTP Returns (`) ^Returns (%) $PTP Returns (`) ^Returns (%) $PTP Returns (`)
31-Dec-13 to 31-Dec-14 13.43 11343.36 14.33 11432.53 14.31 11430.70 14.14 11414.28
31-Dec-12 to 31-Dec-13 4.06 10405.70 N.A. N.A 3.79 10378.55 -0.68 9932.21
30-Dec-11 to 31-Dec-12 11.18 11118.25 N.A. N.A 9.38 10938.34 10.67 11066.79
Since Inception 09-May-03 to 31-Dec-14 7.54 23319.00 N.A. N.A 6.18 20112.96 5.42 18496.40
Since Inception 02-Jan-13 to 31-Dec-14 N.A. N.A. 9.28 11936.16 8.78 11828.15 6.27 11290.54
Returns (As on December 31, 2014)
Past performance may or may not be sustained in future. Since Inception Returns (in %) are calculated on Compounded Annualised Basis.$ PTP (Point to Point) Returns is based on standard investment of ` 10,000/- made at the beginning of relevant period.Performance of the dividend option for the investors would be net of dividend distribution tax, as applicable.^ Growth Option
SCHEMES MANAGED BY MR. DHIMANT SHAH
PRINCIPAL EMERGING BLUECHIP FUND
Performance Scheme Returns Scheme’s Benchmark Additional BenchmarkPlan - Regular Plan - Direct (CNX Midcap Index) (CNX Nifty Index)
Date ^Returns (%) $PTP Returns (`) ^Returns (%) $PTP Returns (`) ^Returns (%) $PTP Returns (`) ^Returns (%) $PTP Returns (`)
31-Dec-13 to 31-Dec-14 80.18 18017.84 81.31 18130.71 55.91 15590.86 31.39 13138.80
31-Dec-12 to 31-Dec-13 5.84 10584.24 N.A. N.A -5.10 9489.95 6.76 10675.52
30-Dec-11 to 31-Dec-12 54.66 15503.20 N.A. N.A 38.91 13915.75 27.70 12769.72
Since Inception 12-Nov-08 to 31-Dec-14 35.54 64630.00 N.A. N.A 22.28 34368.96 19.00 29077.92
Since Inception 02-Jan-13 to 31-Dec-14 N.A. N.A. 37.96 18998.84 20.79 14575.52 17.61 13820.05
PRINCIPAL DIVIDEND YIELD FUND
Performance Scheme Returns Scheme’s Benchmark Additional BenchmarkPlan - Regular Plan - Direct (CNX Dividend Opportunities Index) (CNX Nifty Index)
Date ^Returns (%) $PTP Returns (`) ^Returns (%) $PTP Returns (`) ^Returns (%) $PTP Returns (`) ^Returns (%) $PTP Returns (`)
31-Dec-13 to 31-Dec-14 44.93 14492.75 45.62 14561.82 33.57 13356.74 31.39 13138.80
31-Dec-12 to 31-Dec-13 -5.30 9470.07 N.A. N.A -7.18 9281.94 6.76 10675.52
30-Dec-11 to 31-Dec-12 41.94 14193.72 N.A. N.A 30.53 13053.16 27.70 12769.72
Since Inception 15-Oct-04 to 31-Dec-14 13.36 36000.00 N.A. N.A N.A N.A 16.15 46143.18
Since Inception 02-Jan-13 to 31-Dec-14 N.A. N.A. 16.82 13634.32 10.46 12195.27 17.61 13820.05

INVEST KNOWHOW February 201530
Returns (As on December 31, 2014)
SCHEMES MANAGED BY MR. P.V.K. MOHAN
SCHEMES MANAGED BY MR. GURVINDER SINGH WASAN
PRINCIPAL GROWTH FUND
Performance Scheme Returns Scheme’s Benchmark Additional BenchmarkPlan - Regular Plan - Direct (S&P BSE 200 Index) (CNX Nifty Index)
Date ^Returns (%) $PTP Returns (`) ^Returns (%) $PTP Returns (`) ^Returns (%) $PTP Returns (`) ^Returns (%) $PTP Returns (`)
31-Dec-13 to 31-Dec-14 49.36 14935.92 50.22 15022.30 35.47 13546.66 31.39 13138.80
31-Dec-12 to 31-Dec-13 8.31 10831.16 N.A. N.A 4.38 10438.05 6.76 10675.52
30-Dec-11 to 31-Dec-12 46.01 14600.96 N.A. N.A 30.98 13098.46 27.70 12769.72
Since Inception 25-Oct-00 to 31-Dec-14 17.04 93230.00 N.A. N.A 16.18 84036.23 14.69 69961.15
Since Inception 02-Jan-13 to 31-Dec-14 N.A. N.A. 26.89 16080.14 18.02 13916.37 17.61 13820.05
PRINCIPAL TAX SAVINGS FUND
Performance Scheme Returns Scheme’s Benchmark Additional BenchmarkPlan - Regular Plan - Direct (S&P BSE 200 Index) (CNX Nifty Index)
Date ^Returns (%) $PTP Returns (`) ^Returns (%) $PTP Returns (`) ^Returns (%) $PTP Returns (`) ^Returns (%) $PTP Returns (`)
31-Dec-13 to 31-Dec-14 49.45 14944.62 50.07 15007.02 35.47 13546.66 31.39 13138.80
31-Dec-12 to 31-Dec-13 8.55 10854.65 N.A. N.A 4.38 10438.05 6.76 10675.52
30-Dec-11 to 31-Dec-12 46.51 14651.12 N.A. N.A 30.98 13098.46 27.70 12769.72
Since Inception 31-Mar-96 to 31-Dec-14 17.54 207584.30 N.A. N.A 13.01 99249.86 12.01 84062.72
Since Inception 02-Jan-13 to 31-Dec-14 N.A. N.A. 26.94 16093.35 18.02 13916.37 17.61 13820.05
PRINCIPAL BALANCED FUND
Performance Scheme Returns Scheme’s Benchmark Additional BenchmarkPlan - Regular Plan - Direct (Crisil Balanced Fund Index) (CNX Nifty Index)
Date ^Returns (%) $PTP Returns (`) ^Returns (%) $PTP Returns (`) ^Returns (%) $PTP Returns (`) ^Returns (%) $PTP Returns (`)
31-Dec-13 to 31-Dec-14 34.94 13494.27 36.06 13605.63 25.34 12534.46 31.39 13138.80
31-Dec-12 to 31-Dec-13 7.22 10722.43 N.A. N.A 6.05 10604.69 6.76 10675.52
30-Dec-11 to 31-Dec-12 34.18 13418.37 N.A. N.A 21.28 12127.97 27.70 12769.72
Since Inception 14-Jan-00 to 31-Dec-14 11.27 49470.00 N.A. N.A N.A. N.A 11.50 51041.13
Since Inception 02-Jan-13 to 31-Dec-14 N.A. N.A. 20.60 14529.17 14.72 13151.17 17.61 13820.05
PRINCIPAL BANK CD FUND
Performance Scheme Returns Scheme’s Benchmark Additional BenchmarkPlan - Regular Plan - Direct (CRISIL Liquid Fund Index) (CRISIL 1 Year T-Bill Index)
Date ^Returns (%) $PTP Returns (`) ^Returns (%) $PTP Returns (`) ^Returns (%) $PTP Returns (`) ^Returns (%) $PTP Returns (`)
31-Dec-13 to 31-Dec-14 8.86 10885.56 9.49 10949.36 9.21 10921.45 8.56 10855.81
31-Dec-12 to 31-Dec-13 9.07 10907.23 N.A. N.A 9.03 10903.13 5.86 10586.45
30-Dec-11 to 31-Dec-12 9.37 10936.87 N.A. N.A 8.54 10854.31 8.11 10810.71
Since Inception 06-Nov-07 to 31-Dec-14 8.13 17498.00 N.A. N.A 7.59 16882.81 6.11 15290.76
Since Inception 02-Jan-13 to 31-Dec-14 N.A. N.A. 9.41 11964.52 9.13 11902.93 7.15 11477.35
PRINCIPAL INCOME FUND - SHORT TERM PLAN
Performance Scheme Returns Scheme’s Benchmark Additional BenchmarkPlan - Regular Plan - Direct (CRISIL Short-Term Bond Fund Index) (CRISIL 10 Year Gilt Index)
Date ^Returns (%) $PTP Returns (`) ^Returns (%) $PTP Returns (`) ^Returns (%) $PTP Returns (`) ^Returns (%) $PTP Returns (`)
31-Dec-13 to 31-Dec-14 9.87 10987.07 10.65 11065.36 10.47 11046.80 14.14 11414.28
31-Dec-12 to 31-Dec-13 7.83 10782.90 N.A. N.A 8.27 10827.20 -0.68 9932.21
30-Dec-11 to 31-Dec-12 10.22 11021.73 N.A. N.A 9.15 10914.85 10.67 11066.79
Since Inception 09-May-03 to 31-Dec-14 7.77 23930.50 N.A. N.A 6.93 21831.42 5.42 18496.40
Since Inception 02-Jan-13 to 31-Dec-14 N.A. N.A. 9.52 11989.46 9.35 11951.33 6.27 11290.54
Past performance may or may not be sustained in future. Since Inception Returns (in %) are calculated on Compounded Annualised Basis.$ PTP (Point to Point) Returns is based on standard investment of ` 10,000/- made at the beginning of relevant period.Performance of the dividend option for the investors would be net of dividend distribution tax, as applicable.^ Growth Option
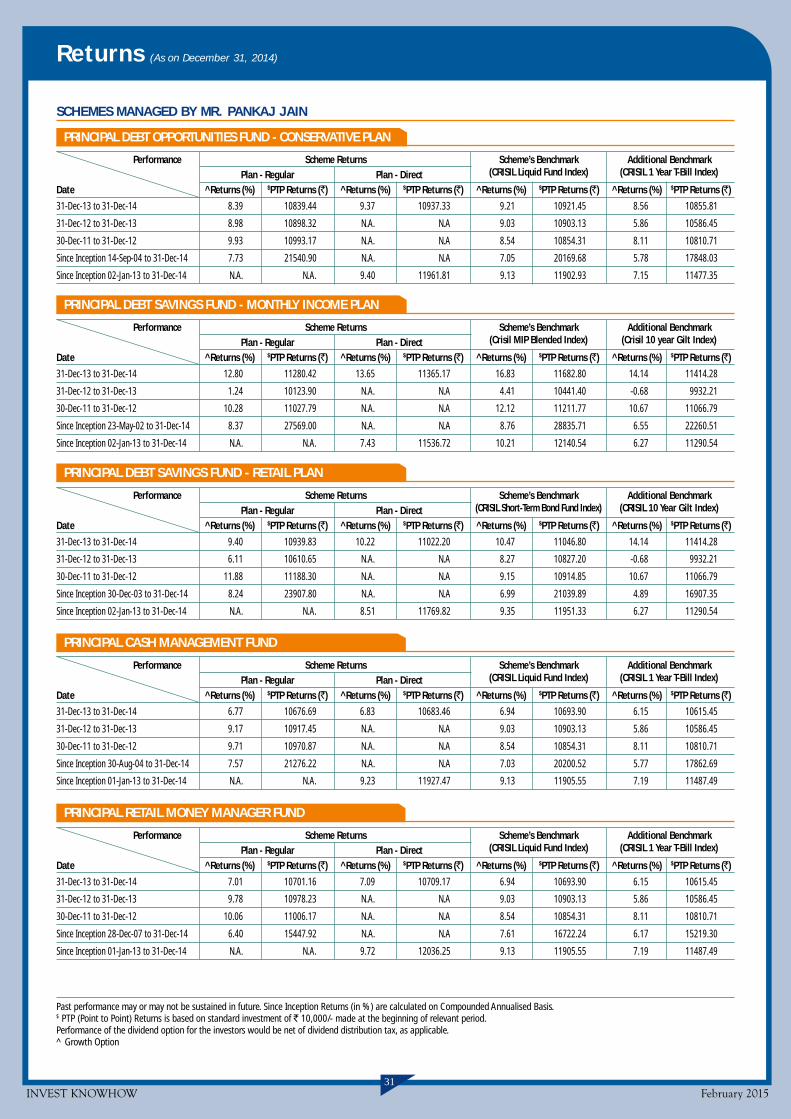
INVEST KNOWHOW February 201531
Returns (As on December 31, 2014)
SCHEMES MANAGED BY MR. PANKAJ JAIN
PRINCIPAL DEBT OPPORTUNITIES FUND - CONSERVATIVE PLAN
Performance Scheme Returns Scheme’s Benchmark Additional BenchmarkPlan - Regular Plan - Direct (CRISIL Liquid Fund Index) (CRISIL 1 Year T-Bill Index)
Date ^Returns (%) $PTP Returns (`) ^Returns (%) $PTP Returns (`) ^Returns (%) $PTP Returns (`) ^Returns (%) $PTP Returns (`)
31-Dec-13 to 31-Dec-14 8.39 10839.44 9.37 10937.33 9.21 10921.45 8.56 10855.81
31-Dec-12 to 31-Dec-13 8.98 10898.32 N.A. N.A 9.03 10903.13 5.86 10586.45
30-Dec-11 to 31-Dec-12 9.93 10993.17 N.A. N.A 8.54 10854.31 8.11 10810.71
Since Inception 14-Sep-04 to 31-Dec-14 7.73 21540.90 N.A. N.A 7.05 20169.68 5.78 17848.03
Since Inception 02-Jan-13 to 31-Dec-14 N.A. N.A. 9.40 11961.81 9.13 11902.93 7.15 11477.35
PRINCIPAL DEBT SAVINGS FUND - MONTHLY INCOME PLAN
Performance Scheme Returns Scheme’s Benchmark Additional BenchmarkPlan - Regular Plan - Direct (Crisil MIP Blended Index) (Crisil 10 year Gilt Index)
Date ^Returns (%) $PTP Returns (`) ^Returns (%) $PTP Returns (`) ^Returns (%) $PTP Returns (`) ^Returns (%) $PTP Returns (`)
31-Dec-13 to 31-Dec-14 12.80 11280.42 13.65 11365.17 16.83 11682.80 14.14 11414.28
31-Dec-12 to 31-Dec-13 1.24 10123.90 N.A. N.A 4.41 10441.40 -0.68 9932.21
30-Dec-11 to 31-Dec-12 10.28 11027.79 N.A. N.A 12.12 11211.77 10.67 11066.79
Since Inception 23-May-02 to 31-Dec-14 8.37 27569.00 N.A. N.A 8.76 28835.71 6.55 22260.51
Since Inception 02-Jan-13 to 31-Dec-14 N.A. N.A. 7.43 11536.72 10.21 12140.54 6.27 11290.54
PRINCIPAL DEBT SAVINGS FUND - RETAIL PLAN
Performance Scheme Returns Scheme’s Benchmark Additional BenchmarkPlan - Regular Plan - Direct (CRISIL Short-Term Bond Fund Index) (CRISIL 10 Year Gilt Index)
Date ^Returns (%) $PTP Returns (`) ^Returns (%) $PTP Returns (`) ^Returns (%) $PTP Returns (`) ^Returns (%) $PTP Returns (`)
31-Dec-13 to 31-Dec-14 9.40 10939.83 10.22 11022.20 10.47 11046.80 14.14 11414.28
31-Dec-12 to 31-Dec-13 6.11 10610.65 N.A. N.A 8.27 10827.20 -0.68 9932.21
30-Dec-11 to 31-Dec-12 11.88 11188.30 N.A. N.A 9.15 10914.85 10.67 11066.79
Since Inception 30-Dec-03 to 31-Dec-14 8.24 23907.80 N.A. N.A 6.99 21039.89 4.89 16907.35
Since Inception 02-Jan-13 to 31-Dec-14 N.A. N.A. 8.51 11769.82 9.35 11951.33 6.27 11290.54
PRINCIPAL CASH MANAGEMENT FUND
Performance Scheme Returns Scheme’s Benchmark Additional BenchmarkPlan - Regular Plan - Direct (CRISIL Liquid Fund Index) (CRISIL 1 Year T-Bill Index)
Date ^Returns (%) $PTP Returns (`) ^Returns (%) $PTP Returns (`) ^Returns (%) $PTP Returns (`) ^Returns (%) $PTP Returns (`)
31-Dec-13 to 31-Dec-14 6.77 10676.69 6.83 10683.46 6.94 10693.90 6.15 10615.45
31-Dec-12 to 31-Dec-13 9.17 10917.45 N.A. N.A 9.03 10903.13 5.86 10586.45
30-Dec-11 to 31-Dec-12 9.71 10970.87 N.A. N.A 8.54 10854.31 8.11 10810.71
Since Inception 30-Aug-04 to 31-Dec-14 7.57 21276.22 N.A. N.A 7.03 20200.52 5.77 17862.69
Since Inception 01-Jan-13 to 31-Dec-14 N.A. N.A. 9.23 11927.47 9.13 11905.55 7.19 11487.49
PRINCIPAL RETAIL MONEY MANAGER FUND
Performance Scheme Returns Scheme’s Benchmark Additional BenchmarkPlan - Regular Plan - Direct (CRISIL Liquid Fund Index) (CRISIL 1 Year T-Bill Index)
Date ^Returns (%) $PTP Returns (`) ^Returns (%) $PTP Returns (`) ^Returns (%) $PTP Returns (`) ^Returns (%) $PTP Returns (`)
31-Dec-13 to 31-Dec-14 7.01 10701.16 7.09 10709.17 6.94 10693.90 6.15 10615.45
31-Dec-12 to 31-Dec-13 9.78 10978.23 N.A. N.A 9.03 10903.13 5.86 10586.45
30-Dec-11 to 31-Dec-12 10.06 11006.17 N.A. N.A 8.54 10854.31 8.11 10810.71
Since Inception 28-Dec-07 to 31-Dec-14 6.40 15447.92 N.A. N.A 7.61 16722.24 6.17 15219.30
Since Inception 01-Jan-13 to 31-Dec-14 N.A. N.A. 9.72 12036.25 9.13 11905.55 7.19 11487.49
Past performance may or may not be sustained in future. Since Inception Returns (in %) are calculated on Compounded Annualised Basis.$ PTP (Point to Point) Returns is based on standard investment of ` 10,000/- made at the beginning of relevant period.Performance of the dividend option for the investors would be net of dividend distribution tax, as applicable.^ Growth Option
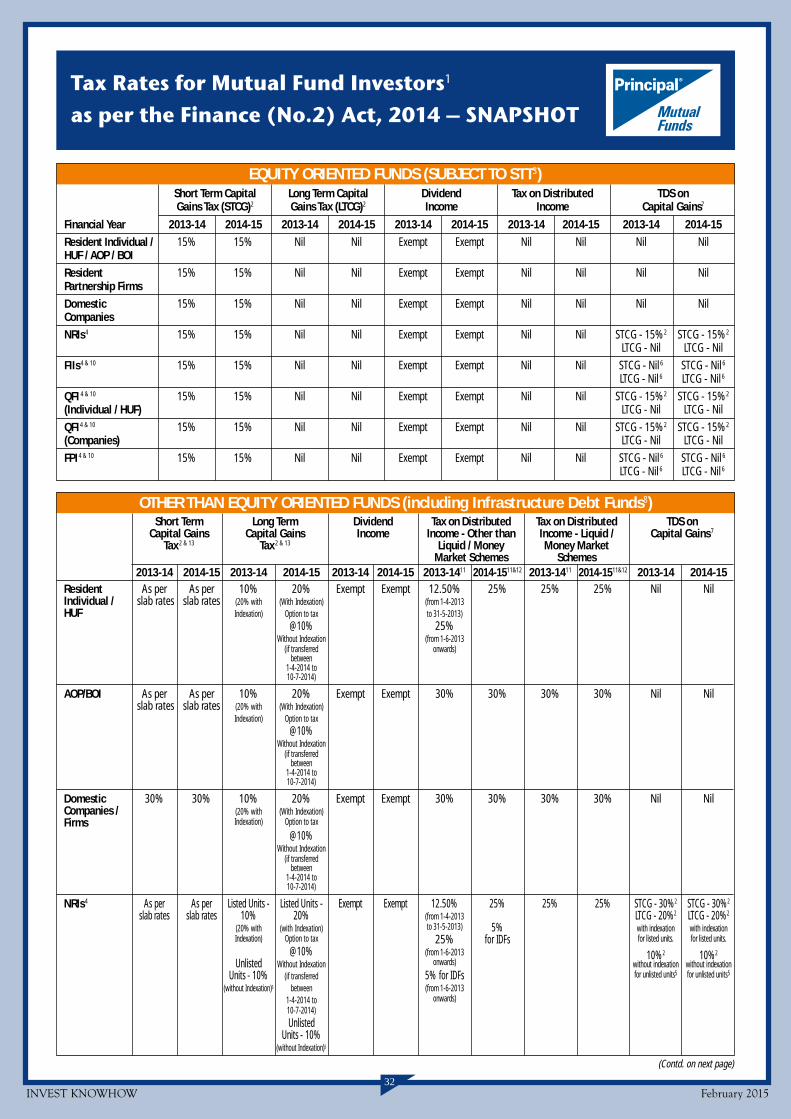
INVEST KNOWHOW February 201532
Short Term Capital Long Term Capital Dividend Tax on Distributed TDS onGains Tax (STCG)2 Gains Tax (LTCG)2 Income Income Capital Gains7
Financial Year 2013-14 2014-15 2013-14 2014-15 2013-14 2014-15 2013-14 2014-15 2013-14 2014-15Resident Individual / 15% 15% Nil Nil Exempt Exempt Nil Nil Nil NilHUF / AOP / BOIResident 15% 15% Nil Nil Exempt Exempt Nil Nil Nil NilPartnership FirmsDomestic 15% 15% Nil Nil Exempt Exempt Nil Nil Nil NilCompaniesNRIs4 15% 15% Nil Nil Exempt Exempt Nil Nil STCG - 15%2 STCG - 15%2
LTCG - Nil LTCG - Nil
FIIs4 & 10 15% 15% Nil Nil Exempt Exempt Nil Nil STCG - Nil 6 STCG - Nil 6
LTCG - Nil 6 LTCG - Nil 6
QFI 4 & 10 15% 15% Nil Nil Exempt Exempt Nil Nil STCG - 15%2 STCG - 15%2
(Individual / HUF) LTCG - Nil LTCG - Nil
QFI4 & 10 15% 15% Nil Nil Exempt Exempt Nil Nil STCG - 15%2 STCG - 15%2
(Companies) LTCG - Nil LTCG - Nil
FPI4 & 10 15% 15% Nil Nil Exempt Exempt Nil Nil STCG - Nil 6 STCG - Nil 6
LTCG - Nil 6 LTCG - Nil 6
Short Term Long Term Dividend Tax on Distributed Tax on Distributed TDS onCapital Gains Capital Gains Income Income - Other than Income - Liquid / Capital Gains7
Tax 2 & 13 Tax 2 & 13 Liquid / Money Money MarketMarket Schemes Schemes
2013-14 2014-15 2013-14 2014-15 2013-14 2014-15 2013-1411 2014-1511&12 2013-1411 2014-1511&12 2013-14 2014-15Resident As per As per 10% 20% Exempt Exempt 12.50% 25% 25% 25% Nil NilIndividual / slab rates slab rates (20% with (With Indexation) (from 1-4-2013HUF Indexation) Option to tax to 31-5-2013)
@10% 25%Without Indexation (from 1-6-2013
(if transferred onwards)between
1-4-2014 to10-7-2014)
AOP/BOI As per As per 10% 20% Exempt Exempt 30% 30% 30% 30% Nil Nil slab rates slab rates (20% with (With Indexation)
Indexation) Option to tax@10%
Without Indexation(if transferred
between1-4-2014 to10-7-2014)
Domestic 30% 30% 10% 20% Exempt Exempt 30% 30% 30% 30% Nil NilCompanies / (20% with (With Indexation)Firms Indexation) Option to tax
@10%Without Indexation
(if transferredbetween
1-4-2014 to10-7-2014)
NRIs4 As per As per Listed Units - Listed Units - Exempt Exempt 12.50% 25% 25% 25% STCG - 30%2 STCG - 30%2
slab rates slab rates 10% 20% (from 1-4-2013 LTCG - 20%2 LTCG - 20%2
(20% with (with Indexation) to 31-5-2013) 5% with indexation with indexationIndexation) Option to tax 25% for IDFs for listed units. for listed units.
@10% (from 1-6-2013 10%2 10%2
Unlisted Without Indexation onwards) without indexation without indexationUnits - 10% (if transferred 5% for IDFs for unlisted units5 for unlisted units5
(without Indexation)5 between (from 1-6-20131-4-2014 to onwards)10-7-2014)Unlisted
Units - 10%(without Indexation)5
EQUITY ORIENTED FUNDS (SUBJECT TO STT3)
OTHER THAN EQUITY ORIENTED FUNDS (including Infrastructure Debt Funds8)
(Contd. on next page)
Tax Rates for Mutual Fund Investors1
as per the Finance (No.2) Act, 2014 – SNAPSHOT
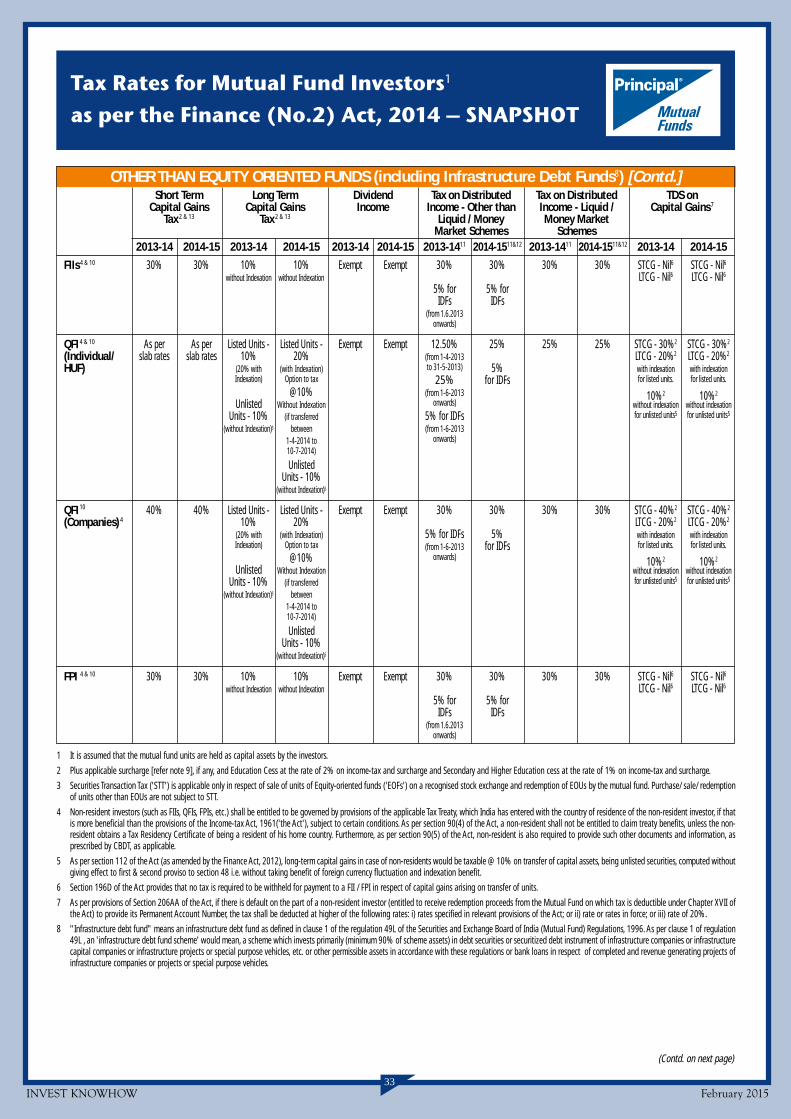
INVEST KNOWHOW February 201533
Tax Rates for Mutual Fund Investors1
as per the Finance (No.2) Act, 2014 – SNAPSHOT
OTHER THAN EQUITY ORIENTED FUNDS (including Infrastructure Debt Funds8) [Contd.]
1 It is assumed that the mutual fund units are held as capital assets by the investors.
2 Plus applicable surcharge [refer note 9], if any, and Education Cess at the rate of 2% on income-tax and surcharge and Secondary and Higher Education cess at the rate of 1% on income-tax and surcharge.
3 Securities Transaction Tax ('STT') is applicable only in respect of sale of units of Equity-oriented funds ('EOFs') on a recognised stock exchange and redemption of EOUs by the mutual fund. Purchase/ sale/ redemptionof units other than EOUs are not subject to STT.
4 Non-resident investors (such as FIIs, QFIs, FPIs, etc.) shall be entitled to be governed by provisions of the applicable Tax Treaty, which India has entered with the country of residence of the non-resident investor, if thatis more beneficial than the provisions of the Income-tax Act, 1961('the Act'), subject to certain conditions. As per section 90(4) of the Act, a non-resident shall not be entitled to claim treaty benefits, unless the non-resident obtains a Tax Residency Certificate of being a resident of his home country. Furthermore, as per section 90(5) of the Act, non-resident is also required to provide such other documents and information, asprescribed by CBDT, as applicable.
5 As per section 112 of the Act (as amended by the Finance Act, 2012), long-term capital gains in case of non-residents would be taxable @ 10% on transfer of capital assets, being unlisted securities, computed withoutgiving effect to first & second proviso to section 48 i.e. without taking benefit of foreign currency fluctuation and indexation benefit.
6 Section 196D of the Act provides that no tax is required to be withheld for payment to a FII / FPI in respect of capital gains arising on transfer of units.
7 As per provisions of Section 206AA of the Act, if there is default on the part of a non-resident investor (entitled to receive redemption proceeds from the Mutual Fund on which tax is deductible under Chapter XVII ofthe Act) to provide its Permanent Account Number, the tax shall be deducted at higher of the following rates: i) rates specified in relevant provisions of the Act; or ii) rate or rates in force; or iii) rate of 20%.
8 "Infrastructure debt fund" means an infrastructure debt fund as defined in clause 1 of the regulation 49L of the Securities and Exchange Board of India (Mutual Fund) Regulations, 1996. As per clause 1 of regulation49L , an 'infrastructure debt fund scheme' would mean, a scheme which invests primarily (minimum 90% of scheme assets) in debt securities or securitized debt instrument of infrastructure companies or infrastructurecapital companies or infrastructure projects or special purpose vehicles, etc. or other permissible assets in accordance with these regulations or bank loans in respect of completed and revenue generating projects ofinfrastructure companies or projects or special purpose vehicles.
Short Term Long Term Dividend Tax on Distributed Tax on Distributed TDS onCapital Gains Capital Gains Income Income - Other than Income - Liquid / Capital Gains7
Tax 2 & 13 Tax 2 & 13 Liquid / Money Money MarketMarket Schemes Schemes
2013-14 2014-15 2013-14 2014-15 2013-14 2014-15 2013-1411 2014-1511&12 2013-1411 2014-1511&12 2013-14 2014-15
FIIs4 & 10 30% 30% 10% 10% Exempt Exempt 30% 30% 30% 30% STCG - Nil6 STCG - Nil6without Indexation without Indexation LTCG - Nil6 LTCG - Nil6
5% for 5% forIDFs IDFs
(from 1.6.2013onwards)
QFI 4 & 10 As per As per Listed Units - Listed Units - Exempt Exempt 12.50% 25% 25% 25% STCG - 30%2 STCG - 30%2
(Individual/ slab rates slab rates 10% 20% (from 1-4-2013 LTCG - 20%2 LTCG - 20%2
HUF) (20% with (with Indexation) to 31-5-2013) 5% with indexation with indexationIndexation) Option to tax 25% for IDFs for listed units. for listed units.
@10% (from 1-6-2013 10%2 10%2
Unlisted Without Indexation onwards) without indexation without indexationUnits - 10% (if transferred 5% for IDFs for unlisted units5 for unlisted units5
(without Indexation)5 between (from 1-6-20131-4-2014 to onwards)10-7-2014)
UnlistedUnits - 10%
(without Indexation)5
QFI10 40% 40% Listed Units - Listed Units - Exempt Exempt 30% 30% 30% 30% STCG - 40%2 STCG - 40%2
(Companies) 4 10% 20% LTCG - 20%2 LTCG - 20%2
(20% with (with Indexation) 5% for IDFs 5% with indexation with indexationIndexation) Option to tax (from 1-6-2013 for IDFs for listed units. for listed units.
@10% onwards) 10%2 10%2
Unlisted Without Indexation without indexation without indexationUnits - 10% (if transferred for unlisted units5 for unlisted units5
(without Indexation)5 between1-4-2014 to10-7-2014)
UnlistedUnits - 10%
(without Indexation)5
FPI 4 & 10 30% 30% 10% 10% Exempt Exempt 30% 30% 30% 30% STCG - Nil6 STCG - Nil6without Indexation without Indexation LTCG - Nil6 LTCG - Nil6
5% for 5% forIDFs IDFs
(from 1.6.2013onwards)
(Contd. on next page)
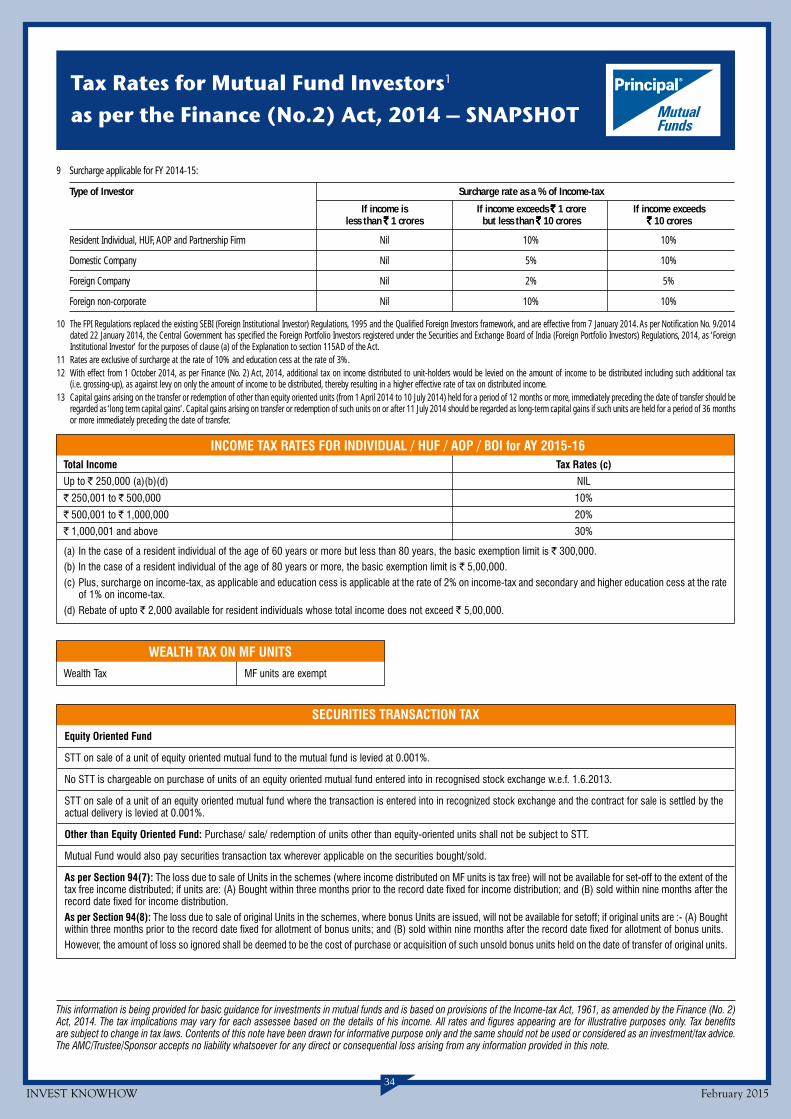
34
Tax Rates for Mutual Fund Investors1
as per the Finance (No.2) Act, 2014 – SNAPSHOT
INCOME TAX RATES FOR INDIVIDUAL / HUF / AOP / BOI for AY 2015-16Total Income Tax Rates (c)
Up to ` 250,000 (a)(b)(d) NIL
` 250,001 to ` 500,000 10%
` 500,001 to ` 1,000,000 20%
` 1,000,001 and above 30%
(a) In the case of a resident individual of the age of 60 years or more but less than 80 years, the basic exemption limit is ` 300,000.(b) In the case of a resident individual of the age of 80 years or more, the basic exemption limit is ` 5,00,000.(c) Plus, surcharge on income-tax, as applicable and education cess is applicable at the rate of 2% on income-tax and secondary and higher education cess at the rate
of 1% on income-tax.(d) Rebate of upto ` 2,000 available for resident individuals whose total income does not exceed ` 5,00,000.
This information is being provided for basic guidance for investments in mutual funds and is based on provisions of the Income-tax Act, 1961, as amended by the Finance (No. 2)Act, 2014. The tax implications may vary for each assessee based on the details of his income. All rates and figures appearing are for illustrative purposes only. Tax benefitsare subject to change in tax laws. Contents of this note have been drawn for informative purpose only and the same should not be used or considered as an investment/tax advice.The AMC/Trustee/Sponsor accepts no liability whatsoever for any direct or consequential loss arising from any information provided in this note.
WEALTH TAX ON MF UNITS
Wealth Tax MF units are exempt
SECURITIES TRANSACTION TAX
Equity Oriented Fund
STT on sale of a unit of equity oriented mutual fund to the mutual fund is levied at 0.001%.
No STT is chargeable on purchase of units of an equity oriented mutual fund entered into in recognised stock exchange w.e.f. 1.6.2013.
STT on sale of a unit of an equity oriented mutual fund where the transaction is entered into in recognized stock exchange and the contract for sale is settled by theactual delivery is levied at 0.001%.
Other than Equity Oriented Fund: Purchase/ sale/ redemption of units other than equity-oriented units shall not be subject to STT.
Mutual Fund would also pay securities transaction tax wherever applicable on the securities bought/sold.
As per Section 94(7): The loss due to sale of Units in the schemes (where income distributed on MF units is tax free) will not be available for set-off to the extent of thetax free income distributed; if units are: (A) Bought within three months prior to the record date fixed for income distribution; and (B) sold within nine months after therecord date fixed for income distribution.As per Section 94(8): The loss due to sale of original Units in the schemes, where bonus Units are issued, will not be available for setoff; if original units are :- (A) Boughtwithin three months prior to the record date fixed for allotment of bonus units; and (B) sold within nine months after the record date fixed for allotment of bonus units.However, the amount of loss so ignored shall be deemed to be the cost of purchase or acquisition of such unsold bonus units held on the date of transfer of original units.
9 Surcharge applicable for FY 2014-15:
Type of Investor Surcharge rate as a % of Income-tax
If income is If income exceeds `̀̀̀̀ 1 crore If income exceedsless than `̀̀̀̀ 1 crores but less than `̀̀̀̀ 10 crores `̀̀̀̀ 10 crores
Resident Individual, HUF, AOP and Partnership Firm Nil 10% 10%
Domestic Company Nil 5% 10%
Foreign Company Nil 2% 5%
Foreign non-corporate Nil 10% 10%
10 The FPI Regulations replaced the existing SEBI (Foreign Institutional Investor) Regulations, 1995 and the Qualified Foreign Investors framework, and are effective from 7 January 2014. As per Notification No. 9/2014dated 22 January 2014, the Central Government has specified the Foreign Portfolio Investors registered under the Securities and Exchange Board of India (Foreign Portfolio Investors) Regulations, 2014, as ‘ForeignInstitutional Investor’ for the purposes of clause (a) of the Explanation to section 115AD of the Act.
11 Rates are exclusive of surcharge at the rate of 10% and education cess at the rate of 3%.12 With effect from 1 October 2014, as per Finance (No. 2) Act, 2014, additional tax on income distributed to unit-holders would be levied on the amount of income to be distributed including such additional tax
(i.e. grossing-up), as against levy on only the amount of income to be distributed, thereby resulting in a higher effective rate of tax on distributed income.13 Capital gains arising on the transfer or redemption of other than equity oriented units (from 1 April 2014 to 10 July 2014) held for a period of 12 months or more, immediately preceding the date of transfer should be
regarded as ‘long term capital gains’. Capital gains arising on transfer or redemption of such units on or after 11 July 2014 should be regarded as long-term capital gains if such units are held for a period of 36 monthsor more immediately preceding the date of transfer.
INVEST KNOWHOW February 2015
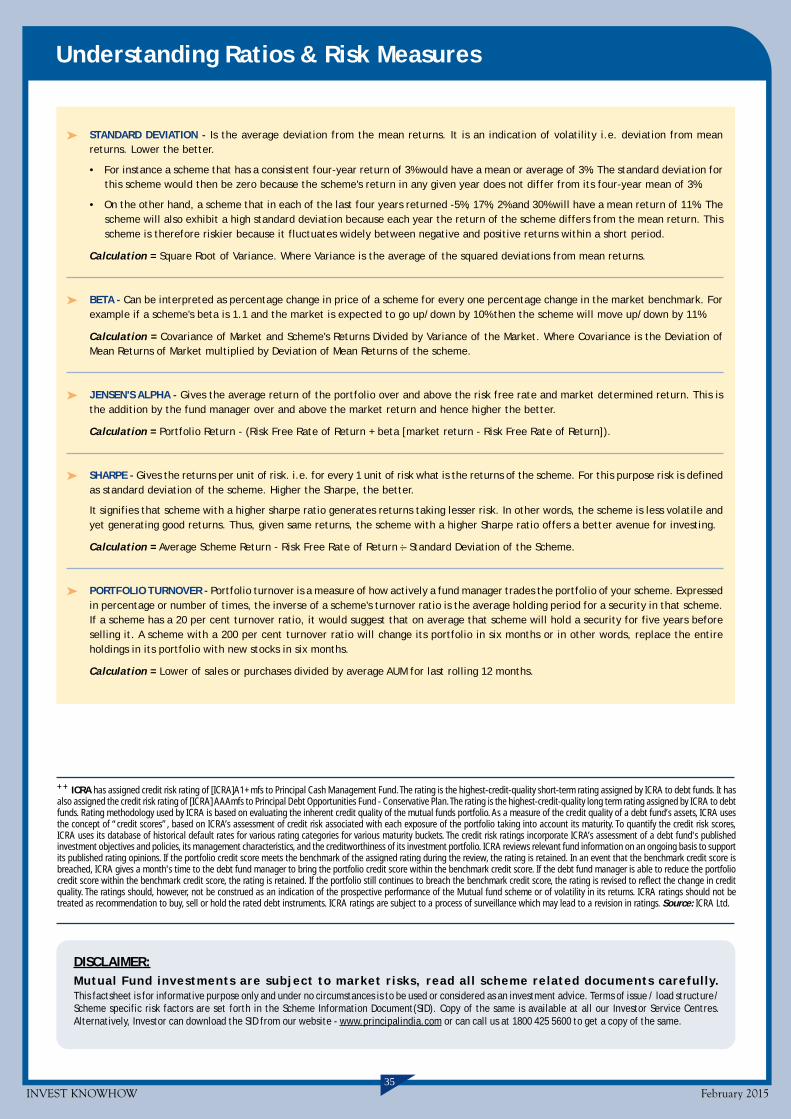
INVEST KNOWHOW February 201535
Understanding Ratios & Risk Measures
STANDARD DEVIATION - Is the average deviation from the mean returns. It is an indication of volatility i.e. deviation from meanreturns. Lower the better.
• For instance a scheme that has a consistent four-year return of 3% would have a mean or average of 3%. The standard deviation forthis scheme would then be zero because the scheme's return in any given year does not differ from its four-year mean of 3%.
• On the other hand, a scheme that in each of the last four years returned -5%, 17%, 2% and 30% will have a mean return of 11%. Thescheme will also exhibit a high standard deviation because each year the return of the scheme differs from the mean return. Thisscheme is therefore riskier because it fluctuates widely between negative and positive returns within a short period.
Calculation = Square Root of Variance. Where Variance is the average of the squared deviations from mean returns.
BETA - Can be interpreted as percentage change in price of a scheme for every one percentage change in the market benchmark. Forexample if a scheme's beta is 1.1 and the market is expected to go up/down by 10% then the scheme will move up/down by 11%.
Calculation = Covariance of Market and Scheme's Returns Divided by Variance of the Market. Where Covariance is the Deviation ofMean Returns of Market multiplied by Deviation of Mean Returns of the scheme.
JENSEN'S ALPHA - Gives the average return of the portfolio over and above the risk free rate and market determined return. This isthe addition by the fund manager over and above the market return and hence higher the better.
Calculation = Portfolio Return - (Risk Free Rate of Return + beta [market return - Risk Free Rate of Return]).
SHARPE - Gives the returns per unit of risk. i.e. for every 1 unit of risk what is the returns of the scheme. For this purpose risk is definedas standard deviation of the scheme. Higher the Sharpe, the better.
It signifies that scheme with a higher sharpe ratio generates returns taking lesser risk. In other words, the scheme is less volatile andyet generating good returns. Thus, given same returns, the scheme with a higher Sharpe ratio offers a better avenue for investing.
Calculation = Average Scheme Return - Risk Free Rate of Return :_ Standard Deviation of the Scheme.
PORTFOLIO TURNOVER - Portfolio turnover is a measure of how actively a fund manager trades the portfolio of your scheme. Expressedin percentage or number of times, the inverse of a scheme's turnover ratio is the average holding period for a security in that scheme.If a scheme has a 20 per cent turnover ratio, it would suggest that on average that scheme will hold a security for five years beforeselling it. A scheme with a 200 per cent turnover ratio will change its portfolio in six months or in other words, replace the entireholdings in its portfolio with new stocks in six months.
Calculation = Lower of sales or purchases divided by average AUM for last rolling 12 months.
DISCLAIMER:Mutual Fund investments are subject to market risks, read all scheme related documents carefully.This factsheet is for informative purpose only and under no circumstances is to be used or considered as an investment advice. Terms of issue / load structure/Scheme specific risk factors are set forth in the Scheme Information Document(SID). Copy of the same is available at all our Investor Service Centres.Alternatively, Investor can download the SID from our website - www.principalindia.com or can call us at 1800 425 5600 to get a copy of the same.
++ ICRA has assigned credit risk rating of [ICRA]A1+mfs to Principal Cash Management Fund. The rating is the highest-credit-quality short-term rating assigned by ICRA to debt funds. It hasalso assigned the credit risk rating of [ICRA] AAAmfs to Principal Debt Opportunities Fund - Conservative Plan. The rating is the highest-credit-quality long term rating assigned by ICRA to debtfunds. Rating methodology used by ICRA is based on evaluating the inherent credit quality of the mutual funds portfolio. As a measure of the credit quality of a debt fund’s assets, ICRA usesthe concept of “credit scores”, based on ICRA’s assessment of credit risk associated with each exposure of the portfolio taking into account its maturity. To quantify the credit risk scores,ICRA uses its database of historical default rates for various rating categories for various maturity buckets. The credit risk ratings incorporate ICRA’s assessment of a debt fund's publishedinvestment objectives and policies, its management characteristics, and the creditworthiness of its investment portfolio. ICRA reviews relevant fund information on an ongoing basis to supportits published rating opinions. If the portfolio credit score meets the benchmark of the assigned rating during the review, the rating is retained. In an event that the benchmark credit score isbreached, ICRA gives a month's time to the debt fund manager to bring the portfolio credit score within the benchmark credit score. If the debt fund manager is able to reduce the portfoliocredit score within the benchmark credit score, the rating is retained. If the portfolio still continues to breach the benchmark credit score, the rating is revised to reflect the change in creditquality. The ratings should, however, not be construed as an indication of the prospective performance of the Mutual fund scheme or of volatility in its returns. ICRA ratings should not betreated as recommendation to buy, sell or hold the rated debt instruments. ICRA ratings are subject to a process of surveillance which may lead to a revision in ratings. Source: ICRA Ltd.

Offices of AMC Identified as Official Point of Acceptance (OPA) / Investor Service Centres (ISC)Principal Pnb Asset Management Company Private Limited - OPA & ISC:• Mumbai: Exchange Plaza, ‘B’ wing, Ground Floor, NSE Building, Bandra Kurla Complex, Bandra (East), Mumbai-400 051
Principal Pnb Asset Management Company Private Limited - ISC:• Ahmedabad: 102, Megha House, Opp. Kotak Mahindra Bank, Mithakhali Law Garden Road, Ahmedabad-380 006 • Bengaluru: Salarpuria Landmark,2nd Floor, Unit No. 2002, 100 Feet Road, HAL II Stage, Bengaluru-560 038 • Chandigarh: SCO No. 145-146, 1st Floor, Sector 9-C, Chandigarh-160 009• Chennai: Nirupama & Neelima Building, New Unit No.55, Vijaya Raghava Road, T. Nagar, Chennai-600 017 • Hyderabad: ANR Center, Unit No. 201,1st Floor, Road No.1, Banjara Hills, Hyderabad - 500 034 • Jaipur: 61-A, Vasanti, Sardar Patel Marg, C-Scheme, Jaipur-302 001 • Kolkata: BachhawatHouse, Premises No.2, Dr. Martin Luther King Sarani, (Formerly Upper Wood Street), Kolkata-700 016 • Lucknow: Rohtas Trident, 1st Floor, 10,Rana Pratap Marg, Lucknow-226 001 • New Delhi: Unit No. 001 & 002, Gr. Floor, DLF Capitol Point, Baba Kharag Singh Marg, New Delhi-110 001• Pune: Unit No: 103 & 104, 1st Floor, Rainbow Plaza, Opp. Modern Highschool, Jangali Maharaj Road, Shivaji Nagar, Pune - 411 005.
Points of Service (“POS”) of MF UTILITIES INDIA PRIVATE LIMITED (“MFUI”) as Official Point of Acceptance:The Online Transaction Portal of MF Utility is www.mfuonline.com and the list of POS of MFUI is published on the website of MFUI at www.mfuindia.com,as updated from time to time.
Centres of Karvy Computershare Private Limited (R&T to Principal Mutual Fund) which have been identified as Official Point of Acceptance:Agra: 1st Floor, Deepak Wasan Plaza, Behind Holiday Inn, Opp. Megdoot Furnitures, Sanjay Place, Agra-282 002 • Ahmedabad: 201/202 Shail, Opp. Madhusudan House, Navrangpura,Ahmedabad-380 006 • Ajmer: 302, 3rd Floor, Ajmer Auto Building, Opp. City Power House, Jaipur Road, Ajmer - 305 001 • Aligarh: 1st Floor, Kumar Plaza, Aligarh-202 001 • Allahabad: RSATowers, 2nd Floor, Above Sony TV Showroom, 57, S.P. Marg, Civil Lines, Allahabad-211 001 • Amritsar: 72-A, Taylor's Road, Opp. Aga Heritage Club, Amritsar-143 001 • Anand: B-42Vaibhav Commercial Center, Nr TVS Down Town Show Room, Grid Char Rasta, Anand-380 001 • Asansol: 114/71, G.T. Road, Near Sony Centre, Bhanga Pachil, Asansol-713 303• Aurangabad: Ramkunj Niwas, Railway Station Road, Near Osmanpura Circle, Aurangabad-431 005 • Bangalore: 59, Skanda Puttanna Road, Basavanagudi, Bangalore-560 004• Bankura: Ambika Market Complex, Gr. Floor, Nutanganj, Post & Dist Bankura, Bankura-722 101 • Bareilly: 1st Floor, 165, Civil Lines, Opp. Hotel Bareilly Palace, Near Railway Station,Bareilly-243 001 • Belgaum: CTS No. 3939/ A2 A1, Above Raymonds Show Room, Beside Harsha Appliances, Club Road, Belgaum-590 001 • Bharuch: Shop No. 147-148, Aditya Complex,Near Kasak Circle, Bharuch-392 001 • Bhatinda: #2047-A 2Nd Floor, The Mall Road, Above Max New York Life Insurance, New Delhi-151 001 • Bhavnagar: G-11 Giranjali Complex, BesideBhavnagar Municipal Corporation & Collector Office, Kalanala, Bhavnagar-364 001 • Bhilai: Shop No. 1, First Floor, Plot No.1, Commercial Complex, Nehru Nagar (East), Bhilai-490 020• Bhopal: Kay Kay Business Centre, 133, Zone I, M.P. Nagar, Above City Bank, Bhopal-462 011 • Bhubaneshwar: A/181 , Back Side of Shivam Honda Show Room, Saheed Nagar,Bhubaneswar-751 007 • Bikaner: 70-71, 2nd Floor, Dr. Chahar Building, Panchsati Circle, Sadul Ganj, Bikaner-334 001 • Bokaro: B-1, 1st Floor, City Centre, Sector-4, Near Sona ChandiJwellars, Bokaro-827 004 • Burdwan: 63 G.T. Road, Halder Complex 1st Floor, Burdwan-713 101 • Calicut: 2nd Floor, Soubhagya Shopping Complex, Arayidathpalam, Mavoor Road,Calicut-673 004 • Chandigarh: SCO 2423-2424, Sector 22-C, Chandigarh-160 022 • Chennai: F-11, Akshaya Plaza, 1st Floor, 108, Adhithanar Salai, Egmore, Opp. Chief Metropolitan Court,Chennai-600 002 • Cochin: Ali Arcade, 1st Floor, Kizhavana Road, Panampilly Nagar, Near Atlantis Junction, Ernakualm-682 036 • Coimbatore: 3rd Floor, Jaya Enclave, 1056/1057 AvinashiRoad, Coimbatore-641 018 • Cuttack: P.O. - Buxi Bazar, Cuttack, Opp. Dargha Bazar, Dargha Bazar, Cuttack-753 001 • Dehradun: Kaulagarh Road, Near Sirmaur Margabove, RelianceWebworld, Dehradun-248 001 • Dhanbad: 208 New Market, 2nd Floor, Bank More, Dhanbad-826 001 • Durgapur: 1st Floor, Old Dutta Automobile Bldg., Nachan Road, Benachity, Durgapur-713 213 • Erode: No. 4, Veerappan Traders Complex, KMY Salai, Sathy Road, Opp. Erode Bus Stand, Erode-638 003 • Faridabad: A-2B, 1st Floor, Nehru Groundnit, Faridabad-121 001• Ghaziabad: 1st Floor, C-7, Lohia Nagar, Ghaziabad-201 001 • Gorakhpur: Above V.I.P. Houseajdacent, A.D. Girls College, Bank Road, Gorakpur-273 001 • Gurgaon: Shop No.18, Gr. Floor,Sector-14, Opp. AKD Tower, Near Huda Office, Gurgaon-122 001 • Guwahati: 1st Floor, Bajrangbali Building, Near Bora Service Station, G.S. Road, Guwahati - 781 007 • Gwalior: 2nd Floor,Rajeev Plaza, Jayendra Ganj, Lashkar, Gwalior. M.P.-474 009 • Hubli: CTC No. 483 / A1-A2, Gr. Floor, Shri Ram Plaza, Behind Kotak Mahindra Bank, Club Road, Hubli - 580 029.• Hyderabad: 8-2-596, Avenue 4, Karvy Plaza, Street No. 1, Banjara Hills, Hyderabad-500 034 • Indore: 2nd Floor, 203-205, Balaji Corporates, Above ICICI Bank, 19/1 New Palasia,Indore-452 001 • Jabalpur: Grover Chamber, 43 Naya Bazar Malviya Chowk, Opp. Shyam Market, Jabalpur-482 002 • Jaipur: S-16/A 3rd Floor, Land Mark Building, Opp. Jai Club, MahaverMarg C-Scheme, Jaipur-302 001 • Jalandhar: 1st Floor, Shanti Towers, SCO No. 37, PUDA Complex, Opp. Tehsil Complex, Jalandhar-144 001 • Jalgaon: 113, Navi Peth, B/H MahalaxmiDairy, Jalgaon-425 001 • Jammu: 5 A/D Extension 2, Near Panama Chowk Petrol Pump, Panama Chowk, Jammu-180 012 • Jamnagar: 136-138, Madhav Palaza, Opp. SBI Bank, Near LalBunglow, Jamnagar-361 001 • Jamshedpur: 2nd Floor, R.R. Square, SB Shop Area, Near Reliance Foot Print & Hotel, BS Park Plaza, Main Road, Bistupur, Jamshedpur-831 001 • Jodhpur:203, Modi Arcade, Chopasni Road, Jodhpur-342 001 • Junagadh: 124-125 Punit Shopping Center, M.G. Road, Ranavav Chowk, Junagadh-362 001 • Kanpur: 15/46, B, Gr. Floor, Opp. MuirMills, Civil Lines, Kanpur-208 001 • Karnal: 18/369, Char Chaman, Kunjpura Road, Behind Miglani Hospital, Karnal-132 001 • Kolhapur: 605/1/4, E Ward, Shahupuri 2nd Lane, Laxmi Niwas,Near Sultane Chambers, Kolhapur-416 001 • Kolkata: 166 A, Rashbihari Avenue, 2nd Floor, Opp. Fortish Hospital, Kolkata-700 029 • Kota: 29,1st Floor, Near Lala Lajpat Rai Circle, ShoppingCentre, Kota-324 007 • Kottayam: 1st Floor Csiascension Square, Railway Station Road, Collectorate P. O., Kottayam-686 002 • Lucknow: 24, Prem Nagar, Ashok Marg, Lucknow-226 001• Ludhiana: SCO-136, 1st Floor, Above Airtel Showroom, Feroze Gandhi Market, Ludhiana-141 001 • Madurai: Rakesh Towers, 30-C, 1st Floor, Bye Pass Road, Opp. Nagappa Motors,Madurai-625 010 • Malda: Sahis Tuli, Under Ward No.6, No.1 Govt Colony, English Bazar Municipality, Malda-732 101 • Mangalore: Mahendra Arcade, Opp. Court Road, Karangal Padi,Mangalore-575 003 • Meerut: 1st Floor, Medi Centre, Opp. ICICI Bank, Hapur Road, Near Bachha Park, Meerut-250 002 • Mehsana: Ul-47, Apollo Enclave, Opp. Simandhar Temple, ModheraCross Road, Mehsana-384 002 • Moradabad: Om Arcade, Parker Road, Above Syndicate Bank, Chowk Tari Khana, Moradabad-244 001 • Mumbai: 24/B, Raja Bahadur Compound, AmbalalDoshi Marg, Behind BSE Bldg., Fort, Mumbai-400 001 • Mumbai - Borivali: Gr. Floor, Himanshu Bldg., Sodawala Lane, Lina Chandawarkar Road, Borivali, Mumbai-400 091• Mumbai - Thane: 101, Yashwant Building, Ram Ganesh, Godkari Path, Ram Maruti Road, Naupada, Thane-400 602 • Muzaffarpur: 1st Floor, Uma Market, Thana Gumtimoti Jheel, Muzaffarpur-842 001• Mysore: L-350, Silver Tower, Ashoka Road, Opp. Clock Tower, Mysore-570 001 • Nadiad: 104/105, Near Paras Cinema, City Point Nadiad, Nadiad-387 001 • Nagpur: Plot No. 2/1, HouseNo 102/1, Mangaldeep Appartment, Mata Mandir Road, Opp. Khandelwal Jewelers, Dharampeth, Nagpur-440 010 • Nasik: S-12,Suyojit Sankul, Sharanpur Road, Near Rajiv Gandhi Bhavan,Nasik-422 002 • Navsari: 1/1 Chinmay Aracade, Opp. Sattapir Road, Tower Road, Navsari-396 445 • New Delhi: 305, New Delhi House, 27, Barakhamba Road, New Delhi -110 001• Noida: 307, Jaipuria Plaza, D-68-A, 2nd Floor, Opp. Delhi Public School, Sector 26, Noida-201 301 • Panipat: 1st Floor, Krishna Tower, Above Amertex, G.T. Road, Panipat-132 103• Panjim: City Business Centre, Coelho Pereira Building, Room No. 18,19 & 20, Dada Vaidya Road, Panjim-403 001 • Patiala: SCO-27 D, Chotti Baradari, Near Car Bazaar, Patiala-147 001• Patna: 3-A, 3rd Floor, Anand Tower, Exhibition Road, Opp. ICICI Bank, Patna-800 001 • Pondicherry: No. 7, Thiayagaraja Street, Pondicherry-605 001 • Pune: Office # 16, Gr. Floor, ShrinathPlaza, Near Dyaneshwar Paduka Chowk , F. C. Road, Pune-411 005 • Raipur: 2 & 3, Lower Level, Millenium Plaza, Room No. L 1, 2 & 3, Behind Indian Coffee House, Raipur-492 001 • Rajkot:104, Siddhi Vinyak Complex, Opp. Ramkrishna Ashram, Dr. Yagnik Road, Rajkot, Rajkot-360 001 • Ranchi: Room No. 307, 3rd Floor, Commerce Tower, Beside Mahabir Tower, Ranchi-834 001• Rourkela: 1st Floor, Sandhu Complex, Kachery Road, Uditnagar, Rourekla-769 012 • Salem: No. 40, 2nd Floor, Brindavan Road, Fairlands, Near Perumal Koil, Salem-636 016 • Shillong:Annex Mani Bhawan, Lower Thana Road, Near R K M Lp School, Shillong-793 001 • Shimla: Triveni Building, By Pas Chowkkhallini, Shimla-171 002 • Siliguri: Nanak Complex, Sevoke Road,Siliguri-734 001 • Surat: G-5, Empire State Buliding, Near Udhna Darwaja, Ring Road, Surat-395 002 • Tirunelveli: 55/18, Jeney Building, S.N. Road, Near Aravind Eye Hospital, Tirunelveli-627001 • Trichur: 2nd Floor, Brothers Complex, Naikkanal Junction, Shornur Road, Near Dhanalakshmi Bank H O, Thrissur-680 001 • Trichy: 60, Sri Krishna Arcade, Thennur High Road, Trichy-620 017 • Trivandrum: 2nd Floor, Akshaya Tower, Sasthamangalam, Trivandrum-695 010 • Udaipur: 201-202, Madhav Chambers, Opp. G P O., Chetak Circle, Udaipur-313 001 • Vadodara:SB-5, Mangaldeep Complex, Opp. Masonic Hall, Productivity Road, Alkapuri, Baroda-390 007 • Valsad: Shop No. 2 , Phiroza Corner, Opp. Next Show Room, Tithal Road, Valsad-396 001• Vapi: Shop No. 12, Ground Floor, Sheetal Appatment, Near K.P. Tower, Vapi-396 195 • Varanasi: D-64/132, 1st Floor, Anant Complex, Sigra, Varanashi-221 010 • Vellore: No. 1, M. N. R.Arcade, Officers Line, Krishna Nagar, Vellore-632 001 • Vijayawada: 39-10-7, Opp. Municipal Water Tank, Labbipet, Vijayawada-520 010 • Visakhapatnam: Door No: 48-8-7, DwarakaDimond, Gr. Floor, Srinagar, Visakhapatnam - 530 016 • Warangal: 5-6-95, 1st Floor, Opp. B.Ed Collage, Lashkar Bazar, Chandra Complex, Hanmakonda, Warangal-506 001.
Name, Address and Website of Registrar:Karvy Computershare Pvt. Ltd. (Unit: Principal Mutual Fund),
Karvy Registry House, #8-2-596, Avenue 4, Street No. 1, Banjara hills, Hyderabad-500 034. Website: www.karvycomputershare.com
For any enquiries and / or queries, investors are advised to address a suitable communication to AMC at: