faculty of electrical engineering, mathematics & computer...
TRANSCRIPT

i
Faculty of Electrical Engineering, Mathematics & Computer Science
Bachelor thesis creative technology
July 2018
Jeroen Waterink Supervisor:
ir. ing. R.G.A. Bults
Critical Observer:
ir. J. Scholten

ii

iii
ABSTRACT
Climate change and urbanization are two inevitable increasing challenges that cities
have to deal with. The increasing amount of people migrating to the cities and the
effects of climate change can cause problems that influence the quality of life in the
cities. One of these problems is heavy rainfall. One of the cities dealing with this is
the city of Enschede. Because of the way the city of Enschede is build it cannot
handle heavy rainfall very well, resulting in flooding of streets and basements. In
order to deal with this problem, the concept of the Smart Rainwater Buffer was
ideated. Which is a smart rainwater buffering system which can be installed and
connected to the roofs of the inhabitants of Enschede. The system buffers water
during rainfall and makes sure it has enough capacity for the next rain shower. The
rainwater can be used locally, promoting to waste less drinking water. By installing
large numbers of these buffers, it is possible to reduce the strain on the sewage
system during rainfall, preventing flooding issues.
This bachelor thesis describes the process of developing a DIY and consumer ready
Smart Rainwater Buffer. A literature research on Design for DIY was conducted to
design the system to be easy to assemble by the user. Next to that research was
conducted on data communication technologies for smart city IoT and fluid level
measurement techniques. Several concepts were ideated, from which one concept
was chosen by the stakeholders. This final concept was used to build a prototype of
the DIY and consumer ready Smart Rainwater Buffer. The prototype incorporates a
newly designed sensor module suitable for most rainwater barrels. The complete
system was designed to be as robust, reliable, and user friendly as possible. The
evaluation of the prototype showed that it is ready to be tested in a pilot project
with inhabitants of the city of Enschede.

iv

v
ACKNOWLEDGEMENTS
There are several people who I would like to explicitly thank for their help and
support during this project. First of all, I would like to thank my supervisor Richard
Bults and my critical observer Hans Scholten for their supervision and guidance
throughout this project. Furthermore, I would also like to thank Hendrik-Jan
Teekens from the municipality of Enschede for his useful input in the design
process of this project.
Moreover, I would like to thank my team members from the Smart Rainwater Buffer
team for their dedication and pleasant cooperation during this project.

vi

vii
CONTENTS
ABSTRACT ............................................................................................................ III
ACKNOWLEDGEMENTS ............................................................................................. V
LIST OF ABBREVIATIONS ...................................................................................... XI
LIST OF FIGURES ................................................................................................ XIII
1. INTRODUCTION ................................................................................................. 1
1.1 PROBLEM ............................................................................................................ 1 1.2 GOAL ................................................................................................................. 2 1.3 REPORT OUTLINE ................................................................................................... 3
2. STATE OF THE ART ............................................................................................. 5
2.1 BACKGROUND INFORMATION ...................................................................................... 5 2.1.1 History of water management in Enschede .................................................................................. 5 2.1.2 Climate adaptive Enschede ...................................................................................................... 6 2.1.3 Expert opinion ....................................................................................................................... 6
2.2 PREVIOUS RESEARCH ............................................................................................... 7 2.4 LITERATURE RESEARCH ............................................................................................ 9
2.4.1 Design for DIY ....................................................................................................................... 9 2.5 RELATED RESEARCH .............................................................................................. 13
2.5.1 Similar projects .................................................................................................................... 13 2.5.2 Alternative water buffering solutions ........................................................................................ 22 2.5.3 Expert opinion, rain barrels .................................................................................................... 24
2.6 CONCLUSION ...................................................................................................... 25
3. METHODS AND TECHNIQUES ............................................................................. 27
3.1 CREATIVE TECHNOLOGY DESIGN PROCESS ................................................................... 27 3.1.1 Ideation .............................................................................................................................. 29 3.1.2 Specification ........................................................................................................................ 30 3.1.3 Realization .......................................................................................................................... 30 3.1.4 Evaluation ........................................................................................................................... 30
3.2 STAKEHOLDER IDENTIFICATION ................................................................................ 30 3.3 REQUIREMENT ELICITATION ..................................................................................... 31
3.3.1 MoSCoW ............................................................................................................................. 31 3.3.2 Functional and non-functional requirements .............................................................................. 31
3.4 SCENARIOS ........................................................................................................ 32 3.4.1 PACT .................................................................................................................................. 32
3.5 CONCEPT GENERATION ........................................................................................... 32 3.5.1 Group brainstorming ............................................................................................................. 32 3.5.2 Individual brainstorming ........................................................................................................ 32
3.6 INTERVIEWS ....................................................................................................... 33 3.6.1 Semi-structured interviews .................................................................................................... 33 3.6.2 Unstructured interviews ......................................................................................................... 33
3.7 FUNCTIONAL SYSTEM ARCHITECTURE .......................................................................... 33 3.7.1 Level approach .................................................................................................................... 33 3.7.2 UML Activity Diagrams .......................................................................................................... 34
4. IDEATION .......................................................................................................... 35

viii
4.1 STAKEHOLDER IDENTIFICATION ................................................................................ 35 4.2 INTERVIEWS ....................................................................................................... 37
4.2.1 Municipality ......................................................................................................................... 37 4.2.2 Waterboard ......................................................................................................................... 39 4.2.3 University ........................................................................................................................... 40 4.2.4 Co-developers ..................................................................................................................... 40
4.3 SCENARIOS ........................................................................................................ 41 4.3.1 PACT pre-analysis ................................................................................................................ 42 4.3.2 Specific PACT analysis ........................................................................................................... 44
4.4 PRELIMINARY REQUIREMENTS ................................................................................... 46 4.5 CONCEPTS ......................................................................................................... 48
4.5.1 Smart Art – Rain delay .......................................................................................................... 48 4.5.2 Delay roof ........................................................................................................................... 49 4.5.3 SRB Garden Furniture ........................................................................................................... 49 4.5.4 SRB flat room module ........................................................................................................... 50 4.5.5 SRB rain floor ...................................................................................................................... 51 4.5.6 Underground SRB ................................................................................................................. 51 4.5.7 Rain pipe SRB ...................................................................................................................... 52 4.5.8 Water Fence SRB ................................................................................................................. 53 4.5.9 DIY Water Fence SRB ............................................................................................................ 53 4.5.10 Wall mounted SRB: Small footprint large capacity .................................................................... 57 4.5.11 SRB DIY module ................................................................................................................. 59 4.5.12 SRB rain barrel................................................................................................................... 59
4.6 EVALUATION ....................................................................................................... 60 4.7 FINAL CONCEPT ................................................................................................... 63 4.8 EVALUATED PRELIMINARY REQUIREMENTS ..................................................................... 64
5 SPECIFICATION ............................................................................................... 67
5.1 FUNCTIONAL SYSTEM ARCHITECTURE .......................................................................... 67 5.1.1 Level 0: System overview ...................................................................................................... 67 5.1.2 Level 1: SRB combined functions ........................................................................................... 68 5.1.3 Level 2: SRB function description ........................................................................................... 71
5.2 FINAL REQUIREMENTS ........................................................................................... 72
6 REALIZATION ..................................................................................................... 75
6.0 DECOMPOSITION OF FINAL CONCEPT ........................................................................... 75 6.1 COMPONENTS ..................................................................................................... 76
6.1.1 Barrels ............................................................................................................................... 76 6.1.2 Filtering .............................................................................................................................. 77 6.1.3 Input, overflow, and output .................................................................................................... 80 6.1.4 Valves ................................................................................................................................ 81 6.1.5 Controller ........................................................................................................................... 82 6.1.6 Network connection .............................................................................................................. 83 6.1.7 Sensors .............................................................................................................................. 95 6.1.8 Power sources .................................................................................................................... 104 6.1.9 Software ............................................................................................................................ 107 6.1.10 Data sources..................................................................................................................... 108
6.2 SUBSYSTEM REALIZATION ..................................................................................... 108 6.2.1 Valve control ...................................................................................................................... 108 6.2.2 Fluid level measuring ........................................................................................................... 110 6.2.3 Temperature measuring ....................................................................................................... 116 6.2.4 Networking and Logic ........................................................................................................... 116 6.2.5 Filtering ............................................................................................................................. 117 6.2.6 Weather prediction data and logic .......................................................................................... 119
6.3 PROTOTYPES .................................................................................................... 120 6.3.1 Version 1.0: Test version ...................................................................................................... 120 6.3.2 Version 2.0: DIY Consumer version ........................................................................................ 123

ix
7 EVALUATION.................................................................................................... 133
7.1 REQUIREMENTS EVALUATION .................................................................................. 133 7.2 PRICE EVALUATION ............................................................................................. 134 7.3 DESIGN FOR DIY EVALUATION ................................................................................ 135
7.3.1 Design for assembly ............................................................................................................ 135 7.3.2 Evaluating assembly complexity ............................................................................................. 136 7.3.3 Conclusion ......................................................................................................................... 137
7.4 SOFTWARE TESTS ............................................................................................... 137 7.5 STAKEHOLDER FEEDBACK ...................................................................................... 138
Conclusion ................................................................................................................................. 138
8 CONCLUSION AND RECOMMENDATIONS ................................................................ 139
8.1 CONCLUSION .................................................................................................... 139 8.2 RECOMMENDATIONS ............................................................................................ 141
REFERENCES ........................................................................................................ 143
APPENDIX ........................................................................................................... 153
A. RESULT BRAINSTORM ............................................................................................ 153 B. BARREL COMPARISON ............................................................................................ 154 C. RELEVANT IOT NETWORKING PROJECTS ....................................................................... 157 D. DATA SOURCES ................................................................................................... 159 E. PART LIST – FINAL PROTOTYPE ................................................................................. 162 F. VALVE SPECIFICATIONS .......................................................................................... 166 G. VALVE TEST ....................................................................................................... 167 H. ULTRASONIC SENSOR MEASUREMENT TESTS .................................................................. 169 I. EVALUATED REQUIREMENTS ..................................................................................... 174

x

xi
LIST OF ABBREVIATIONS
AirT Air Temperature monitoring
API Application Programming Interface
CTDP Creative Technology Design Process
DIY Do It Yourself
DP Differential-Pressure
IoT Internet of Things
LPWAN Low Power Wireless Area Network
OTA Over-The-Air
SRB Smart Rainwater Buffer
UI User Interface
US Ultrasonic
WLAN Wireless Local Area Network
WPAN Wireless Personal Area Network

xii

xiii
LIST OF FIGURES
Figure 1: Height map of Enschede .................................................................... 1
Figure 2: History of Enschede and water management ........................................ 5
Figure 3: De slimme regenton ....................................................................... 13
Figure 4: RainGrid basic version modules/parts ................................................ 14
Figure 5: RainGrid basic version installed ........................................................ 15
Figure 6: RainGrid controller installed ............................................................. 16
Figure 7: RainGrid dashboard web interface .................................................... 16
Figure 8: Opti installed system ...................................................................... 18
Figure 9: Opti system 3d model ..................................................................... 19
Figure 10: Opti dashboard ............................................................................ 19
Figure 11: Loxone Rain water harvesting project .............................................. 20
Figure 12: OTA-Analytics Smart Rainwater Management System installed ........... 21
Figure 13: Underground rainwater harvesting system ....................................... 22
Figure 14: Modular underground storm water tank system ................................ 23
Figure 15: Atlantis D-rain tank storm water management system. ...................... 23
Figure 16: Creative Technology Design Process ................................................ 28
Figure 17: Time division of altered Creative Technology Design Process .............. 29
Figure 18: Level approach example of system A and sub functions ..................... 34
Figure 19: Power-Interest matrix based on theory of Mendelow (1991) ............... 36
Figure 20: "Gaten kaas" rain delaying art concept ............................................ 48
Figure 21: Rain delaying flat roof concept ....................................................... 49
Figure 22: SRB Garden Furniture concepts. ..................................................... 50
Figure 23: SRB flat roof module concept ......................................................... 50
Figure 24: Smart rain floor concept ................................................................ 51
Figure 25: Underground SRB concepts ............................................................ 52
Figure 26: Rain pipe SRB concept .................................................................. 52
Figure 27: Rainwinner Water Fence. ............................................................... 53
Figure 28: Steel stone Cage inspiration. .......................................................... 55
Figure 29: Industrial Plastic Sheeting. ............................................................ 55
Figure 30: DIY water fence concept ................................................................ 55
Figure 31: Roll’n snap closure technique. ........................................................ 56
Figure 32: DIY water fence outlet concept ....................................................... 56
Figure 33: Common terraced houses in the Netherlands .................................... 57
Figure 34: SRB wall mounted concept ............................................................. 58
Figure 35: Concept in context ........................................................................ 58
Figure 36: SRB DIY module concept ............................................................... 59
Figure 37: SRB barrel concept ....................................................................... 60
Figure 38: SRB power source options ............................................................ 61
Figure 39: SRB concepts ............................................................................... 62
Figure 40: SRB local water usage concepts and extended version ....................... 63
xiv
Figure 41: Final SRB concept ......................................................................... 64
Figure 42: Overview of SRB system ................................................................ 68
Figure 43: SRB decomposition ....................................................................... 69
Figure 44: SRB activity diagram ..................................................................... 70
Figure 45: Decomposition of discharge function ............................................... 71
Figure 46: Decomposition of temperature measure function .............................. 71
Figure 47: Decomposition of water level measure function ............................... 72
Figure 48: Garantia Rain buffer...................................................................... 77
Figure 49: Downspout filter ........................................................................... 77
Figure 50: Leaf guard ................................................................................... 78
Figure 51: Filter guard in barrel input connector............................................... 78
Figure 52: Nylon filter mesh .......................................................................... 79
Figure 53: Filter mesh concepts ..................................................................... 79
Figure 54: downspout-gutter connector and a rubber ring ................................. 80
Figure 55: Skin fitting .................................................................................. 80
Figure 56: JP Fluid Control 12v 1/2-inch valve ................................................. 82
Figure 57: CWX 5v 1-1/4-inch valve ............................................................... 82
Figure 58: float sensor ................................................................................. 96
Figure 59: Displacer, Bubbler, DP sensor......................................................... 97
Figure 60: Load cell. .................................................................................... 98
Figure 61: Capacitance Transmitter ................................................................ 98
Figure 62: Magnetostrictive level transmitter ................................................... 98
Figure 63: Ultrasonic sensor .......................................................................... 99
Figure 64: Ultrasonic level sensor working principle .......................................... 99
Figure 65: Radar level transmitter working principle ......................................... 99
Figure 66: US sensor with pipe waveguide .................................................... 101
Figure 67: US sensor with horn waveguide. ................................................... 101
Figure 68: US sensor without waveguide ....................................................... 101
Figure 69: Ultrasonic pulse principal. ............................................................ 101
Figure 70: Waveguide specification. ............................................................. 102
Figure 71: Siemens waveguide pipe ratio. ..................................................... 103
Figure 72: DS18B20 digital temperature sensor. ............................................ 104
Figure 73: CWX-15 DN32 5v CR02 ball valve ................................................. 109
Figure 74: CR02 configuration. .................................................................... 109
Figure 75: Valve control circuit using HL-52S V1.0 2 relay module .................... 109
Figure 76: US-100 ..................................................................................... 110
Figure 77: HC-SR04P ................................................................................. 110
Figure 78: JSN-SR04T-2.0 .......................................................................... 110
Figure 79: 40 KHz ultrasonic transceiver unit ................................................. 110
Figure 80:Fluid level measuring concept 1. .................................................... 111
Figure 81: Concept 1 prototype ................................................................... 111
Figure 82: Fluid level measuring concept 2. ................................................... 112
Figure 83: Concept 2 prototype ................................................................... 112
Figure 84: Concept 3 prototype ................................................................... 114
Figure 85: pipe wave guide with air vent holes .............................................. 114
xv
Figure 86: intersection of sensor module showing air vent concept ................... 114
Figure 87: concept 4 prototype .................................................................... 115
Figure 88: concept of sensor module showing wave guide concept ................... 115
Figure 89: DS18B20 wiring scheme .............................................................. 116
Figure 90: Prototype nylon filter socks in different sizes .................................. 118
Figure 91: Filter adapter prototype ............................................................... 118
Figure 92: Filter sock after rain shower ......................................................... 119
Figure 93: Prototype version 1.0 installed ..................................................... 121
Figure 94: Prototype 1 situation ................................................................... 121
Figure 95: packaging of final design ............................................................. 123
Figure 96: Final design ............................................................................... 125
Figure 97: Final design ............................................................................... 126
Figure 98: exploded view final design ........................................................... 127
Figure 99: Connecting to local SRB Wi-Fi network .......................................... 128
Figure 100: Wi-Fi setup interface ................................................................. 128
Figure 101: SRB by and connected services ................................................... 130
Figure 102: Wiring final prototype ................................................................ 132
Figure 103: SRB price analysis .................................................................... 135

xvi
1
1. INTRODUCTION
1.1 Problem Climate change and urbanization are two inevitable increasing challenges that cities
have to deal with. The increasing amount of people migrating to the cities and the
effects of climate change can cause problems that influence the quality of life in the
cities. Problems like air pollution, increasing temperatures and extreme rainfall are
becoming increasingly harder to deal with. One of the problems that arises is the
flooding of streets. Because of all the concrete and asphalt the overall water runoff
volume of the infrastructure is simply not high enough anymore [1].
Cities in the Netherlands have to adapt to these circumstances. In order to ensure
and improve the quality of living in the city, more and more cities start to solve these
challenges using technology. They want to become Smart Cities, by the use of smart
algorithms, sensor networks, and cloud computing [2].
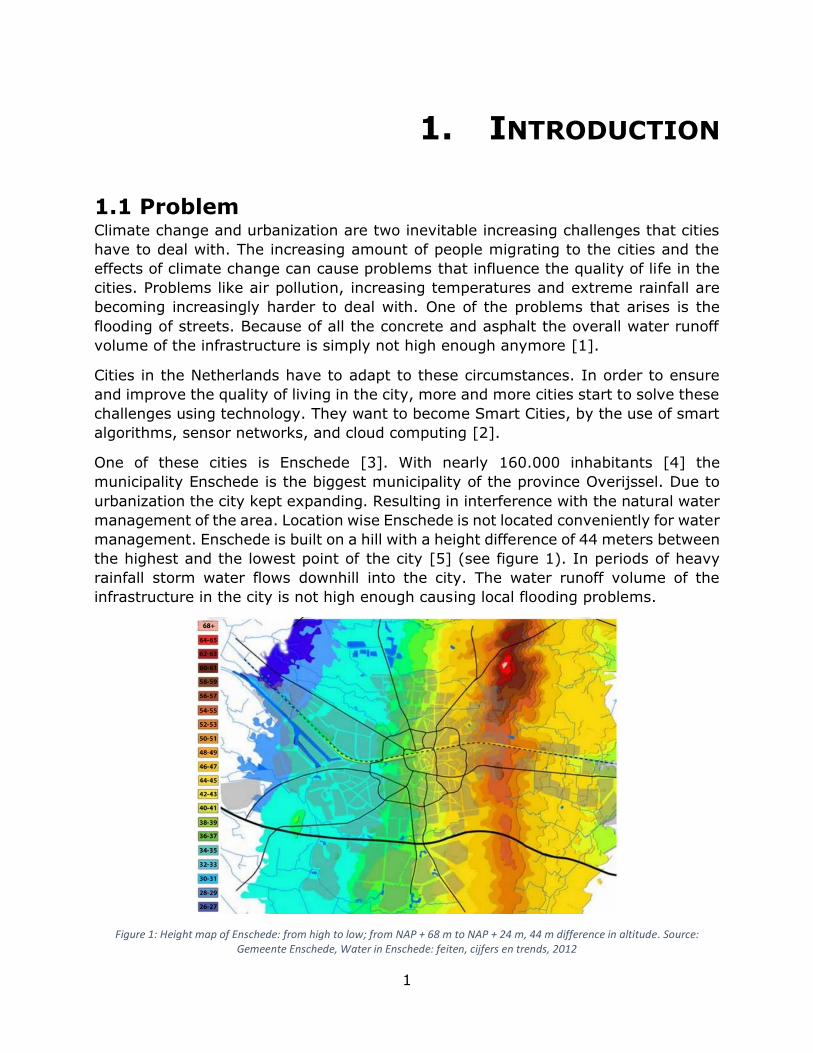
One of these cities is Enschede [3]. With nearly 160.000 inhabitants [4] the
municipality Enschede is the biggest municipality of the province Overijssel. Due to
urbanization the city kept expanding. Resulting in interference with the natural water
management of the area. Location wise Enschede is not located conveniently for water
management. Enschede is built on a hill with a height difference of 44 meters between
the highest and the lowest point of the city [5] (see figure 1). In periods of heavy
rainfall storm water flows downhill into the city. The water runoff volume of the
infrastructure in the city is not high enough causing local flooding problems.
Figure 1: Height map of Enschede: from high to low; from NAP + 68 m to NAP + 24 m, 44 m difference in altitude. Source: Gemeente Enschede, Water in Enschede: feiten, cijfers en trends, 2012

2
Together with the waterboard Vechtstromen [6] and the University of Twente [7], the
municipality Enschede started the Climate Adaptive City Enschede project [7]. The
goal of the project is to let the city of Enschede adapt to climate changes. One of the
parts of the Climate Adaptive City Enschede project and this graduation project is the
development of the Smart Rainwater Buffer (SRB). The concept of the SRB is a smart
rainwater buffer that act on the weather predictions for rainfall. The system collects
rainwater during rainfall and releases the buffered water prior to predicted rainfall,
resulting in less strain on the sewage system during the critical times of heavy rainfall.
The SRB is in development for over a year now and is ready to be redesigned for the
use by early adopters.
1.2 Goal The goal of the project is to redesign the SRB for the use by early adopters1. Which
means that the system needs to be designed for a Do It Yourself (DIY) and needs to
be consumer ready. At the end of the project there should be a working prototype of
the redesigned SRB. Which should be able to be produced in large quantities of 20 to
50 units, ready to be installed by the early adopters.
To reach the goal of a redesigned DIY and customer ready SRB the project is split
into two parts. The first part being the redesign of the technical side of the system.
The Second part being the design of a Do It Yourself (DIY) system. This graduation
project will focus on the redesign of the technical part of the SRB and the design for
DIY, but no on the design of the actual DIY.
To reach the beter understand the goal of this graduation project there first needs to
be a clear definition of “DIY” and “consumer ready” in the context of this research.
For this research DIY is seen as “design for DIY”, the developed solution should be
designed to be compatible to be used as a DIY project. The design of the DIY project
including instructions will not be part of this research. It is also important to define
what is meant with “consumer ready” in the context of this research. For this research
a consumer ready SRB will be seen as a product that can be used without the need
of having technical knowledge about the system. It must work reliably and contains
all needed functionalities. After the setup of the system the system must not require
any technical maintenance.
Based on the previous presented problem statement and project goal the main focus
of this thesis will be:
“How to develop a DIY and consumer ready Smart Rainwater Buffer for deployment
in the city of Enschede?”
1 Based on the innovation theory of rogers, early adopters can be seen as the pioneers of
consumers. An early adapter is someone who starts using a certain product before it is used
by the masses [53].

3
1.3 Report outline The outline of this report is as follows. Chapter 2, the background analysis, starts with
background information on water management and climate adaptation in Enschede.
Furthermore, an overview is given on the previous research that has been done on
the SRB. The remainder of this chapter contains Literature research on design for DIY
and a state of the art. Chapter 3 describes the methods and techniques that are used
in this project. Chapter 4, the ideation chapter, identifies the stakeholders and their
requirements. Several concepts were created from which one was chosen by the
stakeholders. Chapter 5, the specification, uses the final concept of the previous
chapter as input to specify the functionality of the system. Chapter 6 deals with the
realization of the prototype and all the research that was done to create the prototype.
Chapter 7 contains the evaluation of the prototype and chapter 8 features the
conclusion and further recommendations for the project.

4

5
2. STATE OF THE ART
This chapter starts with background information on water management and climate
adaptation in Enschede. Furthermore, an overview is given on the previous research
that has been done on the SRB. Then, a literature review on design for DIY is
conducted, as well as a review of related research on smart rainwater buffers.
Finally, the chapter is concluded by evaluation the relevance of the research
question.
2.1 Background information
2.1.1 History of water management in Enschede
Before the early 1850’s the water management of Enschede was not influenced much
by its inhabitants. The water mainly followed its natural course. The hardened
surfaces were very limited making it easy for storm water to infiltrate into the ground.
Around 1930 the textile industry started expanding. This resulted in that the
groundwater level got lower because the textile factories used large amounts of
groundwater. With the growth of the industry also workers' districts were required.
This resulted in that Enschede grew further on the lower side of the hill because the
originally wet spots were now dried up (see figure 2).
Nowadays the textile industry has completely disappeared from Enschede, causing
the ground water levels to rise again. The rising of the groundwater level caused lots
of problems, for example basements that leak water or streets that flood because the
water doesn’t get absorbed enough in the ground. Next to the groundwater problem,
climate change also results in more and extreme rainfall. Making the strain on the
sewage system of Enschede too high. The overall water runoff volume of the
infrastructure is simply not high enough anymore to keep the water out of the city
[5].
Figure 2: History of Enschede and water management, Source: Gemeente Enschede

6
2.1.2 Climate adaptive Enschede
To deal with the challenges that arise from climate change, the municipality of
Enschede and the University of Twente started the Climate Adaptive City project. The
goal of this project is to let the city of Enschede adapt to particular aspects of climate
change. At the moment the project consists of two parts: 1) the Smart Rainwater
Buffer, and 2) Air Temperature monitoring (AirT). Both will use one central data
repository for data storage. There will also be a monitoring dashboard available,
displaying the status of the SRB and AirT system. The project was started in the
beginning of 2017 with research on the Smart Rainwater Buffer. Two prototypes were
developed. In Q2 and Q3 of 2018 five prototypes will be used for a pre-pilot. In the
pre-pilot five innovators will be testing and co-developing the system. In Q4 there is
a pilot test planned this pilot test will make use of the to be redesigned SRB. This
pilot will include approximately 10 SRB systems [8].
The redesign of the SRB will take place in Q1 and Q2 of 2018. As stated before the
redesign of the SRB consists out of two parts. The first part being the redesign of the
technical side of the system. The second part being the design of a Do It Yourself
(DIY). This research will focus on the technical part, but there will be a close
collaboration with the other part, mainly on the redesign of physical components of
the system.
Additionally, there will be a collaboration with the researchers responsible for the data
repository, AirT, interface design and awareness. The SRB systems will be connected
to the main data repository just like the AirT systems and the monitoring dashboard.
The data repository will store and process the data gathered from the SRB and AirT
systems.
2.1.3 Expert opinion
As an extension on the background analysis a small interview was conducted with
Hendrik Jan Teekens, water management designer at the municipality of Enschede.
Teekens confirmed the findings in the background analysis section on the water
management of Enschede. He pointed out that the main problems are ground water
problems. In case of large scale problems like the flooding of streets, the municipality
will take responsibility. But smaller problems that only affect a few households are
the responsibility of the home owners themselves. In this case an SRB could work not
only beneficial for the strain on the sewage system but it would also be directly
beneficial for the owners.

7
2.2 Previous research The Smart Rainwater Buffer was ideated in 2016 at a creathon organized by the
University of Twente in collaboration with the waterboard Vechtstromen and the
municipality Enschede [9]. In 2017 this idea was developed further in three
graduation projects of the university. The two graduates Steeghs [10] and Rindt [11]
translated the idea into a product concept while graduate Vetter [12] also worked on
a version of the SRB. In 2018 a fourth graduate student, Defize [13], investigated
the possible barriers to introduce a Smart Rainwater Buffer in Enschede. Early 2018,
Groeneveld [14] continued the research on the fluid level measurement technique of
the prototype.
In 2017 Vetter [12] did research on the Smart Rainwater Buffer. The focus of his
research was centered around finding a solution to reduce the strain on the sewage
system of Enschede during rain fall. He listed requirement that the potential solution
should have. During his ideation phase he concluded together with the client,
municipality of Enschede, that the Smart Rainwater Buffer concept has the most
potential. Further in his research he proposed a setup using water fences, because
this solution takes up the least amount of space in a typical city backyard and this
solution is modular. The water fences are easy to connect to each other which allows
the system to be modular and usable in small and large scale. The final stage of his
research was also to make a prototype.
During the development of the prototype and the evaluation of his research Vetter
made the following, relevant to this current research, recommendations. One of his
recommendations is to use a different type of ultrasonic sensor for fluid level
measuring. The HC-SR04 used in his prototype is very sensitive to small disruptions.
One other recommendation proposed by the client, the municipality of Enschede, is
to implement the functionality to automatically discharge the water in the buffer into
the garden. Because in the summer the water level in the soil in Enschede are too
low. The client also proposed automatic discharge if the water in the buffer has a risk
of developing the legionella bacteria, caused by long term high water temperatures.
Vetter also recommended to equip the Smart Rainwater buffers with a rain meter.
Using the data of a rain meter and other rain meters in the area to predict in what
direction a rain cloud is going. Vetter also proposed a display on the Smart Rainwater
Buffer to inform the user about the state of the system. During his research Vetter
also concluded that a ball valve is the best option for a valve to empty the buffer.
Because this type of valve works best for narrow pipes, and this valve can still work
if the water is a bit dirty. Finally, Vetter recommended to research other option than
Wi-Fi as network connection in order to lower the dependency on the system owners
own Wi-Fi network. He proposed researching the use of a LoRa network [12].
Steeghs [10] and Rindt [11] both did research on converting the idea of the Smart
Rainwater Buffer in to a feasible and realistic concept. They first listed the
requirements for the system and end users. Then they used these requirements to
build a first prototype. The prototype consisted of a working smart rain barrel and a
web interface.

8
One of the recommendations of their research that is relevant to this research is to
use more accurate sensors. In the first prototype flow sensors were used but these
are only accurate when used with a minimal water pressure. Another recommendation
is to not only use Buienradar [15] for the rainfall predictions but also use the data of
weather stations in the area. Using the weather station data to predict in what
direction a rain cloud is going. They also recommended to add a temperature sensor
to the system. Hence, the system can act on temperature changes like freezing or
long term high temperatures which increase the risk for legionella in the buffered
water. The final recommendation was that the system should be designed to be
implemented in different buffers of different sizes, allowing for flexibility and
applications in different situations. One thing that stood out in all the prototypes of
Steeghs, Rindt, and Vetter is that all prototypes need a 230-volt power source,
meaning that they need a physical wall socket outside the house at the location of
the SRB.
In 2018 Defize [13] also did research on the Smart Rainwater Buffer but this research
was mostly focused on investigating the possible barriers to introduce a Smart
Rainwater Buffer in Enschede. Some interesting conclusions were drawn from his
research. One of these conclusions is that sustainability is the main motivation of the
people interested in the SRB. Defize also recommends using a SRB DIY kit for the
tests with early adopters. This is because his research showed that there are strong
preferences and rejections for certain buffer designs. Because of this the final product
should be customizable to personal preferences. He claims that customers should
have the option to purchase a DIY-kit, with optional buffer designs and optional
installation service. He also proposed the idea of making a separate “smart module”.
He envisions a solution that a rainwater buffer can be made smart with a separate
module that can be attached to an existing or new buffer. The remainder of his
research is more on the societal aspects of the project but not relevant for the scope
of this research.
In early 2018 Groeneveld [14] was the last person to research the SRB. His research
was focused on a sensing technique to automatically determine the capacity of the
SRB. During his research he used an ultrasonic sensor to measure the distance
between the top of the buffer and the surface of the fluid in the buffer. He found out
that the ultrasonic sensor gets more accurate if instead of one ultrasonic wave, a
burst of multiple waves is used to calculate the fluid level in the buffer. The average
distance calculation of the burst is more accurate than a measurement using only one
ultrasonic wave. Groeneveld also concluded that when using an ultrasonic sensor in
a closed barrel, there will be echo’s which will be received as noise by the sensor. He
recommended the use of an algorithm that can filter the noise. He also recommends
looking into different sensing techniques for fluid level measurement [14].
9
Conclusion
What can be concluded from the previous research is that there is more research
needed in finding reliable measurement methods. In a consumer ready product, it is
very important that the system works consistently meaning that reliable
measurements are a must. What also can be concluded is that it is important that the
system can autonomously handle indirect effects of the weather. Like the increased
risk of legionella and the freezing of the water inside the barrel. Another point to
research is making the system modular and suitable for a DIY product. Furthermore,
it can be concluded that there is a need to research possible other weather prediction
sources than Buienradar, and the use of local rain meters to predict the direction of
rain clouds. Also, the dependency on the SRB owners’ home network might be an
unreliability and it is worth researching other wireless data communication
technologies (e.g. LoRa).
One thing that also stand out is that both prototypes need a 230-volt power source,
meaning that they need a physical wall socket outside the house at the location of
the SRB. One could imagine that not all future users have a 230v power plug at the
potential location of the Smart Rainwater Buffer. Therefore, it is worth researching if
the power supply could also be a battery with a small solar panel for example.
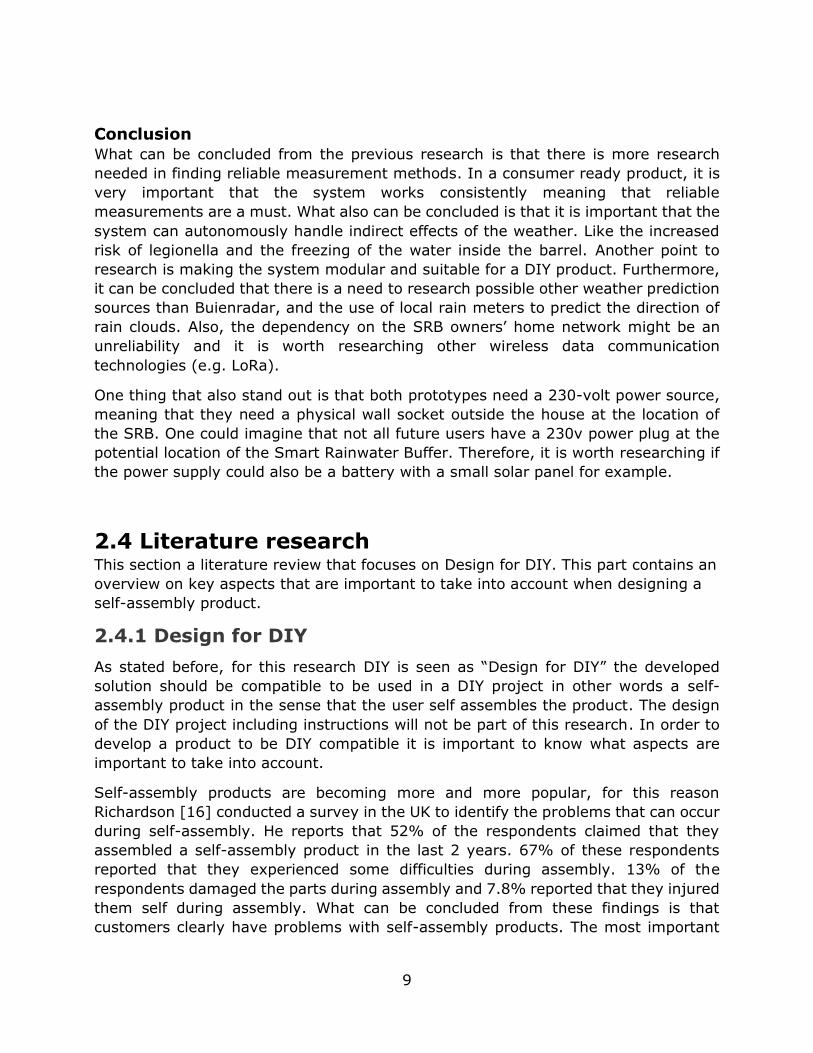
2.4 Literature research This section a literature review that focuses on Design for DIY. This part contains an
overview on key aspects that are important to take into account when designing a
self-assembly product.
2.4.1 Design for DIY
As stated before, for this research DIY is seen as “Design for DIY” the developed
solution should be compatible to be used in a DIY project in other words a self-
assembly product in the sense that the user self assembles the product. The design
of the DIY project including instructions will not be part of this research. In order to
develop a product to be DIY compatible it is important to know what aspects are
important to take into account.
Self-assembly products are becoming more and more popular, for this reason
Richardson [16] conducted a survey in the UK to identify the problems that can occur
during self-assembly. He reports that 52% of the respondents claimed that they
assembled a self-assembly product in the last 2 years. 67% of these respondents
reported that they experienced some difficulties during assembly. 13% of the
respondents damaged the parts during assembly and 7.8% reported that they injured
them self during assembly. What can be concluded from these findings is that
customers clearly have problems with self-assembly products. The most important

10
thing is that self-assembly products must not be too difficult to assemble, because
this might lead to frustrations, damaging of the product or even injuries [16].
In a onetime assembly process technical skills and experience do not play a significant
role. Richardson [17] claims that even if an assembler is experienced, it is still very
likely that the person will just work from the provided procedural assembly
instructions. This is because self-assembly products are mostly a one-time thing and
are not repeated again.
Rules on design for assembly
Richardson [17] shows that consumer self-assembly products have some comparable
aspects with product line assembly in factories. For product line assembly the method
Design for Assembly (DFA) is applied. Chan, Wysk, and Wang [18] translated the DFA
rules so they can also be applied on self-assembly products. They specify the following
rules for DFA:
1. Reduce the total number of parts – In general reducing the amount of parts
results in lower costs and lower assembly difficulty. It reduces the level of
intensity of all activities related to the product. The use of one-piece structures
is encouraged.
2. Design a modular system – A modular design is recommended in order to
simplify manufacturing. A modular design allows for an easier assembly,
testing, inspection, redesigning and maintenance.
3. Use standard components – When developing a system for self-assembly
always try to use as much as possible standard components. Standard
components are cheaper than custom components and they are widely
available. Another benefit of standard components is being less dependent on
one specific supplier because standard components can be delivered by many
suppliers.
4. Design parts to be multi-functional – Parts that are multi-functional reduce
the amount of parts. This rule is also beneficial for rule 1. An example is a part
that acts as a structural and also as an electric conductive part.
5. Design parts for multi-use – If multiple different products are being
developed than try to let these products use the same parts. These parts can
have the same or a different function. This results in a more uniform design an
creates a standard for the complete product line, making it easier to upgrade
or combine different products.
6. Design for ease of fabrication – Use parts that do not require extra work by
the person assembling the system. For example, avoid operations like painting,
polishing and finishing.
7. Avoid separate fasteners – Fasteners like screws and glue should be
avoided. They require more effort in assembly and the chances for errors
during assembly are higher. If fasteners should be uses than some guidelines
need to be followed. First minimize the number and variation, second use
standard components as much as possible, finally avoid screws that are too

11
long or too small. Take into account the motor abilities of the person who will
assemble the system.
8. Minimize assembly directions – Try to design the system in a way that all
parts can be assembled from only one direction. The best direction is to
assemble parts from above in a vertical direction, because than the effect of
gravity has the most positive effect on assembly.
9. Maximize compliance – Try to design parts to be robust, making sure they
don’t break during assembly. Avoid the use of fragile parts or add spare parts
of things that can easily brake. Also make insertion unambiguous, design parts
to have a guiding surface.
10.Minimize handling – Handling is the positioning, orienting and fixing of a part.
In order to facilitate orientation, the use of symmetrical parts is strongly
recommended. If this for some reason is not possible than asymmetry should
be exaggerated to avoid possible failures. External guidelines like arrows can
help with the orientation of a part. Also, when designing the product try to
minimalize the material waste also for the packaging.
Although these guidelines are clear and useful for the DIY compatibility of the SRB,
some more information is still needed on the specifics of the complexity of self-
assembly products. Richardson et al. [19] studied the factors that cause complexity
during assembly. They approached this with the use of methods that origin from the
cognitive psychology research field. In their research they created a framework that
can be used to evaluate the complexity and difficulty of self-assembly products. Of
course, assembly instructions are also very important for in the process of self-
assembly, but this is outside of the scope of this research.
Evaluating assembly complexity
In order to design an easy to assemble product is needed to understand what exactly
makes assembly complex. As Richards [17] states, complexity is linked to a task and
affects the difficulty of that task. Richardson et al. [19] uses physical characteristics
called “task variables” to identify tasks that influence assembly complexity. These
task variables are related to the nature of the task, required mental effort and the
cognitive load of the task. Richardson et al. [19] created a model to link cognitive
load to assembly complexity and difficulty. This model uses task variables to score
the difficulty of the assembly process (for details see Richardson et al. [19]). The task
variables that were found in his research that affect assembly complexity are given
below.
Symmetrical planes - This factor has the most influence on the complexity of
assembly. Richardson et al. [19] found out that a decrease in symmetry is related to
an increase in assembly complexity and thinking time. The orientation of parts should
be kept as easy as possible. This can be done by including clues like arrows. This
helps people orientate and rotate parts in the correct direction. Just like Chan et al.

12
[18], Richardson et al. [19] also concluded that parts should preferably be
symmetrical shaped and in case of asymmetry than this should be exaggerated.
Novel assemblies – This factor is the second important factor that influences
complexity. Novel assemblies can be measured as the number of unique assemblies
in an assembly step, in other words the variety of parts per assembly step. The higher
the number of parts in an assembly step, the higher the difficulty level.
Selections – This task variable measures the amount of parts available to choose
from. The research by Madan, Bramorski and Sundarraj [20] also concludes this. They
point out that difficulty can be reduced by packaging components into bags following
the order of assembly. They also found out that too many bags made the task difficult
again, so it is really important that the amount of parts and bags is balanced.
Fastening points – Fastening points provide clues for the placement of parts. An
increase in the amount of fastening points results in more possibilities for part
positioning. For this reason, an increase in fastening points leads to a higher difficulty
and higher chance of errors.
Fastenings – A large amount of fastenings can lead to the perception that the
assembly will be difficult, although this doesn’t have to be the case. Also, the number
of fastenings increases the amount of fastening points, so both should be kept at a
minimum.
Parts – As pointed out before in the rules for DFA, the amount of parts should be
kept at a minimum.
Conclusion
The relationship between assembly tasks and assembly difficulty is now better
understood. Now there is a clear overview of aspects that influence the complexity of
a self-assembly product that can be applied to design for DIY. It can be concluded
that the SRB can be made DIY compatible if the aspects and rules that are mentioned
above are taken in to account for the design of the SRB.

13
2.5 Related Research This section contains an overview both of already existing products or projects with
the same goals and functionalities of the SRB and alternative projects focused on
urban rainwater buffering. Finally, this section also contains an expert opinion on rain
barrels.
2.5.1 Similar projects
Slimme regenton [21] - Waterschap Amstel Gooi en Vecht & Studio Bas Sala
De “Slimme regenton” (English: The smart rain barrel) is a project from Waterschap
Amstel Gooi en Vecht in cooperation with Design Studio Bas Sala. Together they
developed a consumer-friendly smart rain barrel meant for at home use. They used
an ordinary rain barrel and upgraded it with a small internet connected computer,
sensors and an electronically controlled valve. The computer uses the sensors to
measure the amount of water in the barrel and controls the valve to empty the barrel
in to the city’s sewage system. The onboard computer has an internet connection that
checks the rain forecast and if needed empties the rain barrel before the rain falls, to
unstress the sewage system during rain fall.
The philosophy from Waterschap Amstel Gooi en Vecht is that this kind of
micromanagement of the stress on the sewage system during rainfall can be effective
if this smart rain barrel is applied in large quantities. See figure 3 for an impression
of the system.
Figure 3: De slimme regenton. Source: Bas Sala

14
RainGrid [22] [23] - RainGrid & RiverSides
RainGrid is a rainwater barrel designed to collect storm water during rain fall and
release it at times the sewage system is less stressed in order to prevent flooding.
This product was also used in case studies on smart rain barrels, more on this later
on in this section. The RainGrid has a modular design and can be easily installed by
following an installation guide. The basic version of the RainGrid doesn’t contain any
electronics.
Content of the basic RainGrid [24]:
• 500 L/132 gal. capacity rain cistern
• Rainwater diverter system
• ¾-Inch brass mini-ball valve with ¾-inch hose thread
• Drain plug
• 200-micron Nitex mesh filter
The basic RainGrid comes with a diverter system, which basically is a hand-controlled
valve that can be used to bypass the rain barrel and directly divert the rainwater to
the sewage. This diverter system is meant for a shutdown of the system during
periods that it is likely to freeze. See figure 4 and 5 for an impression of the RainGrid
barrel and diverter system. The system also contains a filter which prevents any
debris from entering the barrel and prevents the outlet of becoming clogged. The
emptying of the rain barrel is not automated on the basic version of the RainGrid.
This should be done by the owner itself. The company uses a catchphrase in order to
remind people to do this; “After a rain, it’s time to drain!”.
Figure 4: RainGrid basic version modules/parts. Source: RainGrid installation manual

15
Figure 5: RainGrid basic version installed. Source: RainGrid official website
The RainGrid also can be upgraded with the RainGrid controller. This extension
module of the basic RainGrid system adds an internet connected control unit to the
system together with a water temperature sensor, Ultrasonic sensor and electric
valve. This allows the setup to drain automatically and monitor the system via a web
interface.
Every RainGrid controller has an individual network address which is monitored real
time to get its current storage volume. A data server combines local weather
predictions for the next 5 days with the available storage data of the rain barrels.
When the predictions are greater than the available storage that is currently available
than the barrel is automatically drained to ensure enough storage.
Technical details:
- The control unit has an ZigBee radio inside that communicates with a gateway
inside the house that is connected to the internet. (Figure 6)
- The used gateway is an TP-Link router with a ZigBee radio integrated and
running the latest version of OpenWRT.
- Data is pulled every 15 minutes.
- 5 day local weather prediction.
- The barrels are made of 50% recycled MDPE, to lower the environmental
impact. Including division system ($ 299)
- Ultrasonic sensor at the top that is used for water level measuring.
- Temperature sensor at the bottom to check the micro climate inside the rain
barrel.
- 5v electronic valve,
- Online dashboard (shows current capacity, button to open/close valve, shows
forecast, shows micro climate status) (Figure 7)
- Battery power, solar charged. (Figure 6)

16
Figure 6: RainGrid controller installed. Source: RiverSides official website
Figure 7: RainGrid dashboard web interface. Source: RiverSides official website

17
Case studies RainGrid – RiverSides
The non-profit environmental group RiverSides is the group that created the RainGrid.
In 2013 one member of the group continued with the project in a spin off commercial
company called RainGrid, which sells the RainGrid product. While the others from the
RiverSides group kept developing and researching the smart rain barrel. In 2017 the
Riverside group released a detailed report (Automated rain barrels: residential case
studies) on their pilot project, containing five case studies.
Here follows a summary of the important facts that were found during these case
studies.
One of the important lessons learned during the case studies is to help remind the
owner to clean the filter. Because if the filter is clogged than the water will not enter
the barrel resulting in corrupt measurements. Their recommendation is to schedule
filter maintenance on the online dashboard. Also filter notifications to the householder
would be useful.
Another finding was that rain reduces the signal strength of the ZigBee radio on the
barrel. This resulted in that there was no communication possible during a rain
shower, which is one of the most critical moments for data gathering. Another
problem that arises from this problem was that their prototype didn’t cache data,
meaning that when the connection is lost the flow data will still be collected but will
not be saved. Their recommendation was to ensure the connectivity of controller with
the modem, while taking into account interference and reduced range due to rain. For
example, by decreasing the distance for the gateway to the controller, increasing the
range of the radio, using a different type of wireless connection instead of ZigBee or
using a hardwired internet connection. Also building in system capacity to cache data,
preventing data loss when dealing with connectivity issues.
Their final recommendation was to consider using a completely different wireless
system and internet connection that does not depend on the owner’s home network
structure and internet connection.
18
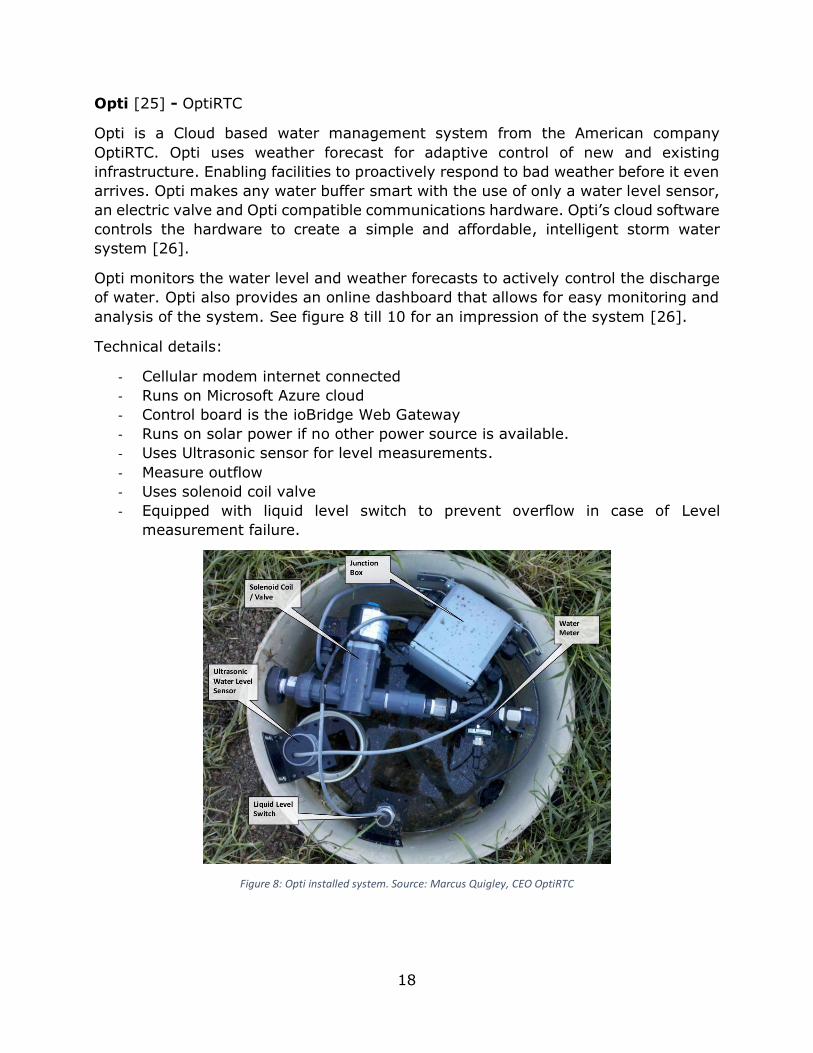
Opti [25] - OptiRTC
Opti is a Cloud based water management system from the American company
OptiRTC. Opti uses weather forecast for adaptive control of new and existing
infrastructure. Enabling facilities to proactively respond to bad weather before it even
arrives. Opti makes any water buffer smart with the use of only a water level sensor,
an electric valve and Opti compatible communications hardware. Opti’s cloud software
controls the hardware to create a simple and affordable, intelligent storm water
system [26].
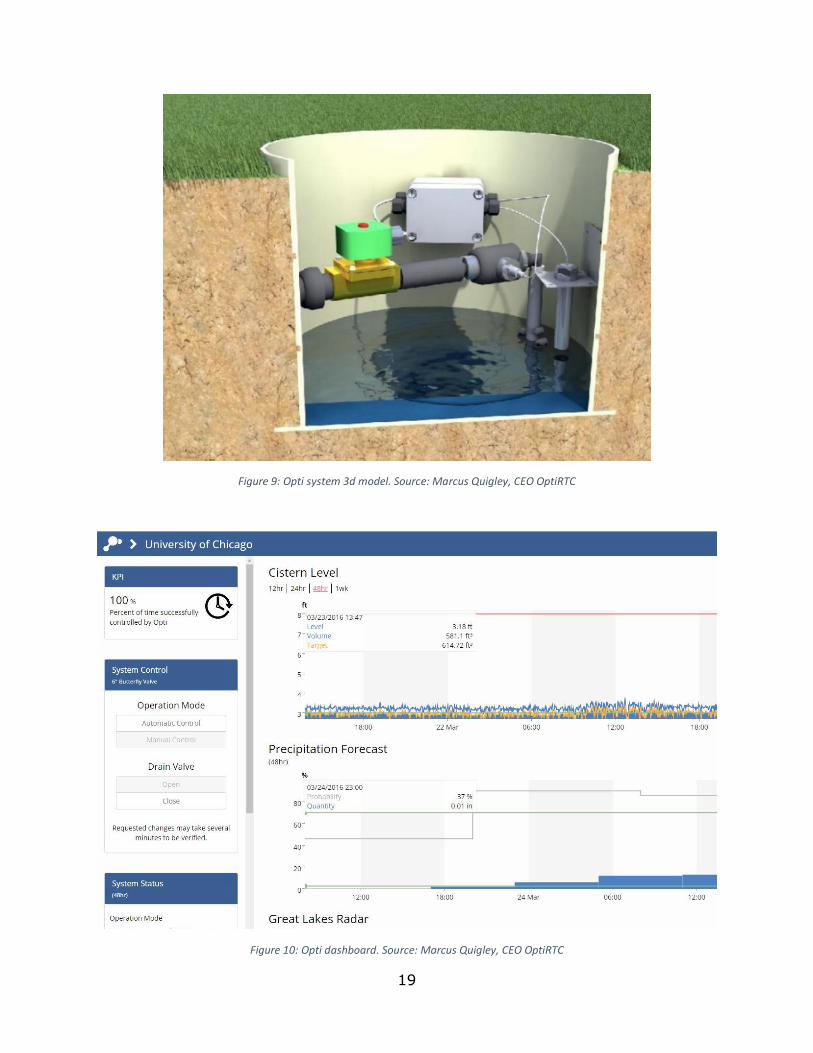
Opti monitors the water level and weather forecasts to actively control the discharge
of water. Opti also provides an online dashboard that allows for easy monitoring and
analysis of the system. See figure 8 till 10 for an impression of the system [26].
Technical details:
- Cellular modem internet connected
- Runs on Microsoft Azure cloud
- Control board is the ioBridge Web Gateway
- Runs on solar power if no other power source is available.
- Uses Ultrasonic sensor for level measurements.
- Measure outflow
- Uses solenoid coil valve
- Equipped with liquid level switch to prevent overflow in case of Level
measurement failure.
Figure 8: Opti installed system. Source: Marcus Quigley, CEO OptiRTC
19
Figure 9: Opti system 3d model. Source: Marcus Quigley, CEO OptiRTC
Figure 10: Opti dashboard. Source: Marcus Quigley, CEO OptiRTC

20
Loxone rain water harvesting project [27] – Loxone
Loxone is a UK based company that develops and sells high end professional smart
home appliances. The products of Loxone are more expensive than regular IoT smart
devices and are meant for professionally installed smart homes.
On their blog they posted an article about smart rainwater harvesting using the
company’s products. In their blog post they describe how they added their products
to an underground water buffer with a pump connected to it. They use their own
Loxone ultrasound sensor to measure the fluid level. One of their connected switches
is used to control the outlet pump in combination with their developed Miniserver.
The Miniserver gets the data from the ultrasonic sensor and drains the barrel if the
water level gets above a certain threshold. See figure 11 for an impression of the
system [28].
Since Loxone sells their products online, it is possible to make a cost estimation. The
estimation is only of the Loxone technology needed and does not included the buffer
and pump.
Cost estimation:
- Loxone Ultrasonic Sensor 0-10V € 258,68
- Loxone Miniserver € 511,45
- Loxone Smart Socket Air € 71,78
Total cost: € +/- 840 ,- (exclusive shipping costs)
Figure 11: Loxone Rain water harvesting project. Source: Loxone
21
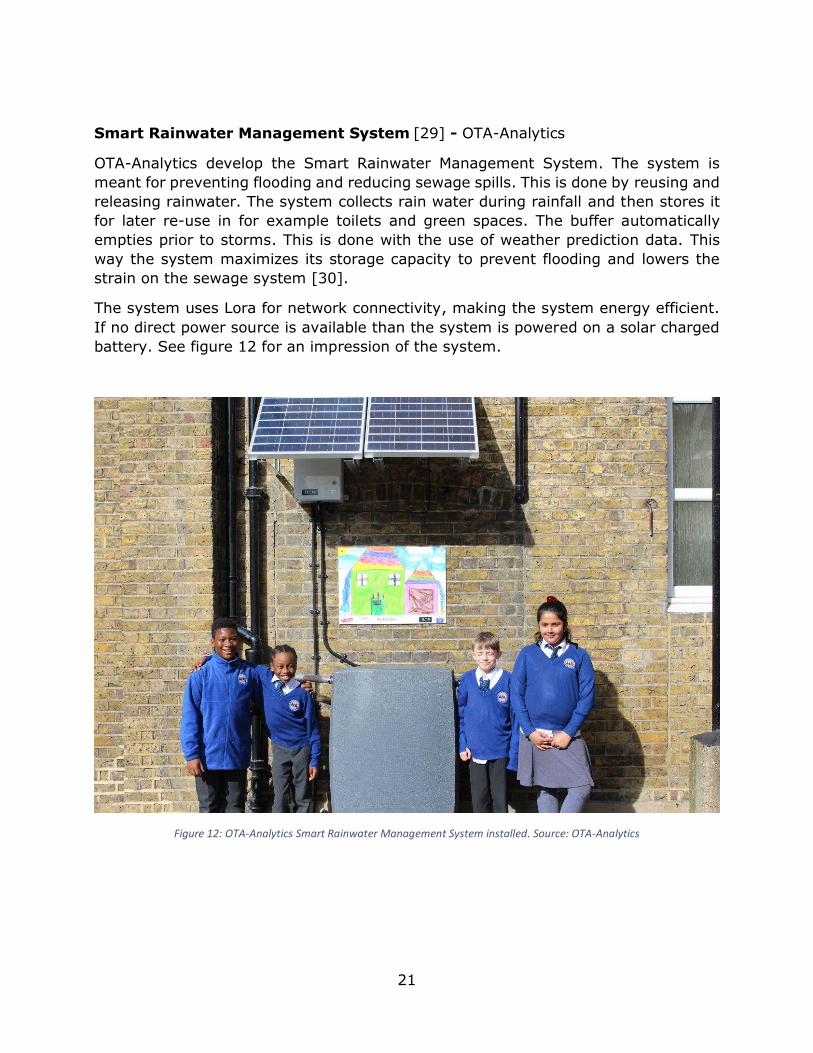
Smart Rainwater Management System [29] - OTA-Analytics
OTA-Analytics develop the Smart Rainwater Management System. The system is
meant for preventing flooding and reducing sewage spills. This is done by reusing and
releasing rainwater. The system collects rain water during rainfall and then stores it
for later re-use in for example toilets and green spaces. The buffer automatically
empties prior to storms. This is done with the use of weather prediction data. This
way the system maximizes its storage capacity to prevent flooding and lowers the
strain on the sewage system [30].
The system uses Lora for network connectivity, making the system energy efficient.
If no direct power source is available than the system is powered on a solar charged
battery. See figure 12 for an impression of the system.
Figure 12: OTA-Analytics Smart Rainwater Management System installed. Source: OTA-Analytics
22
2.5.2 Alternative water buffering solutions
The following solutions are not a smart rainwater buffer in the sense of
automatically draining water before rainfall, but these concepts are still interesting
to the project because of their innovative techniques of urban rainwater buffering.
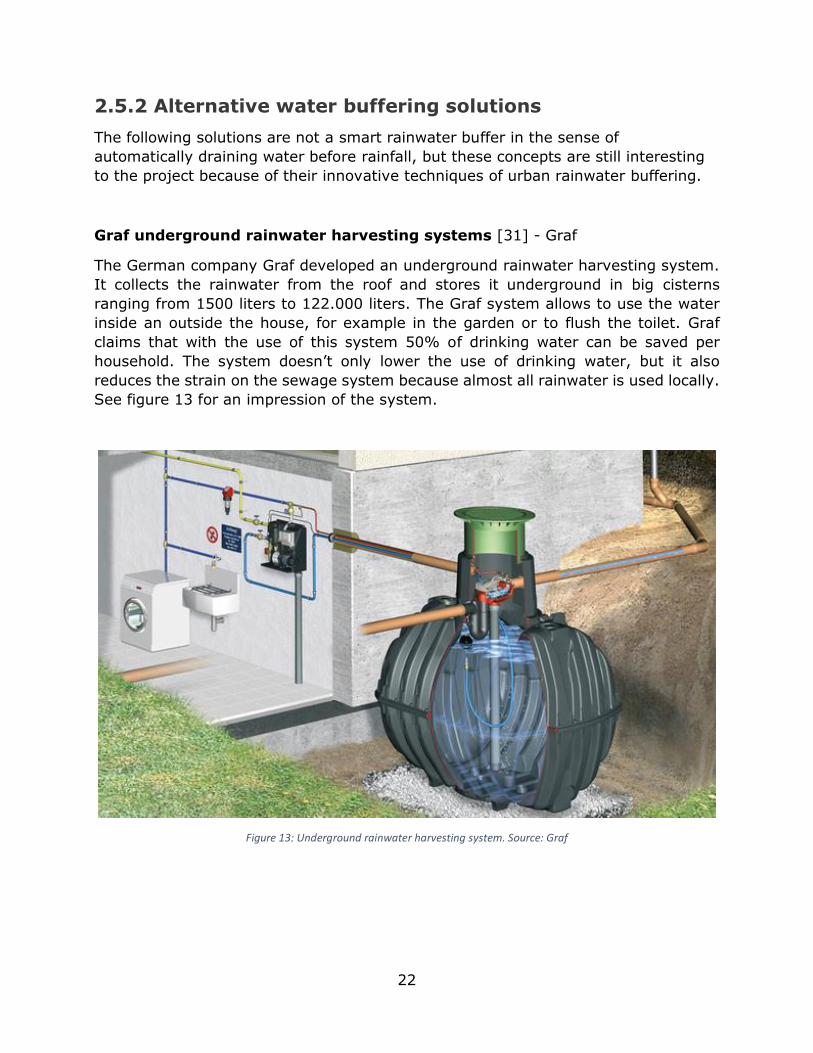
Graf underground rainwater harvesting systems [31] - Graf
The German company Graf developed an underground rainwater harvesting system.
It collects the rainwater from the roof and stores it underground in big cisterns
ranging from 1500 liters to 122.000 liters. The Graf system allows to use the water
inside an outside the house, for example in the garden or to flush the toilet. Graf
claims that with the use of this system 50% of drinking water can be saved per
household. The system doesn’t only lower the use of drinking water, but it also
reduces the strain on the sewage system because almost all rainwater is used locally.
See figure 13 for an impression of the system.
Figure 13: Underground rainwater harvesting system. Source: Graf

23
D-Raintank Modular Rainwater Storage System [32] [33] – Atlantis
The American company Atlantis develops modular underground storm water tanks.
Modular water tanks are placed underground and can be constructed to hold any
volume required. The system is built out of modular plastic cubes that are stacked
together to the proper size. Finally, the built structure is wrapped in a plastic sheet
and covered with earth, allowing the system to easily integrate into landscaping. The
advantage of the modular water tanks compared with traditional water tanks is that
this system is much more versatile. The system allows to use huge underground areas
for rainwater harvesting. The modules are strong enough for vehicles parking making
them also useful to place underneath a drive way. The plastic modules ship flat and
the entire system can be installed completely by hand and is also assembled on-site.
See figure 14 and 15 for an impression of the system.
Figure 14: Modular underground storm water tank system. Source: S.A.R.G water solutions
Figure 15: Atlantis D-rain tank storm water management system. Source: Atlantis
24
2.5.3 Expert opinion, rain barrels
In order to redesign the SRB it is important to know the fundamentals of building a
rainwater buffer. In order to get insight into this the videos from David the Good [34]
and Gord Hiebert [35], two rainwater buffer experts, were used. The Good tells in the
video about the most important aspects of rainwater harvesting that he has learned
from his experience. Hiebert demonstrates how to build a rainwater harvesting
system and what point are important to pay attention to when doing so.
Input
Make sure the water can be diverted in the winter. Frozen water expands this can
damage the rain water barrel. Also, a filter should be placed at the input of the
rainwater barrel. This filter keeps dirt out and prevents from mosquito breeding inside
the barrel. Dirt inside the barrel can clog the output outlet, preventing the barrel to
drain. Make sure the top of the barrel is closed, so dirt and mosquitoes can’t bypass
the filter.
Scalability
If the storage capacity of the rain barrels is too small than the system can be scaled
up, simply by connecting another rain barrel to the overflow or outlet of the rain
barrel.
Placement
Make sure the rain barrel is placed on a level base, this way the barrel can be drained
completely, and it is also beter for water level measuring. Elevate the rain barrel for
more gravitational pressure and also making it easier to put a bucket or watering can
underneath the outflow.
Outflow
The diameter of the outflow of the rain barrel should not be too small otherwise it will
take a long time to drain the barrel. The bigger the outflow the better.
Overflow
Also make sure the rainwater buffer has an overflow. If the water buffer is full the
water should be diverted to the sewage or to another rainwater barrel.
Algae
Make sure the inside of the barrel is dark. Algae are small plants that photosynthesize,
if algae form in the water than the water will turn green. In order to prevent the
growth of algae you should cut off the sunlight. Without sunlight algae won’t grow.
Avoid using open and transparent water barrels.

25
2.6 Conclusion The goal of this chapter was to get insight into the problem of flooding in the city of
Enschede and to collect sufficient information to solve this problem in the remainder
of the project. The research on the background information of the flooding problems
in the city of Enschede created a clear understanding of the problem and its origin. It
can be concluded that the SRB would be a viable solution for the problem if it would
be redesigned to operate reliably all through the city. Previous research gave a clear
overview of recommendations and possible improvements. The Expert opinions on
rainwater barrels gave useful insight in the important aspects to take into account
when developing a rainwater harvesting system.
The research on Design for DIY showed the relationship between assembly tasks and
assembly difficulty. A clear overview of aspects that influence the complexity of a self-
assembly products was created, and this information can be applied to develop a
product that can be used in a DIY.
The state of the art research on similar projects showed that although the number of
projects similar to the SRB is growing, there is no competitor for the complete concept
of the SRB. The other projects are either art projects, not for the consumer market,
too expensive or have a completely different goal. Because of this reason and because
of the fact that still lots of research needs to be done during this project, it can be
concluded that this research is still novel. The research question of: How to develop
a DIY and consumer ready Smart Rainwater Buffer for deployment in the city of
Enschede? Cannot be answered yet, but the gathered information in this chapter will
be very helpful in doing so in the next phase of the project.

26

27
3. METHODS AND TECHNIQUES
This chapter describes the methods and techniques that are used during this
graduation project. The methods and techniques are used to keep the research and
the report structured. The main method that will be applied in this graduation
project is the Creative Technology Design Process (CTDP). Next to that the used
method on stakeholder identification and analysis is presented. The MoSCoW
method, interviews and PACT analysis are used for requirements elicitation.
Brainstorming and Interviews are used for concept generation. The black box white
box method and UML diagrams are used for specification of the system.
3.1 Creative Technology Design Process The multidisciplinary bachelor study Creative Technology has its own Design Process
which is integrated in the curriculum of the study. For this reason, the Creative
Technology Design Process will be the main method in this graduation project. First
the Creative Technology Design Process will be explained after that the
implementation of it in this project is explained. The Creative Technology Design
Process is based on two design models [36]. The first being the Divergence and
Convergence model of Jones [37]. This model consists of two phases, the
divergence and convergence phase. A divergence phase is always followed by a
convergence phase. The Divergence phase is used to open up and define the design
space. This allows a broad overview of possibilities. The convergence phase is a
process of reducing the design space to the point that the best solution is found.
This is done using requirements and available knowledge [37]. The second model
that the Creative Technology Design Process [36] is based on is the spiral model.
This model allows for a process where the design steps within a phase do not have a
fixed order. All the steps include a reflection phase.
The Creative Technology Design Process starts with a design question. Then four
phases are used to answer this design question. The four phases are the ideation,
specification, realization and evaluation phase. The goal of the Creative Technology
Design process is to structure the design process, allowing for more specified steps
in planning and defined feedback moments. For an overview of the original models
see figure 16. During this thesis an altered version of the Creative Technology
Design Process will be used (see Figure 17). The altered model limits time on the
specification phase allowing for more time in the ideation and realization phase. This
is important because of the limited time available for the graduation project.
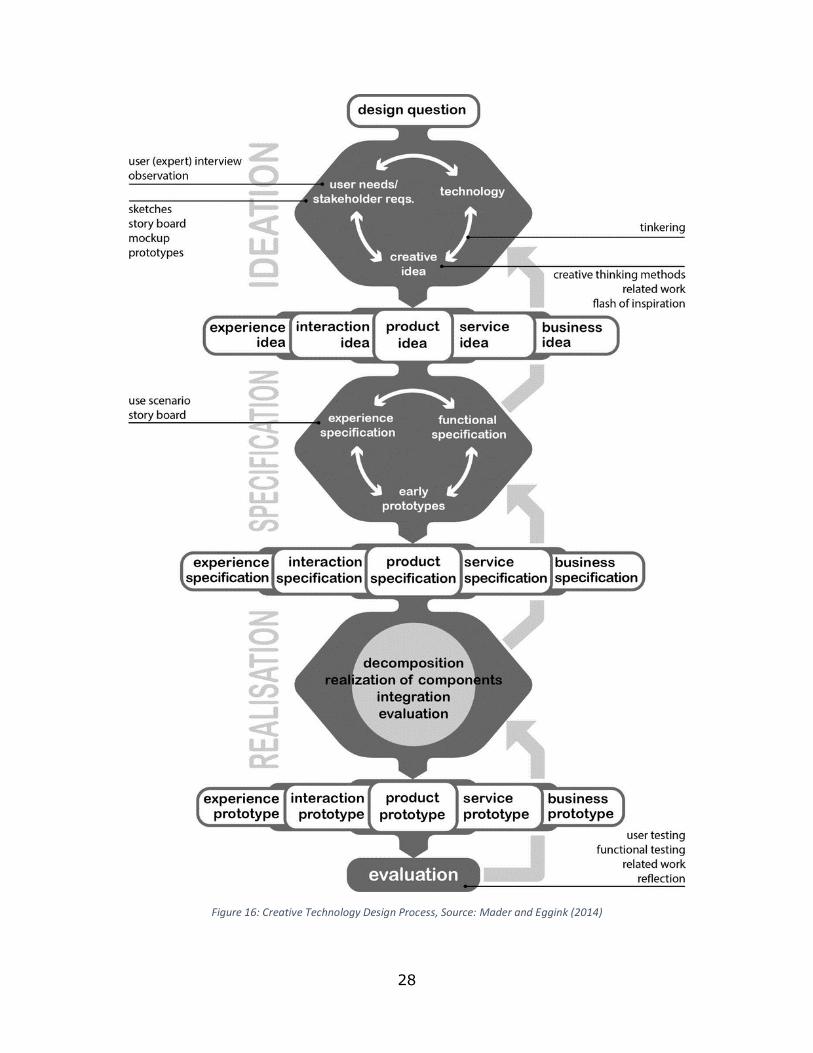
28
Figure 16: Creative Technology Design Process, Source: Mader and Eggink (2014)

29
Figure 17: Time division of altered Creative Technology Design Process
3.1.1 Ideation
The main goal of this phase is to identify stakeholders, to come up with preliminary
requirements and concepts. The starting point for the ideation phase is the design
question originating from a product idea and order from the stakeholders together
with the background research which resulted in the research question. The research
question was verified in the State of the art research. Tinkering, brainstorming and
the similar work found in the state of the art are used as input to come up with
creative ideas. These early ideas are then evaluated with stakeholders and clients.
This process is than reiterated until a useful and feasible idea is found. In these
reiterations the aspects of experience, interaction, service and business model are
considered and used to evaluate the concepts.
As an addition to the original CTPD, this phase will also contain a small part from
the specification phase. Instead of building early prototypes in the specification
phase the ideation phase is extended with the creation of high-level concepts. These

30
high-level concepts are evaluated with the stakeholders and the output is used for
requirement elicitation. The use of high-level concepts instead of early prototypes
saves time and it also allows for more time for requirement elicitation and
verification. Finally, the best idea is selected to be developed further in the next
phase of the project.
3.1.2 Specification
The main goal of this phase is to specify the functional behavior of the to be
developed product and to get a clear overview of the system and its requirements.
The specification phase uses the best idea of the ideation phase as input. The
original Creative Technology Design Process states that early prototypes must be
used to explore the options and requirements of the product. These Early
prototypes would then be evaluated, and the input would be used to create new
better prototypes.
As explained in the previous section this is already incorporated in an alternative
way in the ideation phase. In this graduation project the specification phase will be
used to create a functional system architecture visualized with block diagrams which
describe the overall system, the subsystems and the interaction between the
subsystems. This gives insight in the functional behavior of the system and could
result in a change of functionality or requirements if needed.
3.1.3 Realization
The goal of this phase is to build the product. The realization phase starts with the
decomposition of the specifications set in the previous phases. Then the
components are realized and tested. When this is done a prototype of the complete
product will be build. Finally, the product is evaluated to check if it meets the
requirements set in the specification phase, if needed the prototype will be altered
and evaluated again until the requirements set in the specification phase are met.
3.1.4 Evaluation
The final phase, the evaluation phase, starts with functional testing, meaning that
the functional requirements are tested. After that user testing is used to verify if the
design indeed meets the nonfunctional requirements and facilitates the wanted user
experience. Next to that the literature research done on design for DIY is used to
evaluate the DIY aspect of the prototype. Software tests are used to test the logic of
the system. Finally, the stakeholders are asked for feedback on the prototype.
3.2 Stakeholder Identification Not only the end users are affected by a new product. When developing a product,
it is important to have a clear overview of the people that are affected by the
product and what people directly or indirectly influence the design process towards
the envisioned product. Some of these people might have more influence than

31
others, and also other specific requirements. Because of this reason it is important
to perform a stakeholder analysis. Bryson [38] and Sharp [39] describe
stakeholders as ‘any group or individual who can affect or is affected by the
achievement of the organization’s objectives’.
Thompson [40] identifies 3 steps to follow in a stakeholder analysis. The first step is
to identify all possible stakeholders by brainstorming. First it is important that a list
of stakeholders of people who influence or are affect by the product is made, this
give a clear overview of all stakeholders. The second step is to prioritize the
stakeholders. This can be done using the Stakeholder power-interest matrix by
Mendelow [41] . This is a tool to identify stakeholders and their power and interest
in the development of the project. The final step is to identify the motivations of
each stakeholder. In order to develop a product that satisfies all stakeholders it is
important to know what their interest in the project is.
3.3 Requirement elicitation When developing a product, it is important to have a clear understanding of its
requirements. Requirements come from different stakeholders and have different
priorities. When developing a product with in a limited time span, it can occur that
there is not enough time to implement all the requirements. Hence, it is important
that requirements are ranked on priorities.
3.3.1 MoSCoW
The MoSCoW method [42] is a method to categorize requirements on priorities. The
method helps in getting a clear overview of the most important requirements and in
what order to implement them. MoSCoW stands for 4 types of requirements: Must,
Should, Could, Would. “M” stands for must have this requirement in order to
succeed. “S” stands for should have this requirement if possible, the success of the
project does not rely on it. “C” stands for could have this requirement, only if it does
not have any effect on the implementation of other requirements. “W” stands for
would like to have this requirement later, it will not be implemented during this
project.
3.3.2 Functional and non-functional requirements
Requirements are divided into two categories: functional and non-functional.
Functional requirements specify functions that a system must be able to perform.
Functional requirements can be written down in the form of a description or in the
form of a use case [43].
While functional requirements describe what a system should do, non-functional
requirements specify criteria on how the system will do this. Non-functional
requirements are often related to the quality or constraints of the system [43].

32
Once the requirements are divided into categories it makes it easier to evaluate
them in the evaluation phase of the project .
3.4 Scenarios In order to understand the usage of the to be developed product it is important to
know in what context and how the product will be used. This can be done using
Scenarios. In the context of this research a scenario will be defined as a description
of the use of the to be developed product in a certain context to perform a specific
task. The description should be sufficiently detailed, so product requirements can be
derived from it [44]. A tool that can be used to identify requirements is a PACT
analysis and scenario [45].
3.4.1 PACT
The PACT framework is used to create user centered scenarios and to give insight
into the requirements of the system [46]. PACT stands for four key points: People,
Activity, Context and Technology. These four key points are related to the use of a
product by a user in a certain context [47].
This thesis uses two types of PACT analyses. The first type is based on the PACT
analysis technique and format from Trulock [48]. This extensive technique uses a
wide set of variables (e.g. cognitive and physical characteristics) to analyze the four
key points of a PACT analysis. This approach is useful to get a good insight in the
profile of potential users and requirements that they have on a product.
The second type is based on the PACT analysis technique and format of Benyon and
Macaulay [46]. This technique uses PACT as a guideline to create a user centered
scenario that can give interesting insights in the requirements that potential users
might have on a product.
3.5 Concept generation In order to generate as much concepts as possible it is important to use different
concept generation techniques. Brainstorming is one of the techniques used in this
project, but interviews and discussions are also used as tool to generate ideas [49].
3.5.1 Group brainstorming
One of the used techniques for concept generation is group brainstorming, this is a
form of brainstorming where group members actively interact with each other in a
verbal dialog by sharing their ideas. Group members are free to share all their ideas
without direct criticism of other group members, this helps to stimulate the
production of large amounts of ideas and combining different ideas [49].
3.5.2 Individual brainstorming
Next to group brainstorming individual brain storming is also used for idea
generation, this is a form of brainstorming that allows an individual to generate
ideas and stay more focused on the topic than in a group. The used tools for

33
individual brainstorming are researching similar products and the use of mind maps
[49].
3.6 Interviews The interview techniques used in this thesis are all quantitative interviews. These
are interviews that are semi-structured and unstructured. These interviews are
more flexible than structured interviews and allow for a better insight in the
interviewees’ own perspectives and ideas [50]. These interviews are used for idea
generation, requirement elicitation and evaluation with the stakeholders.
3.6.1 Semi-structured interviews
In a semi-structured interview, the researcher has a list of questions or topics
prepared before the interview and these can be asked in any order to the
interviewee. These types of interviews allow the interviewer to pick up things said
by the interviewee and ask further questions in that direction while still having a
guideline of questions that should be answered at the end of the interview [50].
3.6.2 Unstructured interviews
Unstructured interviews mostly only have a predefined topic and no prepared
questions. The interviewer introduces the topic and the interviewee is than free to
respond on it with his or her own perspective. Unstructured interviews are very
similar to a normal conversation or discussion [50].
3.7 Functional system architecture In order to describe a system and its subsystems and the interaction between the
subsystems a functional system architecture can be made. This thesis uses both block
diagrams modeled following the level approach, and UML activity diagrams to do this.
These techniques are used in the specification phase of the project the get insight in
the functional behavior of the system which is used as input to for the final
requirement elicitation.
3.7.1 Level approach
In order to create an overview of the system and its functionalities, block diagrams
of different abstraction levels are used to describe and visualize the overall system,
the subsystems and the interaction between the subsystems. The level approach is
based on the principle of black and white boxes. Black boxes don’t show internal
specifics and white boxes do show internal specifics of a system. Blocks in the
diagram represent systems, the arrows represent interaction, together they form
the functionality of the system. The Level approach starts at an abstract overview of
the system and the systems it is connected to. The next levels are less abstract and
look into the functionality of the main system and subsystems. See figure 18 for a
graphical impression of the level approach.
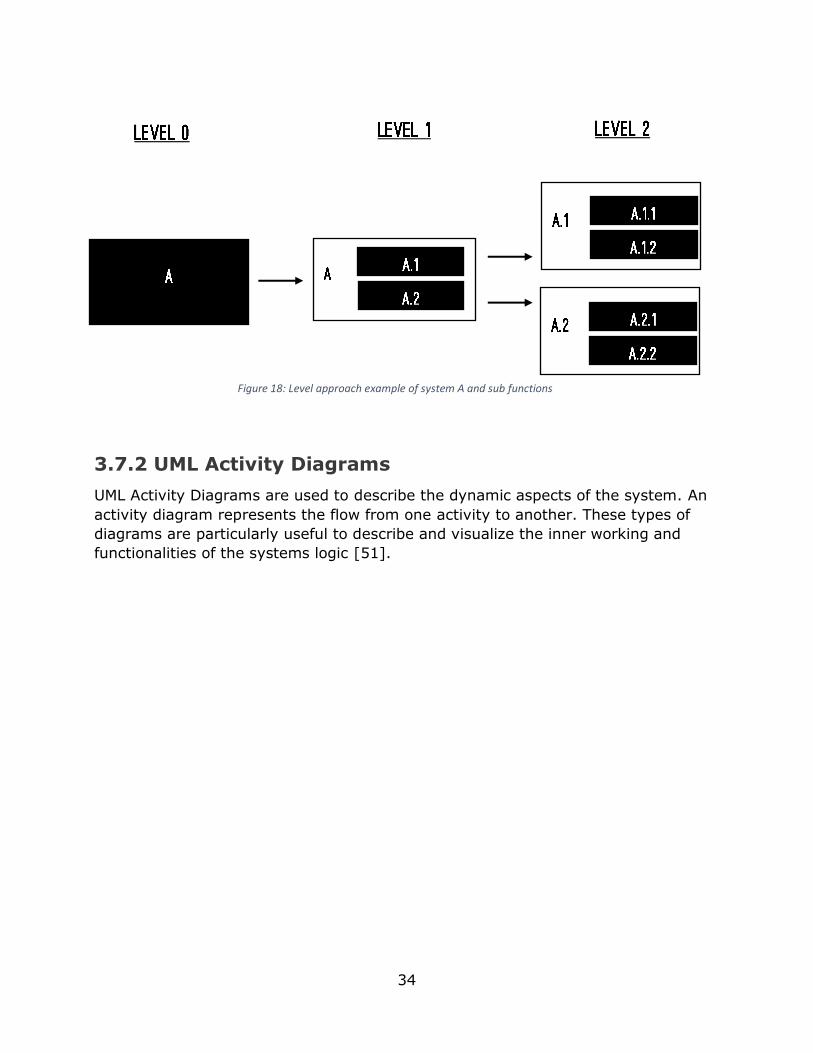
34
3.7.2 UML Activity Diagrams
UML Activity Diagrams are used to describe the dynamic aspects of the system. An
activity diagram represents the flow from one activity to another. These types of
diagrams are particularly useful to describe and visualize the inner working and
functionalities of the systems logic [51].
Figure 18: Level approach example of system A and sub functions
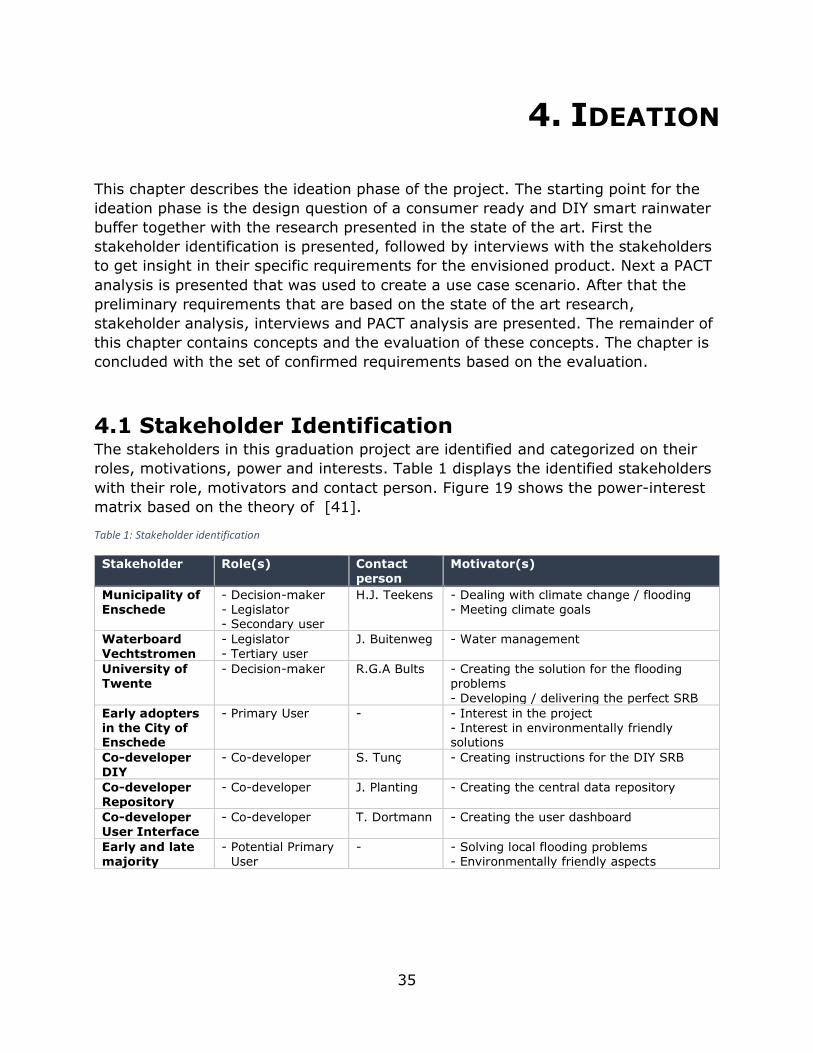
35
4. IDEATION
This chapter describes the ideation phase of the project. The starting point for the
ideation phase is the design question of a consumer ready and DIY smart rainwater
buffer together with the research presented in the state of the art. First the
stakeholder identification is presented, followed by interviews with the stakeholders
to get insight in their specific requirements for the envisioned product. Next a PACT
analysis is presented that was used to create a use case scenario. After that the
preliminary requirements that are based on the state of the art research,
stakeholder analysis, interviews and PACT analysis are presented. The remainder of
this chapter contains concepts and the evaluation of these concepts. The chapter is
concluded with the set of confirmed requirements based on the evaluation.
4.1 Stakeholder Identification The stakeholders in this graduation project are identified and categorized on their
roles, motivations, power and interests. Table 1 displays the identified stakeholders
with their role, motivators and contact person. Figure 19 shows the power-interest
matrix based on the theory of [41].
Table 1: Stakeholder identification
Stakeholder Role(s) Contact
person
Motivator(s)
Municipality of
Enschede
- Decision-maker
- Legislator - Secondary user
H.J. Teekens - Dealing with climate change / flooding
- Meeting climate goals
Waterboard
Vechtstromen
- Legislator
- Tertiary user
J. Buitenweg - Water management
University of
Twente
- Decision-maker R.G.A Bults - Creating the solution for the flooding
problems
- Developing / delivering the perfect SRB
Early adopters
in the City of Enschede
- Primary User - - Interest in the project
- Interest in environmentally friendly solutions
Co-developer
DIY
- Co-developer S. Tunç - Creating instructions for the DIY SRB
Co-developer
Repository
- Co-developer J. Planting - Creating the central data repository
Co-developer
User Interface
- Co-developer T. Dortmann - Creating the user dashboard
Early and late
majority
- Potential Primary
.User
- - Solving local flooding problems
- Environmentally friendly aspects

36
Figure 19: Power-Interest matrix based on theory of Mendelow (1991)
The stakeholder identification and power-interest matrix show that the municipality
has the highest power in this project. The municipality is one of the investors and
will be a secondary end user of the system. The municipality will not directly
interact with the system but will have access to data collected by the system,
making the municipality a secondary end user [39]. The motivations of the
municipality are dealing with the flooding problems caused by climate change and
meeting the climate goals [52]. It is important that the relations with the
municipality are managed closely. The requirements of the municipality are very
important for this project.
The university also has a lot of power over the project. At this moment they will not
be explicit end users of the system, but they will be the leader in the development
of the envisioned product. For these reasons it is important to keep the university
satisfied. The university will play an important role in relation management, advice
and decision making.
Co-developer Tunç does not have the highest power but she does have the highest
interest of all stakeholders. The main goal of Tunç is to develop DIY assembly
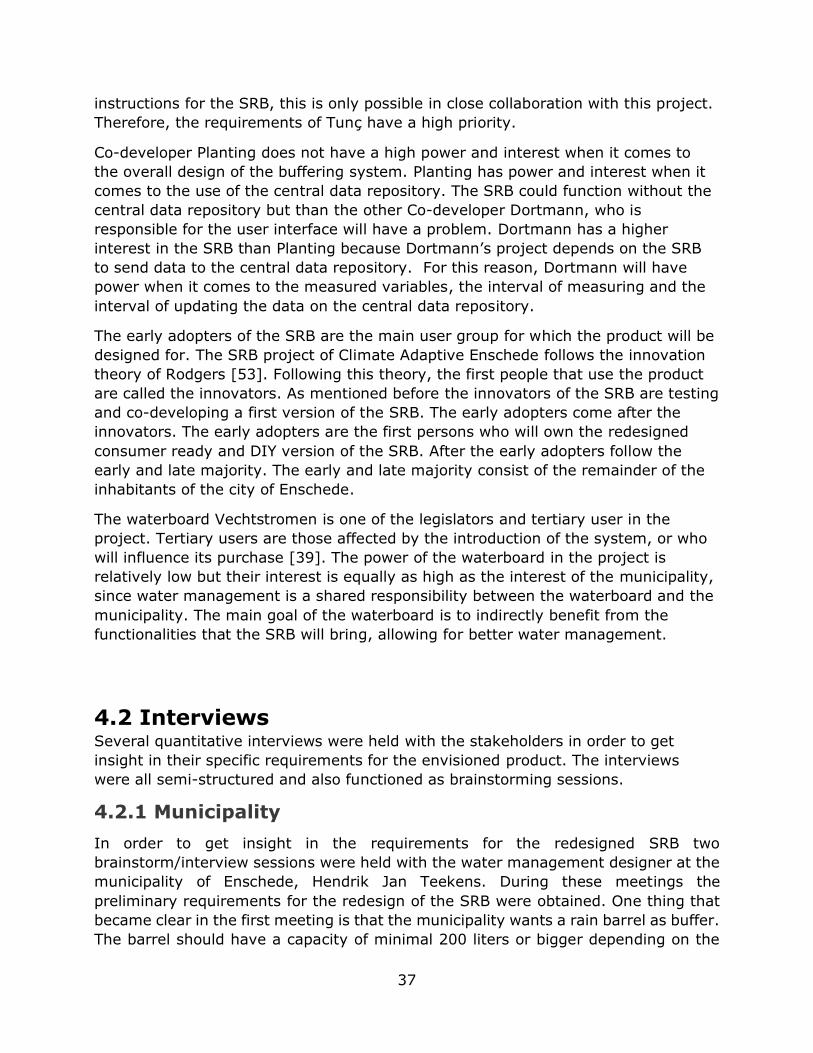
37
instructions for the SRB, this is only possible in close collaboration with this project.
Therefore, the requirements of Tunç have a high priority.
Co-developer Planting does not have a high power and interest when it comes to
the overall design of the buffering system. Planting has power and interest when it
comes to the use of the central data repository. The SRB could function without the
central data repository but than the other Co-developer Dortmann, who is
responsible for the user interface will have a problem. Dortmann has a higher
interest in the SRB than Planting because Dortmann’s project depends on the SRB
to send data to the central data repository. For this reason, Dortmann will have
power when it comes to the measured variables, the interval of measuring and the
interval of updating the data on the central data repository.
The early adopters of the SRB are the main user group for which the product will be
designed for. The SRB project of Climate Adaptive Enschede follows the innovation
theory of Rodgers [53]. Following this theory, the first people that use the product
are called the innovators. As mentioned before the innovators of the SRB are testing
and co-developing a first version of the SRB. The early adopters come after the
innovators. The early adopters are the first persons who will own the redesigned
consumer ready and DIY version of the SRB. After the early adopters follow the
early and late majority. The early and late majority consist of the remainder of the
inhabitants of the city of Enschede.
The waterboard Vechtstromen is one of the legislators and tertiary user in the
project. Tertiary users are those affected by the introduction of the system, or who
will influence its purchase [39]. The power of the waterboard in the project is
relatively low but their interest is equally as high as the interest of the municipality,
since water management is a shared responsibility between the waterboard and the
municipality. The main goal of the waterboard is to indirectly benefit from the
functionalities that the SRB will bring, allowing for better water management.
4.2 Interviews Several quantitative interviews were held with the stakeholders in order to get
insight in their specific requirements for the envisioned product. The interviews
were all semi-structured and also functioned as brainstorming sessions.
4.2.1 Municipality
In order to get insight in the requirements for the redesigned SRB two
brainstorm/interview sessions were held with the water management designer at the
municipality of Enschede, Hendrik Jan Teekens. During these meetings the
preliminary requirements for the redesign of the SRB were obtained. One thing that
became clear in the first meeting is that the municipality wants a rain barrel as buffer.
The barrel should have a capacity of minimal 200 liters or bigger depending on the

38
roof top size and situation. The municipality wants the system to operate fully
autonomous based on weather prediction data. The barrel should empty 2 hours prior
rainfall because this is the maximum time needed to get water out of the sewage
system. The system should preferably have a price below 250 euros.
One of the other points that was discussed is remote control by the municipality of
privately owned SRB installations. The conclusion of the discussion was that at launch
of the product the municipality should not have explicit control options over privately
owned SRB installations. However, the systems hardware should support this, so if in
the future the municipality wants water management controls, this could be realized
via a software update.
Furthermore, the municipality wants to stimulate to use the collected water around
the house. In some cases, it might also be beneficial for the ground water level to
drain the water into the garden. This depends on the location and on the time of the
year. Meaning that the buffer should only drain water in the garden if it is beneficial
for the ground water levels. Also, the overflow off the buffer must put water into the
garden if possible.
Also, the water quality of the buffered water was discussed. The system should
autonomously guard the quality of the water. For instance, in case of an increased
risk of the development of the legionary bacteria the water should automatically be
drained. The barrel should also be designed to protect against mosquito breeding
inside the barrel. The SRB should also have a filter.
Also, different types of SRB installations where discussed. The municipality likes the
idea of a “basic” and “extended” model. The basic model being an SRB that can only
drain water to the sewage and has the option to manually tap water for indoor and
outdoor use. The extended version would be a basic SRB with extra output modules
added to allow drainage of water into the garden or other uses.
Another point that was discussed is the installation of the buffer. The municipality
prefers installation by the end users but also suggested installation by an engineer if
necessary. These engineers could for instance be trained students.
In terms of system monitoring the municipality wants to focus on a personal
monitoring dashboard for the user of the SRB. This dashboard should motivate the
user to use water locally. The municipality also wants a public dashboard to promote
the SRB. The data collected by the SRB must be handled with care and must only be
use with respect for the user’s privacy and conform the European GDPR.
Table 2 shows the functional and nonfunctional requirements gathered from these
interviews and brainstorming sessions.

39
Table 2: Requirements municipality
Functional requirements Non-Functional requirements
The barrel should empty 2 hours prior
rainfall
The barrel should have a capacity of
minimal 200 liters or bigger
The system could support over the air
updates
There could be two versions of the
system, the basic and extended
version.
The system should automatically drain
the water incase of risk for legionella
The system should be installable by the
user self
The system must work autonomously The collected data should be saved and
transmitted in a secure way
The system must be able to drain water
to the sewage system
The system should cost less than 250
euros
The system is manually drainable The system should promote being environmentally friendly
The system must have a rainwater
overflow
The system should filter the rainwater
before it enters the barrel
The system should support an online
personal monitoring dashboard
The system could support an online
public promotion dashboard
4.2.2 Waterboard
There was also a brainstorm/interview session held with Jeroen Buitenweg, a senior
policy adviser on water management and climate adaption from the waterboard
Vechtstromen. Buitenweg pointed out that water management is a shared
responsibility between the municipality and the waterboard. The SRB would be an
interesting solution to solve flooding problems and promote local water usage.
Buitenweg pointed out that he wants the system to be as simple and robust as
possible. Out of his experience he learned that maintenance by user will often be
forgotten, it would be wise to design the system around this. Buitenweg also
pointed out that it is important that buffers that are in too wet parts of the city
should never discharge the water into the gardens but directly into the sewage
system.
Table 3 shows the functional and nonfunctional requirements gathered from the
interview and brainstorming session.

40
Table 3: Requirements waterboard
Functional requirements Non-Functional requirements
The system should only drain water into
the garden if the garden is located in an
area suitable for this.
The system must require low
maintenance.
The system should be durable
4.2.3 University
Out of the interviews and brainstorming sessions with Bults and Scholten, both
stakeholder representatives of the university, it became clear that they want to
have a consumer and DIY ready SRB that is ready to be used by the Early adopters
of the SRB project. They pointed out that the system should be developed in a way
that allows further development in the future of the project. The system must
upload its sensor data to a central data repository. During these sessions it was also
asked what they define as “consumer ready”. They responded on this that the
system should be consumer ready in the extend of being universal to install.
Situation specific part should not be included in the product and are the
responsibility of the user him or herself. The system should work reliably, be robust
and must be easy to assemble.
Table 4 shows the functional and nonfunctional requirements gathered from these
interviews and brainstorming sessions.
Table 4: Requirements university
Functional requirements Non-Functional requirements
The system must send the status information to the central data
repository.
The system must be reliable
The system must be robust
The system must be easy to assemble
4.2.4 Co-developers
During interviews and brainstorming sessions with Co-developer Tunç, who is working
on the DIY assembly instructions of the SRB, she pointed out that she is planning to
use instructions that are colored. Because of this, color coding of parts on the to be
developed system can be used. In order to keep the DIY tasks simple, Tunç also
requests a DIY product with predefined holes for valves or other equipment. The holes
could already be in the barrel or they could be easily cut out by the user during the
assembly process. This is something that should be researched further in the
realization phase because predefined holes limit the flexibility of placement of the
SRB.

41
During interviews and brainstorming sessions with Co-developer Planting, who is
working on the central data repository, it became clear that it is important for Planting
to guard the integrity of the data. For this reason, Planting proposed the use of an
Application programming interface (API) to communicate with the central data
repository in order to standardize and limit the operations that the SRB can perform
and secure the database in case of a security breach at the side of the SRB.
During interviews and brainstorming sessions with Co-developer Dortmann, who is
working on an SRB user dashboard, it became clear that Dortmann wants access to
the fluid level data and temperature of the buffered water in the SRB. He proposed
that the SRB should measure this at least every 1 minute and upload the data to the
server at least every 15 minutes. During the brainstorming sessions with Dortmann
the installation process of the SRB was also discussed. Dortmann agreed that it would
be most logical to incorporate the digital setup process of the SRB into the user
dashboard. Finally, Dortmann requested that the SRB would generated planned
discharges and send these to the central data repository. These planned discharges
are discharges that might happen in the near future based on precipitation
predictions. These planned discharges will be used in the user interface in order to
give the user insight in the behavior of the system.
Table 5 shows the functional and nonfunctional requirements gathered from these
interviews and brainstorming sessions.
Table 5: Requirements co-developers
Functional requirements Non-Functional requirements
The system must send the status information to the central data
repository.
The system could have predefined holes for the installation of parts in the DIY
assembly process.
The system should support an online personal monitoring dashboard
The system must communicate with the central data repository via an API
The system should measure the system
status every minute
The system could be setup via a web
interface
The system should send the system
status every 15 minutes to the central
data repository
The system should send planned
discharges to the central data
repository.
4.3 Scenarios This section contains a PACT analysis and PACT scenario. These tools help to get
insight into the needs of the users while using the SRB in the city of Enschede. The
source of information for this analysis and scenario originate from brainstorming

42
sessions with the municipality, the state of the art research, statistics from CBS [4],
the research of Defize [13], and the surveys from Steeghs [10] and Rindt [11].
In order to identify the user group and their needs a PACT analysis is performed in
two parts: a PACT pre-analysis [48] and the actual PACT analysis [46]. The
stakeholder analysis identified the early adopters as primary end-users. The PACT
pre-analysis is focused on this user group and has been used to create the actual
pact analysis and scenario for the early adopter.
4.3.1 PACT pre-analysis
This section contains a PACT pre-analysis for a smart rain water buffer system
following the PACT analysis technique and format of Trulock [48]. This user
centered approach will help understand the context the product will be used in
together with requirements that come with use in that particular context. The
primary user of the SRB will be the early adopter, living in Enschede. The pact pre-
analysis is used to get insight in the characteristics, motives, tasks, context and
used tools from the early adopter user group.
People
The user group of SRB owners will be very heterogeneous. This group contains
many different types of people. In short, the users in this group could be described
as the average citizen of the city of Enschede. The system will mainly be focused on
adults. The cognitive abilities of users will differ a lot. Meaning that the system and
the DIY assembly process should be designed for different levels of attention,
learning abilities, memory and perception. There will also be diversity in the physical
characteristics of the users. For example, difference in strength or physical abilities.
This could also mean that the user group contains people with special needs, like
wheel chair users or blind people. If the system is variable in the height of the
placement or provides some sort of audible feedback than the system would also be
usable by these types of users.
Enschede is also a very multicultural city, almost 30% of the inhabitants of
Enschede has a migration background. The vast majority of migrants have a
western background, culture wise there are no extreme differences [4]. But barriers
like language, might have an influence. This is something to take into account
during the development of the DIY assembly process and interface design.
The motives within the user group might also differ per user. Interests, personal
values and hobbies might have a big influence in the motivation to use a smart
rainwater buffer. People with the hobby of gardening might have a different
motivation to use a smart rain water buffer than people who are interested in the
environment and climate adaption. Another group of people might only use the
smart rainwater buffer if there are financial benefits linked to the user of the SRB.
Also, people in dryer parts of the city might not see the need to use a smart rain
water buffer to solve problems for people in more wet parts of the city. The focus

43
group of this project will be the early adopters. The early adopters are a subset of
the user group described above, but with a bigger interest in the project.
Activities
The goals of the SRB owners can differs and also the tasks and actions. The system
will mainly operate autonomously without needing any user interaction, this is
uniform for all users. Although the system can work almost fully autonomous it also
allows for some manually controlled actions.
The most uniform task that is applicable for all SRB users could be the cleaning of
the filtering system if this is not done automatically. This will be a regular task that
needs to be performed frequently. The system should remind the user to clean the
filter frequently. The main task of the user will be to monitor the system
performance and status. This will be done via a dashboard which is outside the
scope of this graduation project and will be the responsibility of co-developer
Dortmann, with a shared dependency on the central data repository of co-developer
Planting. An important aspect for this graduation project with regards to system
monitoring is providing the technical functionality to allow remote monitoring.
Another task that might be performed by the owner is using water from the barrel
for local usage. This can be done manually by tapping a certain amount of water
into a for example a bucket. This means that the user should have some way to
interact with the system to control the output valve. This could for instance be done
with a physical button placed on the system. Local water usage could also be
provided by using an extension module that allows to user to automate discharges
of water into the garden. This could for instance require a one-time action of
installing the extra outlet module and a setup process using the dashboard.
Context
The SRB owner can interact with the system in the digital context or in the physical
context. The physical context will very likely be outside, depending on the
placement of the SRB. It is assumed that most users will place the SRB outside the
house. The conditions in this environment differ per time of year. The digital context
also called social context will be via the dashboard which lays outside the scope of
this graduation project and will be the responsibility of co-developer Dortmann .
Technologies
The main technology used is the SRB unit. The input of the system will be sensor
data and prediction data but also user input. The output will also be data and the
controlling of actuators like the valves. The SRB unit will communicate with a
central data repository to get and to send data. The dashboard will also use the
central data repository.

44
4.3.2 Specific PACT analysis
This section contains the PACT analysis for the most important user group: the early
adoptors, based on the PACT analysis technique and format of Benyon and
Macaulay [46]. This user centered approach will help understand the context the
redesigned SRB will be used together with requirements that come with use in that
particular context. The PACT analysis is concluded with a use case scenario of an
early adaptor.
Scenario Title
SRB use by early adopters
Scenario History
Version Date Description
1 08-05-2018 Discussed at GP progress meeting
1.1 10-05-2018 Modified following discussion
1.2 07-06-2018 Modified following feedback
Scenario Type
Use case scenario
Rationale
This scenario has been developed as input for the concept ideation and
requirements identification for the redesign of the SRB. It is intended to provide a
rich description of a general context of the use of the redesigned SRB by an early
adopter. In the scope of this project an early adopter can be considered as one of
the first inhabitants of Enschede that buys and uses the in this project to be develop consumer version of the SRB.
PACT analysis
People – 34-year-old single woman with a passion for gardening, living in a
residential area in the east of Enschede. Graduated from hospitality school,
currently has permanent job as waiters with an monthly income of around 1500 – 2000 euro.
Activities – Using the SRB to harvest rainwater to use in her own garden and to
lower the change of a flooded backyard.
Context – Outdoor, in the garden of an terraced house in a residential area of the city of Enschede.
Technology – The Smart Rainwater Buffer, a system that can buffer water during
rainfall in order to reduce strain on the sewage system in order to prevent
flooding issues. The system will use weather prediction data to drain the
necessary amount of buffered water before it starts raining. The system should
allow for local water usage and supports the municipality in reducing the strain on the sewage system.

45
Scenario Petra Molenaar is a 34-year-old woman who was born and raised in the city of
Enschede. Petra works as a waitress at a restaurant located at the “Oude markt”
in Enschede. She started working there as a teenager and has worked their ever
since. Petra lives together with her dog Monty in a small cozy house in the east of
Enschede. What Petra loves about her house is the big garden. Petra loves to be
outside. Her biggest hobby is gardening, and she likes to grow her own vegetables. Next to her vegetables and flower beds, she also has a big lawn
because Monty also needs space to play. The big disadvantage of her garden are
the water problems. In the fall and winter her garden is too wet and in the spring
her garden dries up to the point that her garden is completely dry in the summer.
She had an irrigation system installed to keep the garden moist in the summer,
but this costs her a lot of tap water which is not an environmentally friendly
solution.
Petra heard that Frank from across the street has a Smart Rainwater Buffer (SRB)
prototype installed in his garden, which saves him lots of tap water and also
keeps his garden a little bit drier in the wet periods. Petra went over to Frank an
asked him about the SRB. Frank is very enthusiastic about his SRB, in fact Frank
is one of the innovators2 of the product and showed Petra exactly how the buffer worked. Petra really liked the buffer, especially because it nicely blended in to the
garden of Frank. Frank made his own wooden cover on the buffer, so it matches
with his garden shed. The robustness of the system also really appealed to her.
Frank modified the prototype in a way that there are no hanging wires that his
dog could possibly play with and overall the system looked reliable. Frank told
Petra that she could become one of the early adopter of the product, meaning
that she could become one of the first few people that has the consumer version of the SRB.
Once Petra got home she decided to become an early adopter, because she really
liked the concept of an SRB and she thinks it would be a very useful tool for her
backyard. Petra contacted the municipality to order a SRB for her own garden.
She picked an anthracite colored buffer because it matches with the color of her fence. Once the package with the Smart Rain Water buffer arrived Petra
immediately assembled the DIY system using the clear assembly instructions. The
employee of the municipality told her that the assembly would be easy, but she
didn’t expect it to be so extremely easy for real. In no time she had her SRB up
and running. Petra bought the basic model of the smart rainwater buffer because
at the moment she didn’t had enough money to buy extension modules to connect her garden irrigation system.
Petra now uses the SRB for over a month and she loves it. When she comes home
from a long day of work she goes in to her garden and waters her plants with
water from the SRB. She can just press a button to fill her watering can. After a
month of saving, Petra decides to buy the extension outlet module for her garden
2 Innovators are the first users of the product [53] and in this case also co-developers, for
more information see chapter 4.1

46
irrigation system. Together with the extension module she also got an DIY assembly manual. Before she mounted the extension module she first had to
empty her buffer. After she mounted the extension module she could simply
connect her irrigation system with the same connector she used for the tap water,
so she did not have to change anything on her irrigation system. After she
completed the installation she used the dashboard app to setup the irrigation
times for her garden. She was surprised that the municipality already offered pre-programmed settings based on the ground water levels in her neighborhood.
4.4 Preliminary Requirements As the Creative Technology design method describes the needs of the stakeholders
can be used to create preliminary requirement. Based on state of the art research,
interviews, stakeholder analysis and scenarios table 6 could be constructed. Table 6
shows a list of preliminary. This list is ordered in functional and non-functional
requirements and following the MoSCoW method requirements (see section 3.3.2
for an explaination).
Table 6: Preliminary Requirements
Functional requirements Non-Functional requirements
Must
The system must be able to buffer
water
The system must be durable
The system must filter the water before
it enters the barrel
The system must be modular
The system must work autonomously The system must be weather proof
The system must send the status information to the central data
repository.
The system must be reliable
The system must use weather
prediction data to regulate the buffer capacity
The system must require low
maintenance
The system must be able to drain water
to the sewage system
The system must be easy to assemble
The system must be manually drainable The system must be secure
The system must have an rainwater
overflow
The system must be designed for DIY
The barrel must have a capacity of
minimal 200 liters or bigger
The system must be installable by the user self

47
Should
The system should remind the user to
clean the filter
The system should use a wireless
networking technology
The system should be upgradable with
extra control or sensor modules
The system should promote being
environmentally friendly
The system should support an online
personal monitoring dashboard
The system should be energy efficient
The system should be able to
automatically drain water to the garden
The system should cost around 250
euros
The system should automatically drain
the water incase of risk for legionella
The system should communicate with
the central data repository via an API
The should indicate if an error occurred
The system should only discharge water
into the garden between a predefined
period of time.
The system should have a bypass
module to bypass the waterflow in the
winter to prevent freezing of the barrel.
A bucket should fit underneath the
manual tab
The barrel should empty 2 hours prior
rainfall
The system should send the system status every 15 minutes to the central
data repository
The system should measure the system
status every minute
The system should send planned
discharges to the central data
repository.
Could
The system could support over the air
updates
There could be two versions of the
system, the basic and extended
version.
The system could have predefined holes
for the installation of parts in the DIY
assembly process.
The system could be setup via a web
interface
Would
The system would support an online
public promotion dashboard

48
4.5 Concepts Several concepts were created by group and individual brainstorming (see Appendix
A for the results of the brainstorming sessions). All the concepts are ideated by
focusing on an SRB as a solution for both the end-user, the municipality and
waterboard to lower the strain on the sewage system during rainfall and therefore
preventing flooding issues. Some of the presented ideas take the preliminary
requirements more into account than others.
The first two concepts were created in order to find out if the stakeholders still want
to solve the problem of a too high strain on the sewage system by approaching it in
the same way as the previous projects focused on the problem. The previous
project, as stated before in chapter 2.2, focused on a smart autonomously
controlled buffering system. The first two concept are not focused on smart
autonomously controlled buffering systems and will not incorporate technology. The
reactions on these concepts will help understand if the stakeholders still want the
same approach.
The other concepts are all based on a smart autonomously controlled buffering
system. The difference in these concepts are the different types of buffering
methods, buffers and other functional and nonfunctional requirements.
4.5.1 Smart Art – Rain delay
Displayed in figure 20 is a concept of a rain delaying art piece. The object will have
no technology inside. The idea behind the concept is a buffer with holes in the sides
of the buffer. Once the buffer gets filled the water will flow slowly through the holes
reducing the amount of water per square meter per second. Instead of a large
amount of water in a relatively short time this concept will spread the same amount
of water over a longer period of time. This concept doesn’t allow control over the
buffered water and will also not be feasible for places with a too high ground water
level. This object would be more suitable to be placed in a public space like a park.
Figure 20: "Gaten kaas" rain delaying art concept. Source: Sefora Tunc

49
4.5.2 Delay roof
Displayed in figure 21 is a concept of a rain delaying flat roof. The concept doesn’t
use any technology. The idea behind the concept is a narrow hole in the roof to
slowly lets the water flow of the roof into the sewage system. This reduces the
amount of water entering the sewage system in a small period of time. The system
is very simple and only requires the narrow outlet hole and an overflow. The
overflow is need in case the roof is full and cannot buffer more water. This concept
doesn’t allow control over the buffered water and will only be useful for flat roofs
that are built to buffer water.
Figure 21: Rain delaying flat roof concept
4.5.3 SRB Garden Furniture
Displayed in figure 22 are some concepts of SRB garden furniture. The idea behind
the concept is adding SRB modules (e.g. control module, automatic valves) to
garden furniture or ornaments. For example, a planter could be used multifunctional
by having flowers on top and a SRB inside. This type of SRB would fit in the context
of every garden. At the outside it will not be visible that an SRB is inside. Since it is
multifunctional it is also space saving, something that is important in small gardens.
The limiting factor of this concept is the limited buffer size compared to other
rainwater buffering solutions.

50
Figure 22: SRB Garden Furniture concepts. First, smart water buffering planters. Source: Sefora Tunc. Second, smart water buffering fountain. Source: Sefora Tunc. Last, smart water buffering bar table. Source: Budget Living
4.5.4 SRB flat room module
Displayed in figure 23 is the concept of the SRB flat roof module. The idea behind
the concept is an SRB module that can be added to a rain pipe of a flat roof. The
SRB flat roof module will be able to control the flow though the rain pipe. It does
this by closing the rain pipe during rainfall to let the rainwater stay on the roof and
temporally buffer it there until the raincloud has passed. Once it has stopped raining
the module will open the rain pipe again allowing the water to flow into the sewage
system. This system will not buffer the water for a long period of time in order to
reduce the forces on the roof. In order to make sure the amount of water on the
roof does not get too much an overflow needs to be installed, to drain the water
after it reaches a certain level. The benefit of this system is that it is relatively
simple and does not require a hard installation process. The downside of this
concept is that the concept is only applicable for flat roofs that are able to store
water.
Figure 23: SRB flat roof module concept

51
4.5.5 SRB rain floor
Displayed in figure 24 is the concept of the SRB rain floor. The idea behind this
concept is a rain buffer that is integrated in the floor of the backyard. Instead of
placing tiles in the backyard one could also place a rain buffering floor. A rain
buffing floor is realized by placing an open shallow buffer underneath a floor made
of wooden planks. Small cracks between the planks will let the rainwater that falls
onto the floor flow into the buffer. The house’s rain pipes could also be connected to
the buffer. Combined with a control unit and an automatically controlled valve this
rain floor could function as a large capacity SRB. The SRB rain floor won’t take up
any space in the garden making this an interesting solution for gardens with limited
space but with the need for a rainwater buffer. The downside of the concept will be
the complicated installation process and the high costs.
Figure 24: Smart rain floor concept
4.5.6 Underground SRB
Displayed in figure 25 is the concept of an underground SRB. The idea behind this
concept is an SRB barrel buried underground in the garden. The benefit of this
concept is to ability to place a barrel with a large capacity because it will not take up
any space above ground in the garden. The big downside of this concept is
maintenance and installation. It will not be easy to perform maintenance on a buffer
that is buried in to the ground.

52
Figure 25: Underground SRB concepts
4.5.7 Rain pipe SRB
Displayed in figure 26 is the concept SRB rain pipes. The idea behind the concept is
using the length and capacity of rain pipes to buffer rainwater. This solution would
be very simple because it only requires one module to control the buffering and
draining to the sewage system, just like the concept presented in 4.5.4. The limiting
factor in this concept is the length of the rain pipes. For example, 1 meter of 80-
millimeter rain pipe will only be able to store approximately 5 liters of water.
Meaning that to buffer large amounts of water a long system of rain pipes is
needed.
Figure 26: Rain pipe SRB concept

53
4.5.8 Water Fence SRB
The company Rainwinner developed the Rainwinner water fence [54] (see figure
27). This product could be part of a SRB by adding the necessary components to
make this buffer smart. A water fence would not take up much space in the garden
since most people already have a fence in their garden. The Rainwinner is a
modular system consisting of connected modules that each have a capacity of 110
liters [54]. This makes the Rainwinner a flexible solution because the complete
buffer and capacity can be altered to the specifics of the garden it will be placed in,
for example 3 meters of fence could already buffer 1000 liters of water. 1 module
costs approximately 190,- euros. A buffer of 330 liters would already cost 565,-
euros [55].
Figure 27: Rainwinner Water Fence. Source: energienulshop
4.5.9 DIY Water Fence SRB
The previous concept of the Rainwinner water fence would be a good solution to
buffer a lot of rainwater in a small garden. The big downside of the concept is the
high cost. Because of this the a DIY water fence concept was ideated together with
R.G.A. Bults, the stakeholder of the university and supervisor of this project. The
concepts is a DIY water fence that can be build in almost any backyard in every
desired size. The concept is based on steel stone cage fences (see figure 28), these
fences are made by building a steel cage from concrete mesh and filling it with
stones. Instead of filling these steel cages with stone they could also be filled with
some sort of rainwater buffer. This could be done by making a custom “Water bag”
made from industrial plastic sheeting (see figure 29). Another option might be to
use pond foil this is thicker but also more expensive. In order to make the
construction steady and robust some poles are needed. Concrete poles would be a

54
good option, 2 poles are needed at the beginning and 2 at the end, so there are
poles on both sides of the concrete mesh. When the water bag is filled up it will be
very heavy this will result in a lot of pressure on the structure, extra poles are metal
strips might be needed to reinforce the strength of the structure. See figure 30 for
an impression of the concept. Using this construction and for example dimensions of
1x0.3x2 meters this would result in a buffer with a capacity of 600 liters
Ofcourse the plastic sheeting also needs to be constructed into a bag. There are
several ways to do this the most simple and cheap option would be to use a roll
closure (see figure 31). An other option would be to used platic welding to well the
platic sheeting together. The final option would be to let these plastic water bags be
produced in a factory.
The water bags would also need some type of outlet. For this the following
meganism presented in figure 32 was ideated. One could use a long fitting with a
flat plate and rubber ring at the end. This could be put through a round hole that is
cut into the plastic sheeting. At the other side of the sheeting one could place an
other rubber ring and use a large flat screw to tighten the fitting to the water bag.

55
Figure 28: Steel stone Cage inspiration. Source: Slegers Sierbestrating
Figure 29: Industrial Plastic Sheeting. Source: Brokers Kunststoffen
Figure 30: DIY water fence concept

56
Figure 31: Roll’n snap closure technique. Source: Ortlieb
Figure 32: DIY water fence outlet concept

57
4.5.10 Wall mounted SRB: Small footprint large capacity
This idea is inspired by the common terraced houses (Dutch: rijtjeshuizen) in the
Netherlands (see figure 33). Most of these houses have long rain pipes at the front
and the back of the house with lots of empty unused space around them. The idea
is to replace a part of these rain pipes and replace it with tall wall mounted rain
buffers (see figure 34 and 35). The buffers will have a small footprint but will be
very tall in order to provide a large buffer capacity. The buffers can have a tap at
the bottom that can be used for local water usage by the residents of the house.
The buffers could be equipped with the necessary components to make the buffers
smart. In case the buffers will be located at the front of the house these buffers
could for example easily be professionally installed by the housing associations or
municipality. The power could come from a dedicated wire for SRB installations
running through the street or from the meter cupboards in the houses themselves.
The building guidelines in the Netherlands say the meter cupboards must be located
close the entrance of the house [56], meaning that providing the SRB with power
from the meter cupboard will not be a too difficult job. Because this the meter
cupboard will be in the front of the house close to where the buffers would be
installed.
A buffer with the dimensions of 250x60x40 cm could already buffer 600 liters of
rainwater. If the entire block of houses would be equipped with these buffers on the
front and the back of the house than all the rainwater that is collected by the entire
roof could be buffered.
Figure 33: Common terraced houses (rijtjeshuizen) in the Netherlands. Source: ANP

58
Figure 34: SRB wall mounted concept
Figure 35: Concept in context, Original image source: CBS

59
4.5.11 SRB DIY module
Displayed in figure 36 is the concept of an SRB DIY module. The idea behind the
concept is to provide an SRB module that can be applied to any type of barrel. In
other words, this allows for an SRB DIY project in which the user needs to provide
his own rain barrel and the module can be added to it to make the barrel an SRB.
The most important aspect behind this concept is that it only consists of two easy to
install modules. The benefit of this concept is the small package size in case of
shipping to customers this reduces costs since the buffer is not included. The
downside of this concept is that there is no control in what barrels will be used,
meaning that the modules must be compatible with different types of barrels.
Figure 36: SRB DIY module concept, left the sensor-computing-power unit and right the valve unit
4.5.12 SRB rain barrel
Displayed in figure 37 is the concept of an SRB barrel. This concept is based on the
previous prototypes of the SRB. An SRB barrel that can be placed outside in the
garden and is easy to install and maintain. The benefits of this concept are that it is
simple, and it can use widely available components. The system can easily be
extended with extra modules and will be durable.

60
Figure 37: SRB barrel concept
4.6 Evaluation The different concepts were presented to the municipality, university and co-
developers. During the presentation of the concepts it was confirmed that the to be
developed solution must be able to buffer water and that the drainage of the buffer
needs to be based on the weather predictions and the freshness of the water. The
municipality and the university decided to choose for the SRB barrel concept because
of its simplicity, flexibility and installation process. The barrel concept must be a DIY
product that can be assembled by the user of the SRB. Although the stakeholders
choose for the barrel concept they also saw potential in the bring your own barrel
SRB DIY module concept. They want the DIY buffer concept to be developed, but
during development there should also be thought about using technologies and
techniques that can be applied also for the bring your own barrel SRB DIY module.
The stakeholders also made clear again that the system should communicate with the
central data repository in order to provide data that suffices for the creation of an
online management dashboard
After the municipality and the university agreed on the concept of the SRB barrel, the
municipality and the university where interviewed on the specifics and requirements
of the system. It was confirmed that the system must be modular, and the installation
of the modules should not be too difficult.
Together with the municipality and the university it was decide that a the SRB should
be powered by a power plug, plugged in to a wall socket (230v). Besides the safety
concerns, decrease in flexibility of placement and a less environmentally friendly
image it was still decided to use a power plug instead of a solar and battery
combination as a power source. If a solar and battery combination would have to

61
been used it would be very important that the power source is able to reliably deliver
power to the system even in case of a long period cloudy weather when the solar
power is limited. The municipality and the university pointed out that a solar and
battery power system would be preferred over a power plug but in this graduation
project there is not enough time to develop a completely reliable solution which is
also cost effective. A solar and battery power system would be very beneficial in areas
where the power grid is unreliable, but this is not the case in the Netherlands. See
figure 38 for a concept of the different power sources.
Figure 38: SRB power source options, a) a power plug, b) a fixed solar panel, c) a detachable solar panel
It was decided that either a local or a wide area wireless networking technique will
be used for data communication. Both will be research in the realization phase and
the most suitable technique will be chosen for the final consumer version. It was
decided by the municipality and university to use a wireless communication
technique because it is not common that people have a wired network connection
available in their garden.
The University stated that all the rainwater should go through the system, meaning
that a rain barrel filler (Dutch: vul automaat) cannot be used because this system
will not divert all water into the barrel. All the available rainwater should enter the
system. This makes it easier to study the performance of the system. Since a rain
barrel filler cannot be used anymore there is the need for an overflow. The
municipality wants that the overflow can either go into the garden or into the
sewages system. This dependents on the groundwater level and the time of year.
The waterboard stated that the system must be kept simple, meaning that also the
overflow must be. The stakeholders agreed on the argument of the waterboard and
together they agreed that the output of the overflow will be decided at installation
and that people can change it later if they want to. The stakeholders didn’t like the
idea of a manual 3-way valve at the overflow that can be used to quickly change
between output to the sewage system to output to the garden, they belief this is the
responsibility of the user to implement this themselves if they want to. The
stakeholders liked the idea of notifying the users when it is advised to change the
output of the overflow. The university pointed out a diverter to protect the barrel
from freezing is not a must have requirement. The university made the claim that
a B C

62
qualitative good components in contact with water will not get damaged if the
temperature outside is below zero.
Both the municipality and the university agreed that the system must be robust.
Two concepts of SRB barrels were presented to them (see figure 39). The first
concept has the output valve and control unit on the front and the second concept
has these both below the buffer. The municipality and the university agreed that the
second concept with the outlet and control unit at the bottom will be the most
robust. One other remark they made is that all parts should be waterproof because
of the use of water and possible condensation.
Figure 39: SRB concepts, a) control unit and valve on the front, b) control unit and valve underneath the barrel
Furthermore, the need for different types of SRB systems suggested by the research
of Defize [13] were discussed. It was decided that there will be a basic and
extended version of the SRB. The basic version should be upgradable with extra
modules (e.g. extra output valves or water quality sensor). But for the scope of this
Graduation Project the focus should be on the basic model.
The municipality wants the basic model to use weather prediction data to plan
drainages before rainfall. The basic model also must be able to drain automatically
to the sewage system. The output overflow must be able to be connected to the
garden or sewage system. The basic model should also allow the user to manually
tap water from the system for local usage. The municipality wants a dedicated tap
for manual water usage and doesn’t want the automatic outlet to be used for the
manual tapping of water. See figure 40 for the different concepts for manual
drainage and the extended version.
a B
Sensor unit Sensor unit
Control unit
& valve Control unit
Valve unit

63
Figure 40: SRB local water usage concepts and extended version, a) no extra tap, b) extra tap, c) extended model
Finally, the municipality and co-developers confirmed that the SRB should have
support for a user dashboard that allows users to monitor the system. The SRB
must communicate with a central data repository that keeps track of the water level
and draining of the buffer. The user interface will then get these data from the
central data repository and display it to the user. Since the SRB must be a DIY
product the setting up of the system must also be done by the user. In order to
make this user friendly it was decided together with co-developers Planting and
Dortmann to let the user setup the system via the to be developed online user
interface. The setting will be stored in the data repository and will be requested by
the SRB at first bootup.
4.7 Final concept It can be concluded that the stakeholders wants an SRB that uses a barrel as buffer.
This buffer must have a capacity of a least 200 liters. The system will work
autonomously and will not be directly controllable via the network, only manually at
the location of the buffer. The SRB uses weather prediction data in order to control
the output and the capacity of the buffer. Incase it is going to rain the buffer will
drain enough water based on the prediction data, this must happen 2 hours before
rainfall. The buffer also monitors the water temperature in order to detect risks for
legionella and will drain the water automatically if it is configured to do this. The
system is powered via power plug connected to the electricity grid. The system also
uses a wireless network connection. The system sends its status information to the
central data repository. The system has one controlled output to the sewage system
or garden and a second output for a manual valve. The valves and control unit will
be at the bottom of the barrel in order to safe space and to be more robust. The
system has a rainwater inlet and overflow. The cost price of the system should
preferably be around 250 euros. See figure 41 for an impression of the final
concept.
a B
Sensor unit Sensor unit
Control unit
& valve
Control unit
Valve units
Sensor unit
Control unit
& valve Tap
Detachable hose
connector
C

64
Figure 41: Final SRB concept
4.8 Evaluated preliminary requirements Because the stakeholders evaluated the concepts and made a choice on what
concept to realize, the requirements for this phase could be finalized and confirmed
by the stakeholders. Table 7 below contains the final list of requirements for this
phase.
Table 7: Confirmed Requirements
Functional requirements Non-Functional requirements
Must
The system must be able to buffer
water
The system must be durable
The system must work autonomously The system must be robust
The system must be able to drain water
to the sewage system
The system must be weather proof
The system must be manually drainable The system must be modular
The system must provide the option to
connect the overflow to the garden or
sewage system
The system must be reliable
The system must filter the water before
it enters the barrel
The system must require low
maintenance
The system must have a rainwater
overflow
The system must be secure
The system must use weather
prediction data to regulate the buffer
capacity
The system must be easy to assemble
Control unit
Valve unit
Sensor unit
Tap
Inlet &
overflow

65
The system must send the status information to the central data
repository
The system must be installable by the user self
The system must drain 2 hours prior rainfall
The system’s capacity must be at least 200 liters
The system must be safe to use
The system must fit in a garden
The system must be designed for DIY
Should
The system should remind the user to
clean the filter
The system should use a wireless
networking technology
The system should indicate if an error
occurred
The system should promote being
environmentally friendly
The system should measure the system status every minute
The system should be energy efficient
The system should automatically drain
the water in case of risk for legionella
The system should communicate with
the central data repository via an API
The system should support an online
personal monitoring dashboard
The complete system should cost not
more than 250 euro
The system should be able to
automatically drain water to the garden
The user should be able to opt out for
the option to drain water in case of
risks for legionella
The system should send the system
status every 15 minutes to the central
data repository
A bucket should fit underneath the
manual tab
The system should send planned
discharges to the central data
repository.
The system should be upgradable with
extra control or sensor modules
Could
The system could only overflow into the garden between a predefined period of
time.
The system could be independent from the user’s private communication
infrastructure.
The system could support over the air updates
The system could be scalable
The system bypasses the waterflow
from the rain pipe in the winter to prevent freezing of the barrel
The system could be setup via a web
interface
Would
The system would support an online
public promotion dashboard
There would be two versions of the
system, the basic and extended
version.
The system would have a self-sufficient
power source (e.g. solar/battery
combination)
The system would have predefined
holes for the installation of parts in the
DIY assembly process.
The system would not require a
software setup process by the user.

66

67
5 SPECIFICATION
This chapter describes the specification phase of the project. The starting point for
the specification phase are the final concept and requirements from the ideation
phase. This chapter presents a functional system architecture visualized with block
diagrams and activity diagrams which describe the overall system, the subsystems
and the interaction between the subsystems. Finally, the requirements are evaluated
again and presented.
5.1 Functional system architecture This section contains a description and visualization of the functional system
architecture of the SRB. First an overview of the SRB and connected systems is
presented. Secondly a decomposition and an activity diagram of the SRB logic are
presented. Finally, specific internal functions are described.
5.1.1 Level 0: System overview
Figure 42 gives a black-box view of the complete system and connected systems. As
can be seen in the figure the SRB has inputs from the outside world, water level, and
temperature. Next to these two inputs the system has a connection with a
precipitation prediction source. The SRB can send a request to the precipitation
prediction source and then the precipitation prediction source responds with the
precipitation predictions. The system is also connected to the central data repository.
The SRB is able to send data (e.g. temperature and water levels over time) to the
central data repository. The SRB is also able to send a request for data (e.g.
configuration settings) to the central data repository. The central data repository will
than respond with the requested data.

68
Figure 42: Overview of SRB system
5.1.2 Level 1: SRB combined functions
Figure 43 gives a first level decomposition of the SRB system, it shows the combined
functions within the SRB system. The center of the system is the SRB logic. When the
SRB is powered for the first time it will first request its configuration data from the
central data repository. After it has received the config data it will start operating as
a smart rainwater buffer. The SRB logic uses the notifications send by the job
scheduler function to trigger actions. These actions are requesting the water level,
requesting the water temperature and discharging an amount of water. Another
function of the SRB is to periodically request precipitation predictions this is done by
sending a request to the network handler. The network handler connects to the
precipitation prediction source and sends the prediction data back to the SRB logic.
The SRB logic analyses this data and checks if it has enough capacity left to buffer
the predicted rainwater. In case there is not enough space left, the buffer will drain
the needed amount water. This is done by using the drain and water level measure
functions. Finally, the buffer also periodically sends the collected data to the central
data repository. This is again done via the network handler. For a more detailed view
of the logic of the SRB see the Activity diagram in figure 44.

69
Figure 43: SRB decomposition

70
Figure 44: SRB activity diagram
Activ
ity
Decis
ion n
ode
Merg
e n
ode
Fork
In
itial n
ode
Fin
al n
ode

71
5.1.3 Level 2: SRB function description
Discharge function
Figure 45 give a decomposition of the discharge function. The central function of the
discharge function is the “water level control function”. This function controlles the
valve based on the given amount of water that needs to be drained and the current
water level.
Figure 45: Decomposition of discharge function
Temperature measure function
Figure 46 gives a decomposition of the temperature measure function. The SRB
logic can request a status update from this function. This request is handled by the
“sensor data converter function” which sends a pull request to the “get temperature
sensor data function“. The “get temperature sensor data function“ returns the raw
sensor data. This data is converted and send to the SRB logic by the “sensor data
convert function”
Figure 46: Decomposition of temperature measure function

72
Water level measure function
Figure 47 gives a decomposition of the water level measure function. The SRB logic
can request a status update from this function. This request is handled by the
“sensor data converter function” which sends a pull request to the “get water level
sensor data function“. The “get water level sensor data function“ returns the raw
sensor data. This data is converted and send to the SRB logic by the “sensor data
convert function”
Figure 47: Decomposition of water level measure function
5.2 Final Requirements The functional system architecture resulted in additional functional requirements
these are added to the list with requirements than now is finalized. See table 8 for
the finalized list of requirements.
Table 8: Final requirements
Functional requirements Non-Functional requirements
Must
The system must be able to buffer
water
The system must be durable
The system must work autonomously The system must be robust
The system must be able to measure the water level in the buffer
The system must be weather proof
The system must be able to drain water
to the sewage system
The system must be reliable
The system must be manually drainable The system must be secure
The system must provide the option to
connect the overflow to the garden or
sewage system
The system must be easy to assemble
The system must send the system
status to a central data repository
The system’s capacity must be at least
200 liters
The system must use weather
prediction data to regulate the buffer
capacity
The system must be safe to use
The system must be able to measure the water temperature in the buffer
The system must fit in a garden

73
The system must be able to store measurement data until it is send to the
central data repository
The system must be modular
The system must drain 2 hours prior rainfall.
The system must be designed for DIY
The system must support an online
personal monitoring dashboard
The system must require low
maintenance
The system must send the status
information to the central data
repository
The system must be installable by the
user self
The system must filter the water before
it enters the barrel
The system must have a rainwater
overflow
Should
The system should remind the user to
clean the filter
The system should use a wireless
networking technology
The system should indicate if an error
occurred
The system should promote being
environmentally friendly
The system should measure the system
status every minute
The system should be energy efficient
The system should send the system
status every 15 minutes to the central
data repository
The system should require low
maintenance
The system should automatically drain
the water in case of risk for legionella
The complete system should cost not
more than 250 euro
The system should automatically drain in case of risk for freezing.
The user should be able to opt out for the option to drain water in case of
risks for legionella
The system should be able to notify the user in case of an error.
The user should be able to opt out for the option to drain water in case of
risks for freezing
The system should be able to warn the user about risk for legionella.
A bucket should fit underneath the manual tab
The system should be able to
automatically drain water to the garden
The system should communicate with
the central data repository via an API
The system should send planned
discharges to the central data
repository.
Could
The system could only overflow into the
garden between a predefined period of
time.
The system could be independent from
the user’s private communication
infrastructure.
The system could be configurable via
the central data repository.
The system could be scalable

74
The system could still function for a few days if the network connection fails.
The system could be setup via a web interface in the to be developed user
dashboard.
The system should be upgradable with extra control or sensor modules
Would
The system would support over-the-air
(OTA) software updates.
There would be two versions of the
system, the basic and extended
version.
The system would have a self-sufficient
power source (e.g. solar/battery
combination)
The system would have predefined
holes for the installation of parts in the
DIY assembly process.
The system would not require a
software setup process by the user.

75
6 REALIZATION
This chapter describes the realization phase of the project. The starting point for
this phase is the final concept and the functional architecture given in the chapter 4
and 5. This chapter starts off with a decomposition of the final concept. Choices for
every part are made and elaborated. After that the system is divided into
subsystem for which prototypes were made and tested. Finally, two complete
prototypes of the SRB are presented. The first prototype is focused on proving the
concept of the SRB and the second prototype is the final DIY and consumer ready
prototype based on the final design and specifications.
6.0 Decomposition of final concept Now that the system has been specified a detailed decomposition of the final
concept can be given. The system will consist of a buffer with a capacity of at least
200 liters. This buffer is directly connected to a rain pipe and also has an overflow
to the sewage system or garden. In order for the system to work autonomously a
controller is needed. This controller uses sensors to measure the fluid level and the
water quality. The controller uses these values to control an electric valve that can
drain the buffer to the sewage system or to the garden of the owner. In order to
compute the draining of the system prediction data is needed. This data is
requested through a network interface. The used networking technology will either
be a local or wide area network technology. This network interface will also be used
to connect to the central data repository, to request configuration data and to send
measurement and control logs. The system will be power via the electricity grid. The
product must be design for DIY, the installation process must not be too
complicated. Parts must have a good quality and must be easy to install. The overall
price of the system should be around 250 euros. The list of the main components is
listed below.
- Barrel
- Barrel base
- Network controller
- Controller
- Sensors
- Power source
- Overflow
- Input
- Input filter
- Electric output valve
- Manual tap

76
6.1 Components Because the system is developed for consumers and for a DIY the system should be
very robust and easy to install. The total price of the system should also stay below
250 euros. Qualitative good components are needed but should not be too
expensive, for this reason more standardized components will be used, these are
widely available and will also be cheaper than extraordinary components. The next
sections will give an overview on the available component options and the most
suited components for this system.
6.1.1 Barrels
A potential buffer must have a minimal capacity of 200 liters. The buffer must also
fit in the context of a garden and must not take up too much space in the garden.
The total price of the system should also stay below 250 euros. Taking into account
these requirements a list of potential barrels is given in appendix B, this is a
complete overview of considered barrels, pros and cons, suppliers and prices.
The main goal in selecting a barrel is finding a barrel that doesn’t take up too much
space but still has an as large as possible capacity. For this reasons round barrels
are considered less space saving than rectangular barrels. The benefit of rectangular
barrels is that they can fit in a corner and take up a bit less space. Another benefit
is that is easier to place a connector on a flat surface. The downside of rectangular
barrels is that a rectangularly shaped barrels are less firm than round barrels. For
this reason, most rectangular buffers don’t have completely flat sides, this is to
reinforce the buffer. These deviations on the sides might potentially cause problems
for certain measurement techniques.
Conclusion
After comparing the potential buffers, the Garantia square rain buffer is the best
option. This buffer has a rectangular shape and has a capacity of 300 liters. The
barrel has its own custom stand that also has space inside to place an automatic
valve and computing unit. The buffer comes with a tap that is in an optimal location.
If the buffer is placed on the stand it has the ideal height to place a bucket under
the tap. The buffer has mostly flat sides, this makes it easy to install connectors.
Finally, the buffer also has a removable lid, this is nice for installation and
maintenance. The buffer including base only cost 58 euro’s. See figure 48 for an
impression of the buffer.

77
Figure 48: Garantia Rain buffer. Source: Garantia
6.1.2 Filtering
Because it was chosen to connect the rain pipe directly to the rain barrel there is a
change that leaves, and other types of debris end up in the barrel. The expert
opinions on rain barrels [34] [35] strongly recommend using a filter. A filter doesn’t
only prevent debris from entering the barrel but also prevents mosquitoes from
entering the barrel. On the other hand, the case studies from riversides [22]
showed that user are very likely to forget cleaning the filter, resulting in flooding
issues and potentially damage to the roofs.
There are several options when it comes to filtering the most save option is using a
downspout filter (Dutch: bladscheider). This device (figure 49) simply filters leaves
out of the water before they can enter the buffer. A downspout filter requires very
low maintenance and it not likely to get clogged. The disadvantage is that is a
relatively coarse filter, meaning that it will not filter out the smaller debris and also
doesn’t prevent mosquitoes from entering the buffer.
Figure 49: Downspout filter. Source: Hornbach

78
A second option would be to already filter the water before it leaves the gutter. This
could be done using a leaf guard (Dutch: Bladbolrooster) (figure 50). This is the
most simple and cheap solution. The leaf guard can be place in the gutter where the
pipe is connected to the gutter. This will prevent leaves from entering the drain
pipe. The downside of this solutions is that it is relatively coarse filtering, meaning
that it will not filter out the smaller debris and also doesn’t prevent mosquitoes from
entering the buffer. Another disadvantage is that all the leaves will stay in the
gutter, this should be cleaned occasionally, meaning that one would have to go up
to the gutter and remove the leaves from the gutter.
Figure 50: Leaf guard. Source: Hornbach
A third option would be to bring the leaf guard down to the buffer. The filter guard
could also be placed at the place where the drain pipe is connected to the barrel.
The advantage would be that now the leaves won’t stay in the gutter but at the
input of the buffer. The disadvantage is still the risk of clogging is the user forgets
to clean out the buffer input. It also doesn’t prevent fine debris and mosquitoes for
entering the barrel. See figure 51 for an impression of the solution.
Figure 51: Filter guard in barrel input connector
The final option would be to use some kind of screen or fine mesh that prevents
leaves and other debris from entering the buffer. Currently there doesn’t exist a
pre-made solution for rain barrels using screen or mesh but it could be easily self-
made. Nylon filter mesh (figure 52) is sold on roles and can be easily made into a
custom filter sock. This filter sock can be used to filter out fine and coarse debris

79
and also prevents mosquitoes from entering the barrel. Figure 53 shows two
concepts using a filter sock. The disadvantage of using a filter sock is that it can get
clogged, resulting in flooding issues and potentially roof damage. This could be
prevented by using a large filter sock and regularly cleaning or changing the filter
sock.
Figure 52: Nylon filter mesh. Source: Wildkamp
Figure 53: Filter mesh concepts
Conclusion
After evaluating the concepts with the stakeholders, it was decided that the filter
sock will be used as filtering solution. This solution meets the requirements of the
municipality to filter the water as much as possible. The filter sock also prevents
mosquitos from entering the barrel.

80
6.1.3 Input, overflow, and output
When it comes down to selecting the type of input for the SRB it comes down to two
options. 1) using a rain barrel filler or 2) using a direct input from the rain pipe into
the buffer. Since the stakeholders decided that all water should go into to the
system only option 2 is left. Since expert options also advice that the buffer is
completely closed except for inputs and output the only option is to use a connector
that connects the rain pipe to the rain buffer.
There doesn’t exist a pre-made solution to connect a rain pipe to a rain barrel, but
this can easily be made using a simple downspout-gutter connector and a rubber
ring (see figure 54). The same solution could also be used for the overflow. The
user can simply connect a rain pipe to the connector and divert it to where ever the
user wants.
Figure 54: downspout-gutter connector and a rubber ring. Source: Wildkamp
The output of the valve should be able to connect to valve. There exist a pre-made
solution for this, a skin fitting (see figure 55).
Figure 55: Skin fitting. Source: Wildkamp

81
6.1.4 Valves
Before selecting a valve, it is important to set some requirements for a potential
valve. The first requirement is that the valve must be of good quality and must work
reliably. Secondly the valve must have an IP rating of at least IP-54. It is important
that the valve is dust protected and splashing water proof because the valve will be
used outdoors. The valve must also be cost-efficient because there is a limited
budget for the SRB, 100 euro would be the maximum, based on the other expenses
that need to be made. Finally, the valve must be controllable electrically and
preferable operate on a low voltage, if possible even as low as possible in order to
limit energy consumption.
Based on these requirements market research showed that there are only two types
of valves that meet these requirements, magnetic solenoid valves and ball valves.
Solenoid valves are the most cost effective but have the disadvantage of being
sensitive to debris in the water. Since the water quality cannot be guaranteed this
valve would not be the most reliable option. The most reliable option is the ball
valve. A ball valve can perform better in dirty water and is available in many
different sizes. The downside of electric ball valves is that they are not widely used
and that there are not a lot of suppliers. Because of this reason the price of ball
valves in the Netherlands is relatively high. This might be a problem because the
budget for the complete SRB is limited, especially in the future if SRB’s with multiple
valve are considered.
Research showed that there are also foreign suppliers that can deliver potentially
better valves for a fraction of the price of a locally purchased valve. Based on the
specifications the price/quality ratio of electric ball valves from foreign suppliers is
better than the price/quality ratio of locally purchased valves. A potential downside
for the foreign purchased valves it the delivery time. The average delivery time is
two weeks for a foreign purchased valve and only a few days for a locally purchased
valve. Because this graduation project is executed in a limited time span the
delivery time might be too long. But for commercial use this doesn’t have to be a
problem because one could just order a large amount of these valves in advance. A
final concern might be the warranty. It is assumed that warranty of a foreign
purchased valve is not as good as the warranty of a locally purchased valve. But on
the other hand, the warranty of the foreign purchased valve is also less important
because the price is substantially lower than the price of locally purchased valve and
it might even be easier and cost effective to just replace a broken valve with a new
one instead of getting warranty from a supplier.
Research showed that in the Netherlands there is one supplier that supplies
motorized valves below 100 euros. This is the supplier “JP Fluid Control” who sells
products via magneetventielshop.nl. the cheapest option is the 67 euro, 12v, ½
inch, IP-54 electric valve (see figure 56). This is a relatively small valve, bigger
valves become costlier.

82
It was found that the foreign suppliers have a bigger product range with lower
prices. The AliExpress3 platform was used to get insight in these suppliers. It was
found that CWX is the most promising supplier. Their products are not only sold
under their Chinese brand but also under the other international brands U.S Solid,
BACOENG, and Misol. CWX has a product range of valves ranging from diameter
DN8 to DN32, voltage 5v to 24v, and a price range from 9 to 17 euro’s. All valves
are rated IP-65 and can handle a maximum pressure of 10 bar. For more extensive
specifications see appendix F. For an impression of the valve see figure 57.
Figure 56: JP Fluid Control 12v 1/2-inch valve. Source: JP Fluid
Control
Figure 57: CWX 5v 1-1/4-inch valve. Source: CWX
It was decided to test the CWX valves in order to check if they meet the quality
requirements for the locally available valves. The test of the CWX valves can be
found in appendix G.
conclusion
After performing the tests, it can be concluded that CWX valves will be used for the
product. The valve is reliable and has better specification than the more expensive
JP Fluid Control valves. The CWX valves are not only much cheaper but are also
available in a 5 volt version, which is an ideal voltage for affordable solar power
systems.
6.1.5 Controller
The controller of the system will be a Raspberry Pi. This controller is energy and
cost efficient, easy to program, and has embedded support for networking. The
Raspberry Pi also has the needed GPIO pin for connecting sensors and actuators.
The Raspberry Pi is chosen over an Arduino because a Raspberry Pi is more
powerful and has better support for networking.
3 On foreign websites it’s important that the correct search query is used. The best search
query for AliExpress is “motorized ball valve”. If a valve with a certain working voltage is
required simply add “5v” or “12v” at the end of the search query.

83
6.1.6 Network connection
In order to find the best networking solution a literature research was performed.
This section contains a literature review that focuses on suitable data
communication technologies for the SRB. IoT devices can generally make use of two
types of communication technologies: short range and long-range technologies
[57]. In order to determine what data communication technology of what type is
best suited for the SRB two literature reviews were performed and presented below.
Both literature reviews are based on the requirements of the SRB to allow 2-way
communication, and to be energy efficient. Finally, the pros and cons of using a
short or long-range technology in an urban area is presented.
6.1.6.1 Long range data communication technologies
The main objective of this literature review is to provide an overview of long range
data communication technologies that are used or can be used in creating a Smart
city and are suited to be used for the SRB. A useful data communication technology
for the SRB has the preliminary requirements of being energy efficient and being
able to both send and receive data. The SRB should also be controllable over the
network.
The first section of this literature review focuses on what key aspects are important
for IoT networks in urban areas. The second part touches upon the data
communication technologies that are most suitable to use in urban areas. In this
part, an overview of different data communication technologies is presented
together with their advantages and disadvantages. The final part contains a
comparison on what data communication technologies best to use for what type of
Smart City systems.
Key aspects of Smart City IoT networks
There are four main key aspects when it comes to IoT networks in cities. In all the
studied papers published in the last three years all researchers agree that these
aspects are the most important for urban IoT networks. Some authors give
explanation on the importance of these key aspects and others only simply state
them. The first key aspect is low device cost. Ericsson [58] states that it is important
that the IoT devices have a low cost because it is a key enabler for, wider accessibility,
large volume applications, enabling lots of new use cases. Raza, Kulkarni, and
Sooriyabandara [59] also look at this aspect from another point of view, namely the
cost of the required infrastructure. It is important to consider what it will cost to bring
the infrastructure in place in order to provide connection to the low-cost devices.
The second key aspect is long battery life. Raza, Kulkarni, and Sooriyabandara [59]
point out that communication operations consume more energy than processing
operations. For this reason, it is crucial that the energy consumption for
communication operations is as low as possible. Zhai [60] and Marais, Malekian, and
Abu-Mahfouz [61] both highlight the importance of this aspect by noting that IoT
devices that are placed all over the city will probably not all have an unlimited power

84
source available. If this is the case than the only option is to equip the devices with a
battery or super capacitor that can last long or can be recharged on the place of
deployment.
The third key aspect is a long communication range. Especially in public areas like
cities it is not convenient to place lots of receivers all through the city. It is more
convenient to have a few central points that have a very large range. This minimizes
the needed infrastructure which also minimizes the need of maintenance and
investment cost of the infrastructure [62].
The fourth and last key aspect is scalability. As Bibri [63] points out, IoT is becoming
more affordable and accessible and the amount of IoT devices will keep increasing.
Especially for the purposes of big data analysis large amounts of data are required.
Data that needs to be collected by as many nodes as possible. As Song et al. [62]
state together with the previous key aspect of long range, there should only be a few
long-range base stations. Because of this given requirement it is important that these
base stations support large amounts of connected devices.
Low Power Wide Area Networks
The best networking technologies for urban IoT networks are Low Power Wide Area
Networks (LPWAN). Wireless networks for IoT purposes can be divided into two
categories. The first category is short-range transmission technologies and the second
category is long-range transmission technologies [64]. The category that fits the
needs of Smart City IoT networks is long-range transmission technologies. Within this
category lay the Low Power Wide Area Networks (LPWAN). As the name implies, these
types of networks are energy efficient and have a large range, providing connectivity
to devices in a large area.
In literature (Vejlgaard et al. [65]; Song et al. [62]; Adelantado et al. [66]) the
opinions are divided on what the most suitable LPWAN technology is for Smart city
IoT. This is especially the case in the papers published after 2016. In 2016 the 3rd
generation partnership project (3GPP), a global body for telecommunication
standards, released the LTE Advanced protocol that standardized a protocol called
Narrowband IoT (NB-IoT). This protocol made the use of the cellular licensed
frequency networks very suitable for low power, long range IoT network solutions.
Before the standardization of NB-IoT the cellular network did not really have an
energy efficient enough networking technology that could compete with other network
solutions for low power IoT devices [67]. Before NB-IoT got announced the only
cellular networking technology available that more or less satisfied the key aspects
was LTE-M, but one may state that this networking technology does not meet the
requirement of low power and scalability [68].
The other suitable technologies for Smart City IoT networks all use the unlicensed
spectrum for operation. As Li et al. [57] point out, in this spectrum everyone is
allowed to operate following some country depended restrictions. There are not only
divided opinions on licensed and unlicensed bands but also on network technologies
in the unlicensed band. Because the licensed band only recently got support for low

85
power, long range networks there were already multiple technologies developed in
the unlicensed band. The two most promising and adapted technologies found in
literature (e.g., Adelantado et al. [66]; Raza et al. [59]) are LoRa and SigFox. Now
that there is a clear understanding on the status of LPWAN technologies it can be
concluded that the two networking technologies that operate in the licensed band:
NB-IoT and LTE-M, and also the two in the unlicensed band: LoRa and SigFox are the
most suitable to use in urban areas.
NB-IoT
NB-IoT is the most recently developed networking technology that is widely adopted
and suitable for urban IoT networks. As Song et al. [62] outline NB-IoT is a networking
technology that is an evolution of LTE (4G), one of the most adopted cellular network
technologies. The technology was standardized by the 3GPP in 2016, with the goal to
provide wide coverage for a large amount of low-power, low-cost IoT devices. Because
the technology is built upon LTE, currently the most widely adopted cellular
networking technology, NB-IoT operates in the licensed spectrum and it has the
advantage of being very flexible in deployment. As Li et al. [57] point out NB-IoT
relies on the already in place cellular infrastructure, therefore no big investments are
needed to deploy NB-IoT. NB-IoT can be deployed in 3 different modes: The NB-IoT
carrier can be deployed within the LTE carrier, in the LTE guard band, or operate
stand-alone. Zhai [60] adds to this that the flexibility of NB-IoT and the reuse of
already in place base stations allows NB-IoT to be deployed fast and easy and
therefore also at a low cost. Li et al. [57] also claim that the big advantages of NB-
IoT is its guaranteed coverage indoor and maximum range up to 35 kilometers. They
also point out that the disadvantage of NB-IoT is its latency. The maximum latency
of NB-IoT is 10 seconds therefore the technology cannot be used for latency-sensitive
applications.
LTE-M
Before NB-IoT was standardized by the 3GPP the only cellular networking technology
available that more or less satisfies the key aspects for urban IoT was LTE-M. For the
usage of LTE-M it really depends on what particular urban IoT application it is used
for in order to decide if it meets all the requirements of an urban IoT solution [68].
LTE-M is a protocol on top of the LTE protocol, this makes the deployment of LTE-M
simple and easy. LTE-M is compatible with the already in place LTE infrastructure, so
the network operators will only have to update their systems’ software [69]. LTE-M
is a cellular networking technology therefore it operates in the licensed spectrum. As
Yang et al. [68] point out the scalability and energy efficiency of LTE-M are
questionable. This is because LTE-M uses a wider band than NB-IoT and it supports
higher data rates. The higher data rates can in some applications be an advantage,
but the disadvantage is the higher energy consumption. Another advantage of LTE-M
is that its latency is small enough to provide a connection to latency-sensitive
applications.
86
LoRa
The most adapted LPWAN in the unlicensed spectrum is LoRa. Because LoRa operates
in the unlicensed spectrum it is open to everyone, therefore everyone is allowed to
deploy a LoRa network [62]. Augustin, Yi, Clausen, and Townsley [70] point out that
the LoRa technology consist of two parts. The LoRa physical layer and the LoRaWAN
networking protocol. The LoRa physical layer uses a Chirp Spread Spectrum radio
modulation technique, this technique is proprietary technology from Semtech. The
LoRaWAN networking protocol, enables large amounts of LoRa equipped devices to
connect with a gateway. As Adelantado et al. [66] describes, LoRa operates with a
low power consumption, that could allow around 10 years of battery lifetime. LoRa
modules are relatively cheap and have a low data rate but a long communication
range, which in urban areas lays between 2 to 5 km and around 15 km in suburban
areas. A LoRaWAN network is organized in a star-of-start topology. In this
configuration gateways relay messages between end-nodes and an internet
connected network server. The connection between the gateway and end devices is
wireless. The connection between the gateway and the server goes via IP over
Ethernet or Cellular. The communication is bidirectional but the use of only uplink
communication from end device to gateway is preferred, because of duty cycle
restrictions of gateways. LoRaWAN supports three classes of devices Classes A, B and
C. Each class has different capabilities. The classes differ in power consumption and
duty cycle, as explained in the following [66]. As they also point out in the research
on the limits of LoRa is that LoRa has some constraints. Because LoRa operates in the
unlicensed spectrum its key constraint is the regulation on maximum duty cycle,
which is in Europe only 1 percent, limiting the maximum transmission time per day.
Because of this constrained the downlink messages to an end-node negatively
influence the capacity of the network because gateways also need to operate following
the regulations. Finally, LoRa could also experience a capacity decrease because of
the uncoordinated deployment of gateways or other networking technologies
operating on the same frequency.
SigFox
Another leading networking technology that also operates in the unlicensed spectrum
is SigFox. As Adelantado et al. [66] point out, SigFox is considered less open and less
flexible than LoRa. As described by Bonavolontà et al. [71], SigFox uses Ultra-
narrowband technology meaning that only a very narrow portion of the spectrum is
used. Because of this the effect of noise is minimized and the hardware of end nodes
becomes less complicated, but the required gateways are therefore more complicated
and expensive. Because of the proprietary design of SigFox, the technology is also
very energy efficient. Just like LoRa, SigFox biggest constrains are the duty cycle
regulation and noise in the unlicensed spectrum from other devices. The SigFox public
network has country wide coverage in the Netherlands [72]. To use the network, the
end node must be compliant with the closed SigFox protocol and a payed subscription
per end node is required. This subscription is offered by exclusive local partners of
SigFox. These partners are responsible for maintaining the local network
infrastructure.

87
Comparison
When it comes down to selecting the best suited technology it all depends on what
type of IoT solution it will be used for. SigFox and LoRa are suitable networking
technologies for data acquisitioning while NB-IoT and LTE-M are more suitable for the
combination of data acquisitioning and control actions. Augustin et al. [70] state that
SigFox can be a good choice for data acquisitioning IoT and less for command-and-
control purposes. Adelantado et al. [66] claim that LoRa would be a better solution
for data acquisitioning. Because Lora is considerd more open and flexible, giving the
developer the opertunity to make more efficient IoT solutions without to many
restrictions when it comes to the networking technology. Bonavolontà et al. [71] add
to this that the benefit of LoRa above SigFox is that for the use of LoRa networks
there is no restriction to a fixed provider and payed subscription. When using LoRa
there is a choice in using a network by a provider or setting up a privately-owned
network. In terms of power consumption there is not much of a difference, both
technologies require very low power.
On the other hand, Cano and Iborra [69] claim that other technologies in the licensed
spectrum are not only a better option for the use of data acquisitioning but also for
providing control options. They state that LoRa and SigFox are not reliable and flexible
enough compared to NB-IoT and LTE-M. Because LoRa and SigFox operate in the
unlicensed spectrum they have the constrained of obeying the strict duty cycle
regulations and they are more likely to experience errors by interference from other
technologies in the unlicensed spectrum, this is especially the case for the LoRa
protocol. Ericsson [58] adds to this that SigFox and LoRa are patented standards, in
both cases only one manufacture has the exclusive right on the chip design. Mobile
operators and some companies that are developing IoT solutions do not like this
because they do not want to be dependent on just one party.
Yang et al. [68] claim that when it comes to the most flexible technology in terms of
use cases, NB-IoT is the best solution based on the four key aspects of LPWAN. NB-
IoT is less restricted than SigFox and LoRa, it has a higher data rate, is more scalable
and still has a low power consumption. Compared with LTE-M, NB-IoT is more energy
efficient and has a much larger coverage, while LTE-M facilitates a higher data rate
and lower latency. Zhai [60] points out that both LTE-M and NB-IoT can reuse already
in place base stations making the deployment of these technologies fast and easy and
therefore also at a low cost. LoRa and SigFox require a new infrastructure. But the
infrastructure for these technologies is significantly cheaper than the infrastructure
for the cellular technologies. So, in case no infrastructure is in place, LoRa and SigFox
would be cheaper to deploy, with LoRa being the cheapest solution. An overview of
the comparison between the technologies is presented in table 9.
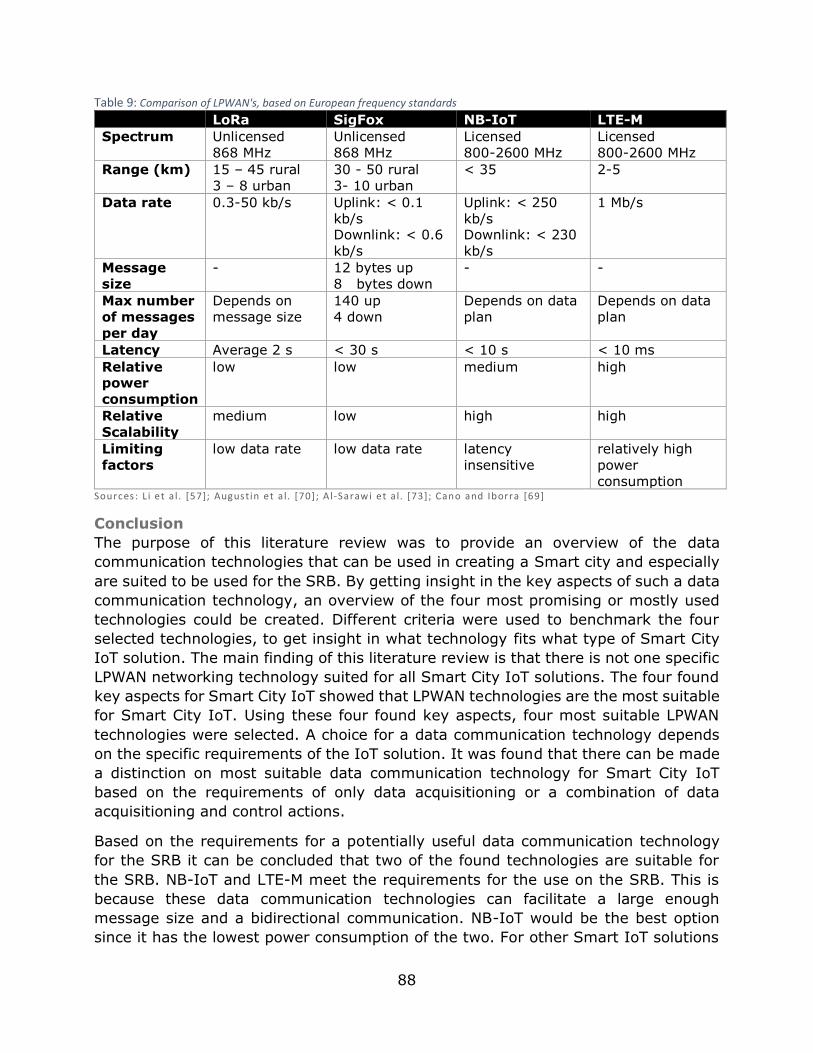
88
Table 9: Comparison of LPWAN's, based on European frequency standards
LoRa SigFox NB-IoT LTE-M
Spectrum Unlicensed
868 MHz
Unlicensed
868 MHz
Licensed
800-2600 MHz
Licensed
800-2600 MHz
Range (km) 15 – 45 rural
3 – 8 urban
30 - 50 rural
3- 10 urban
< 35 2-5
Data rate 0.3-50 kb/s Uplink: < 0.1
kb/s Downlink: < 0.6
kb/s
Uplink: < 250
kb/s Downlink: < 230
kb/s
1 Mb/s
Message
size
- 12 bytes up
8 bytes down
- -
Max number
of messages
per day
Depends on
message size
140 up
4 down
Depends on data
plan
Depends on data
plan
Latency Average 2 s < 30 s < 10 s < 10 ms
Relative power
consumption
low low medium high
Relative
Scalability
medium low high high
Limiting
factors
low data rate low data rate latency
insensitive
relatively high
power
consumption Sources : L i et a l . [57]; Augustin et a l. [70]; Al-Sarawi et a l. [73]; Cano and Iborra [69]
Conclusion
The purpose of this literature review was to provide an overview of the data
communication technologies that can be used in creating a Smart city and especially
are suited to be used for the SRB. By getting insight in the key aspects of such a data
communication technology, an overview of the four most promising or mostly used
technologies could be created. Different criteria were used to benchmark the four
selected technologies, to get insight in what technology fits what type of Smart City
IoT solution. The main finding of this literature review is that there is not one specific
LPWAN networking technology suited for all Smart City IoT solutions. The four found
key aspects for Smart City IoT showed that LPWAN technologies are the most suitable
for Smart City IoT. Using these four found key aspects, four most suitable LPWAN
technologies were selected. A choice for a data communication technology depends
on the specific requirements of the IoT solution. It was found that there can be made
a distinction on most suitable data communication technology for Smart City IoT
based on the requirements of only data acquisitioning or a combination of data
acquisitioning and control actions.
Based on the requirements for a potentially useful data communication technology
for the SRB it can be concluded that two of the found technologies are suitable for
the SRB. NB-IoT and LTE-M meet the requirements for the use on the SRB. This is
because these data communication technologies can facilitate a large enough
message size and a bidirectional communication. NB-IoT would be the best option
since it has the lowest power consumption of the two. For other Smart IoT solutions

89
it completely depends on the requirements of the solution to select the right data
communication technology.
Despite that the findings of this research can give a guideline in selecting a suitable
data communication technology for Smart City IoT, some critical remarks should be
made. This research did not explicitly take into account the availability and providers
of the proposed data communication technologies for a specific area. In some cases,
it might be more beneficial or mandatory to use already in place networks than having
to setup a new network, this could bring other factors like subscription costs that
could influence the choice for a suitable data communication technology. Therefore,
further research in appendix C of this report presents research on the status of the
four found networking technologies in their practical use. Looking at availability and
providers of the networks in the Netherlands and the cost of required network
modules that are needed for the IoT solution.
6.1.6.2 Short Range data communication technologies
Next to long range data communication technologies it would also be possible to use
a short-range data communication technology for the SRB. With the use of a short-
range data communication technology the system needs a local gateway to connect
to, in case of the SRB this gateway would be placed inside the private ethernet
network of the SRB owner. This gateway can relay messages between the SRB and
the Internet. The Goal of this literature review is to provide an overview of short range
data communication technologies that are used or can be used in IoT applications and
are suited to be used for the SRB. A useful data communication technology for the
SRB has the preliminary requirements of being energy efficient and being able to both
send and receive data. The SRB should also be controllable over the network.
The first section of this literature review focuses on what types of short range data
communication technologies are suitable for the SRB. The second part provides an
overview of the different suitable data communication technologies. The last part
contains a comparison on what data communication technologies best to use for the
SRB.
Local Area Networks
The most suitable types of short range networks for the SRB are Wireless Personal
Area Networks (WPAN) and Wireless Local Area Networks (WLAN). As Rahman [74]
points out these networks should have a range between 20 to 100 meters. This range
would be large enough for the SRB since the SRB is likely to be placed close to a
house with a gateway inside. As found in literature [57] [62] [73] there are four
short range networking technologies that currently dominate the IoT market. These
technologies are ZigBee, Wi-Fi, BLE, and Z-Wave. The technologies differ in key
aspects for implementation, for example in energy efficiency or data rate.

90
ZigBee
The Zigbee protocol is created by the ZigBee alliance based on the standardized low
power wireless communication standard IEEE 802.15.4. The goal of ZigBee is to
provide a small sized personal area network at a low cost and low power consumption
[73]. As Li et al [57] notes, because of its low deployment cost and its low power
consumption the technology is widely adopted to IoT solutions. As they also point out,
ZigBee operates in the unlicensed spectrum. But because it operates in the unlicensed
spectrum it shares this spectrum with other appliances, so it is more likely to
experience interference. As Ahmad et al. [75] point out ZigBee is based on
master/slave and facilitates two-way communication between devices. Zigbee also
facilitates the functionality of confirming that messages were received, this makes
ZigBee a reliable networking solution. Overall ZigBee is considered to be a good
solution for the use in in-home IoT devices.
Wi-Fi
Wi-Fi is a high-speed wireless internet technology. Currently this network is available
in almost all households in the Netherlands and if not, it is easy and cheap to setup.
Wi-Fi is designed to provide a secure, high-speed and reliable communication. The
data rate of Wi-Fi is higher than the most WPAN networks. The coverage of Wi-Fi
reaches up to 100 meters, depends on conditions like interference and obstacles. As
Chen and Han [76] point out Wi-Fi works via an ip based protocol this is an advantage
when comunicating with the internet. The downside of Wi-Fi is its high power
consumption, because of this it is not suitable for many IoT devices [57]. Another
disadvantage pointed out by Song et al. [62] is that Wi-Fi also operates in the
unlicensed spectrum, meaning there is a higher chance of interference. Especially in
urban densely populated area’s the range of Wi-Fi is strongly influenced by other Wi-
Fi networks in that area. This could be a problem for the SRB, since the SRB will also
be placed in densely populated areas.
BLE
Bluetooth low energy (BLE) also known as Bluetooth smart is a protocol that is very
suitable for IoT solutions. BLE was designed for low latency, low power, low bandwidth
and short-range IoT applications. The benefits of BLE compared to classic Bluetooth
are a lower setup time, support for an unlimited number of nodes in a star network
topology and most important a lower power consumption [73]. As Rahman [74]
describes BLE also works via the Master/Slave principal, and also facilitates two-way
communication. As he also points out, BLE has support for internet connectivity, this
is beneficial if the slave device wants to communicate with the internet. Just like the
other technologies BLE also operates in the unlicensed spectrum.
Z-Wave
Z-Wave is designed to be a low power protocol for IoT communication, especially for
smart home appliances. The technology facilitates the sending and receiving of
relatively small packages at low data rates. For this reason, Z-Wave is only suitable

91
for sending small messages like control commands. Z-Wave supports two types of
devices, controller and slave devices. The slave devices are limited in the way that
they are unable to initiate messages. Slave devices can only reply and execute
commands that are being send by a controller device. For this reason, slave devices
have a very low cost [73]. This would be a problem because the SRB (slave) needs
to functionality of being able to initiate messages. If Z-Wave would be used for the
SRB, then the gateway (master) should periodically initiate communication with the
SRB (slave). As Li et al. [57] point out, Z-Wave also operates in the unlicensed
spectrum, but on a much lower frequency than the technologies mentioned above. Z-
Wave operates on a frequency where it must obey to European duty cycle restrictions
of 1%, for this reason the number of messages and message size is limited per day.
Z-Wave is low power, reliable and low-cost therefor it is widely used in smart home
and other IoT appliances.
Comparison
When comparing the four above mentioned network technologies it clearly shows that
there is a trade of between power consumption and data rate. As Al-Sarawi [73]
pointes out the low data rate and master slave implementation of Z-Wave make the
technology mostly useful for control operations and not for transferring large amounts
of data. Z-Wave has the lowest power consumption, but it has some constraints,
therefore it is not useful for the SRB.
Zigbee has a higher data rate than Z-Wave and still a respectively low power
consumption but is limited in range. The data rate of ZigBee is still relatively low
compared with the other technologies. But if data rate and limited range are not
important for the IoT application than ZigBee would be a good choice [75]. In case of
the SRB, ZigBee would be a good option, but only of the distance between the
gateway and the SRB is not too big.
If a higher data rate is required at roughly the same power consumption than BLE
should be a good choice. The data rate of BLE is much higher than the data rates of
Z-Wave and ZigBee. This technology would be a good choice for the SRB, but to use
BLE a gateway is required. This is also the case for ZigBee and Z-Wave. The
advantage of Wi-Fi is that most people already have a Wi-Fi network, so no extra
gateway is needed. Wi-Fi also has the advantage of having a very high data rate, but
this comes at the price of a very high-power consumption. If Wi-Fi would be used for
the SRB than a large power source is needed and the SRB will probably not be able
to run on a solar charged battery. The disadvantage of all technologies is that they
all operate in the unlicensed spectrum a therefor have a higher change for
interference. An overview of the comparison the technologies is presented in table
10.

92
Table 10: Comparison of WLAN's, based on European frequency standards
Zigbee BLE Wi-Fi Z-Wave
Frequency
bands
2.4 GHz
Unlicensed spectrum
2.4 GHz
Unlicensed spectrum
2.4 GHz or 5
GHz Unlicensed
spectrum
868 MHz
Unlicensed spectrum
Range 10-50 m 100 m 100 m 30-100 m
Data rate < 171.2 kbps < 1 Mbps > 10 Mbps < 40 kbps
Latency 15 ms 3 - 6 ms 3.2 – 17 ms 100 ms
Relative
power consumption
Low Low Highest Lowest
Limiting factors
Short range Unlicensed spectrum
High energy consumption
Low data rate
Sources : Song et a l . [62]; Al -Sarawi etal . [73]; L i et a l . [57]
Conclusion
The Goal of this literature review was to provide an overview of short range data
communication technologies that are used or can be used in IoT applications and are
suited to be used for the SRB. The networking technologies should meet the
requirements set for the SRB. The goal of this research was reached by getting insight
in the most used and suitable IoT data communication technologies. After the
comparison of the four data communication technologies one data communication
technology could be selected to be most suitable for the SRB. This data
communication technology is BLE. BLE meets the requirements of low power and two-
way communication. BLE has a large range and provides the option to use the IPv6
protocol, making it easily to create a gateway to the internet. If the range would not
be an important factor than ZigBee would also be a good option for the SRB. It is
reliable and also meets the preliminary requirements. Wi-Fi does not meet the
requirement of being energy efficient, but the advantage of Wi-Fi is that no extra
gateways need to be install because there is a high change that these are already in
place. So, incase low power would not be a requirement than Wi-Fi would be the most
suitable option. Despite that the finding in this literature review can provide a
guideline in selecting a suitable short range data communication technique, some
critical remarks should be made. This literature research is based on theoretical
value’s and specification of the techniques. Only in practice it can become sure if the
chosen solution indeed is the most optimal in a given environment. Factors like
interference and attenuation can differ per situation and location therefore practical
experiments should to be conducted if one of these technologies is chosen to be used
on the SRB.

93
6.1.6.3 Short vs Long range
Now that there is a clear overview of both short and long range wireless data
communication technologies they can be compared. As Song et al. [62] point out
short range wireless data communication technologies like Wi-Fi and ZigBee are very
suitable for small scale personal area networks. Wi-Fi has a high data rate a low
latency, but high power consumption. Zigbee is the opposite, it has a low data rate,
but is also very low power. The long range technology NB-IoT lays in between the
two data communication technologies when looking only at the data rate but NB-IoT
has a much larger range and can handle more connections than Wi-Fi and ZigBee.
LPWAN technologies like NB-IoT are more consumer friendly. As Song et al. [62] and
Li et al. [57] point out, the use of short range wireless networks like Wi-Fi and ZigBee
also comes with a high chance of unexpected failures because of the widely used
communication environments. This challenges the end users who lack patience and
specific knowledge. The advantage of NB-IoT is that it provides a city-scale network
for IoT devices without any particular configurations on the gateway or having to
setup a new gateway. NB-IoT makes adding devices to the network a simpler task,
the entire process can be completed without the need for expert knowledge.
As Li et al. [57] point out in their research, NB-IoT is the best choice for IoT devices
like the SRB. NB-IoT is very reliable since it is operating on top of the operators’
existing cellular networks on licensed bands which are significantly more reliable than
unlicensed solutions. The NB-IoT protocol supports repeating transmissions of data
to enhance the reliability of transmission. The security of NB-IoT is also better than
all the other proposed solutions in this report. This is because NB-IoT relies on the
security of the cellular networks, whose security mechanisms are based on a physical
subscriber identification module (SIM) attached to the device. Next to the high
reliability and security, NB-IoT also has a high scalability, flexibility and availability.
The downside of NB-IoT is the dependency of the user on the operators. Operators
ask a monthly fee for their services and this price could for some user maybe be too
high. Than a BLE network would be a better alternative, a short-range networking
technology. If short range technologies were to be used for the SRB this would mean
that a gateway would have to be placed at the owner’s house, being the bridge
between the SRB and the internet. The benefits of short range wireless technologies
on the SRB would be the low power consumption and relatively high data rates. The
downsides of the use of short range wireless technologies for the SRB are the
dependency on the SRB owners’ private network and the limited distance between
the placement of the barrel and the gateway. If long range wireless communication
technologies would be used for the SRB, then the SRB could connect to a centralized
gateway that provides connection to multiple SRB installations in the area. The
benefits would be the independency of the SRB owners’ network and the simplicity of
the system, the home owner doesn’t have to install a gateway. The downside of long
range wireless communication in this scenario would be the limited data rate because
the power consumption needs to be low. Below follows a list of pros and cons based
on the use of the two different networking technologies on the SRB.

94
Short Range Long Range
Pros
• Lower power consumption (not
always)
• Not depending on carriers and payed data plans
• Less restrictions
• Higher data rates
Pros
• Low power (only at low data
rates)
• Not dependent on SRB owner’s private network
• No network configuration at
placement required
• Less hardware required (no
gateway)
• Less installation required by
owner Cons
• Dependent on home owner’s
private network
• Network configuration at
placement required
• More hardware required • More installation required by
owner
• Short range of gateway/router
• Disturbance of gateway/router
Cons
• Lower data rate
• Not always free to use
• Can be dependent on carrier
• More restrictions
6.1.6.4 Final choice
After evaluating the findings on data communication technologies and looking at the
list of available networks in Enschede (see appendix C), the stakeholders indicated
that they prefer the Long-Range data communication technology NB-IoT over the
Short-range data communication technology Wi-Fi. Taking into account the current
state of NB-IoT there is a chance that NB-IoT will not work flawless. For this reason,
two versions of the SRB will be developed in parallel, one version with NB-IoT and
one version that used the local Wi-Fi network of the SRB owner.
The hardware costs for NB-IoT are relatively high at this moment in time. A
Raspberry Pi NB-IoT shield cost 90 euro. But it is expected that the prices will drop
in the near future when NB-IoT becomes more mainstream [58]. The hardware for a
Wi-Fi connection is already build in the Raspberry Pi.

95
6.1.7 Sensors
The system will be measuring the fluid level and the temperature. The fluid level
measurements will be used as input for the smart buffering logic. The temperature
measurements will be used to monitor the water quality. Both measurements will
also be used by the user interface. This section will contain information on fluid level
measurement techniques and the most suitable technique to use for the redesign of
the SRB. Next to that this section also contains information on the most suitable
temperature measurement technique and the applications of using temperature
measurements in determining water quality.
6.1.7.1 Expert opinion, fluid level measurement techniques
The previous prototypes of the SRB both made use of Ultrasonic sensors to measure
the fluid level in the barrel. In previous research it was found that this sensing method
is not completely reliable in certain conditions. This section will list all possible and
realistic technologies to measure fluid levels in the barrel of the SRB. This section is
based on the web article “A Dozen Ways to Measure Fluid Level and How They Work”
by expert Henry Hopper [77]. In this article Hopper gives and overview of twelve
techniques that can be used to measure fluid levels. A selection was made on the
usability of these techniques when used to measure the fluid level in a rainwater
buffer. The relevant technologies are presented together with their advantages and
disadvantages. Finally, a conclusion is drawn to determine which sensing technique
is in theory the most suitable for the SRB. This depends on the important aspects of:
simplicity of the sensor, variable sensing range, reliability, accuracy and relatively low
price. For this section where nonscientific sources used, because of the lack of
practical information on these techniques in scientific literature.
1. Floats
The first method is using floats. The float sensors that are used currently consist of a
floating magnet and multiple read switches. The magnetic float floats on the fluid
while being in a tube or connected to a pipe. The tube or pipe contain read switches
which detect the float. The advantages of this measurement technique are the
simplicity and low chance on errors in measurements. The sensor is also very cheap.
The disadvantages are the scalability and accuracy. The measurement instrument is
always of a fixed length. This is not a continuous level-measuring device, meaning
that it cannot discriminate level values between steps [77]. See figure 58 for an
impression of the sensor.

96
Figure 58: float sensor. Source: SWI
2. Hydrostatic Devices
In measuring fluids there are three types of hydrostatic devices. Displacers, bubblers,
and differential-pressure transmitters. See figure 59 for an impression of the sensors
Displacers – These types of sensors use the Archimedes principle by continuously
measuring the weight of a displacer inside the process liquid. When the liquid level
increases, the displacer will become lighter to the sensor. This way the sensor can
measure the fluid level. The advantage of this method is the accuracy. The
disadvantage is the fixed size [78] [77].
Bubblers – This type of sensor is used for barrels that operate under atmospheric
pressure. A tube is placed in the process liquid the end of the tube is located at the
bottom of the barrel. Air is blown through the tube into the barrel. The pressure in
the tube depends on the fluid level in the barrel, this pressure is measured [77]. The
advantage of this technique is the simple design and construction. The disadvantage
is the complicated calibration process [79].
Differential-pressure (DP) transmitters– This sensor is placed at the bottom of the
fluid tank. The sensor measures the pressure that the fluid inside the tank creates on
the sensor. This pressure is compared with a reference pressure (normally
atmospheric pressure). The advantage of this sensing technique is the accuracy and
simplicity. The disadvantage is that these sensors only work in clear liquids, this could
be a problem with rainwater [80] [77].

97
Figure 59: Displacer, Bubbler, DP sensor working principle presented respectively. Source: Henry Hopper
3. Load Cells / Stain gauges
A load cell or strain gauge are sensors that can convert a force into an electrical
signal. If a load cell would be used for fluid measuring than the barrel should be
specifically designed around the load cell. The support structure of the barrel should
allow the barrel to put its force on the loadcell. The advantage of a load cell is that it
doesn’t has to be in contact with the fluid. The disadvantages are the high price, high
influence from temperature or wind load. Meaning it can’t be used outside easily.
Also, the barrels design should be compatible with the load cell [81] [77]. See figure
60 for an impression of the sensor.
4. Capacitance Transmitters
These types of sensors make use of dielectric constants of fluids because this constant
is different from air. The sensor has a transmitter connected to a rod and a reference
probe that are both inside the fluid, these form the two plates of a capacitor. The
capacitance between the two plates gets higher when the fluid level rises. This
capacitance is measured and provides a continuous level measurement [77]. The
advantage of this technology is the reliability and no moving parts. The disadvantage
is the fixed range and high price. See figure 61 for an impression of the sensor.
5. Magnetostrictive level transmitter
This sensor consists of a rod with a magnetic float on it. The sensor sends a current
pulse down the rod and measures the time it takes until it receives a reflected signal
by the magnets in the float. The advantage of this sensor is the accuracy. The sensor
is not influenced by pressure or temperature. The disadvantages are the fixed size of
the rod and the high price of the sensor [77]. See figure 62 for an impression of the
sensor.
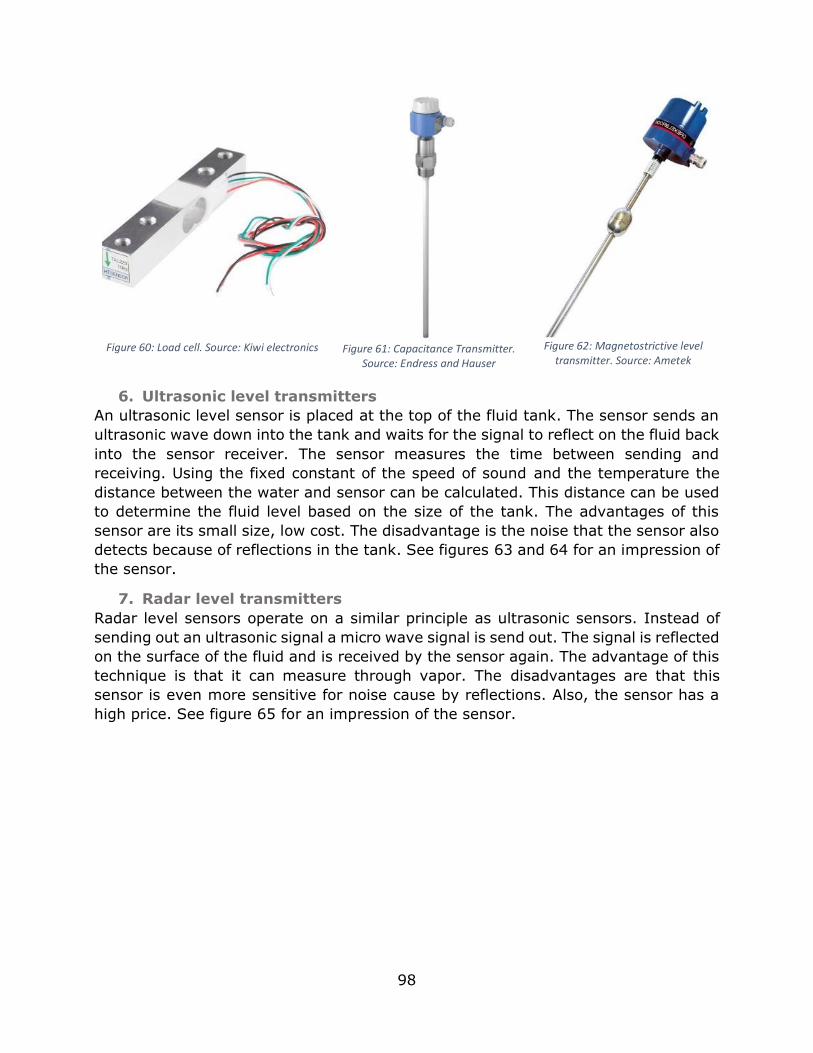
98
Figure 60: Load cell. Source: Kiwi electronics
Figure 61: Capacitance Transmitter.
Source: Endress and Hauser
Figure 62: Magnetostrictive level
transmitter. Source: Ametek
6. Ultrasonic level transmitters
An ultrasonic level sensor is placed at the top of the fluid tank. The sensor sends an
ultrasonic wave down into the tank and waits for the signal to reflect on the fluid back
into the sensor receiver. The sensor measures the time between sending and
receiving. Using the fixed constant of the speed of sound and the temperature the
distance between the water and sensor can be calculated. This distance can be used
to determine the fluid level based on the size of the tank. The advantages of this
sensor are its small size, low cost. The disadvantage is the noise that the sensor also
detects because of reflections in the tank. See figures 63 and 64 for an impression of
the sensor.
7. Radar level transmitters
Radar level sensors operate on a similar principle as ultrasonic sensors. Instead of
sending out an ultrasonic signal a micro wave signal is send out. The signal is reflected
on the surface of the fluid and is received by the sensor again. The advantage of this
technique is that it can measure through vapor. The disadvantages are that this
sensor is even more sensitive for noise cause by reflections. Also, the sensor has a
high price. See figure 65 for an impression of the sensor.

99
Figure 63: Ultrasonic sensor
Source: Kiwi electronics
Figure 64: Ultrasonic level sensor working principle. Source: Henry
Hopper
Figure 65: Radar level transmitter working
principle. Source: Henry Hopper
Conclusion
Taking into account the advantages and disadvantages of the different sensing
techniques. A selection of potentially useful techniques for the redesigned SRB has
been made based on the aspects listed at the beginning of the section: simplicity of
the sensor, variable sensing range, reliability, accuracy and low price. Based on
these aspects the DP sensor and the ultrasonic sensor would be most suitable for
fluid level measuring in the SRB.
Research showed that DP sensors are not widely available and also not very cost
effective. For this reason, more research was done on improving ultrasonic level
measurements. Ultrasonic sensors only cost between 1 and 2 euros and can be
accurate enough if installed in the correct way, more on this is presented in the next
section.
6.1.7.2 Improving Ultrasonic Level measurements
Previous research of Vetter [12] and Groeneveld [14] both concluded that fluid level
measurements made using an ultrasonic sensor can be inaccurate because of echo’s
and misinterpreted signals. As Groeneveld pointed out, ultrasonic sensors have
measurement deviations. This is because the sensor sends sinusoidal signals with a
certain amplitude. These signals can be received at different amplitudes which result
in small deviations in measurements. Because of this it is important that a
measurement margin is used [14]. Next to measurement deviations, echoes are
also important to take into account. As Vetter pointed out in his research, ultrasonic
measurements in closed barrels need to deal with interference from echoes that
arise in a closed barrel [12]. Temperature also has impact on the measuring
accuracy [82]. This is because temperature influences the speed of sound. For this
reason, it is important that ultrasonic measurements are analyzed with a

100
compensation for the effect of temperature and the speed of sound. Some sensors
already come with an ambient temperature sensor that can be used to compensate
for this effect. Other environmental influences like humidity and air pressure both
have negligible influence [82].
Even though ultrasonic measurements have to deal with these aspects, ultrasonic
measurements are still a widely used technique for simple, reliable and cost-
effective fluid level measuring. Research was done to get insight in the techniques
used to improve ultrasonic fluid level measurements.
Echo profile filtering
The company Siemens claims to be the world leader in ultrasonic level
measurement sensor [83]. Their sensors use a combination of intelligent signal
processing algorithms and sensor housings. They did not publish any information on
the theory behind there sensor housing, but they do provide information on their
intelligent signal processing algorithms. Siemens calls their signal processing
technology Sonic Intelligence and it works as follows. After the sensor sends an
ultrasonic pulse it captures the echo profile of that signal. The sensor controller
differentiates between true echoes, false echoes and noise. The controller analyses
the received profile using software algorithms, extracting one echo from the profile
as the most probable target echo [84]. The first step of the algorithm is to filter out
impossible measurements. This is done by setting a predefined range. This range
consist of the top and bottom of the vessel. Next to that the algorithm also looks at
the previous measure level and uses this a margin for a realistic level [85]. Using
this technique siemens is able to filter out false echoes caused by obstacles or the
vessel its self. Next to Siemens also the company Pulsar has their own echo
processing software with in theory works the same as the software of Siemens [86].
Sensor Waveguides
Next to echo profile filtering the housing/waveguide of the sensor also can have
influence on the accuracy and range of the sensor. When looking at the already
available level measurement sensor that use ultrasonic sensor it can be observed
that the housing of the sensor is important (see figure 66 till 68). The companies
that make these sensors don’t provide any information on the theory behind the
waveguide. But there were some scientific sources, data sheets, and expert opinions
found that explain how to design an ultrasonic sensor waveguide for a certain
application.
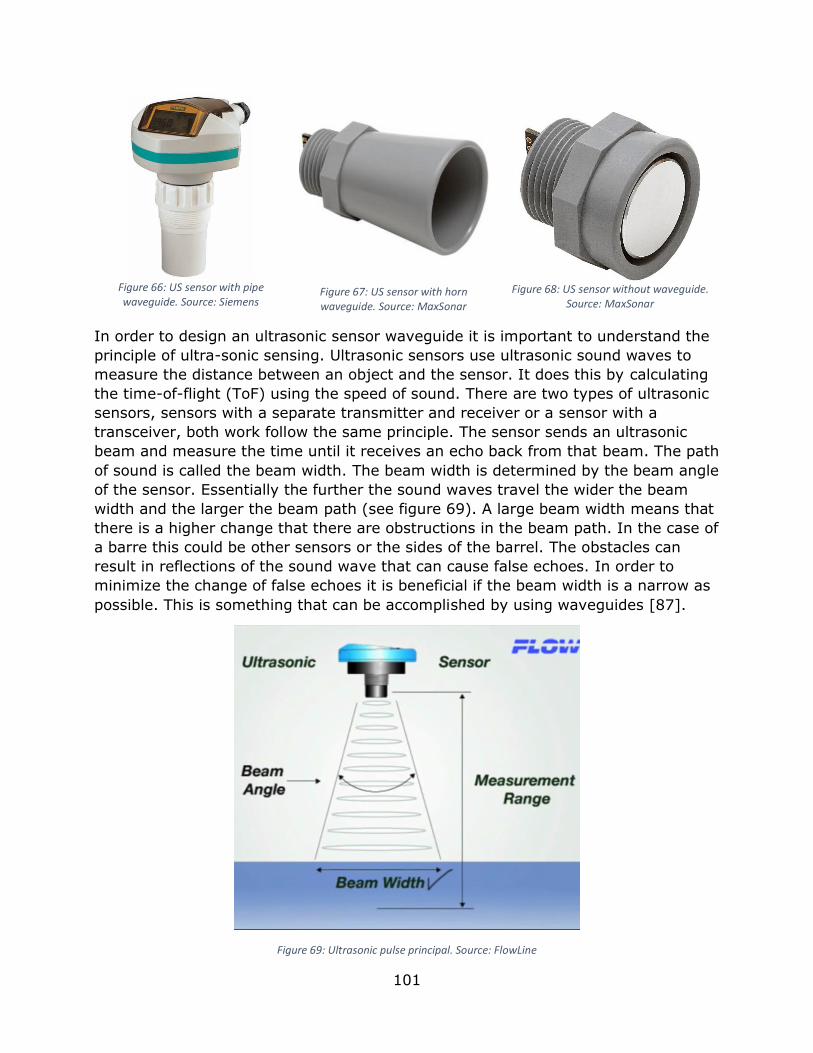
101
Figure 66: US sensor with pipe waveguide. Source: Siemens
Figure 67: US sensor with horn waveguide. Source: MaxSonar
Figure 68: US sensor without waveguide.
Source: MaxSonar
In order to design an ultrasonic sensor waveguide it is important to understand the
principle of ultra-sonic sensing. Ultrasonic sensors use ultrasonic sound waves to
measure the distance between an object and the sensor. It does this by calculating
the time-of-flight (ToF) using the speed of sound. There are two types of ultrasonic
sensors, sensors with a separate transmitter and receiver or a sensor with a
transceiver, both work follow the same principle. The sensor sends an ultrasonic
beam and measure the time until it receives an echo back from that beam. The path
of sound is called the beam width. The beam width is determined by the beam angle
of the sensor. Essentially the further the sound waves travel the wider the beam
width and the larger the beam path (see figure 69). A large beam width means that
there is a higher change that there are obstructions in the beam path. In the case of
a barre this could be other sensors or the sides of the barrel. The obstacles can
result in reflections of the sound wave that can cause false echoes. In order to
minimize the change of false echoes it is beneficial if the beam width is a narrow as
possible. This is something that can be accomplished by using waveguides [87].
Figure 69: Ultrasonic pulse principal. Source: FlowLine

102
Although there is not a lot of information on waveguides available some datasheets
and projects [88] were found that explain the principles of waveguides. NPX [89]
and Murata [90] give a clear description on how to design an ultrasonic horn. Figure
70 displays the specification for narrowing down the ultrasonic beam for a 9 mm
ultrasonic sensor.
Figure 70: Waveguide specification. Source: Murata
Next to a horn shaped wave guide also pipe waveguides are proposed [91] [92]
[93] [94] [95] [96], or a combination of both a horn wave guide and pipe
waveguide [97]. There are two options when using a pipe waveguide, 1) a pipe with
a length calculated using the ratio between pipe length and pipe diameter, and 2) a
pipe in the full length of the barrel.
Research of Siemens [91] showed that there is a rule of thumb that can be used as
a guide to design a working pipe waveguide. There needs to be a 3:1 ratio between
the length of the pipe and the diameter of the pipe. Ideally the pipe nozzle should
be cut at a 45-degree angle and the sides of the pipe should be smooth (see figure
71). [94] claims that a cut of 45 degrees is only necessary for pipes longer than 6
inches. [94] also points out that an air vent hole is required if the pipe is submerged
in liquid. The advantages of using a pipe waveguide is that it narrows down the
beam width, it blocks unwanted echoes and it can lower the temperature at the
sensor face quite a bit. A pipe blocks echoes that are not perpendicular to the
sensor, meaning the only the echoes directly beneath the sensor are able to reach
the sensor [93].

103
Figure 71: Siemens waveguide pipe ratio. Source: Lesman blog
Next to the previous pipe waveguide configuration there also is a pipe waveguide
configuration with a pipe in the full length of the barrel it is used in. The advantage
of a full-length pipe is that it separates the measurement surface from foam,
turbulence, and debris. The pipe also maximizes the acoustic signal strength [92].
When making a full-length pipe wave guide it is important the pipes inner diameter
is equal to or greater than the sensors beam width. [92] recommends pipes with a
larger diameter. The pipe must be a seamless pipe with a smooth wall, meaning the
pipe must be of one piece, so no joints between pipes can be used. The fluid must
also not leave droplets on the side of the pipe, this can cause false echoes [96].
There also must be two air vent holes located just beneath the coupling with the
sensor located in the sensors deadband [92]. Finally, [92] also recommends making
a 45-degree cut at the end of the pipe, so there is always liquid in the pipe. The
advantage of the full-length pipe waveguide is that both sensor types mentioned
above can be used [95]. [97] shows in his project that a combination of a horn
wave guide and a full-length pipe wave guide also can be used together. The horn
wave guide can narrow down the beam width of a sensor, in order to make it useful
for a full-length pipe wave guide. This makes it possible to use sensors that original
would have a too wide beam width for a full-length pipe wave guide.
6.1.7.4 Temperature measuring
For temperature measuring the DS18B20 waterproof temperature sensor is used.
This is a digital sensor with power supply range from 3.0V to 5.0V, and
measurement range from -10 °C to +85 °C, with an accuracy of 0.5 °C. Because
this is a digital sensor it is also compatible with a raspberry Pi without the use of an
AD converter. See figure 72 for an impression of the sensor.

104
Figure 72: DS18B20 digital temperature sensor. Source: RS components
6.1.7.5 Water quality management.
As the stakeholders and previous research pointed out, it is important to guard the
water quality in order to prevent risks for legionella infections for the user.
Legionella is a bacterium that thrives in warm conditions between 20°C to 50°C,
only a temperature above 50°C will kill the bacterium [98]. In order to get infected
the contaminated water needs to be vaporized. This will be a problem if for example
the user uses the water for the sprinkler system. [99] points out that the water
should not be stored longer than 20 days if the water has been 20°C or higher. This
is not information from a scientific source but there is no other information available
on the time of legionella growth in rain barrels or growth time in general. This
information will be used as a guideline for the automatic draining functionality of the
buffer.
6.1.8 Power sources
This section contains literature research that focusses on the development of IoT
devices with an alternative power source. The goal of this literature research is to
get an overview on what combination of a networking technology, networking
strategy and power source is the most suited to provide the SRB with a reliable and
energy efficient network connection.
Since the SRB will be operating outside in the garden it is wise to also think about the
power source of the SRB. An SRB with a plug connected to a simple wall socket might
not be the most obvious solution because not all potential users might have a wall
socket outside at the potential place for the SRB. If this is the case and the SRB would
indeed need power via a wall socket than this could be a barrier that holds back the
sales of the SRB. If users first must pay an electrician to place a waterproof wall
socket outside than they might not be interested in the SRB anymore. A second
concern of users with an SRB with power plug might be that they don’t consider the
SRB as save, because it’s a device that deals with water and water can cause a short
circuit. A final concern would be the environmentally friendly image of the SRB. An
SRB is supposed to make a household more environmentally friendlier but yet another

105
device with a power plug might not give the impression of being environmentally
friendly.
Based on these concerns it is wise to look at alternative power sources. Looking at
the placement of the barrel and the expected power consumption of the barrel the
only suitable alternative power source is a combination of a solar panel and a battery.
The SRB would not be able to run on only a solar panel because it also needs to
operate in the dark. An SRB would also not be able to operate only on a battery
because the battery needs to be charged after a while. That is why a combination of
both would be a good solution. With this power source the placement of the SRB
becomes more flexible because it doesn’t need a power plug anymore. Users might
also consider the device safer because it is not plugged in to the wall socket and finally
the SRB will be considered more environmentally friendly. A drawback of this power
source is that at the same time the SRB becomes less flexible because it needs to be
placed in a spot where it can catch enough sunlight to charge the battery. This
problem could for instance be solve by making the solar panel detachable from the
SRB, so it can be place in a spot with more sunlight. A con of this solution is an
increased complexity of the system and an increase in price. To find out if this solution
is feasible literature was consulted to get insight in how to develop a solar and battery
powered system that can run all day long in winter and summer.
The research of Diaz et al. [100] show that there are 3 main issues concerning long
lasting power management systems for IOT modules: 1) energy harvesting, 2) energy
storage, and 3) power-aware protocols. As they point out the use of energy harvesting
is a requirement otherwise the requirement of long battery live and limited
environmental impact cannot be satisfied. They note that solar power is one of the
most applicable and accessibly energy harvesting sources for IoT solutions. There are
two options concerning energy storage in IOT systems. The use of rechargeable
batteries or the use of ultracapacitors. Finally, a power aware protocol is needed. As
Diaz et al. [100] highlight, the radio systems of a IoT module are the main sources
of energy wastage. That’s why a power aware protocol is needed. In their research
they propose a time slotted protocol that acts on the available charge left in the
battery. The protocol also operates the radio module. It saves power by only turning
the radio module on when necessary. The remainder of the time the radio is turned
off which result in a lower overall power consumption leading to a longer use of one
charge of a battery.
Diaz et al. [100] shows that in order to design a IoT node using an alternative power
source it is important to calculate the energy demands of the system. Because a
reliable design should properly balance the energy demand and supply. To balance
this the energy demand of the node and the power converter need to be calculated,
together with the energy delivered by the solar panel and the amount of energy that
can be stored in the battery.
The research of Shi and Li [101] adds to this that it is also very important that power
management of the IoT solution is designed to make optimal use of the power

106
available. They state that the best solution for power management is not the mostly
used software-controlled power management controller. But a better solution is to
use a fully hardware-controlled power management solution, which relies less on the
unpredictable behavior of the weather. They prove that there are 3 key aspects on
which a proper power management system should suffice:
1. Make optimal use of the harvested solar energy. The system should use
solar power as the preferred power if there is enough sunshine available to
power the sensor node. The battery should only be used if the power of the
solar panel is too low.
2. In order to extend the battery life as for as long as possible the charging of
the battery should also be controlled because it is important to avoid too
many charge cycles to ensure the performance of the battery.
3. The control circuit should be as simple as possible to decrease power
consumption of the control unit, while still being able to perform stable and
reliable.
Conclusion
It can be concluded that it is certainly possible to let the SRB run on solar power. With
the use of a power aware protocol, power efficient networking technology and a
properly designed power control circuit it is possible to provide a reliable power source
even in long periods of rainfall. But still a few critical remarks can be made. The use
of a solar and battery powered system will increase complexity and the cost of the
SRB. Although a system with a power plug will be less environmentally friendly it is
cheaper, and this is certainly an important aspect to keep in mind. The stakeholders
also see potential in a solar powered version of the SRB but due to contains on time
and resources this will not be part of this graduation project.
For these reasons the redesigned SRB will be powered with a power plug. But during
the design process the aspect of a low power consumption will still be taken into
account in order to prepare for a solar powered SRB in the future. This will be done
by selecting parts that are energy efficient and can be powered by voltages lower
than 6 volts. This is not only beneficial for a future solar powered SRB, but it will also
make the power plug powered version of the SRB energy efficient.

107
6.1.9 Software
The software of the SRB will be written in the Python programming language. This
language is compatible with the Raspberry Pi and is also preferred by the
stakeholders of the University.
The software will be developed by the use of functions and combinations of
functions. This makes it easy to understand and alter parts of code if needed.
Before programming the SRB is important to know where the logic of the system
will be located. There are two options for this, 1) locally on the SRB, or 2) in the
cloud. In order to find out what option is the most suitable for the redesign of the
SRB an list with pros and cons of both options is constructed, based on the
functional architecture presented in chapter 5:
Local computing Cloud computing
Pros
• If the server stops working the
buffers are still able to operate independently.
• Less networking time required on
the SRB because decisions are
made locally, also saves energy.
• Complete network of SRBs is less
vulnerable for hacking, because every SRB needs to be updated
separately.
Pros
• Logic can be updated fast and
easily, every SRB will be updated at once.
• Less computing on the SRB,
meaning a lower power
consumption on the SRB.
• More beneficial for a fast
updating user interface (UI), the UI doesn’t have to wait on the
SRB to send its status data to the
sever.
Cons
• More computing locally means a
higher energy consumption.
• Harder to update the logic of the system, every single SRB would
need to be updated separately.
• Less beneficial for a fast updating
user interface (UI), the UI must
wait on the SRB to send its
status data to the sever.
Cons
• If the server stops working all
buffers will also stop working.
• More networking time required on the SRB because decisions are
made in cloud, also more energy
consuming.
• Complete network of SRBs is
more vulnerable for hacking, if
the server is hacked than all SRB are hacked as well.
Based on the pros and cons and the requirements from the ideation and specification
phases it can be concluded that local computing would be the best option. This would
be the most reliable and robust solution. The systems will be able to operate even if
the central data repository is offline.

108
6.1.10 Data sources
In order to make smart decisions based on weather data the SRB needs a source for
precipitation prediction data. Appendix D presents the research done on available
weather prediction sources. The previous prototypes [10] [11] [12] [14] all used
Buienradar [15] as precipitation prediction source. Buienradar provides free
precipitation prediction data for the next two hours. This data is enough in order to
drain the system 2 hours before rainfall but this data is not enough in order to give
the user an overview of planned discharges.
From the research in appendix D it can be concluded that the data with the smallest
interval can be provided by Buienradar. This data is accurate enough to divide
Enschede into 24 sections. The data is only providing insight in the predictions for the
next 2 hours, but the data does not contain the precipitation probability. Darksky will
be the best prediction source for planned discharges. Darksky provides an API that
can deliver hourly and daily predictions based on location.
In this prototype each SRB will request its own precipitation predictions even if some
SRB system are located so close to each other that they have the same predictions.
Once there are a lot of SRBs installed it is wise to change this by letting the central
data repository collect prediction data for certain clusters of SRB systems. But for
now, the central data repository will not support this.
6.2 Subsystem realization This section contains the realization of the subsystems based on the research
presented in the previous sections, and the requirements presented in the
specification chapter. The realization of each subsystem is described together with
the research and prototypes that led to the final version of the subsystem.
6.2.1 Valve control
As described in the components section on valves it was decided to use the CWX
valves. For this prototype it was chosen to use the CWX-15 DN32 5v CR02 ball
valve (figure 73). This valve has a relatively large diameter which is convenient to
prevent the system from clogging. The valve also operates on 5 volts in a CR02
configuration, this the most energy efficient configuration which is beneficial if the
system will be power by solar energy in a future iteration of the product. Since it
was decided to use a Raspberry Pi as controller it is needed to control this valve
using a relay module because the GPIO pins of the Raspberry Pi operate on 3.3
volts. See figure 74 for the CR02 configuration and figure 75 for the wiring scheme
to control the valve using the raspberry pi.

109
Figure 73: CWX-15 DN32 5v CR02 ball valve
Figure 74: CR02 configuration. Source: CWX
Figure 75: Valve control circuit using HL-52S V1.0 2 relay module
3.3v
5v
GND
GND GPIO
GPIO
RPI
VALVE

110
6.2.2 Fluid level measuring
Research in the components section on fluid level measuring sensors showed that
ultrasonic sensors are the best options for fluidlevel measuring in this project. The
research also showed that in somecases it might be nessiary to use wave guides in
order to improve the error rate of the sensor. First a overview of suitable sensor
modules was conducted. From this overview four sensors were tested. These
sensors are: the US-100, hc-sr04p, JSN-SR04T-2.0, and generic 40 KHz ultrasonic
transceiver unit(see figure 76-79).
Figure 76: US-100
Figure 77: HC-SR04P
Figure 78: JSN-SR04T-2.0
Figure 79: 40 KHz
ultrasonic transceiver unit
US-100 and HC-SR04P
The US-100 and HC-SR04P showed almost idendical results during testing. Both
sensors have a separate transducer and receiver and both have a measurement
angle of 30 degrees and have a sensing range from 2 cm to 450 cm. Both sensors
are compatible with the Raspberry PI. The US-100 works on a power supply ranging
from 2.4V to 5.5V. The HC-SR04P works on a power supply ranging from 3.3V to
5.5V. Both sensor have a precision up to 1 mm and work with 40KHz waves. The
only difference worth mentioning between the both sensor is that the US-100 has a
intergrated temperature sensor that compensates for diffences the speed of sound
caused by changing temperatures. Since the sensor will be used outdoor, the best
option is to use the US-100 because of the natrualy occuring temperature
fluctutions caused by the weather. The downside of these sensor is that they are not
waterproof.
JSN-SR04T-2.0 and 40 KHz ultrasonic tranceiver
The JSN-SR04T-2.0 and 40 KHz ultrasonic tranceiver are both sensors that have a
combined transducer and receiver. Both sensors can be used with the circuit board
that comes with the JSN-SR04T-2.0 and both can handle a power supply ranging
from 3.3V to 5.5V. The benefit of these sensors is that they are waterproof, making
them usefull for outdoor usage. The sensors have a sensing range from 20 cm to
600 cm with a accurace of 1 cm and a resolution of 1 mm. When designing a sensor
module it is important to take into account that the sensor has a sensing range
starting at 20 cm from the sensor. Both sensors have a measurement angle of 75
degrees.

111
Sensor module concepts and tests
Based on the components section on improving fluid level measuring sensors
serveral concepts on fluidlevel measuring using ultrasonic sensor were created.
Concept 1
The first concept that was tested is simply placing the ultrasonic sensor at the top of
the barrel (see figure 80 and 81). It was found that this is only a reliable method in
some barrels, depending on the shape of the barrel. In the tests it was found that
all the different sensors had a higher error rate in round barrels, caused by echoes
that are created inside the barrel. The rectangular barrel with flat sides that was
tested had no problems with echoes and the sensor performed without any errors.
But because there will be more sensors and objects inside the barrel it was decided
to ideate a more realiable concept.
Figure 80:Fluid level measuring concept 1. Source: Chipkin
Automation Systems Inc.
Figure 81: Concept 1 prototype: sensor on top of barrel
Concept 2
The second concept is based on the research on full lenght pipe wave guides (see
figure 82 and 83). These type of waveguides isolate the sensor completely from
influnces on measurement caused by the shape of the barrel and object inside the
barrel, making this solution a universal solution for each rain barrel. The first
prototype was constucted by using a 80 mm pipe with the same length as the
barrel. The pipe was placed inside the barrel and the sensor was placed in a 3d
printed mount at the top of pipe facing down into the pipe. It was found that the
US-100 and HC-SR04P became more accurare and had a lower error rate when use
in this setup with a pipe wave guide(see appendix H for the graphs of the
measurement of the diffent sensors with and without pipe wave guide). It was
found that the tranceiver based sensors (JSN-SR04T-2.0 and 40 KHz ultrasonic
tranceiver) did not work inside the pipe. This is because of the bigger measurement
angel. The tranceiver based sensors have a measurement angel of 75 degrees, this

112
angle is to big to use in a pipe without creating echoes that corropt the
measurements. This problem could be solved by narrowing down the measurement
angle of the sensor. This can be done by using a cone shaped wave guide, as was
found in the research in chapter 6.1.7.2 on improving fluid level measuring
sensors.
Figure 82: Fluid level measuring concept 2, full length pipe wave guide. Original image source: Chipkin Automation Systems Inc.
Figure 83: Concept 2 prototype
113
Concept 3
Concept 3 is a next iteration on concept 2. This concept is focused on using the US-
100 and HC-SR04P sensor because these sensor already have a small measring
angle and also because these sensor can measure distances closer to the sensor
than the other two sensors. Concept 3 introduces a temperature sensor inside the
pipe and a housing that is waterproof which is also easy to assemble (see figure
84). This module holds all the sensors the SRB needs. The module is 3d printed and
can be screwed on the barrel. The module is designed to be used with or without
pipe wave guide. The design of the module also follows the guidelines on design for
DIY found in the literature reseach in chapter 2. The sensor module itself is modular
and is also designed for easy fabrication. Once all the parts are printed they can
easely be screwed on eachother and the module is assembeld.
Because the sensor module was designed to be waterproof it is also airtight. This
causes problems when using the sensor module in combination with the pipe. When
the pipe is inserted into the water there is no way for the air to get out of the pipe
resulting in that the pipe gets presurised. This is a problem for the measuring of the
water level, because the level in the pipe is not the same anymore as in the level in
the barrel. As posible solution for this was already found in the research in chapter
6.1.7.2 on improving fluid level measuring sensors. As stated by [92], there must
be two air vent holes located just beneath the coupling with the sensor located in
the sensors deadband. This was done (see figure 85) but this introduced a lot of
false echoes which are not wanted.
It was decided not the use the air vent holes in the pipe but to place the air vent
holes in the sensor module itself. This was tested by removing the temperature
sensor from the module and replacing it with a tube between the inner and outer
cable gland that is normally used for a waterproof connection with the cable (see
figure 86). The result from these tests were excellent, the sensor measured without
any major errors. The air can get in and out of the pipe while still keeping the
sensor module waterproof. In a next iteration the sensor module should be altered
by adding 2 extra cable glands for the air vent tube.
This sensor module now meets almost all requirments for a good sensor module. It
is reliable, easy to install, robust, and weather proof. But the sensor that is used in
this module is not waterproof. It will not come in direct contact with water but it
might get damaged because of water vapor for this reason there will an other
iteration of the sensor module, which uses a waterproof sensor.

114
Figure 84: Concept 3 prototype
Figure 85: pipe wave guide with air vent holes
Figure 86: intersection of sensor module showing air vent concept

115
Concept 4
This concept is developed for the waterproof tranceiver based sensor JSN-SR04T-
2.0 (see figure 87). Out of previous tests it was concluded that this sensor does not
work inside a pipe because of the wide measurement angle. The sensor also has a
measurement range starting a 20 cm from the sensor, this should not a problem for
the barrel that is used for the SRB, because the sensor is mounted on top of the lid
which has distance of approximatly 20 cm from the water surface at the maximal
water level. This concept also contains a rubber ring that seals the top of the sensor
module. The connection between sensor and the sensor module is sealed with
silicone sealant in order to make sure the module is waterproof.
During testing of this sensor module (see appendix H) it was found that the JSN-
SR04T-2.0 has the most steady measurements with the lowest error rate compared
to the results of the other sensors.
In order to make this sensor module also compatible with the pipe wave guide a
second cone shaped wave guide is needed to narrow down the measurement angle
of the sensor (see figure 88). Unforunatly it was not possible to realise this within
this graduation project due to time constraints.
Figure 87: concept 4 prototype
Figure 88: concept of sensor module showing wave guide concept

116
6.2.3 Temperature measuring
As described in the components section on temperature sensors it was decided to
use the DS18B20 waterproof temperature sensor. The sensor is connected to the
Raspberry Pi and initialized by the guidelines provided by [102]. See figure 89 and
table 11 for the wiring scheme. The resistor between the data cable (yellow) and
VCC (red) must be 4.7 KΩ
Figure 89: DS18B20 wiring scheme
Table 11: DS1820 wiring table
DS18B20 RPI RPI pin
Red VCC 3.3V 1
Black GND 6
Yellow GPIO 4 7
6.2.4 Networking and Logic
As described in the components section on network connection it was decided to
develop two prototypes in parallel, one prototype that uses NB-IoT and the other
uses Wi-Fi.
NB-IoT
The research in appendix C on available IoT networks in Enschede showed that
during the time period of this graduation project there was only one publicly
availably NB-IoT network. This was the NB-IoT network of T-Mobile. Because NB-
IoT operates in the 4G band it is only available on the frequencies that T-Mobile can
use for 4G. In the Netherland these are the 900 MHz, 1800 MHz, and 2600 MHz
frequencies [103].
Since it was decide to use the Raspberry Pi as controller research was done on NB-
IoT connectivity for the Raspberry Pi. It was found the most easy and accessible
option is to use an NB-IoT shield designed for the Raspberry Pi. The only option
available during the time period of this graduation project was the Sixfab Raspberry
Pi NB-IoT Shield. The problem with this shield is that the networking chip (LTE BC95
B20 800MHz) only supports the 800 MHz frequency. T-Mobile does not operate on

117
this frequency, meaning that this shield could not be used. There were other shields
with compatible network chips available for pre-order, but these would not be
delivered in time. For this reason, it was chosen to stop the development of an NB-
IoT connected SRB and fully focus on a Wi-Fi connected SRB. Research showed that
there is a lot of development in NB-IoT shields, but this will not be relevant for this
Graduation project anymore.
Wi-Fi
The second option for a data communication technique is Wi-Fi. The advantage of
the Raspberry Pi is that it has a build in Wi-Fi module. The biggest challenge is
connecting the Raspberry Pi with the private Wi-Fi network of the SRB user. The
most common and supported method of connecting to a Wi-Fi network is by
specifying a SSID (network name) and a password. These credentials must be
specified by the user. State of the Art research was done on how to make this
process user friendly and easy. It was found that almost all Wi-Fi enabled smart
home products without a screen (e.g. Chromecast, Alexa) use a technique that lets
the product itself broadcast an open Wi-Fi network. The user can connect to this Wi-
Fi network with his or her phone and will then be redirected to a locally hosted
setup page that asks the user to specify to which Wi-Fi network the product should
connect to. Once this is done the product connects to the specified network and now
has an internet connection.
It was found that there is an opensource application for the Raspberry Pi on GitHub4
that provides a service just like described above. For this project the application was
altered a bit in order to meet the requirements of being user-friendly and easy to
install. With the changes made to the application it now features a user friendly and
simple user interface. The application is universal and works both on hidden and not
hidden networks. Once the user fills in the network credentials the system will
always try to connect to the given network with the given credentials. By doing this
the system can handle network loss and will reconnect to the network once the
network is available again. The application can be put back into configuration mode
by pressing a button. If the user makes a mistake it is possible to reset the system
to configure the system again.
6.2.5 Filtering
As discussed in the components section on filtering, the stakeholder wants to filter
the water as much as possible in a way that it requires no or less maintenance by
the user. It was decided that a filter sock of Nylon filter mesh will be used for this
(see figure 90). An adapter was developed in order to connect the filter to the input
of the buffer. The adapter is made of a 70 mm PVC sleeve, a 70 mm 90° PVC angle,
and an 60-80 mm RVS hose clamp (see figure 91). This adapter fits tight inside the
rain pipe connector. The length of the 40 sock is 40 centimeters, with this length
4 https://github.com/jasbur/RaspiWiFi

118
the filter sock can not float in the range of the sensor. The filter sock was also
tested during a heavy rain shower. This showed that the filter is not able to filter out
very small dust particles, but it perfectly filters out any other type of bigger debris
(see figure 92). It was also found that most of the dust particles that are not
captured by the filter will easily drain together with the rainwater when the buffer is
being drained.
Figure 90: Prototype nylon filter socks in different sizes
Figure 91: Filter adapter prototype

119
Figure 92: Filter sock after rain shower
6.2.6 Weather prediction data and logic
As described in the components section on data sources Buienradar and Dark Sky
will be used as weather prediction sources. The following prototype for the SRB logic
was realized: The Buienradar 5-minute predictions for 2 hours will be used a main
guideline for draining water. Simply because this is the most accurate and detailed
source that is available at the moment. Every 5 minutes the newest prediction for 2
hours in advance will be requested. This value will be transformed in millimeters per
5 minutes and this value will be used to calculate how much water in liters will be
collected by a roof with a certain area in 5 minutes time. The buffer will check if
there is enough capacity left to buffer these liters, if not the buffer will drain the
amount that is needed to provide enough capacity. For this the buffer also takes
into account the previous 5-minute predictions for the last 2 hours.
Buienradar is only used to make decision on draining but it cannot be used to plan
discharges. Since it is a requirement to plan discharges for the user interface the
Dark Sky API will be used for this. Once every hour the system will request the
hourly precipitation predictions for the next two days. The predictions will be filtered
on there probably, if the precipitation probability is higher than 0.75 percent than
the system will save this locally and also send it to the central data repository. In
case Buienradar cannot be reached three times in a row than the hourly planned
prediction in the database will be used to decide if the buffer needs to free up
capacity. If the buffer does this than the buffer will start trying to request
Buienradar predictions again after the hour of the planned discharge making sure
that the buffer doesn’t drain twice for the same rain shower.
Dark sky will also be used as weather prediction source for the freeze guard
functionality that protects the system from freezing. Once a day at 12 PM the
system will request the minimal temperature for the next day. If the user enabled
the freeze guard and the minimal temperature for the next day is below zero than

120
the buffer will drain all the water, leave the valve open, and block the system from
draining. The next day the system will check again if the temperature is above zero
degrees than the system will close the valve again and enable the system to drain
again. See the list below for a complete overview of the requests.
- Every 5 minutes request precipitation data from Buienradar and decide
whether to drain or not.
- Every hour request precipitation data from Buienradar and register planned
discharges.
- Every day at 12 PM request minimal temperature for the next day and
decide whether to activate the freeze guard protocol or not.
6.3 Prototypes During this graduation project two prototypes were developed the first prototype
was focused on exploring different kinds of hardware solutions, testing the
developed subsystems, and testing the concept of an SRB. The second prototype is
focused on designing for DIY and creating a consumer ready and robust system.
6.3.1 Version 1.0: Test version
As described before this prototype is focused on testing the concept of the SRB,
evaluating the hardware choices and testing the developed subsystems. The
prototype is made of a repurposed industrial 200-liter barrel (see figure 93). The
barrel was painted green in order for it to better fit in the neighborhood.
Situation
The buffer was located on the highest floor an apartment complex in the middle of
the city center. The barrel was connected to one of the four rain pipes connected to
a section of the flat roof of the apartment complex. The barrel was connected to
outlet B, displayed in figure 94. The total area of the roof section is roughly 400
square meters. Assuming that 25% of the water that is collected on the roof ends
up in outlet B, then the water collection area of this buffer is approximately 100
square meters.
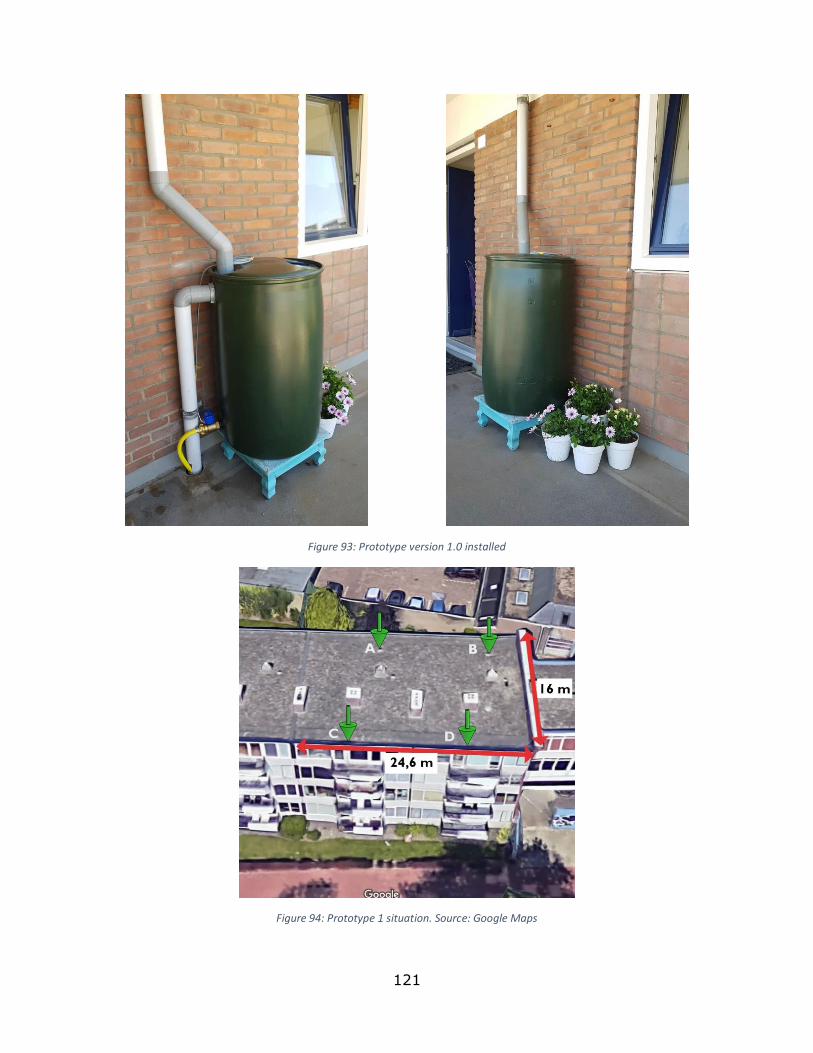
121
Figure 93: Prototype version 1.0 installed
Figure 94: Prototype 1 situation. Source: Google Maps

122
Design
The first prototype was equipped with an input, overflow, electric valve,
temperature sensor, ultrasonic sensor, and Raspberry Pi. The prototype did not
include all the functional and nonfunctional requirements, but it did include the basic
functionality of an SRB. It could automatically drain a specific amount of water
based on the Buienradar predictions and it was able to log the temperature of the
water.
During the development of the prototype it was confirmed that using an ultrasonic
sensor in a round barrel resulted in false echoes that corrupted the measurements.
The second concept iteration of the sensor module was used to place the sensor
inside a full-length pipe wave guide. The used pipe was an ordinary rain pipe with a
diameter of 80 millimeter and a length of 1 meter. The pipe wave guide solved the
problems with false echoes making the sensor reliable enough for the calculations
done on the Raspberry Pi. The Raspberry Pi measured the distance between the
water and the sensor and used the basic mathematical formula to calculate the
volume of a cylinder to calculate the amount of water in the buffer. Every 5 minutes
the Raspberry Pi requests the latest 5 minute prediction for the next 2 hours. Based
on this prediction the Raspberry Pi calculated the needed capacity and drained a
certain amount of water if there was not enough capacity.
Test prototype evaluation
This first prototype gave insight in the concept of the SRB and it also showed that it
is very important that the water level measurements are correct. Wrong
measurements result in wrong calculations and unnecessary loss of water. This
prototype also showed that the CWX valve works very reliably. The valve functioned
5 weeks long without any error. The most interesting insight that was found in using
this prototype was that the roof is also an unpredictable factor. After a long period
of dry weather, it took some time before water came pouring down the drainpipes
while it was raining heavily. This is because the roof that the prototype was
connected to has a layer of gravel on the roof and the drainpipes are located a bit
higher than the gravel otherwise the gravel could end up in the drainpipe. This
resulted in that it took 30 minutes during a have rain shower before the drainpipes
started pouring water into the buffer. The roof also buffers some water, this water is
never drained to the sewage system, but it will evaporate overtime. After the water
level on the roof is high enough the drainpipe will start to poor. Because of this the
calculations for the expected buffered water did not correspond with the actual
amount buffered. In the case of this specific roof the calculation need to be altered
in a way that they also take into account the buffer capacity of the roof and the
amount of water left on the roof before a rain shower.

123
6.3.2 Version 2.0: DIY Consumer version
This second prototype is fully focused on designing for DIY and creating a consumer
ready, robust, and easy to install system which follows the specified requirements.
Design
A big part of the design process is designing for DIY. This version is designed
following the guidelines given in the literature research on design for DIY in chapter
2. The system is designed to be modular, all subsystems are divided over modules
that can be connected to each other. This in not only convenient for the DIY aspect
of the product but also for the flexibility of the system and the ability to perform
maintenance on the system. As mentioned in the beginning of this chapter all parts
have are of good quality and almost all the components are standardized
components that are available in every hardware store. It was also tried to keep the
number of components at a minimum by combining components into multifactional
components. Finally, the packaging was also kept at a minimum because all the
components that are needed can be shipped inside the barrel (see figure 95).
Figure 95: packaging of final design

124
Figure 96 and 97 shows the final design of the DIY and consumer ready SRB. As can
be seen, the design is kept simple and robust. The sensor module is placed on top
of the barrel and the computing unit and valve are placed underneath the barrel
inside the base. The design features a manual tap on the front that allows the user
to use water locally. Most of the “smart” components are hidden underneath the
barrel, this way the most critical parts of the system are protected well and do not
require a custom housing. Another advantage of the valve being located inside the
base is a better protection from freezing.
All the electric parts can be connected with waterproof plugs to the control unit (see
figure 97 A and C). The control unit contains the Raspberry Pi, power adapter,
relays for the valve control, and the waterproof connector sockets. All the
components are soldered onto a Raspberry Pi development board that can easily be
connected to the Raspberry Pi (See figure 97 B). In this prototype the control unit is
powered by a power plug, but the system is designed to not use more than 5 volts
making it possible to run the system on solar power in the future.
For this type of barrel, the pipe wave guide is not really necessary, but if later
modifications or tests show that it is necessary it can easily be connected to the
sensor module without any screws because the pipe connector on the sensor
module is conical (see figure 96 E).
The filter module is place inside the input rain pipe connector (see figure 96 D).
The filter sock can be replaced by untightening the hose clamp and taking of the
filter sock. The filter sock can be cleaned and can be used again.
The hose clamps on the hose that is connected to the automatic valve are hose
clamps that do not need a screw driver (see figure 97 F). This make the DIY process
easier. The rain pipe connectors are universal and can be connected to both 70 mm
and 80 mm drainpipes (see figure 96 B) . The user is free to decided were to put
these rain pipe connects the same counts for the manual tap and the hole for the
cable (see figure 97 D and E). The output hose that is connected to the automatic
valve features metal GEKA connectors. These connectors are durable and robust
and are widely available.
The installation process of the buffers only requires a drill and a hole saw in multiple
diameters. The holes are easily drilled into the buffer because it is made of a
relative soft plastic (PP). The remained of the installation process is simply
connecting parts together. In order to make the installation process more user-
friendly DIY instructions and an instruction video were made in collaboration with
co-developer Tunç, more details on this can be found in the Thesis of Tunç.

125
Figure 96: Final design. A) front view of the buffer, B) input and overflow connectors, C) Custom designed sensor module, D) Inside of the barrel, E) Waveguide connected to sensor module
A
B
C
E D

126
Figure 97: Final design. A) Valve and computing unit, B) computing unit, C) Waterproof connectors, D) cable hole, E) Back of the buffer, F) output hose with DIY friendly hose clamp and GEKA connector
A
D E F
C
B
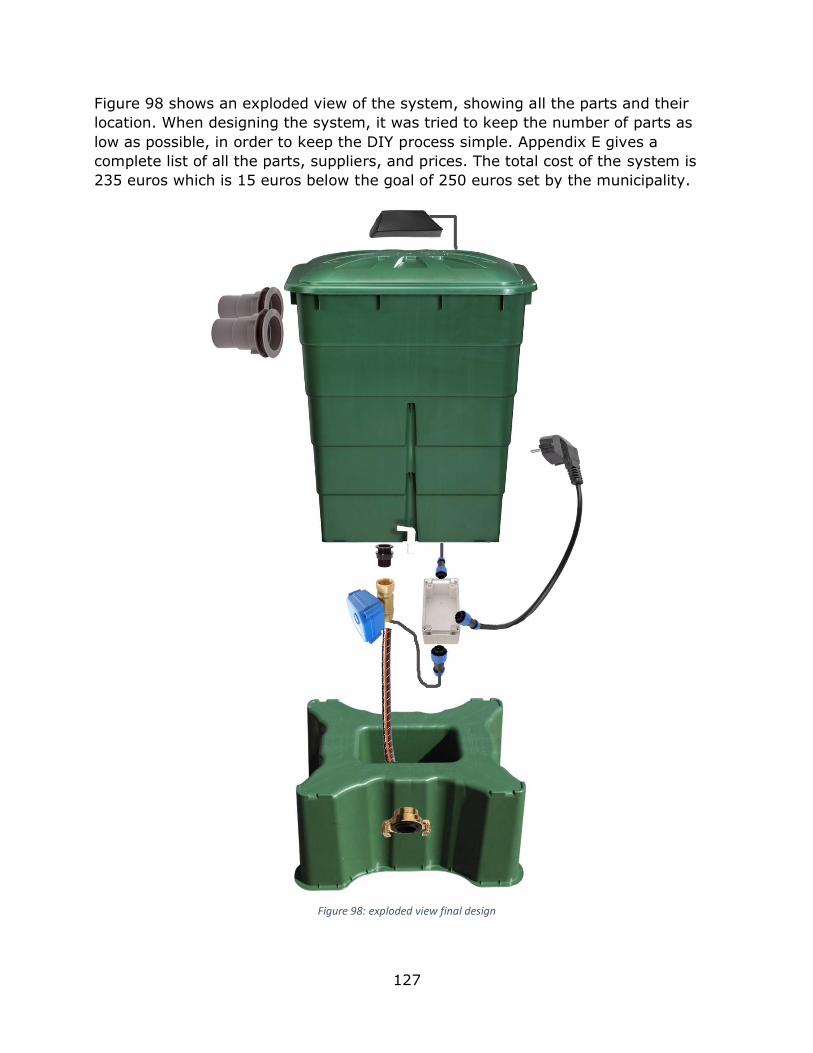
127
Figure 98 shows an exploded view of the system, showing all the parts and their
location. When designing the system, it was tried to keep the number of parts as
low as possible, in order to keep the DIY process simple. Appendix E gives a
complete list of all the parts, suppliers, and prices. The total cost of the system is
235 euros which is 15 euros below the goal of 250 euros set by the municipality.
Figure 98: exploded view final design

128
Connectivity
As mentioned before in section 6.2.4 the SRB will be connect the internet via the
private Wi-Fi network of the SRB owner. But in order to do this the user needs to
setup the connection on the buffer. To make this as user friendly and universal as
possible it was decided to let the Raspberry Pi inside the computing unit broadcast a
local network that the user can connect to and use to setup the SRB without having
to perform any hard-technical task.
When the SRB is powered on for the first time it will automatically boot in to
configuration mode. The Raspberry Pi will than broadcast a Wi-Fi network with an
SSID starting with “SRB-”. The user can connect to this network with his or her
phone and will automatically be redirected to setup page (see figure 99 and 100)
were the user is asked to select an SSID and fill in the corresponding password.
Once the user submits the form the Raspberry Pi will reboot and try to connect to
the selected Wi-Fi network. Once the Raspberry Pi has a Wi-Fi connection it will
send a status update to the central data repository. This is used to tell the user via
the user interface that the SRB was able to successfully connect to the specified
network. If the Raspberry Pi could not connect to the Wi-Fi network, it will
continuously try to connect to the network and the user interface will give the
suggestion to the user to check if his or her Wi-Fi network is working or to reset the
SRB back to the configuration mode.
Figure 99: Connecting to local SRB Wi-Fi network
Figure 100: Wi-Fi setup interface

129
The SRB can be reset by pushing the button on the computing unit for more than 10
seconds. The Raspberry Pi will than reboot into the configuration mode and the user
is able to setup the SRB again. It was chosen to go for this approach because this
seemed like the most user-friendly solution. It would not be user friendly if the
Raspberry Pi resets every time when it cannot connect to the Wi-Fi network. This
would mean that the user would have to configure the SRB every time the Wi-Fi
router is power off or doesn’t function for any other particular reason. Now the SRB
only resets when the button on the computing unit is pressed.
Logic
As mentioned in chapter 6.1.5 and 6.1.9 the system is controlled by a Raspberry Pi
running a Python program. The Raspberry Pi interfaces with the sensors and
actuators via the GPIO pins and uses a Wi-Fi connection to send and request data to
external systems: weather predictions sources and the central data repository from
the Climate Adaptive City Enschede project. The system is designed to be reliable
and robust. The system will be able to operate independently for 2 days if network
connection is lost or if the data sources are offline. The system is also designed to
store measurement data locally in case the connection with the central data
repository is lost. SQLite is used database engine for the local database on the
Raspberry Pi, making it easy to query the database.
The structure of the program running on the raspberry pi is based on the functional
system architecture given in chapter 5 of this report. The logic of the system can
be seen as the main program that run on the Raspberry Pi. This program contains
multiple functions which are called by a job scheduler function. This is implemented
by using the Cron tab functionality of Linux. The list below gives an overview of the
scheduled functions.
- Every minute: Request a status update of the system, temperature and
water level are saved in a local database. Also check if there was water
drained manually and check if the water temperature is above the legionella
risk threshold.
- Every 5 minutes: Request precipitation data from Buienradar and decide
whether to drain or not. In case of a drain then send this to the central data
repository.
- Every 15 minutes: Send the status updates that are saved in the local
database to the central data repository. If the central data repository
confirms that a status update is received than delete the status update from
the local database.
- Every hour: Request precipitation data from Dark sky and register planned
discharges in the local database and send them to the central data repository.
- Every day at 12 PM: Request the minimal temperature for the next day and
decide whether to activate the freeze guard protocol.

130
Communication handler
As explained in section 6.2.6 the SRB will be able to connect to three different
services: The central data repository, Buienradar, and Dark Sky. This is
implemented by giving each service its own library that is imported by the main
program. Each library contains the necessary functions for the specific service. The
SRB also runs a local database this database is used to save planned discharges and
status updates. The status updates remain stored in the local database until the
central data repository has confirmed receiving them. The SRB also uses the central
data repository to request configuration data, once this data is received it will be
permanently stored on the SRB but can be update by the user via the user-interface
connected to the central data repository. See figure 101 for an impression of the
connection between the different services.
Figure 101: SRB by and connected services
Water level measurements
The water level the inside the barrel is measure by the ultrasonic sensor in the
sensor module. As Groeneveld [14] pointed out in his research, ultrasonic sensors
have a small deviation in measuring distances because the amplitude of the
received echo can deviate. A signal could be received a fraction later if the
amplitude is not above the threshold value of the sensor. It was found that a
measurement is more accurate if it takes the average of a burst of measurements.
Finally, it is important that this measurement is checked on being realistic, taking
into account the barrel size and the previous measurement.
This is implemented in the SRB in three functions. 1) The single measurement
function, which simply returns the distance between the water and the sensor. 2)
The burst measurement function which uses the single measurement function 10

131
times in a row and returns the average distance. 3) The smart measurement
function, which uses the burst measurement function and checks if the output of
this function is realistic. This is based several levels of validating the measurement.
1) Validating if the measurement is in a possible range, based on the dimensions of
the buffer. 2) Validating if the measurement is within a certain range from the
previous measurement. 3) If the measurement was not validated by level 2 it is
saved as possible distance and the validation process starts again and now uses the
possible distance for validation in level 2. 4) if the measurement was not validated 5
times in a row than the function will output a measurement error.
Temperature measurements
The temperature measurements are less susceptible for errors for this reason the
temperature is only measured once per request. This is implemented by two
functions. 1) the get raw temperature measurement function returns the raw
measurement value from the sensor. 2) The get temperature function uses the
output of the get raw temperature function and calculated the temperature in
degrees Celsius.
Discharges
The system has several discharge functions: drain amount, drain till, and drain all.
These functions are called by the scheduled functions in the main program. The
drain functions use the smart measurement function as input for opening and
closing the valve. Every minute the buffer compares the current water level to the
previous water level. If there is less water in the buffer and there was no automatic
discharge of the system than the buffer will register this as a manual discharge.
Every 5 minutes the system checks the Buienradar predictions. In case a rain
shower is predicted the SRB will drain the amount water that is needed to free up
enough space to buffer the expected water.
Water quality guard
If the user has enabled the water quality guard function than the SRB will check the
water quality every minute. The SRB checks if the temperature is not above the
threshold of 20 degrees for 10 days in a row, in order to prevent risks for legionella.
The system keeps track of this using a counter and once the counter reaches 10
than the SRB will call the drain all function. The counter will be reset when the
buffer is fully emptied.
Freeze guard
If the user has enabled the Freeze guard function than the buffer will once a day
request the minimal temperature for the next day. If the minimal temperature is
below zero than the buffer will open the valve and keeps the valve open until it
receives a minimal temperature above zero.

132
Wiring scheme
The sensors and actuator are connected to the Raspberry Pi using a
prototype shield. See figure 102 for the wiring scheme of the final prototype.
Figure 102: Wiring final prototype
VA
LV
E
133
7 EVALUATION
This chapter contains the evaluation of the final prototype of the DIY and consumer
ready smart rain water buffer. This chapter starts with the evaluation of the
requirements that were specified in chapter 5. Secondly a price evaluation of the
system will be given. This price evaluation gives insight in the total costs of the
system and what modules are the most expensive. After that an evaluation based
on the Design for DIY research found in chapter 2 is presented. Finally, the
feedback of the stakeholders is discussed.
7.1 Requirements evaluation In this section the requirements that were specified in chapter 5 are evaluated. This
is done by assessing the final prototype and validating if the prototype fulfills the
requirements. As specified in in the methods chapter, the requirements are sorted
using the MoSCoW method. In the evaluation it is the most important that all “must
have” requirements are met and next to that also most of the “should have”
requirements should be met. A new requirements table was constructed, were the
requirements that were met are highlighted green and the requirements that were
met under certain conditions are highlighted yellow. Some requirement have shared
responsibilities with other solutions that are developed by co-developers and
therefore some of the implementation responsibilities of the requirements lay
outside the scope of this graduation project.
It was found that all “must have” functional and Non-functional requirements are
met. The system contains all the necessary functions. The implementation of some
functions is a shared responsibility. For example, the nonfunctional requirement that
the system must be secure is a shared responsibility between the SRB and the
central data repository. It can be confirmed that the SRB is secure, but this is not
the case for the central data repository. The central data repository was not secure
at the moment of evaluating which makes the SRB also less secure. If the central
data repository would be secure than the SRB would also be secure. This
dependency of security on the central data repository could be eliminated on the
SRB side but this would mean that other requirements that were set for the SRB will
be compromised, for example setting up the system via the user dashboard.
Next to the “must have” requirements also all the functional and nonfunctional
“should have” requirements have been met. But some of these requirements are
shared responsibilities between the SRB and the user dashboard. Notifying people
about errors must be implemented on both sides. The SRB is able to create an error
event in the central data repository, but the user dashboard is responsible to show
this to the user. This dependency could for instance be eliminated by using a status
LED on the buffer but then the buffer would also need a screen to tell the user what

134
type of error occurred. Only this would make the system less simple and possibly
less durable and robust. Next to that there are also shared dependencies for the
requirement that the system should promote being environmentally friendly. This
has been implemented in the design of the buffer by providing a manual tab,
registering manual discharges, and providing a universal outlet and overflow. But
next to these design choices it is also important that the users are informed well
and triggered into being environmentally friendly this is a responsibility that lays at
the DIY instructions and the user dashboard which both are out of the scope of this
graduation project.
Most of the “could have” requirements are met or partially met. Only some of
requirements are met under certain conditions. The requirement that the system
could be independent from the user’s private communication infrastructure is only
met if the user connects it to a public, no privately-owned Wi-Fi network. Next to
that the system also meets the requirement of being scalable in the sense that
software on the buffer supports changing the maximum capacity of the buffer. Next
to that the software is already prepared to support connecting extra modules but
the hardware must be altered to support this.
7.2 Price evaluation The stakeholders set the requirement that the complete system should cost not
more than 250 euro. The price evaluation below shows the total price of the system
and what parts of the system are the most expensive. For a complete list of the
parts see appendix E
Appendix E shows that the total price of the final prototype is 235 euros, which is
lower than the maximal price of 250 euros including taxes. Figure 103 shows a price
analysis of the system. As can be observed in figure 103, the computing unit is the
most expensive part of the system. But this is also the part that could become
cheaper by replacing the computing unit. The computing unit which is used now is a
Raspberry Pi 3b but it could be replaced with the cheaper Raspberry Pi zero. Next to
that if all parts would be bought in bulk than the price of the overall system could
potentially be lowered than 200 euros.

135
Figure 103: SRB price analysis
7.3 Design for DIY evaluation The literature research in chapter 2 on Design for DIY presented two guidelines,
design for assembly and evaluating assembly complexity. These two guidelines were
used to evaluate the design choices that were made for DIY in the final prototype.
7.3.1 Design for assembly
Reduce the total number of parts: During the design process of the barrel is was
tried to keep the number of parts as low as possible. This is done by creating modules,
like for example the sensor module, filter module and computing module. These
modules already come pre-assemble lowering the amount of parts that need to be
assembled by the end user. Next to this it was also chosen to use universal parts, for
example the input and overflow of the barrel are suitable for drainpipes from 70 and
80 millimeters. Instead of proving multiple parts in multiple sizes it has been limited
to one part with a universal size.
Design a modular system: The SRB is designed to be modular to simplify
manufacturing. The modular design allows for easier assembly, testing, inspection,
redesigning and maintenance.
Barrel24%
Vavle7%
Computing Unit41%
Sensor unit4%
Filter1%
Connectors16%
Other7%
SRB PRICE

136
Use standard components: The SRB consist of almost all standard components.
These components are cheaper than custom components and are also widely
available.
Design parts to be multi-functional: Where possible it was tried to design parts
to be multifunctional. For example, the sensor module of the SRB has a wave guide
mount that can both position and fasten the wave guide.
Design parts for multi-use: The SRB was designed to use parts that are the same
but can be used for different purposes. For example, the input and overflow parts are
the same and the GEKA connectors used for connecting the valve to the hose are the
same connector that the user can use to connect a garden supply to the output hose
of the SRB.
Design for ease of fabrication: The parts that were custom designed for the SRB
are designed to require the least amount of extra work in order to construct them in
to DIY ready modules. This is for example done in the 3D models that are 3D printed.
The screwing thread in these 3D models have been designed so they do not need
polishing before they can be screwed together.
Avoid separate fasteners: Fasteners like screws have been avoided in the design
of the SRB. For example, the sensor module uses a conical connector to connect to
the wave guide, no separate fasteners are needed.
Minimize assembly directions: The SRB does not follow this design rule very well.
Since the SRB mostly uses standard components it was not possible to design the
system in a way that all parts can be assembled from only one direction.
Maximize compliance: The design uses qualitatively good and robust parts. These
parts will not easily break during or after the DIY assembly.
Minimize handling – The SRB doesn’t follow this design rule very well. Because the
SRB mainly uses standard components it was not possible to alter these components
to give them arrows or directions for self-assembly. This could of course be done
using stickers but this would require extra work in preparing the parts to go into the
SRB assembly kit. Instead of putting assembly clues on the parts it was chosen to
give these clues in the assembly manual.
7.3.2 Evaluating assembly complexity
Symmetrical planes: Because of the use of standard components it was not possible
to follow this design rule. As explained before the assembly manual will contain clues
for assembly and the orientation of parts.
Novel assemblies: The number of unique assembly steps was kept low in the design
of the SRB in order to lower the difficulty of the assembly. This is done by following
the same rules in multiple assembly steps. For example, all parts that are directly

137
connected to the buffer follow the rule that the rubber must be on the inside of the
barrel.
Selections: This design rule is not implemented in the Design of the SRB but in the
design of the instruction manual.
Fastening points: Since the SRB uses a standard rain barrel it was not possible to
provide any pre-drilled holes. These holes have to be drilled by the user, making the
difficulty level of the assembly higher.
Fastenings: Only two types of fastenings are used. Parts can either be screwed on
or screwed thigh.
Parts: As pointed out before in the evaluation in the rules on design for assembly,
the amount of parts is minimized by the use of modules and multifunctional parts.
7.3.3 Conclusion
Based on the rules on design for assembly and assembly complexity it can be
concluded that most aspects of the design are DIY friendly. But there are some
aspects that could be improved. The biggest improvement in the design could be
made by using a custom designed barrel. A barrel that has predefined holes that
allows parts to be connected from only one direction would have a big impact on
lowering the assembly complexity.
7.4 Software tests The software of the system was also tested this was done by testing each function
individually and by testing the complete system in different scenarios. The first
scenario that the systems was tested in was by installing the system and letting it
run for 2 weeks. Unfortunately, there was no rain in the two weeks that the barrel
was tested but there were still some important results found. The first thing that
was found is that water quality guard works properly. After 10 days the risk for
legionella became too high and the system automatically drained the buffer. It was
also found that the threshold 0.25 liter that was used to determine if water was
drained by the manual tap is too low. The measured values deviated too much,
resulting in false manual discharges. After the threshold was changes to 1 liter the
problem was solved.
The second situation that the system was test in was by shutting down the central
data repository for 3 days. Normally when the central data repository is online the
SRB will every 15 minutes send its status updates, which are generated every
minute. When the central data repository is offline the SRB will store its status data
locally. After 3 days the SRB was still working as intended. Once the central data
repository came back online the SRB send all the collected measurement to the

138
central data repository at once. Both the SRB and central data repository could
handle this perfectly fine. But for the future it is important the think about what
would happen if for example 10 000 SRBs would send all of their measurements for
the past few days to the central data repository at once. The SRBs will be able to
handle this but the capacity of the central data repository might not be big enough.
Maybe it might be needed that the uploads by the SRBs must be coordinated if this
would happen.
7.5 Stakeholder feedback Finally, the stakeholders were also asked for feedback on the final prototype. The
municipality was very pleased with the design of the final prototype. They were
satisfied with the end result. They pointed out the system is very robust and
practical. They could also imagine this design being placed in a garden. The final
remark that they made is that they would prefer the system to be solar powered.
This would give the installation a more environmentally friendly image and it would
make the placement of the buffer more flexible.
The stakeholders from the university were also satisfied with the end product but
they pointed out the it might be a problem if people want to get to the computing
unit which is located in the base of the barrel if the barrel is filled with water. The
computing unit can only be reached if the barrel is empty. In most cases this will
not be a problem but if people for example want the change the Wi-Fi connection of
the barrel than the barrel must be emptied in order to be able to press on the Wi-Fi
reset button. This could for instance be solved by moving the button or by allowing
the user to change the Wi-Fi settings via the user interface.
Next to the municipality and the university also the possible end users were asked
to give feedback on the design of the buffer. In total 15 possible end users were
asked on their opinion on the buffer. The first thing that became clear is that user
still see it as a basic rainwater buffer, but with extra functionalities. All users agreed
that the design is durable, and 92 percent of the potential users would consider
placing the buffer in their garden. 2 persons indicated that they like the concept,
but they would like to pick their own rain barrel instead of the barrel that is
provided. Finally, all users showed interest in a solar powered SRB instead of an
SRB with a power plug.
Conclusion
Overall the end product was received very well by the end users, but some small
remarks were made on some of the design choices. All stakeholders agreed that a
solar powered SRB would be interesting, but the reliability of the system must not
be influenced by this. Next to that it was also found that there is some interest in an
SRB concept that allows users to user their own rain barrel.

139
8 CONCLUSION AND RECOMMENDATIONS
This chapter presents the overall conclusion of this graduation project. The research
question that is stated in chapter 1.2 is answered. Finally, recommendations for
future research and development of the smart rainwater buffer are given.
8.1 Conclusion This graduation project presents the development of a smart rainwater buffer that
can be placed in the gardens of the inhabitants of Enschede. The SRB provides a
solution for the problem of flooding in the city of Enschede caused by climate
change and urbanization. The goal of the SRB is to reduce the strain on the sewage
system. It does this by buffering the water during rainfall and releasing it on a less
critical time in the sewage system or in the garden. There was some previous
research done on the potential of the concept of the SRB which concluded that there
is indeed a demand for a smart rainwater buffer not only by the municipality of
Enschede but also by its inhabitants. This research also showed that in this stage of
the product there is demand for a Do It Yourself smart rainwater buffer. That is why
the goal of this graduation project was to redesign the SRB to be consumer ready.
The research question that was formulate at the start of the project was: “How to
develop a DIY and consumer ready Smart Rainwater Buffer for deployment in the
city of Enschede?”.
The first steps that were taken in answering this research question were to conduct
a literature study and state of the art research. The literature research resulted in
guidelines on “Design for DIY”. These guidelines have been used throughout the
project to ensure that the system is DIY friendly. The state of the art research
showed that the research was still novel because there are no other solutions on the
market or publicly in development that had the same goal as the to be developed
SRB. Namely, solving flooding issues in the city by developing a DIY and consumer
ready smart rainwater buffer.
Next the stakeholders were involved in the design process to collect requirements
on the to be developed solution. These requirements were used to ideate serval
concepts. The final concept that was chosen by the stakeholders was an SRB in the
form of a DIY rain barrel that can be placed in the garden of an inhabitant of the
city of Enschede. The design must be simple and robust and must by universal to
fit in every type of garden. Next to that the system must work fully autonomous
and should require low maintenance. The buffer uses precipitation prediction
sources to control the system and it also takes into account the protection of the
user and the system.
Once the concept and the requirements were finalized the SRB was realized. The
SRB was designed following the Design for DIY methods specified in chapter 2. The
design uses as much standard components as possible, next to that it was verified

140
that all components are of good quality and will be durable enough for self-
assembly by the user. It was also found that a good sensor module design is crucial
for the reliability of the system. Literature research on sensing methods was
conducted and gave insight in what sensor to use. It was decided to use ultrasonic
sensors for the fluid level measuring in the barrel. Ultrasonic sensors are reliable
but also very cost effective. But ultrasonic sensors are also very prone to errors
because of noise originating from the measurement surroundings. Literature
research was done on improving ultrasonic sensors and it was found that wave
guide are the best solution. Several wave guide designs were proposed but the full-
length pipe wave guide was the most suitable solution for the SRB. This wave guide
made the sensor module universal to use in any type of buffer, making this sensor
module not only usable for this version of the SRB but also compatible with future
versions using different kind of barrels.
Furthermore, there was also a literature research conducted on the data
communication technologies suitable for smart city IoT, especially focused on the
SRB. It was found the public long-range networks are the most promising
technologies to use because these networks are very reliable and do not need a
manual setup by the end user. The most promising long-range network that was
found is NB-IoT. Unfortunately, the necessary hardware to connect to the NB-IoT
network available in the Netherlands was not available at time of conducting this
research and it was decided to use an alternative. The sort range data
communication technology Wi-Fi was selected as alternative because most
inhabitants in the Netherlands already have their own private Wi-Fi network. The
downside of using Wi-Fi is that the SRB becomes reliable on the private network
infrastructure of the user for which the quality cannot be guaranteed.
The buffer was programmed to be as autonomous and reliable as possible. This was
done by providing the system with advanced measurement functions and
implementing a backup system for precipitation predictions. The backup system
allows the system to stay operational for 2 days if the connection to the
precipitation prediction sources is lost. The buffer also takes into account the
indirect effects of the weather, in order to protect the user and the system itself.
The system guard to user for a too high legionella risk and also protects the system
from getting damaged if it is freezing.
The evaluation of the system showed that the concept is indeed DIY friendly and
that the system operates as intended. By concluding all results discussed above an
answer to the research question can be given. A DIY and consumer ready Smart
Rainwater Buffer for the deployment in the city of Enschede can be developed by
following the guidelines on Design for DIY, using a reliable sensor module and
network connection, and using a controller that is able to run the system
autonomous and reliable. Nevertheless, the best way to prove if the Design is DIY
friendly, consumer ready, and reliable is by testing it in a pilot project with real
users in a real use case scenario. More on this is discussed in the next section on
recommendations.

141
8.2 Recommendations
Several recommendations can be giving on the research and development of the
DIY and consumer ready Smart Rainwater Buffer. In order to prove that the Design
is DIY friendly, consumer ready, and reliable it is recommended to start a pilot
project with real users building and using the SRB. By testing the system in a real
scenario with a real user it can really become clear if the product is ready to be
used by the inhabitant of Enschede.
Next to that it is also recommended to continue the research in using NB-IoT. NB-
IoT is being developed very fast and more and more hardware is becoming
available. The use of NB-IoT could make the system even more user friendly. With
the use of NB-IoT a manual network setup by the user is no longer required.
Potentially NB-IoT could also be used for getting the location of the buffer, which
could bring the SRB one step closer to not needing any type a manual setup by the
user itself, making the system less dependent on the user.
It was also found that the stakeholders prefer the system to be power by solar
power. This would make the system more flexible and less reliant on the location of
a power plug. Next to that it would also give the SRB a more environmentally
friendly image. But when powering the system with solar power it is important the
this will not influence the reliability of the system. The power source should be able
to provide the system with enough power to let the system continuously run in
every type of weather.
Finally, it is recommended to research what modifications the system needs in order
to get certified to be sold to inhabitants in Enschede.

142

143
REFERENCES
[1] V. R. Golroudbary, "Trends in rainfall extremes over the Netherlands:
changes due to climate and urbanization," 2013 - 2017. [Online]. Available:
https://www.itc.nl/Pub/WCC/WCC-projects/PhD-project-Trends-in-rainfall-
extremes-over-the-Netherlands-changes-due-to-climate-and-
urbanization.html.
[2] S. Anand and M. Anand, "Smart Cities: Environmental Challenges and Green
Computing," International Journal of Advanced Research in Computer
Science, pp. 221-226, 2017.
[3] Twenty-Twente, "ENSCHEDE WORDT EEN SMART CITY," 16 03 2017.
[Online]. Available: https://www.twente.com/twenty-twente/enschede-
wordt-een-smart-city/. [Accessed 05 04 2018].
[4] CBS , „Bevolkingsontwikkeling; regio per maand; Enschede,” 28 Feb 2018.
[Online]. Available:
https://opendata.cbs.nl/statline/#/CBS/nl/dataset/37230ned/table?ts=1520
774007776.
[5] Gemeente Enschede, "Water in Enschede: feiten, cijfers en trends,"
Gemeente Enschede, 2012.
[6] Waterschap Vechtstromen, "KlimaatActieve Stad (KAS)," 2016. [Online].
Available: https://www.vechtstromen.nl/over/klimaat/klimaatactieve/.
[Accessed 05 04 2018].
[7] M. Zuithof, "Waterbeheer centraal in klimaat adaptieve stad," Vitale groene
stad, vol. 05, no. 02, 2017.
[8] H. J. Teekens, Composer, Slimme regenton van UT voert water af voor
regenbui. [Sound Recording]. Tubantia. 2017.
[9] Gemeente Enschede, "Slimme regenton," 2017. [Online]. Available:
https://www.enschede.nl/duurzame-daad/slimme-regenton.
[10] G. Steeghs, "Developing a smart rainwater buffering system for the
municipality of Enschede," University of Twente, Enschede, 2017.
[11] F. Rindt, "DEVELOPING A SMART RAINWATER BUFFERING SYSTEM FOR THE
CITIZENS OF ENSCHEDE," University of Twente, Enschede, 2017.

144
[12] B. Vetter, "Designing a Smart Rainwater Buffer," University of Twente,
Enschede, 2017.
[13] D. Defize, "Climate Active City Enschede," University of Twente, Enschede,
2018.
[14] J. Groeneveld, "Inhoud Smart Rain Water Buffer," University of Twente,
Enschede, 2018.
[15] Buienradar, "Gratis Weerdata," Buienradar, 2018. [Online]. Available:
https://www.buienradar.nl/overbuienradar/gratis-weerdata. [Accessed 05 04
2018].
[16] M. Richardson, "Errors, accidents and self-assembly products,"
Contemporary Ergonomics, vol. 10, no. 305, 2007.
[17] M. Richardson, "Assembly Complexity and the design of self-assembly
products," in Human Factors and Ergonomics in Consumer Product Design:
Methods and Techniques, CRC Press, 2011, pp. 187-200.
[18] T. C. Chang, R. A. Wysk and H. P. Wang, Computer-Aided Manufacturing, 2e
ed., Pearson Education Limited, 1997, pp. 596-598.
[19] M. Richardson, G. Jones, M. Torrance and T. Baguley, "Identifying the task
variables that predict object assembly difficulty," Human Factors, 2006.
[20] M. Madan, T. Bramorski and R. P. Sundarraj, "The effects of grouping parts
for ready-to-assemble products on assembly time: An experimental study,"
International Journal of Operations and Production Management, pp. 39-49,
1995.
[21] B. Sala, "Studio Bas Sala," 2017. [Online]. Available:
http://www.slimmeregenton.nl. [Accessed 05 05 2018].
[22] RiverSides, "RiverSides," [Online]. Available: http://www.riversides.org/.
[Accessed 05 05 2018].
[23] RainGrid, "RainGrid," [Online]. Available: https://www.raingrid.com/.
[Accessed 05 05 2018].
[24] RainGrid, " RainGrid Cistern Manual," 06 2016. [Online]. Available:
https://www.raingrid.com/wp-content/uploads/2016/08/RainGrid-Cistern-
InstallationAndOperationGuide-June2016.pdf. [Accessed 05 05 2018].
[25] Opti, "Opti," [Online]. Available: https://optirtc.com/. [Accessed 05 05
2018].

145
[26] M. Quigley, "Opti," OptiRTC, 22 03 2018. [Online]. Available: https://optirtc-
cso.com/. [Accessed 22 03 2018].
[27] P. Schuster, "Rainwater Harvesting – The Smart Way!," 12 02 2014.
[Online]. Available: https://www.loxone.com/enen/rainwater-harvesting/.
[Accessed 05 05 2018].
[28] P. Schuster, "Rainwater Harvesting – The Smart Way!," 12 02 2014.
[Online]. Available: https://www.loxone.com/enen/rainwater-harvesting/.
[29] Catapult Future Cities, "Smart Rainwater Management System – Over The
Air Analytics (OTA)," [Online]. Available:
http://futurecities.catapult.org.uk/smart-rainwater-management-system-
ota/. [Accessed 05 05 2018].
[30] Catapult, "Smart Rainwater Management System – Over The Air Analytics
(OTA)," 21 07 2017. [Online]. Available:
http://futurecities.catapult.org.uk/smart-rainwater-management-system-
ota/.
[31] Graf, "Rainwater harvesting systems," [Online]. Available: http://www.graf-
water.com/rainwater-harvesting.html. [Accessed 05 05 2018].
[32] S.A.R.G water solutions, "Underground Water Storage Tanks - Modular,"
[Online]. Available: http://sargwatersolutions.com/modular-underground-
water-tanks.html. [Accessed 05 05 2018].
[33] Atlantis, "Atlantis Rainwater Harvesting Tank System," [Online]. Available:
https://www.atlantis-america.com/?page_id=12061. [Accessed 05 05 2018].
[34] D. t. Good, Director, Top 7 Mistakes to Avoid when Harvesting Rain Water.
[Film]. United States.2016.
[35] G. Hiebert, Director, Building a Rain Barrel - Easy as 1, 2, 3. [Film]. Canada:
Okanagan WaterWise, 2012.
[36] A. H. Mader and W. Eggink, "A Design Process for Creative Technology,"
Proceedings of the 16th International conference on Engineering and Product
Design, pp. 568-573, 2014.
[37] C. J. Jones, Design methods, London: Wiley-Interscience, 1970.
[38] J. M. Bryson, "What to do when stakeholders matter," Public Management
Review, vol. 1, no. 6, pp. 21-53, 2004.
[39] H. Sharp, A. Finkelstein and G. Galal, "Stakeholder Identification in the
Requirements Engineering Process," DEXA '99 Proceedings of the 10th
146
International Workshop on Database & Expert Systems Applications, vol. 10,
no. 99, pp. 387-392, 1999.
[40] R. Thompson, "Stakeholder Analysis," 2018. [Online]. Available:
https://www.mindtools.com/pages/article/newPPM_07.htm. [Accessed 26 4
2018].
[41] A. L. Mendelow, "Environmental Scanning--The Impact of the Stakeholder
Concept," International Conference on Information Systems, pp. 407-417,
1981.
[42] D. Haughey, "MoSCoW Method," 2014. [Online]. Available:
https://www.projectsmart.co.uk/moscow-method.php. [Accessed 27 4
2018].
[43] P. L. Eide, Quantification and Traceability of Requirements, Trondheim:
Norwegian University of Science and Technology, 2005.
[44] J. Van Helver and C. Fowler, "Scenario-based User Needs Analysis," Chimera
Working Paper, vol. 2003, no. 02, 2003.
[45] I. Widya, R. G. Bults, M. Huis in 't Veld and M. M. R. Vollenbroek-Hutten,
"Scenario-based Requirements Elicitation in a Pain-teletreatment
Application," Proceedings of the ICSOFT 4th. International Conference on
Software and Data Technologies, vol. 4, no. 2, pp. 406-413, 2009.
[46] D. Benyon and C. Macaulay, "Scenarios and the HCI-SE design problem,"
Interacting with Computers, no. 14, pp. 397-405, 2002.
[47] R. M. Huis in ’t Veld, I. A. Widya, R. G. Bults, L. Sandsjo, H. J. Hermens and
M. M. Vollenbroek-Hutten, "A scenario guideline for designing new
teletreatments: a multidisciplinary approach," Journal of Telemedicine and
Telecare, no. 16, p. 302–307, 2010.
[48] V. Trulock, "PACT Analysis," 12 08 2005. [Online]. Available:
http://hci.ilikecake.ie/requirements/pact.htm. [Accessed 29 04 2018].
[49] H. Faste, N. Rachmel, R. Essary and E. Sheehan, "Brainstorm, chainstorm,
cheatstorm, tweetstorm: New ideation strategies for distributed HCI design,"
Conference on Human Factors in Computing Systems - Proceedings, vol. 31,
pp. 1343-1352, 2013.
[50] A. Bryman, Social research methods, 4e ed., New York: Oxford University
Press, 2012.

147
[51] uml-diagrams.org, "Activity Diagrams," uml-diagrams, [Online]. Available:
https://www.uml-diagrams.org/activity-diagrams.html. [Accessed 15 05
2018].
[52] Enschede, "Duurzaamheid," 2018. [Online]. Available:
https://www.ruimtelijkeplannen.enschede.nl/NL.IMRO.0153.SV00001-
0003/b_NL.IMRO.0153.SV00001-0003_6.6.1.html. [Accessed 27 4 2018].
[53] E. M. Rogers, Diffusion of innovation, Simon and Schuste, 2010.
[54] Rainwinner, "The Rainwinner," [Online]. Available:
http://www.rainwinner.nl/. [Accessed 16 05 2018].
[55] deduurzametuin, "Rainwinner," [Online]. Available:
https://www.deduurzametuin.nl/winkel/tuinmaterialen/rainwinner-set-van-
3/. [Accessed 16 05 2018].
[56] Enexis, "Richtlijnen meterkast en bouwkast," 2016. [Online]. Available:
https://www.enexis.nl/over-ons/documenten-en-publicaties/richtlijnen-
meterkast-en-bouwkast. [Accessed 19 05 2018].
[57] Y. Li, X. Cheng, Y. Cao, D. Wang and L. Yang, "Smart Choice for the Smart
Grid: Narrowband Internet of Things (NB-IoT)," IEEE INTERNET OF THINGS
JOURNAL, 2017.
[58] Ericsson, "Cellular networks for massive IoT," White paper, 2016.
[59] U. Raza, P. Kulkarni and M. Sooriyabandara, "Low Power Wide Area
Networks: An Overview," IEEE COMMUNICATIONS SURVEYS & TUTORIALS,
pp. 855-873, 2017.
[60] W. Zhai, "Design of narrowband-IoT oriented wireless sensor network in
urban smart parking," International Journal of Online Engineering, Vols.
Volume 13, Issue 12, pp. 116-126, 2017.
[61] J. M. Marais, R. Malekian and A. M. Abu-Mahfouz, "LoRa and LoRaWAN
testbeds: A review," 2017 IEEE AFRICON: Science, Technology and
Innovation for Africa, pp. 1496-1501, 2017.
[62] Y. Song, J. Lin, M. Tang and S. Dong, "An Internet of Energy Things Based
on Wireless LPWAN," Engineering 3, pp. 460-466, 2017.
[63] S. E. Bibri, "The IoT for smart sustainable cities of the future: An analytical
framework for sensor-based big data applications for environmental
sustainability," Sustainable Cities and Society 38, pp. 230-253, 2018.

148
[64] R. S. Iborra, S. J. Gomez, J. B. Viñas, M. D. Cano and A. . F. Skarmeta,
"Performance Evaluation of LoRa Considering Scenario Conditions," Sensors,
2018.
[65] B. Vejlgaard, M. Lauridsen, H. Nguyen, I. Z. Kovács, P. Mogensen and M.
Sørensen, "Coverage and Capacity Analysis of Sigfox, LoRa, GPRS, and NB-
IoT," in IEEE Vehicular Technology Conference , Australia, 2017.
[66] F. Adelantado, X. Vilajosana, P. Tuset-Peiro, B. Martinez, J. Melià-Seguí and
T. Watteyne, "Understanding the Limits of LoRaWAN," IEEE Communications
Magazine, Vols. Volume 55, Issue 9, pp. 34-40, 2017.
[67] 3GPP, "Progress on 3GPP IoT," The 3rd generation partnership project, 29 02
2016. [Online]. Available: http://www.3gpp.org.
[68] W. Yang, M. Wang, J. Zhang, J. Zou, M. Hua, T. Xia and X. You, "Narrowband
Wireless Access for Low-Power Massive Internet of Things: A Bandwidth
Perspective," IEEE Wireless Communications, no. Volume 24, Issue 3, pp.
138-145, 25 may 2017.
[69] M. D. Cano and R. S. Iborra, "State of the Art in LP-WAN Solutions for
Industrial," Sensors, 2016.
[70] A. Augustin, J. Yi, T. Clausen and W. M. Townsley, "A Study of LoRa: Long
Range & Low Power Networks for the Internet of Things," Sensors, 2016.
[71] F. Bonavolontà, A. Tedesco, R. S. L. Moriello and A. Tufano, "Enabling
wireless technologies for Industry 4.0: State of the Art," 2017 IEEE
International Workshop on Measurement and Networking, 2017.
[72] Aerea, "Aerea Sigfox IOT network," [Online]. Available:
http://www.aerea.nl/. [Accessed 10 05 2018].
[73] S. Al-Sarawi, M. Anbar, K. Alieyan and M. Alzubaidi, "Internet of Things (IoT)
Communication Protocols : Review," International Conference on Information
Technology (ICIT), 2017.
[74] A. B. A. Rahman, "Comparison of Internet of Things (IoT) Data Link
Protocols," Washington University in St. Louis, pp. 1-21, 2015.
[75] M. W. Ahmad, M. Mourshed, D. Mundow, M. Sisinni and Y. Rezgui, "Building
energy metering and environmental monitoring – A state-of-the-art review
and directions for future research," Energy and Buildings, vol. 2016, no. 120,
pp. 85-102, 2016.
[76] Y. Chen and D. Han, "Water quality monitoring in smart city: A pilot project,"
Automation in Construction, no. 89, pp. 307-316, 2018.

149
[77] H. Hopper, "A Dozen Ways to Measure Fluid Level and How They Work," 1 12
2004. [Online]. Available: https://www.sensorsmag.com/components/a-
dozen-ways-to-measure-fluid-level-and-how-they-work.
[78] S. B. Reddy, "Operationg Priciple of Displacer Level Sensors," 03 2013.
[Online]. Available:
http://www.instrumentationtoolbox.com/2013/03/operating-principle-of-
displacer-level.html#axzz5AUoG4uFj.
[79] Automation Wiki, "Bubbler Level Measurement," 25 03 2010. [Online].
Available:
http://automationwiki.com/index.php?title=Bubbler_Level_Measurement.
[80] Automation Wiki, "Differential Pressure Level Measurement," 10 06 2017.
[Online]. Available:
http://automationwiki.com/index.php/Differential_Pressure_Level_Measurem
ent.
[81] Automation Wiki, "Load Cell," 24 02 2010. [Online]. Available:
http://automationwiki.com/index.php/Load_Cell.
[82] Pepperl+Fuchs, "The pulse of automation: Technology Guide," 2018.
[83] Siemens, "Ultrasoinc sensor systems," [Online]. Available:
https://w3.siemens.com/mcms/sensor-systems/en/process-
instrumentation/level-measurement-with-level-measuring-
instruments/continuous/ultrasonic/pages/ultrasonic.aspx. [Accessed 29 05
2018].
[84] Siemens, "Siemens Ultrasonic Level Measurement," 2017.
[85] Siemens, "What is Auto False-Echo Suppression," 2017.
[86] Pulsar Process Measurement, "Echo Detection with DATEM echo processing
software," [Online]. Available: https://www.pulsar-
pm.com/instrumentation/technologies/echo-processing.aspx. [Accessed 30
05 2018].
[87] FlowLine, "Ultrasonic Level Sensor Beam Width Explained," Liquid Level
Solutions, 2011.
[88] Flood Network, "Oxford Flood Network Sensor build," [Online]. Available:
https://flood.network/. [Accessed 30 05 2018].
[89] NPX, "Enabled Ultrasonic Distance Measurement," 03 2014. [Online].
Available: https://www.nxp.com/docs/en/application-note/AN4841.pdf.
[Accessed 30 05 2018].

150
[90] Murata, "Ultrasonic Sensor Open Structure Type," 10 2016. [Online].
Available:
https://www.murata.com/~/media/webrenewal/products/sensor/ultrasonic/o
pen/applinote_maopn.ashx?la=en. [Accessed 30 05 2018].
[91] Lesman Tech Tips, "Does ultrasonic level measurement work with a
standpipe?," 29 04 2014. [Online]. Available:
https://blog.lesman.com/2014/04/29/does-ultrasonic-level-measurement-
work-with-a-standpipe/. [Accessed 30 05 2018].
[92] Omega, "Applying Ultrasonic Level Sensors in Life Science Pre-Treatment,"
[Online]. Available: https://www.omega.com/technical-learning/ultrasonic-
level-transmitters-in-life-science-pre-treatment.html. [Accessed 30 05
2018].
[93] APG, "How To Make A Standpipe And Wave Guide For Your Ultrasonic
Sensor," 16 10 2013. [Online]. Available:
https://www.apgsensors.com/about-us/blog/how-to-make-a-standpipe-and-
wave-guide-for-your-ultrasonic-sensor. [Accessed 30 05 2018].
[94] Global Water, "Ultrasonic level sensors," [Online]. Available:
http://www.globalw.com/support/ultrasonic.html. [Accessed 30 05 2018].
[95] Jon's Blog, "Arduino Nano Ultrasonic Level Sensor Tutorial," 12 10 2017.
[Online]. Available: https://chemejon.wordpress.com/2017/10/12/arduino-
nano-ultrasonic-level-sensor-tutorial-hc-srf05/. [Accessed 30 05 2018].
[96] S. Wielenberg, "Using an Ultrasonic Sensor Inside of a Pipe," 11 07 2016.
[Online]. Available: https://www.maxbotix.com/Tutorials/124.htm.
[Accessed 30 05 2018].
[97] S. Hicks, "Ultrasonic water depth sensor," 07 08 2014. [Online]. Available:
https://www.envirodiy.org/ultrasonic-water-depth-sensor/. [Accessed 30 05
2018].
[98] D. Green, "Legionella: The Invisible Killer," IOSH London Metropolitan Branch
Meeting, pp. 1 - 5, 2013.
[99] Freerain Ltd, "Is Legionella problem for rainwater harvesting systems?," 05
12 2008. [Online]. Available: http://rainwater-harvesting-
systems.blogspot.com/2008/12/is-legionella-problem-for-rainwater.html.
[Accessed 30 05 2018].
[100] P. Díaz, F. Royo, T. Olivares, F. R. Mireles and L. O. Barbosa, "A Case Study
on the Power-Aware Protocol Framework for wireless sensor networks,"
International Journal of Distributed Sensor Networks, vol. 12, no. 9, 2013.

151
[101] R. Shi and Y. Li, "An intelligent solar energy-harvesting system for wireless
sensor networks," Journal on Wireless Communications and Networking, vol.
2015, no. 179, 2015.
[102] R. IJzermans, "DS18B20 waterdichte temperatuur sensor aansluiten op
Raspberry Pi," 01 08 2017. [Online]. Available:
https://raspberrytips.nl/ds18b20-raspberry-pi/. [Accessed 20 06 2018].
[103] 4G-dekking, "4G-dekking T-Mobile," 2018. [Online]. Available:
https://www.4gdekking.nl/alles-over-4g. [Accessed 30 06 2018].

152

153
APPENDIX
A. Result Brainstorm

154
B. Barrel comparison
Barrel Specs Pros and cons Supplier Price
- 300 liters
- Rectangular - Tap
- Base
- Lid
- 122 x 80 x 66 cm
+ Large capacity
+ Made of 100% plastic + Relatively low price
+ Made in Germany
+ 100% recyclable
+ Easy to install + Also available in bigger and
smaller size
- No predrilled holes besides hole
for the tap
Hornbach
€ 58,-
- 320 liters
- Rectangular - Tap
- Lid
- 135 x 60 x 40 cm
- Level indicator
+ Large capacity
+ Space saving
- Leaks
- Tap placement not ideal - No base
- Not flat inside
- Predrilled holes are to small
Warentuin.nl € 135,-
- 300 liters
- Round
- Tap
- Planter on top
+ Large capacity
+ Multi-functional
+ Design fits in context of
garden
- Relatively high price
- No base
- No flat sides - No predrilled holes besides hole
for the tap
Formido € 205,-

155
- 280 liters - Rectangular
- Tap
- Lid
- Base - 152 x 52 x 52 cm
+ Space saving + Base
- Low quality
- No flat sides - Less attractive design
kunststofregenton.nl
€ 100,-
- 350 Liters
- Round
- Tap - 2 predrilled holes
- 120 x 78 cm
+ Large capacity
+ Good quality
+ 2 predrilled holes
- Not space saving
- No base
- No flat sides
Voertonnen.
nl
€ 150,-
- 380 liters
- Foldable - Lightweight
- 100 x 70 cm
+ Easy shipping
+ Large capacity
- Lower quality
- No option to drill extra holes
- No lid - No base
- Not durable
kunststofreg
enton.nl
€ 150,-
- 227 liters
- Lid - Tap
- 96 x 60
+ Base
- No flat sides
kunststofreg
enton.nl
€ 90,-

156
- 275 liters - Tap
- 105 x 80 x 40 cm
+ Space saving + Fits in context of garden
- Relatively high price
- No base - No predrilled holes besides hole
for the tap
kunststofregenton.nl
€ 260,-
- 200 Liters
- Planter on top
- Tap
- Extra hole - 105 x 60 cm
+ Large capacity
+ Multi-functional
+ Nice design
+ Good quality
- No base
- No flat sides
Elho.com € 130,-
- 800 liters
- Foldable - 110 x 110 cm
- Wood
- frost resistant
+ Frost resistant
+ Easy shipping + Fits in context of garden
+ Large capacity
+ Good quality
- No option to drill extra holes
- No lid
- No base
Magazijnblijd
orp.nl
€ 250,-
- 300 liters - 117 x 60 x 68
- 2 predrilled holes
- Lid
+ Large capacity + Good quality
+ 2 predrilled holes
+ Flat back
+ Flat sides
+ Space saving
- No base
Tuinadvies.nl
€ 120,-

157
C. Relevant IoT networking projects This section contains an overview of the available IoT networks in Enschede.
NB-IoT by T-Mobile
T-Mobile is the first provider in the Netherlands that has country wide NB-IoT
coverage. For approximately 1 euro a month per connection the network can be used.
The use of the network is sim based so every device should be equipped with a sim
card. T-Mobile allows 120 messages per day. For the SRB that would mean 5
messages per hour. For more information see the T-Mobile NB-IoT webpage5.
LoRa by KPN
LoRa by KPN has full coverage across the Netherlands. The company has not
published the prices for the use of the network. SIMPoint a reseller of KNP LoRa does
have prices published. SIMPoint provides Postpaid subscriptions and prepaid
products. A postpaid subscription with 9000 uplinks and 900 downlinks costs between
1,20 and 1 euro per month per device. A prepaid bundle of 109500 uplinks and 9000
downlinks cost 16,30 euro per year per device. For more information see the SIMPoint
website6 and the KPN LoRa website7.
LoRa by The Things Network
The Things Network is a community based LoRa network. The platform is completely
open, everyone is allowed to use it. The downside of the network is that they want to
keep the downlink at a minimum. The things network has a Fair Access Policy that
limits the uplink airtime to 30 seconds per day (24 hours) per node and the downlink
messages to 10 messages per day (24 hours) per node. This is a problem because
the SRB needs to download prediction data more than 10 times a day. For more
information see the The Things Network website8.
SigFox by SigFox
The SigFox network provided by SigFox is a low power wide area network that has
country wide coverage in the Netherlands. The pricing of SigFox depends on the
volume of devices. Ranging from 1 euro per device per month to 1 euro per device
per year. SigFox allows 140 messages per day this is because of European
regulations. For more information see the SigFox website9.
5 https://iot.t-mobile.nl/waarom-iot 6 https://www.simpoint.com/lora/ 7 https://www.kpn.com/zakelijk/grootzakelijk/internet-of-things/lora-netwerk.htm 8 https://www.thethingsnetwork.org/ 9 https://www.sigfox.com/en
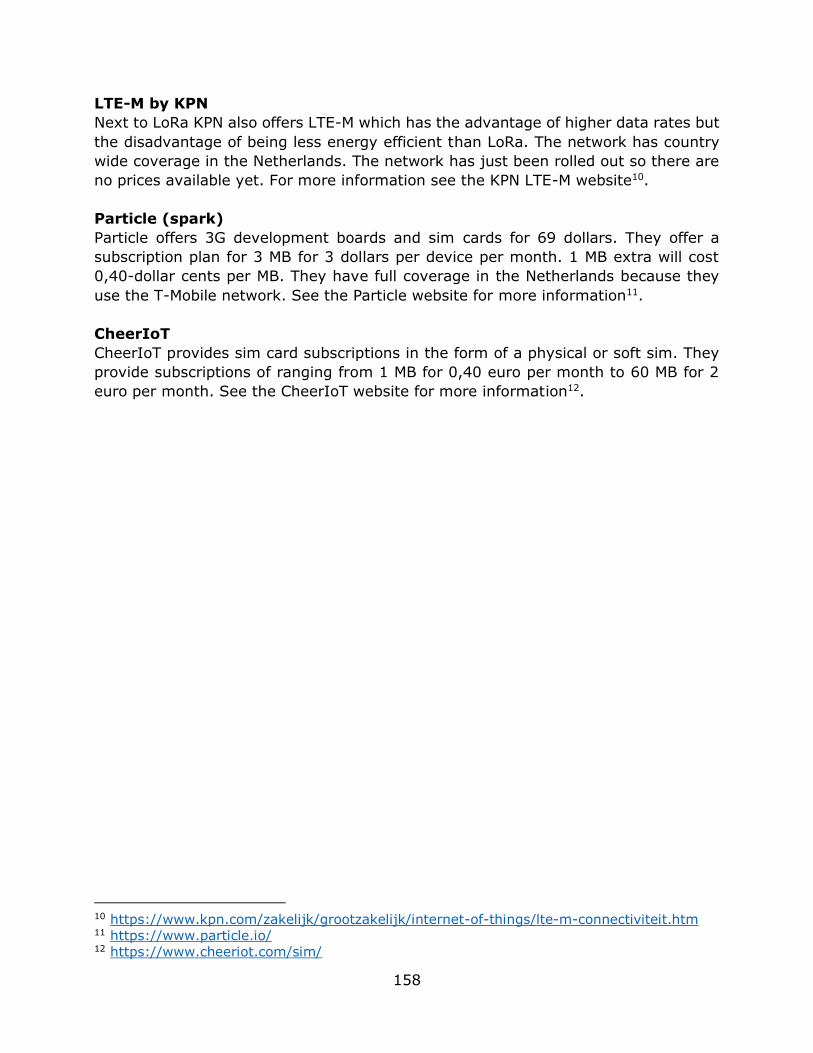
158
LTE-M by KPN
Next to LoRa KPN also offers LTE-M which has the advantage of higher data rates but
the disadvantage of being less energy efficient than LoRa. The network has country
wide coverage in the Netherlands. The network has just been rolled out so there are
no prices available yet. For more information see the KPN LTE-M website10.
Particle (spark)
Particle offers 3G development boards and sim cards for 69 dollars. They offer a
subscription plan for 3 MB for 3 dollars per device per month. 1 MB extra will cost
0,40-dollar cents per MB. They have full coverage in the Netherlands because they
use the T-Mobile network. See the Particle website for more information11.
CheerIoT
CheerIoT provides sim card subscriptions in the form of a physical or soft sim. They
provide subscriptions of ranging from 1 MB for 0,40 euro per month to 60 MB for 2
euro per month. See the CheerIoT website for more information12.
10 https://www.kpn.com/zakelijk/grootzakelijk/internet-of-things/lte-m-connectiviteit.htm 11 https://www.particle.io/ 12 https://www.cheeriot.com/sim/

159
D. Data sources Previous research did not elaborate why a certain weather prediction data source was
used. That is why in this section the open data sources are presented. There a lots of
weather institutes all around the world but only a few of them make their detailed
precipitation predictions publicly available in a raw format.
Buienradar
Buienradar provides a data source with 5-minute predictions for the next 2 hours. It
uses coordinates (latitude and longitude) as input. The response of the http call
returns a text file. This file contains the precipitation for the next 2 hours for the given
latitude and longitude. A value of 0 means it is dry and a value of 255 means heavy
rainfall. Formula 1 can be used to convert this value to millimeter per hour. Buienradar
gets its information from multiple sources: KNMI, MetOffice, EUMetsat, DWD, KMI,
SMHI, MF.
𝑃𝑟𝑒𝑐𝑖𝑝𝑖𝑡𝑎𝑡𝑖𝑜𝑛 𝑖𝑛𝑡𝑒𝑛𝑠𝑖𝑡𝑦 = 10((𝑣𝑎𝑙𝑢𝑒−109)/32)
Formula 1: Precipitation intensity
Address: https://gadgets.buienradar.nl/data/raintext?lat=52.09&lon=5.11
Format: Plain text
Interval: 5 minutes for next 2 hours
Accuracy: Coordinate based, see grid on map in figure D.1 for the maximum
accuracy based on the allowed input of maximum precision of
coordinates. As can be seen in figure D.1, Enschede can be divided into
6 x 4 sections.
Figure D.1: Enschede coordinate grid accuracy Buienradar. Source: Google Maps

160
Norwegian Meteorological Institute
The Norwegian weather institute provides an open API that allows getting forecast
data based on cities. It can give forecast information for Enschede for different
intervals, the smallest is 1 hour and the largest is 6 hours. The original data is
provided by the Norwegian Meteorological Institute, European Centre for Medium-
Range Weather Forecasts (ECMWF) and European Organization for the Exploitation of
Meteorological Satellites (EUMETSAT). For more information see the API
documentation of yr.no13.
Feed 1:
Address: http://www.yr.no/place/Netherlands/Overijssel/Enschede/forecast.xml
Format: XML
Interval: 6 hour prediction for next 10 days
Accuracy: City based
Data: precipitation, wind direction, wind speed, temperature, pressure
Feed 2:
Address:http://www.yr.no/place/Netherlands/Overijssel/Enschede/forecast_hour_by
_hour.xml
Format: XML
Interval: 1 hour prediction for next 2 days
Accuracy: City based
Data: precipitation, wind direction, wind speed, temperature, pressure
13 http://om.yr.no/info/verdata/xml/

161
DarkSky
Darksky is an American company that uses data sources from all around the world
and applies data fusion to the data to get the best weather prediction. The data
sources used for predictions in Enschede are: isd, dwdpa, cmc, gfs and madis. The
API request returns the forecast weather conditions hour-by-hour for the next 48
hours, and a day-by-day forecast for the next week. The location of the prediction is
based on precise coordinates. For more information see the API documentation of
DarkSky14.
Address: https://api.darksky.net/forecast/[key]/[latitude],[longitude]
Format: JSON
Limitation: Per day 1000 free API request, if more than $0.0001 per request.
Interval: 1 hour prediction for next 2 days and day prediction for next 7 days
Accuracy: Coordinate based, location precise prediction(example 52.xxxx, 6.xxxx)
Data: precipitation intensity, precipitation probability, precipitation Type,
temperature, apparent temperature, dewpoint, humidity, pressure,
wind gust, wind speed, wind bearing, cloud cover, UV index, visibility,
ozone
Conclusion
The data with the smallest interval can be provided by Buienradar. This data is
accurate enough to divide Enschede into 20 sections. The data is only providing
insight in the predictions for the next 2 hours. The data also doesn’t contain the
precipitation probability. For the next project phases, it is worth researching if the
data from Buienradar can be made more accurate by applying data fusion with the
data of the other sources or data from the sensors that are placed in Enschede. The
daily precipitation predictions and precipitation probability combined with the 2-hour
predictions of Buienradar could possibly result in a more accurate prediction, this will
be further researched in the next phases of the project.
14 https://darksky.net/dev/docs#forecast-request

162
E. Part list – Final prototype
Part Name Supplier Price
Barrel + Tap
300 Liters
Hornbach
€ 35,-
Barrel Base Hornbach
€ 23,-
Electronic Ball Valve
5v, DN32, CR02
CWX € 16,50
Pp reservoir connector
DN32
Wildkamp € 9,-
Geka koppeling
binnendraad 1 ¼
DN32
PVC24 € 3,-
Raspberry pi 3B Farnell € 35,-
Micro sd card, 8 GB,
class 10
Farnell € 8,-
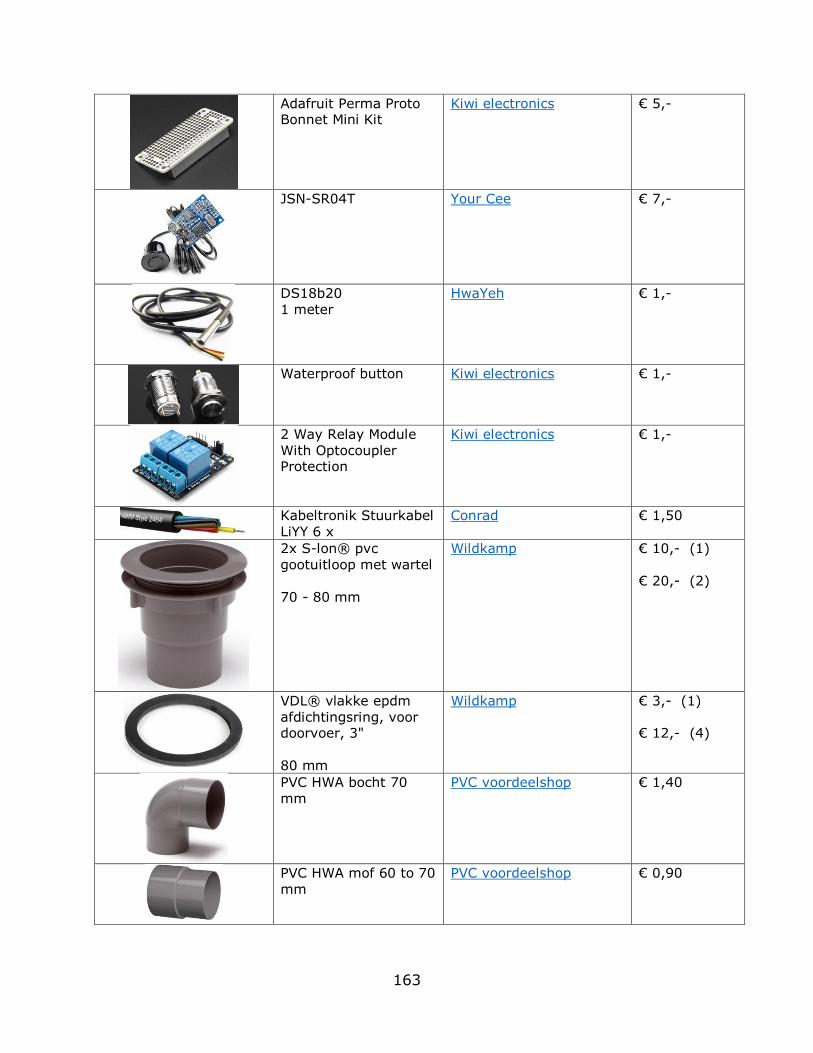
163
Adafruit Perma Proto Bonnet Mini Kit
Kiwi electronics € 5,-
JSN-SR04T Your Cee € 7,-
DS18b20
1 meter
HwaYeh € 1,-
Waterproof button Kiwi electronics € 1,-
2 Way Relay Module
With Optocoupler Protection
Kiwi electronics € 1,-
Kabeltronik Stuurkabel
LiYY 6 x
Conrad € 1,50
2x S-lon® pvc
gootuitloop met wartel
70 - 80 mm
Wildkamp € 10,- (1)
€ 20,- (2)
VDL® vlakke epdm
afdichtingsring, voor doorvoer, 3"
80 mm
Wildkamp € 3,- (1)
€ 12,- (4)
PVC HWA bocht 70
mm
PVC voordeelshop € 1,40
PVC HWA mof 60 to 70
mm
PVC voordeelshop € 0,90

164
Productkenmerken NYLON FILTERKOUS
voor bronfilter 75 mm
1 meter
PVC voordeelshop € 0,80
MIKALOR RVS
SLANGKLEM 60 - 80
PVC voordeelshop € 2,-
Wartel M12 Polyamide
Lichtgrijs (RAL 7035)
TRU COMPONENTS TC-AGR12LGY4203 1
stuks
Conrad € 0,36 (1)
€ 0,72 (2)
Super Tricoflex® pvc
waterslang, 19 x 25,5
mm, l = 100 m
1 meter
Wildkamp € 4,60
RIV messing koppeling
met
bajonetaansluiting,
type 3302, 1x
slangtule, 20 mm
Wildkamp € 4,- (1)
€ 8,- (2)
Mikalor® verzinkte
wormschroef
slangklem, 16 - 27 mm
Wildkamp € 0,50 (1)
€ 1 ,- (2)
Hammond Electronics
RP1085C Universele
behuizing 105 x 75 x 40 ABS Lichtgrijs
Conrad € 11,50
5v Farnell € 7,70
Stroom Kabel HAWA 1008278 Zwart 5.00 m
Conrad € 5,-

165
Kabelschoen (rond) Bus, recht Serie
(ronde connectors):
SP13 Totaal aantal
polen: 3 SP1310 / S 3 I Weipu 1 stuks
Conrad € 4,50
Kabelschoen (rond) Stekker, inbouw Serie
(ronde connectors):
SP13 Totaal aantal
polen: 3 SP1312 / P 3 Weipu 1 stuks
Conrad € 4,50
Kabelschoen (rond) Bus, recht Serie
(ronde connectors):
SP13 Totaal aantal
polen: 4 SP1310 / S 4
I Weipu 1 stuks
Conrad € 4,50
IP68-connector serie
SP13 Apparaatstekker voor frontmontage
Weipu SP1312 / P 4
IP68 Aantal polen: 4
Conrad € 4,50
Kabelschoen (rond)
Bus, recht Serie
(ronde connectors): SP13 Totaal aantal
polen: 6 SP1310 / S 6
I Weipu 1 stuks
Conrad € 4,50
IP68-connector serie
SP13 Apparaatstekker
voor frontmontage
Weipu SP1312 / P 6 IP68 Aantal polen: 6
Conrad € 4,50
Total: € 235,62

166
F. Valve specifications

167
G. Valve test In order to proof that the foreign bought valve is of good quality several tests were
conducted to research the quality of the valve. The tested valve is the CWX-15,
DN15, CR03, 3-6 volt version (see figure G.1) . The valve was tested in low
temperatures, underwater, in dirty water and by intentionally blocking the valve
from closing.
Figure G.1: CWX 15 valve
Freeze test
The valve was tested by putting it in the freezer for 24 hours. The specifications of
the valve (see appendix F) say that the valve should be able to handle temperatures
between -20 and 45 degrees Celsius. Because it the valve will be used outside it is
possible that the temperature will be below zero. This was simulated in this test, the
valve was put in to the freezer with a temperature of -18 degrees Celsius. The
valve worked perfectly fine after this test, so it can be concluded that the valve
indeed can handle temperature below zero. Of course, this test does not say
anything about a longer exposure to low temperatures, but this test can be used as
an indication that it probably also can handle low temperatures for a longer period
of time. Next to that the valve was also not tested with water inside the valve. This
was not done because the it is already known that water that freezes will expand
and that this could possibly damage the valve.
Waterproof test
The valve specifications tell that the valve has an IP65 rating. This means that the
valve is dust tight and that the valve has protection against water jets. In order to
test this the valve was put under water for 24 hours, while the valve was opened
and closed every 15 minutes. After the 24 hours the valve worked perfectly fine,
there were also no signs of water damage. If the valve can be place underwater for
24 hours than one could also safely assume that the valve will be rain proof. See
figure G.2 for an impression of the test setup.
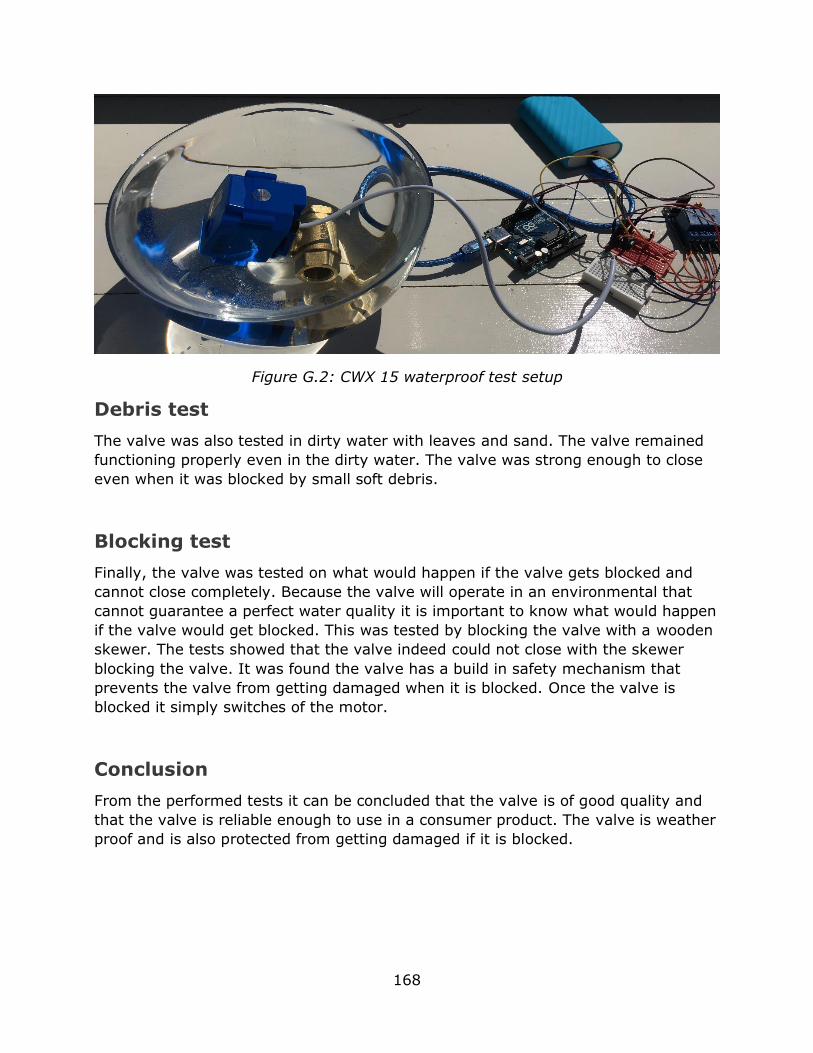
168
Figure G.2: CWX 15 waterproof test setup
Debris test
The valve was also tested in dirty water with leaves and sand. The valve remained
functioning properly even in the dirty water. The valve was strong enough to close
even when it was blocked by small soft debris.
Blocking test
Finally, the valve was tested on what would happen if the valve gets blocked and
cannot close completely. Because the valve will operate in an environmental that
cannot guarantee a perfect water quality it is important to know what would happen
if the valve would get blocked. This was tested by blocking the valve with a wooden
skewer. The tests showed that the valve indeed could not close with the skewer
blocking the valve. It was found the valve has a build in safety mechanism that
prevents the valve from getting damaged when it is blocked. Once the valve is
blocked it simply switches of the motor.
Conclusion
From the performed tests it can be concluded that the valve is of good quality and
that the valve is reliable enough to use in a consumer product. The valve is weather
proof and is also protected from getting damaged if it is blocked.

169
H. Ultrasonic sensor measurement tests This section contains the test results of the US-100, hc-sr04p, JSN-SR04T-2.0, and
generic 40 KHz ultrasonic transceiver unit ultrasonic sensors. All sensors have been
tested in measuring the water level in a buffer. The sensors were polled every
second while draining and filling the barrel. The results are visualized in graphs.
These tests were performed in order to study the behavior of the different sensors
while filling and draining the buffer.
Test setup
Barrel type: 300 liter, Garantia rectangular rain buffer
Barrel height: 84 cm
Barrel width top: 72 cm
Barrel depth top: 57 cm
Barrel width bottom: 56 cm
Barrel depth bottom: 42.5 cm
Outdoor temperature: 15 °C
Controller: Arduino Uno
Measurement frequency: 1 s
Test date: 12-06-2018
US-100 & hc-sr04p
Since the US-100 & hc-sr04p are both made of the same components it was decided
to only test the hc-sr04p because early tests showed that the measurement results
of the two sensors are almost identical. The hc-sr04p will be tested with and without
wave guide. See figure H.2 to H.5 for the results.
Test 1: No wave guide
Sensor positioned on the center of the barrel lid, placed 86 cm above the bottom of
the barrel (see figure H.1).
Figure H.1: Sensor placement hc-sr04p, test 1

170
Figure H.2: hc-sr04p, filling, test 1
Figure H.3: hc-sr04p, draining, test 1
0
10
20
30
40
50
60
70
80
90
100
1
24
47
70
93
11
6
13
9
16
2
18
5
20
8
23
1
25
4
27
7
30
0
32
3
34
6
36
9
39
2
41
5
43
8
46
1
48
4
50
7
53
0
55
3
57
6
59
9
62
2
64
5
66
8
69
1
71
4
73
7
76
0
78
3
80
6
Dis
tan
ce (
cm)
Time (s)
hc-sr04p, filling, no waveguide
0
10
20
30
40
50
60
70
80
90
100
12
44
77
09
31
16
13
91
62
18
52
08
23
12
54
27
73
00
32
33
46
36
93
92
41
54
38
46
14
84
50
75
30
55
35
76
59
96
22
64
56
68
69
17
14
73
77
60
78
38
06
82
9
Dis
tan
ce (
cm)
Time (s)
hc-sr04p, draining, no waveguide

171
Test 2: Full length pipe wave guide
Sensor positioned 10 cm from the center of the barrel lid, placed 86 cm above the
bottom of the barrel.
Figure H.4: hc-sr04p, filling, test 2
Figure H.5: hc-sr04p, draining, test 2
0
20
40
60
80
100
120
1
25
49
73
97
12
1
14
5
16
9
19
3
21
7
24
1
26
5
28
9
31
3
33
7
36
1
38
5
40
9
43
3
45
7
48
1
50
5
52
9
55
3
57
7
60
1
62
5
64
9
67
3
69
7
72
1
74
5
76
9
79
3
81
7
84
1
Dis
tan
ce (
cm)
Time (s)
hc-sr04p, filling, pipe waveguide
0
20
40
60
80
100
120
12
24
36
48
51
06
12
71
48
16
91
90
21
12
32
25
32
74
29
53
16
33
73
58
37
94
00
42
14
42
46
34
84
50
55
26
54
75
68
58
96
10
63
16
52
67
36
94
71
57
36
75
7
Dis
tan
ce (
cm)
Time (s)
hc-sr04p, draining, pipe waveguide

172
JSN-SR04T-2.0
Since the JSN-SR04T-2.0 has a measurement angle of 75 degrees this sensor will
not work in a full-length pipe wave guide. For this reason, the JSN-SR04T-2.0 will
only be tested without pipe wave guide. The Sensor was positioned on the center of
the barrel lid, placed 86 cm above the bottom of the barrel. See figure H.6 and H.7
for the results.
Figure H.6: JSN-SR04T-2.0, filling
Figure H.7: JSN-SR04T-2.0, draining
0
10
20
30
40
50
60
70
80
90
100
1
27
53
79
10
5
13
1
15
7
18
3
20
9
23
5
26
1
28
7
31
3
33
9
36
5
39
1
41
7
44
3
46
9
49
5
52
1
54
7
57
3
59
9
62
5
65
1
67
7
70
3
72
9
75
5
78
1
80
7
83
3
85
9
88
5
91
1
Dis
tan
ce (
cm)
Time (s)
JSN-SR04T-2.0, filling, no waveguide
0
10
20
30
40
50
60
70
80
90
1
19
37
55
73
91
10
9
12
7
14
5
16
3
18
1
19
9
21
7
23
5
25
3
27
1
28
9
30
7
32
5
34
3
36
1
37
9
39
7
41
5
43
3
45
1
46
9
48
7
50
5
52
3
54
1
55
9
57
7
59
5
61
3
63
1
Dis
tan
ce (
cm)
Time (s)
JSN-SR04T-2.0, draining, no waveguide

173
Generic 40 KHz ultrasonic transceiver unit
Since the transceiver unit also has a measurement angle of 75 degrees this sensor
will not work in a full-length pipe wave guide. For this reason, the transceiver unit
will only be tested without pipe wave guide. The Sensor was positioned on the
center of the barrel lid, placed 86 cm above the bottom of the barrel. Placed inside a
3d printed mount. It was found that the mount was too tight for the sensor resulting
in errors. For this reason, the sensor was only tested with draining the barrel to get
a general impression of the sensors performance. See figure H.8 for the result.
Figure H.8: Transceiver unit, draining
Discussion
The tests with the hc-sr04p show that this sensor has less interference when a pipe
wave guide is used. Based on these tests the hc-sr04p and US-100 could be used
for the SRB. Both have overall good results but the measurements with the wave
guide are significantly better than without. The test on the JSN-SR04T-2.0 showed
that this sensor is a reliable without any modifications. This sensor would be the
best fit for the barrel that is used for the prototype, also because it is waterproof.
For a universal sensor module that works on every type of barrel this sensor would
not be the best option because this sensor does not work without modifications in a
pipe wave guide. The Generic 40 KHz ultrasonic transceiver unit showed some very
promising results but is by far not as reliable as the other two sensors. If this sensor
would be used it is important that has the correct mount that does not corrupt the
measurements.
0
10
20
30
40
50
60
70
80
90
100
1
20
39
58
77
96
11
51
34
15
3
17
21
91
21
02
29
24
8
26
72
86
30
53
24
34
3
36
23
81
40
04
19
43
8
45
74
76
49
55
14
53
3
55
25
71
59
06
09
62
8
64
76
66
68
5
Dis
tan
ce (
cm)
Time (s)
Transceiver unit, draining

174
I. Evaluated Requirements Table I.1 gives an overview of the evaluated requirements. This overview was
constructed by assessing the final prototype and validating if the prototype fulfills
the requirements. The requirements that were met are highlighted green and the
requirements that were met under certain conditions are highlighted yellow.
Table I.1: Evaluated requirements
Functional requirements Non-Functional requirements
Must
The system must be able to buffer
water
The system must be durable
The system must work autonomously The system must be robust
The system must be able to measure
the water level in the buffer
The system must be weather proof
The system must be able to drain water
to the sewage system
The system must be reliable
The system must be manually drainable The system must be secure
The system must provide the option to connect the overflow to the garden or
sewage system
The system must be easy to assemble
The system must send the system status to a central data repository
The system’s capacity must be at least 200 liters
The system must use weather
prediction data to regulate the buffer capacity
The system must be safe to use
The system must be able to measure
the water temperature in the buffer
The system must fit in a garden
The system must be able to store
measurement data until it is send to the
central data repository
The system must be modular
The system must drain 2 hours prior
rainfall.
The system must be designed for DIY
The system must support an online
personal monitoring dashboard
The system must require low
maintenance
The system must send the status
information to the central data
repository
The system must be installable by the
user self
The system must filter the water before
it enters the barrel
The system must have a rainwater
overflow
Should
The system should remind the user to
clean the filter
The system should use a wireless
networking technology
The system should indicate if an error
occurred
The system should promote being
environmentally friendly

175
The system should measure the system status every minute
The system should be energy efficient
The system should send the system
status every 15 minutes to the central data repository
The complete system should cost not
more than 250 euro
The system should automatically drain
the water in case of risk for legionella
The user should be able to opt out for
the option to drain water in case of risks for legionella
The system should automatically drain
in case of risk for freezing.
The user should be able to opt out for
the option to drain water in case of
risks for freezing
The system should be able to notify the
user in case of an error.
A bucket should fit underneath the
manual tab
The system should be able to warn the
user about risk for legionella.
The system should communicate with
the central data repository via an API
The system should be able to
automatically drain water to the garden
The system should send planned
discharges to the central data
repository.
Could
The system could only overflow into the
garden between a predefined period of time.
The system could be independent from
the user’s private communication infrastructure.
The system could be configurable via
the central data repository.
The system could be scalable
The system could still function for a few
days if the network connection fails.
The system could be setup via a web
interface in the to be developed user
dashboard.
The system should be upgradable with
extra control or sensor modules
Would
The system would support over-the-air (OTA) software updates.
There would be two versions of the system, the basic and extended
version.
The system would have a self-sufficient power source (e.g. solar/battery
combination)
The system would have predefined holes for the installation of parts in the
DIY assembly process.
The system would not require a software setup process by the user.