faculty of health sciences / department of community
TRANSCRIPT

!
!! !
Faculty of health sciences / Department of community medicine
Prevalence and cause of Dyspnea in a general population: The Tromsø Study !Prasanna Karki HEL-3950 Master’s thesis in Public Health September 2015 Supervisor: Professor Henrik Schirmer Co- supervisor: Professor Hasse Melbye

!

!!!
! i!
PREFACE
This dissertation is original, unpublished, independent work submitted for the degree of Master in
Public Health at The Artic University of Norway. The described project Prevalence and cause of
dyspnea in general population was conducted under the supervision of Professor Henrik Schirmer in
the Department of Clinical Medicine and co-supervision of Professor Hasse Melbye in the General
Practice Research Unit.
This work is to the best of my knowledge original, except where literature review and references are
made to previous work. This dissertation has not been or is being submitted to any other degree or
qualification at any other university.
I would like to express my sincere gratitude to my supervisor and co-supervisor for their continuous
supervision, advices, feedback and guidelines. This project would never have been done without their
expertise and support. Also, I am very grateful to Department of community medicine, The Artic
University of Norway for equipping me with valuable learning tools and warm support during my
study period.
Finally, I would like to thank my family and my friend Sanjit Jung Thapa for their moral support and
constant believing in me.

!!!
! ii!
!
!
!
!
!
!
!
!
!
!
!
!
!
!
!
!

!!!
! iii!
ABSTRACT
Background: Dyspnea is a prevalent condition causing reduced quality of life increasingly by age.
The main causes are heart failure (HF), chronic obstructive pulmonary disease (COPD) with less
common conditions being ischemic dyspnea, heart disease, atrial fibrillation, asthma, and pulmonary
fibrosis. The aim of study was to determine causes of dyspnea in a general population through
examination with echocardiography and spirometry and determine age and gender specific prevalence
of each condition.
Methods: This population based cross-sectional study included 11812 (46.9% were men) participants
with answered questionnaire data on dyspnea from the sixth survey of Tromsø study. Independent-
sample T-test (for continuous variables) and Chi-square test (for categorical variables) were used to
explore significant difference in participant´s characteristics between men and women. Differences
between groups were compared with ANOVA for continuous variable and logistic regression
(univariate / multivariable analysis) was performed with dyspnea along demographic and baseline
characteristics, COPD, restrictive disease and spirometry and echocardiography measurement group.
Results: Overall 48.6% of the total participants reported dyspnea. Among participants with moderate
COPD prevalence of dyspnea was 67.3% for men and 75% for women. The prevalence of enlarged
LAD/BSA increased from 15% in subjects without self-reported dyspnea to 30% in moderate dyspnea
without further increase with increasing severity. Only 25.2% of the participants reporting dyspnea
symptoms had abnormal measurements. Among them only 43.6% of male subjects reporting dyspneic
symptoms had abnormal measurements compared to 56.4% of women reporting dyspneic symptoms.
Increase in severity of COPD was associated with increased prevalence of dyspnea. Moderate COPD
[OR=2.6; 95% CI: 1.5-4.5] and severe COPD [OR=9.4; 95% CI: 2.0-44.7] were significantly
associated with increased prevalence of dyspnea.
Conclusion: Our study shows a strong association between self-reported dyspnea and diastolic heart
failure, restrictive pulmonary disease and increasing levels of COPD.
Keywords: Dyspnea, heart failure, COPD, Prevalence, echocardiography, spirometry

!!!
! iv!
!!!!!!!!!!!!!!!!!!!!!!!!!!!!
!
!
!!!!!!!!!!!

!!!
! v!
TABLE OF CONTENTS
PREFACE ................................................................................................................................................ I ABSTRACT ......................................................................................................................................... III
LIST OF FIGURES ............................................................................................................................. VI LIST OF TABLES ............................................................................................................................... VI
LIST OF ABBREVIATIONS ............................................................................................................ VII 1.BACKGROUND .................................................................................................................................. 1
1.1 CONGESTIVE HEART FAILURE .......................................................................................................... 2 1.2 CORONARY HEART DISEASE (CHD) ................................................................................................. 3 1.3 CHRONIC OBSTRUCTIVE PULMONARY DISEASE (COPD) .................................................................. 4
2. RATIONALE OF THE STUDY ....................................................................................................... 7
3. PURPOSE OF THE STUDY ............................................................................................................. 9 3.1 GENERAL OBJECTIVE ....................................................................................................................... 9 3.2 SPECIFIC OBJECTIVES ....................................................................................................................... 9
4. MATERIALS AND METHODS ..................................................................................................... 11 4.1 STUDY DESIGN ............................................................................................................................... 11 4.2 STUDY AREA .................................................................................................................................. 11 4.3 STUDY POPULATION AND STUDY PERIOD ....................................................................................... 11 4.4 DATA COLLECTION ........................................................................................................................ 11 4.5 STUDY VARIABLES ......................................................................................................................... 12 A) DYSPNEA ...................................................................................................................................... 12 B) SPIROMETRY ................................................................................................................................ 12 C) CHRONIC OBSTRUCTIVE PULMONARY DISEASE (COPD) .............................................................. 13 D) ECHOCARDIOGRAPHY .................................................................................................................. 13 E) INDEPENDENT VARIABLES ........................................................................................................... 14 4.6 DATA ANALYSIS ............................................................................................................................ 14
5. ETHICAL CONSIDERATION ...................................................................................................... 17
6. RESULTS .......................................................................................................................................... 19 7. DISCUSSION .................................................................................................................................... 33
8. CONCLUSION ................................................................................................................................. 37 9. RECOMMENDATION ................................................................................................................... 39
10. REFERENCES ............................................................................................................................... 41 11. APPENDICES ................................................................................................................................ 47
APPENDIX 1 ......................................................................................................................................... 48 APPENDIX 2 ......................................................................................................................................... 50
!

!!!
! vi!
LIST OF FIGURES
Figure 1: Profile of the study population used in analysis ..................................................................... 15
Figure 2: Proportion with no, mild, moderate, severe and very severe self-reported dyspnea distributed
across 10 years age group ............................................................................................................... 21
Figure 3: Proportion of total with each sex with no, mild, moderate, severe and very severe self-
reported dyspnea distributed across 10 years age .......................................................................... 22
LIST OF TABLES
Table 1: Demographic and baseline characteristic of men and women in the study population ........... 20
Table 2: Observed prevalence of self-reported dyspnea in the study population of men and women
stratified by lung function by spirometry ....................................................................................... 24
Table 3: Observed prevalence of self-reported dyspnea in the study population categorized by level of
Left atrium size ............................................................................................................................... 25
Table 4: Prevalence of self-reported dyspnea in the study population with Spirometer and
Echocardiography measurements ................................................................................................... 27
Table 5: Univariate and multivariate analysis of demographic factor associated with prevalence of
dyspnea (Yes/No) ........................................................................................................................... 29
Table 6: Univariate and multivariate analysis of level of COPD, Restrictive disease and spirometer and
echocardiography measurements group associated with prevalemce of dyspnea (Yes/No) with age
and sex adjustment. ........................................................................................................................ 30
Table 7: Demographic and baseline characteristics in study population stratified by measurement
group ............................................................................................................................................... 48
Table 8: Demographic and baseline characteristics in study population with and without dyspnea
stratified by normal and abnormal measurement group ................................................................. 50
!!!
! vii!
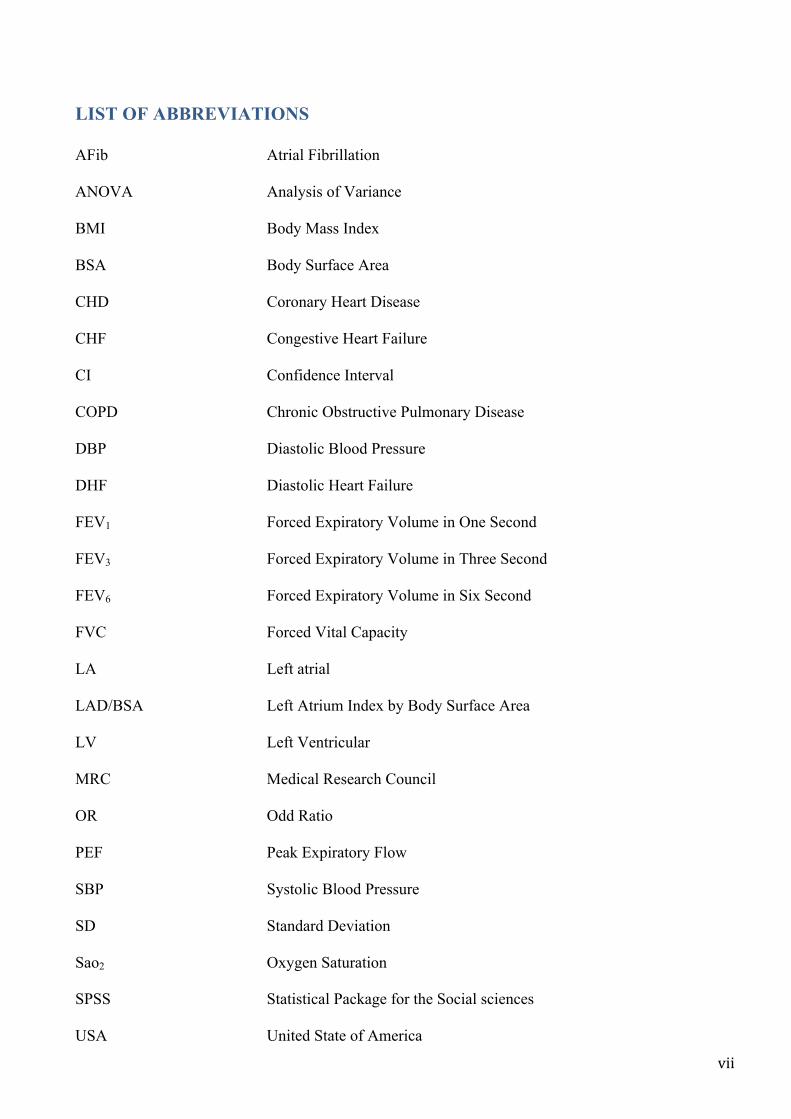
LIST OF ABBREVIATIONS
AFib Atrial Fibrillation
ANOVA Analysis of Variance
BMI Body Mass Index
BSA Body Surface Area
CHD Coronary Heart Disease
CHF Congestive Heart Failure
CI Confidence Interval
COPD Chronic Obstructive Pulmonary Disease
DBP Diastolic Blood Pressure
DHF Diastolic Heart Failure
FEV1 Forced Expiratory Volume in One Second
FEV3 Forced Expiratory Volume in Three Second
FEV6 Forced Expiratory Volume in Six Second
FVC Forced Vital Capacity
LA Left atrial
LAD/BSA Left Atrium Index by Body Surface Area
LV Left Ventricular
MRC Medical Research Council
OR Odd Ratio
PEF Peak Expiratory Flow
SBP Systolic Blood Pressure
SD Standard Deviation
Sao2 Oxygen Saturation
SPSS Statistical Package for the Social sciences
USA United State of America

!!!
! viii!
WHO World Health Organization
!
!!!!!!!

!!!
! 1!
1.BACKGROUND
Dyspnea is a prevalent condition causing reduced quality of life increasingly by age and is a common
problem affecting up to half of patients admitted to acute, tertiary care hospitals (1) and one quarter of
ambulatory patients (2, 3). Clinicians use the term dyspnea, while patients rather describe it with terms
such as breathlessness, shortness of breath, chest tightness, and air hunger or as increased effort of
breathing (4). These different terms indicate that defining dyspnea (5) is complex and will vary
between patients. Extensive research has been done on the pathophysiological aspects of dyspnea, but
to date, the precise physical mechanism of breathlessness is unclear (6). And, although the affective
contribution to a perception of breathlessness has been examined, the nature of its contribution to
dyspnea has been difficult to find (6). When dyspnea occurs at rest or during mild to moderate
exertion, it is considered pathologic and a symptom of disease state (7). The presence of dyspnea
predicts long-term mortality (8) and characterizes high-prevalence diseases like congestive heart
failure (CHF), ischemic heart disease, chronic obstructive pulmonary disease (COPD), and asthma.
There are numerous causes of dyspnea although patients diagnosed within respiratory and
cardiovascular disease account for approximately two-third of all cases (9). The prevalence of dyspnea
has varied greatly across studies and countries (10-12). The variation might be due to differences in the
distribution of known correlates of dyspnea such as age, sex and smoking status (10, 12, 13). But
differences might also reflect variation in how dyspnea was measured; the nature of the samples
studied and the burden of chronic disease that cause dyspnea. Dyspnea is extremely common with
advancing disease, and at late stages is present in 90-95% of those with COPD, 60-80% of those with
CHF and 10-70% of those with cancer, whilst also being common in end-stage kidney disease and
most severe in primary lung cancers, affecting 90% (14). Prevalence of dyspnea varies among clinical
settings and patient subgroups; in the community 3% to 25%, outpatient clinics 3.7%, emergency
rooms 2.7%, and at hospital admissions 15% to 25% (15). Population-based studies have shown a
prevalence of 9 to 13% for mild to moderate dyspnea among community-residing adults (8, 16, 17), 15

!!!
! 2!
to 18% among community-residing adults aged 40 years or older (16, 18, 19), and 25 to 37% of adults
aged 70 years and older (20). Other population-based studies have reported an overall dyspnea
prevalence of more than 20% (2, 10, 12, 21). A high- prevalence of cardiopulmonary disease, life-style
changes, obesity and subclinical medical conditions might have explained this dyspnea. Several other
factors associated with increased prevalence include older age, obesity, smoking, low socio-economic
status and female gender (15). About 60% of those presenting with dyspnea are aged 65 years or more
(22). However, dyspnea remains difficult to evaluate, especially in an elderly population, because of
its subjective nature and the small margin between disease and physical deconditioning due to ageing
(23). Therefore, the reported prevalence of dyspnea in the community seems to vary widely ranging
from 20 to 60% in elderly populations (15). Cardiac and pulmonary etiology was most frequent,
usually in the form of congestive heart failure, asthma or chronic obstructive lung disease (15). More
attention to dyspnea, including its early detection, may be important for a variety of reasons: dyspnea
is a common complaint (24-26) with a marked negative influence on daily functioning and quality of
life (5, 26), acute or severe dyspnea requires prompt and adequate pharmacological intervention (27)
and it is an important contributor to mortality (5, 25). Early evaluation of dyspnea can have a positive
influence on the patient’s functional condition, thus promoting and prolonging an active and
independent lifestyle (28). Hence, the prevalence and limits to exertion caused by dyspnea needs to be
defined across the whole population irrespective of health service utilization (17).
1.1 Congestive heart failure
With increasing life expectancy, heart failure has become an increasing health problem in
industrialized countries (29). Heart failure was earlier understood as pump failure or left ventricular
(LV) systolic dysfunction, but several studies found that several patients admitted with heart failure
had normal systolic function (30-32) and were labeled as heart failure patients with normal LV systolic
function, later on defined as separate entity as Diastolic heart failure (DHF) (33). This group consisted
of elderly, obese and hypertensive patients (33), mostly with delayed left ventricular relaxation and

!!!
! 3!
also some with decreased left ventricular compliance and consequently reduced filling dynamics and
increased left ventricular end-diastolic pressure (34). In earlier studies DHF was presumed to account
approximately one-third of all patients with heart failure (35) but over the last two decades, these
perspective have changed substantially with an increase in the prevalence of DHF from 38% to 54% of
all heart failure cases (35). Patients with acute dyspnea are present in emergency departments and
intensive care units every day. Acute dyspnea is mostly due to potentially life-threatening cardiac or
respiratory conditions, and treating it promptly requires understanding of the underlining mechanism
(36). Patients with heart failure are frequently limited in their activities of daily living by exertion
dyspnea. One hypothesis for dyspnea is that the reduced cardiac output that occurs during exercise in
patients with heart failure results in respiratory muscle ischemia and ultimately, respiratory muscle
fatigue (37). Depending on the hospital setting, acute heart failure accounts for 30% to 70% of acute
dyspnea in the emergency departments (36). Quick identification of acute heart failure remains crucial
and lifesaving, and may lead to prompt admission of the patients in a specialized cardiovascular
intensive care unit. A simple and quick way of differentiating cardiac and pulmonary causes of
dyspnea is essential in patients admitted to the emergency departments and should be based on routine
procedure. In practice, medical history, symptoms, physical examination, chest x-ray,
electrocardiogram and, more recently, blood B-type natriuretic peptide values are useful tools for
detecting acute heart failure in patients presenting with acute dyspnea (36). Heart failure is then
confirmed by echocardiography.
1.2 Coronary heart disease (CHD)
The prevalence of coronary heart disease (CHD) increases with increasing age. However, in many
developed countries, CHD mortality has decreased during the last two decades (38). Symptomatic
presentation of CHD varies widely. Individuals with CHD present both with and without symptoms
(39). Dyspnea may be the only symptom of CHD but may also precede angina pectoris as a
manifestation of CHD in 10-15% of referred cases (40). For symptomatic patients, dyspnea has been
considered as an angina equivalent on the basis of increased prevalence and severity of myocardial

!!!
! 4!
ischemia and heightened mortality risk compared to asymptomatic patients or symptomatic patients
with non-cardiac or atypical angina (39). Recently, the prognostic relationship between dyspnea and
CHD in individuals undergoing non-invasive CHD testing has been observed, although the
pathophysiologic mechanism that underline adverse prognosis as a function of dyspnea has been to
date poorly understood (39). The potential mechanisms explaining the relationship of dyspnea to
obstructive CHD have been little examined (39). In a series of elegant experiments, Pepine et al. (41)
demonstrated that myocardial ischemia-induced left ventricular dysfunction perpetuates increased left
ventricular end-diastolic pressure, which in turn increases lung airway resistance and reduced lung
compliance and thereby causes dyspnea.
1.3 Chronic obstructive pulmonary disease (COPD)
As COPD progresses, many individuals experience frequent acute exacerbations of incapacitating
dyspnea requiring emergency admission to hospital (6). Dyspnea is one of the most common
symptoms in chronic obstructive lung disease and it is invariably present in all severity stages either at
rest or under conditions of exercise (42). Breathing difficulty is the major reason that patients with
COPD seek medical attention. A variety of studies have demonstrated that patients with different
respiratory disease report unique descriptors of their dyspnea (43). In particular, patient with COPD
describe their breathlessness as related to the work and effort associated with breathing (43). In
addition, patients with COPD responded that their breathing difficulty was perceived more frequently
during inspiration rather than during expiration (4). Despite the wide range of available treatment, as
many as 50% (42) of all patients with COPD presents with shortness of breath. In a study Rennard et
al. (44) reported that more than 50% of respondents to a telephone survey with COPD reported that
dyspnea limited sports and recreation activities as well as normal physical exertion and about 40%
indicated that their breathing affected their ability to perform household chores. Several cross-sectional
studies have reported the a prevalence of dyspnea in population samples of respondent’s self-reporting
diagnosis of COPD, chronic bronchitis or with airflow limitation identified using spirometry screening
(45). However, there is limited information about the occurrence, distribution and outcomes associated

!!!
! 5!
with dyspnea among patients with diagnosed COPD who are managed in primary care (45). A cross-
sectional study of COPD patients selected from primary care offices in several European countries
reported an 80% prevalence of dyspnea (46). However, these data are from a selective group of
patients and it was not possible to show an association with prospectively evaluated outcomes (46).

!!!
! 6!

!!!
! 7!
2. RATIONALE OF THE STUDY
Dyspnea is a very common symptom and persistent shortness of breath can interfere greatly with
quality of life (23). Dyspnea is a key target in both clinical management and clinical trials of acute
heart failure syndrome and lung disease and its relief important to patients, clinicians, investigators,
and regulatory approval agencies (17). Despite its importance, the impact of early therapy on dyspnea
is not well known. Extensive research has been done on the pathophysiological aspects of dyspnea, but
to date, the precise physical mechanism of breathlessness is unclear (17). And, although the affective
contribution to a perception of breathlessness has been examined, the nature of its contribution to
dyspnea has been difficult to find. Therefore, accurate diagnosis and a greater awareness and
understanding of modulating factor can facilitate targeted treatment of dyspnea and subsequently
dramatically improve clinical conditions (15).
!!!!

!!!
! 8!

!!!
! 9!
3. PURPOSE OF THE STUDY
3.1 General objective
To explore the prevalence and causes of dyspnea in a general population
3.2 Specific objectives
a) To explore whether dyspnea differ in general characteristic from those not reporting dyspnea.
b) To assess to what extent the dyspnea is related to cardiac or respiratory measures of disease.
!!!!!!!!!

!!!
! 10!

!!!
! 11!
4. MATERIALS AND METHODS
4.1 Study design
Population based cross sectional study
4.2 Study area
The Tromsø study consists of six surveys (referred to as Tromsø 1-6) that have been conducted in the
municipality of Tromsø from 1974 to 2008. The Tromsø study population includes subjects who have
attended at least one of the six surveys. The sixth survey of the Tromsø study (Tromsø 6) was used for
this study.
4.3 Study population and Study period
The study population consisted of all men and women aged 30-87 from the sixth survey of the Tromsø
study (Tromsø 6). It was conducted in 2007-08. During the Tromsø 6 study, a total of 12984 men and
women aged 30-87 took part. Finally, after excluding all the non-eligible participants with missing
questionnaire data on dyspnea 11812 participants were included. Within this group, 1764 Subjects had
both been examined by spirometry and echocardiography enabling estimation of prevalence of signs of
cardiac and pulmonary disease among those reporting dyspnea.
4.4 Data collection
The residents of the municipality of Tromsø were invited to take part in the survey based on the
official population registry. Data in Tromsø 6 study were collected in two visits. A personal invitation
was mailed and subjects were free to attend whenever suitable. Information about the survey and the
examination was included in the invitation leaflet. Non-attendees were given one reminder.
Participants eligible for the second-visit examinations were identified before they were to attend the
first visit of the survey and were invited to the second-visit examination 2-4 weeks after the
completion of first visit.

!!!
! 12!
4.5 Study variables
a) Dyspnea
The participants were asked about their perceived breathlessness and were then classified into MRC
dyspnea grades, according to how they perceived their disability (47).
No dyspnea: Patient-complaining no breathlessness.
Mild dyspnea: Patient-complaining discomfort in breathing with ordinary physical activities i.e.
discomfort when walking rapidly on level ground or up a moderate slope.
Moderate dyspnea: Patient-complaining discomfort in breathing after walking 100 yards or after a few
minutes on the level.
Severe dyspnea: Patient-complaining discomfort in breathing with less than ordinary physical
activities i.e. walking calmly on level ground or washing and dressing.
Very severe dyspnea: Patient- complaining discomfort in breathing at rest.
b) Spirometry
The participant’s lungs function was measured by spirometry. The following measurements were
normalized according to gender, age and height.
FEV1, FVC and FEV1/FVC. To ensure quality of measurements following measurement was also
included: FEC, FEV75%, PEF, FEV3 and FEV6.
Predicted FEV1 and FVC were calculated using the formula (48):
Predicted FEV1
Men: exp (-10.556+2.342*Ln (height)-0.0000685*age*age)
Women: exp (-9.091+2.004*Ln (height)-0.000163*age*age+0.007237* age)
Predicted FVC
Men: exp (-12.396+2.733*Ln (height)-0.0000592*age*age)
!!!
! 13!
Women: exp (-9.851+2.189*Ln (height)-0.000163*age*age+0.007237*age)
Thereafter, % predicted FEV1 and FVC for men and women was calculated as,
[Measured (FEV1)/Predicted (FEV1)]*100 and [measured (FVC)/Predicted (FVC)]*100 respectively.
Spirometer (with obstructive pattern) was indicated normal if FEV1/FVC ≥ 0.7 and FEV1 ≥ 80% or
FVC ≥ 80% predicted and was indicated abnormal if FEV1/FVC < 0.7 was recorded.
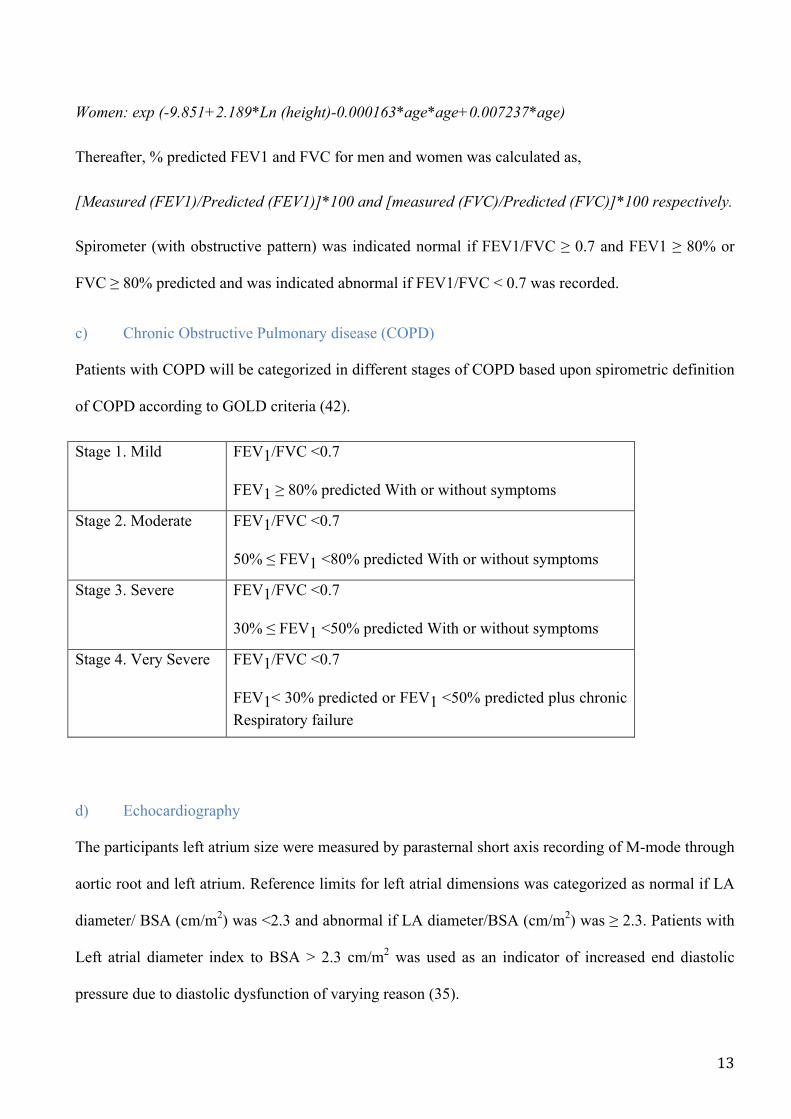
c) Chronic Obstructive Pulmonary disease (COPD)
Patients with COPD will be categorized in different stages of COPD based upon spirometric definition
of COPD according to GOLD criteria (42).
Stage 1. Mild FEV1/FVC <0.7
FEV1 ≥ 80% predicted With or without symptoms
Stage 2. Moderate FEV1/FVC <0.7
50% ≤ FEV1 <80% predicted With or without symptoms
Stage 3. Severe FEV1/FVC <0.7
30% ≤ FEV1 <50% predicted With or without symptoms
Stage 4. Very Severe FEV1/FVC <0.7
FEV1< 30% predicted or FEV1 <50% predicted plus chronic Respiratory failure
d) Echocardiography
The participants left atrium size were measured by parasternal short axis recording of M-mode through
aortic root and left atrium. Reference limits for left atrial dimensions was categorized as normal if LA
diameter/ BSA (cm/m2) was <2.3 and abnormal if LA diameter/BSA (cm/m2) was ≥ 2.3. Patients with
Left atrial diameter index to BSA > 2.3 cm/m2 was used as an indicator of increased end diastolic
pressure due to diastolic dysfunction of varying reason (35).

!!!
! 14!
e) Independent variables
Baseline demographic characteristics: age, sex, measurements, self-reported disease, smoking, alcohol,
exercise and education.
Age was divided into 6 groups: 30-3, 40-49, 50-59, 60-69, 70-79 and ≥ 80 years. Measurements such
as systolic blood pressure, diastolic blood pressure, body mass index, oxygen saturation (Sao2),
cholesterol, glucose and heart rate was recorded. For systolic and diastolic blood pressure
measurement 3 reading was recorded and the mean of reading 2 and 3 was used in the analysis. Body
mass index was categorized according to WHO criteria as normal, overweight and obese if
BMI<25kg/m2, BMI 25-2925kg/m2 and BMI≥ 30kg/m2 respectively (49). The participants reported
any presence of diabetes, heart attack, atrial fibrillation, angina, asthma and bronchitis were included
as self-reported disease. Smoking habits were reported as: never, former or current smokers. Similarly,
alcohol intake of participants was categorized as: never, monthly or weekly. The participants exercise
level was recorded and categorized into three groups: easy, (you do not become short-winded or
sweaty) moderate (you become short-winded or sweaty) and hard exercise level (you become
exhausted). The participants’ educational level was categorized into five groups: Primary/secondary
school or modern secondary school, Technical school/vocational school/1-2 years senior high school,
High school diploma, College/university less than 4 years and College/university 4 years or more.
4.6 Data analysis
Data analyses were performed using SPSS version 21.0 (SPSS Inc., Chicago, IL. USA). Presence of
normalcy was evaluated for each continuous variable. Independent-sample T-test (for continuous
variables) and Chi-square test (for categorical variables) were used to explore significant difference in
participant´s characteristics between men and women. All the demographic and baseline
characteristics were used as independent variables in the analysis. Differences between groups were
compared with ANOVA for continuous variable adjusting for age. Furthermore, a dichotomous
variable dyspnea (present/absence) was made and logistic regression (univariate / multivariable

!!!
! 15!
analysis) was performed with dyspnea along demographic and baseline characteristics, COPD,
restrictive disease and spirometer and echocardiography measurement group to explore the significant
association between them. The graphical method was used, where the bar graph indicates the age
distribution of prevalence of dyspnea between men and women.
!Figure 1: Profile of the study population used in analysis

!!!
! 16!
!!!!!!!!!!!!!!!!!!!!!!!!!!!!!!!!!!!!!!!!!!

!!!
! 17!
5. ETHICAL CONSIDERATION
The Regional Committee on Research Ethics North Norway approved this project for the Tromsø 6
Survey.
!!!!!
!

!!!
! 18!

!!!
! 19!
6. RESULTS
Demographic and baseline characteristics
The baseline and demographic characteristics of men and women are summarized in Table 1. Men
constitute 46.9% of the total sample and the mean age was 57.2 years for men and 57.4 years for
women. The mean systolic and diastolic blood pressure was 137.7 and 81.1 mmHg for men and 133.4
and 74.8 mmHg for women (p value <0.001). The mean body mass index was 27.2 kg/m2 for men and
26.5 kg/m2 for women (p value <0.001) .The proportion of Obesity was 20.3 % among men and 20%
among women and proportion of overweight was 51.6% among men and 38.3% among women. Mean
oxygen saturation (SaO2) was 97.1 for men 97.5 for women (p value <0.001). Mean total serum
cholesterol level was 5.5mmol/l for men and 5.6mmol/l for women (p value <0.001), while the mean
glucose level was 5.7mmol/l for men and 5.3mmol/l for women (p value <0.001). Among the self-
reported diseases, asthma (8.6%) and heart attack (8.2%) was more prevalent among men and asthma
(11%) was more prevalent among women. Overall 46.8% of the total participants reported dyspnea.
Among men who reported dyspnea 38.9%, 1.3%, 2.5% and 1.4% had mild, moderate, severe and very
severe dyspnea respectively compared to 42.3%, 1.7%, 2.8% and 2.5% of women with self-reported
dyspnea. A significantly higher proportion of men compared to women reported former or current
daily smoking. Alcohol intake was higher among men compared to women. Men were more physically
active than women. Men had higher educational level than women especially regarding technical or
vocational school and lower degree university school (less than 4 years).

!!!
! 20!
Table 1: Demographic and baseline characteristic of men and women in the study population
Characteristics Total Men Women P value Valid n (%) 11812 5537 (46.9) 6275 (53.1) Age in years (SD) 57 (12.6) 57.4(12.2) 57.2(12.9) < 0.001 Measurements Mean SBP (SD) 135.4 (22.9) 137.7 (20.3) 133.4 (24.8) < 0.001 Mean DBP (SD) 77.7 (10.6) 81.1 (10.1) 74.8 (10.2) < 0.001 BMI kg/m2 (SD) BMI kg/m2 category BMI<25 n (%) BMI 25-29 n (%) BMI ≥ 30 n (%)
26.9 (4.2) 4264 (35.3) 5255 (44.5) 2380 (20.2)
27.2 (3.8) 1556 (28.1) 2853 (51.6) 1125 (20.3)
26.5 (4.7) 2608 (41.6) 2402 (38.3) 1255 (20)
< 0.001 < 0.001
SaO2 (SD) 97.3 (2.1) 97.1(2.1) 97.5 (2.1) < 0.001 Cholesterol (SD) 5.6 (1) 5.5 (1) 5.6 (1.1) < 0.001 Glucose (SD) 5.5 (1.5) 5.7 (1.6) 5.3 (1.3) < 0.001 Heart rate (SD) 65.5 (10.7) 64.5 (11) 66.4 (10.3) < 0.001 Self-reported disease Diabetes n (%) 557 (4.8) 296 (5.5) 261 (4.3) 0.003 Heart attack n (%) 616 (5.3) 447 (8.2) 169 (2.8) < 0.001 AFib n (%) 658 (5.8) 352 (6.6) 306 (5.1) 0.001 Angina n (%) 552 (4.8) 329 (6.1) 223 (3.6) < 0.001 Asthma n (%) 1136 (9.8) 463 (8.6) 673 (11) < 0.001 Bronchitis n (%) 503 (4.4) 226 (4.2) 277 (4.5) 0.3 Level of self-reported Dyspnea < 0.001 No n (%) Mild n (%) Moderate n (%) Severe n (%) Very severe n (%)
6284 (53.2) 4811 (40.7) 177 (1.5) 303 (2.6) 237 (2)
3092 (55.8) 2156 (38.9) 70 (1.3) 139 (2.5) 80 (1.4)
3192 (50.9) 2655 (42.3) 177 (1.7) 164 (2.6) 157 (2.5)
Smoking Never n (%) Former n (%) Current n (%)
4363 (37.4) 4934 (42.3) 2355 (20.2)
1860 (33.9) 2577 (47.0) 1043 (19.0)
2503 (40.6) 2357 (38.2) 1312 (21.3)
< 0.001
Alcohol Never n (%) Monthly n (%) Weekly n (%)
5786 (52.4) 5021 (45.5) 240 (2.2)
1849 (35) 3244 (61.4) 190 (3.6)
3937 (68.2) 1777 (30.8) 50 (1)
< 0.001
Exercise level Easy n (%) Moderate n (%) Hard n (%)
4978 (46.8) 5321 (50) 346 (3.3)
2167 (42.9) 2650 (52.5) 230 (4.6)
2811 (50.2) 2671 (47.7) 116 (2.1)
< 0.001

!!!
! 21!
Education level 1 n (%) 2 n (%) 3 n (%) 4 n (%) 5 n (%)
3267 (28.0) 3038 (26.1) 862 (7.4) 2087 (17.9) 2406 (20.6)
1335 (24.4) 1541 (28.2) 390 (7.1) 1147 (21.0) 1059 (19.4)
1932 (31.2) 1497 (24.2) 862 (7.6) 940 (15.2) 1347 (21.8)
< 0.001
Values are mean with standard deviation (SD), or number n with percentage of column (%) BMI (Body Mass Index); SBP (Systolic blood pressure); DBP (Diastolic blood pressure) AFib (Atrial fibrillation); SaO2 (Oxygen Saturation) Education level: 1 (Primary/secondary school, modern secondary school) 2 (Technical school, vocational school, 1-2 years senior high school) 3 (High school diploma) 4 (College/university less than 4 years) 5(College/university 4 years or more) In figure 2 and 3 the bar graph shows the proportion of total with no, mild, moderate, severe and very
severe self-reported dyspnea distributed across 10 years age group and with each sex. Self reported
dyspnea increased with increasing age.
!Figure 2: Proportion with no, mild, moderate, severe and very severe self-reported dyspnea distributed
across 10 years age group
!!!
! 22!
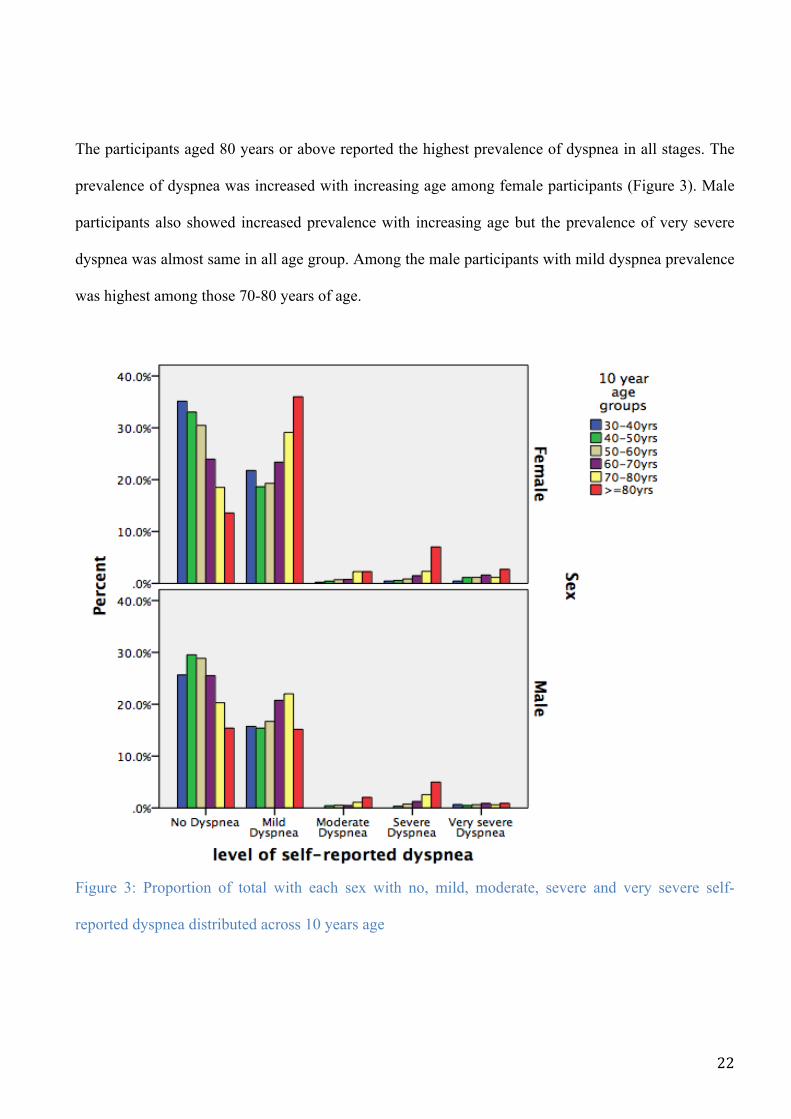
The participants aged 80 years or above reported the highest prevalence of dyspnea in all stages. The
prevalence of dyspnea was increased with increasing age among female participants (Figure 3). Male
participants also showed increased prevalence with increasing age but the prevalence of very severe
dyspnea was almost same in all age group. Among the male participants with mild dyspnea prevalence
was highest among those 70-80 years of age.
!Figure 3: Proportion of total with each sex with no, mild, moderate, severe and very severe self-
reported dyspnea distributed across 10 years age
!

!!!
! 23!
Prevalence of dyspnea
Among men 23.4% had COPD and 6.2% had restrictive lung disease compared to 16.7% and 5.6% in
women (Table 2). Among the participants with obstructive lung disease prevalence of dyspnea was
higher among women compared to men (p value <0.001). With mild COPD, the prevalence of dyspnea
was 50.5% for men and 57.5% for women. Among participants with moderate COPD prevalence of
dyspnea was 67.3% for men and 75% for women. The prevalence of mild dyspnea was higher among
participants with obstructive lung disease. The prevalence of mild dyspnea was 44.5%, 56.3%, 55.8%
and 27.3% for men and 49.8%, 59.5%, 57.2% and 33.3% for women with mild, moderate, severe and
very severe COPD respectively. Also, with restrictive lung disease prevalence of dyspnea was higher
among women compared to men. Men with restrictive lung disease 65.7% reported dyspnea and
women with restrictive lung disease 79% reported dyspnea. Most of these reported, mild dyspnea both
in men 62.3% and women 67.7%. The prevalence of self-reported dyspnea categorized by level of left
atrium diameter index by body surface area (LAD/BSA) is summarized in table 3. 18.6% of the
participants had LAD/BSA above the normal upper reference limit of ≥2.3 cm/m2. For these subject
the prevalence of mild dyspnea was 20.9%, moderate dyspnea was 30%, severe dyspnea was 29.3%
and very severe dyspnea 30.3% (p for trend <0.001). The prevalence of enlarged LAD/BSA increased
from 15% in subjects without self-reported dyspnea to 30% in moderate dyspnea without further
increase with increasing severity.

!!!
! 24!
Table 2: Observed prevalence of self-reported dyspnea in the study population of men and women stratified by lung function by spirometry
Self-reported dyspnea
Total
Lung function by spirometry
Normal Mild COPD Moderate COPD
Severe COPD
Very severe COPD
Restrictive Lung Disease
Men valid n (%) 2488 1753 (70.4) 234 (9.4) 293 (11.8) 43 (1.8) 11 (0.4) 154 (6.2) Women valid n (%) 3264 2534 (77.7) 233 (7.1) 279 (8.5) 35 (1.0) 3 (0.1) 180 (5.6) No dyspnea Men n (%) Women n (%)
1294 (52) 1492 (45.8)
1026 (58.5) 1279 (50.5)
116 (49.5) 99 (42.5)
96 (32.7) 70 (25)
3 (7) 5 (14.2)
0 (0) 1 (33.3)
53 (34.3) 38 (21)
Mild dyspnea Men n (%) Women n (%)
1051 (42.3) 1508 (46.2)
659 (37.5) 1083 (42.7)
104 (44.5) 116 (49.8)
165 (56.3) 166 (59.5)
24 (55.8) 20 (57.2)
3 (27.3) 1 (33.3)
96 (62.3) 122 (67.7)
Moderate dyspnea Men n (%) Women n (%)
36 (1.4) 75 (2.2)
15 (1) 48 (2)
3 (1.3) 3 (1.2)
12 (4) 13 (4.7)
4 (9.4) 4 (11.4)
1 (9) 0 (0)
1 (1) 7 (4)
Severe dyspnea Men n (%) Women n (%)
75 (3) 98 (3)
30 (1.7) 55 (2.1)
8 (3.5) 10 (4.3)
17 (6) 19 (6.8)
11 (25.5) 6 (17.2)
7 (63.7) 1 (33.3)
2 (1.2) 7 (4)
Very severe dyspnea Men n (%) Women n (%)
32 (1.3) 91 (2.8)
23 (1.3) 69 (2.7)
3 (1.2) 5 (2.2)
3 (1) 11 (4)
1 (2.3) 0 (0)
0 (0) 0 (0)
2 (1.2) 6 (3.3)
P sex difference <0.001 COPD (Chronic Obstructive Pulmonary Disease); Normal (FEV1/FVC ≥ 0.7 and FEV1≥80%predicted and FVC≥80%predicted); Mild (FEV1/FVC < 0.7 and FEV1 ≥ 80% predicted); Moderate (FEV1/FVC < 0.7 and 50% ≤ FEV1<80% predicted); Severe (FEV1/FVC < 0.7 and 30% ≤ FEV1<50% predicted); Very severe (FEV1/FVC < 0.7 and FEV1<30 % predicted); Restrictive disease (FEV1/FVC ≥ 0.7 and FEV1 <80% or FVC < 80% predicted

!!!
! 25!
Table 3: Observed prevalence of self-reported dyspnea in the study population categorized by level of Left atrium size
LA diameter/BSA (cm/m2)
Total
Self-Reported Dyspnea P value
No Dyspnea
Mild Dyspnea
Moderate Dyspnea
Severe Dyspnea
Very severe Dyspnea
Valid n (%) 2029 959 (47.3) 929 (45.8) 50 (2.5) 58 (2.9) 33 (1.6) < 2.3 n (%) 1652 (81.4) 818 (85.3) 735 (79.1) 35 (70.0) 41 (70.7) 23 (69.7) < 0.001 ≥ 2.3 n (%) 377 (18.6) 141 (14.7) 194 (20.9) 15 (30) 17 (29.3) 10 (30.3) BSA (Body Surface Area) LA (Left atrial)
!!!
! 26!
Table 4 summarizes the prevalence of self-reported dyspnea according to spirometer and
echocardiography measurements. Among the participants with both spirometric and echocardiographic
measurement 12.5% had only abnormal echocardiography, 20.9% had only abnormal spirometer and
5.6% had both abnormal spirometry and echocardiography. The prevalence of self-reported dyspnea
was higher among participants with abnormal spirometer compared to all other groups. Among the
participants reporting mild, moderate, severe and very severe dyspnea 25.2%, 34.1%, 35.6% and
20.8% respectively had abnormal spirometry measurement. Similarly, among the participants reporting
very severe dyspnea 29.2% had abnormal echocardiography measurement and among the participants
reporting with severe dyspnea 22.2% had both abnormal spirometry and echocardiography
measurements. Only 25.2% of the participants reporting dyspnea symptoms had abnormal
measurements (appendix 1). Among them only 43.6% of male subjects reporting dyspneic symptoms
had abnormal measurements compared to 56.4% of women reporting dyspneic symptoms (Appendix
1). There was a significant difference in men and women and measurement status (Appendix 2) i.e.
normal/abnormal according to whether or not they have symptoms i.e. dyspnea/ no dyspnea
(p*value<0.001).

!!!
! 27!
Table 4: Prevalence of self-reported dyspnea in the study population with Spirometer and Echocardiography measurements
Characteristic
Total
Self-Reported Dyspnea P value
No Dyspnea
Mild Dyspnea
Moderate Dyspnea
Severe Dyspnea
Very severe Dyspnea
Valid n (%) 1764 830 (47.1) 824 (46.7) 41 (2.3) 45 (2.6) 24 (1.4) < 0.001 Normal spirometer and Echo n (%) 1075 (60.9) 586 (70.6) 450 (54.6) 15 (36.6) 14 (31.1) 10 (41.7)
Abnormal Echo n (%) 221 (12.5) 91 (11.0) 110 (13.3) 8 (19.5) 5 (11.1) 7 (29.2) Abnormal Spirometer n (%) 369 (20.9) 126 (15.2) 208 (25.2) 14 (34.1) 16 (35.6) 5 (20.8) Abnormal spirometer and Echo n (%) 99 (5.6) 27 (3.3) 56 (6.8) 4 (9.8) 10 (22.2) 2 (8.3) Echo (Echocardiography) Normal spirometer and Echo (FEV1/FVC ≥ 0.7 and FEV1 ≥ 80% or FVC ≥ 80% predicted and Left atrial <2.3 cm/m2) Abnormal Echo (Left atrial ≥ 2.3 cm/m2) Abnormal Spirometer with obstructive pattern (FEV1/FVC < 0.7) Abnormal Spirometer with obstructive pattern and Echo (FEV1/FVC<0.7 and Left atrial ≥ 2.3 cm/m2)

!!!
! 28!
Logistic regression analysis
Table 5 summarizes the results of the Univariate and multivariable analysis of demographic factor
associated with prevalence of dyspnea (Yes/No). Increase in age was associated with higher
prevalence of dyspnea. In univariate analysis, age group 60-70years [OR=1.5; 95% CI: 1.2-1.9], 70-80
years [OR=2.4; 95% CI: 1.9-3.0] and 80 and above years [OR=3.8; 95% CI: 2.8-5.0) were
significantly associated with increased prevalence of dyspnea. However in multivariate analysis, the
age group 80 years and above [OR=1.5; 95% CI: 1.1-2.3] was significantly associated with increased
prevalence of dyspnea. The prevalence of dyspnea increased 20% [OR=1.2; 95% CI: 1.1-1.3] in
female compared to male. Participants with BMI≥30kg/m2 (obesity) were 2.5 times more likely to
have dyspnea compared to participants with BMI<25 [OR=2.5; 95% CI: 2.2-2.8]. Self-reported disease
was also associated with higher prevalence of dyspnea. In multivariate analysis heart attack [OR=1.7;
95% CI: 1.3-2.2], atrial fibrillation [OR=1.6; 95% CI: 1.3-2.0], angina pectoris [OR=2.1; 95%CI: 1.6-
2.8], asthma [OR=2.2; 95% CI: 1.8-2.6] and bronchitis [OR=3.6; 95% CI: 2.7-4.8] were significantly
associated with increased prevalence of dyspnea. Smoking was also associated with increased
prevalence of dyspnea. Current smoker [OR=1.8; 95% CI: 1.6-2.0] and former smoker [OR=1.2; 95%
CI: 1.1-1.3] were significantly associated with increased prevalence of dyspnea. Weekly intake of
alcohol was associated with increased prevalence of dyspnea by 1.4 times [OR=1.4; 95% CI: 1.1-1.9]
compared to those who do not consume alcohol. Low level of exercise was associated with increased
prevalence of dyspnea compared to high level of exercise. The participants with high level of
education had low prevalence of dyspnea compared to low level of education i.e. college/university
less than 4 years [OR=0.8; 95% CI: 0.7-0.9] and college/university more than 4 years [OR=0.6; 95%
CI:0.5-0.6].

!!!
! 29!
Table 5: Univariate and multivariate analysis of demographic factor associated with prevalence of dyspnea (Yes/No)
Determinants Univariate analysis Multivariable analysis OR (95% CI) P value OR (95% CI) P value Age group (10years) 30-40 years (ref.) 40-50 years 50-60 years 60-70 years 70-80 years 80 and above years
1.0 0.9 (0.7-1.1) 1.0 (0.8-1.3) 1.5 (1.2-1.9) 2.4 (1.9-3.0) 3.8 (2.8-5.0)
0.456 0.565 <0.001 <0.001 <0.001
1.0 0.7 (0.5-0.9) 0.7 (0.5-0.9) 0.9 (0.7-1.1) 1.0 (0.7-1.3) 1.5 (1.1-2.3)
0.011 0.009 0.487 0.920 0.024
Sex Male (ref.) Female
1.0 1.2 (1.1-1.3)
<0.001
1.0 1.2 (1.1-1.4)
<0.001
Body mass index BMI <25 (ref.) BMI 25-29 BMI ≥30
1.0 1.6 (1.5-1.8) 2.5 (2.3-2.7)
<0.001 <0.001
1.0 1.8 (1.6-2.0) 2.5 (2.2-2.8)
<0.001 <0.001
Self-reported disease Diabetes No (ref.) Yes Heart attack No (ref.) Yes Atrial fibrillation No (ref.) Yes Angina pectoris No (ref.) Yes Asthma No (ref.) Yes Bronchitis No (ref.) Yes
1.0 1.8 (1.5-2.2) 1.0 2.8 (2.3-3.3) 1.0 2.4 (2.0-2.8) 1.0 4.0 (3.3-4.9) 1.0 2.5 (2.2-2.9) 1.0 6.5 (5.1-8.3)
<0.001 <0.001 <0.001 <0.001 <0.001 < 0.001
1.0 1.7 (1.3-2.2) 1.0 1.6 (1.3-2.0) 1.0 2.1 (1.6-2.8) 1.0 2.2 (1.8-2.6) 1.0 3.6 (2.7-4.8)
<0.001 <0.001 <0.001 <0.001 <0.001
Smoking Never (ref.) Former Current
1.0 1.5 (1.3-1.6) 2.2 (2.0-2.4)
<0.001 <0.001
1.0 1.2 (1.1-1.3) 1.8 (1.6-2.0)
<0.001 <0.001
Alcohol Never (ref.) Monthly Weekly
1.0 0.8 (0.7-0.9) 1.1 (0.8-1.4)
<0.001 0.274
1.0 0.6 (0.5-1.4) 1.4 (1.1-1.9)
0.095 0.016
Exercise level Easy Moderate Hard (ref.)
4.6 (3.5-6.0) 2.1 (1.6-2.7) 1.0
<0.001 <0.001
2.9 (2.1-3.9) 1.6 (1.2-2.1) 1.0
<0.001 0.001

!!!
! 30!
Education 1 (ref.) 2 3 4 5
1.0 0.7 (0.6-0.7) 0.5 (0.4-0.6) 0.5 (0.4-0.5) 0.3 (0.2-0.3)
<0.001 <0.001 <0.001 <0.001
1.0 0.9 (0.8-1.0) 0.8 (0.7-1.0) 0.8 (0.7-0.9) 0.6 (0.5-0.6)
0.360 0.166 0.011 <0.001
OR (Odd Ratio); (ref.) reference group. 1(Primary/secondary school, modern secondary school); 2 (Technical school, vocational school, 1-2 years senior high school); 3 (High school diploma); 4 (College/university less than 4 years); 5 (College/university 4 years or more). Table 6: Univariate and multivariable analysis of level of COPD, Restrictive disease and spirometer and echocardiography measurements group associated with prevalence of dyspnea (Yes/No) with age and sex adjustment.
Determinants Univariate analysis Multivariable analysis OR (95% CI) P value OR (95% CI) P value Level of COPD Normal (ref.) Mild Moderate Severe Very severe
1.0 1.2 (1.1-1.5) 2.6 (2.1-3.1) 9.4 (4.5-19.6) 13.9 (1.8-107.1)
0.017 <0.001 <0.001 0.011
1.0 1.2 (0.7-2.2) 2.6 (1.5-4.5) 9.1 (2.0-44.7) 6 (0.6-58.2)
0.361 <0.001 0.004 0.121
Restrictive disease No (ref.) Yes
1.0 2.6 (2.0-3.3)
<0.001
1.0 2.8 (1.5-58.2)
<0.001
Measurement group Normal spirometer and echo (ref.) Abnormal echo Abnormal spirometer Abnormal spirometer and echo
1.0 1.7 (1.2-2.2) 2.3 (1.8-2.9) 3.1 (2.0-5.0)
<0.001 <0.001 0.003
1.0 1.3 (1.2-2.2) 1.7 (1.4-2.1) 2.0 (1.7-4.8)
<0.001 <0.001 0.003
OR (Odd Ratio); (ref.) reference group. Normal spirometer and Echo (FEV1/FVC ≥ 0.7 and FEV1 ≥ 80% or FVC ≥ 80% predicted and Left atrial <2.3 cm/m2); Abnormal Echo (Left atrial ≥ 2.3 cm/m2); Abnormal Spirometer with obstructive pattern (FEV1/FVC < 0.7); Abnormal Spirometer with obstructive pattern and Echo (FEV1/FVC<0.7 and Left atrial ≥ 2.3 cm/m2)

!!!
! 31!
Table 6 summarizes univariate and multivariable analysis of level of COPD, Restrictive disease and
spirometry and echocardiographic measurement group associated with prevalence of dyspnea
(Yes/No) with age and sex adjustment. Increase in severity of COPD was associated with increased
prevalence of dyspnea. Moderate COPD [OR=2.6; 95% CI: 1.5-4.5] and severe COPD [OR=9.4; 95%
CI: 2.0-44.7] were significantly associated with increased prevalence of dyspnea. The prevalence of
dyspnea increased 2.8 folds [OR=2.8; 95% CI: 1.5-5.2] in people with restrictive disease. In terms of
spirometric and echocardiographic measurements, prevalence of dyspnea increased 1.3 folds [OR=1.3;
95% CI: 1.2-2.2] in people with abnormal echo compared to people with both normal spirometer and
echocardiography. Also, prevalence of dyspnea increased 1.7 folds [OR=1.7; 95% CI: 1.4-2.1] in
people with abnormal spirometry compared to people with both normal spirometry and
echocardiography. Similarly, prevalence of dyspnea increased 2 folds [OR=2; 95% CI: 1.7-4.8] in
people with abnormal spirometry and echocardiography compared to people with both normal
spirometry and echocardiography.

!!!
! 32!

!!!
! 33!
7. DISCUSSION
We observed that prevalence of dyspnea was related to cardiac or respiratory measure of disease and
dyspnea differ in general characteristics from those not reporting dyspnea which might be explained
by known risk factor such as age, sex, smoking habits, alcohol intake and comorbidity.
In this study, we observed a higher self-reported prevalence of dyspnea (Table 1) among men and
women. A higher prevalence of obesity (Table 1) among men and women in our study might explain
higher prevalence of self-reported dyspnea in men and women in our study because several studies
such as the large epidemiological study of 16,171 American adults aged ≥17 years (50) showed a
positive association between BMI and self-reported prevalence of dyspnea and Zutler et al. (51)
recently reported that obesity was associated with a 3.6 fold increased risk of dyspnea on exertion
independent of age, sex and airway obstruction. Similarly, the high proportion of men and women
reporting former and current smoking and self-reported asthma and heart attack is associated with
higher self-reported prevalence of dyspnea. We observed prevalence rate of dyspnea by different age
group and gender (Figure 2 and 3). Women reported a higher self-reported prevalence of dyspnea
compared to men. However, we observe that increasing age had a stronger influence on the prevalence
of dyspnea than gender. The participants with higher age group were associated with higher Self-
reported prevalence of dyspnea in our study and dyspnea was seen common in both men and women
participant’s aged ≥80 years. One might consider dyspnea rather a normal phenomenon in the aged, as
dyspnea is so common in older people. There was a marked gender difference in dyspnea prevalence
with predisposing factors, such as smoking, more frequently encountered in women in this study.
Similar to our studies other studies have found increased rates of breathlessness in women compared to
men (52-54). This gender differences in reported symptoms is the subject of ongoing debate but might
be consider as a true difference in prevalence (52).
We observe a large gender difference in COPD (Table 2) as cause of symptoms, which might be due to
differences in smoking history. In our study, increase in the severity of COPD as cause of symptoms
was seen with increased prevalence of dyspnea for both men and women and also prevalence of

!!!
! 34!
dyspnea was higher among men and women with restrictive lung disease as cause of symptoms.
Similarly, in participants with abnormal LA measurement, a measure linked to heart failure, 63%
reported dyspnea as compared to only 50% in those with normal or moderately enlarged LA size
(Table 3). However, as we also observed self-reported dyspnea among participants with normal LA
measurements, this might be due to the presence of other risk factor. Three studies looked at dyspnea
in the general population with a mean age 62 years but age ranged from 15 to 95 years (55-57). In
these three studies, cardiac and/or pulmonary diseases were the reason of dyspnea in 60%, with the
most common underlying diagnosis being heart failure and COPD. This is comparable with our study
with participants at a mean age of 57 years, with a cardiac and / or pulmonary disease as reason of
dyspnea in 67.5% of men with moderate COPD and 75% of women with moderate COPD and 30.3%
with abnormal LA measurement i.e. diastolic heart failure respectively. Therefore, heart failure and
COPD were the most common underlying diagnosis in cardiac and /or pulmonary disease being the
reason of dyspnea in our study. Also, we observed higher prevalence of dyspnea in women with
COPD compared to men with COPD, which might be due to large gender difference in COPD as
mention above and might be due to difference in smoking history.
Different recommendations exist regarding diagnostic strategies in the evaluation of dyspnea. The
most frequently recommended screening tests are spirometry, echocardiography and chest radiography
(55). As respiratory and/or heart disease was frequently the cause of dyspnea, spiromery and/or
echocardiography should obviously be one of the initial screening tests. Among the participants with
both spirometry and echocardiography measurement, we observed abnormal spirometry and/ or
echocardiography in 39% of the participants (Table 4) and high proportion of participants (25.2%)
reporting dyspnea symptoms had abnormal measurements (appendix 1). We observed a larger gender
difference in reporting dyspnea symptoms among participants with abnormal spirometry, which might
be due to differences in lung geometry between the sexes, because females, on average, would be
expected to have smaller airways and smaller lung volumes than male (58). Also, difference in
smoking history because with the increase in smoking pack years being associated with decrease

!!!
! 35!
FEV1, FEV1% predicted and FEV1/FVC values in both male and female (59). Furthermore, a study
carried out by Prescott and colleagues (60) demonstrated that female smokers had greater reductions in
FEV1 than males at comparable level of smoking intensity, which might be the reason why we
observed more women participants with abnormal spirometry.
We carried out a univariate and multivariable logistic regression analysis between dyspnea and several
covariates and found strong associations between them. The oldest age group was marked with
increased prevalence of dyspnea. Similarly, Overall prevalence of dyspnea was greater for women.
Obesity was associated with a 2.5 fold-increased risk of dyspnea. The participants with self-reported
disease such as diabetes, atrial fibrillation, angina pectoris, heart attack, asthma and bronchitis were
associated with increased prevalence of dyspnea but in multivariable analysis diabetes was not
significantly associated with dyspnea. We observe smoking and alcohol intake as significantly
associated with a higher prevalence of dyspnea. As compared to a high level of exercise, moderate and
sedentary exercise levels were associated with a 60% and tripling of the odds for reporting dyspnea.
Increasing length of education was also significantly associated with a decreasing prevalence of self-
reported dyspnea. Similar to our study a population survey assessing the prevalence and severity of
dyspnea in adults (17) found age, gender and education associated with dyspnea. We observed 9.1
fold increase in odds of self-reported dyspnea with increased severity of COPD. A restrictive disease
pattern had a 2.8 fold increase similar to the results in the study by Jakeways and colleagues (21).
Strength and limitations
Selection bias could be a limitation of our study as echocardiography only was performed in a
subgroup. But as this subgroup was randomly selected from the larger the main limitations caused by
the lower number in the groups eligible for this analysis is lower precision of our prevalence estimates
and lower power in the multivariable logistic regression analysis. There were relatively high number of
participants without both measurement of lung function (spirometry) and echocardiography among
study eligible participants in our study. The exclusion of these participants from our study analysis
might have affected our results to better explore how dyspnea is related to cardiac and respiratory

!!!
! 36!
measure of disease because there might be a significant difference between the subgroup with
spirometry and echocardiography as compared to those with echocardiography, which we could not
include in the analysis. We used measurement of left atrium size to identify participants with diastolic
heart failure however there were relatively few eligible participants with LV systolic dysfunction a
more severe form of heart failure. The selection bias due to missing echocardiography or spirometric
measurements might have affected our results regarding the impact of cardiac or pulmonary disease on
dyspnea, as COPD and systolic heart failure are known to coexist (61). A study carried out by Currow
and colleagues (17) found work status and income a significant predictor of breathlessness. However,
this study was unable to analyze the role of these variables.
The main strength of this study is the large sample size, where all the participants with self-reported
dyspnea in municipality of Tromsø were included providing a sample size with power to perform a
stratified analysis bye age and sex, to show at least any trends of differences in the prevalence of
dyspnea and how dyspnea differ in general characteristics from those not reporting dyspnea.
!!!!!!

!!!
! 37!
8. CONCLUSION
Our study shows a strong association between self-reported dyspnea and diastolic heart failure,
restrictive pulmonary disease and increasing levels of COPD. In addition obesity, lack of physical
activity, smoking and self-reported cardiac disease such as atrial fibrillation, myocardial infraction and
angina and pulmonary disease such as asthma and bronchitis independently of spirometric and
echocardiographic values. This indicate a large potential for prevention of self-reported dyspnea by
addressing life style and other measure that will prevent cardiovascular and pulmonary disease both in
an individual and public health level.
!
!!!!!!!!!!!!!!!!!!!!!!!!!!!!!!!!

!!!
! 38!
!!!!!!!!!!!!!!!!!!!!!!!!!!!!!!!!!!!!!!!!!!!!!!

!!!
! 39!
9. RECOMMENDATION
All the patients with self-reported dyspnea should be acknowledged and the physicians should assess if
all individuals identified with having dyspnea have COPD, CHD or heart failure as a cause of
symptoms. Health service utilization should facilitate the assessment of policies for monitoring of
dyspnea particularly in elderly population and supporting care of population living with dyspnea
related to COPD, CHD and heart failure. Larger studies and research are needed to examine whether
the possible treatable causes of dyspnea will translate into improved patient outcome in elderly people
as the balance between positive effects and side effects of treatment might be different in this
particular group of patients.
!!!!!!!!!!!!!!!!!!!!!!!!!!!!!!

!!!
! 40!
!!!!!!!!!!!!!!!!!!!!!!!!!!!!!!!!!!!!!!!!!!!!!!!!!!

!!!
! 41!
10. REFERENCES
1. Desbiens N, Mueller-Rizner N, Connors A, Wenger N. The relationship of nausea and dyspnea
to pain in seriously ill patients. Pain. 1997;71:149–56.
2. Hammond EC. Some preliminary findings on physical complaints from a prospective study of
1,064,004 men and women. Am J Public Health Nations Health. 1964;54:11-23.
3. Kroenke K, Arrington ME, Mangelsdorff AD. The prevalence of symptoms in medical
outpatients and the adequacy of therapy. Arch Intern Med. 1990;150:1685-9.
4. Mahler DA, Harver A, Lentine T, Scott JA, Becka K, Schwartzstein RM. Descriptor of
breathlessness in cardiorespiratory disease. Am J Respir Crit Care MED. 1996;154:1357-63.
5. Barberger-Gateau P, Chaslerie A, Dartigues JF, Commenges D, Gagnon M, Salamon R. Health
measures correlates in a French elderly community population: the PAQUID study. J Gerontol Soc
Sci. 1992;47:s88-s95.
6. Bailey PH. The Dyspnea-Anxiety-Dyspnea Cycle-COPD Patients´ Stories of Breathlessness:
"It´s Scary/When You Can´t Breathe". Qualitative health research. 2004;14(6):760-78.
7. Joseph R. Shiber JS. Dyspnea. The Medical clinics of North America. 2006;90:453-79.
8. Forstad A, Soyseth V, Anderson A, Gulsvik A. Respiratory symptoms as predictors of all-
cause mortality in an urban community: a 30-year follow-up. J Intern MED. 2006;259:520-9.
9. Pratter MR, Curley FJ, Dubois J, Irwin RS. Cause and evaluation of chronic dyspnea in a
pulmonary disease clinic. Arch Intern Med. 1989;149:2277-82.
10. Eagan TM, Bakke PS, Eide GE, Gulsvik A. Incidence of asthma and respiratory symptoms by
sex, age and smoking in a community study. Eur Respir J. 2002;19:599-605.
11. Lindstorm M, Kotaniemi J, Jonsson E, Lundback B. Smoking, respiratory symptoms, and
disease:a comparative study between northern Sweden and Northern Finland:report from the FinEsS
study. Chest. 2001;119:852-61.
12. Lopez MVV, Montes MdO, Halbert RJ. Sex-related differences in COPD in five Latin
Americian cities: the PLATINO study. Eur Respir J. 2010;36:1034-41.

!!!
! 42!
13. Gulsvik A. Prevalence of respiratory symptoms in the city of Oslo. Scand J Respir Dis.
1979;60:275-85.
14. Solano JP, Gomes B, Higginson IJ. A comparision of symptom prevalence in far advanced
cancer, AIDS, heart disease, chronic obstructive pulmonary disease and renal disease. J Pain Symptom
Manage. 2006;31(1):58-69.
15. Mulrow CD, Lucey CR, Farnett LE. Discriminating causes of Dyspnea through clinical
examination: Clinical review. Journal of general internal medicine. 1993;8:383-93.
16. Bowden J, To T, Abernethy A, Currow D. Predictors of chronic breath- lessness: a large
population study. BMC Public Health. 2011;11:33.
17. Currow DC, Plummer JL, Crockett A, Abernethy AP. A community population survey of
prevalence and severity of dyspnea in adults. J Pain Symptom Manage. 2009;38:533-45.
18. Hawthorne VM, Watt GC, Hart CL, Hole DJ, Smith GD, Gillis CR. Cardiorespiratory disease
in men and women in urban Scotland: baseline characteristics of the Renfrew/Paisley (midspan) study
population. Scott Med J. 1995;40(102-107).
19. Shin C, Lee S, Abbott R, Kim J, Lee S, In K, et al. Relationships between respiratory
symptoms and FEV1 in men and women with normal lung function: The Korean Health and Genome
Study. Lung. 2005;183:301-9.
20. Ho SF, O’Mahony MS, Steward JA, Breay P, Buchalter M, Burr ML. Dyspnoea and quality of
life in older people at home. Age Ageing. 2001;30:155-9.
21. Jakeways N, McKeever T, Lewis SA, Weiss ST, Britton J. Relationship between
FEV1reduction and respiratory symptoms in the general population. Eur Respir J. 2003;21:658-63.
22. Charles J, Ng A, Britt H. Presntations of shortness of breathe in Australian general practice.
Aust Fam Physician. 2005;34:520-1.
23. Mourik VY, Rutten HF, Moons GMK, Bertens CML, Hoes WA, Reitsma BJ. Prevalence and
undelying causes of dyspnea in older people: a systematic review. Age and Ageing. 2014;43:319-26.

!!!
! 43!
24. Landahl S, Steen B, Svanborg A. Dyspnea in 70-year-old people. Acta Med Scand.
1980;207:225-30.
25. Tessier JF, Nejjari C, Letenneur L, Filleul ML, Marty MI, Baarberger PG, et al. Dyspnea and
8-year mortality among elderly men and women: The PAQUID cohort study. Eur J Epidemiol.
2001;17:223-9.
26. Mahler DA, Wells CK. Evaluation of clinical methods for rating dyspnea. Chest.1988;93:580-
6.
27. Silvestri GA, Mahler DA. Evaluation of dyspnea in the elderly patient. Clin Chest Med.
1993;14:393-404.
28. Van-Grunsven P. Treatment of acute serious dyspnea in asthma and COPD in general gractice:
a literature review. Huisarts Wet. 1997;40:54-62.
29. Rodeheffer RJ, Jacobsen SJ, Gersh BJ, Kottke TE, McCann HA, Bailey KR, et al. The
incidence and prevalence of congestive heart failure in Rochester, Minnesota. Mayo Clinic
proceedings. 1993;68(12):1143-50.
30. Dougherty AH, Naccarelli GV, Gray EL, Hicks CH, Goldstein RA. Congestive heart failure
with normal systolic function. Am J Cardiol. 1984;54:778-82.
31. Dodek A, Kassebaum DG, Bristow JD. Pulmonary edema in coronary-artery disease without
cardiomegaly: paradox of the stiff heart. N Engl J Med. 1972;286:1347-50.
32. Vasan RS, Benjamin EJ, Levy D. Prevalence, clinical features and prognosis of diastolic heart
failure: an epidemiologic perspective J Am Coll Cardiol. 1995;30:8-18.
33. Nasim S, Nadeem N, Zahidie A, sharif T. Relationship between exercise induced dyspnea and
functional capacity with doppler-derived diastolic function. BioMed Central. 2013;6:1-7.
34. Schirmer H, Lunde P, Rasmussen K. Mitral flow derived Doppler indices of left ventricular
diastolic function in a general population: The Tromsø study. Eur Heart J 2000;21(16):1376-86.
35. Paulus JW, Tschope C, Sanderson EJ, Rusconi C, Flachskampf AF, Rademakers EF, et al.
How to diagnose heart failure: a consenus statement on the diagnosis of heart failure with normal left

!!!
! 44!
ventricular ejection fraction by the Heart Failure and Echocardiography Associations of the European
Society of Cardiology. Eur Heart J. 2007;28:2539-50.
36. Picard CR, Tazi A. Dyspnea: How to Differentiate Between Acute Heart Failure Syndrome and
other Disease. Acute Heart Failure2008. p. 161-7.
37. Mancini DM, Henson D, LaManca J, Levine S. Respiratory Muscle Function and Dyspnea in
Patients with Chronic Congestive Heart Failure. Circulation. 1992;86(3):909-18.
38. Ahto M, Isoaho R, Puoujoki H, Laippala P, Romo M, Kivela SL. Prevalence of coronary heart
disease, associated manifestation and electrocardiographic findings in elderly Finns. British Geriatrics
Society. 1998;27:729-37.
39. Nakanishi R, Rana JS, Rozanski A, Cheng VY, Gransar H, Thomson LJ, et al. Relationship of
dyspnea vs. typical angina to coronary artery disease severity, burden, composition and location on
coronary CT angiography. Atherosclerosis. 2013;230:61-6.
40. Hagman M, Wilhelmsen L. Relationship between dyspnea and chest pain ischemic heart
disease. Acta medica Scandinavica Supplementum. 1981;644:16-8.
41. Pepine CJ, Wiener L. Relationship of anginal symptoms to lung mechanics during myocardial
ischemia. Circulation. 1972;46:863-9.
42. Global Initiative for Chronic Obstructive Lung Disease. NHLBI/WHO, 2005.
43. Mahler DA. Mechanisms and Measurement of Dyspnea in Chronic Obstructive Pulmonary
Disease. Proc Am Thorac Soc. 2005;3:234-8.
44. Rennard S, Decramer M, Calverly PMA, Pride NB, Soriano JB, Vermeire PA, et al. Impact of
COPD in North America and Europe in 2000:subject´s perspective of confronting COPD. International
Survey. Eur Respir J. 2002;20:799-805.
45. Mullerova H, Lu C, Li H, Tabberer M. Prevalence and Burden of Breathlessness in Patients
with Chronic Obstructive Pulmonary Disease Managed in Primary Care. PLoS ONE. 2014;9(1):1-12.
46. Jones PW, Brusselle G, Dal-Negro RW, Ferrer M, Kardos P. Properties of the
COPDassessment test in a cross-sectional European study. Eur Respir J. 2011;38(1):29-35.

!!!
! 45!
47. Bestall JC, Paul EA, Garrod R, Garnham R, Jones PW, Wedzicha JA. Usefulness of the
Medical Research Council (MRC) dyspnoea scale as a measure of disability in patients with chronic
obstructive pulmonary disease. Thorax. 1999;54:581-6.
48. Bellamy D, Booker R, Connellan S, Halpin D. Spirometry in practice: A practical guide to
using spirometry in primary care. London: British Thoracic society (BTS) COPD Consortium, 2005.
49. WHO. Report of a WHO Consultation on Obesity:Obesity preventing and managing the global
epidemic. Geneva: WHO/NUT/NCD. 1997.
50. Sin DD, Jones RL, Man SF. Obesity is a risk factor for dyspena but not for airflow
obstructions. Archives of Internal Medicine. 2002;162(13):1477-81.
51. Zutler M, Singer JP, Omachi TA, Eisner M, Iribarren C, Katz P. Relationship of obesity with
respiratory symptoms and decreased functional capacity in adults without established COPD. Primary
care Respiratory journal: Journal of the General practice Airways Groups. 2012;21(2):194-201.
52. Gijshers V, Wijk CMT, Kolk AM. Sex difference in physical symptoms: the contribution of
symptom perception theory. Soc Sci Med. 1997;45:231-46.
53. Verbrugge LM. Sex difference in complaints and diagnosis. J Behav Med. 1980;3:327-55.
54. Bradley N, David L, Chow E. Symptom distress in patients attending an outpatient palliative
radio therapy clinic. J Pain Symptom Manage. 2005;30:123-31.
55. Pedersen F, Mehlsen J, Raymond I, Atar D, Skjoldborg US, Hildebrandt PR. Evaluation of
dyspnea in a sample of elderly subjects recruited from general practice. Int J Clinc Pract.
2007;61(9):1481-91.
56. Nielsen LS, Svanegaard J, Wiggers P, Egeblad H. The yield of a diagnostic hospital dyspnoea
clinic for the primary health care section. J Intern Med. 2001;250:422-8.
57. Nielsen LS, Svanegaard J, Klitgaard NA, Egeblad H. N-terminal pro-brain natriuretic peptide
for discriminating between cardiac and non-cardiac dyspnoea. EurJ Heart Fail. 2004;6:63-70.
58. Brooks LJ, Byard PJ, Helms RC, Fouke JM, Stronl KP. Relationship between lung volume and
tracheal area as assessed by acoustic reflection. J Appl Physiol. 1988;64:1050-4.

!!!
! 46!
59. Shimray AJ, Kanan W, Jamatia SNN, Roel S, Kom LB, Ournanath F, et al. Gender differences
in Spirometic Lung Functions in Chronic Obstructive Pulmonary Disease patients Attending Rims
Hospital out-patient Department. IOSR-JDMS. 2014;13(9):49-51.
60. Prescott E, Bjerg AM, Andersen PK, Lange P, Vestbo J. Gender difference in smoking effects
on lung function and risk of hospitalization for COPD: result from a Danish longitudinal population
study. Eur Respir J. 1997;10:822-7.
61. Render ML, Weinstein AS, Blaustein AS. Left ventricular dysfunction in deteriorating patient
with Chronic Obstructive Pulmonary disease. Chest. 1995;107:162-8.

!!!
! 47!
11. APPENDICES

!
! 48!
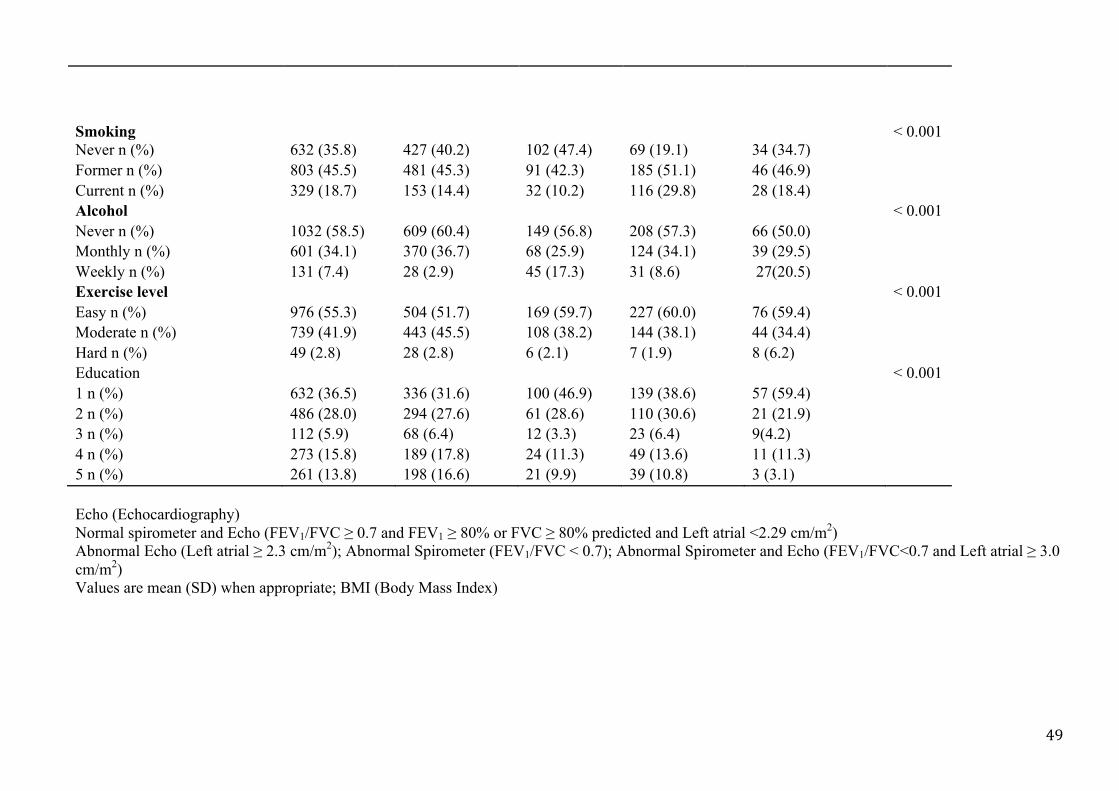
Appendix 1
Table 7: Demographic and baseline characteristics in study population stratified by measurement group
Characteristics Total Spirometer and Echo measurement group P value
Normal spirometer and Echo
Abnormal Echo
Abnormal spirometer
Abnormal spirometer and Echo
Valid n (%) 1764
1075 (60.9) 221 (12.5) 369 (20.9) 99 (5.6) < 0.001 < 0.001 < 0.001
Age (SD) 65 (11.1) 62 (10.8) 70 (9.7) 67 (10) 75 (8.3) Male n (%) 780 (44.2) 458 (42.6) 70 (31.7) 215 (58.3) 37 (37.4) Measurement Mean SBP (SD) 143.2 (24) 139.4 (22) 153.2 (25) 145.1 (25.7) 155.5 (24.6) Mean DBP (SD) 78.6 (10.6) 78.5 (10) 79.3 (11.4) 78.7 (11.1) 77.9 (12.2) 0.444 BMI kg/m2 (SD) BMI kg/m2 category BMI<25 n (%) BMI 25-29 n (%) BMI ≥ 30 n (%)
27 (4) 582 (33%) 823 (46.7) 359 (20.4)
27.1 (4.1) 343 (31.9) 503 (46.8) 229 (21.3)
26.8 (3.9) 70 (31.7) 108 (48.9) 43 (19.5)
26.8 (4.1) 130 (35.2) 170 (46.1) 69 (18.7)
26.7 (4.1) 39 (39.4) 42 (42.4) 18 (18.2)
0.633 <0.001
SaO2 (SD) 97.4 (1.8) 97.6 (1.2) 97.6 (1.2) 96.8 (3.2) 97.2 (1.3) <0.001 Cholesterol (SD) 5.6 (1.1) 5.7 (1) 5.7 (1.1) 5.6 (1.1) 5.5 (1) 0.784 Glucose (SD) 5.5 (1.5) 5.5 (1.5) 5.4 (1.2) 5.6 (1.6) 5.5 (1.3) 0.530 Heart rate (SD) 64.9 (10.3) 64.8 (10) 64.4 (10) 65.4 (10.7) 65 (13) 0.877 Self-reported disease Diabetes n (%) 97 (5.6) 58 (5.5) 16 (7.4) 19 (5.3) 4 (4.3) 0.623 Heart attack n (%) 142 (8.2) 55 (5.2) 22 (10.0) 46 (12.8) 19 (20.7) < 0.001 Atrial fibrillation n (%) 137 (8.1) 55 (5.3) 34 (16.0) 24 (6.9) 24 (25.3) 0.003 Angina pectoris n (%) 135 (7.9) 52 (4.9) 35 (16.4) 30 (8.4) 18 (19.6) < 0.001 Asthma n (%) 191 (11.1) 90 (8.5) 16 (7.4) 69 (19.4) 16 (17.6) < 0.001 Bronchitis n (%) 79 (4.6) 23 (2.3) 8 (3.7) 32 (9.0) 16 (17.4) < 0.001
!
! 49!
Smoking
< 0.001
Never n (%) 632 (35.8) 427 (40.2) 102 (47.4) 69 (19.1) 34 (34.7) Former n (%) 803 (45.5) 481 (45.3) 91 (42.3) 185 (51.1) 46 (46.9) Current n (%) 329 (18.7) 153 (14.4) 32 (10.2) 116 (29.8) 28 (18.4) Alcohol < 0.001 Never n (%) 1032 (58.5) 609 (60.4) 149 (56.8) 208 (57.3) 66 (50.0) Monthly n (%) 601 (34.1) 370 (36.7) 68 (25.9) 124 (34.1) 39 (29.5) Weekly n (%) 131 (7.4) 28 (2.9) 45 (17.3) 31 (8.6) 27(20.5) Exercise level < 0.001 Easy n (%) 976 (55.3) 504 (51.7) 169 (59.7) 227 (60.0) 76 (59.4) Moderate n (%) 739 (41.9) 443 (45.5) 108 (38.2) 144 (38.1) 44 (34.4) Hard n (%) 49 (2.8) 28 (2.8) 6 (2.1) 7 (1.9) 8 (6.2) Education < 0.001 1 n (%) 632 (36.5) 336 (31.6) 100 (46.9) 139 (38.6) 57 (59.4) 2 n (%) 486 (28.0) 294 (27.6) 61 (28.6) 110 (30.6) 21 (21.9) 3 n (%) 112 (5.9) 68 (6.4) 12 (3.3) 23 (6.4) 9(4.2) 4 n (%) 273 (15.8) 189 (17.8) 24 (11.3) 49 (13.6) 11 (11.3) 5 n (%) 261 (13.8) 198 (16.6) 21 (9.9) 39 (10.8) 3 (3.1) Echo (Echocardiography) Normal spirometer and Echo (FEV1/FVC ≥ 0.7 and FEV1 ≥ 80% or FVC ≥ 80% predicted and Left atrial <2.29 cm/m2) Abnormal Echo (Left atrial ≥ 2.3 cm/m2); Abnormal Spirometer (FEV1/FVC < 0.7); Abnormal Spirometer and Echo (FEV1/FVC<0.7 and Left atrial ≥ 3.0 cm/m2) Values are mean (SD) when appropriate; BMI (Body Mass Index)
!
! 50!
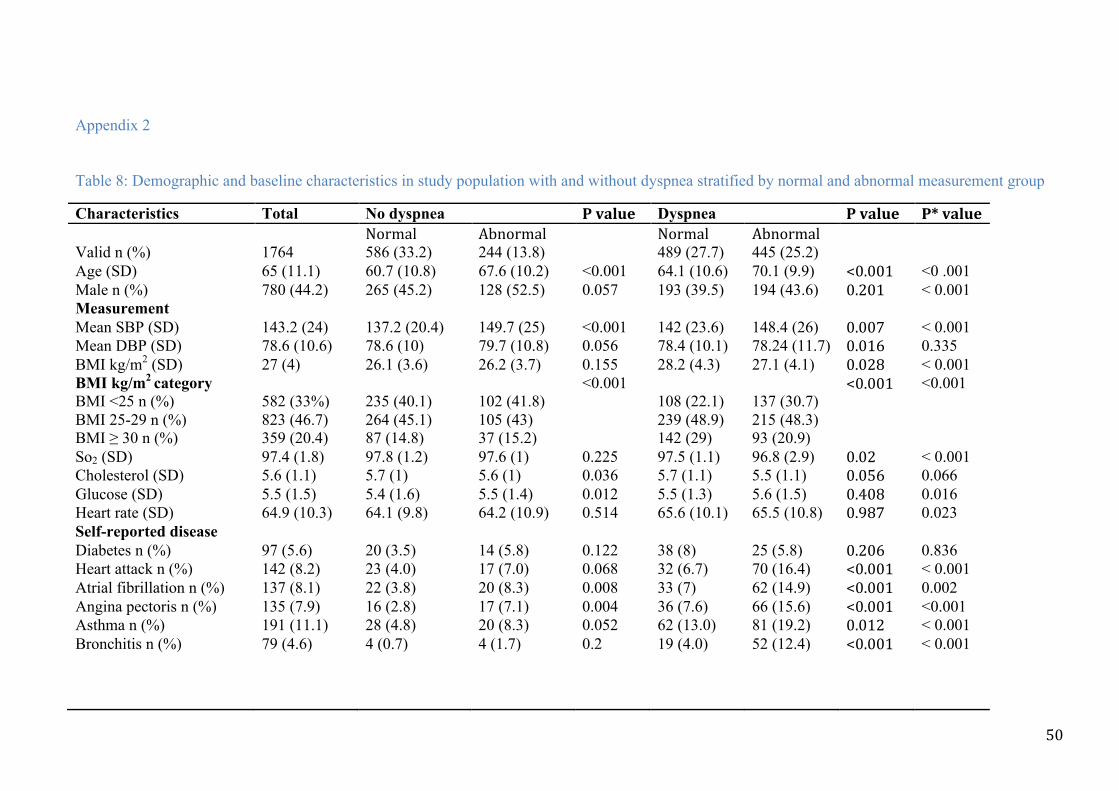
Appendix 2
!Table 8: Demographic and baseline characteristics in study population with and without dyspnea stratified by normal and abnormal measurement group
Characteristics! Total! No dyspnea! P!value! Dyspnea! P!value! P*!value!! ! Normal! Abnormal! ! Normal! Abnormal! ! !Valid n (%)! 1764! 586 (33.2)! 244 (13.8)! ! 489 (27.7)! 445 (25.2)! ! !Age (SD) 65 (11.1) 60.7 (10.8) 67.6 (10.2) <0.001 64.1 (10.6) 70.1 (9.9) <0.001! <0 .001!Male n (%) 780 (44.2) 265 (45.2) 128 (52.5) 0.057 193 (39.5) 194 (43.6) 0.201! < 0.001 Measurement ! Mean SBP (SD) 143.2 (24) 137.2 (20.4) 149.7 (25) <0.001 142 (23.6) 148.4 (26) 0.007! < 0.001 Mean DBP (SD) 78.6 (10.6) 78.6 (10) 79.7 (10.8) 0.056 78.4 (10.1) 78.24 (11.7) 0.016! 0.335 BMI kg/m2 (SD) BMI kg/m2 category BMI <25 n (%) BMI 25-29 n (%)
27 (4) 582 (33%) 823 (46.7)
26.1 (3.6) 235 (40.1) 264 (45.1)
26.2 (3.7) 102 (41.8) 105 (43)
0.155 <0.001
28.2 (4.3) 108 (22.1) 239 (48.9)
27.1 (4.1) 137 (30.7) 215 (48.3)
0.028!<0.001!
< 0.001 <0.001
BMI ≥ 30 n (%) 359 (20.4) 87 (14.8) 37 (15.2) 142 (29) 93 (20.9) ! So2 (SD) 97.4 (1.8) 97.8 (1.2) 97.6 (1) 0.225 97.5 (1.1) 96.8 (2.9) 0.02! < 0.001 Cholesterol (SD) 5.6 (1.1) 5.7 (1) 5.6 (1) 0.036 5.7 (1.1) 5.5 (1.1) 0.056! 0.066 Glucose (SD) 5.5 (1.5) 5.4 (1.6) 5.5 (1.4) 0.012 5.5 (1.3) 5.6 (1.5) 0.408! 0.016 Heart rate (SD) 64.9 (10.3) 64.1 (9.8) 64.2 (10.9) 0.514 65.6 (10.1) 65.5 (10.8) 0.987! 0.023 Self-reported disease ! Diabetes n (%) 97 (5.6) 20 (3.5) 14 (5.8) 0.122 38 (8) 25 (5.8) 0.206! 0.836 Heart attack n (%) 142 (8.2) 23 (4.0) 17 (7.0) 0.068 32 (6.7) 70 (16.4) <0.001! < 0.001 Atrial fibrillation n (%) 137 (8.1) 22 (3.8) 20 (8.3) 0.008 33 (7) 62 (14.9) <0.001! 0.002 Angina pectoris n (%) 135 (7.9) 16 (2.8) 17 (7.1) 0.004 36 (7.6) 66 (15.6) <0.001! <0.001 Asthma n (%) 191 (11.1) 28 (4.8) 20 (8.3) 0.052 62 (13.0) 81 (19.2) 0.012! < 0.001 Bronchitis n (%) 79 (4.6) 4 (0.7) 4 (1.7) 0.2 19 (4.0) 52 (12.4) <0.001! < 0.001
!!!

!
! 51!
Smoking 0.216 <0.001! <0.001 Never n (%) 632 (35.8) 243 (41.8) 89 (33.2) 184 (38.4) 116 (26.7) ! Former n (%) 803 (45.5) 262 (45.0) 109 (40.6) 219 (45.7) 213 (49) ! Current n (%) 329 (18.7) 77 (13.2) 70 (26.2) 76 (15.9) 106 (24.4) ! Alcohol
0.343
!0.021!
0.003
Never n (%) 1032 (58.5) 328 (59.4) 141 (49.8) 281 (61.8) 282 (59.4) ! Monthly n (%) 601 (34.1) 214 (38.7) 97 (34.2) 156 (34.2) 134 (28.3) ! Weekly n (%) 131(7.4) 10 (1.9) 45 (16) 18 (4) 58 (12.3) ! Exercise level 0.017 0.032! <0.001 Easy n (%) 976 (55.3) 247 (44.8) 169 (52.8) 257 (60.8) 303 (64.6) ! Moderate n (%) 739 (41.9) 282 (51) 139 (43.4) 161 (38) 157 (33.4) ! Hard n (%) 49 (2.8) 23 (4.2) 12 (3.8) 5 (1.2) 9 (2) ! Education <0.001 0.003! <0.001 1 n (%) 632 (35.8) 160 (27) 94 (38.8) 176 (35.6) 202 (46.2) ! 2 n (%) 486 (27.6) 153 (25.9) 64 (26.5) 141 (28.5) 128 (29.2) ! 3 n (%) 112 (6.4) 38 (6.4) 26 (10.8) 30 (6) 18 (4.2) ! 4 n (%) 273 (15.4) 108 (18.3) 30 (12.4) 81 (16.4) 54 (12.4) ! 5 n (%) 261 (14.8) 132 (22.4) 28 8 (11.5) 66 (13.5) 35 (8) ! !Echo (Echocardiography). Normal (normal spirometer and Echo i.e.FEV1/FVC ≥ 0.7 and FEV1 ≥ 80% or FVC ≥ 80% predicted and Left atrial <2.29 cm/m2); Abnormal (abnormal Echo i.e. Left atrial ≥ 3.0 cm/m2, abnormal spirometer i.e. FEV1/FVC < 0.7 and abnormal spirometer and echo i.e. FEV1/FVC<0.7 and Left atrial ≥ 3.0 cm/m2); Values are mean with standard deviation (SD), or number n with percentage of column (%)BMI (Body Mass Index). SBP (Systolic blood pressure). DBP (Diastolic blood pressure) Education level: 1 (Primary/secondary school, modern secondary school); 2 (Technical school, vocational school, 1-2 years senior high school); 3 (High school diploma); 4 (College/university less than 4 years); 5 (College/university 4 years or more). AF (Atrial fibrillation); SO2 (Oxygen Saturation); P* (overall p value i.e. whether there are differences in effects on measurement status according to whether or not they have symptoms)