faculty of physical education and sport charles university
TRANSCRIPT

Faculty of Physical Education and Sport
Charles University in Prague
Jose Martiho 31, 162 52 Praha 6 Department: Anatomy and Biomechanics Supervisor: Prof. Ing Stanislav Otahal, Csc.
Prof. Ing. Jan Kovanda, Csc.
THE BIOMECHANICAL REFLEXION OF MODERATE IDIOPATHIC SCOLIOSIS IN GAIT
CYCLE OF YOUNG ADULTS. DISSERTATION THESIS Author: Mgr. Christos Polyzos Department: Anatomy and Biomechanics Doctoral study started from 2002 – 2012. Dissertation pages are (78 p). Dissertation is available by the faculty of physical education and sport, Jose
Martiho 31, 162 52 Praha 6 Internal defense at department of anatomy and biomechanics in date 2012. Czech Republic Prague 2012

The biomechanical reflexion of moderate idiopathic scoliosis in gait cycle of young adults
Problem
The existence of any deviation upon the human structures or tissues through moderate idiopathic scoliosis
will cause a misbalance and an influence upon the proper distribution of forces acting on and around a joint,
ligament, bone or muscle. The result of such a misbalance, will be an alteration of all physical quantities
exerted from different segments of the body not only in the upper trunk but in the lower trunk too and
changes will occur in the upper extremities as well as in the lower extremities and their relative joints. The
joints of the lower extremities, which are involved in the gait cycle, from such an influence their functions
will be probably altered during the gait cycle; and movement restriction or loss is expected to be observed.
This study is relative to the three dimensional analysis of the gait cycle of young adults suffering from
moderate idiopathic scoliosis (MIS), in the lumbar or thoraco-lumbar part of the vertebra column. It is based
upon the presentation of cases suffering from scoliosis, patients that went under an elaborate thorough of
kinesiologic, anthropometric and kinematic analysis so as someone to be capable to extract useful
information of how the locomotion and the posture corresponds to this kind of disorder. Scoliosis patients
exhibit significantly impaired quality of life (Schwab et al, 2003) and young adults with MIS consist a
population group with increased occupational and sports activities (Weinstein et al, 2003) and gait cycle is
of great importance. Gait analysis is used to identify and treat (Lewit , 2000, Zabjeket al,2005) individuals
with conditions affecting their posture and in terms their ability to walk.
The Kinematic analysis is trying to seek how the gait cycle of the lower extremities correspond to
moderate idiopathic scoliosis and what kind of alteration will be exerted upon the physical quantities (linear
displacement, linear velocity and linear acceleration) that the major 3 joints (hip, knee and ankle) of the
lower extremities produce during locomotion. Expectable asymmetries, for our interest, during locomotion
may either concern the function (kinematic point of view) of the center of gravity or may concern the
creation of abnormal locomotion from the lower limbs, or both.
The general hypothesis: the scoliotic shape of the trunk will result in dynamical characteristics of whole
body locomotion movement.
Aims
To detect the biomechanical reflexion of moderate idiopathic scoliosis upon the major joints of the lower
extremities and the center of gravity during gait cycle of young adults as well as the correspondence of these
anatomical points due to an abnormal movement created always in comparison with the gait cycle of healthy
people.
Methods
For the purpose of this study thirty-five young adults (with similar anthropometric characteristics) of both
sexes were selected and divided in two groups: Group A consisted of 20 young adults with moderate
idiopathic scoliosis and group B of 15 healthy people without any known spinal deformity or disease
(table1).
Inclusion criteria for group A were: age more than eighteen years and less than fifty (as we wanted to
study established deformities in people with no degenerative spine so we arbitrarily set as limit fifty years of
age), lumbar and thoraco-lumbar curves (as these will probably have greater impact on pelvic locomotion),
scoliosis curves between 20o
to 40o
(smaller curves might not influence gait and bigger are not so commonly
met). Inclusion criteria for group B were same age variation to group A, no clinically examined spine
deformity, no limb length discrepancy more than 0,5 cm (as this could influence gait cycle pattern).
Every subject signed on and participated freely in the study, approved by the local ethics board. All
subjects were submitted to a clinical (Harris and Stanley, 2002), radiological (Cobb, 1948), (for group A)
and gait assessment.
In group A the gait cycle is characterized according to the convexity of the spine. The term “Ipsilateral”
is used for the convexity side joints and “Controlateral” for the concavity side joints in group A. In group B,
the average values from both sides of the body were used due to close similarities found amongst them.
The 3D kinematic analysis of gait was succeeded with the subjects walked on a mechanical treadmill,
with self selected speed. A typical one of the gait cycles was selected after achieving a steady pace of
walking so as to avoid mistakes in measuring the physical quantities. Gait cycle in each extremity was
initiated with initial contact (IC-heel contact) from double support position at 0 seconds and ended at the
next initial contact. Paper markers were installed on the skin surface of anatomical landmarks (major
trochanter, lateral condyle and lateral malleolus) that accurately represent the movement identification of the
hip, knee and ankle joints. For 3D video motion analysis three digital video camera recorders where
obtained. The physical quantities of our interest are: a) The linear displacement measured in cm, b) linear
velocity in m/sec and c) linear acceleration in m/sec2.
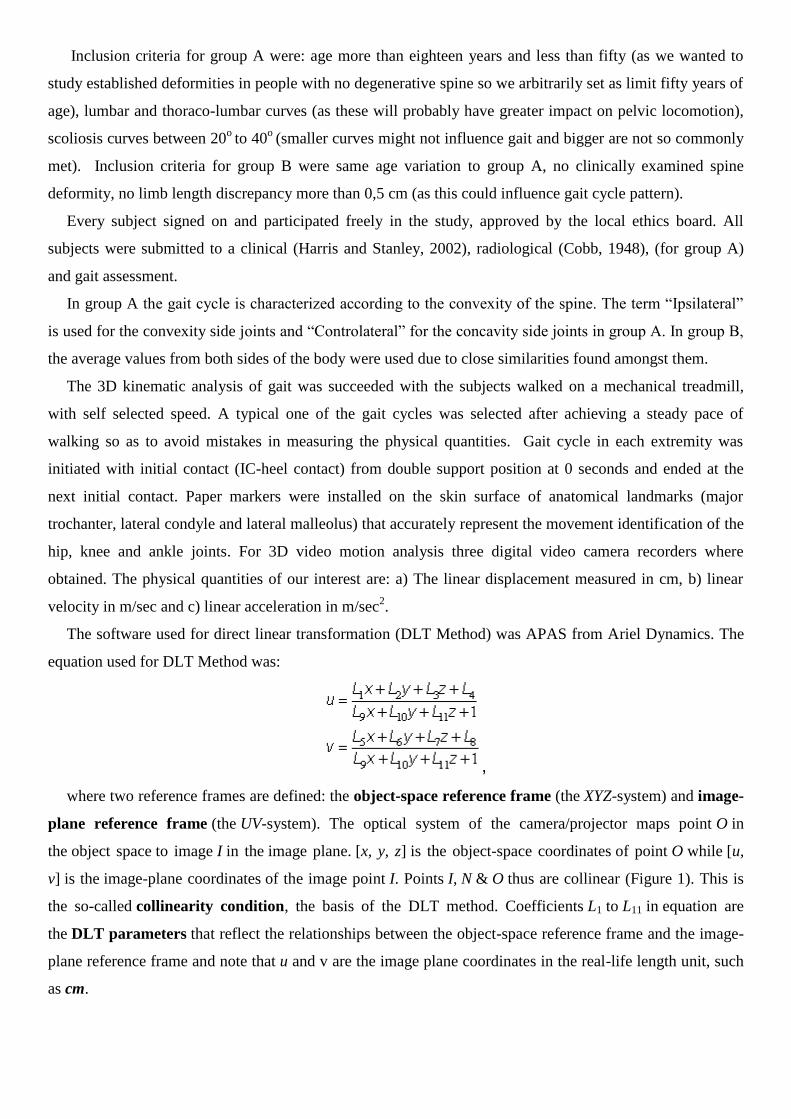
The software used for direct linear transformation (DLT Method) was APAS from Ariel Dynamics. The
equation used for DLT Method was:
,
where two reference frames are defined: the object-space reference frame (the XYZ-system) and image-
plane reference frame (the UV-system). The optical system of the camera/projector maps point O in
the object space to image I in the image plane. [x, y, z] is the object-space coordinates of point O while [u,
v] is the image-plane coordinates of the image point I. Points I, N & O thus are collinear (Figure 1). This is
the so-called collinearity condition, the basis of the DLT method. Coefficients L1 to L11 in equation are
the DLT parameters that reflect the relationships between the object-space reference frame and the image-
plane reference frame and note that u and v are the image plane coordinates in the real-life length unit, such
as cm.
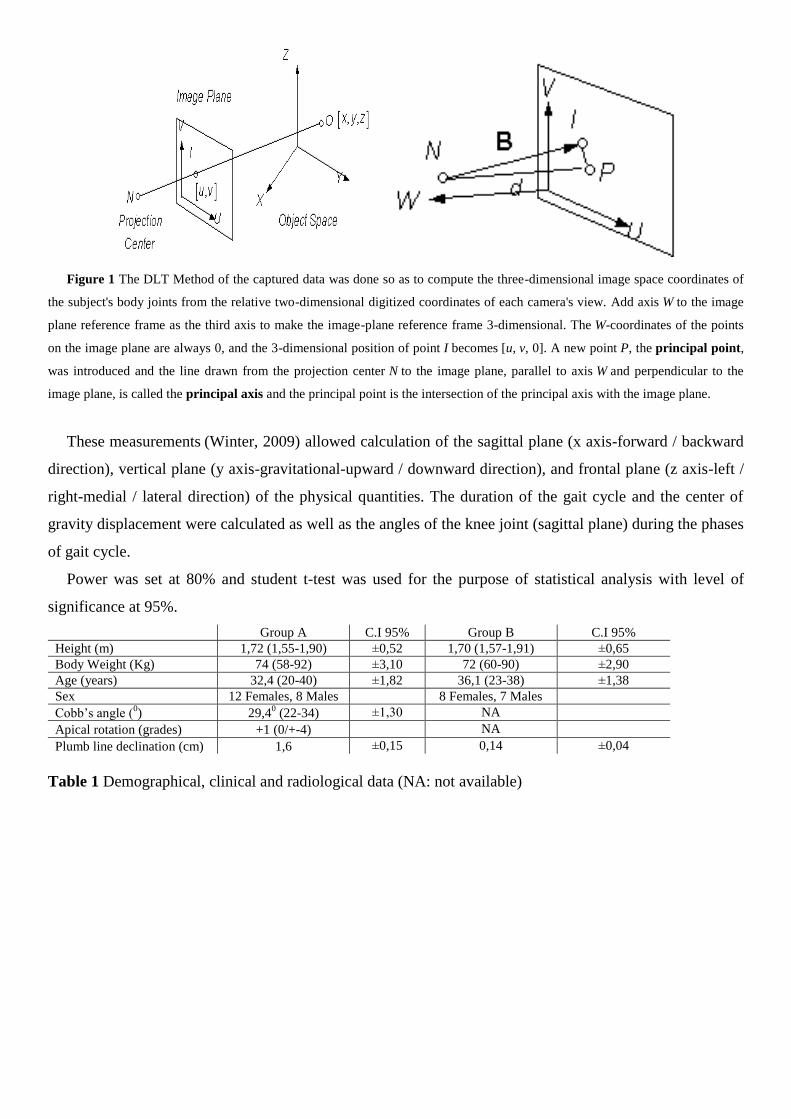
Figure 1 The DLT Method of the captured data was done so as to compute the three-dimensional image space coordinates of
the subject's body joints from the relative two-dimensional digitized coordinates of each camera's view. Add axis W to the image
plane reference frame as the third axis to make the image-plane reference frame 3-dimensional. The W-coordinates of the points
on the image plane are always 0, and the 3-dimensional position of point I becomes [u, v, 0]. A new point P, the principal point,
was introduced and the line drawn from the projection center N to the image plane, parallel to axis W and perpendicular to the
image plane, is called the principal axis and the principal point is the intersection of the principal axis with the image plane.
These measurements (Winter, 2009) allowed calculation of the sagittal plane (x axis-forward / backward
direction), vertical plane (y axis-gravitational-upward / downward direction), and frontal plane (z axis-left /
right-medial / lateral direction) of the physical quantities. The duration of the gait cycle and the center of
gravity displacement were calculated as well as the angles of the knee joint (sagittal plane) during the phases
of gait cycle.
Power was set at 80% and student t-test was used for the purpose of statistical analysis with level of
significance at 95%.
Group A C.I 95% Group B C.I 95%
Height (m) 1,72 (1,55-1,90) ±0,52 1,70 (1,57-1,91) ±0,65
Body Weight (Kg) 74 (58-92) ±3,10 72 (60-90) ±2,90
Age (years) 32,4 (20-40) ±1,82 36,1 (23-38) ±1,38
Sex 12 Females, 8 Males 8 Females, 7 Males
Cobb’s angle (0) 29,4
0 (22-34) ±1,30 NA
Apical rotation (grades) +1 (0/+-4) NA
Plumb line declination (cm) 1,6 ±0,15 0,14 ±0,04
Table 1 Demographical, clinical and radiological data (NA: not available)

Results
Photo 1 Typical moderate thoracolumbar scoliosis.
Graph 1 Thoracolumbar scoliosis: Typical linear displacement, velocity and acceleration of the hip joint during the gait cycle (IC
stands for initial contact with the gait cycle initiated from double support phase) of young adults suffering from moderate
idiopathic scoliosis (ipsilateral at the convex side) and healthy subjects (average from right and left extremity).

Graph 2 Thoracolumbar scoliosis: Typical linear displacement, velocity and acceleration of the knee joint during the gait cycle
(IC stands for initial contact with the gait cycle initiated from double support phase) of young adults suffering from moderate
idiopathic scoliosis (ipsilateral at the convex side) and healthy subjects (average from right and left extremity).

Graph 3 Thoracolumbar scoliosis: Typical linear displacement, velocity and acceleration of the ankle joint during the gait cycle
(IC stands for initial contact with the gait cycle initiated from double support phase) of young adults suffering from moderate
idiopathic scoliosis (ipsilateral at the convex side) and healthy subjects (average from right and left extremity).
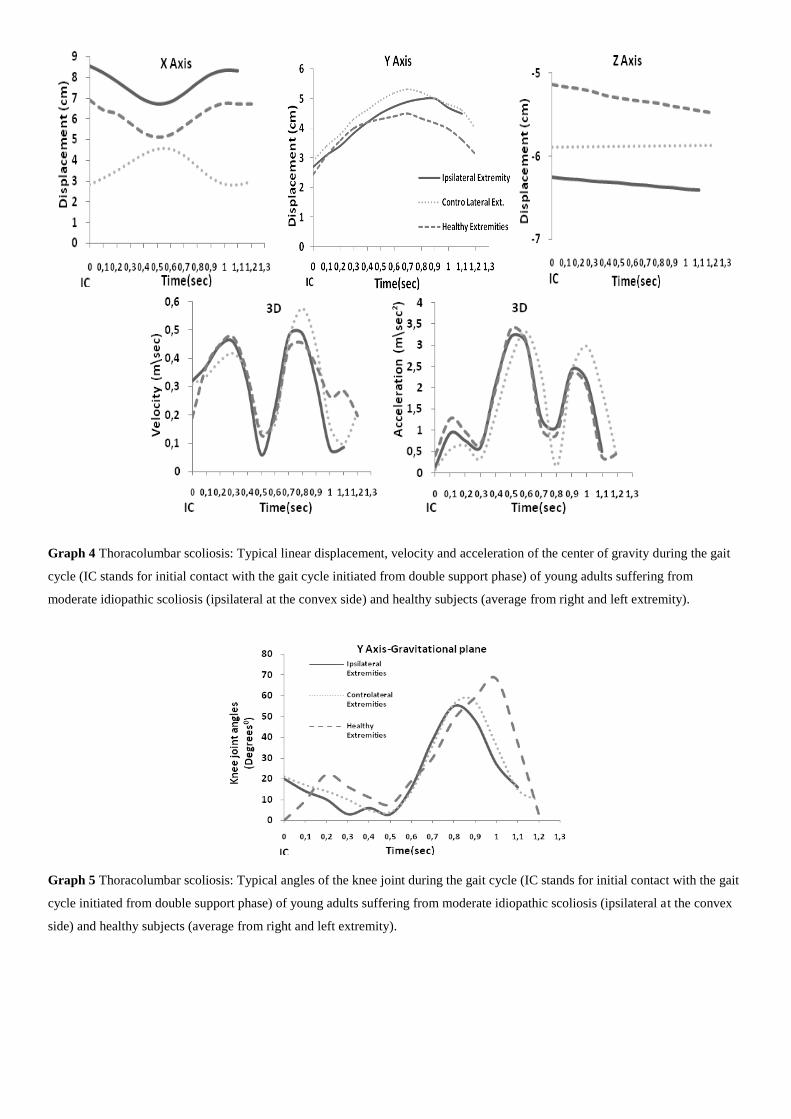
Graph 4 Thoracolumbar scoliosis: Typical linear displacement, velocity and acceleration of the center of gravity during the gait
cycle (IC stands for initial contact with the gait cycle initiated from double support phase) of young adults suffering from
moderate idiopathic scoliosis (ipsilateral at the convex side) and healthy subjects (average from right and left extremity).
Graph 5 Thoracolumbar scoliosis: Typical angles of the knee joint during the gait cycle (IC stands for initial contact with the gait
cycle initiated from double support phase) of young adults suffering from moderate idiopathic scoliosis (ipsilateral at the convex
side) and healthy subjects (average from right and left extremity).

All patients of group A had a right thoraco-lumbar or left lumbar primary structural curve. The average
Cobb’s angle in group A was 29,40and plumb line declination was 1,2cm. Mean leg length discrepancy in
group A was 1,2cm (±0,2cm, C.I 95%) while in group B the difference was 0,3cm (±0,13).
Scoliosis patients showed typical deformities regarding lumbar region, scapula and pelvis (table 2). When
examining range of motion, an obvious hip joint flexion restriction was noted as well as reduced lateral
flexion of the spine ipsilateral to the curve. Restriction in rotation and extension of the spine was less, but
worth noticing. More detailed clinical examination is shown in table 3.
Table 2 Effect of scoliosis upon the musculoskeletal system. NE: not existed
Table 3 Human locomotion restriction or loss. NE: not existed, SLR: straight leg raise
Body-weight distribution of the lower extremities was unevenly in group A (Table 4) and the mean
difference between them was 1,495 kg (±0,205, Confidence Interval C.I 95%) which is greater compared to
0,77 kg (±0,224), p<0,05, the mean difference between the extremities in control group B. Mean leg length
discrepancy in group A was 1,49 cm (±0,2cm) while in group B the difference was 0,55 cm (±0,131),
p<0,05. The gait cycle from both extremities in group A was asynchronous and the phases of walking were
not executed in a simultaneous manner amongst them. The gait cycle in scoliosis patients was increased
compared to healthy people and amongst the extremities in group A the ipsilateral side had a mean gait cycle
at 1,42sec (±0,11sec) and the controlateral side had a mean gait cycle at 1,39sec (±0,076 sec) while the
average from both extremities (group B) had a mean gait cycle at 1,21 sec (±0,073), p<0,05. Also, the mean
gait cycle difference between the lower extremities from group A was 0,153sec (±0,039sec) and it is greater
from the mean difference resulted from group B, that was 0,02 (±0,003sec), p<0,05. The statistical
differences found in scoliosis (group A) patients between ipsilateral and controlateral extremity (side to side
comparison) were concerning: The hip joint in the ipsilateral side of the trunk that had 6,4cm (±0,99) mean
sagittal displacement (x axis), higher than the mean sagittal displacement (forward / backward) of the hip
joint in the controlateral side that had 4,48cm (±0,53), p<0,05. The knee joint in the ipsilateral side of the
Clinical data Type of
scoliosis
Lumbar
Lordosis
Pelvic
tilt
Head & neck
posture
Shoulder & scapula
position
Iliac crest &
PSIS
Scoliosis
patients
Group A (n=20)
Thoraco-
lumbar
(16)
Lumbar (4)
Hyper-lordosis in 60%
of all cases. Flattening
in 30 % of all cases.
Existed in
100% of
all cases
Protruded in
100% of all
cases
Elevation in 100%
of all cases
Elevation in
100% of all
cases
Control group
Group B (n=15)
NE Hyper-lordosis in 15%
of all cases Flattening
in 5 % of all cases
Existed in
5% of all
cases
NE NE NE
Clinical data Trunk and spine Lumbar
extension
Hip joint
left & right extremity
SLR left & right
extremity
Pain
presence
Flexion Lateral
flexion
Rotation Range of
movement
External
rotation
Internal
rotation
Hip flexion /
knee extension
During
movement
Scoliosis
patients
Group A
(n=20)
Limited
in 30%
of all
cases
Limited
in one
side in
100% of
all cases
Limited
in one
side in
70% of
all cases
Hypo-
mobile in
80% of all
cases
Difference
in 100% of
all cases
Difference
in 100% of
all cases
Difference in
85% of all cases
90% of all
cases during
lateral-
flexion &
rotation
Control group
Group B
(n=15)
NE NE NE NE NE NE Difference in
5% of all cases
NE

trunk that had 6,74cm (±0,89) mean sagittal displacement, higher than the mean sagittal displacement of the
knee joint in the controlateral side that had 4,8cm (±0,35), p<0,05 and the ankle joint at the ipsilateral side of
the trunk had 6,46cm (±0,66) mean sagittal displacement, higher than the mean sagittal displacement of the
ankle joint in the controlateral side that had 4,5cm (±0,34), p<0,05. The center of gravity (midway between
hips, few cm ahead S2) in the ipsilateral side of the trunk that had 6,47cm (±0,88) mean sagittal
displacement, higher than the mean sagittal displacement of the center of gravity in the controlateral side
that had 4,35cm (±0,47), p<0,05.
Linear 3D velocity and 3D acceleration was lesser in the ipsilateral extremity but wasn’t reached the level
of any significant statistical difference.
Table 4 The average body-weight distribution, Leg length discrepancy (LLD) and gait cycle in patients with
moderate idiopathic scoliosis and healthy subjects. NS not significant, i.e. P value >0.05
Clinical data Scoliosis patients
Group A (n =20)
Control group mean
Group B (n =15)
Average Standard
Deviation
Confidence
Interval(±)
Average Standard
Deviation
Confidence
Interval(±)
P value
Ipsilateral and controlateral extremities
difference
Lower Extremities difference (mean)
Body weight distribution (Kg) 2,405 1,824937 0,799 0,22 0,443471157 0,224423246 <0,01
Leg length discrepancy (cm) 1,6 0,479556 0,210 0,486666 0,258751582 0,130943961 <0,01
Gait cycle (sec) 0,022 0,0842052 0,037 0,002666 0,00507093 0,002566195 <0,01
Table 5 The average body-weight distribution, LLD and gait cycle difference between ipsilateral and
controlateral extremity in patients with moderate idiopathic scoliosis and healthy subjects. Control group B
represented by an average value from lower extremities due to minimal differences found amongst lower
extremities. Significant differences are typed in bold and are accepted for P value <0.05
Clinical data Scoliosis patients
Group A (n =20)
Control group mean
Group B (n =15)
Average Standard
Deviation
Confidence
Interval(±)
Average Standard
Deviation
Confidence
Interval(±)
P value
Ipsilateral extremity Lower Extremities (mean)
Body weight distribution (Kg) 30,1 5,6560 3,5501 30,57 5,82 2,94 NS
Leg length discrepancy (cm) 83,96 6,2387 2,7342 85,02 6,50 3,29 NS
Gait cycle (sec) 1,42 0,2488 0,1091 1,21 0,14 0,073 <0,05
Controlateral extremity Lower Extremities (mean)
Body weight distribution (Kg) 32,51 7,2111 3,1603 30,57 5,82 2,94 NS
Leg length discrepancy (cm) 85,56 6,4155 2,8116 85,02 6,50 3,29 NS
Gait cycle (sec) 1,39 0,1680 0,0736 1,21 0,14 0,073 <0,02
Table 6 The average body-weight distribution, LLD and gait cycle in patients with moderate idiopathic
scoliosis and healthy subjects. Control group B represented by an average value from lower extremities
Clinical data Scoliosis patients
Group A ( n =20)
Average Standard Deviation Confidence Interval(±) P value
Ipsilateral
extremity
Controlateral
extremity
Ipsilateral
extremity
Controlateral
extremity
Ipsilateral
extremity
Controlateral
extremity
Body weight distribution
(Kg)
30,1 32,51 5,6560 7,2111 3,5501 3,1603 NS
Leg length discrepancy
(cm)
83,96 85,56 6,2387 6,4155 2,7342 2,8116 NS
Gait cycle (sec) 1,415 1,393 0,2488 0,1680 0,1091 0,0736 NS

Kinematic data Scoliosis patients
Group A (n=20)
Average Standard Deviation Confidence Interval(±) P value
Hip Joint Ipsilateral
extremity
Controlateral
extremity
Ipsilateral
extremity
Controlateral
extremity
Ipsilateral
extremity
Controlateral
extremity
Displacement X axis (cm) 6,365 4,48 2,257916 1,210307 0,989557 0,530431 <0,03
Displacement Y axis (cm) 2,915 2,94 0,856108 0,852489 0,375199 0,373613 NS
Displacement Z axis (cm) -6,11 -5,835 1,185394 0,927518 0,519512 0,406495 NS
Displacement 3D (cm) 2,455 2,14 0,778308 0,871417 0,341102 0,381909 NS
Velocity 3D (m/sec) 0,0566 0,0576 0,017733 0,024095 0,007772 0,01056 NS
Acceleration 3D (m/sec2) 0,185 0,21945 0,073339 0,135828 0,032142 0,059528 NS
Knee Joint Ipsilateral
extremity
Controlateral
extremity
Ipsilateral
extremity
Controlateral
extremity
Ipsilateral
extremity
Controlateral
extremity
Displacement X axis (cm) 6,7421 4,805 2,045677 0,78972 0,89654 0,346104 <0,01
Displacement Y axis (cm) 7,4665 8,1705 4,714639 3,435169 2,066244 1,505501 NS
Displacement Z axis (cm) -5,635 -5,56 0,901037 0,730825 0,39489 0,320292 NS
Velocity 3D (m/sec) 0,4398 0,45565 0,065678 0,090679 0,028784 0,039741 NS
Acceleration 3D (m/sec2) 1,7667 1,9097 0,523855 0,857731 0,229585 0,37591 NS
Ankle Joint Ipsilateral
extremity
Controlateral
extremity
Ipsilateral
extremity
Controlateral
extremity
Ipsilateral
extremity
Controlateral
extremity
Displacement X axis (cm) 6,46 4,445 1,498912 0,786381 0,656915 0,34464 <0,01
Displacement Y axis (cm) 4,005 4,04 0,496806 0,456992 0,217731 0,200282 NS
Displacement Z axis (cm) -5,32 -5,165 0,814733 0,88334 0,357066 0,387134 NS
Velocity 3D (m/sec) 0,6723 0,7176 0,124648 0,164049 0,054628 0,071896 NS
Acceleration 3D (m/sec2) 2,7043 2,9467 1,17324 1,571771 0,514186 0,688846 NS
Center of gravity Ipsilateral
extremity
Controlateral
extremity
Ipsilateral
extremity
Controlateral
extremity
Ipsilateral
extremity
Controlateral
extremity
Displacement X axis (cm) 6,465 4,33 1,9982295 1,075615 0,875747 0,4714 <0,01
Displacement Y axis (cm) 5,5355 5,5245 4,574625 4,47451 2,004881 1,961004 NS
Displacement Z axis (cm) -5,84 -5,595 0,919038 0,7598303 0,402779 0,3330042 NS
Displacement 3D (cm) 11,56 10,945 3,493814 1,531245 1,531203 0,671085 NS
Velocity 3D (m/sec) 0,2959 0,3122 0,081886 0,074586 0,035888 0,032688 NS
Acceleration 3D (m/sec2) 1,047 1,1728 0,371145 0,591763 0,162659 0,259347 NS
Table 7 Kinematic data: The linear displacement (cm) in sagittal plane (x axis), gravitational plane (y axis),
and frontal plane (z axis) and the 3D linear velocity (m/sec) and acceleration (m/sec2) exerted from the hip,
knee and ankle joints and the center of gravity amongst the ipsilateral and the controlateral extremity in
scoliosis patients. Significant differences are typed in bold and are accepted for P value <0.05, NS not significant, i.e. P value >0.05,
Significant differences are typed in bold and are accepted for P value <0.05
Comparison of group A and group B showed statistical significant difference in the following parameters
(C.I 95%):
Hip measurements showed that ipsilateral side (group A) had -6,11cm (±0,52) increased mean frontal
displacement (medial / lateral) compared to an average from both hips (group B) that had -5,10 cm (±0,23)
mean frontal displacement (z axis), p<0,05. Also, group A had reduced mean sagittal (x axis-forward /
backward direction), and increased frontal displacement in the hip joint of the controlateral side compared to
an average value that both hips in group B produced (x axis, controlateral side, 4,48 cm, C.I ±0,53 vs.
healthy extremities 6,41 cm, ±0.52 / z axis, controlateral side, -5,8 cm, ±0,41 vs. healthy ext. -5,10 cm,
±0,23), p<0,05. Relative to the knee joint, mean sagittal in the controlateral side in group A was lesser
4,48cm (±0,35) vs. 6,53cm (±0,43) compared to an average that both knees in group B produced . Knee’s
mean frontal displacement and mean vertical displacement in group A was increased in controlateral side
comparison to group B average value from both extremities (controlateral, y axis 8,17cm, C.I ±1,51, z axis -
5,56cm, ±0,32/ average value from both knees, group B, y axis 4,87cm,C.I ±0,64, z axis -4,73cm, ±0,20). As

for the knee joint in the ipsilateral side, the mean frontal displacement in scoliosis group was -5,6 cm
(±0,39) and it is higher compared to -4,73 cm (±0,20) found in control group. The ankle’s mean sagittal and
frontal displacement in the ipsilateral side of the trunk (scoliosis patients) was higher compared to an
average value resulted from both ankles in control group concerning x and z axis (ipsilateral, x axis 6,46cm,
C.I ±0,66, z axis -5,32cm, ±0,36/ healthy extremities, x axis 4,74cm,C.I ±0,18, z axis -4,21cm, ±0,15), while
mean frontal displacement was higher in the controlateral side of group A compared to group B
(controlateral -5,17 cm, ±0,39 vs. healthy extremities -4,21 cm, ±0,15), p<0,05. The center of gravity had
significantly reduced mean sagittal displacement in scoliosis patient’s controlateral side, being 4,33cm
(±0,47) for group A and 6,07cm (±0,52) for group B, p<0,05.
Linear 3D velocity and acceleration was lesser in Group A but wasn’t reached the level of any significant
statistical difference.
Kinematic data Scoliosis patients
Group A (n=20)
Control group mean
Group B (n=15)
Average
Standard
Deviation
Confidence
Interval(±)
Average
Standard
Deviation
Confidence
Interval(±)
P value
Hip Joint Ipsilateral extremity Lower extremities (mean)
Displacement X axis (cm) 6,365 2,257916 0,989557 6,40666 1,031099 0,52180 NS
Displacement Y axis (cm) 2,915 0,856108 0,375199 2,69667 0,553388 0,280048 NS
Displacement Z axis (cm) -6,11 1,185394 0,519512 -5,10333 0,451769 0,228622 <0,02
Displacement 3D (cm) 2,455 0,778308 0,341102 2,02 0,324478 0,164205 NS
Velocity 3D (m/sec) 0,0566 0,017733 0,007772 0,0646 0,004521 0,002288 NS
Acceleration 3D (m/sec2) 0,185 0,073339 0,032142 0,233633 0,032479 0,016436 NS
Hip Joint Controlateral extremity Lower extremities (mean)
Displacement X axis (cm) 4,48 1,210307 0,530431 6,40666 1,031099 0,52180 <0,01
Displacement Y axis (cm) 2,94 0,852489 0,373613 2,69667 0,553388 0,280048 NS
Displacement Z axis (cm) -5,835 0,927518 0,406495 -5,10333 0,451769 0,228622 <0,05
Displacement 3D (cm) 2,14 0,871417 0,381909 2,02 0,324478 0,164205 NS
Velocity 3D (m/sec) 0,0576 0,024095 0,01056 0,0646 0,004521 0,002288 NS
Acceleration 3D (m/sec2) 0,21945 0,135828 0,059528 0,233633 0,032479 0,016436 NS
Table 8 Kinematic data: The linear displacement (cm) in sagittal (x axis), gravitational (y axis), and frontal
planes (z axis) and the 3D linear velocity (m/sec) and acceleration (m/sec2) exerted from the hip joints: a)
amongst the ipsilateral extremity and the mean from both extremities in healthy people and b) amongst the
controlateral extremity and the mean from both extremities in healthy people. Significant differences are typed in bold
and are accepted for P value <0.05, NS not significant, i.e. P value >0.05
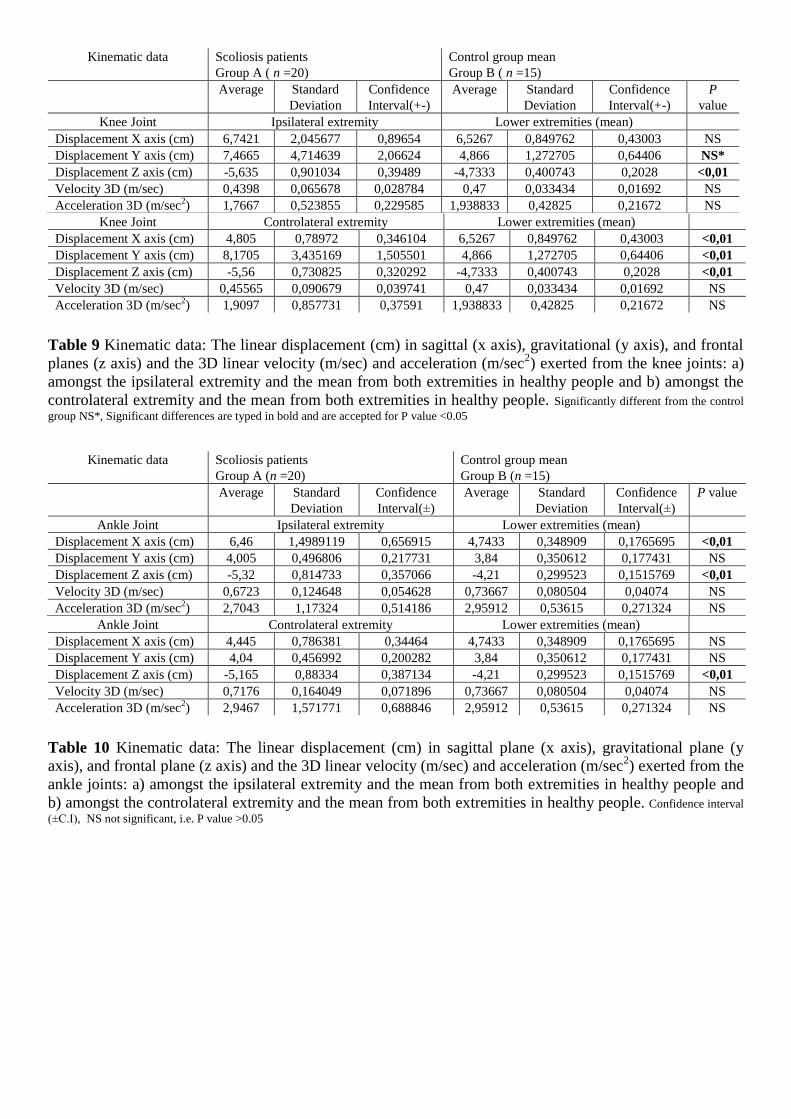
Knee Joint Controlateral extremity Lower extremities (mean)
Displacement X axis (cm) 4,805 0,78972 0,346104 6,5267 0,849762 0,43003 <0,01
Displacement Y axis (cm) 8,1705 3,435169 1,505501 4,866 1,272705 0,64406 <0,01
Displacement Z axis (cm) -5,56 0,730825 0,320292 -4,7333 0,400743 0,2028 <0,01
Velocity 3D (m/sec) 0,45565 0,090679 0,039741 0,47 0,033434 0,01692 NS
Acceleration 3D (m/sec2) 1,9097 0,857731 0,37591 1,938833 0,42825 0,21672 NS
Table 9 Kinematic data: The linear displacement (cm) in sagittal (x axis), gravitational (y axis), and frontal
planes (z axis) and the 3D linear velocity (m/sec) and acceleration (m/sec2) exerted from the knee joints: a)
amongst the ipsilateral extremity and the mean from both extremities in healthy people and b) amongst the
controlateral extremity and the mean from both extremities in healthy people. Significantly different from the control
group NS*, Significant differences are typed in bold and are accepted for P value <0.05
Ankle Joint Controlateral extremity Lower extremities (mean)
Displacement X axis (cm) 4,445 0,786381 0,34464 4,7433 0,348909 0,1765695 NS
Displacement Y axis (cm) 4,04 0,456992 0,200282 3,84 0,350612 0,177431 NS
Displacement Z axis (cm) -5,165 0,88334 0,387134 -4,21 0,299523 0,1515769 <0,01
Velocity 3D (m/sec) 0,7176 0,164049 0,071896 0,73667 0,080504 0,04074 NS
Acceleration 3D (m/sec2) 2,9467 1,571771 0,688846 2,95912 0,53615 0,271324 NS
Table 10 Kinematic data: The linear displacement (cm) in sagittal plane (x axis), gravitational plane (y
axis), and frontal plane (z axis) and the 3D linear velocity (m/sec) and acceleration (m/sec2) exerted from the
ankle joints: a) amongst the ipsilateral extremity and the mean from both extremities in healthy people and
b) amongst the controlateral extremity and the mean from both extremities in healthy people. Confidence interval
(±C.I), NS not significant, i.e. P value >0.05
Kinematic data Scoliosis patients
Group A ( n =20)
Control group mean
Group B ( n =15)
Average
Standard
Deviation
Confidence
Interval(+-)
Average
Standard
Deviation
Confidence
Interval(+-)
P
value
Knee Joint Ipsilateral extremity Lower extremities (mean)
Displacement X axis (cm) 6,7421 2,045677 0,89654 6,5267 0,849762 0,43003 NS
Displacement Y axis (cm) 7,4665 4,714639 2,06624 4,866 1,272705 0,64406 NS*
Displacement Z axis (cm) -5,635 0,901034 0,39489 -4,7333 0,400743 0,2028 <0,01
Velocity 3D (m/sec) 0,4398 0,065678 0,028784 0,47 0,033434 0,01692 NS
Acceleration 3D (m/sec2) 1,7667 0,523855 0,229585 1,938833 0,42825 0,21672 NS
Kinematic data Scoliosis patients
Group A (n =20)
Control group mean
Group B (n =15)
Average
Standard
Deviation
Confidence
Interval(±)
Average
Standard
Deviation
Confidence
Interval(±)
P value
Ankle Joint Ipsilateral extremity Lower extremities (mean)
Displacement X axis (cm) 6,46 1,4989119 0,656915 4,7433 0,348909 0,1765695 <0,01
Displacement Y axis (cm) 4,005 0,496806 0,217731 3,84 0,350612 0,177431 NS
Displacement Z axis (cm) -5,32 0,814733 0,357066 -4,21 0,299523 0,1515769 <0,01
Velocity 3D (m/sec) 0,6723 0,124648 0,054628 0,73667 0,080504 0,04074 NS
Acceleration 3D (m/sec2) 2,7043 1,17324 0,514186 2,95912 0,53615 0,271324 NS

Kinematic data Scoliosis patients
Group A (n=20)
Control group mean
Group B (n=15)
Average
Standard
Deviation
Confidence
Interval(±)
Average
Standard
Deviation
Confidence
Interval(±)
P value
Center of gravity Ipsilateral extremity Lower extremities (mean)
Displacement X axis (cm) 6,465 1,9982295 0,875747 6,07 1,0326457 0,52258123 NS
Displacement Y axis (cm) 5,5355 4,574625 2,004881 3,562 1,948334 0,985975 NS
Displacement Z axis (cm) -5,84 0,919038 0,402779 -5,24333 0,4174184 0,21123896 NS*
Displacement 3D (cm) 11,56 3,493814 1,531203 10,37 1,307233 0,661539 NS
Velocity 3D (m/sec) 0,2959 0,081886 0,035888 0,348467 0,072243 0,036559 NS
Acceleration 3D (m/sec2) 1,047 0,371145 0,162659 1,203533 0,379745 0,192174 NS
Center of gravity Controlateral extremity Lower extremities (mean)
Displacement X axis (cm) 4,33 1,075615 0,4714 6,07 1,0326457 0,52258123 <0,01
Displacement Y axis (cm) 5,5245 4,47451 1,961004 3,562 1,948334 0,985975 NS
Displacement Z axis (cm) -5,595 0,7598303 0,3330042 -5,24333 0,4174184 0,21123896 NS
Displacement 3D (cm) 10,945 1,531245 0,671085 10,37 1,307233 0,661539 NS
Velocity 3D (m/sec) 0,3122 0,074586 0,032688 0,348467 0,072243 0,036559 NS
Acceleration 3D (m/sec2) 1,1728 0,591763 0,259347 1,203533 0,379745 0,192174 NS
Table 11 Kinematic data: The linear displacement (cm) in sagittal (x axis), gravitational (y axis), and frontal
planes (z axis) and the 3D linear velocity (m/sec) and acceleration (m/sec2) exerted from the center of
gravity: a) amongst the ipsilateral extremity and the mean from both extremities in healthy people and b)
amongst the controlateral extremity and the mean from both extremities in healthy people. Significant differences
are typed in bold and are accepted for P value <0.05, NS not significant, i.e. P value >0.05
Kinematic data Scoliosis patients
Group A (n =20)
Average Standard Deviation Confidence Interval(±) P value
Knee Joint
(sagittal plane)
Ipsilateral
extremity
Controlateral
extremity
Ipsilateral
extremity
Controlateral
extremity
Ipsilateral
extremity
Controlateral
extremity
Total angles of freedom 25,54 26,99 4,97 4,95 2,18 2,17 NS
Initial contact(0) 30,55 34,7 11,20 11,26 4,91 4,93 NS
Mid stance(0) 22,15 22,7 7,59 7,29 3,33 3,20 NS
Terminal stance(0) 6,45 6,71 5,42 4,90 2,38 2,15 NS
Initial swing(0) 25,9 26,6 6,08 5,80 2,66 2,54 NS
Mid swing(0) 50,65 51,2 5,26 7,19 2,31 3,15 NS
Terminal swing(0) 31,45 32,5 10,05 9,32 4,40 4,08 NS
Table 12 Kinematic data exerted from the knee joint in the sagittal plane (y axis) amongst the ipsilateral and
the controlateral extremities in scoliosis patients during the phases of the gait cycle. NS not significant, i.e. P value
>0.05
During the phases of gait cycle in group A, the angles of the knee joint (in sagittal axis-x axis) amongst
ipsilateral and controlateral extremities did not showed any significant difference. Regarding knee range of
motion scoliosis patients had seriously reduced range of angles (degrees) during gait cycle and a number of
significant statistical differences were found amongst groups and included: in scoliosis group an initial
contact (from double support phase and with heel strike) of the ipsilateral knee that was extended at 30,60
(±4,91), initial and mid swing phases with 260
(±2,18) and 50,70
(±2,31) flexion on average respectively,
while the controlateral knee had 34,70 (±4,91) average extension at initial contact, 26,6
0 (±2,54) average
flexion at initial swing phase and 51,2 (±4,93) average flexion in mid swing phase. In contrast group B
(non-scoliosis group) had at initial contact an average extension at 20
(±0,51) and in initial and mid swing
phases an average flexion at 41,50
(±0,42) and 74,50
(±0,43), respectively, p<0,05. The difference in the
mean angular displacement of the knee joint, during the gait cycle, amongst the ipsilateral and the

controlateral extremity in group A was not significant but it is higher (1,440
,C.I ±1,07) compared to the
mean angle difference exerted from the right and left knee in group B (0,870, ±0,09), p<0,05.
Kinematic data Scoliosis patients
Group A (n =20)
Control group mean
Group B (n =15)
Average Standard
Deviation
Confidence
Interval(±)
Average Standard
Deviation
Confidence
Interval(±)
P value
Knee Joint (sagittal) Ipsilateral extremity Lower Extremities (mean)
Total Angles of freedom 25,54 4,97 2,18 31,27 0,88 0,45 <0,01
Initial contact(0) 30,55 11,20 4,91 2 1 0,51 <0,01
Mid stance(0) 22,15 7,59 3,33 24,5 0,80 0,41 NS
Terminal stance(0) 6,45 5,42 2,38 9,5 0,57 0,29 NS
Initial swing(0) 25,9 6,08 2,66 41,5 0,82 0,42 <0,01
Mid swing(0) 50,65 5,26 2,31 74,5 0,85 0,43 <0,01
Terminal swing(0) 31,45 10,05 4,40 29,5 1,15 0,58 NS
Controlateral extremity Lower Extremities (mean)
Total Angles of freedom 26,99 4,95 2,17 31,27 0,88 0,45 <0,02
Initial contact(0) 34,7 11,26 4,93 2 1 0,51 <0,01
Mid stance(0) 22,7 7,29 3,20 24,5 0,80 0,41 NS
Terminal stance(0) 6,7 4,90 2,15 9,5 0,57 0,29 NS
Initial swing(0) 26,6 5,80 2,54 41,5 0,82 0,42 <0,01
Mid swing(0) 51,2 7,19 3,15 74,5 0,85 0,43 <0,01
Terminal swing(0) 32,5 9,32 4,08 29,5 1,15 0,58 NS
Ipsilateral and controlateral extremities
difference
Lower extremities difference
Total angles of freedom 1,44 2,44 1,07 0,87 0,18 0,09 <0,01
Initial contact(0) 4,15 7,17 3,14 1 0,16 0,08 <0,03
Mid stance(0) 0,55 2,06 0,90 0,49 0,22 0,11 <0,01
Terminal stance(0) 0,25 3,21 1,41 0,31 0,09 0,05 <0,01
Initial swing(0) 0,7 2,95 1,29 0,59 0,27 0,14 <0,01
Mid swing(0) 0,55 2,91 1,28 0,53 0,22 0,11 <0,01
Terminal swing(0) 1,05 6,97 3,06 0,71 0,67 0,34 NS*
Table 13 Kinematic data exerted from the knee joint angles of freedom in the vertical plane (y axis)
amongst: a) the ipsilateral extremity of scoliosis patients and the mean from both extremities in healthy
people, b) controlateral extremity of scoliosis patients and the mean from both extremities in healthy people
during the phases of the gait cycle and c) the average differences of knee joint angles of freedom during
phases of gait cycle between ipsilateral and controlateral extremities in patients with moderate idiopathic
scoliosis and the lower extremities of healthy subjects. Significant differences are typed in bold and are accepted for P value
<0.05, NS not significant, i.e. P value >0.05, Confidence interval (±C.I), NS* different from the control group but with no significance
Discussion
Young adults suffering from scoliosis, belong to a group of population with increased demands in
everyday activities. The gait cycle plays important role in sport and occupational activities of people and can
be analysed with a simple and easy manner. The analyses could provide to us adequate information about
the treatment plan of individuals with conditions affecting their ability to walk since MIS is the commonest
type of scoliosis. We conducted this study to detect the effects of moderate idiopathic scoliosis on gait
variables, of young adults, exerted from the hip the knee and ankle joint of the lower extremities as well as
the center of gravity, and the correspondence of gait cycle relative to this kind of disorder, as compared to an
able-bodied population and an asymmetric scoliosis posture.
The imbalance created by scoliosis affect the postural parameters of stability (center of mass and center
of pressure) (Nault et al, 2002), the trunk (Raso et al, 1998), the coronal sacropelvic morphology (Mac

Thiong et al, 2006) and thus an important determinant of gait that would be primarily affected (Della Croce
et al, 2001) from this influence.
Studies showed that adolescent idiopathic scoliosis was not affecting the 3D displacement of pelvis
during normal walking, resulted as a prolonged duration of activation of par vertebral muscles and
equilibrium was maintained (Mahaudens et al, 2005) while other studies (Syczewska et al, 2006) showed
that orientation of the pelvis during walking altered and this induces changes in gait stereotype.
Other studies showed that asymmetries in the gait pattern were detected in scoliosis patients and
possible gait compensation is occurring, so that the subjects compensate on the controlateral pelvis / lower
limb to that of the curve (Chockalingam et al, 2004). The IS patients generally produced higher sway area,
lateral sway, sagittal sway, and sway radius than normal subjects. The cadence is smaller in the IS patients,
but the stance phase and stride phase are similar to normal subjects (Chen et al, 1998). Other studies,
(Mahaudens et al, 2009) suggested that patients with adult idiopathic scoliosis present no side to side
differences but compared to healthy individuals a frontal pelvis, hip, and a transversal hip and sagittal knee
motion restriction existed, the sagittal angular speed of the knee and ankle joint was decreased and the step
length was reduced by 6 cm on average and the stance phase duration by only 2% on average. All these
results indicated an almost physiological walk, even for those patients with severe scoliosis.
This study includes a major number of patients with thoraco-lumbar and lumbar primary curves because
deformities at these levels are anatomically related to pelvis (Mac Thiong et al, 2006). From the kinesiology
examination of scoliosis people in group A, it was clearly evident that an influence upon the axial
musculoskeletal system existed and similar abbreviations noted in the study of Zabjek et al, 2005. Pain is
possible an important factor that influence proper posture, according to previous studies (Cordover et al,
1997, Weiss, 1993) and locomotion as well as the pelvic obliquity secondary to scoliosis (Perry and
Burnfield, 2010), the resultant leg length difference (White and Panjabi, 1990), and the body asymmetry
which produce an asymmetrical body weight distribution on stance phase (Genthon et al, 2005).
The mean difference in the body weight distribution amongst the lower extremities in group A, compared
to this from group B was higher as well as the discrepancy too. The gait cycle that produced by the lower
extremities was affected and altered, and in group A was 14,8 % increased compared to the gait cycle
presented in group B (p<0,05) which in terms was similar to optional gait cycle (Whittle et al, 2002) as this
shown in table 14. Also a higher mean difference existed, in the gait cycle, between ipsilateral and
controlateral extremity. In contrast the mean difference amongst lower extremities in control group was
minimal (p<0,05).
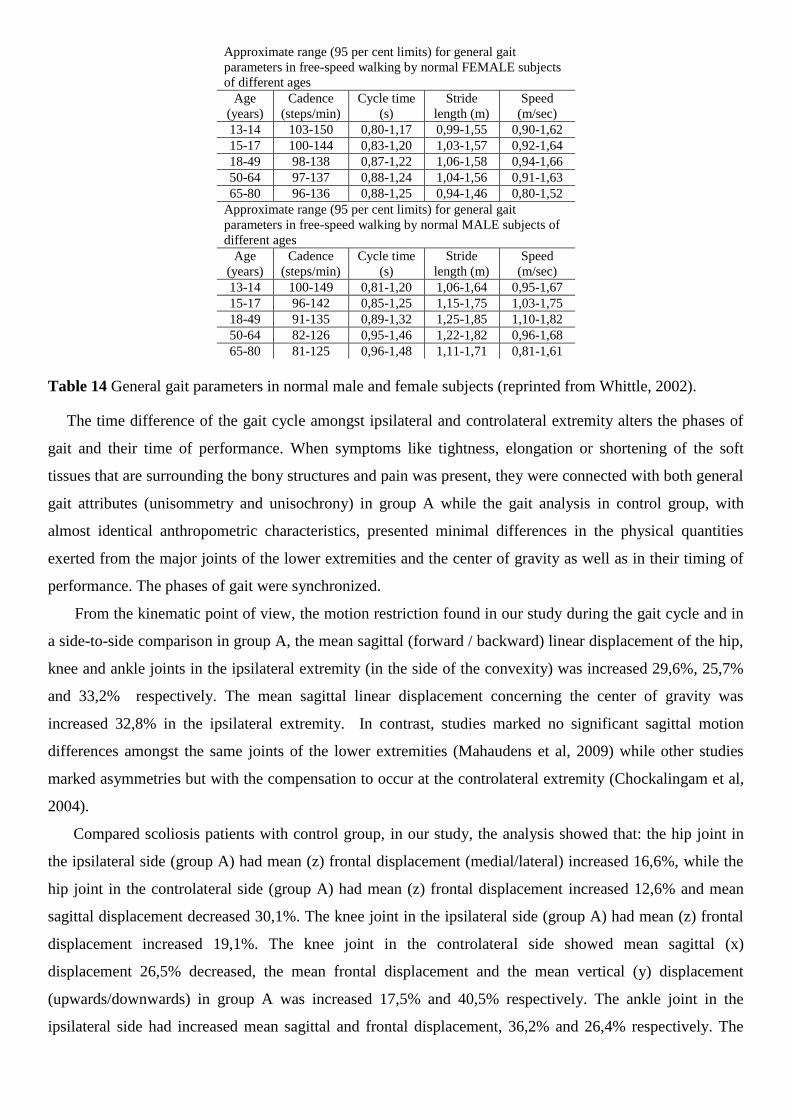
Approximate range (95 per cent limits) for general gait
parameters in free-speed walking by normal FEMALE subjects
of different ages
Age
(years)
Cadence
(steps/min)
Cycle time
(s)
Stride
length (m)
Speed
(m/sec)
13-14 103-150 0,80-1,17 0,99-1,55 0,90-1,62
15-17 100-144 0,83-1,20 1,03-1,57 0,92-1,64
18-49 98-138 0,87-1,22 1,06-1,58 0,94-1,66
50-64 97-137 0,88-1,24 1,04-1,56 0,91-1,63
65-80 96-136 0,88-1,25 0,94-1,46 0,80-1,52
Approximate range (95 per cent limits) for general gait
parameters in free-speed walking by normal MALE subjects of
different ages
Age
(years)
Cadence
(steps/min)
Cycle time
(s)
Stride
length (m)
Speed
(m/sec)
13-14 100-149 0,81-1,20 1,06-1,64 0,95-1,67
15-17 96-142 0,85-1,25 1,15-1,75 1,03-1,75
18-49 91-135 0,89-1,32 1,25-1,85 1,10-1,82
50-64 82-126 0,95-1,46 1,22-1,82 0,96-1,68
65-80 81-125 0,96-1,48 1,11-1,71 0,81-1,61
Table 14 General gait parameters in normal male and female subjects (reprinted from Whittle, 2002).
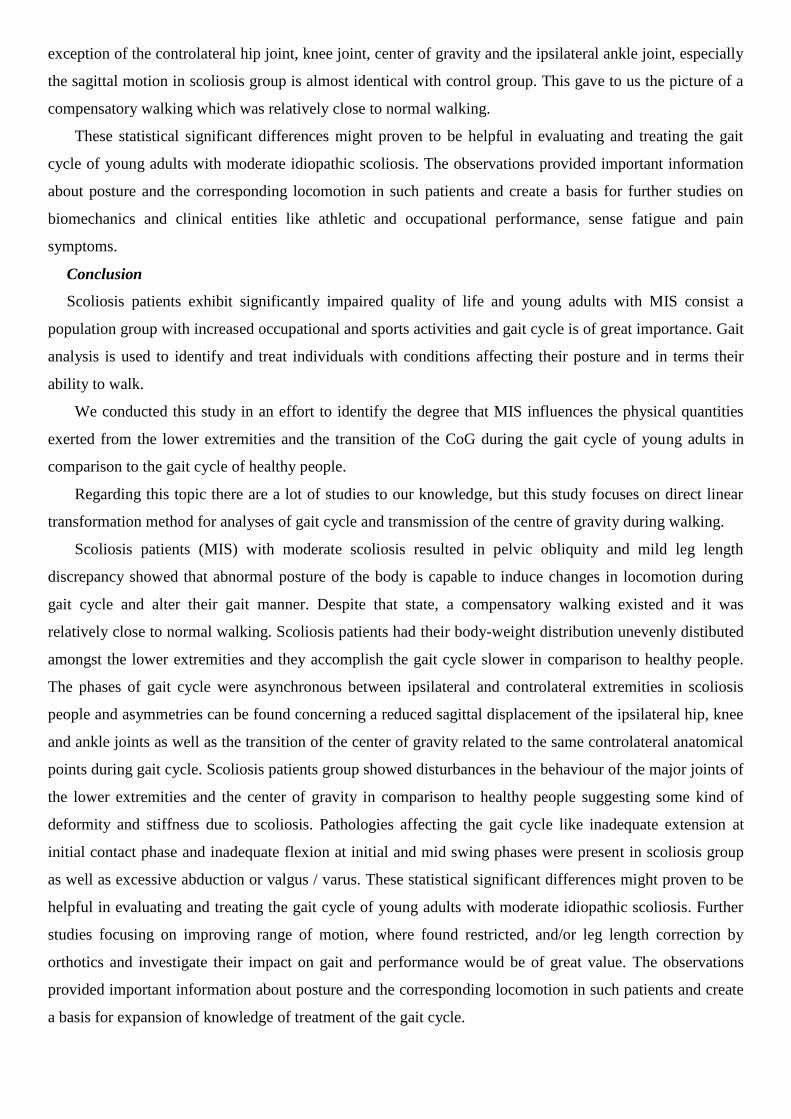
The time difference of the gait cycle amongst ipsilateral and controlateral extremity alters the phases of
gait and their time of performance. When symptoms like tightness, elongation or shortening of the soft
tissues that are surrounding the bony structures and pain was present, they were connected with both general
gait attributes (unisommetry and unisochrony) in group A while the gait analysis in control group, with
almost identical anthropometric characteristics, presented minimal differences in the physical quantities
exerted from the major joints of the lower extremities and the center of gravity as well as in their timing of
performance. The phases of gait were synchronized.
From the kinematic point of view, the motion restriction found in our study during the gait cycle and in
a side-to-side comparison in group A, the mean sagittal (forward / backward) linear displacement of the hip,
knee and ankle joints in the ipsilateral extremity (in the side of the convexity) was increased 29,6%, 25,7%
and 33,2% respectively. The mean sagittal linear displacement concerning the center of gravity was
increased 32,8% in the ipsilateral extremity. In contrast, studies marked no significant sagittal motion
differences amongst the same joints of the lower extremities (Mahaudens et al, 2009) while other studies
marked asymmetries but with the compensation to occur at the controlateral extremity (Chockalingam et al,
2004).
Compared scoliosis patients with control group, in our study, the analysis showed that: the hip joint in
the ipsilateral side (group A) had mean (z) frontal displacement (medial/lateral) increased 16,6%, while the
hip joint in the controlateral side (group A) had mean (z) frontal displacement increased 12,6% and mean
sagittal displacement decreased 30,1%. The knee joint in the ipsilateral side (group A) had mean (z) frontal
displacement increased 19,1%. The knee joint in the controlateral side showed mean sagittal (x)
displacement 26,5% decreased, the mean frontal displacement and the mean vertical (y) displacement
(upwards/downwards) in group A was increased 17,5% and 40,5% respectively. The ankle joint in the
ipsilateral side had increased mean sagittal and frontal displacement, 36,2% and 26,4% respectively. The

ankle joint in the controlateral side showed 22,8% increased mean frontal displacement. The center of
gravity in the controlateral side (group A) had mean (z) sagittal displacement decreased 28,6%.
Linear 3D velocity and acceleration was lesser in Group A but wasn’t reached the level of any significant
statistical difference.
From the above mentioned, scoliosis group had an increased sagittal displacement existed as for the 3
major joints of the ipsilateral extremity (shorter extremity) and the transmission of the center of gravity
compared to the controlateral extremity. When compared both groups, the controlateral hip joint and the
center of gravity had lesser sagittal displacement. Scoliosis group had as a part of the compensation or the
imbalance distorted motion in all 3 axes concerning the controlateral knee joint compared to healthy people.
As for the ankle joint, distorted was the sagittal and the frontal linear displacement in the ipsilateral side.
Frontal motion (medial / lateral) was affected in both knee and ankle joints from the extremities. The sagittal
motion was decreased in the controlateral knee and increased in the ipsilateral ankle while Mahaudens et al,
2009 marked higher sagittal knee motion in scoliosis people but regarding the sagittal motion of the
ipsilateral ankle did not observe any significant difference. The lateral sway (medial / lateral) in the z axis
was higher in both knee and ankle joints from the ipsilateral and the controlateral side of group A and
confirmed with other studies (Chen et al, 1998). The same studies mentioned that the vertical displacement
was increased but from our analyses only the controlateral knee joint showed increased gravitational
displacement (upwards / downwards).
Other researchers (Kramers et al, 2004) noted that sagittal plane hip motion followed a physiological
pattern during gait cycle and the most significant and marked asymmetry was seen in the transverse plane,
denoted as a torsional offset of the upper trunk in relation to the symmetrically rotating pelvis
In our study, the knee joint degrees of freedom were estimated in sagittal axis. During the phases of gait
cycle, performed from young adults with moderate idiopathic scoliosis, we didn’t found any significant
statistical differences amongst ipsilateral and controlateral extremities as well as control group too but in
scoliosis patients the ipsilateral and controlateral extremity overall angular degree of freedom was lesser.
Regarding the mean angular differences exerted by the ipsilateral and controlateral knee joint, during the
phases of gait cycle in group A, significant statistical differences were found with the exception of the mean
difference from terminal swing phase, compared to the mean angles exerted from the lower extremities in
control group. This status indicated how the knee joint was affected in scoliosis group.
In group A, the ipsilateral knee had at initial contact 93% lesser extension, initial and mid swing phases
with 37% and 32% lesser flexion on average compared to healthy extremities in control group, while the
controlateral knee showed 94 % lesser extension at initial contact, initial and mid swing phases with 36%
and 31% lesser flexion on average in comparison to group B. This can be explained as a shorter stride length
in conjunction to a higher sway radius of the distal parts of the lower extremities due to the fact that the gait
cycle was increased in period of time in scoliosis group but with no significant statistical difference in the
mean velocity and mean acceleration compared to control group. Other studies (Chen et al, 1998) didn’t
show differences in stance and stride phases amongst scoliosis patients and healthy people. With the
exception of the controlateral hip joint, knee joint, center of gravity and the ipsilateral ankle joint, especially
the sagittal motion in scoliosis group is almost identical with control group. This gave to us the picture of a
compensatory walking which was relatively close to normal walking.
These statistical significant differences might proven to be helpful in evaluating and treating the gait
cycle of young adults with moderate idiopathic scoliosis. The observations provided important information
about posture and the corresponding locomotion in such patients and create a basis for further studies on
biomechanics and clinical entities like athletic and occupational performance, sense fatigue and pain
symptoms.
Conclusion
Scoliosis patients exhibit significantly impaired quality of life and young adults with MIS consist a
population group with increased occupational and sports activities and gait cycle is of great importance. Gait
analysis is used to identify and treat individuals with conditions affecting their posture and in terms their
ability to walk.
We conducted this study in an effort to identify the degree that MIS influences the physical quantities
exerted from the lower extremities and the transition of the CoG during the gait cycle of young adults in
comparison to the gait cycle of healthy people.
Regarding this topic there are a lot of studies to our knowledge, but this study focuses on direct linear
transformation method for analyses of gait cycle and transmission of the centre of gravity during walking.
Scoliosis patients (MIS) with moderate scoliosis resulted in pelvic obliquity and mild leg length
discrepancy showed that abnormal posture of the body is capable to induce changes in locomotion during
gait cycle and alter their gait manner. Despite that state, a compensatory walking existed and it was
relatively close to normal walking. Scoliosis patients had their body-weight distribution unevenly distibuted
amongst the lower extremities and they accomplish the gait cycle slower in comparison to healthy people.
The phases of gait cycle were asynchronous between ipsilateral and controlateral extremities in scoliosis
people and asymmetries can be found concerning a reduced sagittal displacement of the ipsilateral hip, knee
and ankle joints as well as the transition of the center of gravity related to the same controlateral anatomical
points during gait cycle. Scoliosis patients group showed disturbances in the behaviour of the major joints of
the lower extremities and the center of gravity in comparison to healthy people suggesting some kind of
deformity and stiffness due to scoliosis. Pathologies affecting the gait cycle like inadequate extension at
initial contact phase and inadequate flexion at initial and mid swing phases were present in scoliosis group
as well as excessive abduction or valgus / varus. These statistical significant differences might proven to be
helpful in evaluating and treating the gait cycle of young adults with moderate idiopathic scoliosis. Further
studies focusing on improving range of motion, where found restricted, and/or leg length correction by
orthotics and investigate their impact on gait and performance would be of great value. The observations
provided important information about posture and the corresponding locomotion in such patients and create
a basis for expansion of knowledge of treatment of the gait cycle.

References
1. Abdel-Aziz YI, Karara HM: Direct linear transformations into object space coordinates in close range
photogrammetry. In Symposium on close range photogrammetry, Urbana, 111, 1971, University of
Illinois at Urbana-Champaign.
2. Agabegi Elizabeth D; Agabegi, Steven S. (2008). Page 90 in: Step-Up to Medicine (Step-Up Series).
3. Alexander, M. A., Bunch, W. H., and Ebbesson, S. 0. E.: Can experimental dorsal rhizotomy produce
scoliosis? J. Bone joint Surg., 54AA509, 1973.
4. Braune W, Fischer: The human gait, Berlin. 1,4Springer.
5. Bresler B, Frankel JP: The forces and moments in the leg during level walking, ASME Transactions 27-
36, 1950.
6. Chau T. (2001a) A review of analytical techniques for gait data. Part 1: fuzzy, statistical and fractal
methods. Gait and Posture 13: 49-66.
7. Chau T. (2001b) A review of analytical techniques for gait data. Part 2: neural network and wavelet
methods. Gait and Posture 13: 102-120. 8. Chen P.Q., Wang J.L., Tsyang Y.H., Huang P.I., Hang Y.S., 1998.The postural stability control and gait
patterns of idiopathic scoliosis in adolescents. Clinical biomechanics 13 S52-S58. 9. Chockalingam N, Dangerfield PH, Rahmatalla A et al. Assessment of ground reaction force during
scoliotic gait. Eur.Spine J 2004. 10. Cobb JR. The American Academy of Orthopedic Surgeons Instructional Course Lectures. Vol. 5. Ann
Arbor, MI: Edwards; 1948. 11. Cordover AM, Betz RR, Clements DH, Bosacco SJ. Natural history of adolescent thoracolumbar and
lumbar idiopathic scoliosis into adulthood. J Spinal Disord. 1997;10:193–6. 12. Craik R. & C. Oatis. Gait analysis theory and application, 1995, Mosby 13. Della Croce U, Riley PO, Lelas JL, Kerrigan DC (2001) A refined view of the determinants of gait. Gait
Posture 14:79–84. 14. DiRocco PJ, Vaccaro P: Cardiopulmonary functioning in adolescent patients with mild IS. Arch Phys
Med Rehab 1983, 69:198-201. 15. Genthon N. and Rougier P. Influence of an asymmetrical body weight distribution on the control of
undisturbed upright stance, Journal of biomechanics 38 (2005) 2037-2049. 16. Gilbert JA et al: A system to measure the forces and moments at the knee and hip during level walking,
J Orthop Res 2:281, 1984.
17. Gray, H.: Anatomy of the Human Body. ed. 23. Lewis, W. H. [ed.]. Philadelphia, Lea & Febiger, 1936.
18. Hakkarainen, S.: Experimental scoliosis: production of structural scoliosis by immobilization of young
rabbits in a scoliotic position. Acta Orthop. Scand., Suppl. 52(192) A, 1981.
19. Nick Harris, David Stanley, Advanced Examination Techniques in Orthopaedics. 2002 1st edition,
Cambridge University Press.
20. Holden JP, Orsini JA, Siegel KL et al. (1997) Surface movement errors in shank kinematics and knee
kinetics during gait. Gait and Posture 5: 217-227.
21. Inman, VT, Ralston, HJ and Todd, F: Human walking. Williams and Wilkins, Baltimore, 1981.
22. International Society of Biomechanics Newsletter: (1992), No. 45.
23. Karski T. Etiology of the so-called "idiopathic scoliosis". Biomechanical explanation of spine
deformity. Two groups of development of scoliosis. New rehabilitation treatment; possibility of
prophylactics. Stud Health Technol Inform. 2002;91:37-46.
24. Kramers-de Quervain IA, Müller R, Stacoff A, Grob D, Stüssi E. Gait analysis in patients with
idiopathic scoliosis. Eur Spine J. 2004 Aug;13(5):449-56. Epub 2004.
25. Krebs DE, Edelstein JE, Fishman S. (1985) Reliability of observational kinematic gait analysis.
Physical Therapy 65: 1027-1033
26. Ladin Z, Wu G: Combining position and acceleration measurements for joint force estimation, J
Biomech 24(12):1173, 1991.
27. Langenskibld, A., and Michelsson, J. E.: The pathogenesis of experimental progressive scoliosis. Acta
Orthop. Scand., Suppl. 59A, 1962.
28. Larsson, LE, Odenrick, P and Sandlund, B: The phases of the stride and their interaction in human gait.
Scand J Med Rehab, 12:107, 1980.
29. Lawton, J. 0., and Dickson, R. A.: The experimental basis of idiopathic. scoliosis. Clin. Orthop., 210:9,
1986.
30. Karel Lewit - Manipulative Therapy in Rehabilitation of the Locomotor System. 3rd ed,2000,
Butterworth-Heinemann
31. Lonestien Je, Carlson JM. The prediction of curve progression in untreated idiopathic scoliosis during
growth. J Bone Joint Surg 1984; 66A:1061-1071
32. Lonstein JE, Winter RB, Bradford DS, Oglive JW. Moe’s textbook of scoliosis and other spinal
deformities 3rd ed, WB Saunders Company 1995.
33. Loynes, R.: Scoliosis after thoracoplasty. J. Bone joint Surg., 54BA84, 1972.
34. MacEwen, G. D.: Experimental scoliosis. In Zorab, P. A. (ed.): Proceedings of a Second Symposium on
Scoliosis:Causation. Edinburgh, E & S Livingston, 1968. 35. Mac-Thiong JM, Labelle H, de Guise JA (2006) Comparison of sacropelvic morphology between
normal adolescents and subjects with adolescent idiopathic scoliosis. Stud Health Technol Inform 123:195–200
36. Mahaudens P. Ζ X. Banse Ζ M. Mousny Ζ C. Detrembleur. Gait in adolescent idiopathic scoliosis: kinematics and electromyographic analysis Eur Spine J (2009) 18:512–521
37. Mahaudens P, Thonnard JL, Detrembleur C (2005) Influence of structural pelvic disorders during standing and walking in adolescents with idiopathic scoliosis. Spine J 5:427–433.
38. Marieb, Elaine Nicpon (1998). Human anatomy & physiology. San Francisco: Benjamin Cummings. 39. Mayo NE, Goldberg MS, Poitras B, et al.: The Ste-Justine AIS cohort study: Back pain. Spine
1994, 19:1573-1581. 40. Mayfield, J. K., Riseborough, E. j., jaffe, N., and Nehme, M. E.:Spinal deformity in children treated for
neuroblastoma. J.Bone joint Surg., 63AA83, 1981.
41. McCarver, G, Levine, D., and Veliskakis, K.: Left thoracic and related curve patterns in idiopathic
scoliosis. J. Bone joint Surg., 53A:196, 1971.
42. Michelsson, j.: The development of spinal deformity in experimental scoliosis. Acta Orthop. Scand., 81
[Suppl.], 1965. (An excellent review of animal experiments related, to scoliosis.)
43. Muybridge E: Animal locomotion. In Brown LS, editor: Animal in Motion, London, 1975, Chapman &
Hall.
44. Nault M.L., Allard P., Hinse S., Le Blanc R., Caron O., Labelle H., sadeghi H., 2002. Relations between
standing stability and body posture parameters in adolescent idiopathic scoliosis. Spine 27 1911-1917.
45. 0hlen, G., Aaro, S., and Byland, R: The sagittal configuration and mobility of the space in idiopathic
scoliosis. Spine, 13:413, 1988.
46. Papaioarmou, T., Stokes, L, and Kenwright, j.: Scoliosis associated with limb-length inequality. J. Bone
joint Surg.,64A:59, 1982.
47. Perry Jacquelin and Judith M. Burnfield, Gait Analysis: Normal and Pathological Function 2nd ed, 5
Thorofare, NJ, Slack Inc, 2010 ISBN-13: 978-1-5564-2766-4
48. Piggott, H: The natural history of scoliosis in myelodysplasia. J. Bone joint Surg., 6213:54, 1980.
49. Pincott, J. R., Davies, J. S., and Taffs, L. F.: Scoliosis caused by section of dorsal spinal nerve roots. J.
Bone joint Surg.,66B:27, 1984.
50. Pincott. J. R., and Tafts, L. F.: Experimental scoliosis in primates: a neurological cause. J. Bone
joint Surg.,64B:503, 1982.
51. Radin EL et al: Relationship between lower limb dynamics and knee joint pain, Journal of Orthopedic
Research 9:398-405, 1991.
52. Raso VJ, Lou E, Hill DL, Mahood JK, Moreau MJ, Durdle NG. Trunk distortion in adolescent
idiopathic scoliosis. J Pediatr Orthop. 1998 Mar-Apr;18(2):222-6.
53. Reinschmidt C, van den Bogert Al, Lundberg A et al. (1997) Tibiofemoral and tibiocalcaneal motion
during walking: external vs. skeletal markers. Gait and Posture 6: 98-109.
54. Renshow TS. Screening school children for scoliosis. Clin Orthopr Apr 1988; 229;26-33
55. Roaf, R.: The basic anatomy of scoliosis. J. Bone joint Surg.,48B:786, 1966. (An interesting and
important theory.)
56. Rosse, C and Clawson, K: The Musculoskeletal System in Health and Disease. Harper & Row,
Hagerstown, MD, 1980.)
57. Schwab F, Dubey A, Pagala M, et al.: Adult scoliosis: A health assessment analysis by SF-36. Spine
2003, 28:602-606. Sevastik, J. A., Aaro, S., and Normelli, H.: Scoliosis: experimental and clinical
studies. Clin. Orthop., 191:27,1984. (A thorough, very useful review article.)
58. Soderberg GL. Application to pathological motion, 2nd
ed. Williams & Wilkins, 1996.
59. Stillwell, D. L.: Structural deformities of vertebrae: bone adaption and modeling in experimental
scoliosis and kyphosis. J. Bone joint Surg., 44A:611, 1962.
60. Syczewska Małgorzata, Łukaszewska Anna, Górak Beata, Graff Krzysztof., Changes in gait pattern in
patients with scoliosis. Medical Rehabilitation 2006, 10 (4): 12-21

61. Vaughan, C.L., Davis B.L., O’Connor J.C., 1999. Dynamics of human gait, second ed. Kiboho pub,
Cape Town, S. Africa. 62. Weinstein SL, Dolan LA, Spratt KF, et al.: Health and function of patients with untreated IS: A 50
year natural history survey. JAMA 2003, 298:559-567. 63. Weiss HR, "Scoliosis-related pain in adults: Treatment influences," European Journal of Physical
Medicine and Rehabilitation 3/3 (1993): 91–94 64. White Augustus A. & Manohar M. Panjabi, Clinical Biomechanics of the Spine, 2
nd ed., 1990,
Lippincott Williams &Wilkins. 65. Whittle MW. (1982) Calibration and performance of a three-dimensional television system for
kinematic analysis. Journal of Biomechanics 15: 185-196. 66. Whittle W. Michael, Gait analysis an introduction. 3
rd edition, 2002, Butterworth-Heinemann.
67. Winter David A., Biomechanics and motor control of human movement, 4th
edition, 2009, J.Wiley & Sons,Inc
68. Wu G, Ladin Z: The kinematometer: an integrated kinematic sensor for kinesiological measurements,
ASME Trans J Biomech Eng 115(l):53, 1993.
69. Yamada, K., et aL A neurological approach to the etiology and treatment of scoliosis. J. Bone joint
Surg., 53AA97, 1971.
70. Yamada, K., Yamamoto, H., Nakagaura, Y., Tezuka, A., Tamura, T., and Kawata, S.: Etiology of
idiopathic scoliosis. Clin. Orthop., 184:50, 1984. (A comprehensive, informative review of the studies
in japan.)
71. Yarom, R., and Robin, G. G: Studies on spinal and peripheral muscles from patients with scoliosis.
Spine. 4:12, 1979.
72. Yeadon MR: Numerical differentiation of noisy data, Proceedings of the Twelfth International Congress
of Biomechanics, Abstract No. 125, 1989. 73. Zabzek, K. F., Leroux, M. A., Moillard, C. et al.: Acute postural adaptations induced by a shoe lift in IS
patients. European Spine Journal, 10: 107–113, 2001. 74. Zabjek F. Karl, Lerouyx A. Michel, Coillard Christine, Rivard Charles-H and Prince Francois.
Evaluation of the segmental postural characteristics during quiet standing in control and idiopathic scoliosis patients, Clinical biomechanics 20 (2005) 483-490.
ABBREVIATIONS
(Adapted Whittle,2002)
Initial contact-IC
Opposite toe off-OTO
Heel rise-HR
Opposite initial contact-OIC
Toe off-TO
Feet adjacent-FA
Tibia vertical-TV
Loading response-LR
Mid-stance-MS
Terminal stance-TSt
Pre-swing-PSw
Initial swing-ISw
Mid-swing-MSw
Terminal swing-TSw
Base of support-BOS
