faculty of resource science and technology - welcome to … and quality of househol... · bagi...
TRANSCRIPT
Faculty of Resource Science and Technology
QUANTITY AND QUALITY OF HOUSEHOLD WASTEWATER
Sumiyanti binti Bostam
Bachelor of Science with Honors
(Resource Chemistry)
2008

QUANTITY AND QUALITY OF HOUSEHOL WASTEWATER
SUMIYANTI BINTI BOSTAM
This dissertation is submitted in partial fulfillment of requirements for the degree of
Bachelor of Sciences with Honors (Resource Chemistry)
Faculty of Resource Science and Technology
UNIVERSITI MALAYSIA SARAWAK
2007/08

DECLARATION
No section of the work referred to in this dissertation has been submitted in support of an
application for another degree of qualification of this or any other university or institution of higher
learning.
____________________________________
Sumiyanti binti Bostam
Resource Chemistry Programme
Faculty of Resource Science and Technology
Universiti Malaysia Sarawak

ii
ACKNOWLEDGEMENT
First of all, I would like to express my greatest gratitude to my supervisor, Dr. Ling Teck
Yee for helping me in completing this project by giving advices and guidance in doing the report.
I also would like to give thanks to Mr. Send Takuk (Environmental Laboratory Assistant)
for his accompany, guidance and cooperation during this project. Also thanks to Mr. Harris
(Aquatic Laboratory Assistant) for letting us used the laboratory.
Special thanks to my family and friends especially Malini, Debbie, Kak Illyana and Kak
Syikin for helping me for their support and cooperation. Also thanks to my colleagues of Resource
Chemistry and ROTU for their understanding and cooperation.
Lastly, I would like to thank the other lecturers, laboratory assistants and my friends for
their help directly or indirectly. Thanks to all their support, guidance, cooperation and
understanding.
iii
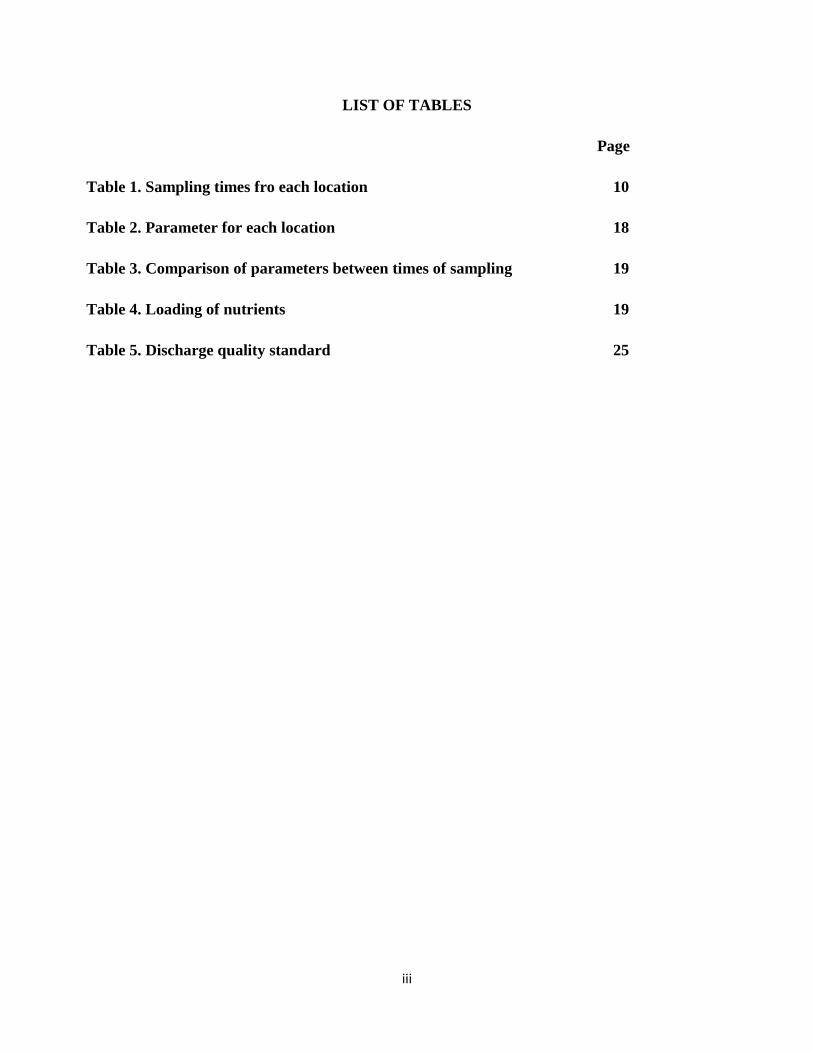
LIST OF TABLES
Page
Table 1. Sampling times fro each location 10
Table 2. Parameter for each location 18
Table 3. Comparison of parameters between times of sampling 19
Table 4. Loading of nutrients 19
Table 5. Discharge quality standard 25
iv
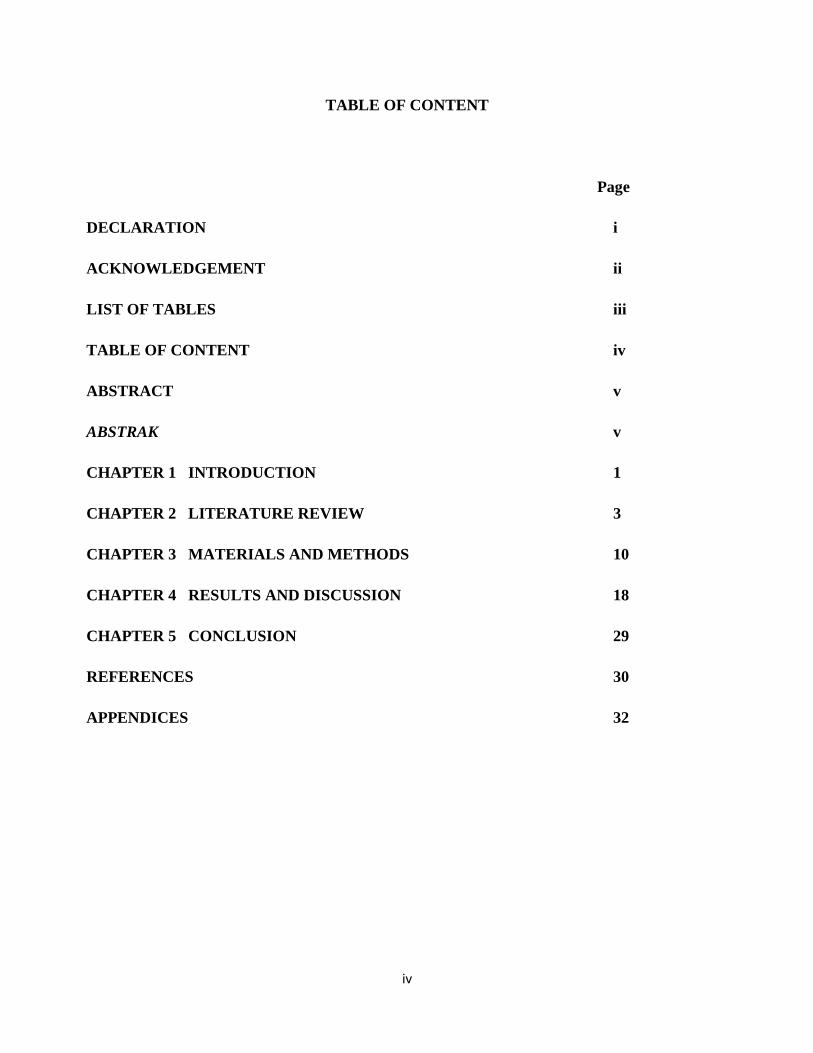
TABLE OF CONTENT
Page
DECLARATION i
ACKNOWLEDGEMENT ii
LIST OF TABLES iii
TABLE OF CONTENT iv
ABSTRACT v
ABSTRAK v
CHAPTER 1 INTRODUCTION 1
CHAPTER 2 LITERATURE REVIEW 3
CHAPTER 3 MATERIALS AND METHODS 10
CHAPTER 4 RESULTS AND DISCUSSION 18
CHAPTER 5 CONCLUSION 29
REFERENCES 30
APPENDICES 32

v
Quantity and Quality of Household Wastewater
Sumiyanti binti Bostam
Resource Chemistry
Department of Chemistry
Faculty of Resource Science and Technology
University Malaysia Sarawak
ABSTRACT
This study is about measuring and determining the quantity and quality of household wastewater from two different
housing areas which are Taman Malihah and Tabuan Jaya. The trips for the sample collection were done for three times.
For Taman Malihah, the sampling was done at Lorong 4G at 9.30 am while for Tabuan Jaya, the sampling point was at
Lorong Bayor Bukit 18 at 11.30 am. From this study, the average value of temperature was 32.62 °C, while for pH the
average value was 7.11. The average value of total suspended solids, DO level, BOD, COD, nitrate, ammonia and
reactive phosphorus were 391.33 mg/L, 1.42 mg/L, 141.12 mg/L, 128.89 mg/L, 0.02 mg/L, 6.16 mg/L and 1.41 mg/L
respectively. The average water discharge was 0.01 m3/s. All the values were the average values between the housing
areas. The loading of total suspended solids, BOD, COD, nitrate, ammonia and reactive phosphorus for Taman Malihah
were 431.73 kg/d, 204.98 kg/d, 186.80 kg/d, 0.04 kg/d, 16.57 kg/d and 1.60 kg/d respectively. While for Tabuan Jaya,
the loadings were 81.11 kg/d, 23.53 kg/d, 21.54 kg/d, 0.003 kg/d, 0.02 kg/d and 0.28 kg/d respectively.
Keywords : household wastewater, characteristics
ABSTRAK
Kajian ini adalah tentang mengukur kuanti dan kualiti sisa air rumah dari dua kawasan perumahan iaitu Taman
Malihah dan Tabuan Jaya. Pensampelan telah dilakukan sebanyak tiga kali. Bagi kawasan perumahan Taman
Malihah, sampel diambil di Lorong 4G pada pukul 9.00 pagi, manakala sampel bagi kawasan prumahan Tabuan
Jaya, diambi di Lorong Bayor Bukit 18 pada 11.30 pagi. Keputusan kajian menunjukkan purata suhu sisa air adalah
32.62 °C manakala untuk nilai purata pH adalah 7.11. Nilai purata bagi jumlah pepejal terampai, DO, BOD, COD,
nitrat, ammonia dan fosforus reaktif adalah 391.33 mg/L, 1.42 mg/L, 141.12 mg/L, 128.89 mg/L, 0.02 mg/L, 6.16 mg/L
and 1.41 mg/L setiap satu. Purata air yang dihasilkan dari rumah adalah 0.01 m3/s. Muatan BOD, COD, nitrat,
ammonia and fosforus reaktif dalam sisa air rumah bagi kawasn perumahan Taman Malihah adalah 431.73 kg/d,
204.98 kg/d, 186.80 kg/d, 0.04 kg/d, 16.57 kg/d and 1.60 kg/d setiap satu. Manakala bagi kawasan perumahan Tabuan
Jaya, muatan bagi parameter dalam sisa air rumah adalah 81.11 kg/d, 23.53 kg/d, 21.54 kg/d, 0.003 kg/d, 0.02 kg/d
and 0.28 kg/d setiap satu.
Kata kunci: sisa air rumah, ciri-ciri
1
CHAPTER 1
INTRODUCTION
Quantitative analysis refers to the measurement of the flow rate of the wastewater. The flow
rate of the wastewater is dependent on the human activities, the more activities that required the
using of water, the higher the flow rate will be. The sampling time will be dependent on the flow
rate. According to Brichford et al. (2001), the average water use in rural households is 151.42 L to
189.27 L each person per day.
Qualitative analysis is referring to the measurement of the chemical, physical and biological
contents of wastewater. There are three types of parameters that can be used to determine the
quality of wastewater like chemical parameters, physical parameters and biological parameters. In
this study the chemical parameters that will be determine are dissolved oxygen (DO), biochemical
oxygen demand (BOD), chemical oxygen demand (COD), nitrate (NO3-), ammonia-N (NH3),
reactive phosphorus (P) and pH, temperature (°C) and total suspended solid (TSS) are the physical
parameters.
The rationales of doing this project are to measure the amount of wastewater that produced
per person per day and the amount of contaminant discharged. Reducing the use of water will affect
the contents or the concentration of contaminants in the wastewater (Brichford et al. 2001).
According to Nathanson (1986), contaminated water, air or food can cause disease and the
contaminants are usually chemically toxic that come from industrial and household activities.
Wastewater that is not properly treated can harm public health and environment. Thus, the
objectives of this study are to determine the quantity and the quality of wastewater by comparing

2
the concentration and loading of nutrients in household wastewater and water discharge per person
per day between Taman Malihah and Tabuan Jaya housing area.

3
CHAPTER 2
LITERATURE REVIEW
2.1 Wastewater
Wastewater can be defined as any water that have been used for various purposes around the
community and has been affected by anthropogenic influence (Llynghus and Larsen, 2004). Most
communities generate wastewater from both residential and nonresidential sources. It comprises
liquid waste that is discharged by domestic residences, industry and agriculture and can be a wide
range of substances and pollutants. In the most common usage, it can be referred as municipal
wastewater that contains a whole range of contaminants that are results from the mixing of
wastewaters from different sources. Sewage is the subset of wastewater that is contaminated with
feces or urine, but it is often used to mean by any wastewater. Sewage includes domestic, municipal
or industrial liquid waste products disposed of by pipe or sewer or similar structure. If not properly
treated, wastewater can harm public health and the environment. In this study, we will only discuss
on domestic wastewater that is also called as household wastewater.
Domestic wastewater is water that discharge from toilets, kitchen and food preparation,
washing and bathing and normal house cleaning. It can be dividing into black water and grey water.
Grey water composed of wastewater from the shower, bathtub, spa bath, hand basin, laundry tub,
clothes washer, kitchen sink and dishwasher and any water that is not discharge from the toilet
(Erikkson et al., 2002). Term black water is used to describe water containing fecal matter and
urine. It is also known as brown water, foul water or sewage. It is distinct from grey water, the
residues of washing process. Black water is heavily polluted and difficult to treat because of the

4
high concentrations of mostly organic matter, nitrogen (N) and moderate contents of phosphorus
(P).
2.2 Quantity of wastewater
The quantity of water used depends upon the number of people at the area, how water is
used and the maintenance of the water supply system. Average water used in rural households is
150 L to 190 L each person per day (Brichford et al., 2001). With low use fixtures and individual
awareness and concern, a reduction to less than 94 L per person per day is possible. The treatment
of the wastewater can be improved by reducing the volume of water entering the system. This will
increase the time of water spends in the system and providing longer time for settling, separation
and more to soil contact (Brichford et al., 2001).
2.3 Quality of wastewater
The quality of water refers to what is in the water. Wastewater usually contains relatively
small amounts of contaminants but they make a big difference in the usefulness of the water.
Contaminants found in wastewater include chemical, physical and biological that can cause disease
in humans. Most of suspended solid can be separated from liquid waste by allowing enough time in
relatively calm septic tank. Greases and fats are a part of the suspended solids. Filtration beds and
absorption systems can be clogged by wastewater high in suspended solids. Organic solvents from
cleaning agents and fuels may not be degraded or removed through treatment and can pass along
5
with the wastewater back into the water supply while nitrogen from human waste and phosphorus
from detergents and some chemical water conditioners are the most notable (Brichford et al., 2001).
2.4 Parameters of water quality
2.4.1 Temperature
According to Nathanson (1986), the temperature will affect the solubility of oxygen in
water. The higher the temperature of water raised up, the lower the solubility of oxygen in water.
Temperature plays an important role in wastewater and water pollution control.
2.4.2 pH
pH or the “potential of hydrogen” is the measurement of hydrogen ions concentration in
water. It indicates the acidity or alkalinity of water. On the pH scale between 0-6 is considered
acidic, 8-14 is considered alkaline and pH 7 is considered neutral water. The naturally occurring
water usually has pH range between 6 and 8 (Bordin, 1996). Water containing organic pollutants
will yield acidic water. A typical procedure for measurement of pH involves calibration of the pH
meter with two buffer solutions spanning the expected pH of the sample, then measurement of the
sample (Trivedi and Raj, 1992; Reeve, 1994). pH value can be calculated as:
pH = log10 [1/H+] or pH = -log10 [H
+]
6
2.4.3 Total suspended solid (TSS)
Solids refer to matter that are dissolved or suspended in water or wastewater and will affect
water or effluent quality. Water with high dissolved are generally inferior palatability (APHA,
1998). The total solid content in water defined as the residue remaining after evaporation of the
water and drying the residue to a constant weight (Joseph, 1996). Suspended solids also known as
non-filterable solids (Joseph, 1996) meant that the water and particulates can pass through the filter
paper. Thus in chemistry, the non-filterable solids are the retained material called the residue.
2.4.4 Dissolved oxygen (DO)
Dissolved oxygen (DO) is the measurement of oxygen that dissolved in water. It is very
important as the marine life depends on it in water. The DO levels decrease if the production of
oxygen is less that the usage of oxygen and this may affect the aquatic life. The DO may vary with
the temperature change and altitude. Warm water hold less oxygen than the cold one and the water
holds less oxygen at higher altitudes. Therefore, processes such as cooling the machinery using
water will arise the temperature and lower its oxygen content. DO is widely used as an
environmental monitoring and measurement of a controlled process. The controlled processes
include the control of activated sludge treatment plants and trace level measurement of boiled water.
Environment monitoring involves water quality within rivers and lakes. Low levels of DO in water
are sign of pollution. DO is measured either in milligrams per liter (mg/L) or “percent saturation”.
A milligram per liter is the amount of oxygen in a liter of water. Percent saturation is the amount of
oxygen in a liter of water relative to the total amount of oxygen that the water can hold at that

7
temperature. DO is measured primarily either by using some variations of the Winkler method or by
using a meter and probe (Trivedi and Raj, 1992).
2.4.5 Biochemical oxygen demand (BOD)
Biochemical oxygen demand (BOD) is the measurement of the amount of oxygen consumed
by bacteria to break down organic matter (food) in the water. It is expressed in mg/L. Bacteria
utilize organic matter in their respiration and remove oxygen from water. The larger the amount of
organic materials found in the streams, the more oxygen is used for aerobic oxidation. Wastewater
from sewage treatment plants often contains organic materials that will be decomposed by
microorganism, which used oxygen in the process. This will decrease the amount of dissolved
oxygen available for aquatic life. Types of microorganisms, pH, presence of toxins, some reduced
mineral matter and nitrification process have been the important factors that influence the BOD test
(Tyagi and Mehra, 1990). Typical BOD values for unpolluted water are of the order of a few mg/L.
Many seemingly innocuous effluents have a very high oxygen demand (Reeve, 1994).
2.4.6 Chemical oxygen demand (COD)
Chemical oxygen demand (COD) is the measurement of amount of organic pollutants found
in surface water (which are chemically oxidized). It is expressed in mg/L which indicates the mass
of oxygen consumed by organic compounds per liter of solution. Presence of toxins and other such
as unfavorable conditions for the growth of microorganisms is not able to affect COD values (Tyagi
and Mehra, 1990)
8
2.4.7 Nitrate (NO3--N)
Nitrogen is present in many forms in aquatic systems. Many of these forms are quickly
oxidized into nitrate or are volatized back to the atmosphere. Nitrogen is found in greater abundance
than phosphorus in aquatic systems. However, coupled with phosphorus, excessive amounts of
nitrate can accelerate eutrophication, leading to increases in aquatic plant growth. Problems
associated with eutrophication include decreases in organism diversity and recreational activities
and reduced property and aesthetic values. In addition, high levels of nitrates in drinking water can
lead to serious health effects for example metheomoglobinemia (blue baby syndrome) (Anonymous,
2007).
2.4.8 Ammonia-N (NH3-N)
Ammonia is one of the major constituents contributing to the toxicity of municipal waters.
At high pH, free NH3 and its hydrolysis product are toxic in low concentration while at low pH,
they are converted into ammonium ions (NH4+) which are comparatively non-toxic (Trivedi and
Raj, 1992). Ammonia is highly toxic to fish life and the water discharge level of ammonia from
wastewater treatment plants must often be closely monitored. To prevent loss of fish, nitrification
prior to discharge is often desirable. Land application can be an attractive alternative to the
mechanical aeration needed for nitrification.

9
2.4.9 Reactive phosphorus (P)
Larger quantity of the phosphorus found in laundering and cleaning because these materials
are major constituent of many commercial cleaning preparations (APHA, 1998). The common
compounds of phosphorus are orthophosphate and polyphosphate that is used in the formulation of
synthetic detergent and organic phosphorus (Butler et al., 1995).
10
CHAPTER 3
MATERIALS AND METHODS
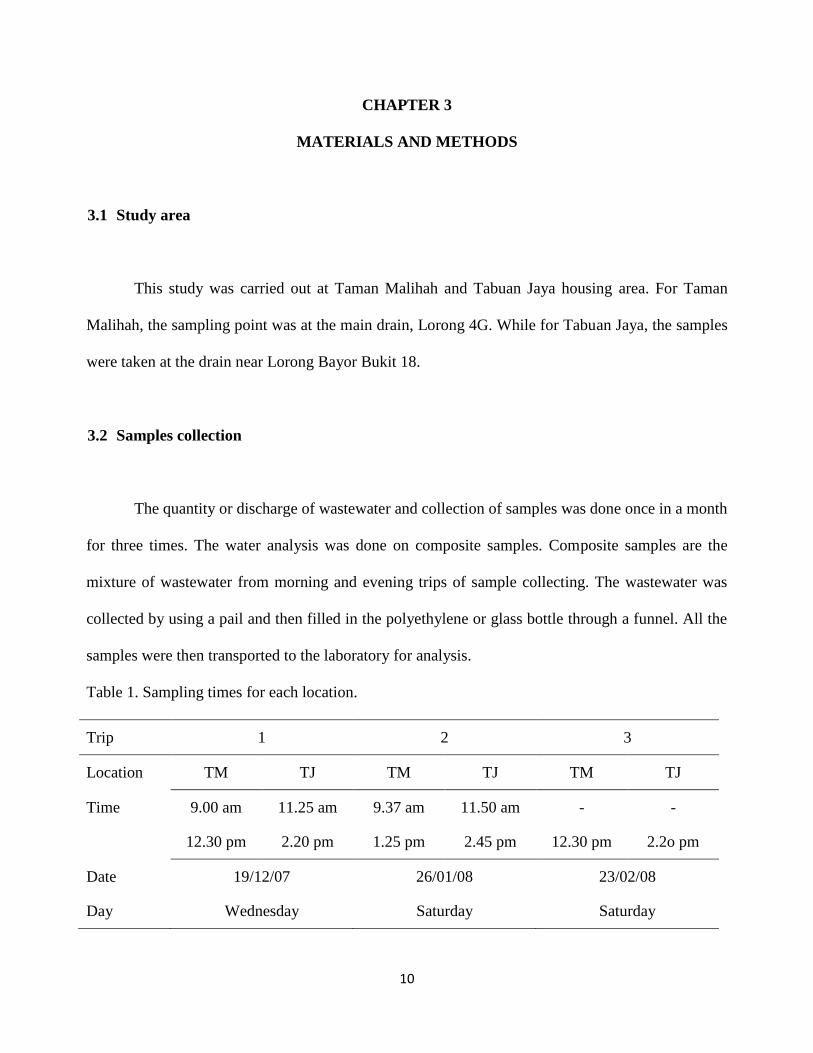
3.1 Study area
This study was carried out at Taman Malihah and Tabuan Jaya housing area. For Taman
Malihah, the sampling point was at the main drain, Lorong 4G. While for Tabuan Jaya, the samples
were taken at the drain near Lorong Bayor Bukit 18.
3.2 Samples collection
The quantity or discharge of wastewater and collection of samples was done once in a month
for three times. The water analysis was done on composite samples. Composite samples are the
mixture of wastewater from morning and evening trips of sample collecting. The wastewater was
collected by using a pail and then filled in the polyethylene or glass bottle through a funnel. All the
samples were then transported to the laboratory for analysis.
Table 1. Sampling times for each location.
Trip 1 2 3
Location TM TJ TM TJ TM TJ
Time 9.00 am 11.25 am 9.37 am 11.50 am - -
12.30 pm 2.20 pm 1.25 pm 2.45 pm 12.30 pm 2.2o pm
Date 19/12/07 26/01/08 23/02/08
Day Wednesday Saturday Saturday
11
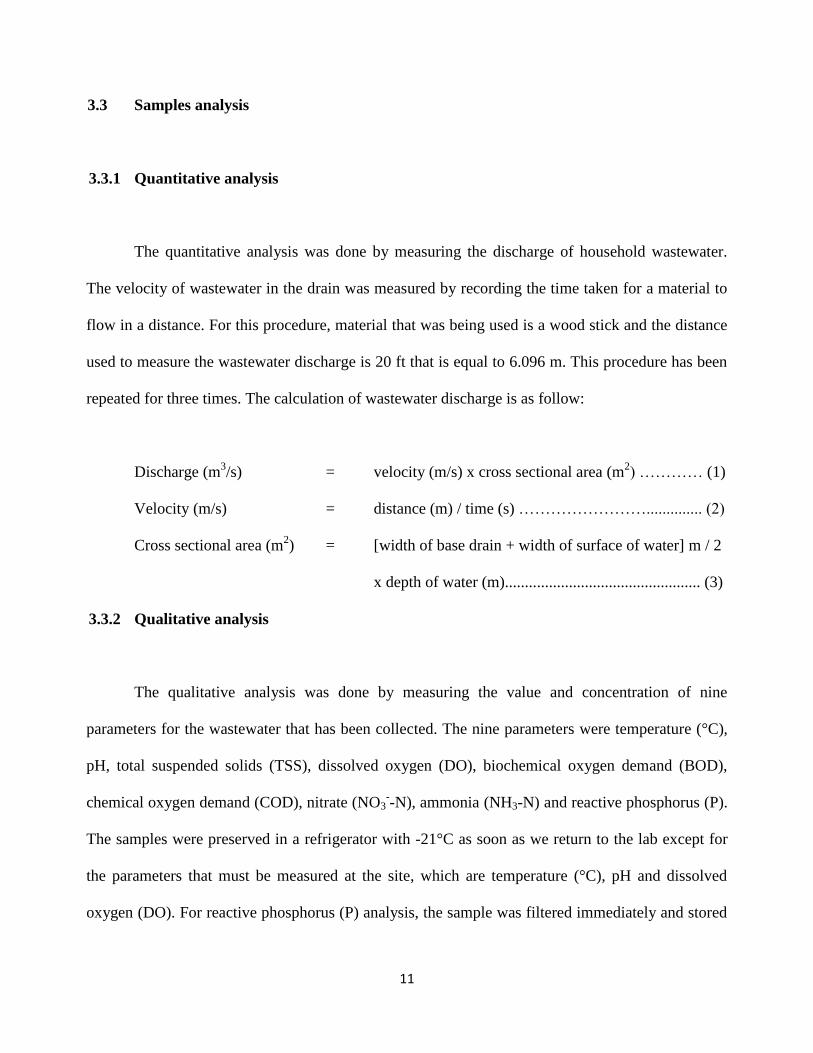
3.3 Samples analysis
3.3.1 Quantitative analysis
The quantitative analysis was done by measuring the discharge of household wastewater.
The velocity of wastewater in the drain was measured by recording the time taken for a material to
flow in a distance. For this procedure, material that was being used is a wood stick and the distance
used to measure the wastewater discharge is 20 ft that is equal to 6.096 m. This procedure has been
repeated for three times. The calculation of wastewater discharge is as follow:
Discharge (m3/s) = velocity (m/s) x cross sectional area (m
2) ………… (1)
Velocity (m/s) = distance (m) / time (s) …………………….............. (2)
Cross sectional area (m2) = [width of base drain + width of surface of water] m / 2
x depth of water (m)................................................. (3)
3.3.2 Qualitative analysis
The qualitative analysis was done by measuring the value and concentration of nine
parameters for the wastewater that has been collected. The nine parameters were temperature (°C),
pH, total suspended solids (TSS), dissolved oxygen (DO), biochemical oxygen demand (BOD),
chemical oxygen demand (COD), nitrate (NO3--N), ammonia (NH3-N) and reactive phosphorus (P).
The samples were preserved in a refrigerator with -21°C as soon as we return to the lab except for
the parameters that must be measured at the site, which are temperature (°C), pH and dissolved
oxygen (DO). For reactive phosphorus (P) analysis, the sample was filtered immediately and stored

12
in the same refrigerator. All the parameters were measured according to the Standard Method for
the Examination of Water and Wastewater and following the Spectrophotometer Procedures
Manual.
3.3.2.1 Temperature
The temperature of the wastewater was measured by using the pH meter, model Cyberscan
100 with a temperature sensor. We must make sure that the pH meter is still functioning before it
can be used in field. The measuring of temperature was done immediately at the site each time of
sampling. The temperature value was recorded when the reading was stable enough. This procedure
has been repeated for three times.
3.3.2.2 pH
The pH of wastewater was measured by using a pH meter, model Cyberscan 100. The pH
meter must be calibrated with two buffer solution before it can be used in field. Measuring of the
pH was done immediately at the site for each time of sampling. The pH value was recorded after the
reading was stable. The procedure has been repeated for three times.

13
3.3.2.3 Total suspended solids (TSS)
The total suspended solid was measured by using the total suspended solid dried at 103 -
105°C method (APHA, 1998). For Taman Malihah, volume of sample used was 100 mL while
Tabuan Jaya, 150 mL. Sample was filtered trough a weighed standard glass – fiber filter and the
residue retained on the filter was dried to a constant weight at 103 - 105°C. Calculation of total
suspended solid is as follows:
(A – B) 1000
Sample volume, mL
Where:
A = weight of filter + dried residue, mg
B = weight of filter, mg
3.3.2.4 Dissolved oxygen (DO)
Dissolved oxygen (DO) of wastewater was measured by using the DO meter, model
Cyberscan 100. We must make sure that the DO meter is still functioning before it can be used
during the sampling. The DO was measured immediately at the site each time of sampling. The
amount of DO (mg/L) was recorded after the reading was stable. This procedure has been repeated
for three times.
mg total suspended solids/L =
14
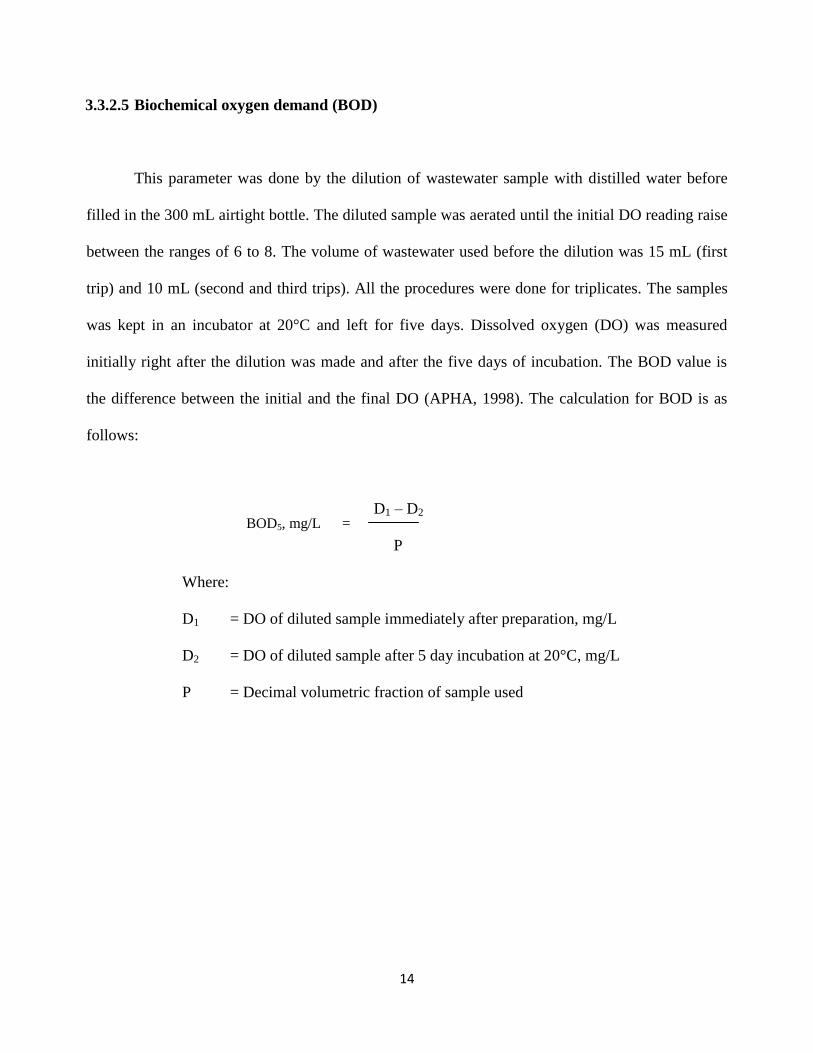
3.3.2.5 Biochemical oxygen demand (BOD)
This parameter was done by the dilution of wastewater sample with distilled water before
filled in the 300 mL airtight bottle. The diluted sample was aerated until the initial DO reading raise
between the ranges of 6 to 8. The volume of wastewater used before the dilution was 15 mL (first
trip) and 10 mL (second and third trips). All the procedures were done for triplicates. The samples
was kept in an incubator at 20°C and left for five days. Dissolved oxygen (DO) was measured
initially right after the dilution was made and after the five days of incubation. The BOD value is
the difference between the initial and the final DO (APHA, 1998). The calculation for BOD is as
follows:
D1 – D2
P
Where:
D1 = DO of diluted sample immediately after preparation, mg/L
D2 = DO of diluted sample after 5 day incubation at 20°C, mg/L
P = Decimal volumetric fraction of sample used
BOD5, mg/L =

15
3.3.2.6 Chemical oxygen demand (COD)
The COD was measured by following the Spectrophotometer Procedures Manual for COD
determination. The sample (100 mL) was homogenized in a blender for 30 seconds. The COD
reactor was turned on and then preheats to 150 °C. Then, 2 mL of sample was pipet into the vial of
COD reagent LR. The vial was closed with the cap tightly. Outside of the COD vial was rinsed with
deionized water and wiped clean the vial with paper towel. Then, the vial was inverted gently for
several times and placed in the preheated COD reactor. All procedures were repeated for 3 times.
All the vials were heated for 2 hours. After the 2 hours period was finished, the reactor was turned
off and waited for about 20 minutes before all the vials were removed. The vials were inverted
several times while still warm and waited until the vials cooled to room temperature. The COD
value was analyzed by using spectrophotometer, HACH DR/2010. The results were displayed in
mg/L and recorded.
3.3.2.7 Nitrate (NO3--N)
The amount of nitrate was measured by using the Nitrate, LR (0 to 0.40 mg/L) Cadmium
Reduction Method (Hach, 1996). The sample was analyzed by using NitriVer3 Nitrite Reagent
Powder Pillow and NitraVer6 Nitrate Reagent Powder Pillow. The cadmium metal in the reagents
reduces nitrate that present in the sample to nitrite. The nitrite ion then reacts in an acidic medium
with sulfanilic acid to form an intermediate diazonium salt which couples to chromotropic acid to
form a pink colored product. This method was done by using a spectrophotometer, HACH
DR/2010. The result of nitrate expressed as nitrogen (NO3--N) in mg/L was displayed at the end of
16
the procedure. The concentration or the amount of nitrate in the wastewater sample was recorded
and all the procedures have been repeated for three times (Hach, 1996).
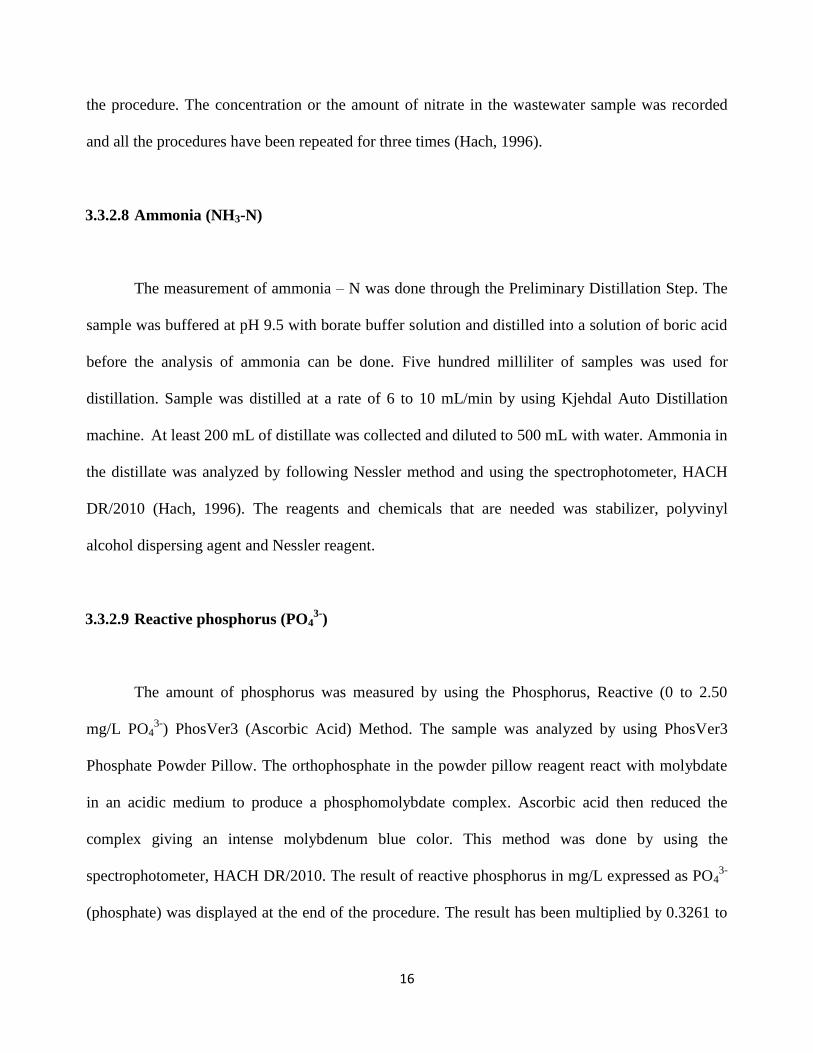
3.3.2.8 Ammonia (NH3-N)
The measurement of ammonia – N was done through the Preliminary Distillation Step. The
sample was buffered at pH 9.5 with borate buffer solution and distilled into a solution of boric acid
before the analysis of ammonia can be done. Five hundred milliliter of samples was used for
distillation. Sample was distilled at a rate of 6 to 10 mL/min by using Kjehdal Auto Distillation
machine. At least 200 mL of distillate was collected and diluted to 500 mL with water. Ammonia in
the distillate was analyzed by following Nessler method and using the spectrophotometer, HACH
DR/2010 (Hach, 1996). The reagents and chemicals that are needed was stabilizer, polyvinyl
alcohol dispersing agent and Nessler reagent.
3.3.2.9 Reactive phosphorus (PO43-
)
The amount of phosphorus was measured by using the Phosphorus, Reactive (0 to 2.50
mg/L PO43-
) PhosVer3 (Ascorbic Acid) Method. The sample was analyzed by using PhosVer3
Phosphate Powder Pillow. The orthophosphate in the powder pillow reagent react with molybdate
in an acidic medium to produce a phosphomolybdate complex. Ascorbic acid then reduced the
complex giving an intense molybdenum blue color. This method was done by using the
spectrophotometer, HACH DR/2010. The result of reactive phosphorus in mg/L expressed as PO43-
(phosphate) was displayed at the end of the procedure. The result has been multiplied by 0.3261 to

17
convert the value to P (phosphorus). The concentration of reactive phosphorus present in the
wastewater sample was recorded and all the procedures have been repeated for three times (Hach,
1996).
3.4 Data analysis
i) All the data were analyzed by using SPSS Evaluation Version 15
ii) Concentration of nutrients and the discharge of wastewater were compared between
the study areas.
iii) The loading of contaminants in the wastewater was calculated as follows:
Loading (g/d) = concentration (g/L) x water discharge (L/d)