faculty quality of worklife analysis · faculty quality of worklife analysis executive summary in...
TRANSCRIPT

Research Brief
Issue 2016 – 04
Faculty Quality of Worklife Analysis
Executive Summary
In November 2015, the Kapi’olani CC Faculty Senate requested OFIE’s assistance in
interpreting a UH system survey on the “Quality of Faculty Worklife” with a specific focus on
faculty worklife at Kapi‘olani CC (hereafter, the College). The 10 campus survey was conducted
in 2014 by the Office of the Executive Vice President for Academic Affairs at the request of the
All Campus Council of Faculty Senate. This survey and summary are available online at
http://www.hawaii.edu/offices/aa/faculty/faculty14.pdf, and readers are referred to the original
document for study context. This report provides a more detailed look at survey responses and
attempts to build an explanatory model for why the College’s faculty feel the way they do about
their work lives.
Methodologically, the survey was conducted entirely online. All faculty were invited to
participate – this survey is “sample-free.” The all campuses response rate was about 33 percent,
with 1326 members completing the survey from a population of 4028. Hawai‘i CC and Kaua‘i
CC had much better response rate than other campuses. Thirty-six percent of Kapi’olani faculty
(121 of 336) responded to the survey. The 121 responses are sufficient to represent the faculty
population as a whole.
Although the UH system survey requested information on faculty demographic and academic
affiliation, this information could not be provided to OFIE due to anonymity concerns. We are
therefore unable to consider potential associations between faculty ethnicity, departmental
affiliation, and quality of worklife.
Main positive findings are: Colleagues at the campus are morale boosters, service to the campus
and community are rewarding for faculty, the physical work environment is positive, and
undergraduate students are enthusiastic. Main negative factors are: teaching and committee load,
salaries and quality of life, opportunities for professional travel and development, student
preparation, facilities maintenance, and faculty voice in budget decisions and ability to speak out
regarding diversity issues.
The overall message from the study of faculty morale is ultimately positive, even despite some
very strong negative attitudes. Faculty enjoy their core functions, appreciate their colleagues, and
are proud to provide service to the campus and to the community. They do get extremely
frustrated by perceived impediments to those core functions. Improved communication can
potentially eliminate a large source of professional unhappiness and dysfunction. If OFIE were to
suggest a line of future research, it would be into the inclusivity of faculty governance and the
communication structures that exist between faculty and administration.
2
An OFIE disclaimer: workplace morale can be an extremely emotionally charged issue in which
some individuals find themselves personally at odds with other individuals beyond some specific
professional disagreement. OFIE takes no stance on the status, validity, or resolution of such
disputes and should be considered only a neutral observer of these social phenomena.
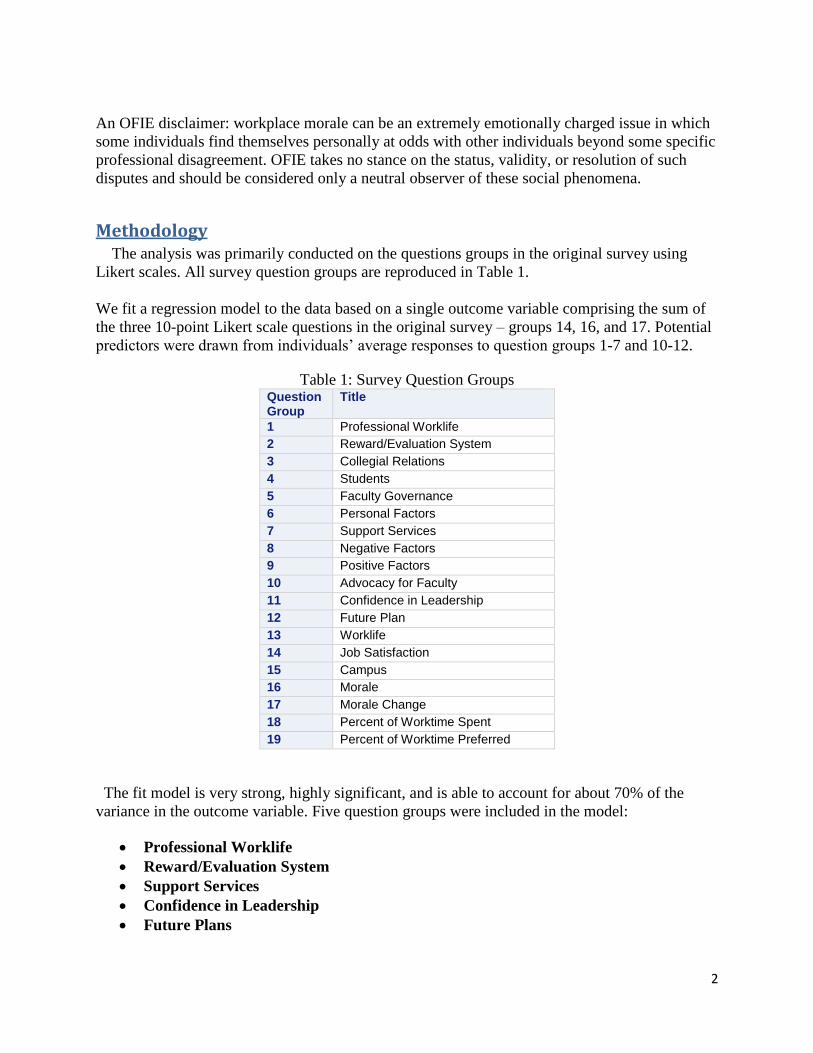
Methodology The analysis was primarily conducted on the questions groups in the original survey using
Likert scales. All survey question groups are reproduced in Table 1.
We fit a regression model to the data based on a single outcome variable comprising the sum of
the three 10-point Likert scale questions in the original survey – groups 14, 16, and 17. Potential
predictors were drawn from individuals’ average responses to question groups 1-7 and 10-12.
Table 1: Survey Question Groups Question Group
Title
1 Professional Worklife
2 Reward/Evaluation System
3 Collegial Relations
4 Students
5 Faculty Governance
6 Personal Factors
7 Support Services
8 Negative Factors
9 Positive Factors
10 Advocacy for Faculty
11 Confidence in Leadership
12 Future Plan
13 Worklife
14 Job Satisfaction
15 Campus
16 Morale
17 Morale Change
18 Percent of Worktime Spent
19 Percent of Worktime Preferred
The fit model is very strong, highly significant, and is able to account for about 70% of the
variance in the outcome variable. Five question groups were included in the model:
Professional Worklife
Reward/Evaluation System
Support Services
Confidence in Leadership
Future Plans
3
Validation and Norming
No details on the validation process are provided in the survey summary. This is not
necessarily a negative, as the survey has been in long-standing use by UH faculty. Any
validation process might indeed be difficult to reconstruct from the several generations of
research staff who have constructed, revised, and administered the questionnaire. Our
presumption is that the survey adequately measures the quality of faculty worklife in the UH
system, but it must be noted that this presumption is untested and therefore qualified. Equivalent
qualified assumptions will be made about additional aspects of survey construction and design,
e.g., handling of duplicate responses.
Similarly, although the survey offers comparisons to both historical data and to other UH
campuses, we can’t consider this survey to be nationally normed. It can’t answer the question,
‘Relative to other universities, how satisfied are UH faculty?’ Ultimately, we cannot provide an
answer to this question, and recommend using an external product if norming is a goal.
Analytical Method
Raw survey responses were provided to OFIE by the UH System Data Governance office in
an excel file. As noted above, any potentially de-anonymizing responses were scrubbed across
the board for all respondents. The data file was imported into SAS version 9.4 for quantitative
analysis. Qualitative responses were so few in number that no specialized software was used;
manual tabulations were conducted when necessary. Additionally, because there were so few
qualitative responses, we will reproduce them only sparingly here so to avoid the appearance that
a single voice is much more analytically important than is actually the case.
We note that question group 3, which deals with peer relationships between faculty, was not a
significant factor in the regression model, but that 5 of the top ten most-frequently cited positive
morale factors dealt with the quality of these peer relationships. We conclude that both high- and
low-morale individuals have meaningful relationships with peers and with campus leaders with
whom they more frequently interact, such as department chairs. This contrasts with the
associated category for “Confidence in Leadership,” which predicts whether an individual has
high or low morale. We suspect that formal and informal communication structures may play a
role in the difference between these two categories, and suggest that this may be an area for
further inquiry into campus morale.
Associative Models
The goal of this analysis is exploratory in nature: what survey variables are associated with
faculty who report higher or lower quality of worklife at the College? Or more succinctly, given
the data contained in the survey, why do faculty members report high or low morale on campus?
The first task then is to identify survey items that accurately gauge morale, and that can serve as
correlation reference points or regression outcomes.
Question groups 13-17 are all good candidates for selection. Groups 13 and 15 ask broadly
about faculty’s work experience, relationship with colleagues, and loyalty to their campus.
However, there are three questions that ask faculty to rate job satisfaction, morale, and morale
change on 10 point scales. These have the advantage of being very direct measures, and also,
given the 10-point response levels, of lowering the margin of error.

4
Table 2. Summary Statistics for Outcome Variables
Variable N Mean
Std
Dev Median Minimum Maximum
Job
Satisfaction
(Item 14a)
119 6.4 2.3 7.0 1.0 10.0
Morale
(Item 16a)
120 5.5 2.6 6.0 1.0 10.0
Morale
Change
(item 17a)
119 4.7 2.8 4.0 1.0 10.0
Each of the selected outcomes above has the maximum possible range from 1 to 10, from
extremely low satisfaction to morale to extremely high. For example, for morale change, a “1”
indicates an extreme decline in morale and a 10 represents the corresponding extreme
improvement. Respondents are overall more likely to indicate higher job satisfaction than morale,
and are, on average, reporting a decrease in morale since 2006, the last survey year.
Despite the average response differences, the three variables are highly correlated, with
Pearson correlation coefficients as indicated in table 3 below.
Table 3. Correlation Matrix for Outcome Variables
Spearman Correlation Coefficients
Prob > |r| under H0: Rho=0
Number of Observations
_14a
@14a
_14a
1.00000
119
_16a
0.87127
<.0001
119
_17a
0.76519
<.0001
118
_16a
@16a
_16a
1.00000
120
_14a
0.87127
<.0001
119
_17a
0.85812
<.0001
119
_17a
@17a
_17a
1.00000
119
_16a
0.85812
<.0001
119
_14a
0.76519
<.0001
118
Variable 16a (“Morale”) is highly correlated with both job satisfaction and morale change
(ρ=.87 and .86), while job satisfaction and morale change still have a very strong (ρ=.77)
relationship. Each pair is significant at the p = .0001 level.
Because these three variables are so highly correlated, conducting further analysis on each
variable individually is largely a redundant exercise. The two best remaining choices are to use
only variable 16a, since it has the highest correlation values, or to combine the three in some way.
The latter case has a particular advantage: considering the sum of 14a, 16a, and 17a as a single

5
outcome provides a data range of possible values from 3-30. The outcomes are not perfectly
correlated, so using a sum has the effect of smoothing the density curve somewhat, so that the
distribution is more normal and less skewed. The data do still show a strong multimodal
tendency and exhibit a relatively high, non-normal kurtosis statistic. Histograms of the three
outcomes along with the new predictor variable are shown in Figure 1 below.
Figure 1. Histograms of Outcome Variables
We note here that overall morale for the overall faculty is overall neutral, with a small
inclination towards low morale. High kurtosis values indicate that faculty feel strongly about
their worklife, with more values concentrated at the edges of the scale than in a normal
distribution, although again, the distribution is slightly more smoothed in the summed model.
We proceed by running linear regression models on the data set with this single sum as the
outcome variable.
Predictor Variables
We begin by looking at mean values for each respondent within each question thematic group,
creating a multiple regression model with 10 potential predictor variables. Question groups 13
(‘Worklife’) and 15 (‘Campus’) are strongly tied to measuring morale itself and are thus
excluded from the model. We use a stepwise regression technique that adds or subtracts variables
from the model based on a .05 significance threshold, e.g., a variable is added one at a time if it
is the most-significant variable at p < .05, and a variable is deleted if it is the least significant

6
variable with p > .05. The model stops computations when no significant variables remain to be
added. Results from the stepwise regression are presented below.
The model is strong with an Adjusted R2 of over .78, all variables significant at the .01 level,
the model significant at the .0001 level, and no VIF showing no troubling collinearities. Only 7
respondents were excluded due to missing values.
Table 4. Regression Model for Reduced Predictor Set, Mean Scores
Variable
Parameter
Estimate
Standard
Error Type II SS F Value Pr > F
Intercept -4.47882 2.22078 60.71217 4.07 0.0462
_1_Overall 4.53073 0.96576 328.51464 22.01 <.0001
_2_Overall 2.19119 0.63112 179.92617 12.05 0.0007
_7_Overall -1.58018 0.61696 97.91724 6.56 0.0118
_11_Overall 2.60515 0.57357 307.93158 20.63 <.0001
_12_Overall -1.66124 0.35560 325.76776 21.82 <.0001
N=113, F Value=55.79, p < .0001, R2 0.7228, Adjusted R2=0.7098
Generally speaking, faculty morale is predicted by their satisfaction with professional
factors like work environment and intellectual engagement, their sense of fairness in the
reward system, the quality of support services, their confidence in various facets of college
and university leadership, and their self-evaluated likeliness to seek alternate employment
at different institutions. The value of the parameter for question group 1 is very strong, still
strong for 2 and 11, and relatively lower for 7 and 12. The sign of the parameter for both
question groups 7 and 12 is negative. Question group 12 is naturally interpretable – higher scores
there indicate a greater likelihood to leave. However, question group 7 asks about the quality of
the college’s support services, so the negative sign means that faculty who are more satisfied
with college services have lower morale. We will return to this issue in more detail below.
Figure 2 below shows a variety of standard SAS outputs for evaluating regression models. The
three plots in the left-most column indicate that the model residuals are normally distributed with
mean 0 and equal variance around each predicted variable. The RStudent plot and Cook’s D
statistics show that while this data set does have influential observations, those observations are a
small proportion of the whole and are not necessarily an area of concern. There are 8/115
influential observations by Cook’s D, which is perhaps a little bit high. However, we note that
SAS uses by default a very conservative threshold of 4/n to identify these values, where
statisticians often recommend using a more lenient version involving the F-statistic or 4/(n-p-1),
where p is the number of parameters in the model. We therefore do not think that there are a
troublingly high number of problematic cases.
Of particular importance is the plot in the center of the matrix, which shows the scatter of
predicted vs. actual values based. The model displays a strong fit at the both the upper and lower
values for faculty morale. Both satisfied and dissatisfied faculty members are concerned with the
same campus issues but have vastly different perspectives on these issues.

7
Figure 2. Diagnostics for Regression Model
Important Factors Faculty were asked to contribute the three most positive and negative factors that impact the
quality of their worklife. Although these questions appear prior to – and thus do not include –
question groups 11 and 12, they still may provide some insight into the issues faculty are most
passionate about.
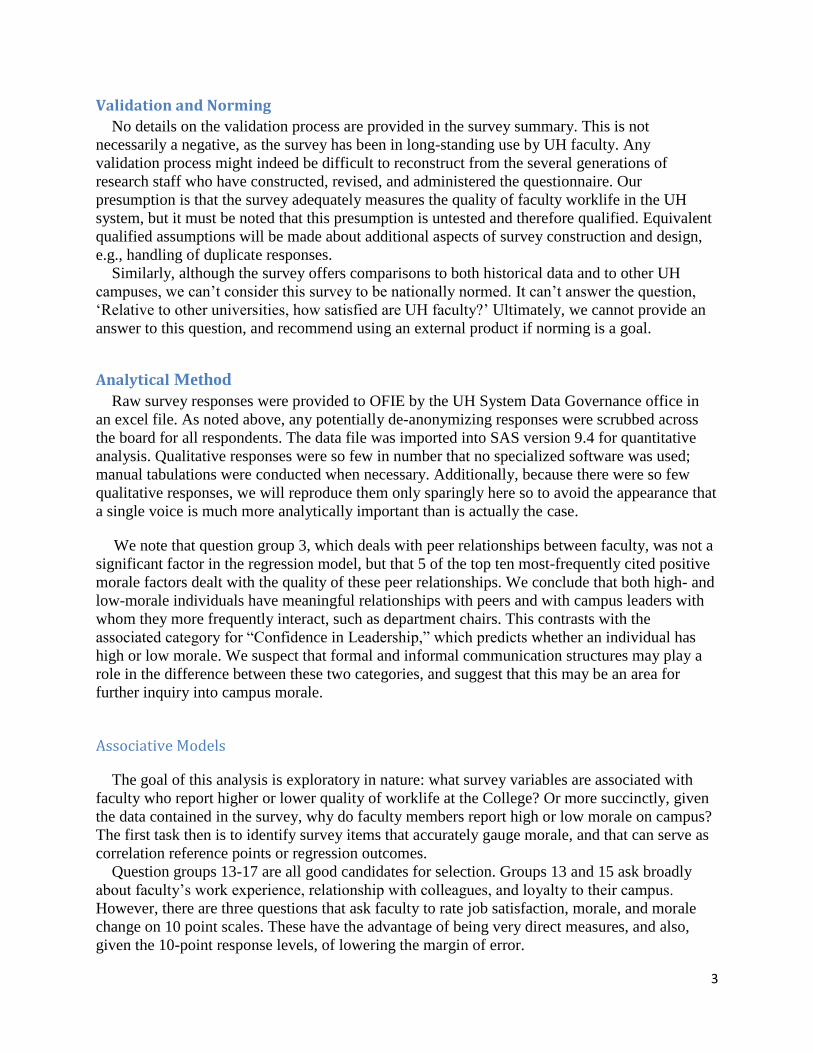
Tables 5 and 6 below show the top ten most positive and negative factors. It is unsurprising to
see that items from question group 1 dominate both lists, as this was so strongly associated. Of
note is that the same items in question group 1 do not appear in both lists. When survey
8
respondents list these factors as positives, they tend to have a focus related to personal choices,
rewards, and other benefits. For example, “service,” which faculty members are most likely to
select for themselves rather than be assigned to, appears twice in the list of positive factors.
Question group 1 items that appear in the negative list are more likely to be assigned or dictated
to faculty from positions above.
Table 5: Top Ten Most Frequently Selected Positive Factors
Question Item COUNT GROUP
Relations within my department/unit are collegial 27 3
My physical work environment is pleasant 26 1
Service to the community is rewarding for me 22 1
My access to parking is adequate 20 1
I have good relations with my chair 19 3
Service to my campus is rewarding for me 18 1
Undergraduate students are enthusiastic 16 4
I receive support for my career from my chair 13 3
My intellectual fit with my department/unit is good 13 3
Relations among faculty on my campus are collegial 13 3
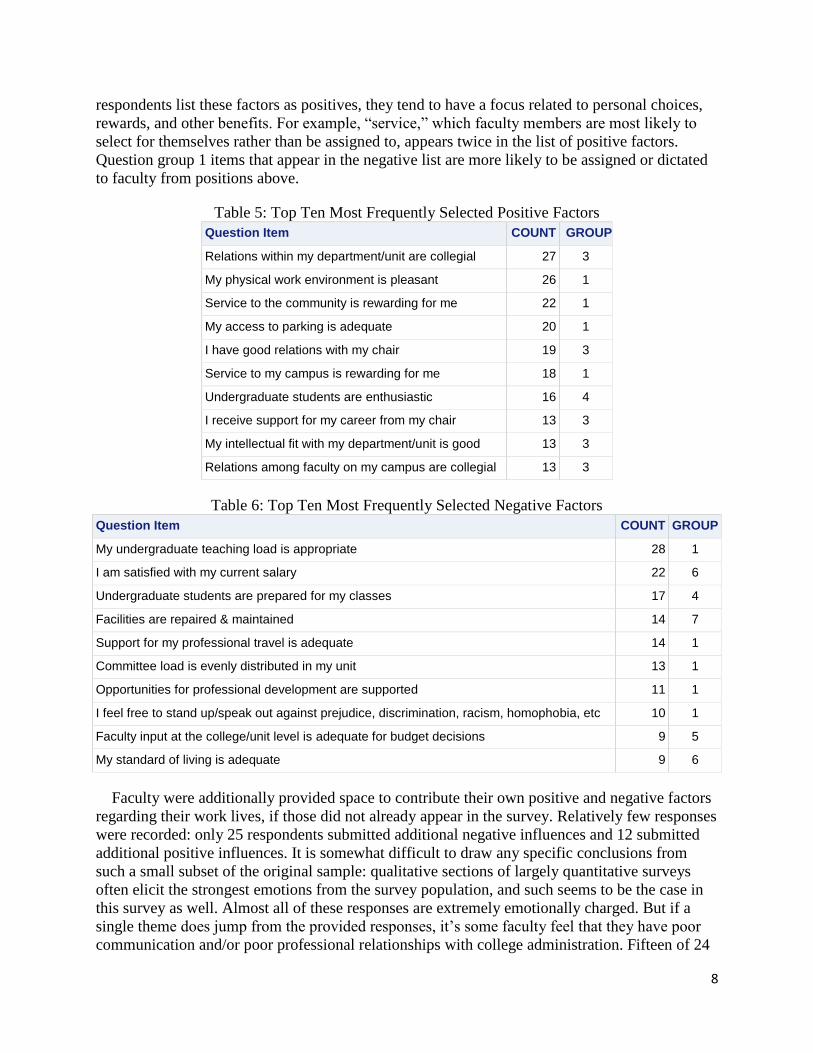
Table 6: Top Ten Most Frequently Selected Negative Factors
Question Item COUNT GROUP
My undergraduate teaching load is appropriate 28 1
I am satisfied with my current salary 22 6
Undergraduate students are prepared for my classes 17 4
Facilities are repaired & maintained 14 7
Support for my professional travel is adequate 14 1
Committee load is evenly distributed in my unit 13 1
Opportunities for professional development are supported 11 1
I feel free to stand up/speak out against prejudice, discrimination, racism, homophobia, etc 10 1
Faculty input at the college/unit level is adequate for budget decisions 9 5
My standard of living is adequate 9 6
Faculty were additionally provided space to contribute their own positive and negative factors
regarding their work lives, if those did not already appear in the survey. Relatively few responses
were recorded: only 25 respondents submitted additional negative influences and 12 submitted
additional positive influences. It is somewhat difficult to draw any specific conclusions from
such a small subset of the original sample: qualitative sections of largely quantitative surveys
often elicit the strongest emotions from the survey population, and such seems to be the case in
this survey as well. Almost all of these responses are extremely emotionally charged. But if a
single theme does jump from the provided responses, it’s some faculty feel that they have poor
communication and/or poor professional relationships with college administration. Fifteen of 24

9
negative responses referred either to “administration” in aggregate or to some specific
administrator. These criticisms themselves range from mild to inflamed in emotional content. By
contrast, 2 of 10 positive factors mention administration or administrators, with a third (‘Non-
traditional leadership is supported’) running counter to some of the negative opinions expressed.
Other negatives of note include disappointment in aspects of interpersonal relationships with
other faculty members, who are variously described as belonging to cliques or of having a “sub-
culture of bullying.”
We might, however, compare the supplemental negative factors provided by faculty to the top
ten most frequently occurring positive factors. For example, question group 3: (‘Collegial
Relations’) appears several times as a strong positive factor. Different aspects of an individual’s
relationship with his/her departmental chair are listed twice. This might indicate that more
frequent interpersonal contact between a department chair and a faculty member can soften the
effects of hierarchical systems within the college.
Conclusions It is difficult to draw universal conclusions about the behavior of an aggregate body like a
post-secondary faculty. To say that this or that body has “high morale” or “low morale” could
only ever be valid in a statistical sense, and would involve a necessary whitewashing of those
opinions contrary to the statistical average. And in practice, such definitions happen rarely: most
average interpretations of group behavior show that the group is itself, well, average. The fact is
that averages moderate extremes, present middling vagaries in the interpretation of behavior, and
are therefore often useless for understanding group dynamics. OFIE does not therefore
recommend interpreting morale along a binary high/low scale. Rather, some individuals have
high morale and others low, and still more meet somewhere in the middle. It is our job as
researchers to collect an entirely different set of behaviors and/or opinions that can better predict
the whys and hows of gradient distinctions.
Various predictive models exist in statistical analysis to do just that: linear regression is one
such model. Its goal is to provide a better estimate of an individual’s behavior than could be
provided by a group expectation. The model provided above demonstrates that faculty
morale at the College is strongly affected by responses to question groups involving
professional worklife; the reward and evaluation system at the college; support services
like libraries, technology, and facilities; and confidence in college and system leadership.
Additionally, those with lower morale are more likely to report interest in seeking other
employment. We have further seen evidence that although the groups as a whole are not
statistically significant, faculty are concerned about their peer relationships on campus,
about their current salaries, and about their potential for a good quality of life in Hawai‘i.
Such a statement may seem uncontroversial, but we can compare the above list of items to
those that are not statistically significant predictors of morale: the quality of the student body,
satisfaction with the pedagogical portion of their positions, advocacy for university faculty by
various authorities, and faculty governance. The lack of statistical significance here indicates that
patterns linking high scores on one variable either do not consistently predict high morale or do
not improve an existing prediction in a multivariate model.
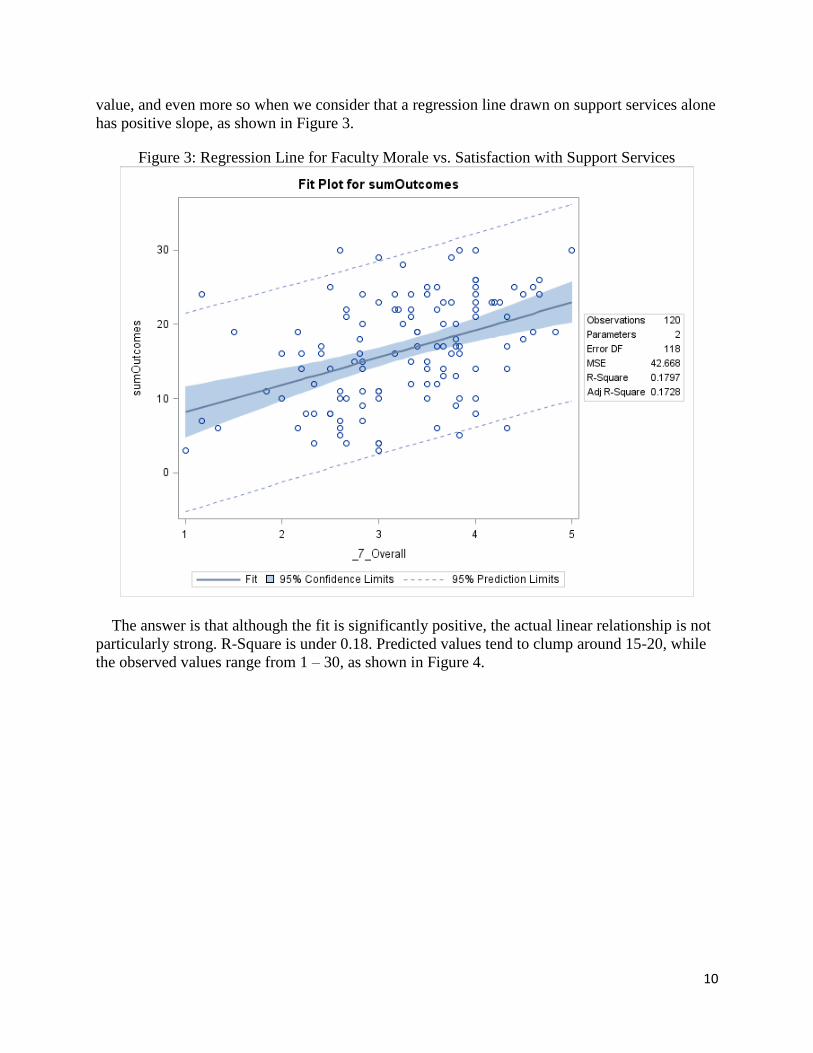
The sign of the statistics on support services is negative, indicating that higher morale is
associated with lower scores for support satisfaction (and vice versa). This is perplexing at face
10
value, and even more so when we consider that a regression line drawn on support services alone
has positive slope, as shown in Figure 3.
Figure 3: Regression Line for Faculty Morale vs. Satisfaction with Support Services
The answer is that although the fit is significantly positive, the actual linear relationship is not
particularly strong. R-Square is under 0.18. Predicted values tend to clump around 15-20, while
the observed values range from 1 – 30, as shown in Figure 4.

11
Figure 4: Observed by Predicted for Morale vs. Support Services Regression
Support services is an imperfect, weak single variable predictor of positive sign with a
negative sign in the multivariate model. It therefore is acting as a moderating influence on
overall faculty morale. Attitudes towards support services bring disparate perspectives in the
faculty closer together.
What other factors might underlie the regression model? One imperfect line does exist
demarcating significant from insignificant effects on faculty morale: personal interactions. We
note that faculty as a whole, whether with high, low, or average morale, feel that they have good
relationships with their peers and with departmental leaders. Teaching and interactions with
students do not seem to affect morale, so at the very worst, those who are dissatisfied with
teaching at least seem to believe they have some control over it. Only a small handful of faculty
report planning to change careers, even if they do plan to pursue other employment possibilities.
They do differ in the ways they perceive more distant relationships with college and system
leadership, and with the decisions these leaders have made regarding the distribution of human,
technological, and material resources.
However, if there is a significant difference in opinions about campus leadership, why does it
not show in the section on Faculty governance? There is not enough evidence to support any firm
conclusions here, but some of the comments provided in the qualitative input section of the
survey do point to possible areas of further research. Several comments refer to faculty feeling

12
that administrators may accept faculty comments, but only at face value, and continue to make
decisions without regard for those comments. Others indicate that faculty input is restricted to a
select clique of power holders on campus and that governance discussions are not universal or
inclusive. Finally, still others feel that important campus discussions are dominated by the
loudest, most aggressive voices in the room. Considering that this series of questions is framed
as “Faculty input at X level is adequate for…,” we suspect that members of the faculty who feel
powerless may not necessarily answer negatively for “faculty input,” but only for “personal
input.” If we would suggest a line of future research, it would be here, into the inclusivity of
faculty governance and the communication structures that exist between faculty and
administration for constructive comments and criticism.
The overall message from the study of faculty morale then is ultimately positive, even
despite some very strong negative attitudes. Faculty enjoy their core functions, appreciate
their colleagues, and are proud to provide service to the campus and to the community.
They do get extremely frustrated by perceived impediments to those core functions, but
this is positive evidence that better communication can eliminate a large source of
professional unhappiness and dysfunction.