faculty research survey report - auc intranet research... · science and engineering faculty, 40.4%...
TRANSCRIPT

The Office of Institutional Research/AUC
[Type the company name]
July 2011
Faculty Research Survey
Report
Prepared by Ola Anwar

The Office of Institutional Research/AUC Page 2
Table of contents Page
_______________________________________________________________________________
The Executive Summary 3 Section I: Q.1: Please indicate your area of affiliation. 4 Q.2: How long have you been at AUC? 4 Section II: Q.3: Please indicate to what extent the incentives listed below are possible factors that impact your motivation to engage in scholarly work/research. 5 Q.4: Please indicate to what extent the barriers listed below are possible factors that impact your motivation to engage in scholarly work/research. 5 Section III: Q.5: Please indicate to what extent the services listed below are possible factors
that would assist you personally in your efforts or interest in applying for external funding (the first set of questions) AND internal funding (the second set of questions). 12
Section IV: Q.6: Please answer the following items to best reflect your publication history. 18 Section V: Q.7: Please indicate the number of proposals that you have submitted for funding
(first set of questions) and have had funded (second set of questions) in the following categories: While at AUC and since 2005, how many proposals have you submitted?
While at AUC and BEFORE 2005, how many proposals have you submitted? 20 Section VI: Cross tabulation questions 23 Section VII: Please provide us with any useful comments or suggestions regarding increasing your interest in pursuing and successfully conducting scholarly work/research and AUC's ability to attract external funding. 41
The Office of Institutional Research/AUC Page 3
Executive Summary
Introduction
In order to continue the efforts to improve research at the American University in Cairo (AUC),
the Office of the Associate Provost for Research Administration in cooperation with the Office of
Institutional Research (IR) conducted an online survey of faculty opinions about the research
environment at AUC.
On May 22nd, 2011, IR emailed survey invitations to 403 faculty members. Two survey email
reminders were sent on May 26 and June 5, 2011 and the survey remained accessible until
June 12. When the survey was closed 103 (25.6%) out of 403 responded.
Methodology and Organization of the Report
This report is divided into seven sections. In Section I, respondents’ area of affiliation and
duration of services at AUC are presented as frequencies and in charts. In Section II, we
presented the factors that affected the motivational levels of the respondents in frequencies and
in charts. Furthermore, the respondents’ list of services that assisted them in applying, in both
internal and external funding, is presented in Section III as frequencies and in charts. In Section
IV, we reported the respondents’ publication history as frequencies and in charts. In Section V,
the respondents’ proposals for funding submitted to AUC before and since 2005 are stated. In
Section VI, the cross tabulation questions are presented in frequency tables. Finally, in Section
VII, the respondents’ comments and suggestions regarding increasing their interests in
conducting scholarly work/research are presented.

The Office of Institutional Research/AUC Page 4
Section I:
For the question, “Please indicate your area of affiliation”, 21.2% of the respondents were
Science and Engineering faculty, 40.4% were Humanities and Social Sciences faculty, 12.5%
were Business Economics and Communication faculty, 1.9% were Library faculty, 4.8% were
Other (Social Research Center, Research Center, Arabic Language Institute and GAPP), and
19.2% did not report this question.
For the question, ‘How long have you been at AUC?’ 7.7% of the respondents reported ‘Less than 1 year’, 11.5% reported ‘1-2’, 16.3% reported ‘3-4’, 11.5% reported ‘5-6’,6.7% reported ‘7-8’, 7.7% reported ‘9-10’, 10.6% reported ‘11-20’, 4.8% reported ‘More than 20 years’ and 23.1% did not answer this question.
Table 1
Area of Affiliation Frequency Percent
Science and Engineering Faculty
22 21.2%
Humanities and Social Sciences Faculty
42 40.4%
Business Economics and Communication Faculty
13 12.5%
Library Faculty 2 1.9%
Other 5 4.8%
Missing 20 19.2%
Total 104 100%
Figure 1
Table 2
How long have you been at AUC?
Frequency
Percent
Less than 1year 8 7.7%
1-2 12 11.5%
3-4 17 16.3%
5-6 12 11.5%
7-8 7 6.7%
9-10 8 7.7%
11-20 11 10.6%
More than 20 years 5 4.8%
Missing 24 23.1%
Total 104 100%
Figure 2
Scie
nce
and
En
gin
eeri…
Hum
anitie
sand S
ocia
lS
cie
nces…
Bu
sin
ess
Econom
ics
and…
Lib
rary
Fa
culty
Oth
er
21.2%
40.4%
12.5%
1.9% 4.8%
Less than 1year
1-2
3-4
5-6
7-8
9-10
11-20
More than 20 years
7.7%
11.5%
16.3%
11.5%
6.7%
7.7%
10.6%
4.8%
The Office of Institutional Research/AUC Page 5
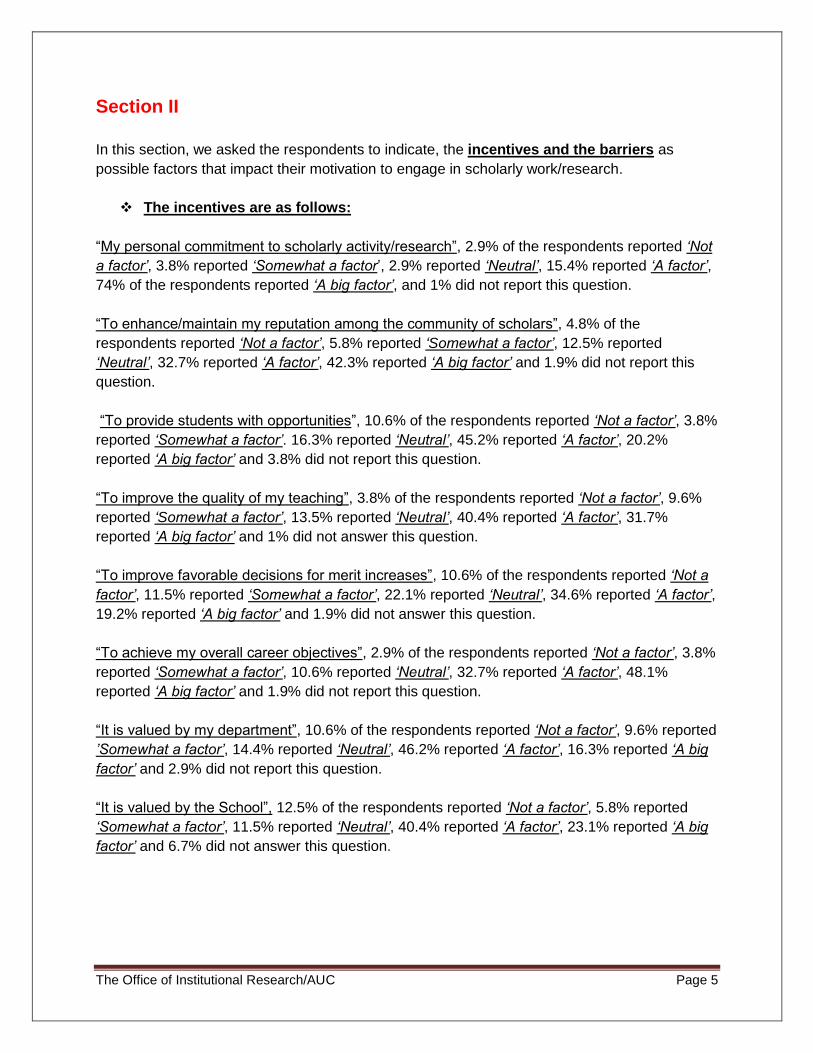
Section II
In this section, we asked the respondents to indicate, the incentives and the barriers as
possible factors that impact their motivation to engage in scholarly work/research.
The incentives are as follows:
“My personal commitment to scholarly activity/research”, 2.9% of the respondents reported ‘Not
a factor’, 3.8% reported ‘Somewhat a factor’, 2.9% reported ‘Neutral’, 15.4% reported ‘A factor’,
74% of the respondents reported ‘A big factor’, and 1% did not report this question.
“To enhance/maintain my reputation among the community of scholars”, 4.8% of the
respondents reported ‘Not a factor’, 5.8% reported ‘Somewhat a factor’, 12.5% reported
‘Neutral’, 32.7% reported ‘A factor’, 42.3% reported ‘A big factor’ and 1.9% did not report this
question.
“To provide students with opportunities”, 10.6% of the respondents reported ‘Not a factor’, 3.8%
reported ‘Somewhat a factor’. 16.3% reported ‘Neutral’, 45.2% reported ‘A factor’, 20.2%
reported ‘A big factor’ and 3.8% did not report this question.
“To improve the quality of my teaching”, 3.8% of the respondents reported ‘Not a factor’, 9.6%
reported ‘Somewhat a factor’, 13.5% reported ‘Neutral’, 40.4% reported ‘A factor’, 31.7%
reported ‘A big factor’ and 1% did not answer this question.
“To improve favorable decisions for merit increases”, 10.6% of the respondents reported ‘Not a
factor’, 11.5% reported ‘Somewhat a factor’, 22.1% reported ‘Neutral’, 34.6% reported ‘A factor’,
19.2% reported ‘A big factor’ and 1.9% did not answer this question.
“To achieve my overall career objectives”, 2.9% of the respondents reported ‘Not a factor’, 3.8%
reported ‘Somewhat a factor’, 10.6% reported ‘Neutral’, 32.7% reported ‘A factor’, 48.1%
reported ‘A big factor’ and 1.9% did not report this question.
“It is valued by my department”, 10.6% of the respondents reported ‘Not a factor’, 9.6% reported
’Somewhat a factor’, 14.4% reported ‘Neutral’, 46.2% reported ‘A factor’, 16.3% reported ‘A big
factor’ and 2.9% did not report this question.
“It is valued by the School”, 12.5% of the respondents reported ‘Not a factor’, 5.8% reported
‘Somewhat a factor’, 11.5% reported ‘Neutral’, 40.4% reported ‘A factor’, 23.1% reported ‘A big
factor’ and 6.7% did not answer this question.

The Office of Institutional Research/AUC Page 6
The barriers are as follows:
“Not enough time due to teaching load”, 6.7% of the respondent reported ‘Not a factor’, 3.8%
reported ‘Somewhat a factor’, 3.8% reported ‘Neutral’, 24% reported ‘A factor’, 53.8% reported
‘A big factor’ and 7.7% did not report this question.
“Not enough time due to administrative (committee) load”, 10.6% of the respondents reported
‘Not a factor’, 1% reported ‘Somewhat a factor’, 12.5% reported ‘Neutral’, 31.7% reported ‘A
factor’, 35.6% reported ‘A big factor’ and 8.7% did not report this question.
“Not enough time due to advising load”, 31.7% of the respondents reported ‘Not a factor’, 3.8%
reported ‘Somewhat a factor’, 25% reported ‘Neutral’, 21.2% reported ‘A factor’, 8.7% reported
‘A big factor’ and 9.6% did not answer this question.
“Too much redtape within the School”, 34.6% of the respondents reported ‘Not a factor’, 5.8%
reported ‘Somewhat a factor’, 23.1% reported ‘Neutral’, 19.2% ‘A factor’, 6.7% reported ‘A big
factor’ and 10.6% did not report this question.
“Too much redtape within the Administration”, 30.8% of the respondents reported ‘Not a factor’,
8.7% reported ‘Somewhat a factor’, 20.2% reported ‘Neutral’, 15.4% reported ‘A factor’, 15.4%
reported ‘A big factor’, and 9.6% did not answer this question.
“Inadequate facilities”, 38.5% of the respondents reported ‘Not a factor’, 7.7% reported
‘Somewhat a factor’, 17.3% reported ‘Neutral’, 14.4% reported ‘A factor’, 11.5% reported ‘A big
factor’ and 10.6% did not report this question.
“Inadequate equipment”, 51.9% of the respondents reported ‘Not a factor’, 5.8% reported
‘Somewhat a factor’, 17.3% reported ‘Neutral’, 7.7% reported ‘A factor’, 7.7% reported ‘A big
factor’ and 9.6% did not answer this question.
“Is too labor intensive”, 46.2% of the respondents reported ‘Not a factor’, 9.6% reported
‘Somewhat a factor’, 17.3% reported ‘Neutral’, 12.5% reported ‘A factor’, 3.8% reported ‘A big
factor’ and 10.6% did not answer this question.
“Not rewarding”, 68.3% of the respondents reported ‘Not a factor’, 3.8% reported ‘Somewhat a
factor’, 4.8% reported ‘Neutral’, 9.6% reported ‘A factor’, 2.9% reported ‘A big factor’ and 10.6%
did not report this question.
“Lack of collaboration opportunities in my department”, 41.3% of the respondents reported ‘Not
a factor’, 11.5% reported ‘Somewhat a factor’, 16.3% reported ‘Neutral’, 12.5% reported ‘A
factor’, 7.7% reported ‘A big factor’ and 10.6% did not report this question.
The Office of Institutional Research/AUC Page 7
“Lack of collaboration opportunities across the School”, 43.3% of the respondents reported ‘Not
a factor’, 10.6% reported ‘Somewhat a factor’, 17.3% reported ‘Neutral’, 13.5% reported ‘A
factor’, 5.8% reported ‘A big factor’ and 9.6% did not answer this question.
“Inadequate budget for professional travel”, 32.7% of the respondents reported ‘Not a factor’,
8.7% reported ‘Somewhat a factor’, 11.5% reported ‘Neutral’, 24% reported ‘A factor’, 12.5%
reported ‘A big factor’ and 10.6% did not report this question.
“Lack of departmental support”, 50% of the respondents reported ‘Not a factor’, 4.8% reported
‘Somewhat a factor’, 18.3% reported ‘Neutral’, 5.8% reported ‘A factor’, 11.5% reported ‘A big
factor’ and 9.6% did not answer this question.
“Lack of Dean’s support”, 54.8% of the respondents reported ‘Not a factor’, 3.8% reported
‘Somewhat a factor’, 14.4% reported ‘Neutral’, 7.7% reported ‘A factor’, 10.6% reported ‘A big
factor’ and 8.7% did not report this question.
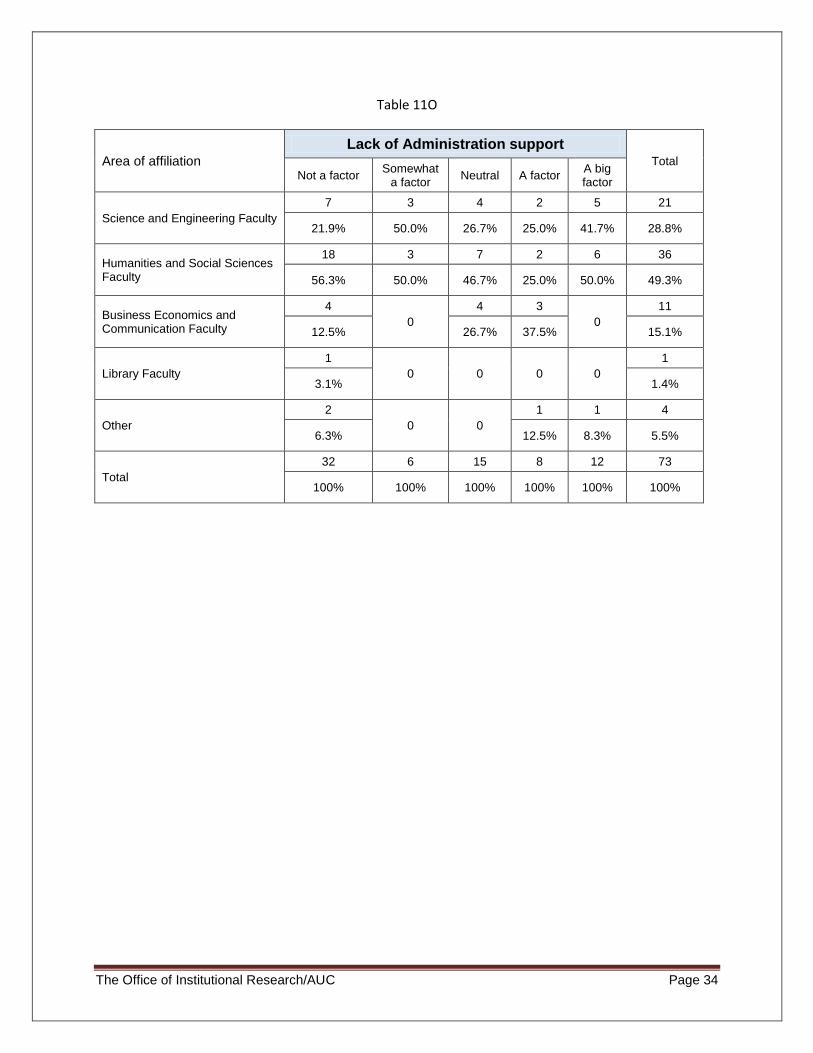
“Lack of Administration support”, 35.6% of the respondents reported ‘Not a factor’, 6.7%
reported ‘Somewhat a factor’, 16.3% reported ‘Neutral’, 8.7% reported ‘A factor’, 15.4% reported
‘A big factor’ and 17.3% did not answer this question.
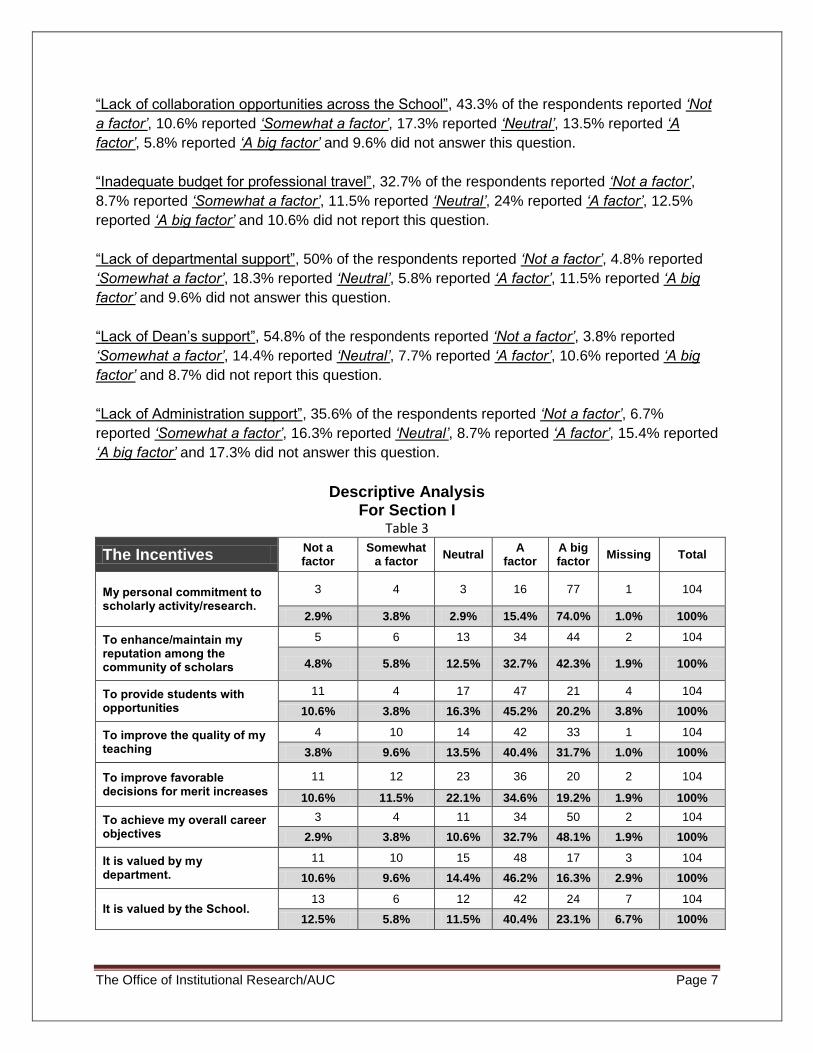
Descriptive Analysis For Section I
Table 3
The Incentives Not a factor
Somewhat a factor
Neutral A
factor A big factor
Missing Total
My personal commitment to scholarly activity/research.
3 4 3 16 77 1 104
2.9% 3.8% 2.9% 15.4% 74.0% 1.0% 100%
To enhance/maintain my reputation among the community of scholars
5 6 13 34 44 2 104
4.8% 5.8% 12.5% 32.7% 42.3% 1.9% 100%
To provide students with opportunities
11 4 17 47 21 4 104
10.6% 3.8% 16.3% 45.2% 20.2% 3.8% 100%
To improve the quality of my teaching
4 10 14 42 33 1 104
3.8% 9.6% 13.5% 40.4% 31.7% 1.0% 100%
To improve favorable decisions for merit increases
11 12 23 36 20 2 104
10.6% 11.5% 22.1% 34.6% 19.2% 1.9% 100%
To achieve my overall career objectives
3 4 11 34 50 2 104
2.9% 3.8% 10.6% 32.7% 48.1% 1.9% 100%
It is valued by my department.
11 10 15 48 17 3 104
10.6% 9.6% 14.4% 46.2% 16.3% 2.9% 100%
It is valued by the School. 13 6 12 42 24 7 104
12.5% 5.8% 11.5% 40.4% 23.1% 6.7% 100%

The Office of Institutional Research/AUC Page 8
Figure 3
Other Incentives:
To receive an annual financial bonus/salary increase
Unfortunately research in general is not valued enough in my department and it doesn't
seem valued enough by AUC.
I love doing research but find very little time for it
To keep updated on research especially in terms of theoretical advancement.
I am at a university because I love my subject and wish to engage in it as deeply as
possible. I enjoy exciting the interest of students in my subject matter.
It keeps me more engaged in my field.
It is gratifying and fulfilling to engage in doing research.
The Dean of BUS has cash awards for top quality journal articles.
Pure enjoyment
Satisfaction associated with new discoveries
As AUC salaries lag, I think a great many faculty engage in research to provide more
opportunities for higher salaries elsewhere.
0 10 20 30 40 50 60 70 80
My personal commitment to scholarlyactivity/research.
To enhance/maintain my reputation among thecommunity of scholars
To provide students with opportunities
To improve the quality of my teaching
To improve favorable decisions for meritincreases
To achieve my overall career objectives
It is valued by my department.
It is valued by the School.
Not a factor
Somewhat a factor
Neutral
A factor
A big factor

The Office of Institutional Research/AUC Page 9
Table 4
Different Barriers Not a factor
Somewhat a factor
Neutral A
factor A big factor
Missing Total
Not enough time due to teaching load
7 4 4 25 56 8 104
6.7% 3.8% 3.8% 24.0% 53.8% 7.7% 100%
Not enough time due to administrative (committee) load
11 1 13 33 37 9 104
10.6% 1.0% 12.5% 31.7% 35.6% 8.7% 100%
Not enough time due to advising load
33 4 26 22 9 10 104
31.7% 3.8% 25.0% 21.2% 8.7% 9.6% 100%
Too much redtape within the School
36 6 24 20 7 11 104
34.6% 5.8% 23.1% 19.2% 6.7% 10.6% 100%
Too much redtape within the Administration
32 9 21 16 16 10 104
30.8% 8.7% 20.2% 15.4% 15.4% 9.6% 100%
Inadequate facilities
40 8 18 15 12 11 104
38.5% 7.7% 17.3% 14.4% 11.5% 10.6% 100%
Inadequate equipment
54 6 18 8 8 10 104
51.9% 5.8% 17.3% 7.7% 7.7% 9.6% 100%
Is too labor intensive 48 10 18 13 4 11 104
46.2% 9.6% 17.3% 12.5% 3.8% 10.6% 100%
Not rewarding 71 4 5 10 3 11 104
68.3% 3.8% 4.8% 9.6% 2.9% 10.6% 100%
Lack of collaboration opportunities in my department
43 12 17 13 8 11 104
41.3% 11.5% 16.3% 12.5% 7.7% 10.6% 100%
Lack of collaboration opportunities across the School
45 11 18 14 6 10 104
43.3% 10.6% 17.3% 13.5% 5.8% 9.6% 100%
Inadequate budget for professional travel
34 9 12 25 13 11 104
32.7% 8.7% 11.5% 24.0% 12.5% 10.6% 100%
Lack of departmental support
52 5 19 6 12 10 104
50.0% 4.8% 18.3% 5.8% 11.5% 9.6% 100%
Lack of my Dean's support 57 4 15 8 11 9 104
54.8% 3.8% 14.4% 7.7% 10.6% 8.7% 100%
Lack of Administration support
37 7 17 9 16 18 104
35.6% 6.7% 16.3% 8.7% 15.4% 17.3% 100%
The Office of Institutional Research/AUC Page 10
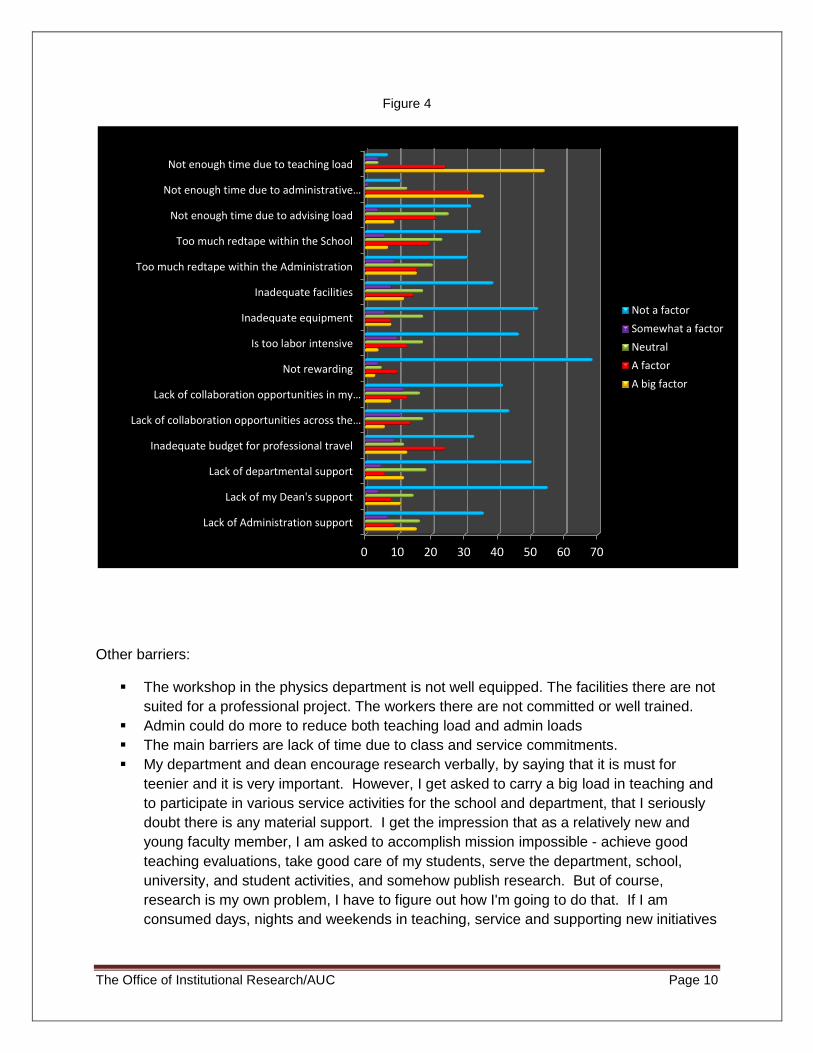
Figure 4
Other barriers:
The workshop in the physics department is not well equipped. The facilities there are not
suited for a professional project. The workers there are not committed or well trained.
Admin could do more to reduce both teaching load and admin loads
The main barriers are lack of time due to class and service commitments.
My department and dean encourage research verbally, by saying that it is must for
teenier and it is very important. However, I get asked to carry a big load in teaching and
to participate in various service activities for the school and department, that I seriously
doubt there is any material support. I get the impression that as a relatively new and
young faculty member, I am asked to accomplish mission impossible - achieve good
teaching evaluations, take good care of my students, serve the department, school,
university, and student activities, and somehow publish research. But of course,
research is my own problem, I have to figure out how I'm going to do that. If I am
consumed days, nights and weekends in teaching, service and supporting new initiatives
0 10 20 30 40 50 60 70
Not enough time due to teaching load
Not enough time due to administrative…
Not enough time due to advising load
Too much redtape within the School
Too much redtape within the Administration
Inadequate facilities
Inadequate equipment
Is too labor intensive
Not rewarding
Lack of collaboration opportunities in my…
Lack of collaboration opportunities across the…
Inadequate budget for professional travel
Lack of departmental support
Lack of my Dean's support
Lack of Administration support
Not a factor
Somewhat a factor
Neutral
A factor
A big factor
The Office of Institutional Research/AUC Page 11
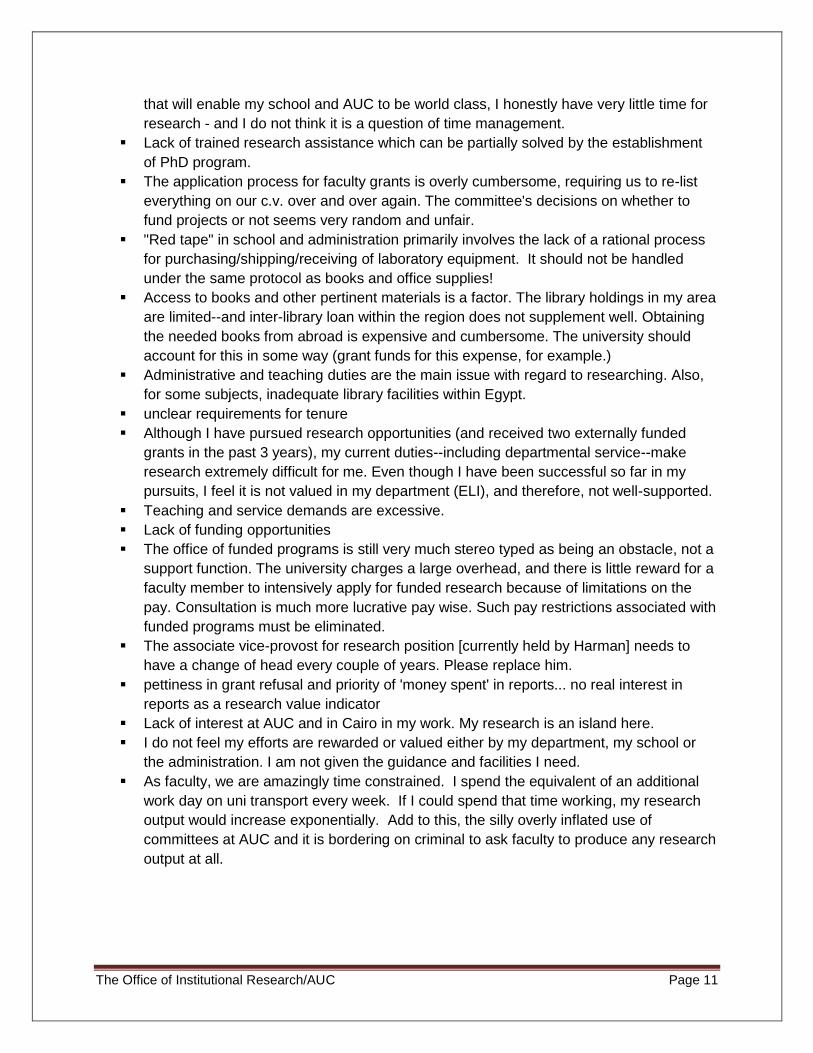
that will enable my school and AUC to be world class, I honestly have very little time for
research - and I do not think it is a question of time management.
Lack of trained research assistance which can be partially solved by the establishment
of PhD program.
The application process for faculty grants is overly cumbersome, requiring us to re-list
everything on our c.v. over and over again. The committee's decisions on whether to
fund projects or not seems very random and unfair.
"Red tape" in school and administration primarily involves the lack of a rational process
for purchasing/shipping/receiving of laboratory equipment. It should not be handled
under the same protocol as books and office supplies!
Access to books and other pertinent materials is a factor. The library holdings in my area
are limited--and inter-library loan within the region does not supplement well. Obtaining
the needed books from abroad is expensive and cumbersome. The university should
account for this in some way (grant funds for this expense, for example.)
Administrative and teaching duties are the main issue with regard to researching. Also,
for some subjects, inadequate library facilities within Egypt.
unclear requirements for tenure
Although I have pursued research opportunities (and received two externally funded
grants in the past 3 years), my current duties--including departmental service--make
research extremely difficult for me. Even though I have been successful so far in my
pursuits, I feel it is not valued in my department (ELI), and therefore, not well-supported.
Teaching and service demands are excessive.
Lack of funding opportunities
The office of funded programs is still very much stereo typed as being an obstacle, not a
support function. The university charges a large overhead, and there is little reward for a
faculty member to intensively apply for funded research because of limitations on the
pay. Consultation is much more lucrative pay wise. Such pay restrictions associated with
funded programs must be eliminated.
The associate vice-provost for research position [currently held by Harman] needs to
have a change of head every couple of years. Please replace him.
pettiness in grant refusal and priority of 'money spent' in reports... no real interest in
reports as a research value indicator
Lack of interest at AUC and in Cairo in my work. My research is an island here.
I do not feel my efforts are rewarded or valued either by my department, my school or
the administration. I am not given the guidance and facilities I need.
As faculty, we are amazingly time constrained. I spend the equivalent of an additional
work day on uni transport every week. If I could spend that time working, my research
output would increase exponentially. Add to this, the silly overly inflated use of
committees at AUC and it is bordering on criminal to ask faculty to produce any research
output at all.
The Office of Institutional Research/AUC Page 12
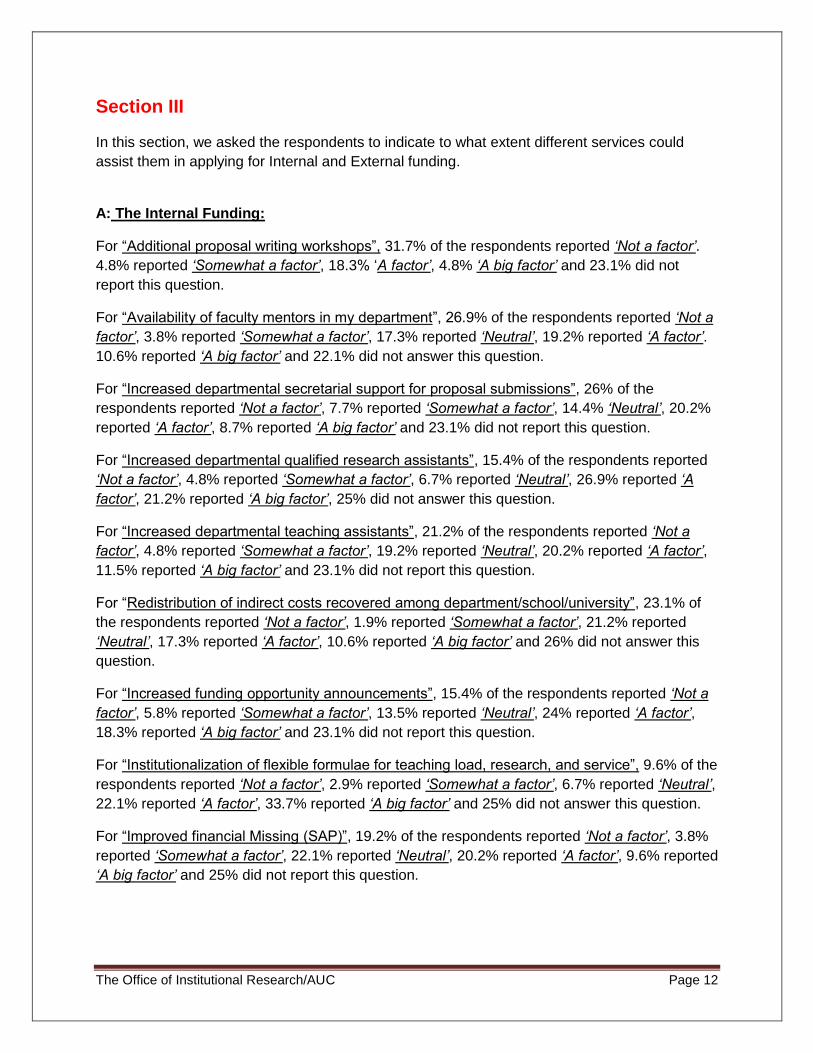
Section III
In this section, we asked the respondents to indicate to what extent different services could
assist them in applying for Internal and External funding.
A: The Internal Funding:
For “Additional proposal writing workshops”, 31.7% of the respondents reported ‘Not a factor’.
4.8% reported ‘Somewhat a factor’, 18.3% ‘A factor’, 4.8% ‘A big factor’ and 23.1% did not
report this question.
For “Availability of faculty mentors in my department”, 26.9% of the respondents reported ‘Not a
factor’, 3.8% reported ‘Somewhat a factor’, 17.3% reported ‘Neutral’, 19.2% reported ‘A factor’.
10.6% reported ‘A big factor’ and 22.1% did not answer this question.
For “Increased departmental secretarial support for proposal submissions”, 26% of the
respondents reported ‘Not a factor’, 7.7% reported ‘Somewhat a factor’, 14.4% ‘Neutral’, 20.2%
reported ‘A factor’, 8.7% reported ‘A big factor’ and 23.1% did not report this question.
For “Increased departmental qualified research assistants”, 15.4% of the respondents reported
‘Not a factor’, 4.8% reported ‘Somewhat a factor’, 6.7% reported ‘Neutral’, 26.9% reported ‘A
factor’, 21.2% reported ‘A big factor’, 25% did not answer this question.
For “Increased departmental teaching assistants”, 21.2% of the respondents reported ‘Not a
factor’, 4.8% reported ‘Somewhat a factor’, 19.2% reported ‘Neutral’, 20.2% reported ‘A factor’,
11.5% reported ‘A big factor’ and 23.1% did not report this question.
For “Redistribution of indirect costs recovered among department/school/university”, 23.1% of
the respondents reported ‘Not a factor’, 1.9% reported ‘Somewhat a factor’, 21.2% reported
‘Neutral’, 17.3% reported ‘A factor’, 10.6% reported ‘A big factor’ and 26% did not answer this
question.
For “Increased funding opportunity announcements”, 15.4% of the respondents reported ‘Not a
factor’, 5.8% reported ‘Somewhat a factor’, 13.5% reported ‘Neutral’, 24% reported ‘A factor’,
18.3% reported ‘A big factor’ and 23.1% did not report this question.
For “Institutionalization of flexible formulae for teaching load, research, and service”, 9.6% of the
respondents reported ‘Not a factor’, 2.9% reported ‘Somewhat a factor’, 6.7% reported ‘Neutral’,
22.1% reported ‘A factor’, 33.7% reported ‘A big factor’ and 25% did not answer this question.
For “Improved financial Missing (SAP)”, 19.2% of the respondents reported ‘Not a factor’, 3.8%
reported ‘Somewhat a factor’, 22.1% reported ‘Neutral’, 20.2% reported ‘A factor’, 9.6% reported
‘A big factor’ and 25% did not report this question.

The Office of Institutional Research/AUC Page 13
B: The External Funding:
For “Additional proposal writing workshops”, 28.8% of the respondents reported ‘Not a factor’.
9.6% reported ‘Somewhat a factor’, 13.5% ‘A factor’, 10.6% ‘A big factor’ and 18.3% did not
report this question.
For “Availability of faculty mentors in my department”, 26% of the respondents reported ‘Not a
factor’, 5.8% reported ‘Somewhat a factor’, 14.4% reported ‘Neutral’, 26% reported ‘A factor’.
9.6% reported ‘A big factor’ and 18.3% did not answer this question.
For “Increased departmental secretarial support for proposal submissions”, 19.2% of the
respondents reported ‘Not a factor’, 9.6% reported ‘Somewhat a factor’, 15.4% ‘Neutral’, 23.1%
reported ‘A factor’, 13.5% reported ‘A big factor’ and 19.2% did not report this question.
For “Increased departmental qualified research assistants”, 9.6% of the respondents reported
‘Not a factor’, 6.7% reported ‘Somewhat a factor’, 11.5% reported ‘Neutral’, 25% reported ‘A
factor’, 27.9% reported ‘A big factor’, 19.2% did not answer this question.
For “Increased departmental teaching assistants”, 17.3% of the respondents reported ‘Not a
factor’, 4.8% reported ‘Somewhat a factor’, 17.3% reported ‘Neutral’, 25% reported ‘A factor’,
15.4% reported ‘A big factor’ and 20.2% did not report this question.
For “Redistribution of indirect costs recovered among department/school/university”, 12.5% of
the respondents reported ‘Not a factor’, 2.9% reported ‘Somewhat a factor’, 21.2% reported
‘Neutral’, 26% reported ‘A factor’, 16.3% reported ‘A big factor’ and 21.2% did not answer this
question.
For “Increased funding opportunity announcements”, 7.7% of the respondents reported ‘Not a
factor’, 7.7% reported ‘Somewhat a factor’, 13.5% reported ‘Neutral’, 27.9% reported ‘A factor’,
25% reported ‘A big factor’ and 18.3% did not report this question.
For “Institutionalization of flexible formulae for teaching load, research, and service”, 3.8% of the
respondents reported ‘Not a factor’, 4.8% reported ‘Somewhat a factor’, 8.7% reported ‘Neutral’,
21.2% reported ‘A factor’, 41.3% reported ‘A big factor’ and 20.2% did not answer this question.
For “Improved financial Missing (SAP)”, 12.5% of the respondents reported ‘Not a factor’, 1.9%
reported ‘Somewhat a factor’, 29.8% reported ‘Neutral’, 18.3% reported ‘A factor’, 14.4%
reported ‘A big factor’ and 23.1% did not report this question.
The Office of Institutional Research/AUC Page 14
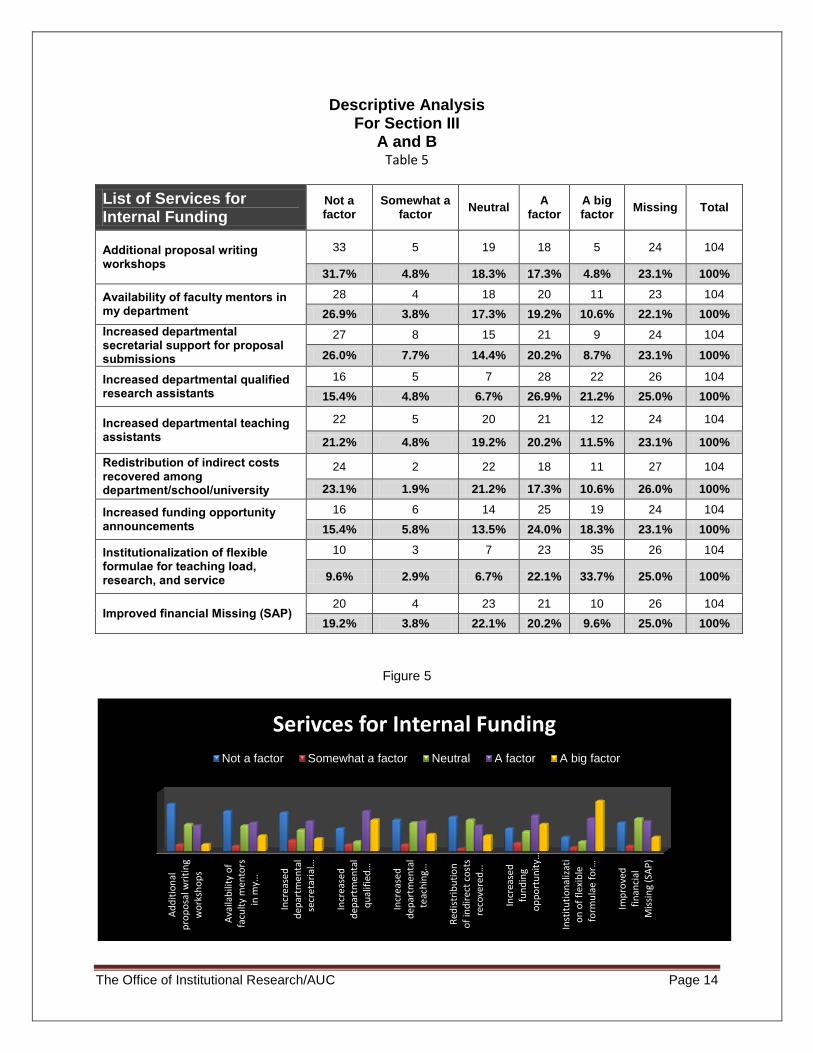
Descriptive Analysis For Section III
A and B Table 5
List of Services for Internal Funding
Not a factor
Somewhat a factor
Neutral A
factor A big factor
Missing Total
Additional proposal writing workshops
33 5 19 18 5 24 104
31.7% 4.8% 18.3% 17.3% 4.8% 23.1% 100%
Availability of faculty mentors in my department
28 4 18 20 11 23 104
26.9% 3.8% 17.3% 19.2% 10.6% 22.1% 100%
Increased departmental secretarial support for proposal submissions
27 8 15 21 9 24 104
26.0% 7.7% 14.4% 20.2% 8.7% 23.1% 100%
Increased departmental qualified research assistants
16 5 7 28 22 26 104
15.4% 4.8% 6.7% 26.9% 21.2% 25.0% 100%
Increased departmental teaching assistants
22 5 20 21 12 24 104
21.2% 4.8% 19.2% 20.2% 11.5% 23.1% 100%
Redistribution of indirect costs recovered among department/school/university
24 2 22 18 11 27 104
23.1% 1.9% 21.2% 17.3% 10.6% 26.0% 100%
Increased funding opportunity announcements
16 6 14 25 19 24 104
15.4% 5.8% 13.5% 24.0% 18.3% 23.1% 100%
Institutionalization of flexible formulae for teaching load, research, and service
10 3 7 23 35 26 104
9.6% 2.9% 6.7% 22.1% 33.7% 25.0% 100%
Improved financial Missing (SAP) 20 4 23 21 10 26 104
19.2% 3.8% 22.1% 20.2% 9.6% 25.0% 100%
Figure 5
Ad
dit
ion
alp
rop
osa
l wri
tin
gw
ork
sho
ps
Ava
ilab
ility
of
facu
lty
men
tors
in m
y…
Incr
ease
dd
epar
tmen
tal
secr
etar
ial…
Incr
ease
dd
epar
tmen
tal
qu
alif
ied
…
Incr
ease
dd
epar
tmen
tal
teac
hin
g…
Red
istr
ibu
tio
no
f in
dir
ect
cost
sre
cove
red
…
Incr
ease
dfu
nd
ing
op
po
rtu
nit
y…
Inst
itu
tio
nal
izat
io
n o
f fl
exib
lefo
rmu
lae
for…
Imp
rove
dfi
nan
cial
Mis
sin
g (S
AP
)
Serivces for Internal Funding
Not a factor Somewhat a factor Neutral A factor A big factor

The Office of Institutional Research/AUC Page 15
Other assisting factors for internal funding:
Please see above. Plus, for all of these, since when should "Neutral" fall between
"Somewhat a factor" and "A factor"? I think your numbers are going to be off--how is
"Neutral" distinguished from "Not a factor"? Most of us are probably familiar enough with
Likert scales to figure out what you're getting at, but I would be afraid to assume as
much in my own research design. Good luck!
transparency at the department and school level.
The current rate that is paid teaching assistants will not attract qualified graduate TAs. 3
hours a week per course is not enough.
Keeping simple grant applications and procedures as we have in the past is most
beneficial to the whole application process and actually doing the work. Asking for
lengthy proposals and reports (in some instances, such as with conferences or when
one has done library research) is counterproductive. Similarly, large-scale accounting is
pointless for grants that are less than $10,000.
There are few (no?) faculty mentors in the ELI as far as internal (or external) research is
concerned.
Having Graham in place is a blessing, he is thorough and linear. A very clear guy and a
pleasure to work with, easily accessible and insightful.
Availability of a summer deadline for submitting proposals
I think Q6 is irrelevant to Internal Funding
The attitude of OSP has been very detrimental for incentive to apply for institutional
grants. Overhead has to be justified and not just taken as a matter of course
simplification of the process

The Office of Institutional Research/AUC Page 16
Descriptive Analysis For Section III
Table 6
List of Services for External Funding
Not a factor
Somewhat a factor
Neutral A
factor A big factor
Missing Total
Additional proposal writing workshops
30 10 14 20 11 19 104
28.8% 9.6% 13.5% 19.2% 10.6% 18.3% 100%
Availability of faculty mentors in my department
27 6 15 27 10 19 104
26.0% 5.8% 14.4% 26.0% 9.6% 18.3% 100%
Increased departmental secretarial support for proposal submissions
20 10 16 24 14 20 104
19.2% 9.6% 15.4% 23.1% 13.5% 19.2% 100%
Increased departmental qualified research assistants
10 7 12 26 29 20 104
9.6% 6.7% 11.5% 25.0% 27.9% 19.2% 100%
Increased departmental teaching assistants
18 5 18 26 16 21 104
17.3% 4.8% 17.3% 25.0% 15.4% 20.2% 100%
Redistribution of indirect costs recovered among department/school/university
13 3 22 27 17 22 104
12.5% 2.9% 21.2% 26.0% 16.3% 21.2% 100%
Increased funding opportunity announcements
8 8 14 29 26 19 104
7.7% 7.7% 13.5% 27.9% 25.0% 18.3% 100%
Institutionalization of flexible formulae for teaching load, research, and service
4 5 9 22 43 21 104
3.8% 4.8% 8.7% 21.2% 41.3% 20.2% 100%
Improved financial Missing (SAP)
13 2 31 19 15 24 104
12.5% 1.9% 29.8% 18.3% 14.4% 23.1% 100%
Figure 6
Ad
dit
ion
alp
rop
osa
l wri
tin
gw
ork
sho
ps
Ava
ilab
ility
of
facu
lty
men
tors
in m
y…
Incr
eas
edd
ep
artm
en
tal
secr
etar
ial…
Incr
eas
edd
ep
artm
en
tal
qu
alif
ied
…
Incr
eas
edd
ep
artm
en
tal
teac
hin
g…
Red
istr
ibu
tio
n o
fin
dir
ect
co
sts
reco
vere
d…
Incr
eas
edfu
nd
ing
op
po
rtu
nit
y…
Inst
itu
tio
nal
izat
io
n o
f fl
exi
ble
form
ula
e fo
r…
Imp
rove
dfi
nan
cial
Mis
sin
g(S
AP
)
Services for External Funding
Not a factor Somewhat a factor Neutral A factor A big factor
The Office of Institutional Research/AUC Page 17
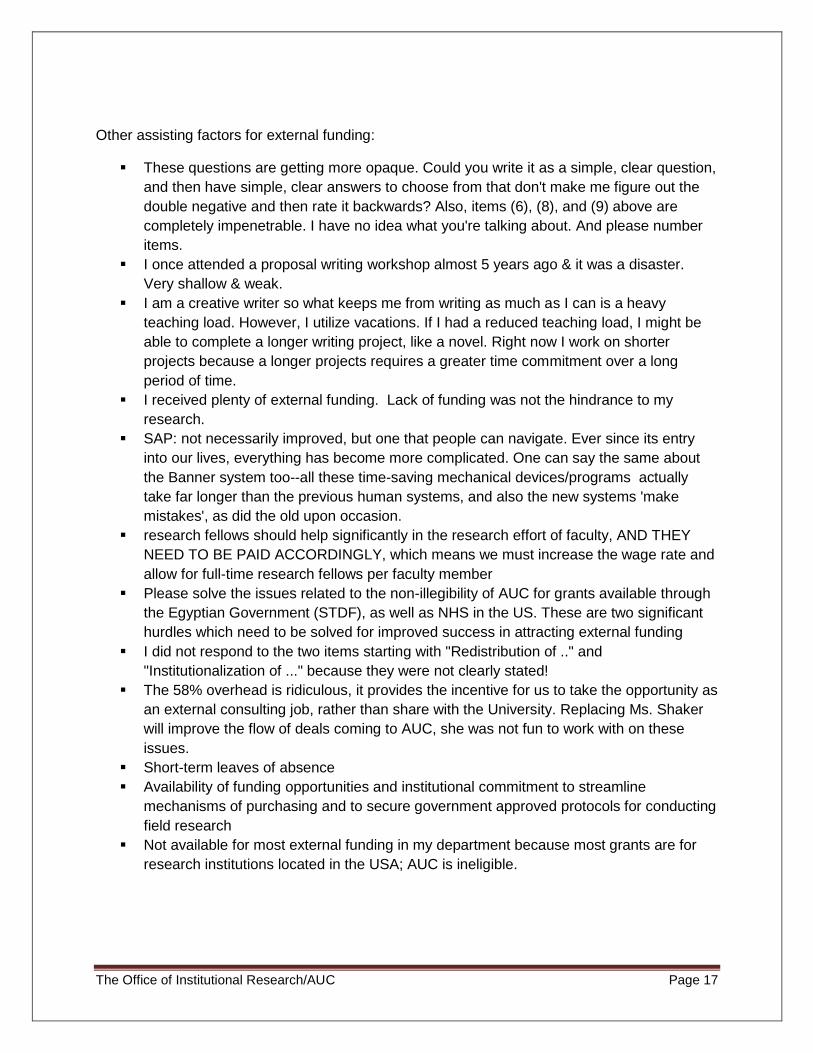
Other assisting factors for external funding:
These questions are getting more opaque. Could you write it as a simple, clear question,
and then have simple, clear answers to choose from that don't make me figure out the
double negative and then rate it backwards? Also, items (6), (8), and (9) above are
completely impenetrable. I have no idea what you're talking about. And please number
items.
I once attended a proposal writing workshop almost 5 years ago & it was a disaster.
Very shallow & weak.
I am a creative writer so what keeps me from writing as much as I can is a heavy
teaching load. However, I utilize vacations. If I had a reduced teaching load, I might be
able to complete a longer writing project, like a novel. Right now I work on shorter
projects because a longer projects requires a greater time commitment over a long
period of time.
I received plenty of external funding. Lack of funding was not the hindrance to my
research.
SAP: not necessarily improved, but one that people can navigate. Ever since its entry
into our lives, everything has become more complicated. One can say the same about
the Banner system too--all these time-saving mechanical devices/programs actually
take far longer than the previous human systems, and also the new systems 'make
mistakes', as did the old upon occasion.
research fellows should help significantly in the research effort of faculty, AND THEY
NEED TO BE PAID ACCORDINGLY, which means we must increase the wage rate and
allow for full-time research fellows per faculty member
Please solve the issues related to the non-illegibility of AUC for grants available through
the Egyptian Government (STDF), as well as NHS in the US. These are two significant
hurdles which need to be solved for improved success in attracting external funding
I did not respond to the two items starting with "Redistribution of .." and
"Institutionalization of ..." because they were not clearly stated!
The 58% overhead is ridiculous, it provides the incentive for us to take the opportunity as
an external consulting job, rather than share with the University. Replacing Ms. Shaker
will improve the flow of deals coming to AUC, she was not fun to work with on these
issues.
Short-term leaves of absence
Availability of funding opportunities and institutional commitment to streamline
mechanisms of purchasing and to secure government approved protocols for conducting
field research
Not available for most external funding in my department because most grants are for
research institutions located in the USA; AUC is ineligible.
The Office of Institutional Research/AUC Page 18
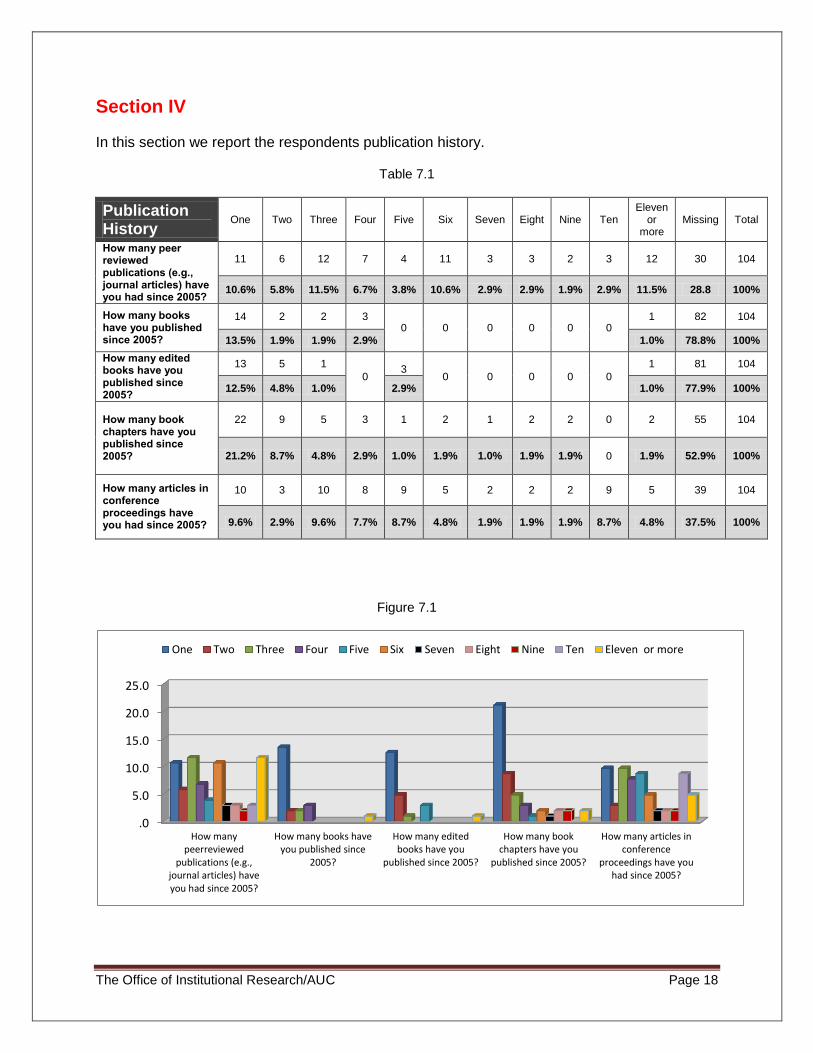
Section IV
In this section we report the respondents publication history.
Table 7.1
Publication History
One Two Three Four Five Six Seven Eight Nine Ten Eleven
or more
Missing Total
How many peer reviewed publications (e.g., journal articles) have you had since 2005?
11 6 12 7 4 11 3 3 2 3 12 30 104
10.6% 5.8% 11.5% 6.7% 3.8% 10.6% 2.9% 2.9% 1.9% 2.9% 11.5% 28.8 100%
How many books have you published since 2005?
14 2 2 3 0 0 0 0 0 0
1 82 104
13.5% 1.9% 1.9% 2.9% 1.0% 78.8% 100%
How many edited books have you published since 2005?
13 5 1
0 3
0 0 0 0 0
1 81 104
12.5% 4.8% 1.0% 2.9% 1.0% 77.9% 100%
How many book chapters have you published since 2005?
22 9 5 3 1 2 1 2 2 0 2 55 104
21.2% 8.7% 4.8% 2.9% 1.0% 1.9% 1.0% 1.9% 1.9% 0 1.9% 52.9% 100%
How many articles in conference proceedings have you had since 2005?
10 3 10 8 9 5 2 2 2 9 5 39 104
9.6% 2.9% 9.6% 7.7% 8.7% 4.8% 1.9% 1.9% 1.9% 8.7% 4.8% 37.5% 100%
Figure 7.1
.0
5.0
10.0
15.0
20.0
25.0
How manypeerreviewed
publications (e.g.,journal articles) haveyou had since 2005?
How many books haveyou published since
2005?
How many editedbooks have you
published since 2005?
How many bookchapters have you
published since 2005?
How many articles inconference
proceedings have youhad since 2005?
One Two Three Four Five Six Seven Eight Nine Ten Eleven or more
The Office of Institutional Research/AUC Page 19
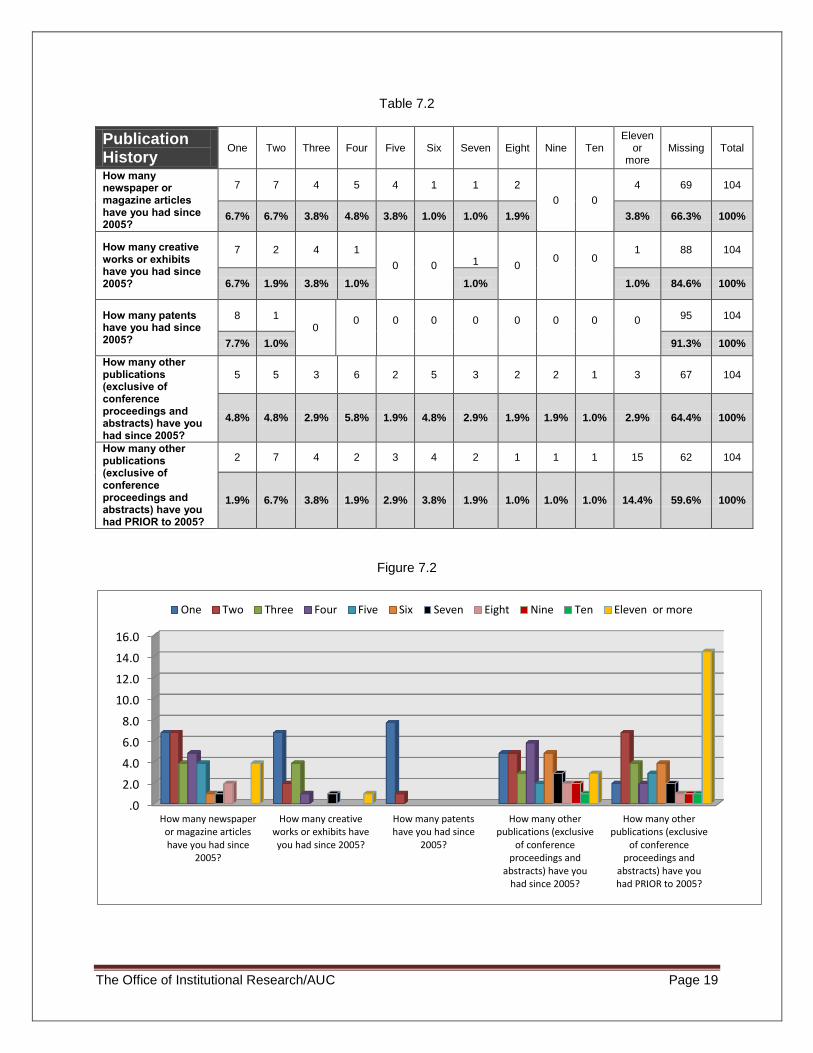
Table 7.2
Publication History
One Two Three Four Five Six Seven Eight Nine Ten Eleven
or more
Missing Total
How many newspaper or magazine articles have you had since 2005?
7 7 4 5 4 1 1 2
0 0
4 69 104
6.7% 6.7% 3.8% 4.8% 3.8% 1.0% 1.0% 1.9% 3.8% 66.3% 100%
How many creative works or exhibits have you had since 2005?
7 2 4 1
0 0 1 0 0 0
1 88 104
6.7% 1.9% 3.8% 1.0% 1.0% 1.0% 84.6% 100%
How many patents have you had since 2005?
8 1 0
0 0 0 0 0 0 0 0 95 104
7.7% 1.0% 91.3% 100%
How many other publications (exclusive of conference proceedings and abstracts) have you had since 2005?
5 5 3 6 2 5 3 2 2 1 3 67 104
4.8% 4.8% 2.9% 5.8% 1.9% 4.8% 2.9% 1.9% 1.9% 1.0% 2.9% 64.4% 100%
How many other publications (exclusive of conference proceedings and abstracts) have you had PRIOR to 2005?
2 7 4 2 3 4 2 1 1 1 15 62 104
1.9% 6.7% 3.8% 1.9% 2.9% 3.8% 1.9% 1.0% 1.0% 1.0% 14.4% 59.6% 100%
Figure 7.2
.0
2.0
4.0
6.0
8.0
10.0
12.0
14.0
16.0
How many newspaperor magazine articleshave you had since
2005?
How many creativeworks or exhibits haveyou had since 2005?
How many patentshave you had since
2005?
How many otherpublications (exclusive
of conferenceproceedings and
abstracts) have youhad since 2005?
How many otherpublications (exclusive
of conferenceproceedings and
abstracts) have youhad PRIOR to 2005?
One Two Three Four Five Six Seven Eight Nine Ten Eleven or more

The Office of Institutional Research/AUC Page 20
Section V
Answering the question, how many proposals have you submitted for funding?, for the
first part: While at AUC and since 2005 is as follows:
For “Submitted for external funding”, 28.8% of the respondents reported ‘Zero’, 13.5% reported
‘One’, 10.6% reported ‘Two’, 6.7% reported ‘Three’, 4.8% reported ‘Four’, 13.5% reported ‘Five
or more’ and 22.1% did not report this question.
For “Had externally funded”, 36.5% of the respondents reported ‘Zero’, 18.3% reported ‘One’,
9.6% reported ‘Two’, 1.9% reported ‘Three’, 2.9% reported ‘Four’, 5.8% reported ‘Five or more’
and 25% did not report this question.
For “Submitted for internal funding”, 12.5% of the respondents reported ‘Zero’, 16.3% reported
‘One’, 8.7% reported ‘Two’, 7.7% reported ‘Three’, 10.6% reported ‘Four’, 19.2% reported ‘Five
or more’ and 25% did not report this question.
For “Had internally funded”, 11.5% of the respondents reported ‘Zero’, 21.2% reported ‘One’,
8.7% reported ‘Two’, 3.8% reported ‘Three’, 12.5% reported ‘Four’, 16.3% reported ‘Five or
more’ and 26% did not report this question.
Table 8.1
Submitted for external funding?
Frequency Percent
Zero 30 28.8%
One 14 13.5%
Two 11 10.6%
Three 7 6.7%
Four 5 4.8%
Five or more 14 13.5%
Missing 23 22.1%
Total 104 100%
Table 8.2
Had externally funded? Frequency Percent
Zero 38 36.5%
One 19 18.3%
Two 10 9.6%
Three 2 1.9%
Four 3 2.9%
Five or more 6 5.8%
Missing 26 25.0%
Total 104 100%
Table 8.3
Submitted for internal funding?
Frequency Percent
Zero 13 12.5%
One 17 16.3%
Two 9 8.7%
Three 8 7.7%
Four 11 10.6%
Five or more 20 19.2%
Missing 26 25.0%
Total 104 100%
Table 8.4
Had internally funded? Frequency Percent
Zero 12 11.5%
One 22 21.2%
Two 9 8.7%
Three 4 3.8%
Four 13 12.5%
Five or more 17 16.3%
Missing 27 26.0%
Total 104 100%

The Office of Institutional Research/AUC Page 21
Figure 8
Answering the question, how many proposals have you submitted for funding?, for the
second part: While at AUC and BEFORE 2005 is as follows:
For “Submitted for external funding”, 25% of the respondents reported ‘Zero’, 8.7% reported
‘One’, 3.8% reported ‘Two’, 4.8% reported ‘Three’, 1.9% reported ‘Four’, 4.8% reported ‘Five or
more’ and 51% did not report this question.
For “Had externally funded”, 26.9% of the respondents reported ‘Zero’, 8.7% reported ‘One’,
3.8% reported ‘Two’, 4.8% reported ‘Three’,1 % reported ‘Four’, 3.8% reported ‘Five or more’
and 51% did not report this question.
For “Submitted for internal funding”, 24% of the respondents reported ‘Zero’, 2.9% reported
‘One’, 2.9% reported ‘Two’, 7.7% reported ‘Three’, 1.9% reported ‘Four’, 7.7% reported ‘Five or
more’ and 52.9% did not report this question.
For “Had internally funded”, 23.1% of the respondents reported ‘Zero’, 2.9 % reported ‘One’,
3.8% reported ‘Two’, 6.7% reported ‘Three’, 1.9% reported ‘Four’, 7.7% reported ‘Five or more’
and 53.8% did not report this question.
.0
5.0
10.0
15.0
20.0
25.0
30.0
35.0
40.0
Submitted forexternal funding
Had externallyfunded
Submitted forinternal funding
Had internallyfunded
Number of proposals submitted while at AUC and since 2005
Zero
One
Two
Three
Four
Five or more

The Office of Institutional Research/AUC Page 22
Table 9.1
Submitted for external funding?
Frequency Percent
Zero 26 25.0%
One 9 8.7%
Two 4 3.8%
Three 5 4.8%
Four 2 1.9%
Five or more 5 4.8%
Missing 53 51.0%
Total 104 100%
Table 9.2
Had externally funded? Frequency Percent
Zero 28 26.9%
One 9 8.7%
Two 4 3.8%
Three 5 4.8%
Four 1 1.0%
Five or more 4 3.8%
Missing 53 51.0%
Total 104 100%
Table 9.3
Submitted for internal funding?
Frequency Percent
Zero 25 24.0%
One 3 2.9%
Two 3 2.9%
Three 8 7.7%
Four 2 1.9%
Five or more 8 7.7%
Missing 55 52.9%
Total 104 100%
Table 9.4
Had internally funded? Frequency Percent
Zero 24 23.1%
One 3 2.9%
Two 4 3.8%
Three 7 6.7%
Four 2 1.9%
Five or more 8 7.7%
Missing 56 53.8%
Total 104 100%
Figure 9
.0
5.0
10.0
15.0
20.0
25.0
30.0
Submitted forexternal funding
Had externallyfunded
Submitted forinternal funding
Had internallyfunded
Number of proposals submitted while at AUC and BEFORE 2005
Zero
One
Two
Three
Four
Five or more
The Office of Institutional Research/AUC Page 23
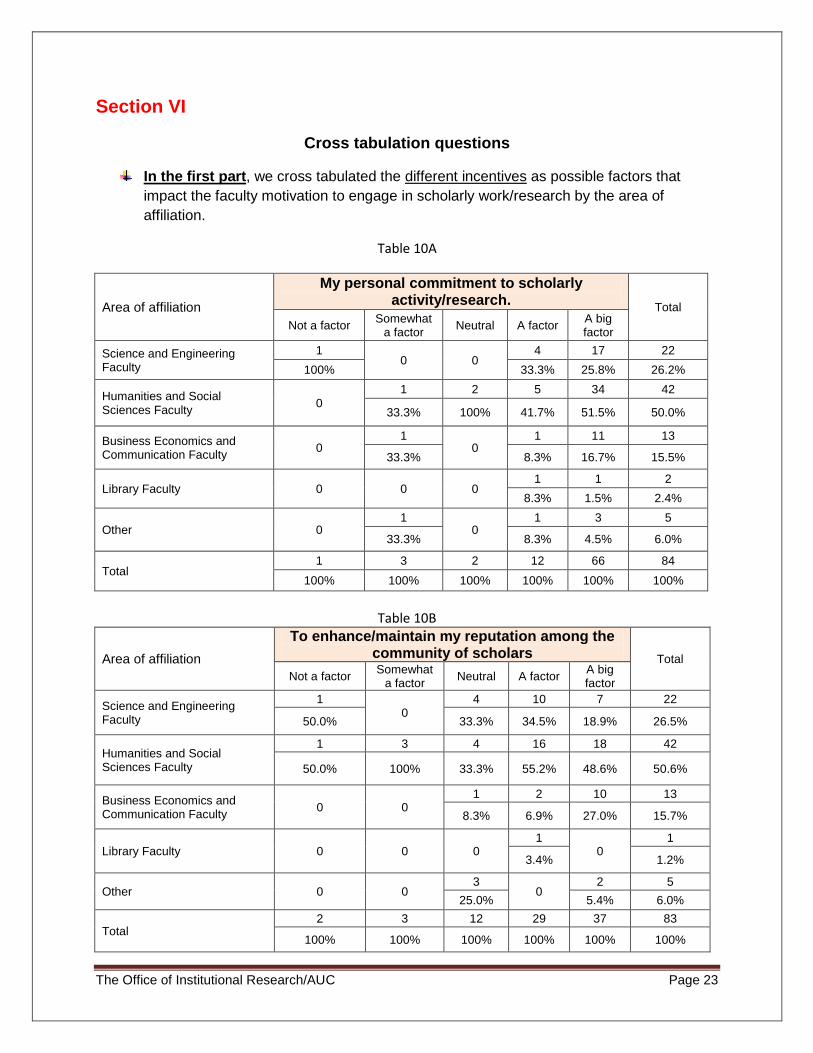
Section VI
Cross tabulation questions
In the first part, we cross tabulated the different incentives as possible factors that
impact the faculty motivation to engage in scholarly work/research by the area of
affiliation.
Table 10A
Area of affiliation
My personal commitment to scholarly activity/research.
Total
Not a factor Somewhat
a factor Neutral A factor
A big factor
Science and Engineering Faculty
1 0 0
4 17 22
100% 33.3% 25.8% 26.2%
Humanities and Social Sciences Faculty
0 1 2 5 34 42
33.3% 100% 41.7% 51.5% 50.0%
Business Economics and Communication Faculty
0 1
0 1 11 13
33.3% 8.3% 16.7% 15.5%
Library Faculty 0 0 0 1 1 2
8.3% 1.5% 2.4%
Other 0 1
0 1 3 5
33.3% 8.3% 4.5% 6.0%
Total 1 3 2 12 66 84
100% 100% 100% 100% 100% 100%
Table 10B
Area of affiliation
To enhance/maintain my reputation among the community of scholars Total
Not a factor Somewhat
a factor Neutral A factor
A big factor
Science and Engineering Faculty
1 0
4 10 7 22
50.0% 33.3% 34.5% 18.9% 26.5%
Humanities and Social Sciences Faculty
1 3 4 16 18 42
50.0% 100% 33.3% 55.2% 48.6% 50.6%
Business Economics and Communication Faculty
0 0 1 2 10 13
8.3% 6.9% 27.0% 15.7%
Library Faculty 0 0 0 1
0 1
3.4% 1.2%
Other 0 0 3
0 2 5
25.0% 5.4% 6.0%
Total 2 3 12 29 37 83
100% 100% 100% 100% 100% 100%

The Office of Institutional Research/AUC Page 24
Table 10C
Area of affiliation
To provide students with opportunities Total
Not a factor Somewhat
a factor Neutral A factor
A big factor
Science and Engineering Faculty
1
0
2 13 6 22
12.5% 14.3% 34.2% 33.3% 26.8%
Humanities and Social Sciences Faculty
6 1 9 17 9 42
75.0% 25.0% 64.3% 44.7% 50.0% 51.2%
Business Economics and Communication Faculty
0 3 3 5 1 12
75.0% 21.4% 13.2% 5.6% 14.6%
Library Faculty 0 0 0 1
0 1
2.6% 1.2%
Other
1
0 0
2 2 5
12.5% 5.3% 11.1% 6.1%
Total
8 4 14 38 18 82
100% 100% 100% 100% 100% 100%
Table 10D
Area of affiliation
To improve the quality of my teaching Total
Not a factor Somewhat
a factor Neutral A factor
A big factor
Science and Engineering Faculty 0
4 5 9 4 22
40.0% 38.5% 28.1% 15.4% 26.2%
Humanities and Social Sciences Faculty
2 4 4 16 16 42
66.7% 40.0% 30.8% 50.0% 61.5% 50.0%
Business Economics and Communication Faculty
0
2 3 4 4 13
20.0% 23.1% 12.5% 15.4% 15.5%
Library Faculty
1
0 0
1
0
2
33.3% 3.1% 2.4%
Other 0 0
1 2 2 5
7.7% 6.3% 7.7% 6.0%
Total
3 10 13 32 26 84
100% 100% 100% 100% 100% 100%

The Office of Institutional Research/AUC Page 25
Table 10E
Area of affiliation
To improve favorable decisions for merit increases
Total
Not a factor Somewhat
a factor Neutral A factor
A big factor
Science and Engineering Faculty
4
0
6 8 4 22
44.4% 30.0% 27.6% 25.0% 26.2%
Humanities and Social Sciences Faculty
4 8 8 15 7 42
44.4% 80.0% 40.0% 51.7% 43.8% 50.0%
Business Economics and Communication Faculty
1 1 4 3 4 13
11.1% 10.0% 20.0% 10.3% 25.0% 15.5%
Library Faculty 0 1
0 1
0 2
10.0% 3.4% 2.4%
Other 0 0 2 2 1 5
10.0% 6.9% 6.3% 6.0%
Total
9 10 20 29 16 84
100% 100% 100% 100% 100% 100%
Table 10F
Area of affiliation
To achieve my overall career objectives Total
Not a factor Somewhat a
factor Neutral A factor
A big factor
Science and Engineering Faculty
1
0
3 9 9 22
100% 37.5% 31.0% 22.0% 26.5%
Humanities and Social Sciences Faculty
0
2 1 16 23 42
50.0% 12.5% 55.2% 56.1% 50.6%
Business Economics and Communication Faculty
0
2 2 2 7 13
50.0% 25.0% 6.9% 17.1% 15.7%
Library Faculty 0 0
1
0 0
1
12.5% 1.2%
Other 0 0
1 2 2 5
12.5% 6.9% 4.9% 6.0%
Total
1 4 8 29 41 83
100% 100% 100% 100% 100% 100%

The Office of Institutional Research/AUC Page 26
Table 10G
Area of affiliation It is valued by my department.
Total
Not a factor Somewhat
a factor Neutral A factor
A big factor
Science and Engineering Faculty
2
0
8 9 3 22
20.0% 57.1% 23.1% 21.4% 26.5%
Humanities and Social Sciences Faculty
6 4 3 23 6 42
60.0% 66.7% 21.4% 59.0% 42.9% 50.6%
Business Economics and Communication Faculty
1 2 3 4 3 13
10.0% 33.3% 21.4% 10.3% 21.4% 15.7%
Library Faculty 0 0 0
1
0
1
2.6% 1.2%
Other
1
0 0
2 2 5
10.0% 5.1% 14.3% 6.0%
Total
10 6 14 39 14 83
100% 100% 100% 100% 100% 100%
Table 10H
Area of affiliation
It is valued by the School Total
Not a factor Somewhat
a factor Neutral A factor
A big factor
Science and Engineering Faculty
2 1 6 9 4 22
22.2% 20.0% 50.0% 25.0% 23.5% 27.8%
Humanities and Social Sciences Faculty
5 3 3 20 7 38
55.6% 60.0% 25.0% 55.6% 41.2% 48.1%
Business Economics and Communication Faculty
1 1 2 5 4 13
11.1% 20.0% 16.7% 13.9% 23.5% 16.5%
Library Faculty 0 0 0
1
0
1
2.8% 1.3%
Other 1
0 1 1 2 5
11.1% 8.3% 2.8% 11.8% 6.3%
Total
9 5 12 36 17 79
100% 100% 100% 100% 100% 100%

The Office of Institutional Research/AUC Page 27
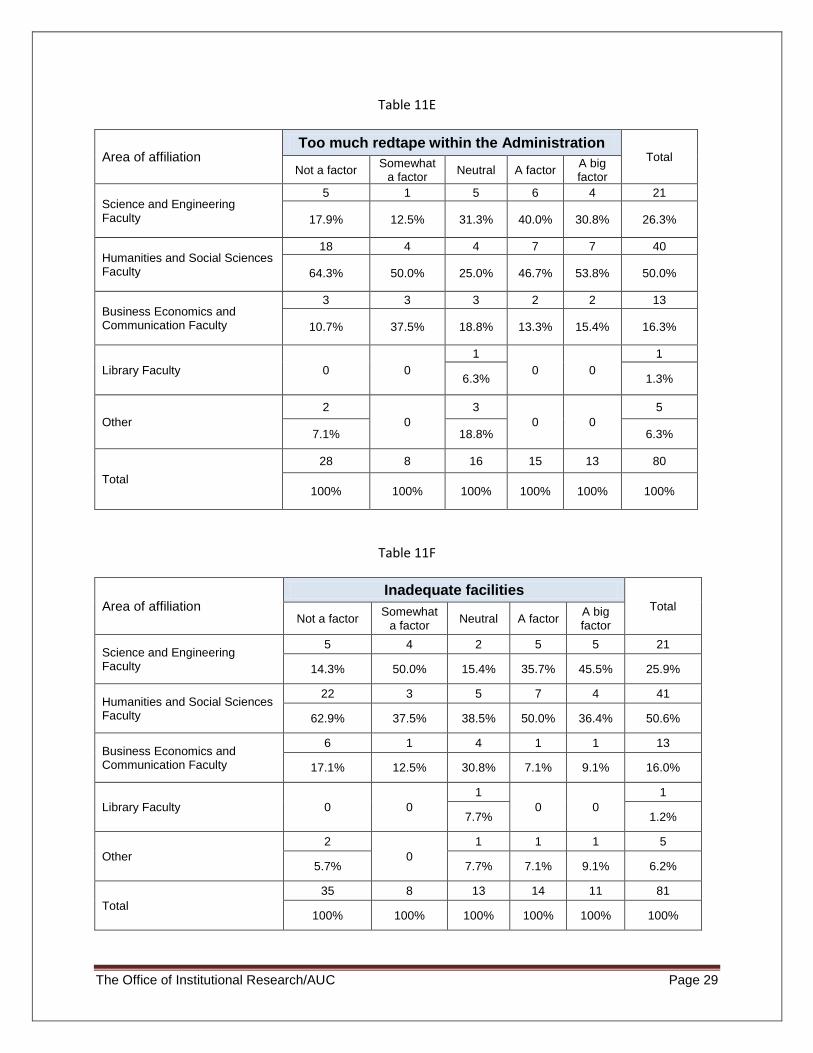
In the second part, we cross tabulated the different barriers as possible factors that
impact the faculty motivation to engage in scholarly work/research by the area of
affiliation.
Table 11A
Area of affiliation Not enough time due to teaching load
Total Not a factor
Somewhat a factor
Neutral A factor A big factor
Science and Engineering Faculty 3
0 0 7 11 21
42.9% 35.0% 22.9% 25.6%
Humanities and Social Sciences Faculty
3 3 1 11 24 42
42.9% 75.0% 33.3% 55.0% 50.0% 51.2%
Business Economics and Communication Faculty
0 1
0 1 11 13
25.0% 5.0% 22.9% 15.9%
Library Faculty 0 0 1
0 0 1
33.3% 1.2%
Other 1
0 1 1 2 5
14.3% 33.3% 5.0% 4.2% 6.1%
Total 7 4 3 20 48 82
100% 100% 100% 100% 100% 100%
X2=40.3, df=16, sig=.001
Table 11B
Area of affiliation
Not enough time due to administrative (committee) load Total
Not a factor Somewhat
a factor Neutral A factor
A big factor
Science and Engineering Faculty
4 1 4 5 7 21
40.0% 100% 33.3% 18.5% 21.9% 25.6%
Humanities and Social Sciences Faculty
4
0
5 17 15 41
40.0% 41.7% 63.0% 46.9% 50.0%
Business Economics and Communication Faculty
2
0 0
2 9 13
20.0% 7.4% 28.1% 15.9%
Library Faculty 0 0
1 1
0
2
8.3% 3.7% 2.4%
Other 0 0
2 2 1 5
16.7% 7.4% 3.1% 6.1%
Total
10 1 12 27 32 82
100% 100% 100% 100% 100% 100%

The Office of Institutional Research/AUC Page 28
Table 11C
Area of affiliation
Not enough time due to advising load Total
Not a factor Somewhat
a factor Neutral A factor
A big factor
Science and Engineering Faculty
7 1 6 6 1 21
24.1% 33.3% 26.1% 31.6% 14.3% 25.9%
Humanities and Social Sciences Faculty
16 1 7 11 6 41
55.2% 33.3% 30.4% 57.9% 85.7% 50.6%
Business Economics and Communication Faculty
5 1 6 1
0
13
17.2% 33.3% 26.1% 5.3% 16.0%
Library Faculty 0 0
1
0 0
1
4.3% 1.2%
Other
1
0
3 1
0
5
3.4% 13.0% 5.3% 6.2%
Total
29 3 23 19 7 81
100% 100% 100% 100% 100% 100%
Table 11D
Area of affiliation
Too much redtape within the School Total
Not a factor Somewhat
a factor Neutral A factor
A big factor
Science and Engineering Faculty
7 2 4 6 2 21
22.6% 40.0% 21.1% 33.3% 28.6% 26.3%
Humanities and Social Sciences Faculty
19 2 6 10 4 41
61.3% 40.0% 31.6% 55.6% 57.1% 51.3%
Business Economics and Communication Faculty
3 1 5 2 1 12
9.7% 20.0% 26.3% 11.1% 14.3% 15.0%
Library Faculty 0 0
1
0 0
1
5.3% 1.3%
Other
2
0
3
0 0
5
6.5% 15.8% 6.3%
Total
31 5 19 18 7 80
100% 100% 100% 100% 100% 100%
The Office of Institutional Research/AUC Page 29
Table 11E
Area of affiliation Too much redtape within the Administration
Total Not a factor
Somewhat a factor
Neutral A factor A big factor
Science and Engineering Faculty
5 1 5 6 4 21
17.9% 12.5% 31.3% 40.0% 30.8% 26.3%
Humanities and Social Sciences Faculty
18 4 4 7 7 40
64.3% 50.0% 25.0% 46.7% 53.8% 50.0%
Business Economics and Communication Faculty
3 3 3 2 2 13
10.7% 37.5% 18.8% 13.3% 15.4% 16.3%
Library Faculty 0 0
1
0 0
1
6.3% 1.3%
Other
2
0
3
0 0
5
7.1% 18.8% 6.3%
Total
28 8 16 15 13 80
100% 100% 100% 100% 100% 100%
Table 11F
Area of affiliation
Inadequate facilities Total
Not a factor Somewhat
a factor Neutral A factor
A big factor
Science and Engineering Faculty
5 4 2 5 5 21
14.3% 50.0% 15.4% 35.7% 45.5% 25.9%
Humanities and Social Sciences Faculty
22 3 5 7 4 41
62.9% 37.5% 38.5% 50.0% 36.4% 50.6%
Business Economics and Communication Faculty
6 1 4 1 1 13
17.1% 12.5% 30.8% 7.1% 9.1% 16.0%
Library Faculty 0 0
1
0 0
1
7.7% 1.2%
Other
2
0
1 1 1 5
5.7% 7.7% 7.1% 9.1% 6.2%
Total
35 8 13 14 11 81
100% 100% 100% 100% 100% 100%

The Office of Institutional Research/AUC Page 30
Table 11G
Area of affiliation Inadequate equipment
Total Not a factor
Somewhat a factor
Neutral A factor A big factor
Science and Engineering Faculty
6 3 3 4 5 21
13.3% 50.0% 21.4% 50.0% 62.5% 25.9%
Humanities and Social Sciences Faculty
30 1 5 3 2 41
66.7% 16.7% 35.7% 37.5% 25.0% 50.6%
Business Economics and Communication Faculty
7 1 5
0 0
13
15.6% 16.7% 35.7% 16.0%
Library Faculty 0 0
1
0 0
1
7.1% 1.2%
Other
2 1
0
1 1 5
4.4% 16.7% 12.5% 12.5% 6.2%
Total
45 6 14 8 8 81
100% 100% 100% 100% 100% 100%
Table 11H
Area of affiliation
Is too labor intensive Total
Not a factor Somewhat
a factor Neutral A factor
A big factor
Science and Engineering Faculty
10 2 6 3
0
21
24.4% 22.2% 37.5% 27.3% 26.3%
Humanities and Social Sciences Faculty
24 4 4 7 1 40
58.5% 44.4% 25.0% 63.6% 33.3% 50.0%
Business Economics and Communication Faculty
4 3 5
0
1 13
9.8% 33.3% 31.3% 33.3% 16.3%
Library Faculty 0 0
1
0 0
1
6.3% 1.3%
Other
3
0 0
1 1 5
7.3% 9.1% 33.3% 6.3%
Total
41 9 16 11 3 80
100% 100% 100% 100% 100% 100%

The Office of Institutional Research/AUC Page 31
Table 11I
Area of affiliation
Not rewarding Total
Not a factor Somewhat
a factor Neutral A factor
A big factor
Science and Engineering Faculty
16 1 2 1 0
20
26.2% 33.3% 50.0% 11.1% 25.0%
Humanities and Social Sciences Faculty
35 2 1 2 1 41
57.4% 66.7% 25.0% 22.2% 33.3% 51.3%
Business Economics and Communication Faculty
7 0 0
5 1 13
11.5% 55.6% 33.3% 16.3%
Library Faculty 1
0 0 0 0 1
1.6% 1.3%
Other 2
0 1 1 1 5
3.3% 25.0% 11.1% 33.3% 6.3%
Total 61 3 4 9 3 80
100% 100% 100% 100% 100% 100%
Table 11J
Area of affiliation
Lack of collaboration opportunities in my department
Total
Not a factor Somewhat
a factor Neutral A factor
A big factor
Science and Engineering Faculty
10 3 4 2 2 21
27.8% 27.3% 25.0% 18.2% 28.6% 25.9%
Humanities and Social Sciences Faculty
19 7 7 5 3 41
52.8% 63.6% 43.8% 45.5% 42.9% 50.6%
Business Economics and Communication Faculty
4 1 3 3 2 13
11.1% 9.1% 18.8% 27.3% 28.6% 16.0%
Library Faculty
1
0 0 0 0
1
2.8% 1.2%
Other
2
0
2 1
0
5
5.6% 12.5% 9.1% 6.2%
Total
36 11 16 11 7 81
100% 100% 100% 100% 100% 100%

The Office of Institutional Research/AUC Page 32
Table 11 K
Area of affiliation
Lack of collaboration opportunities across the School
Total
Not a factor Somewhat
a factor Neutral A factor
A big factor
Science and Engineering Faculty
9 4 6 1 1 21
23.7% 36.4% 37.5% 10.0% 20.0% 26.3%
Humanities and Social Sciences Faculty
23 5 5 5 3 41
60.5% 45.5% 31.3% 50.0% 60.0% 51.3%
Business Economics and Communication Faculty
4 2 3 2 1 12
10.5% 18.2% 18.8% 20.0% 20.0% 15.0%
Library Faculty
1
0 0 0 0
1
2.6% 1.3%
Other
1
0
2 2
0
5
2.6% 12.5% 20.0% 6.3%
Total 38 11 16 10 5 80
100% 100% 100% 100% 100% 100%
Table 11L
Area of affiliation
Inadequate budget for professional travel Total
Not a factor Somewhat
a factor Neutral A factor
A big factor
Science and Engineering Faculty
10 1 6 2 2 21
32.3% 14.3% 54.5% 10.5% 16.7% 26.3%
Humanities and Social Sciences Faculty
14 6 2 11 7 40
45.2% 85.7% 18.2% 57.9% 58.3% 50.0%
Business Economics and Communication Faculty
4 0
2 5 2 13
12.9% 18.2% 26.3% 16.7% 16.3%
Library Faculty 1
0 0 0 0 1
3.2% 1.3%
Other 2
0 1 1 1 5
6.5% 9.1% 5.3% 8.3% 6.3%
Total 31 7 11 19 12 80
100% 100% 100% 100% 100% 100%

The Office of Institutional Research/AUC Page 33
Table 11M
Area of affiliation
Lack of departmental support Total
Not a factor Somewhat
a factor Neutral A factor
A big factor
Science and Engineering Faculty
11 1 6
0
3 21
25.6% 20.0% 33.3% 30.0% 25.9%
Humanities and Social Sciences Faculty
23 4 7 3 4 41
53.5% 80.0% 38.9% 60.0% 40.0% 50.6%
Business Economics and Communication Faculty
6
0
4 1 2 13
14.0% 22.2% 20.0% 20.0% 16.0%
Library Faculty
1
0 0 0 0
1
2.3% 1.2%
Other
2
0
1 1 1 5
4.7% 5.6% 20.0% 10.0% 6.2%
Total
43 5 18 5 10 81
100% 100% 100% 100% 100% 100%
Table 11N
Area of affiliation
Lack of my Dean's support Total
Not a factor Somewhat
a factor Neutral A factor
A big factor
Science and Engineering Faculty
11 1 5 3 2 22
23.4% 25.0% 35.7% 37.5% 22.2% 26.8%
Humanities and Social Sciences Faculty
25 1 8 3 4 41
53.2% 25.0% 57.1% 37.5% 44.4% 50.0%
Business Economics and Communication Faculty
7 2 1 1 2 13
14.9% 50.0% 7.1% 12.5% 22.2% 15.9%
Library Faculty
1
0 0 0 0
1
2.1% 1.2%
Other
3
0 0
1 1 5
6.4% 12.5% 11.1% 6.1%
Total
47 4 14 8 9 82
100% 100% 100% 100% 100% 100%
The Office of Institutional Research/AUC Page 34
Table 11O
Area of affiliation
Lack of Administration support Total
Not a factor Somewhat
a factor Neutral A factor
A big factor
Science and Engineering Faculty
7 3 4 2 5 21
21.9% 50.0% 26.7% 25.0% 41.7% 28.8%
Humanities and Social Sciences Faculty
18 3 7 2 6 36
56.3% 50.0% 46.7% 25.0% 50.0% 49.3%
Business Economics and Communication Faculty
4
0
4 3
0
11
12.5% 26.7% 37.5% 15.1%
Library Faculty
1
0 0 0 0
1
3.1% 1.4%
Other
2
0 0
1 1 4
6.3% 12.5% 8.3% 5.5%
Total
32 6 15 8 12 73
100% 100% 100% 100% 100% 100%

The Office of Institutional Research/AUC Page 35
Cross tabulation question
We cross tabulated the publication history by how long the respondents have been at AUC. (Years of service have been combined as per table 12)
Table 12
How long have you been at AUC?
Frequency Percent
Less than 1year-6 49 47.1%
7-10 years 15 14.4%
11-20 11 10.6%
More than 20 years 5 4.8%
Missing 24 23.1%
Total 104 100%
Table 13A
Years of service at AUC
How many peer reviewed publications (e.g., journal articles) have you had since 2005?
Total
One Two Three Four Five Six Seven Eight Nine Ten Eleven
or more
Less than 1year-6
9 6 7 5 2 7 3 1 1
0
3 44
20.5% 13.6% 15.9% 11.4% 4.5% 15.9% 6.8% 2.3% 2.3% 6.8% 100%
7-10 years
0 0 3 2 2 1
0 1
0 1 3 13
23.1% 15.4% 15.4% 7.7% 7.7% 7.7% 23.1% 100%
11-20
1
0
1
0 0
1
0 0
1 2 3 9
11.1% 11.1% 11.1% 11.1% 22.2% 33.3% 100%
More than 20 years
1 0 0 0 0
1 0 0 0 0
1 3
33.3% 33.3% 33.3% 100%
Total
11 6 11 7 4 10 3 2 2 3 10 69
15.9% 8.7% 15.9% 10.1% 5.8% 14.5% 4.3% 2.9% 2.9% 4.3% 14.5% 100%

The Office of Institutional Research/AUC Page 36
Table 13B
Years of service at AUC
How many books have you published since 2005?
Total
One Two Three Four Eleven or more
Less than 1year-6
9 1
0
1 1 12
75.0% 8.3% 8.3% 8.3% 100%
7-10 years
3
0
1 1
0
5
60.0% 20.0% 20.0% 100%
11-20
1 1
0
1
0
3
33.3% 33.3% 33.3% 100%
Total
13 2 1 3 1 20
65.0% 10.0% 5.0% 15.0% 5.0% 100%
Table 13C
Years of service at AUC
How many edited books have you published since 2005?
Total
One Two Three Five Eleven or more
Less than 1year-6
8 3
0
2 1 14
57.1% 21.4% 14.3% 7.1% 100%
7-10 years
2
0 0 0 0
2
100% 100%
11-20
2 1 1
0 0
4
50.0% 25.0% 25.0% 100%
More than 20 years
0
1
0
1
0
2
50.0% 50.0% 100%
Total
12 5 1 3 1 22
54.5% 22.7% 4.5% 13.6% 4.5% 100%

The Office of Institutional Research/AUC Page 37
Table 13D
Years of service at AUC
How many book chapters have you published since 2005?
Total
One Two Three Four Five Six Seven Eight Nine Eleven
or more
Less than 1year-6
13 3 4 2 1
0 0 0 0
2 25
52.0% 12.0% 16.0% 8.0% 4.0% 8.0% 100%
7-10 years
4 4
0
1
0
1
0
1 1
0
12
33.3% 33.3% 8.3% 8.3% 8.3% 8.3% 100%
11-20
3
0
1
0 0 0
1
0
1
0
6
50.0% 16.7% 16.7% 16.7% 100%
More than 20 years
1
0 0 0 0 0 0
1
0 0
2
50.0% 50.0% 100%
Total
21 7 5 3 1 1 1 2 2 2 45
46.7% 15.6% 11.1% 6.7% 2.2% 2.2% 2.2% 4.4% 4.4% 4.4% 100%
Table 13E
Years of service at AUC
How many articles in conference proceedings have you had since 2005?
Total
One Two Three Four Five Six Seven Eight Nine Ten Eleven
or more
Less than 1year-6
6 2 8 5 5 2 2 1 1 6 1 39
15.4% 5.1% 20.5% 12.8% 12.8% 5.1% 5.1% 2.6% 2.6% 15.4% 2.6% 100%
7-10 years
2
0
2 3 2 1
0
1
0 0
1 12
16.7% 16.7% 25.0% 16.7% 8.3% 8.3% 8.3% 100%
11-20
2
0 0 0
1 2
0 0
1 1 1 8
25.0% 12.5% 25.0% 12.5% 12.5% 12.5% 100%
More than 20 years
0 0 0 0
1
0 0 0 0
1 1 3
33.3% 33.3% 33.3% 100%
Total
10 2 10 8 9 5 2 2 2 8 4 62
16.1% 3.2% 16.1% 12.9% 14.5% 8.1% 3.2% 3.2% 3.2% 12.9% 6.5% 100%
The Office of Institutional Research/AUC Page 38
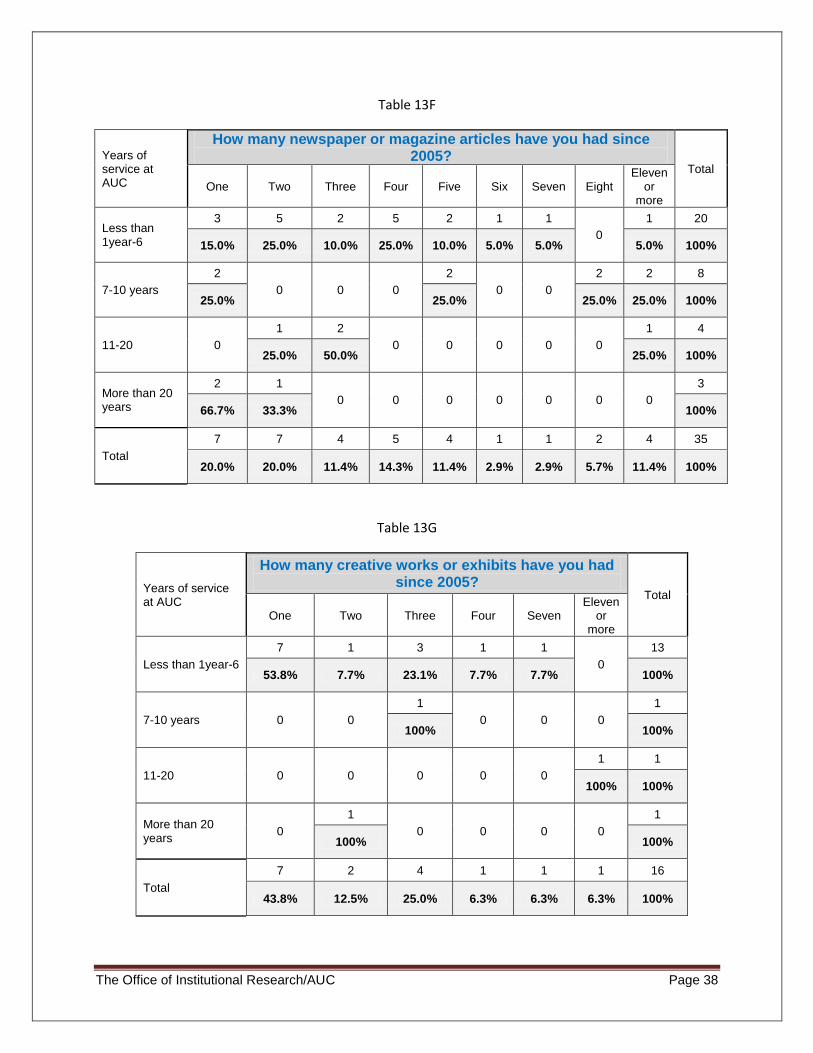
Table 13F
Years of service at AUC
How many newspaper or magazine articles have you had since 2005?
Total
One Two Three Four Five Six Seven Eight Eleven
or more
Less than 1year-6
3 5 2 5 2 1 1
0
1 20
15.0% 25.0% 10.0% 25.0% 10.0% 5.0% 5.0% 5.0% 100%
7-10 years
2
0 0 0
2
0 0
2 2 8
25.0% 25.0% 25.0% 25.0% 100%
11-20 0
1 2
0 0 0 0 0
1 4
25.0% 50.0% 25.0% 100%
More than 20 years
2 1
0 0 0 0 0 0 0
3
66.7% 33.3% 100%
Total
7 7 4 5 4 1 1 2 4 35
20.0% 20.0% 11.4% 14.3% 11.4% 2.9% 2.9% 5.7% 11.4% 100%
Table 13G
Years of service at AUC
How many creative works or exhibits have you had since 2005?
Total
One Two Three Four Seven Eleven
or more
Less than 1year-6
7 1 3 1 1
0
13
53.8% 7.7% 23.1% 7.7% 7.7% 100%
7-10 years 0 0
1
0 0 0
1
100% 100%
11-20 0 0 0 0 0
1 1
100% 100%
More than 20 years
0
1
0 0 0 0
1
100% 100%
Total
7 2 4 1 1 1 16
43.8% 12.5% 25.0% 6.3% 6.3% 6.3% 100%

The Office of Institutional Research/AUC Page 39
Table 13H
Years of service at AUC
How many patents have you had since
2005? Total
One
Less than 1year-6
6 6
100% 100%
7-10 years
1 1
100% 100%
More than 20 years
1 1
100% 100%
Total
8 8
100% 100%
Table 13I
Years of service at AUC
How many other publications (exclusive of conference proceedings and abstracts) have you had since 2005?
Total
One Two Three Four Five Six Seven Eight Nine Ten Eleven
or more
Less than 1year-6
4 3 3 4 1 1 2
0
1
0
2 21
19.0% 14.3% 14.3% 19.0% 4.8% 4.8% 9.5% 4.8% 9.5% 100%
7-10 years
1 2
0 0 0
3 1 1
0
1 1 10
10.0% 20.0% 30.0% 10.0% 10.0% 10.0% 10.0% 100%
11-20 0 0 0 0 0
1
0 0
1
0 0
2
50.0% 50.0% 100%
More than 20 years
0 0 0
2 1
0 0 0 0 0 0
3
66.7% 33.3% 100%
Total
5 5 3 6 2 5 3 1 2 1 3 36
13.9% 13.9% 8.3% 16.7% 5.6% 13.9% 8.3% 2.8% 5.6% 2.8% 8.3% 100%

The Office of Institutional Research/AUC Page 40
Table J
Years of service at AUC
How many other publications (exclusive of conference proceedings and abstracts) have you had PRIOR to 2005?
Total
One Two Three Four Five Six Seven Eight Nine Ten Eleven
or more
Less than 1year-6
2 4 2 2 1 2 1
0 0
1 5 20
10.0% 20.0% 10.0% 10.0% 5.0% 10.0% 5.0% 5.0% 25.0% 100%
7-10 years 0
1 1
0
1 1
0
1 1
0
5 11
9.1% 9.1% 9.1% 9.1% 9.1% 9.1% 45.5% 100%
11-20 0
1
0 0 0
1 1
0 0 0
3 6
16.7% 16.7% 16.7% 50.0% 100%
More than 20 years
0 0 0 0
1
0 0 0 0 0
2 3
33.3% 66.7% 100%
Total
2 6 3 2 3 4 2 1 1 1 15 40
5.0% 15.0% 7.5% 5.0% 7.5% 10.0% 5.0% 2.5% 2.5% 2.5% 37.5% 100%

The Office of Institutional Research/AUC Page 41
Section VII
Methodology: The open ended question was analyzed using the word count function in MS Word. The words that appear most frequently were aggregated and then enumerated as dominant themes. Dominant theme: More workshops/conferences
Workshops and/or material that address technology and research tools.
The mechanical workshop is the best workshop available. It is directed by a very talented and
cooperative engineer. There are only two trained technicians there. The workshop had a lot of
facilities but lacks enough workers there. Right now, only two workers are there and this is not
enough. If you could afford to purchase all the facilities there, I suggest you complete your
investment by hiring more qualified workers there as well.
More workshops on writing proposals for external grants in the humanities would be very
welcome.
I think the Conference and Research Grants have been a wonderful opportunity for me. I have
been able to attend many writers' workshops and retreats that I would not have been able to
without the funding. AUC has funded some unconventional proposals. I am really grateful. The
opportunities have enriched and stimulated my work. I was also awarded a Paid Leave to work on
my literary projects; I was able to utilize the time. It proved very fruitful.
The improvements listed in the email (""increases in Faculty Support Grants, a Provost’s Lecture
series, a full-time Associate Provost for Research Administration without non-research
responsibilities, an improved Faculty Bulletin, new Research and Scholarly Communication
(RSC) Workshops, our first-ever Ph.D. program, a streamlined Institutional Review Board (IRB),
and most recently a better-funded annual AUC Research Conference"") are all fine and good, but
seem to have more direct benefit to research related to the humanities, and do not directly
improve the environment of applied scientific research here at AUC.
We should encourage instructors to conduct research by decreasing the teaching load and by
creating research pools in workshops or research conferences.
More conference funding
Dominant theme: Grants
I think an office of sponsored projects might be useful, where there are professionals to help with
writing all kinds of grants, not just institutional grants that will be presented by AUC. I had access
to these folks at previous institutions, and my friends told me they were very helpful (I didn't
actually use them then). I asked about it last year at AUC (Office of Sponsored Programs?) when
I did my external grant application (an individual grant, which was not funded), and I was told that
they had nothing to offer me.
Increase travel and conference grants.
The streamlined IRB process is helpful, however many more improvements are still needed. AUC
needs to be eligible for NSF and other external grants, this should be a high priority for the board
of trustees.
My impression is that they are not doing much about it. At the same time the new regulations for
internal grants have - rather than encouraging research - instead made it MUCH more difficult to
get internal funding.
The committee that makes the decisions does not read the proposals properly, and does not
have the ability to make informed decisions about the various scholarly topics - hence their
decisions are very random. Some people get full funding ($6,500) for a 1.5 or 2 page proposal,
while others write very long proposals and are then told they are not detailed enough. I was told

The Office of Institutional Research/AUC Page 42
by one committee member that they did not fund my proposal because one person said that the
article that would result could not be assigned in a class they teach. This should not be the
criteria for assigning grants, (i.e. that faculty should chose topics to provide other faculty with
reading assignments). At the very least there needs to be an appeal process. The new grant
regulations have had the opposite effect of what was intended - rather than stimulating research,
they cause increased frustration and faculty to waste their time with an unnecessarily
cumbersome application process and a decreased likelihood of getting funded.
Sort out the problem with the STDF so we can apply for local funds that don't rely on establishing
collaborations with non-prestigious institutes and mediocre researchers in the Gulf.
You did not ask about grant funding prior to coming to AUC. Prior to AUC I obtained several
external grants with the excellent support of the grants office in my previous university, but after
coming to AUC I found the process more mysterious and also so many grant funders in my
specialization do not cover grants outside of the U.S.
I can't speak about AUC in general, but in the ELI, few faculty engage in research, especially
externally-funded research. In my field (EFL/language testing), there are many fewer
opportunities for external funding than there are in other fields. More importantly, however,
because faculty in the ELI are instructors, it seems there is far less support for research activities
than there is in other departments. I am supposed to start work on an externally-funded project in
the fall, but I probably won't pursue other externally- funded research opportunities after this
because it has been too much of a strain on my personal life and health trying to fit rigorous
research into a work-week that is already 60+ hours. There is much less pressure to conduct
research in the ELI, which generally translates into much less support. I love doing research, but I
am starting to question whether it is worth it when it's not valued or supported in my department.
Dominant theme: Teaching courses load
Reduce teaching and admin loads
The promised reduced teaching load will be a big help.
The teaching load is the BEGGIST obstacle for progress in research.
The extraordinarily heavy teaching load prevents any real research from being accomplished.
Negative comments
There is absolutely no transparency or consistency in awarding internal grants. There is also no
feedback given ever unless I chase it down. This is unprofessional.
I am HIGHLY INTERESTED ... I do not need anything to stimulate my interest. My only hope is
to be left alone so i can do some research. Period. I already have little in the way of personal life
(although I am a mother of 3) just coping with teaching and service. I am really disappointed by
the fact that I have not done research as I would like, as I also really enjoy doing it. Although
service is only counted as 20% of the tenure evaluation, I get the impression that it is not
acceptable to say "NO" to a committee nomination as long as you are non-tenured faculty.
My sizable external grant (~100k USD) was essentially wasted over the past year because of
bureaucratic roadblocks, inefficient purchasing procedures, lack of departmental support (e.g.
identification of qualified research assistants), etc. Until these problems are corrected, we will
never be a first rate scientific research institution. I question the legitimacy of degrees granted to
our new PhD students under these conditions."
The Office of Institutional Research/AUC Page 43
General:
To save time, energy, and red tape, schools, depts. should allocate a flat yearly fund $3000 per
year to faculty. This is common practice at major US Research Universities. The faculty member
then submits reports, and expenses receipts. It saves time, energy and is more equitable.
As I am coordinating and teaching one of the most successful courses on research Methods for
Guiding Policies with a broad multidisciplinary approach, I would like to make this course
supportive to AUC teaching Departments as it constitutes the foundation for all graduate
education in AUC
More access to US funding such as NSF and NIH"
There is some confusion about the division of td spomsibilitors between OSP and Development
office
Raise awareness of Community of Science. Strengthen ties with STDF.
"International purchasing and procurement of scientific and laboratory equipment should not be
handled under the same protocol as standard international purchasing. The current organization
of the international purchasing office is abhorrent.
I believe Professional Development leaves are important to give faculty enough time, away from
the teaching obligations, to do research and publish. I applied for one, but haven't heard from the
School yet.
Suggestions:
The improvements listed in the email (""increases in Faculty Support Grants, a Provost’s Lecture
series, a full-time Associate Provost for Research Administration without non-research
responsibilities, an improved Faculty Bulletin, new Research and Scholarly Communication
(RSC) Workshops, our first-ever Ph.D. program, a streamlined Institutional Review Board (IRB),
and most recently a better-funded annual AUC Research Conference"") are all fine and good, but
seem to have more direct benefit to research related to the humanities, and do not directly
improve the environment of applied scientific research here at AUC.
We cannot apply for NSF or NEH. This is a problem. Continuation of a simple grant application
and reporting process is appreciated. A more helpful office that searches for external funding
opportunities would be most welcome. The current situation is very disappointing, at least for my
field.
We need more PhD programs at AUC (an economics PhD will be very rewarding to our
community and to AUC
Need support and mentoring from the department. Need support from the school. Need
appropriate research assistants. Need equipment. Need course relief. I have great interest in
research, but this is a teaching institution, not a research one.
Sending the signal that research is a priority is extremely easy. Formula us reduced teaching load
across the board+ real financial incentives for excellence in research = a world class research
institution with many competitive PhD and research programs. I have no doubt that this Provost
and Associate provost are committed to this goal, just please do it sooner rather than later before
the much feared brain drain sets in. Sometimes you have to spend money to make more money.