fader, marianela; rulli, maria cristina; carr, joel; dell ... · for agribusiness, but potentially...
TRANSCRIPT
This is an electronic reprint of the original article.This reprint may differ from the original in pagination and typographic detail.
Powered by TCPDF (www.tcpdf.org)
This material is protected by copyright and other intellectual property rights, and duplication or sale of all or part of any of the repository collections is not permitted, except that material may be duplicated by you for your research use or educational purposes in electronic or print form. You must obtain permission for any other use. Electronic or print copies may not be offered, whether for sale or otherwise to anyone who is not an authorised user.
Fader, Marianela; Rulli, Maria Cristina; Carr, Joel; Dell'Angelo, Jampel; D'Odorico, Paolo;Gephart, Jessica A.; Kummu, Matti; Magliocca, Nicholas; Porkka, Miina; Prell, Christina;Puma, Michael J.; Ratajczak, Zak; Aseekell, David; Suweis, Samir; Tavoni, AlessandroPast and present biophysical redundancy of countries as a buffer to changes in foodsupply
Published in:ENVIRONMENTAL RESEARCH LETTERS
DOI:10.1088/1748-9326/11/5/055008
Published: 17/05/2016
Document VersionPublisher's PDF, also known as Version of record
Please cite the original version:Fader, M., Rulli, M. C., Carr, J., Dell'Angelo, J., D'Odorico, P., Gephart, J. A., ... Tavoni, A. (2016). Past andpresent biophysical redundancy of countries as a buffer to changes in food supply. ENVIRONMENTALRESEARCH LETTERS, 11(5), [055008]. DOI: 10.1088/1748-9326/11/5/055008

Environ. Res. Lett. 11 (2016) 055008 doi:10.1088/1748-9326/11/5/055008
PAPER
Past and present biophysical redundancy of countries as a buffer tochanges in food supply
Marianela Fader1,Maria Cristina Rulli2, Joel Carr3, JampelDell’Angelo4, PaoloD’Odorico3,JessicaAGephart3,Matti Kummu5, NicholasMagliocca4,Miina Porkka5, Christina Prell6,Michael J Puma7,ZakRatajczak3, DavidA Seekell8, Samir Suweis9 andAlessandroTavoni10
1 InstitutMéditerranéen de Biodiversité et d’Ecologiemarine et continentale, Aix-Marseille Université, CNRS, IRD,Université Avignon,Europole de l’Arbois-BP 80, Bâtiment Villemin, F-13545Aix-en-Provence cedex 04, France
2 Politecnico diMilano.Department of Civil and Environmental Engineering, Piazza Leonardo daVinci, 32, I-20133Milano, Italy3 Department of Environmental Sciences, University of Virginia, Charlottesville, VA 22904-4123, USA4 National Socio-Environmental Synthesis Center, University ofMaryland, 1 Park Place, Annapolis,MD,USA5 Water &Development ResearchGroup, AaltoUniversity, Aalto, Finland6 Department of Sociology, University ofMaryland, College Park,MD,USA7 Center for Climate SystemsResearch, ColumbiaUniversity and theNASAGoddard Institute for Space Studies, NewYork,NY,USA8 Department of Ecology and Environmental Science, UmeåUniversity, Umeå, Sweden9 Department of Physics andAstronomy,University of Padova, National Consortium for the Physical Sciences ofMatter and theNational
Institute ofNuclear Physics, I-35131 Padova, Italy10 GranthamResearch Institute, London School of Economics, LondonWC2A 2AZ,UK
E-mail:[email protected]
Keywords: redundancy, water, spare land, yield gap, productivity, resilience
Supplementarymaterial for this article is available online
AbstractSpatially diverse trends in population growth, climate change, industrialization, urbanization andeconomic development are expected to change future food supply and demand. These changesmayaffect the suitability of land for food production, implying elevated risks especially for resource-constrained, food-importing countries.We present the evolution of biophysical redundancy foragricultural production at country level, from1992 to 2012. Biophysical redundancy, defined asunused biotic and abiotic environmental resources, is represented by the potential food production of‘spare land’, availablewater resources (i.e., not already used for human activities), as well as productionincreases through yield gap closure on cultivated areas and potential agricultural areas. In 2012, thebiophysical redundancy of 75 (48) countries,mainly inNorthAfrica,Western Europe, theMiddle EastandAsia, was insufficient to produce the caloric nutritional needs for at least 50% (25%) of theirpopulation during a year. Biophysical redundancy has decreased in the last two decades in 102 out of155 countries, 11 of thesewent fromhigh to limited redundancy, and nine of these from limited tovery low redundancy. Although the variability of the drivers of change across different countries ishigh, improvements in yield and population growth have a clear impact on the decreases ofredundancy towards the very low redundancy category.We took amore detailed look at countriesclassified as ‘Low Income Economies (LIEs)’ since they are particularly vulnerable to domestic orexternal food supply changes, due to their limited capacity to offset for food supply decreases withhigher purchasing power on the internationalmarket. Currently, nine LIEs have limited or very lowbiophysical redundancy.Many of these showed a decrease in redundancy over the last two decades,which is not always linkedwith improvements in per capita food availability.
1. Introduction
Spatially diverse trends in population growth, climatechange, industrialization, urbanization and economic
development are expected to change future agricul-tural practices, as well as food supply and demand.This will also have an effect on the international flowsof agricultural products, opening new opportunities
OPEN ACCESS
RECEIVED
5December 2015
REVISED
18March 2016
ACCEPTED FOR PUBLICATION
18April 2016
PUBLISHED
17May 2016
Original content from thisworkmay be used underthe terms of the CreativeCommonsAttribution 3.0licence.
Any further distribution ofthis workmustmaintainattribution to theauthor(s) and the title ofthework, journal citationandDOI.
© 2016 IOPPublishing Ltd

for agribusiness, but potentially implying risks forresource-constrained, food-importing countries(Fader et al 2013, D’Odorico and Rulli 2013, Rulli andD’Odorico 2014). In this dynamic context, it isimportant to understand to what degree countries areresilient to long-term changes in food supply, whetherthey originated domestically or through changes ininternational trade, stocks, and prices. Resilience inthis case can be defined as the capacity of a system toabsorb shocks or changes without losing its essentialcharacteristics (Weichselgartner and Kelman 2015).Hence, from the perspective of national food security,resilience is the capacity to adapt to changing condi-tions to maintain adequate food supply. Changes infood supply, as mentioned above, might originatedomestically, for example by reduction in domesticproduction due to climate trends, large-scale pollutionevents, soil degradation, etc. Alternatively, they can beconnected to changes in the international market ofagricultural goods, for example due to export bans inlarge exporters, long-term changes in commodityprices, and new preferences of trade partners (JonesandHiller 2015).
Inmany systems where system reliability is impor-tant, redundancy of components or resources is con-sidered a key element of resilience. In ecology, stabilityand productivity of ecosystems is linked to diversity, asit provides redundancy in ecological functions(Walker 1992), an effect often termed the ‘insurancehypothesis’ (Naem and Li 1997). In this study we focuson stand-by redundancy, which refers to the casewhen extra components are idle and will be taken intothe process if the principal component fails. For exam-ple, in hospitals, power generators are normally instal-led and kept in stand-by in addition to the normalpower source (Horwitz 2000). Hence, in the case offood supply, we might consider which redundanciesexist in the critical resources for food production, andhow these redundancies confer resilience.
Focusing only on the biophysics of food produc-tion, the critical resources are the availability ofunused water and fertile land as well as the possibilityof increasing agricultural productivity (i.e. increasingthe rate of outputs per unit of input). This studyaddresses the evolution of national and global biophy-sical redundancy by analysing how many additionalcalories countries could have produced with theirunused water, land and unexploited productivitypotentials from 1992 to 2012. This period is the long-est continuous time for which data exists with con-sistent political units (after the last decolonizationprocesses and the Perestroika) and consistent datareporting methodology (the FAO applied new meth-odologies concerning missing data from 1990onwards). We assume here that countries with largeyield gaps and substantial amounts of renewable waterresources and unused fertile land have higher redun-dancy and, thus, are biophysically more resilient tolong-term changes. Note that we focus on national
biophysical redundancy, i.e. the biotic and abioticenvironmental conditions for potential crop develop-ment. Hence, socio-economic factors affecting foodsecurity and depending on biophysical conditions ofother countries, most notably food availabilitythrough imports, are not taken into account.
Many authors have analyzed subcomponents ofbiophysical redundancy as defined in this study. In areview of different methodologies, Lobell et al (2009)found that the difference between potential and actualyields averaged 20% for irrigated agriculture and 50%for rainfed agriculture. A very recent estimate showseven higher numbers with 24% for irrigated land and80% for rainfed agriculture (Pradhan et al 2015). Andeven after eliminating fertilizer overuse, yield increasesof 30% seem to be realistic for some major cereals(Mueller et al 2011).
Eitelberg et al (2015) offer a detailed review andcomparison of different estimates of spare land, show-ing a wide range of 2–3580Mha. Differences are duenot only to varying consideration of biophysical fac-tors but also in the various criteria of what type of landshould be excluded from agricultural use (Eitelberget al 2015). This is an important point for sustain-ability, since there is vast evidence about the negativeconsequences arising from conversion of natural eco-systems to agricultural land, including greenhouse gasemissions, biodiversity loss, alteration of the watercycle, and increased erosion (Laurance et al 2014).Assessments of spare land normally lack estimatesabout the potential food production of those areas,with the global agro-ecological zones (GAEZ)approach presenting a prominent exception. Thisapproach quantifies land suitability for different cropsand various levels of inputs coming to a global landsuitability of about 3457Mha, for mixed inputs underrainfed and/or irrigation conditions (very suitable,suitable and moderately suitable land, Fischeret al 2002).
Assessments on water availability have madeimportant advances in recent years, pointing to declin-ing groundwater tables (Wada et al 2010) and recog-nizing the predominant role of green water in foodproduction and water scarcity mitigation (Rockströmet al 2009a, Fader et al 2011). For example, 83% ofhumanity’s water consumption comes from greenwater use (Fader et al 2011). Other important pointsrecognized in recent years were the necessity of con-sidering water for environmental flow requirements(Gerten et al 2013) and the strong influence of damconstruction and water withdrawal on the water cycle,especially in some parts of Asia and the United States(Haddeland et al 2014). Very few assessments haveintegrated water, land and productivity potentials.Foley et al (2011) assessed solutions for increasing foodproduction and came to the conclusion that closingyield gaps, increasing water and land use efficiency,shifting diets and reducing waste could double foodproduction. However, they did not detail the
2
Environ. Res. Lett. 11 (2016) 055008 MFader et al

redundancy of biophysical resources connected tothese solutions. Steffen et al (2015) defines boundariesfor freshwater use and land-system change, indicatingthat humans have used tropical forests in Asia andAfrica as well as freshwater in some regions of theMediterranean, North America and the Middle Eastbeyond their safe thresholds. They did not considerany potential productivity increases. Fader et al (2013)integrates water and land availabilities with model-based potentials for productivity increases to point outthat some countries will need to increase imports tosupport their future population. However their studyfocused on future scenarios and did not include thepast evolution of the resource availabilities and pro-ductivity increases.
The present study contributes to this researchagenda, filling some of the identified gaps by pursuingthe following objectives:
(1)Quantifying the potential food production ofavailable land and water resources for each countryfrom 1992 to 2012. While doing so, we assess theinfluence of conservation measures (maintenanceof environmental flow requirements and protec-tion of pristine natural areas), the potential waterconstrains due to high precipitation variability, andthe sensitivity of the land availability quantifica-tions connected to the consideration or disregardofmanaged grasslands.
(2)Quantifying the changes in national yield gapclosure during the last two decades and computingthe potential additional food production from itsclosure.
(3)Assessing the uncertainty of the potential produc-tion of unused areas using different productivityassumptions.
(4)Demonstrating the resulting biophysical redun-dancy (i.e. the interplay of water, land and produc-tivity redundancy) for each country over the lasttwo decades.
2.Methods
In order to assess the potential food production withunused (i.e. available or redundant) resources andthrough yield gap closure, we assessed six waterredundancy scenarios, six land redundancy scenarios,and four yield gap closure scenarios that we call here‘productivity redundancy scenarios’. Analysing differ-ent scenarios is necessary for two reasons. First, it isunclear what the real availability of water and landresources was and is, and what part of it should beconsidered as ‘available’, ‘unused’ or ‘accessible toagriculture’. Second, it is uncertain how productivethose resources would be if they were used foragriculture. In the sections 2.1–2.3 we will shortlyexplain the different land, water and productivity
scenarios, the details of which can be found in thesections A.1.1–A.1.4 and tables A.1–A.3 of the SI.
The potential food production from the water,land and productivity scenarios was then divided bypopulation and normalized by the standard caloricnutritional needs per person (see section 2.4). Differ-ent land, water and productivity redundancy scenarioswere combined to yield three scenarios of biophysicalredundancy (see section 2.5).
2.1. Production potential with availablewaterresourcesThe potential agricultural production with availablerenewable water resources (WA) was calculated at thenational level using six combinations of water avail-ability, water productivity and water reserves forenvironmental flow requirements (table A.1, equation(A.1)). Using the AQUASTAT database (FAO 2015b),we subtracted the total water withdrawal as sum ofmunicipal, agricultural and industrial withdrawal—(TWW) from the total actual renewable waterresources of each country (TARWR). TARWRincludes internal and external (coming from othercountries) surface and groundwater resources. Insome scenarios we additionally subtracted the amountof water reserved for environmental requirements(EFR) and the water that is difficult to access due tohigh variability of precipitations (S). EFR was repre-sented as either 36% or 57% (Gerten et al 2013) ofTARWR. For S we calculated two scenarios, the firstone assuming that the variability of precipitation,including concentration of rainfall in one season, hasno influence for water accessibility. Thus, wateravailability was not reduced in this scenario. In thesecond one, this term has values of 10%, 20% or 30%of (TARWR–TWW) depending on the average seaso-nal precipitation variability of the country. Thismeansthat in this scenario we assume that, in regions withhighly variable precipitation, water is more difficult tostore, manage and access, and water availability isaccordingly reduced by 10%, 20% or 30% dependingon the coefficient of variation (see section A.1.1 of theSI formore details).
The resulting water availability (in m3) was thenmultiplied by the area-weighted (rainfed and irrigated)water productivity (WP in kcal m−3) in the country foreach year as simulated by the agro-ecosystem modelLPJmL (Bondeau et al 2007, Rost et al 2008, Faderet al 2010, 2015, Schaphoff et al 2013,Waha et al 2013)for the main groups of crops worldwide. This yieldsthe potential caloric production with available waterresources. In order to account for the possibility thatWP of unused areas is lower than in cultivated areas,we also calculated an alternative scenarios assumingthat WP is 30% lower (see section A.1.1 of the SI formore details).
3
Environ. Res. Lett. 11 (2016) 055008 MFader et al

2.2. Production potential of available land resourcesThe potential agricultural production of fertile, spareland (LA) was calculated at national level using sixcombinations of land available and agricultural pro-ductivity associated with it (table A.2, equation (A.2)).From the total area of the country (TA) we subtractedunsuitable land (NS) and land estimated for settle-ments and infrastructure (NAG). TA, NS and NAGwere extracted from the GAEZ (Fischer et al 2002).The result represents the extent of very suitable,suitable, moderately suitable and marginally suitableland, taking into account climate, soil, elevation andterrain constraints. We then subtracted the agricul-tural area (LU) from HYDE 3.2 (Klein Goldewijk,personal communication, 2015). We calculated twoscenarios, one with LU including only cropland (i.e.not comprisingmanaged grasslands), and onewith LUincluding cropland andmanaged grasslands (see moredetails in sectionA.1.2 of the SI).
In some scenarios we additionally exclude pro-tected areas (IUCN classes I and II, from UNEP-WCMC (United Nations Environment Program-World Conservation Monitoring Centre) 2007) andareas worthy of protection (the union of Greenpeace’sIntact forest landscapes and WRI’s frontier forest, seeGreenpeace International 2005, and Bryant et al 1997).
The resulting land availability (in ha) was multi-plied by the average yield of the country (Y in t ha−1)reported by FAOSTAT (2015). This yields the poten-tial caloric production with available water resources.In order to account for the possibility that actual yieldsare lower on unused areas, we also calculated an alter-native scenarios assuming that Y is 30% lower (seemore details in sectionA.1.2 of the SI).
2.3. Yield gap closure onused and spare landPotential calorie production due to productivityincreases on cultivated areas (YG) was calculated bythe difference between potential and actual yields,divided by the number of crops grown in a country,and multiplied by the harvested area (see equation(A.3) and sectionA.1.3).
Potential productivity increases on unused areas(YG_E) were calculated by multiplying spare land (seesection 2.2) by the difference between potential andactual yields (sectionA.1.4 and equation (A.4)).
Actual yields and harvested area were taken fromFAOSTAT (2015), potential yields from Mueller et al(2011). Mueller et al (2011) estimated potential yieldsby using data from other regions with similar pre-cipitation and growing degree day characteristics (i.e.comparable climatic conditions). In some scenarioswe assumed potential yields to be as high as on usedareas (and thus equal to the values in Muelleret al 2011). In other scenarios we assumed them todecrease as a function of actual yields, i.e. potentialyields are lowered by 30% of actual yields. Theassumption in the latter case is that countries with
high actual yields are already using the most produc-tive areas, while countries with low actual yields mighthave high productive areas as part of their spare land(see table A.3 for more details on the yield gapscenarios).
2.4. Scaling and classificationThe resulting potential food production from theformer sections was divided by population numbersfrom FAO (2015a). The results were then divided bythe amount of food production need per capita for oneyear (3000 kcal cap−1 d−1 including food waste; seeRockström et al 2009a, Kummu et al 2012, FAO2012).
To summarize our data, we use the following clas-sification: countries that have redundant resources forproducing the caloric nutritional needs for at least50%of its population for one full year were consideredto have high water, land or productivity redundancy (seetable 1). Countries with values between 25% and 50%were considered to have limited water, land or pro-ductivity redundancy. And countries that have redun-dant resources for producing the caloric nutritionalneeds for less than 25% of its population have very lowwater, land or productivity redundancy. Note that thisrefers to potential calories production in addition tocurrent production.
2.5. Biophysical redundancyWe quantified the overall biophysical redundancy inthree scenarios (Rlow, Rmiddle, Rhigh) that combinedifferent scenarios of the scaled values of LA, WA, YGandYG_E (see tables 1 and 2).
All three scenarios follow the calculation schemeof equation (1):
( ) ( )=+ +
RnInd
min LA, WA YG YG_E, 1x
where nInd is the number of terms in the nominator ofthe equation for which there is data in the differentdatasets and scenarios used. For countries with a fullset of data nInd is equal to 3.
The minimum values of LA and WA were takenunder the assumption that water and land are
Table 1. Scaling and classification of water, land and yield gapresults.
Redundancy to
produce calories for
K%of population Scaled values
Label for land, water,
productivity and bio-
physical redundancy
<0* 0.001 Very low redundancy
0–25 0.002–0.25 Very low redundancy
25–50 0.25–0.5 Limited redundancy
50–100 0.5–1.0 High redundancy
>100 1.0 High redundancy
* Values can be lower than zero when countries exploit marginal
land, use areas worth of protection or water needed by aquatic
ecosystems in the sustainable scenarios, have higher yields than the
potential yields or exploit fossil groundwater aquifers.
4
Environ. Res. Lett. 11 (2016) 055008 MFader et al

Table 2.Characteristics of biophysical redundancy scenarios. PYM=Potential yields as inMueller et al (2011).
Biophysical
redundancy
scenario
Reserves for environ-
mental flow require-
ments (%ofRWR
subtracted)
Water productivity
on unused areas (%of productivity on
used areas)
Inaccessibility of water
due to precipitation
seasonality (%ofRWR
subtracted)
Protected areas and
areas worth of pro-
tection banned for
agriculture?
Managed
grasslands
included in
spare land?
Potential
yields on
used areas
Actual yield
on unused
areas (%of
actual yield on
used areas)
Potential
yield on
unused areas
Combination of scenarios (see tableA.1–A.3 of the SI)
Rlow 57 70 10–30 Yes No PYM 100 PYM Land: SUS_NORM_GR
Water: SUS43_LOW_CV
Yield gap on used areas:NORM
Yield gap on unused areas:
SUS_NORM
Rmiddle 36 70 10–30 Yes Yes PYM 70 PYMminus
30%of
actual
yields
Land: SUS_LOW_NGR
Water: SUS64_LOW_CV
Yield gap on used areas:NORM
Yield gap on unused areas:
SUS_LOW
Rhigh 0 100 0 No Yes PYM 100 PYM Land:NOTSUS_NORM_NGR
Water: NOTSUS_NORM_NOCV
Yield gap on used areas:
NOTSUS_NORM
Yield gap on unused areas:
NOTSUS
5
Environ.R
es.Lett.11(2016)055008
MFader
etal

complementary factors, i.e. the lack of one of themwould render the presence of the other one useless interms of potential food production.
The Rlow scenario is designed to represent veryconstrained redundancy for all countries: managedgrasslands are considered as used and thus not avail-able, protected areas and areas worth of protection areassumed to be not available for agricultural produc-tion. Moreover, precipitation and seasonality of pre-cipitation are assumed to reduce accessibility of waterresources by 10%–30% (depending on the variationcoefficient of precipitation) and environmental flowrequirements are assumed to be high andmet by everycountry. Additionally, water productivity on unusedareas is assumed to be lower than on used areas (seetable 2).
On the other end, the Rhigh scenario is meant torepresent the least constrained redundancy: managedgrasslands are considered available, protected areasand areas worth of protection are assumed to be avail-able for production, potential yields of unused areasare considered to be as high as in used areas, precipita-tion and seasonality of precipitation are assumed notto affect the accessibility of water resources, water pro-ductivity on unused areas is assumed to be as high ason used areas, and no water is reserved for environ-mentalflow requirements.
Finally, Rmiddle represents a scenario in the middleof the range: managed grasslands are considered avail-able, protected areas and areas worthy of protectionare assumed to be unavailable for agricultural produc-tion, spare areas are considered to be 30% less produc-tive than used areas, potential yields are assumed to belower on unused areas than on used areas, precipita-tion and seasonality of precipitation are assumed toreduce accessibility of water resources by 10%–30%(depending on the variation coefficient of precipita-tion), environmental flow requirements are assumedto be lower than in Rlow but they are assumed tobemet.
Results shown in the next sections correspond tothe Rmiddle scenario, with a discussion on the differ-ences betweenRlow,Rmiddle andRhigh in section 3.4.
3. Results
3.1. Current interplay ofwater, land andproductivity redundancyFigure 1 shows water, land and productivity redun-dancies, and the combined biophysical redundancyfor the year 2012. Overall redundancy changes acrossdifferent geographical areas affected by the differentspecific characteristics. In Asia redundancy rangesfrom limited to very low (figure 1(e)), with verylow productivity redundancy being a major factor inSouth East Asia. In the Middle East very low waterredundancy has a strong impact instead. Europe is
particularly affected by limited productivity redun-dancy. Some American countries have very lowbiophysical redundancy due to both very low produc-tivity and land redundancy. The African and SouthAmerican tropics havemostly high overall redundancydue to high land, water and productivity redundancyon spare land. This is notable since in the mediumscenario (Rmiddle) protected areas and areas worth ofprotection are considered unavailable for foodproduction.
Overall there are 75 (48) countries that could notfeed at least 50% (25%) of their population during ayear with redundant resources (figure 1(e)). Those 75countries are home to 4.8 billion people or around70%of theworld population.
3.2. Changes from1992 to 2012Biophysical redundancy has decreased over the lasttwo decades in most countries (figure 2). Most of theexceptions to this pattern are former Soviet Unioncountries, where large agricultural areas were aban-doned after the end of theColdWar.
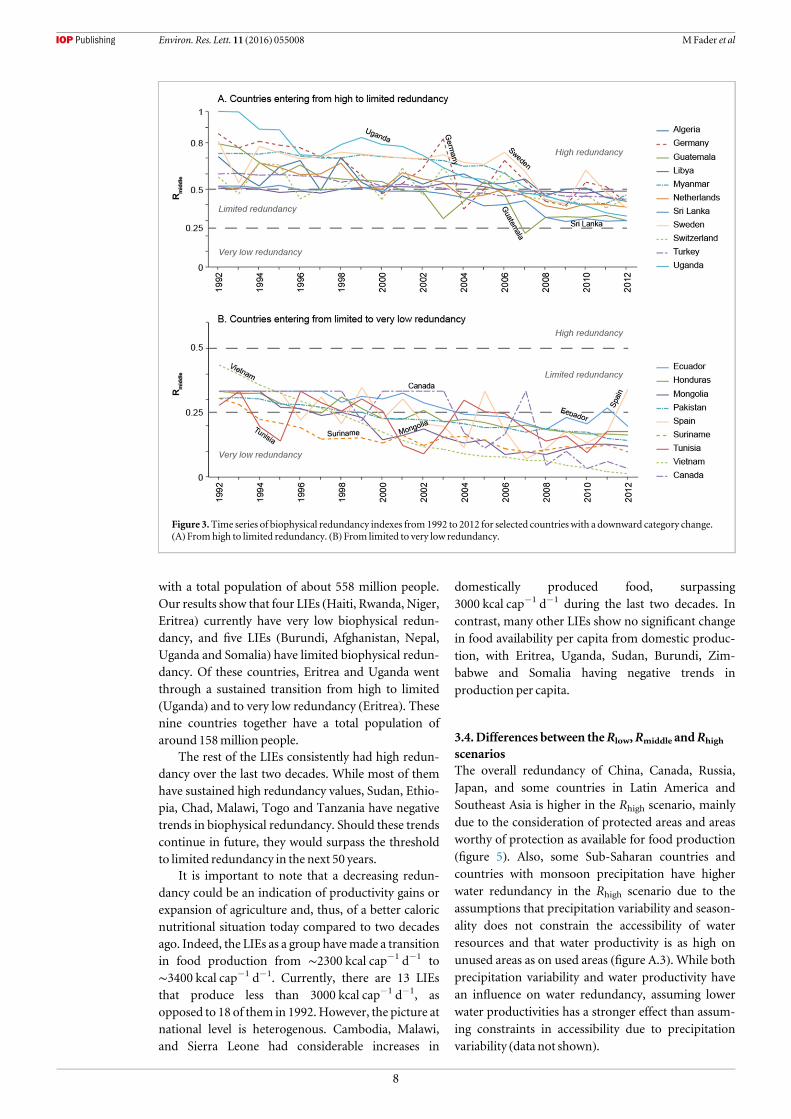
Not all decreases in biophysical redundancy arelinked with category changes, i.e. changes in theredundancy classes. Figure 3 shows only countrieswith time series that have sustained negative trends inbiophysical redundancy and underwent categorychanges.While eleven countries,many of them in Eur-ope, have made a transition from high to limited bio-physical redundancy (figure 3(A)), nine othercountries, most in Asia and South America, went fromlimited to very low biophysical redundancy(figure 3(B)).
These changes are caused by the change in the dri-vers that affect the subcomponents of redundancy (seeequation (A.1)–(A.4)). The role of yield improvementis especially complicated because it diminishes theyield gap, and thus, the productivity redundancy. Atthe same time, it increases the potential production offood on spare land, which is also true for an improve-ment in water productivities. Figure 4 offers a moredetailed look into the drivers of redundancy changefor some selected countries with changes in categoriestowards very low redundancy. In all cases populationgrowth was an important factor. Additionally, Viet-nam, Ecuador, Mongolia and Honduras have adecrease in redundancy due to improvements in yieldsthat caused a smaller productivity redundancy on usedareas. This is combined with a complete depletion ofspare land, and thus, no increase in the productivityredundancy on available areas (compare also figure 1).In Pakistan, depletion of water resources also con-tributes to the trend. Canada, despite a less significantimprovement in yields, shows a positive trend in thelast decade that is combined with high variability ofland use.
6
Environ. Res. Lett. 11 (2016) 055008 MFader et al

3.3. Low income economies (LIEs)LIEs present an interesting case to examine becausethey have very limited financial resources to react toexternal or internal disruptions of food supply, due totheir very low capacity to pay a higher price foragricultural commodities in the world market. Thus,
redundant resources might be their only option forcounteracting a disruption in food supply.
The World Bank designates a country as a LIE if ithad a Gross National Income per capita of $1045 orless in 2014 (World Bank 2015). Currently, 28 coun-tries of the world, mainly situated in Africa, are LIEs,
Figure 1.Maps of subcomponents of biophysical redundancy and index of biophysical redundancy for the year 2012. (a)Landredundancy (LA), (b)water redundancy (WA), (c) productivity redundancy on used land (YG), (d) productivity redundancy onavailable land (YG_E), (e) index of biophysical redundancy for theRmiddle scenario.
Figure 2.Classification of countries according to the change of biophysical redundancy since 1992. Changes were calculatedcomparing the average redundancy from1992 to 2001with the average redundancy from 2002 to 2012.
7
Environ. Res. Lett. 11 (2016) 055008 MFader et al
with a total population of about 558 million people.Our results show that four LIEs (Haiti, Rwanda, Niger,Eritrea) currently have very low biophysical redun-dancy, and five LIEs (Burundi, Afghanistan, Nepal,Uganda and Somalia) have limited biophysical redun-dancy. Of these countries, Eritrea and Uganda wentthrough a sustained transition from high to limited(Uganda) and to very low redundancy (Eritrea). Thesenine countries together have a total population ofaround 158million people.
The rest of the LIEs consistently had high redun-dancy over the last two decades. While most of themhave sustained high redundancy values, Sudan, Ethio-pia, Chad, Malawi, Togo and Tanzania have negativetrends in biophysical redundancy. Should these trendscontinue in future, they would surpass the thresholdto limited redundancy in the next 50 years.
It is important to note that a decreasing redun-dancy could be an indication of productivity gains orexpansion of agriculture and, thus, of a better caloricnutritional situation today compared to two decadesago. Indeed, the LIEs as a group havemade a transitionin food production from ∼2300 kcal cap−1 d−1 to∼3400 kcal cap−1 d−1. Currently, there are 13 LIEsthat produce less than 3000 kcal cap−1 d−1, asopposed to 18 of them in 1992.However, the picture atnational level is heterogenous. Cambodia, Malawi,and Sierra Leone had considerable increases in
domestically produced food, surpassing3000 kcal cap−1 d−1 during the last two decades. Incontrast, many other LIEs show no significant changein food availability per capita from domestic produc-tion, with Eritrea, Uganda, Sudan, Burundi, Zim-babwe and Somalia having negative trends inproduction per capita.
3.4.Differences between theRlow,Rmiddle andRhigh
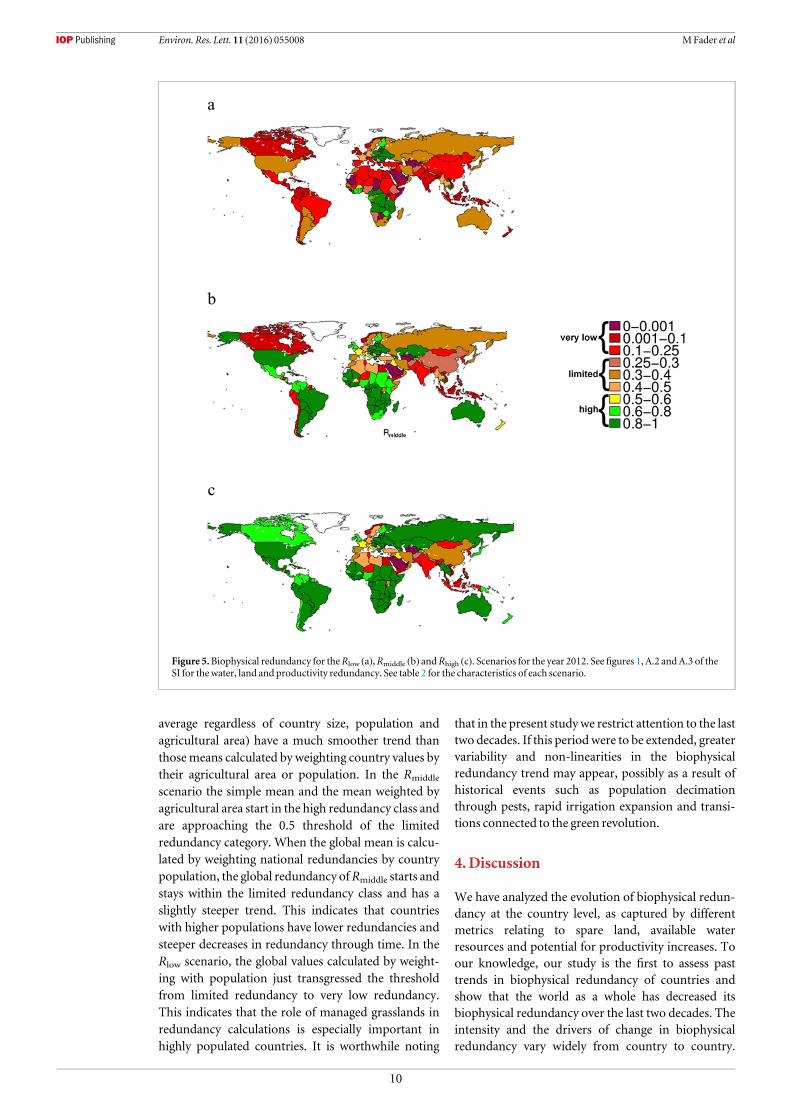
scenariosThe overall redundancy of China, Canada, Russia,Japan, and some countries in Latin America andSoutheast Asia is higher in the Rhigh scenario, mainlydue to the consideration of protected areas and areasworthy of protection as available for food production(figure 5). Also, some Sub-Saharan countries andcountries with monsoon precipitation have higherwater redundancy in the Rhigh scenario due to theassumptions that precipitation variability and season-ality does not constrain the accessibility of waterresources and that water productivity is as high onunused areas as on used areas (figure A.3). While bothprecipitation variability and water productivity havean influence on water redundancy, assuming lowerwater productivities has a stronger effect than assum-ing constraints in accessibility due to precipitationvariability (data not shown).
Figure 3.Time series of biophysical redundancy indexes from 1992 to 2012 for selected countries with a downward category change.(A) Fromhigh to limited redundancy. (B) From limited to very low redundancy.
8
Environ. Res. Lett. 11 (2016) 055008 MFader et al

Not considering managed grasslands as redundantresources (Rlow) has by far the largest influence onoverall biophysical redundancy. It decreases the bio-physical redundancy of Australia and most Americancountries to the limited redundancy level, and it drivesNorthern African, Asian, and European countries tovery low redundancy levels (figure 5).
Comparing the water redundancy from the Rlow
and the Rmiddle scenario highlights the influence ofassuming high instead of middle high environmentalflow requirements (36%–57%) in addition to pre-cipitation variability. This pushes countries of Easternand Southern Africa as well as Niger and Nigeria tolower redundancy categories (figures 1 andA.3).
There are almost no differences in LIEs when com-paring the Rmidlle and Rhigh scenarios. Only Somaliashows a significant change, having high redundancyin the Rhigh scenario and limited redundancy inthe Rmiddle scenario. However, there are substantial
differences when comparing the Rmiddle and Rlow sce-narios: from nine countries in the limited and very lowredundancy categories in the Rmiddle scenario, to 17countries in the Rlow scenario. These 17 countries arehome to around 380 million people. This result indi-cates that the consideration or not of managed grass-lands as redundant resources is very important in poorcountries.
The percentage of world population living in 2012in countries with very low and limited redundancydiminishes from 70% to 60% when going from theRmiddle to the Rhigh scenario. However, moving to theRlow scenario increases the total to 92%, with 70% ofthe world population in countries with very lowredundancy (35% inRmiddle).
The world as a whole shows a decreasing trend inbiophysical redundancy in the last two decades, withconsiderable differences among the Rlow, Rmiddle andRhigh scenarios (figure 6). Simple global means (i.e.
Figure 4.Times series of drivers of change in redundancy for selected countries. TARWR= total actual renewable water resources.TWW=total water withdrawal. Agricultural area refers to cultivated area. Valueswere normalized by( ( )) ( ( ) ( ))- -x x x xmin max mini / .
9
Environ. Res. Lett. 11 (2016) 055008 MFader et al
average regardless of country size, population andagricultural area) have a much smoother trend thanthosemeans calculated by weighting country values bytheir agricultural area or population. In the Rmiddle
scenario the simple mean and the mean weighted byagricultural area start in the high redundancy class andare approaching the 0.5 threshold of the limitedredundancy category. When the global mean is calcu-lated by weighting national redundancies by countrypopulation, the global redundancy ofRmiddle starts andstays within the limited redundancy class and has aslightly steeper trend. This indicates that countrieswith higher populations have lower redundancies andsteeper decreases in redundancy through time. In theRlow scenario, the global values calculated by weight-ing with population just transgressed the thresholdfrom limited redundancy to very low redundancy.This indicates that the role of managed grasslands inredundancy calculations is especially important inhighly populated countries. It is worthwhile noting
that in the present studywe restrict attention to the lasttwo decades. If this period were to be extended, greatervariability and non-linearities in the biophysicalredundancy trend may appear, possibly as a result ofhistorical events such as population decimationthrough pests, rapid irrigation expansion and transi-tions connected to the green revolution.
4.Discussion
We have analyzed the evolution of biophysical redun-dancy at the country level, as captured by differentmetrics relating to spare land, available waterresources and potential for productivity increases. Toour knowledge, our study is the first to assess pasttrends in biophysical redundancy of countries andshow that the world as a whole has decreased itsbiophysical redundancy over the last two decades. Theintensity and the drivers of change in biophysicalredundancy vary widely from country to country.
Figure 5.Biophysical redundancy for theRlow (a),Rmiddle (b) andRhigh (c). Scenarios for the year 2012. See figures 1, A.2 andA.3 of theSI for thewater, land and productivity redundancy. See table 2 for the characteristics of each scenario.
10
Environ. Res. Lett. 11 (2016) 055008 MFader et al

However, population growth appears to be connectedto decreasing biophysical redundancy in a number ofcountries. Detailed monitoring and reporting oftechnological, economic and infrastructural develop-ments would help to build up the databases needed tobetter understand the drivers of change in biophysicalredundancy. Since economic development has beenshown to be statistically connected with per capitafood demand (Tilman et al 2011), obtaining specificdetails about the characteristics, causes, technologicaladvances and sectoral patterns of economic develop-ment may contribute to better predict the dynamics ofthe components of biophysical redundancy.
Currently, there are 75 countries that could notfeed at least 50%of their population during a year withredundant resources within their borders (Rmiddle).And there are 48 countries that could not feed at least25% of their population during a year with redundantresources. These are mainly situated in North Africa,Western Europe, the Middle East and Asia. Thesecountries are vulnerable to long-term food supplychanges and they thus need to develop other means,such as strong national economies, to adapt to possiblelong-term food shortage.
4.1. Robustness andflexibility of the approachOur results are in line with former studies. Namely,our calculations suggest closing the yield gap on usedareas could increase production by 4.32+E15 kcal in
2011, an estimate very close to the 5+E15 kcal fromFoley et al (2011).
Our estimates of spare land are 2476Mha,1492Mha, and 303Mha for the Rhigh, Rmiddle and Rlow
scenario, respectively. The latter two are in very goodagreement with the medium (1376Mha) and low(317Mha) estimates of Eitelberg et al (2015). How-ever, they have higher values for the high estimate(3783Mha), possibly because they included barrenand sparsely vegetated land. Potential food productionwas not calculated in that study and, thus, cannot becomparedwith our estimates.
Our calculation of available water resources is51 096 km3 (Rhigh), 26 655 km3 (Rmiddle) and17 909 km3 (Rlow). The high estimate is in good agree-ment with LPJmL simulations of water availability(48 292 km3, Fader et al 2013) and the value55 375 km3 from Gleick (2000). The lower estimateagrees verywell with the value ofGerten et al (2013) for‘accessible blue water resources’: 16 300 km3 and isnot far away from 12 500 km3, the estimate byRockström et al (2009b).
Our results are the outcome of a flexible metho-dology that can be applied using other productiondata, different datasets of resources use and alternativevalues for caloric nutritional needs, including changesin the composition of diets. It is worthwhile notingthat our use of a reference diet of a 3000 kcal cap−1 d−1
from crop products does not account for the fact thatmost human diets include animal products such as
Figure 6.Evolution of biophysical redundancy for theworld as a whole. See table 2 for the characteristics of each scenario.
11
Environ. Res. Lett. 11 (2016) 055008 MFader et al

meat, milk, or egg, which are partly produced usingfeed, and require several calories of feed crops to beproduced. Even though the use of animal calories canbe easily accounted for in our framework (Daviset al 2014), here we refer only to staple food and otherfood crops because the reliance on animal calories islikely to drop in conditions of severe food shortage.Thus, the reference to a plant base diet is here used as abaseline to evaluate the number of people that couldbe fed in each country by the redundant biophysicalresources.
4.2.On the link of biophysical redundancy andinternational tradeOur study focuses on biophysical redundancy and thusintentionally disregards the influence of imports onfood security. However, water and land use as well asthe intensity of the agricultural management areinfluenced by the status and evolution of the agricul-tural and non-agricultural trade balance of eachcountry. This indirect influence was implicitlyincluded in our study by using historical data onproduction, resource use and agricultural yields.Additionally, in exporting countries, the area andwater used for the production of export goods werenot considered redundant resources. However,in situations of food shortage, countries might chooseto stop exporting and use their natural resources forsecuring the food supply of their population (JonesandHiller 2015). This has not being taken into accountin this study, mainly because we consider that therevenues of exports are necessary for the nationaleconomies.
The relation of international trade, and especiallytrade liberalization, with food security, is a complexone. Not only due to the challenge of measuring foodsecurity, but also to the difficulty of attributing socio-economic developments to trade policies. While a fullanalysis of these issues is certainly out of the scope ofthis study, it is important to note that there is an ongo-ing debate both in political and academic spheres thatdetermines policies that will, in turn, directly affect thebiophysical redundancy level. And this is a good rea-son to include some lines on these issues here.
The neoclassical trade theory assumes aworldwithperfect competition, where no country or firm is cap-able of influencing prices, and full internalization ofexternal costs is in place, thus ruling out environ-mental externalities by construction. Under this the-ory, trade promotes long-term economic growth,maximizes the total potential economic welfare andensures efficient resource use, by allocating produc-tion to sites where the resources needed for that pro-duction are abundant (keywords here are‘comparative advantage’ and the Heckscher–Ohlintheorem). FAO (2003) lists some studies that showempirical evidence on the relationship between eco-nomic growth and free trade, and other authors show
evidence that international trade avoids higher levelsof land use change (e.g. Fader et al 2011). FAO (2003)also points to the unrealistic character of the assump-tions of the neoclassical theory and makes a strongeffort to summarize the risks connected to liberal tradepolicies. This book concludes that there is a need forprotection of vulnerable groups and of understandingthe complex relationships between income, incomedistribution and access to food availability, at nationaland household level. Lambin and Meyfroidt (2011)contribute to the debate pointing to processes ampli-fied by globalization that may increase deforestationand land scarcity, changing future biophysical redun-dancy. These processes include displacement of envir-onmental costs to other territories, indirect land usechange, increase in resource use due to new technolo-gies that make that use more efficient and thuscheaper, and the influence of remittance of migrantson the change, intensification or expansion of agri-cultural activities (Lambin andMeyfroidt 2011).
However, trade does allows increasing food supplyin times of national crisis by increasing imports (incountries that can afford them) and allows countries tosell products in moments of food surplus, increasingthe financial resilience of some economic groups to adegree. But it also facilitates the propagation of shocksthrough higher connectivity, the coupling with theenergy market, financial speculation in the interna-tional food commodities market, and a potentiallyharmful dependency on food produced in other coun-tries that may, out of necessity or convenience, restrictfood supply (Fader et al 2013, Suweis et al 2013, 2015).
Finally, foreign land investments, also called ‘grab-bed’ land, could be used as amechanism for artificiallyincrease biophysical redundancy of the investor coun-tries, decreasing correspondingly the biophysicalredundancy of host countries. Currently, there arealmost 37 Mha contracted land deals, of that, 17 Mhais in Africa (Land Matrix 2015). There is a clear needfor better data on these deal’s conditions, the destinyof products and the local impacts on accessibility andavailability of natural resources.
Collectively, these results demonstrate that there isa clear need to go beyond the biophysical aspects. Inthis sense, this study paves the way for integrating bio-physical redundancy with trade dynamics and socio-economic development indicators in order to quantifythe overall resilience of countries to food supplychanges.
4.3. Time is ripe for discussing the role ofbiophysical redundancy in food securityLambin (2012) presents an interpretation of Malthu-sian and Ricardian views over global productive landthat is useful for the debate on resources scarcity andhuman technological capacities to overcome physicalconstraints. From a Malthusian perspective, land andwater availability are hard constraints for population
12
Environ. Res. Lett. 11 (2016) 055008 MFader et al

growth. As population grows over the carrying capa-city of the Earth, violent conflicts and food insecurityare expected to increase, and welfare is expected todecrease. In contrast, a Ricardian view would proposethat limits can be sequentially upgraded when mar-ginal land and water use become increasingly profit-able (Lambin 2012). Neither of these views wouldconsider that resources could be intentionallyexcluded from production. Our findings suggest,however, that the time is ripe for asking whether thereis a ‘desirable’ level of redundancy in biophysicalresources that play a fundamental role in food produc-tion. That is especially true because eminent climateand socio-economic changes are likely to modify foodsupply and demand in the near future.
In this study, redundancy of critical resources foragricultural production has been introduced as a mir-ror concept to redundancy in engineering and ecology.As such, our concept of biophysical redundancy isequivalent to the ‘stand-by redundancy’ in engineer-ing, i.e. equipment that does not take part in the pro-cess and is most of the time idle, until a failure of asystem component occurs (King 1990). There are atleast three points worthwhile mentioning in connec-tionwith this ‘stand-by’ character.
First, spare land and available water resources arenot ‘idle’, in fact they play amajor role in the provisionof ecosystem services that are also fundamental foragricultural production (e.g. provision of pollinators,water purification, etc) (Godfray et al 2010). Also, agri-cultural intensification, on the one hand, might avoidconversion of natural areas to agricultural production,increasing ‘spare’ land, and thus, land redundancy. Onthe other hand, intensification increases actual yields,diminishing the yield gap and, thus, reducing the pro-ductivity redundancy. But most importantly, high orlow redundancy does not imply environmentallyfriendly or unfriendly practices. When intensificationis linked to mechanization and increases in chemicalinputs and irrigation, it may have detrimental effectson both land suitability (salinization, water logging,soil degradation, soil compaction, etc) and ecosystemfunctioning (nutrient leaching, pollution, etc) (Mon-tgomery 2008). Extensification, on the other side, islinked to increased greenhouse gas emissions, biodi-versity loss and hydrological alterations (Gibsonet al 2011, Tilman et al 2011).
Second, this study does not analyze the feasibilityof using redundant resources in response to food sup-ply changes nor recommends using them in cases offood supply shortage. It is worthwhile to note that theuse of redundant resources can be difficult under somecircumstances. For example, Alexandratos (2005)mentions the remoteness and prevalence of highlyinfectious diseases in some LIEs as impediments forland conversion. Also, some studies point out thatyields gaps, besides being connected to physical fac-tors, like slope and irrigation, are highly linked tomar-ket-related issues, management practices, labor force
and inequality (Neumann et al 2010, Allouche 2011,Dietrich et al 2012). These factors might be as impor-tant as the availability of redundant resources in shap-ing the response to long-term food supply changes.
Third, in this study, countries with large areas offertile, spare land, untapped freshwater resources, anda combination of low actual yields and high potentialyields are assumed to have high redundancy. The rea-son for this would be that they have a buffer with thepotential to compensate—to certain extent—internalor external supply shortcomings by increasing domes-tic production. However, it has to be noted that werefer to medium and long term changes, since thestand-by character of the resources discussed heredoes not allow for a response to sudden disruptions,shocks or price spikes. In this context, other factorslike the diversity of domestic production before theshock and the availability of financial means forincreasing imports may play a much more decisiverole in maintenance of food security (Porkkaet al 2013).
5. Conclusions and implications
In this study we assessed the redundancy potential toincrease food production. We found that biophysicalredundancy has decreased over the last two decades inthemajority of the countries. The drivers of change arecomplex and highly variable across different geogra-phical areas, but we show that improvements in yieldsand population growth have been central causesbehind movements towards the very low redundancycategory. In countries with low redundancy, it wouldbe important to integrate this knowledge with ananalysis of the evolution in other economic sectors anda critical view of changes in agricultural trade balance.This could help to determine whether the trend inredundancy is linked with an increase in vulnerabilityto food supply changes. Additionally, this study hastwo main implications; one is for future research andthe other for development organizations and policymakers.
In terms of the future research implications wehighlight that different definitions and calculations ofthe subcomponents of redundancy had a strong influ-ence on our results. Importantly, the inclusion orexclusion of managed grasslands as redundant resour-ces (potentially available for conversion to agriculturalproduction) had a large influence at the global andnational levels. This clearly shows that spatially-expli-cit research on the potential agricultural production ofmanaged grasslands and the environmental con-sequences of their conversion to other uses is urgentlyneeded in order to determine the flexibility of their usein a context of dynamic food supply.
In relation to policy, we show that LIEs are parti-cularly vulnerable as they have limited or very low bio-physical redundancy. Several of these countries show a
13
Environ. Res. Lett. 11 (2016) 055008 MFader et al

decrease in redundancy in the last two decades andthese decreases are not always linked with improve-ments in food availability. Due to the limited capacityof LIEs to compensate food supply changes by increas-ing imports (potentially at a higher price in periodswith lower supply), it is crucial that governments andthe international development agencies understandthe interplay between dynamics of domestic food pro-duction and biophysical redundancy.
Acknowledgments
This work was supported by the National Socio-Environmental Synthesis Center (SESYNC) underfunding received from the National Science Founda-tion DBI-1052875. Marianela Fader was supported bythe Labex OT-Med (n° ANR-11-LABX-0061) fundedby the French Government «Investissements d’Ave-nir» program of the French National Research Agency(ANR) through the A*MIDEX project (n° ANR-11-IDEX-0001-02), and the European Union’s SeventhFramework Programme for research, technologicaldevelopment and demonstration under the projectLUC4C (grant agreement number 603542). JessicaGephart was supported by the National ScienceFoundation (Grant Number: DGE-00809128). DavidASeekell is supported by theCarl Tryggers Foundationfor Scientific Research. Samir Suweis thanks Univer-sity of Padova Physics and Astronomy DepartmentSenior Grant 129/2013 Prot. 1634. Miina Porkkareceived funding from the Maa-ja vesitekniikan tukiry. Matti Kummu received funding from the Academyof Finland funded project SCART (grant no. 267463).Michael Puma gratefully acknowledges support fromthe Interdisciplinary Global Change Research underNASA cooperative agreement NNX08AJ75A sup-ported by the NASA Climate and Earth ObservingProgram. Alessandro Tavoni acknowledges supportfrom the Centre for Climate Change Economics andPolicy, funded by the ESRC, and the GranthamFoundation for the Protection of the Environment.Zak Ratajczak was supported by the National Sciencefoundation (DBI #1402033). The authors wish tothank Dr Kees Klein Golgewijk (University of Utrechtand Netherlands Environmental Assessment Agency)for providing of the HYDE 3.2 data that went into thecalculations. We also thank Roberto Patricio Korze-niewicz and PhilippeMarchand for their participationin early discussions on this project.
References
AlexandratosN 2005Countries with rapid population growth andresource constraints: issues of food, agriculture, anddevelopment PopulationDev. Rev. 31 237–58
Allouche J 2011The sustainability and resilience of global water andfood systems: political analysis of the interplay betweensecurity, resource scarcity, political systems and global tradeFood Policy 36 S3–8
BondeauA et al 2007Modelling the role of agriculture for the 20thcentury global terrestrial carbon balanceGlob. Change Biol.13 1–28
BryantD,NielsenD andTangley L 1997The Last Frontier Forests—Ecosystems Economies on the Edge (Washington, DC:WorldResources Institute (WRI))
Davis K F, RulliMC andD’Odorico P 2014Moderating diets to feedthe futureEarth’s Future 2 559–65
Dietrich J P, Schmitz C,Müller C, FaderM, Lotze-CampenHandPoppA 2012Measuring agricultural land-use intensity—aglobal analysis using amodel-assisted approach Ecol.Modelling 232 109–18
D’Odorico P andRulliMC2013The fourth food revolutionNat.Geosci. 6 417–8
EitelbergDA, vanVliet J andVerburg PH2015A review of globalpotentially available cropland estimates and theirconsequences formodel-based assessmentsGlob. ChangeBiol. 21 1236–48
FaderM,GertenD, KrauseM, LuchtW andCramerW2013 Spatialdecoupling of agricultural production and consumption:quantifying dependence of countries on food imports due todomestic land andwater constraintsEnviron. Res. Lett. 8014046
FaderM,GertenD, ThammerM,Heinke J, Lotze-CampenH,LuchtWandCramerW2011 Internal and external green-blue agricultural water footprints of nations, and relatedwater and land savings through tradeHydrol. Earth Syst. Sci.15 1641–60
FaderM, Rost S,Müller C, BondeauA andGertenD 2010Virtualwater content of temperate cereals andmaize: present andpotential future patterns J. Hydrol. 384 218–31
FaderM, vonBlohW, Shi S, BondeauA andCramerW2015Modellingmediterranean agro-ecosystems by includingagricultural trees in the LPJmLmodel GeosciModel Dev. 83545–61
FAO2003Trade reforms and food securityConceptualizing theLinkages (Rome: FAO) pp 296
FAO2012The State of Food Insecurity in theWorld 2012 (Rome:Food and agriculture organization of theUnitedNations)
FAO2015a Population (http://faostat3.fao.org/download/O/*/E)(accessed 2May 2015)
FAO2015bAQUASTAT (http://fao.org/nr/water/aquastat/main/index.stm) (accessed 2May 2015)
FAOSTAT2015 Production (http://faostat3.fao.org/download/Q/QC/E) (accessed 2May 2015)
FischerG, vanVelthuizenH, ShahMandNachtergaele F 2002Global Agro-ecological Assessment for Agriculture in the 21stCentury:Methodology andResults (Laxenburg, Austria; Vialedelle Terme di Caracalla, Rome, Italy: International Institutefor Applied SystemsAnalysis; Food andAgricultureOrganization of theUnitedNations) p 156
Foley JA et al2011 Solutions for a cultivated planetNature478 337–42GertenD,HoffH, Rockström J, Jägermeyr J, KummuMand
Pastor AV2013Towards a revised planetary boundary orconsumptive freshwater use: role of environmental flowrequirementsCurr. Opin. Environ. Sustainability 5 551–8
Gibson L et al 2011 Primary forests are irreplaceable for sustainingtropical biodiversityNature 478 378–81
Gleick P 2000TheWorld’s water 2000–2001The Biennial Report onFreshwater Resources (Washington,DC: Island)
GodfrayHC J, Beddington J R, Crute I R,Haddad L, LawrenceD,Muir J F, Pretty J, Robinson S, Thomas SMandToulminC2010 Food security: the challenge of feeding 9 billion peopleScience 327 812–8
Greenpeace International 2005TheWorld’s Last Intact ForestLandscapes (www.intactforest.org/download/download.htm)(accessed 2May2015)
Haddeland I et al 2014Global water resources affected by humaninterventions and climate change Proc. Natl Acad. Sci. USA111 3251–6
Horwitz B 2000Redundancy=reliability. consulting-specifyingengineering (http://csemag.com/industry-news/codes-
14
Environ. Res. Lett. 11 (2016) 055008 MFader et al

and-standards-updates/single-article/redundancy-reliability/e212653a6029648a3b699b3aa33d0378.html)(accessed 2May 2015)
Jones A andHiller B 2015Review of responses to food productionshocksResilience Taskforce Sub Report Foreign andCommonwealthOffice, UK Science and InnovationNetwork(http://foodsecurity.ac.uk/assets/pdfs/review-of-responses-to-food-production-shocks.pdf) (accessed 2May 2015)
KingR 1990 Safety in the process industries (London: Butterworth-Heinemman) p 762
KummuM, deMoelH, PorkkaM, Siebert S, VarisO andWard P J2012 Lost food, wasted resources: global food supply chainlosses and their impacts on freshwater, cropland, andfertilizer use Sci. Total Environ. 438 477–89
Lambin E F 2012Global land availability: malthus versus RicardoGlob. Food Secur. 1 83–7
Lambin E F andMeyfroidt P 2011Global land use change, economicglobalization, and the looming land scarcity Proc. Natl Acad.Sci. USA 108 3465–72
LandMatrix 2015Agricultural Drivers (http://landmatrix.org/en/get-the-idea/agricultural-drivers/) (accessed 1Decem-ber 2015)
LauranceWF, Sayer J andCassmanKG2014Agriculturalexpansion and its impacts on tropical natureTrends Ecol.Evol. 29 107–16
Lobell DB, CassmanKGand Field CB 2009Crop yield gaps: theirimportance,magnitudes, and causesAnnu. Rev. Environ.Resour. 34 179–204
MontgomeryD2008Dirt: The Erosion of Civilization (Berkeley, CA:UniversityOf California Press)
MuellerND,Gerber J S, JohnstonM, RayDK, RamankuttyN andFoley J A 2011Closing yield gaps through nutrient andwatermanagementNature 490 254–7
NaeemS and Li S 1997 Biodiversity enhances ecosystem reliabilityNature 390 507–9
NeumannK, Verburg PH, Stehfest E andMüller C 2010The yieldgap of global grain production: a spatial analysisAgric. Syst.103 316–26
PorkkaM,KummuM, Siebert S andVarisO 2013 From foodinsufficiency towards trade dependency: a historical analysisof global food availabilityPLosOne 8 e82714
Pradhan P, Fischer G, vanVelthuizenH, Reusser D andKropp J P2015Closing yield gaps: how sustainable canwe be?PLosOne10 e0129487
Rockström J, FalkenmarkM,Karlberg L,HoffH, Rost S andGertenD 2009a Futurewater availability for global foodproduction: the potential of greenwater for increasingresilience to global changeWater Resour. Res. 45W00A12
Rockström J et al 2009b Planetary boundaries: exploring the safeoperating space for humanity Ecol. Soc. 14 32
Rost S, GertenD, BondeauA, LuchtW, Rohwer J and Schaphoff S2008Agricultural green and bluewater consumption and itsinfluence on the global water systemWater Resour. Res. 44W09405
RulliMC andD’Odorico P 2014 Food appropriation through largescale land acquisitions Environ. Res. Lett. 9 064030
Schaphoff S,HeyderU,Ostberg S, GertenD,Heinke J and LuchtW2013Contribution of permafrost soils to the global carbonbudgetEnviron. Res. Lett. 8 014026
SteffenW et al 2015 Planetary boundaries: guiding humandevelopment on a changing planet Science 347 1259855
Suweis S, Carr J A, RinaldoA,Maritan A andD’Odorico P 2015Resilience and reactivity of global food security Proc. NatlAcad. Sci. USA 112 6902–7
Suweis S, RinaldoA,Maritan A andD’Odorico P 2013Water-controlledwealth of nations Proc. Natl Acad. Sci. USA 1104230–3
TilmanD, Balzer C,Hill J and Befort B L 2011Global food demandand the sustainable intensification of agriculture Proc. NatlAcad. Sci. USA 108 20260–4
UNEP-WCMC (UnitedNations Environment Program—WorldConservationMonitoring Centre) 2007WorldDatabase onProtected Areas (WDPA), CD-ROM,Cambridge, UK(http://sea.unep-wcmc.org/wdbpa/) (accessed 2May 2015)
WadaY, van Beek L P, vanKempenCM,Reckman JW,Vasak S andBierkensMF2010Global depletion of groundwaterresourcesGeophys. Res. Lett. 37 L20402
WahaK,Müller C, BondeauA,Dietrich J P, Kurukulasuriya P,Heinke J and Lotze-CampenH2013Adaptation to climatechange through the choice of cropping system and sowingdate in sub-saharanAfricaGlob. Environ. Change 23 130–43
Walker BH1992 Biodiversity and ecological redundancyConservation Biol. 6 18–23
Weichselgartner J andKelman I 2015Geographies of resilience.Challenges and opportunities of a descriptive conceptDialoguesHum.Geogr. 5 327–32
World Bank 2015 Country and LendingGroups (http://data.worldbank.org/about/country-and-lending-groups)(accessed 1December 2015)
15
Environ. Res. Lett. 11 (2016) 055008 MFader et al