fads gene variants, diet and atopic phenotypes and lipids
TRANSCRIPT
From
Dr. von Hauner Children's Hospital
Ludwig-Maximilians-University, Munich, Germany
Director: Prof. Dr. Dr. Christoph Klein
Division of Metabolic Diseases and Nutritional Medicine
Prof. Dr. med. Berthold Koletzko
and
The Institute of Epidemiology I, Acting director: Dr. Joachim Heinrich
Helmholtz Zentrum München �
German Research Center for Environmental Health (GmbH)
FADS gene variants, diet and
atopic phenotypes and lipids in children.
Thesis
submitted for a Doctoral degree in Human Biology at the Faculty of Medicine,
Ludwig-Maximilians-University, Munich, Germany
by
Marie Standl
from
Munich, Germany
2013

With approval of the Medical Faculty of the
Ludwig-Maximilians-University of Munich
Supervisor / Examiner: Prof. Dr. med. Berthold KoletzkoCo-Examiners: Priv. Doz. Dr. Bärbel Otto
Prof. Dr. Markus Braun-FalcoCo-Supervisor: Dr. Joachim HeinrichDean: Prof. Dr. med. Dr. h.c. M. Reiser, FACR, FRCRDate of oral examination: 08. 07. 2013
Contents
Contents I
Abbreviations III
Summary IV
Zusammenfassung VII
1 Introduction 1
1.1 Allergy, Allergic Sensitization and Atopy . . . . . . . . . . . . . . . . . 1
1.2 Polyunsaturated Fatty Acid Metabolism and the FADS Gene Cluster . . 2
1.2.1 The Polyunsaturated Fatty Acid Metabolism . . . . . . . . . . 2
1.2.2 The FADS Gene Cluster . . . . . . . . . . . . . . . . . . . . . 2
2 Speci�c Aims and Results 5
2.1 Speci�c Aims . . . . . . . . . . . . . . . . . . . . . . . . . . . . . . . 5
2.2 Study Population and Methods . . . . . . . . . . . . . . . . . . . . . 5
2.2.1 Study Population . . . . . . . . . . . . . . . . . . . . . . . . . 5
2.2.2 The Food Frequency Questionnaire . . . . . . . . . . . . . . . 6
2.2.3 Tested Variants of the FADS Gene Cluster . . . . . . . . . . . 6
2.2.4 Methods . . . . . . . . . . . . . . . . . . . . . . . . . . . . . 6
2.3 Results . . . . . . . . . . . . . . . . . . . . . . . . . . . . . . . . . . 7
2.4 Strengths and Limitations . . . . . . . . . . . . . . . . . . . . . . . . 8
3 Conclusion and Outlook 11
References 12
4 Paper 1: FADS Variants, Dietary Fatty Acid Intake and Atopic Dis-eases in Children(Standl et al. Clinical & Experimental Allergy, 2011) 19
5 Paper 2: FADS Variants, Exclusive Breastfeeding and Asthma inChildren(Standl et al. Allergy, 2012) 39
6 Paper 3: Meta-analysis of Genome-wide Association Studies on AtopicDermatitis(Paternoster* & Standl* et al. Nature Genetics, 2012) 55
7 Paper 4: Regional and Socioeconomic Di�erences in Dietary Intakein Children(Sausenthaler* & Standl* et al. Public Health Nutrition, 2011) 147
I

8 Paper 5: FADS Variants, Dietary Fatty Acid Intake and Lipids inChildren(Standl et al. PLoS ONE, 2012) 161
Acknowledgments 179
Curriculum Vitae 180
Publications 182
Erklärung 184
* These authors contributed equally to this work.
II

Abbreviations
AA arachidonic acid
ALA α-linolenic acid
DHA docosahexaenoic acid
EPA eisosapentaenoic acid
FADS fatty acid desaturase
FFQ food frequency questionnaire
GWAS genome-wide association study
HDL high-density lipoprotein
IgE Immunoglobulin E
LA linoleic acid
LDL low-density lipoprotein
PUFA polyunsaturated fatty acid
SNP single-nucleotide polymorphism
III

Summary
The prevalence of allergic diseases has increased over the past decades. Dietarychanges, especially the altered fatty acid consumption, is suggested to be partly respon-sible. There is a growing body of evidence that polyunsaturated fatty acids (PUFAs)play a major role in the development of atopic diseases in children, although the re-sults have been inconsistent. Also the development of cardiovascular diseases seems tobe dependent on PUFA composition as PUFA levels are believed to lower high bloodlipid concentrations. Elevated cholesterol levels during childhood may be an importantpredictor for later disease in life.
The conversion of essential fatty acids to longer chain, biological active metabolitesis regulated by the enzymes ∆5 and ∆6 desaturase, which are encoded by the genesfatty acid desaturase 1 and 2 (FADS1 and FADS2). Therefore, it is hypothesized thatinter-individual genetic di�erences may modify the association of dietary fatty acidintake and allergic diseases or lipids.
This thesis comprises �ve publications, which are based on data from the GINIplus andLISAplus studies.
The �rst publication investigated the in�uence of variants in the FADS1 FADS2 genecluster on the association of dietary fatty acid and margarine intake and atopic diseases,as well as allergic sensitization. In the strati�ed analysis, a higher margarine intake waspositively associated with a higher risk for asthma in homozygous major allele carriers.
In the second publication, the modulating e�ect of variants in the FADS gene clusteron the association of breastfeeding and asthma up to 10 years of age was evaluated.A strong interaction e�ect between the duration of exclusive breastfeeding and thesix tested SNPs was observed. Individuals carrying at least one minor allele who wereexclusively breastfed for more than three months, showed a reduced risk for asthma,whereas there was no genetic e�ect in homozygous major allele carriers.
The third publication included data from the GINIplus and LISAplus studies to a world-wide meta-analysis of genome-wide association studies on atopic dermatitis. Three newrisk loci were identi�ed. Two of these loci are near genes, which are related to epidermalproliferation and di�erentiation. The third locus is located near immune-related genes.These results underline the hypothesis, that atopic dermatitis is caused by epidermalbarrier abnormalities and immunological features. However, further research is neededto identify causal variants at these loci and to understand the mechanisms throughwhich they a�ect atopic dermatitis.
Regional and socio-economic di�erences in dietary intake of school-aged children wereinvestigated in the fourth publication. A higher level of parental education was asso-ciated with a higher intake of more healthy food, such as bread, butter, eggs, pasta,vegetables/salad and fruit, whereas intakes of margarine, meat products, pizza, dessertsand soft drinks were inversely associated with parental education. Additionally, sub-stantial di�erences in food intake between eastern and western Germany were observed.
In the �fth publication, the association between blood lipid concentrations and variantsof the FADS gene cluster was assessed. Individuals carrying the homozygous minor
V
allele were found to have lower levels of total cholesterol and low-density lipoprotein(LDL) compared to homozygous major allele carriers. Carriers of the heterozygousallele had lower levels of high-density lipoprotein (HDL) and higher levels of triglyceridescompared to homozygous major allele carriers. Additionally, the in�uence of dietaryn-3 PUFA intake was tested. A higher intake of n-3 fatty acids was related to higherlevels of total cholesterol, LDL, HDL and lower triglyceride levels.
In summary, these results support the hypothesis, that there is a causal associationbetween dietary fatty acid intake and atopic diseases or lipids in children and mayhelp to better understand the complex association between allergic in�ammation andPUFAs.
VI
Zusammenfassung
Die Prävalenz allergischer Erkrankungen stieg in den vergangenen Jahrzehnten starkan. Es wird vermutet, dass unter anderem veränderte Ernährungsgewohnheiten, ins-besondere die Zusammensetzung der Fettsäuren in der Nahrung, teilweise dafür ver-antwortlich sein könnten. Obwohl nicht alle Untersuchungsergebnisse konsistent sind,gibt es doch deutliche Hinweise darauf, dass mehrfach ungesättigte Fettsäuren (po-lyunsaturated fatty acids, PUFAs) eine groÿe Rolle bei der Entstehung allergischerErkrankungen bei Kindern spielen.
Ferner ist bekannt, dass die Aufnahme mehrfach ungesättigter Fettsäuren, neben an-deren Faktoren, erhöhten Blutfettwerten entgegenwirkt. Erhöhte Cholesterinwerte inder Kindheit und Jugend können ein Risikofaktor für die Entstehung kardiovaskulärerErkrankungen im Erwachsenenalter sein.
Die Umwandlung von essentiellen Fettsäuren zu längerkettigen, biologisch aktiven Me-taboliten wird durch die Enzyme ∆5 und ∆6 Desaturase gesteuert, die durch die GeneFADS1 und FADS2 (fatty acid desaturase 1 und 2) kodiert werden. Daraus lässt sichdie Hypothese ableiten, dass inter-individuelle genetische Unterschiede den Zusammen-hang zwischen Fettsäurenaufnahme aus der Ernährung und allergischen Erkrankungenund Lipidwerten beein�ussen können.
Diese Dissertation umfasst fünf Publikationen, basierend auf den Daten der GINIplusund LISAplus Studien.
In der ersten Publikation wird der Ein�uss von Varianten aus dem FADS1 FADS2
Gencluster auf den Zusammenhang zwischen Fettsäurenaufnahme und Margarinekon-sum und atopischen Erkrankungen bzw. allergischer Sensibilisierung untersucht. Dabeiwar eine höhere Margarineaufnahme mit einem höheren Asthmarisiko bei Kindern, diehomozygot die häu�ge Variante tragen, assoziiert.
Die zweite Publikation befasst sich mit dem Zusammenhang zwischen Varianten ausdem FADS Gencluster, Stillen und Asthma bis zum Alter von 10 Jahren. Hier wurde einstarker Interaktione�ekt zwischen der Dauer, die ausschlieÿlich gestillt wurde und densechs getesteten SNPs beobachtet. Kinder, die mindestens ein seltenes Allel tragenund für mindestens drei Monate ausschlieÿlich gestillt wurden, hatten ein deutlichniedrigeres Risiko an Asthma zu erkranken. Für Kinder, die homozygot die häu�geVariante tragen, wurde kein genetischer E�ekt beobachtet.
Die dritte Publikation ist eine Meta-Analyse von genomweiten Assoziationsstudien, indie auch Daten der GINIplus und LISAplus Studien miteingegangen sind. Es konntendrei neue Risikovarianten für atopischer Dermatitis identi�ziert werden. Zwei dieserLoci liegen in der Nähe von Genen, die mit epidermaler Zellproliferation und Zelldi�e-rentierung in Verbindung gebracht werden, während der dritte Locus in der Nähe vonGenen liegt, die die Immunantwort regulieren. Diese Ergebnisse stützen die Hypothe-se, dass atopische Dermatitis durch Defekte in der natürlichen Hautbarriere und derImmunregulation verursacht wird. Allerdings sind weitere Untersuchungen erforderlichum die ursächlichen Varianten an diesen Loci zu identi�zieren und den Mechanismuszu verstehen, durch den atopische Dermatitis hervorgerufen wird.
VII
Regionale und sozio-ökonomische Unterschiede in der Ernährung von Kindern im Schulal-ter wurden in der vierten Publikation untersucht. Ein höherer Grad elterlicher Bildungwar mit einem höheren Konsum gesunder Nahrungsmittel, wie Brot, Butter, Eier, Nu-deln, Gemüse/Salat und Obst und einer niedrigeren Aufnahme von Margarine, Fleisch-produkten, Pizza, Nachspeise und Limonaden assoziiert. Auÿerdem wurden grundsätz-liche Unterschiede in der Ernährung zwischen Ost- und Westdeutschland beobachtet.
In der fünften Publikation wird der Zusammenhang zwischen Lipiden und Varianten desFADS Genclusters untersucht. Kinder, die homozygot das seltene Allel tragen, hattenim Vergleich zu Kindern, die das häu�ge Allel homozygot tragen, niedriger Choleste-rinwerte und LDL-Konzentration. Träger des homozygoten Allels zeigten, im Vergleichzu Kindern, die das häu�ge Allel homozygot tragen, niedrigere HDL-Werte und höhereTriglyzeridwerte. Zusätzlich wurde der Ein�uss der n-3 Fettsäurenaufnahme geprüft.Eine höhere n-3 Fettsäurenaufnahme war assoziiert mit einer höheren Cholesterin-,LDL- und HDL-Konzentration und niedrigeren Triglyzeridwerten. Es wurde allerdingskeine Interaktion mit dem FADS Genotyp beobachtet.
Diese Ergebnisse lassen auf einen Zusammenhang zwischen FADS Gencluster, Fett-säurenaufnahme und allergischen Erkrankungen oder Lipiden bei Kindern schlieÿen.Dadurch wird die Hypothese gestützt, dass ein kausaler Zusammenhang zwischen Fett-säurenaufnahme aus der Nahrung und atopischen Erkrankungen bei Kindern besteht.Dies könnte helfen, den komplexen Zusammenhang zwischen allergischer In�ammationund Fettsäuren zu verstehen.
VIII

1 Introduction
1 Introduction
The prevalence of allergic diseases was increasing over the past decades with about 30-40% of the world population now being a�ected1. Changes in dietary intake, especiallythe altered fatty acid consumption, were suggested to be partly responsible for theincreasing prevalence of allergies2, although the results are inconsistent3.
Polyunsaturated fatty acids (PUFAs) have a major impact on health and developmentand have been associated with cardiovascular diseases4,5, mental health6,7 and cog-nitive development8,9, immunologial and in�ammatory responses as well as relateddiseases such as allergic diseases10,11.
The development and programming of the immune system is related to PUFA intakeduring pregnancy, lactation, infancy and early childhood and the development andmanifestation of atopic diseases and allergies can be prevented thereby12,13.
Among other factors, dietary PUFA intake can attenuate high blood lipid concen-trations14�16. Elevated cholesterol levels during childhood and adolescence increasethe risk for cardiovascular diseases later in life. Treatments which e�ectively lowercholesterol levels early in life have been shown to prevent disease manifestation inadulthood17�19.
1.1 Allergy, Allergic Sensitization and Atopy
Allergy is de�ned as a �hypersensitivity reaction initiated by speci�c immunologicmechanisms�, based on the nomenclature developed by the European Academy ofAllergology and Clinical Immunology (EAACI) and updated by the World Allergy Or-ganization (WAO), and can be antibody- or cell-mediated20. The presence of speci�cimmunoglobulin E (IgE) antibodies is called sensitization. In most patients allergy isinitiated by increased levels of IgE antibodies to speci�c antigens. Allergic symptomsmay be referred to as atopic, if IgE sensitization has been documented by IgE an-tibodies in serum or by a positive skin prick test20. Therefore, atopy is de�ned as�a personal and/or familial tendency, usually in childhood or adolescence, to becomesensitized and produce IgE antibodies in response to ordinary exposures to allergens,usually proteins. As a consequence, these persons can develop typical symptoms ofasthma, rhinoconjunctivitis, or eczema.� 20.
Asthma and allergies are complex diseases with high hereditary. The susceptibilityto asthma and allergies is in�uenced by environmental factors, but with a strong ge-netic background21. Recently, a large genome-wide association study on asthma waspublished22. The results show that asthma is genetically heterogeneous with di�erentcharacteristics in children and adults. Several genes could be identi�ed, initiating aswell as down-regulating airway in�ammation processes. Additionally, little overlap be-tween asthma and total serum IgE levels was reported. Therefore, the authors suggestthat elevated total serum IgE concentration do not play a major role in the developmentof asthma, but rather, are a secondary e�ect of asthma22.
1

1 Introduction
1.2 Polyunsaturated Fatty Acid Metabolism and the FADS
Gene Cluster
1.2.1 The Polyunsaturated Fatty Acid Metabolism
There is strong evidence that fatty acids play a major role in programming of theimmune system and the development of atopic diseases in children12,13, although theunderlying biological mechanism is still not entirely clear and the results have beeninconsistent3,23.
In general, fatty acids containing more than one double bond in the chain are calledpolyunsaturated fatty acids. The main n-6 PUFA is linoleic acid (LA, 18:2n-6) andthe main essential n-3 PUFA is α-linolenic acid (ALA, 18:3n-3)24. The essential fattyacids LA and ALA cannot be synthesized by mammalian cells, but they can be me-tabolized by desaturation (introduction of double bonds) and elongation (lengtheningthe hydrocarbon chain). The fatty acid metabolism is presented in �gure 1. The n-6PUFA LA is converted into γ-linolenic acid (18:3n-6), dihomo-γ-linolenic acid (20:3n-6) and arachidonic acid (AA, 20:4n-6). ALA can be converted to the long-chain fattyacids eisosapentaenoic acid (EPA, 20:5n-3) and docosahexaenoic acid (DHA, 22:6n-3),using the same enzymatic pathway as n-6 PUFAs24.
The key link between PUFAs and in�ammation is the synthesis of eicosanoids, whichare generated from PUFAs25. AA is the major substrate for eicosanoid synthesis,which are mediators and regulators of in�ammation. In contrast, n-3 PUFAs are sug-gested to have anti-in�ammatory e�ects by decreasing the production of in�ammatoryeicosanoids and cytokines25. Since n-3 and n-6 PUFAs use the same enzymatic path-way, a higher proportion of n-3 PUFAs leads to less substrate which is available foreicosanoid synthesis from AA. Additionally, there is evidence that n-3 PUFAs alterthe expression of in�ammatory genes and increase the production of anti-in�ammatorymediators24,25.This led to the hypothesis that n-6 PUFA intake may enhance the development ofallergic diseases in susceptible individuals. In contrast, n-3 PUFA are suggested tohave protective e�ects with regard to allergic diseases3.
1.2.2 The FADS Gene Cluster
The conversion of the essential fatty acids LA and ALA to longer chain, biological activemetabolites is regulated by the enzymes ∆5 and ∆6 desaturase, which are encoded bythe genes fatty acid desaturase 1 and 2 (FADS1 and FADS2)26.
The FADS gene cluster is located at chromosome 11q12-13.127 and comprises thegenes FADS1, FADS2 and FADS3. Whereas the function of FADS1 and FADS2 iswell studied, the function of FADS3 is not entirely clear28.Several genetic association studies showed that carriers of the minor alleles of single-nucleotide polymorphisms (SNPs) in the FADS gene cluster exhibit increased levels ofdesaturase substrates and decreased levels of desaturase products. This might arisefrom lowered transcriptional levels or diminished conversion rates of the enzymes inindividuals carrying the minor alleles29.
Variants of the FADS gene cluster can explain up to almost 30% of the variationsin the fatty acid levels29. Several studies have shown strong associations between
2

1 Introduction
Figure 1: Metabolism of n-6 and n-3 PUFAs (adapted from Calder (2005)24)
Linoleic acid (18:2n-6)
?
γ-Linolenic acid (18:3n-6)
?
Dihomo-γ-linolenic acid (20:3n-6)
?
Arachidonic acid (20:4n-6)
α-Linolenic acid (18:3n-3)
?
Stearidonic acid (18:4n-3)
?
(20:4n-3)
?
Eicosapentaenoic acid (20:5n-3)
?
Docosahexaenoic acid (22:6n-3)
∆6-desaturase
Elongase
∆5-desaturase
Elongase
Elongase
∆6-desaturase
β-oxidation
the FADS gene cluster and fatty acid levels in serum phospholipids29,30, plasma andadipose tissue samples31, erythrocyte cell membranes30,32, breast milk30,33,34 and redblood cells35.
Additionally, recent genome-wide association studies on blood lipid levels in adultshave identi�ed several genetic loci including the FADS gene cluster36�40. Lower totalcholesterol36, low-density lipoprotein (LDL)36�38, high-density lipoprotein (HDL)38,39
and higher triglyceride levels39,40 are all associated with the minor alleles of the testedFADS polymorphisms.
Therefore, it is hypothesized that inter-individual genetic di�erences may in�uence theassociation of dietary fatty acid intake and fatty acid related phenotypes26,41�43. Asthe conversion rate of essential fatty acids to longer chain metabolites is hypothesizedto be lower in individuals carrying the minor allele, it would be expected that the pro-in�ammatory e�ects of n-6 fatty acids and the protective e�ects of n-3 fatty acidswould be stronger in major allele carriers, because a higher percentage of the essentialfatty acids is converted to longer chain, biological active metabolites.Beside diet and nutrition, the FADS gene cluster plays an important role in the reg-ulation of the PUFAs. A modulating e�ect of variants in the FADS gene cluster onintelligence development, risk of myocardial infarction and metabolic syndrome was re-ported26. Further, there is some evidence, that variants in the FADS gene cluster mayalso in�uence the association of PUFAs on allergies26,41,43. In summary, these resultsmake these genes good candidates and underline the importance of further research onthe modifying e�ect of variants in the FADS gene cluster on the association of PUFAsand fatty acid related phenotypes.
3


2 Speci�c Aims and Results
2 Speci�c Aims and Results
2.1 Speci�c Aims
The aim of this thesis was to investigate the association between dietary intake, FADSvariants and atopic phenotypes or lipids in children. The main objectives were
• to assess the in�uence of FADS1 FADS2 gene cluster polymorphisms on theassociation between dietary fatty acid intake and atopic diseases and allergicsensitization.
• to evaluate the impact of FADS1 FADS2 gene cluster polymorphisms on theassociation between breastfeeding and asthma.
• to identify new risk loci for atopic dermatitis in a meta-analysis of genome-wideassociation studies.
• to describe regional di�erences between eastern and western Germany with regardto food, nutrient and supplement intake in children, and analyze the associationwith parental education and equivalent income.
• to investigate whether lipid levels are in�uenced by the FADS genotype alreadyin children and whether this association interacts with dietary intake of n-3 fattyacids.
This thesis is based on �ve manuscripts, which are published in Clinical & ExperimentalAllergy, Allergy � the European Journal of Allergy and Clinical Immunology, NatureGenetics, Public Health Nutrition and PLoS ONE.For all publications, I am the �rst, or shared �rst author. I was signi�cantly involvedin developing the research question, study design, performed the statistical analysesand interpreted the results. All comments and suggestions from the co-authors wereincluded in the �nalized version.
2.2 Study Population and Methods
2.2.1 Study Population
All manuscripts are based on data from the GINIplus44 and LISAplus45 studies. Brie�y,a total of 5991 mothers and their newborns were recruited into the German Infant studyon the in�uence of Nutrition Intervention PLUS environmental and genetic in�uenceson allergy development (GINIplus) between September 1995 and June 1998 in Munichand Wesel. Infants with at least one allergic parent and/or sibling were allocated tothe interventional study arm investigating the e�ect of di�erent hydrolysed formulasfor allergy prevention in the �rst year of life44. All children without a family history ofallergic diseases and children whose parents did not give consent for the interventionwere allocated to the non-interventional arm. The in�uence of Life-style factors on thedevelopment of the Immune System and Allergies in East and West Germany PLUSthe in�uence of tra�c emissions and genetics (LISAplus) Study is a population basedbirth cohort study. A total of 3097 healthy, fullterm neonates were recruited between
5

2 Speci�c Aims and Results
1997 and 1999 in Munich, Leipzig, Wesel and Bad Honnef. The participants were notpre-selected based on family history of allergic diseases45.Detailed descriptions of the LISAplus and GINIplus studies have been published else-where (44 and45, respectively).
2.2.2 The Food Frequency Questionnaire
A food frequency questionnaire (FFQ) was developed to measure children's usual foodand nutrient intake over the past 12 months, and more speci�cally to estimate energy,fatty acid and antioxidant intake at 10 years of age. The FFQ comprised a list of82 food items accompanied by several questions about the preferred fat and energycontent of products, preparation methods, diets and food preferences, buying habitsand dietary supplement use. The consumption frequencies and portion size estimateswere converted to average consumption in grams per day and linked to the GermanNutrient Data Base (BLS) version II.3.146. The design of the FFQ, including theselection of the food item list, validation, and the calculation of food and nutrientintake is described further by Stiegler et al.47. Information obtained by FFQ was usedfor the �rst, second, fourth and �fth manuscript.
2.2.3 Tested Variants of the FADS Gene Cluster
Six SNPs of the FADS1 FADS2 gene cluster (rs174545, rs174546, rs174556, rs174561,rs174575 and rs3834458) were typed. Five of these variants (rs174545, rs174546,rs174556, rs174561 and rs3834458) were selected based on the previous publicationsin adult populations29,48. Moreover, the SNP rs174575 was included in order to obtaina better coverage of the FADS gene cluster. This SNP was selected based on a previouspublication in children49.
2.2.4 Methods
Up to now, the association between dietary fatty acid intake and the development ofatopic diseases has been inconsistent3. The �rst publication (chapter 4) investigatedwhether the association between dietary fatty acid intake and atopic diseases andallergic sensitization is modi�ed by variants of the FADS gene cluster.Margarine and fatty acid intake was assessed by FFQ. Information on atopic diseasesfor each year of life up to 10 years of age was collected using a self-administeredquestionnaire completed by the parents and speci�c IgE antibodies against commonfood and inhalant allergens were measured. Six variants of the FADS1 FADS2 genecluster were tested. In total, complete information was available for 2000 children.In this analysis, the impact of inter-individual genetic di�erences on the associationbetween dietary fatty acid intake and atopy was investigated.
The second manuscript (chapter 5) evaluated the e�ect of variants of the FADS genecluster on the association between exclusive breastfeeding and the development ofasthma. The analysis was based on 2245 children. Information on ever having adoctor's diagnosis of asthma up to 10 years of age and breastfeeding during the �rst6 months was collected using parental questionnaires. Six SNPs of the FADS1 FADS2
6

2 Speci�c Aims and Results
gene cluster were tested. Within this study, the inconsistencies in the associationbetween breastfeeding and asthma may be partly explained by inter-individual geneticdi�erences.
The scope of the third publication (chapter 6) was to identify new genetic risk variantsfor atopic dermatitis in a meta-analysis of genome-wide association studies. Within theEArly Genetics & Lifecourse Epidemiology (EAGLE) Consortium a well-powered, two-stage genome-wide association meta-analysis was performed. The discovery analysisincluded 5606 a�ected individuals and 20565 controls from 16 population-based cohortsand the ten most strongly associated new susceptibility loci were examined in additional5419 a�ected individuals and 19833 controls from 14 studies.
The aim of the fourth publication (chapter 7) was to analyze the e�ect of socio-economic factors and regional di�erences in food consumption and supplement intake.Information on food, nutrient and supplement intake of 3435 children derived by FFQwas analyzed in respect to regional di�erences between eastern and western Germanyand the association with parental education and equivalent income was assessed.
In adults, it had been shown that the blood lipid concentrations are strongly in�uencedby variants of the FADS gene cluster. Therefore, the �fth publication (chapter 8)investigated whether blood lipid levels are in�uenced by polymorphisms in the FADS
gene cluster already in children and whether this association interacts with dietaryfatty acid intake. During the 10 year follow-up of the GINIplus and LISAplus studiestotal cholesterol, HDL, LDL and triglycerides were measured. Six SNPs of the FADSgene cluster were genotyped and dietary fatty acid intake was assessed by FFQ. Inthis analysis, the in�uence of FADS variants on lipid concentrations in children wasevaluated.
2.3 Results
In the �rst publication (chapter 4) the in�uence of polymorphisms in the FADS1 FADS2gene cluster on the association between dietary fatty acid intake and atopic diseases andallergic sensitization was evaluated. Margarine intake was associated with an increasedrisk for asthma in individuals carrying the homozygous major allele. The ratio of n-3to n-6 fatty acids was related to higher hay fever risk, although this association wasnot signi�cant after adjustment for multiple testing. These results suggest that thee�ect of dietary fatty acid intake on atopic diseases might be modulated by the FADS1FADS2 genes in children.
In the second publication (chapter 5) the impact of variants of the FADS gene clusteron the association of breastfeeding and asthma was assessed. A strong, highly signif-icant interaction e�ect was identi�ed. Exclusive breastfeeding for at least 3 monthsshowed a protective e�ect in heterozygous and homozygous carriers of the minor allele,whereas no e�ect of exclusive breastfeeding was observed for individuals carrying thehomozygous major allele. These results suggest a modulating e�ect of the FADS1
FADS2 gene cluster on the association of the duration of exclusive breastfeeding andthe development of asthma in later life.
7

2 Speci�c Aims and Results
A meta-analysis of genome-wide association studies on atopic dermatitis identi�edthree new risk loci. Three polymorphisms reached genome-wide signi�cance in thecombined analysis of discovery and replication cohorts. Two of these loci are near genes,which are related to epidermal proliferation and di�erentiation (rs479844 upstream ofOVOL1 and rs2164983 near ACTL9). The third locus, rs2897442 in IL4�KIF3A lo-cated at 5q31.1, seems to be composed of two independent signals (IL4�KIF3A andIL13�RAD50), which contain cytokine and immune-related genes. Additionally, theassociation with the well-studied FLG locus and two signals which were recently iden-ti�ed by two GWA studies could be replicated. These results strengthen the hypothesis,that atopic dermatitis is caused by epidermal barrier abnormalities and immunologi-cal features. However, further research is needed to identify causal variants at theseloci and to understand the mechanisms through which they a�ect atopic dermatitis(chapter 6).
The fourth publication (chapter 7) aimed to describe regional di�erences between east-ern and western Germany and the association between dietary intake and the level ofparental education and equivalent income. A higher level of parental education wasassociated with a higher intake of healthy food, like bread, butter, eggs, pasta, vegeta-bles/salad and fruit, whereas intakes of margarine, meat products, pizza, desserts andsoft drinks were inversely associated with parental education. The association betweendietary intake and equivalent income was weaker. Additionally, substantial di�erencesin food intake between eastern and western Germany were observed. Therefore, nu-tritional education programs and dietary recommendations for school-aged childrenshould take these regional and socio-economic di�erences into account.
The association between blood lipid concentrations and variants of the FADS genecluster was investigated in the �fth publication (chapter 8). Individuals carrying thehomozygous minor allele were found to have lower levels of total cholesterol and LDLcompared to homozygous major allele carriers. Carriers of the heterozygous allele hadlower levels of HDL and higher levels of triglycerides compared to homozygous majorallele carriers. Additionally, the in�uence of dietary n-3 PUFA intake was tested. Ahigher intake of n-3 fatty acids was related to higher levels of total cholesterol, LDL,HDL and lower triglyceride levels. However, these associations did not interact withthe FADS1 FADS2 genotype. These results show, that total cholesterol, HDL, LDL,and triglyceride levels are in�uenced by the FADS gene cluster already in 10 yearold children. This might di�erentially predispose individuals to the development ofcardiovascular diseases later in life.
2.4 Strengths and Limitations
A detailed discussion of strengths and limitations can be found in the �ve publications.Here, a few major aspects will be brie�y summarized.
Dietary intake was assessed by a FFQ, which is generally believed to overestimatedietary intakes50. As an objective measurement, this FFQ was developed and validatedfor the speci�c aim to assess intake of n-3 and n-6 fatty acids. Thus, this developedFFQ for children goes beyond common used other FFQs. The FFQ measured dietary
8

2 Speci�c Aims and Results
intakes over the past 12 months and was validated for dietary fatty acid intake47. Fattyacid concentrations in blood at 10 years of age were not available so far.
Further, it should be considered, that �ve of the six SNPs from the FADS gene cluster,which were analyzed, were selected based on previous publications in adult popula-tions29,48. The SNPs are in high linkage disequilibrium with each other and do notcover the complete region of the FADS gene cluster.
A longitudinal analysis to identify age dependent di�erences is not possible due to alow prevalence especially of asthma in children up to 10 years of age. The de�nitionof asthma and allergies was based on questionnaire information on having a doctor'sdiagnosis for each year of live. A clinical ascertainment of these information in eachyear of life was beyond the scope of this study. However, the presence of speci�c IgEantibodies was measured at 6 and 10 years of age and blood lipid levels were measuredduring the 10 year follow-up.
Further, the results of the meta-analysis of genome-wide association studies on atopicdermatitis underline the importance of careful phenotyping. In this analysis, severalstudies with di�erences in case de�nition and age of onset were included and some locishowed evidence for heterogeneity. Additional sensitivity analyses on age of onset anda more stringent de�nition based on reported physician's diagnosis could partly explainthe heterogeneity.
9


3 Conclusion and Outlook
3 Conclusion and Outlook
This thesis aimed to investigate the association between dietary intake, the FADS1
FADS2 gene cluster and atopic phenotypes as well as lipids in children. An associationbetween dietary fatty acid intake, the FADS1 FADS2 gene cluster and allergies wasidenti�ed. Margarine intake was related with an increased risk for asthma in childrencarrying the homozygous major allele. Additionally, a protective e�ect of breastfeedingfor at least three months on the development of asthma later in life was observedin children carrying at least one minor allele, whereas there was no association forindividuals carrying the homozygous major allele. Further, it could be shown that totalcholesterol, HDL, LDL and triglyceride concentrations are associated with dietary n-3PUFA intake and variants in the FADS gene cluster already in 10-year-old children,although no interaction with dietary fatty acid intake was observed.
So far, the results from several studies, which have investigated the association be-tween dietary PUFA intake and atopic diseases, were not conclusive3,23. Although themechanism seems biological plausible, the evidence remains scarce. One reason forthis might be inter-individual genetic di�erences. In fact, the results presented in thisthesis indicate that individual di�erences in the fatty acid metabolism, in�uenced bythe FADS genes, may be partly responsible for these inconsistencies.
These individual di�erences in the fatty acid metabolism, presumably induced by theFADS genotype, may lead to di�erent nutritional requirements to ensure the necessaryfatty acid supply. A further investigation of the individual di�erences in the conversionof dietary fatty acid intake to longer chain, biological active metabolites against thebackground of the FADS genotype may enhance the knowledge about the underlyingmechanism. Therefore, it would be interesting to include as a further step the fattyacid composition in blood in further analyses.
The development and programming of the immune system is related to PUFA intakeduring pregnancy and lactation12,13. It is known, that the FADS genotype in�uences,upon PUFA levels in blood, the fatty acid composition of breast milk. Therefore, thesu�cient supply with PUFA of the mother during pregnancy and lactation is essentialfor the development. Moreover, it would be highly interesting to investigate the in�u-ence of the maternal genotype and thereby account for the variation of PUFA supplyduring pregnancy and lactation, which is caused by the maternal FADS genotype.
In summary, these results suggest that there is an association between the FADS genecluster, dietary fatty acid intake and atopic diseases or lipids in children. The clinicalrelevance of the FADS genotype itself is weak, because the percentage of varianceexplained is low and therefore cannot be used for prevention purposes, but these resultsmay help to identify possible biological pathways. Thereby, the hypothesis, that thereis a causal association between dietary fatty acid intake and atopic diseases or lipidsin children is supported. Therefore, the FADS genotype should be included in furtherstudies on PUFA and fatty acid related phenotypes and this may help to improveunderstanding the complex association between PUFAs and allergic in�ammation.
11


References
References
[1] World Allergy Organization, White Book on Allergy. 2011.
[2] P. N. Black and S. Sharpe, �Dietary fat and asthma: is there a connection?,� EurRespir J, vol. 10, pp. 6�12, Jan 1997.
[3] S. Sausenthaler, B. Koletzko, and J. Heinrich, �Dietary fat intake and allergicdiseases,� Current Nutrition & Food Science, vol. 2, no. 4, pp. 351�359, 2006.
[4] D. Moza�arian and J. H. Y. Wu, �Omega-3 fatty acids and cardiovascular dis-ease: e�ects on risk factors, molecular pathways, and clinical events.,� J Am Coll
Cardiol, vol. 58, pp. 2047�2067, Nov 2011.
[5] M. Y. Abeywardena and G. S. Patten, �Role of ω3 longchain polyunsaturated fattyacids in reducing cardio-metabolic risk factors.,� Endocr Metab Immune Disord
Drug Targets, vol. 11, pp. 232�246, Sep 2011.
[6] C. M. Milte, N. Sinn, and P. R. C. Howe, �Polyunsaturated fatty acid statusin attention de�cit hyperactivity disorder, depression, and Alzheimer's disease:towards an omega-3 index for mental health?,� Nutr Rev, vol. 67, pp. 573�590,Oct 2009.
[7] G. Kohlboeck, C. Glaser, C. Tiesler, H. Demmelmair, M. Standl, M. Romanos,et al., �E�ect of fatty acid status in cord blood serum on children's behavioraldi�culties at 10 y of age: results from the LISAplus Study.,� Am J Clin Nutr,vol. 94, pp. 1592�1599, Dec 2011.
[8] B. Koletzko, I. Cetin, J. T. Brenna, and for the Perinatal Lipid Intake WorkingGroup, �Dietary fat intakes for pregnant and lactating women.,� Br J Nutr, vol. 98,pp. 873�877, Nov 2007.
[9] J. E. Karr, J. E. Alexander, and R. G. Winningham, �Omega-3 polyunsaturatedfatty acids and cognition throughout the lifespan: a review.,� Nutr Neurosci,vol. 14, pp. 216�225, Sep 2011.
[10] M. M. Suárez-Varela, L. G.-M. Alvarez, M. D. Kogan, J. C. Ferreira, A. MartínezGimeno, I. Aguinaga Ontoso, et al., �Diet and prevalence of atopic eczema in 6to 7-year-old schoolchildren in Spain: ISAAC phase III.,� J Investig Allergol Clin
Immunol, vol. 20, no. 6, pp. 469�475, 2010.
[11] R. Barros, A. Moreira, J. Fonseca, L. Delgado, M. G. Castel-Branco, T. Haahtela,et al., �Dietary intake of α-linolenic acid and low ratio of n-6:n-3 PUFA areassociated with decreased exhaled NO and improved asthma control.,� Br J Nutr,vol. 106, pp. 441�450, Aug 2011.
[12] P. C. Calder, L.-S. Kremmyda, M. Vlachava, P. S. Noakes, and E. A. Miles, �Isthere a role for fatty acids in early life programming of the immune system?,�Proc Nutr Soc, vol. 69, pp. 373�380, Aug 2010.
13

References
[13] L.-S. Kremmyda, M. Vlachava, P. S. Noakes, N. D. Diaper, E. A. Miles, and P. C.Calder, �Atopy risk in infants and children in relation to early exposure to �sh, oily�sh, or long-chain omega-3 fatty acids: a systematic review.,� Clin Rev Allergy
Immunol, vol. 41, pp. 36�66, Aug 2011.
[14] B. E. Phillipson, D. W. Rothrock, W. E. Connor, W. S. Harris, and D. R. Illing-worth, �Reduction of plasma lipids, lipoproteins, and apoproteins by dietary �shoils in patients with hypertriglyceridemia.,� N Engl J Med, vol. 312, pp. 1210�1216, May 1985.
[15] L. Calabresi, B. Villa, M. Canavesi, C. R. Sirtori, R. W. James, F. Bernini, et al.,�An omega-3 polyunsaturated fatty acid concentrate increases plasma high-densitylipoprotein 2 cholesterol and paraoxonase levels in patients with familial combinedhyperlipidemia.,� Metabolism, vol. 53, pp. 153�158, Feb 2004.
[16] D. Moza�arian, R. Micha, and S. Wallace, �E�ects on coronary heart disease ofincreasing polyunsaturated fat in place of saturated fat: a systematic review andmeta-analysis of randomized controlled trials.,� PLoS Med, vol. 7, p. e1000252,Mar 2010.
[17] W. P. Newman, D. S. Freedman, A. W. Voors, P. D. Gard, S. R. Srinivasan, J. L.Cresanta, et al., �Relation of serum lipoprotein levels and systolic blood pressureto early atherosclerosis. The Bogalusa Heart Study.,� N Engl J Med, vol. 314,pp. 138�144, Jan 1986.
[18] G. S. Berenson, S. R. Srinivasan, W. Bao, W. P. Newman, R. E. Tracy, andW. A. Wattigney, �Association between multiple cardiovascular risk factors andatherosclerosis in children and young adults. The Bogalusa Heart Study.,� N Engl
J Med, vol. 338, pp. 1650�1656, Jun 1998.
[19] H. C. McGill, C. A. McMahan, A. W. Zieske, G. D. Sloop, J. V. Walcott, D. A.Troxclair, et al., �Associations of coronary heart disease risk factors with theintermediate lesion of atherosclerosis in youth. The Pathobiological Determinantsof Atherosclerosis in Youth (PDAY) Research Group.,� Arterioscler Thromb Vasc
Biol, vol. 20, pp. 1998�2004, Aug 2000.
[20] S. G. O. Johansson, T. Bieber, R. Dahl, P. S. Friedmann, B. Q. Lanier, R. F.Lockey, et al., �Revised nomenclature for allergy for global use: Report of theNomenclature Review Committee of the World Allergy Organization, October2003.,� J Allergy Clin Immunol, vol. 113, pp. 832�836, May 2004.
[21] D. Vercelli, �Discovering susceptibility genes for asthma and allergy.,� Nat Rev
Immunol, vol. 8, pp. 169�182, Mar 2008.
[22] M. F. Mo�att, I. G. Gut, F. Demenais, D. P. Strachan, E. Bouzigon, S. Heath,et al., �A large-scale, consortium-based genomewide association study of asthma.,�N Engl J Med, vol. 363, pp. 1211�1221, Sep 2010.
14
References
[23] A. Sala-Vila, E. A. Miles, and P. C. Calder, �Fatty acid composition abnormalitiesin atopic disease: evidence explored and role in the disease process examined.,�Clin Exp Allergy, vol. 38, pp. 1432�1450, Sep 2008.
[24] P. C. Calder, �Polyunsaturated fatty acids and in�ammation.,� Biochem Soc
Trans, vol. 33, pp. 423�427, Apr 2005.
[25] P. C. Calder, �n-3 polyunsaturated fatty acids, in�ammation, and in�ammatorydiseases.,� Am J Clin Nutr, vol. 83, pp. 1505S�1519S, Jun 2006.
[26] E. Lattka, T. Illig, B. Koletzko, and J. Heinrich, �Genetic variants of the FADS1FADS2 gene cluster as related to essential fatty acid metabolism.,� Curr Opin
Lipidol, vol. 21, pp. 64�69, Feb 2010.
[27] A. Marquardt, H. Stöhr, K. White, and B. H. Weber, �cDNA cloning, genomicstructure, and chromosomal localization of three members of the human fattyacid desaturase family.,� Genomics, vol. 66, pp. 175�183, Jun 2000.
[28] H. Blanchard, P. Legrand, and F. Pédrono, �Fatty Acid Desaturase 3 (Fads3) is asingular member of the Fads cluster.,� Biochimie, vol. 93, pp. 87�90, Jan 2011.
[29] L. Schae�er, H. Gohlke, M. Müller, I. M. Heid, L. J. Palmer, I. Kompauer, et al.,�Common genetic variants of the FADS1 FADS2 gene cluster and their recon-structed haplotypes are associated with the fatty acid composition in phospho-lipids.,� Hum Mol Genet, vol. 15, pp. 1745�1756, Jun 2006.
[30] L. Xie and S. M. Innis, �Genetic variants of the FADS1 FADS2 gene clusterare associated with altered (n-6) and (n-3) essential fatty acids in plasma anderythrocyte phospholipids in women during pregnancy and in breast milk duringlactation.,� J Nutr, vol. 138, pp. 2222�2228, Nov 2008.
[31] A. Baylin, E. Ruiz-Narvaez, P. Kraft, and H. Campos, �alpha-linolenic acid,Delta6-desaturase gene polymorphism, and the risk of nonfatal myocardial in-farction.,� Am J Clin Nutr, vol. 85, pp. 554�560, Feb 2007.
[32] G. Malerba, L. Schae�er, L. Xumerle, N. Klopp, E. Trabetti, M. Biscuola, et al.,�SNPs of the FADS gene cluster are associated with polyunsaturated fatty acidsin a cohort of patients with cardiovascular disease.,� Lipids, vol. 43, pp. 289�299,Apr 2008.
[33] C. Moltó-Puigmartí, J. Plat, R. P. Mensink, A. Müller, E. Jansen, M. P. Zeegers,et al., �FADS1 FADS2 gene variants modify the association between �sh intakeand the docosahexaenoic acid proportions in human milk.,� Am J Clin Nutr,vol. 91, pp. 1368�1376, May 2010.
[34] E. Lattka, P. Rzehak, E. Szabó, V. Jakobik, M. Weck, M. Weyermann, et al.,�Genetic variants in the FADS gene cluster are associated with arachidonic acidconcentrations of human breast milk at 1.5 and 6 mo postpartum and in�uencethe course of milk dodecanoic, tetracosenoic, and trans-9-octadecenoic acid con-centrations over the duration of lactation.,� Am J Clin Nutr, vol. 93, pp. 382�391,Feb 2011.
15

References
[35] B. Koletzko, E. Lattka, S. Zeilinger, T. Illig, and C. Steer, �Genetic variants of thefatty acid desaturase gene cluster predict amounts of red blood cell docosahex-aenoic and others polyunsaturated fatty acids in pregnant women: �ndings fromthe Avon Longitudinal Study of Parents and Children.,� Am J Clin Nutr, vol. 93,pp. 211�219, Jan 2011.
[36] Y. S. Aulchenko, S. Ripatti, I. Lindqvist, D. Boomsma, I. M. Heid, P. P. Pram-staller, et al., �Loci in�uencing lipid levels and coronary heart disease risk in 16European population cohorts.,� Nat Genet, vol. 41, pp. 47�55, Jan 2009.
[37] C. Sabatti, S. K. Service, A.-L. Hartikainen, A. Pouta, S. Ripatti, J. Brodsky,et al., �Genome-wide association analysis of metabolic traits in a birth cohortfrom a founder population.,� Nat Genet, vol. 41, pp. 35�46, Jan 2009.
[38] D. I. Chasman, G. Paré, S. Mora, J. C. Hopewell, G. Peloso, R. Clarke, et al.,�Forty-three loci associated with plasma lipoprotein size, concentration, andcholesterol content in genome-wide analysis.,� PLoS Genet, vol. 5, p. e1000730,Nov 2009.
[39] S. Kathiresan, C. J. Willer, G. M. Peloso, S. Demissie, K. Musunuru, E. E. Schadt,et al., �Common variants at 30 loci contribute to polygenic dyslipidemia.,� Nat
Genet, vol. 41, pp. 56�65, Jan 2009.
[40] N. M. G. De Silva, R. M. Freathy, T. M. Palmer, L. A. Donnelly, J. Luan, T. Gaunt,et al., �Mendelian randomization studies do not support a role for raised circulatingtriglyceride levels in�uencing type 2 diabetes, glucose levels, or insulin resistance.,�Diabetes, vol. 60, pp. 1008�1018, Mar 2011.
[41] E. Lattka, T. Illig, J. Heinrich, and B. Koletzko, �FADS gene cluster polymor-phisms: important modulators of fatty acid levels and their impact on atopicdiseases.,� J Nutrigenet Nutrigenomics, vol. 2, no. 3, pp. 119�128, 2009.
[42] E. Lattka, T. Illig, J. Heinrich, and B. Koletzko, �Do FADS genotypes enhance ourknowledge about fatty acid related phenotypes?,� Clin Nutr, vol. 29, pp. 277�287,Jun 2010.
[43] C. Glaser, E. Lattka, P. Rzehak, C. Steer, and B. Koletzko, �Genetic variationin polyunsaturated fatty acid metabolism and its potential relevance for humandevelopment and health.,� Matern Child Nutr, vol. 7 Suppl 2, pp. 27�40, Apr2011.
[44] A. von Berg, U. Krämer, E. Link, C. Bollrath, J. Heinrich, I. Brockow, et al.,�Impact of early feeding on childhood eczema: development after nutritional in-tervention compared with the natural course - the GINIplus study up to the ageof 6 years.,� Clin Exp Allergy, vol. 40, pp. 627�636, Apr 2010.
[45] J. Heinrich, G. Bolte, B. Hölscher, J. Douwes, I. Lehmann, B. Fahlbusch, et al.,�Allergens and endotoxin on mothers' mattresses and total immunoglobulin E incord blood of neonates.,� Eur Respir J, vol. 20, pp. 617�623, Sep 2002.
16

[46] B. M. Hartmann, S. Bell, A. Vásquez-Caicedo, A. Götz, J. Erhardt, and C. Brom-bach, Der Bundeslebensmittelschlüssel. German Nutrient Data Base. 2005.
[47] P. Stiegler, S. Sausenthaler, A. E. Buyken, P. Rzehak, D. Czech, J. Linseisen,et al., �A new FFQ designed to measure the intake of fatty acids and antioxidantsin children.,� Public Health Nutr, vol. 13, pp. 38�46, Jan 2010.
[48] P. Rzehak, J. Heinrich, N. Klopp, L. Schae�er, S. Ho�, G. Wolfram, et al., �Ev-idence for an association between genetic variants of the fatty acid desaturase 1fatty acid desaturase 2 (FADS1 FADS2) gene cluster and the fatty acid compo-sition of erythrocyte membranes.,� Br J Nutr, vol. 101, pp. 20�26, Jan 2009.
[49] A. Caspi, B. Williams, J. Kim-Cohen, I. W. Craig, B. J. Milne, R. Poulton, et al.,�Moderation of breastfeeding e�ects on the IQ by genetic variation in fatty acidmetabolism.,� Proc Natl Acad Sci U S A, vol. 104, pp. 18860�18865, Nov 2007.
[50] S. Robinson, K. Godfrey, C. Osmond, V. Cox, and D. Barker, �Evaluation of afood frequency questionnaire used to assess nutrient intakes in pregnant women.,�Eur J Clin Nutr, vol. 50, pp. 302�308, May 1996.
17


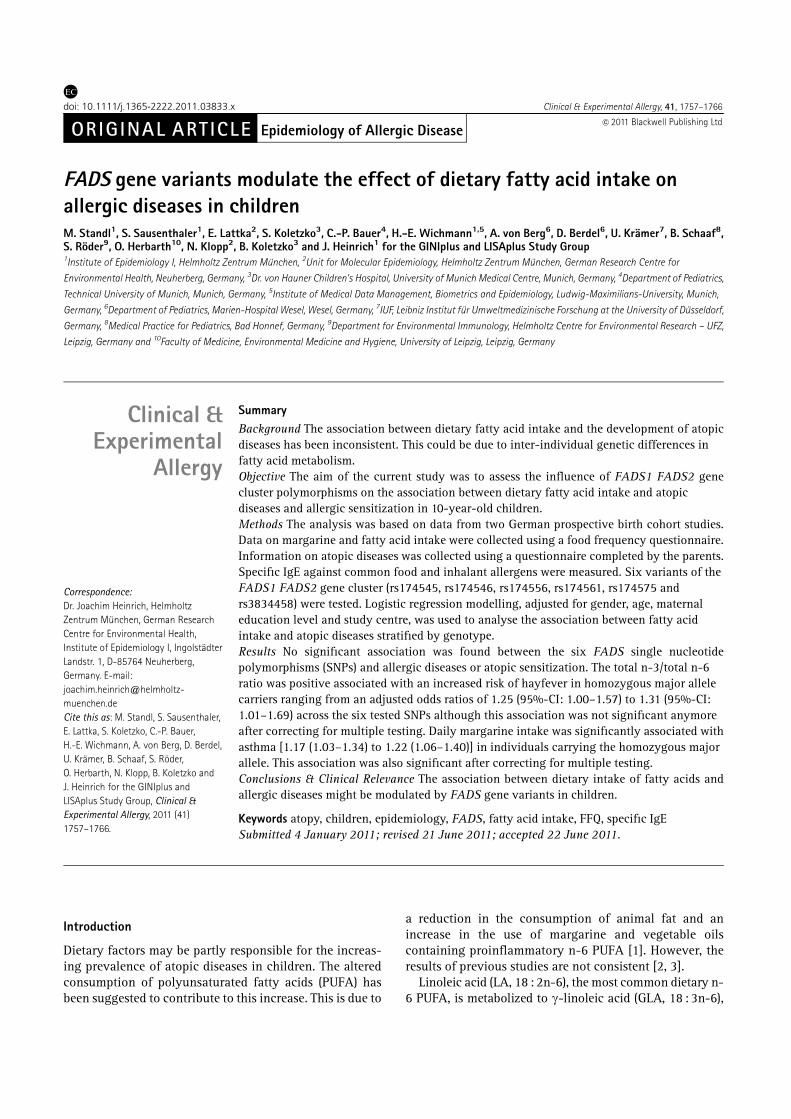
4 Paper 1: FADS Variants, Dietary Fatty AcidIntake and Atopic Diseases in Children(Standl et al. Clinical & Experimental Allergy, 2011)
Original title: FADS gene variants modulate the e�ect of dietary fatty acid intakeon allergic diseases in children.
Authors: M Standl, S Sausenthaler, E Lattka, S Koletzko, C-P Bauer, H-EWichmann, A von Berg, D Berdel, U Krämer, B Schaaf, S Röder, OHerbarth, N Klopp, B Koletzko, J Heinrich
Journal: Clinical & Experimental AllergyVolume: 41Pages: 1757�1766Year: 2011
Reproduced with permission from John Wiley and Sons.
19

ORIGINAL ARTICLE
FADS gene variants modulate the effect of dietary fatty acid intake onallergic diseases in childrenM. Standl1, S. Sausenthaler1, E. Lattka2, S. Koletzko3, C.-P. Bauer4, H.-E. Wichmann1,5, A. von Berg6, D. Berdel6, U. Kramer7, B. Schaaf8,S. Roder9, O. Herbarth10, N. Klopp2, B. Koletzko3 and J. Heinrich1 for the GINIplus and LISAplus Study Group1Institute of Epidemiology I, Helmholtz Zentrum Munchen, 2Unit for Molecular Epidemiology, Helmholtz Zentrum Munchen, German Research Centre for
Environmental Health, Neuherberg, Germany, 3Dr. von Hauner Children’s Hospital, University of Munich Medical Centre, Munich, Germany, 4Department of Pediatrics,
Technical University of Munich, Munich, Germany, 5Institute of Medical Data Management, Biometrics and Epidemiology, Ludwig-Maximilians-University, Munich,
Germany, 6Department of Pediatrics, Marien-Hospital Wesel, Wesel, Germany, 7IUF, Leibniz Institut fur Umweltmedizinische Forschung at the University of Dusseldorf,
Germany, 8Medical Practice for Pediatrics, Bad Honnef, Germany, 9Department for Environmental Immunology, Helmholtz Centre for Environmental Research – UFZ,
Leipzig, Germany and 10Faculty of Medicine, Environmental Medicine and Hygiene, University of Leipzig, Leipzig, Germany
Clinical &Experimental
Allergy
Correspondence:Dr. Joachim Heinrich, HelmholtzZentrum Munchen, German ResearchCentre for Environmental Health,Institute of Epidemiology I, IngolstadterLandstr. 1, D-85764 Neuherberg,Germany. E-mail:[email protected] this as: M. Standl, S. Sausenthaler,E. Lattka, S. Koletzko, C.-P. Bauer,H.-E. Wichmann, A. von Berg, D. Berdel,U. Kramer, B. Schaaf, S. Roder,O. Herbarth, N. Klopp, B. Koletzko andJ. Heinrich for the GINIplus andLISAplus Study Group, Clinical &Experimental Allergy, 2011 (41)1757–1766.
Summary
Background The association between dietary fatty acid intake and the development of atopicdiseases has been inconsistent. This could be due to inter-individual genetic differences infatty acid metabolism.Objective The aim of the current study was to assess the influence of FADS1 FADS2 genecluster polymorphisms on the association between dietary fatty acid intake and atopicdiseases and allergic sensitization in 10-year-old children.Methods The analysis was based on data from two German prospective birth cohort studies.Data on margarine and fatty acid intake were collected using a food frequency questionnaire.Information on atopic diseases was collected using a questionnaire completed by the parents.Specific IgE against common food and inhalant allergens were measured. Six variants of theFADS1 FADS2 gene cluster (rs174545, rs174546, rs174556, rs174561, rs174575 andrs3834458) were tested. Logistic regression modelling, adjusted for gender, age, maternaleducation level and study centre, was used to analyse the association between fatty acidintake and atopic diseases stratified by genotype.Results No significant association was found between the six FADS single nucleotidepolymorphisms (SNPs) and allergic diseases or atopic sensitization. The total n-3/total n-6ratio was positive associated with an increased risk of hayfever in homozygous major allelecarriers ranging from an adjusted odds ratios of 1.25 (95%-CI: 1.00–1.57) to 1.31 (95%-CI:1.01–1.69) across the six tested SNPs although this association was not significant anymoreafter correcting for multiple testing. Daily margarine intake was significantly associated withasthma [1.17 (1.03–1.34) to 1.22 (1.06–1.40)] in individuals carrying the homozygous majorallele. This association was also significant after correcting for multiple testing.Conclusions & Clinical Relevance The association between dietary intake of fatty acids andallergic diseases might be modulated by FADS gene variants in children.
Keywords atopy, children, epidemiology, FADS, fatty acid intake, FFQ, specific IgESubmitted 4 January 2011; revised 21 June 2011; accepted 22 June 2011.
Introduction
Dietary factors may be partly responsible for the increas-ing prevalence of atopic diseases in children. The alteredconsumption of polyunsaturated fatty acids (PUFA) hasbeen suggested to contribute to this increase. This is due to
a reduction in the consumption of animal fat and anincrease in the use of margarine and vegetable oilscontaining proinflammatory n-6 PUFA [1]. However, theresults of previous studies are not consistent [2, 3].
Linoleic acid (LA, 18 : 2n-6), the most common dietary n-6 PUFA, is metabolized to g-linoleic acid (GLA, 18 : 3n-6),
Epidemiology of Allergic Disease
�ECdoi: 10.1111/j.1365-2222.2011.03833.x Clinical & Experimental Allergy, 41, 1757–1766
�c 2011 Blackwell Publishing Ltd

which is converted to arachidonic acid (AA, 20 : 4n-6). AAcan act as substrate of inflammatory eicosanoids. N-3PUFAs are reported to have beneficial effects on allergicinflammation. a-Linolenic acid (ALA, 18 : 3n-3) can beconverted to the long-chain fatty acids eisosapentaenoicacid (EPA, 20 : 5n-3), docosapentaenoic acid (DPA,22 : 5n-3) and docosahexaenoic acid (DHA, 22 : 6n-3),using the same enzymatic pathway as n-6 PUFA. Thereby,n-3 PUFA can competitively inhibit the production of pro-inflammatory AA [4, 5]. This led to the hypothesis that n-6PUFA intake may enhance the development of allergicdiseases in susceptible individuals, mediated at leastpartly through an increase in IgE synthesis. In contrast,n-3 PUFA is suggested to have protective effects againstallergic diseases.
The genes fatty acid desaturase 1 and 2 (FADS1 andFADS2) encode the enzymes delta-5-desaturase and del-ta-6-desaturase, respectively, which are involved in thefatty acid metabolic pathway [6]. Several studies haveshown strong associations between the FADS gene clusterand fatty acid levels in serum phospholipids [7, 8], plasmaand adipose tissue samples [9], erythrocyte cell mem-branes [8, 10], breast milk [8] and red blood cell lipids[11]. Carriers of the minor allele exhibit increased levels ofdesaturase substrates and decreased levels of desaturaseproducts. This might arise from lowered transcriptionallevels or diminished conversion rates of the enzymes inindividuals carrying the minor alleles.
Inter-individual genetic differences in fatty acid meta-bolism might be one of the reasons for the inconsistentassociation between intake of fatty acids and atopicphenotypes [1, 12]. Therefore, we investigated, whetherthe association between fatty acid intake and atopicdiseases could be modified by genetic variants of theFADS gene cluster.
Methods
Study population
Data from two ongoing German birth cohort studies wereincluded in this investigation, the German LISAplus (Life-style Related Factors on the Immune System and theDevelopment of Allergies in Childhood) and GINIplus(German Infant Nutritional Intervention) studies. LISA-plus is a population based birth cohort study. A total of3097 neonates were recruited between 1997 and 1999 inMunich, Leipzig, Wesel and Bad Honnef. The participantswere not pre-selected based on family history of allergicdiseases [13]. A total of 5991 mothers and their newbornswere recruited into the GINIplus study between September1995 and June 1998 in Munich and Wesel. Infants with atleast one allergic parent and/or sibling were allocated tothe interventional study arm investigating the effect ofdifferent hydrolysed formulas for allergy prevention in
the first year of life [14]. All children without a familyhistory of allergic diseases and children whose parents didnot give consent for the intervention were allocated tothe non-interventional arm. Detailed descriptions of theLISAplus and GINIplus studies have been publishedelsewhere ([13] and [14], respectively).
In both studies only individuals with Caucasian Germandescent were included.
For both studies, approval by the local Ethics Commit-tees (Bavarian General Medical Council, University ofLeipzig, Medical Council of North-Rhine-Westphalia) andwritten consent from participant’s families were obtained.
Food frequency questionnaire (FFQ)
The FFQ was developed to measure children’s usual foodand nutrient intake over the past year, and more specifi-cally to estimate energy, fatty acid and antioxidant intakeat 10 years of age. The FFQ comprised a list of 82 fooditems accompanied by several questions about the pre-ferred fat and energy content of products, preparationmethods, diets and food preferences, buying habits anddietary supplement use. To estimate how often foods wereeaten by their child on average over the previous year,parents were asked to choose one of nine frequencycategories. In addition, common portion sizes were givenfor each food to enable an estimation of quantities. Forfoods which were difficult to describe in common house-hold measures, coloured photographs from the EuropeanProspective Investigation into Cancer and Nutrition (EPIC)study showing three different portion sizes were included[15]. The consumption frequencies and portion size esti-mates were converted to average consumption in gramsper day and linked to the German Nutrient Data Base (BLS)version II.3.1 [16]. The design of the FFQ, including theselection of the food item list, validation, and the calcula-tion of food and nutrient intake is described further byStiegler et al. [17].
For the present analysis, information on fatty acidintake and margarine consumption was used.
Genotyping
Six variants of the FADS1 FADS2 gene cluster (rs174545,rs174546, rs174556, rs174561, rs174575 and rs3834458)were typed. Five of these single nucleotide polymorphisms(SNPs) (rs174545, rs174546, rs174556, rs174561 andrs3834458) have been previously shown to be in stronglinkage disequilibrium (LD) with each other (r240.7,D’40.9) [7]. These five SNPs were selected based onprevious publications in adult populations [7, 18]. More-over, we included the SNP rs174575. In addition, applyingthe tagger server program (http://www.broadinstitute.org/mpg/tagger/) in combination with HapMap we found thatwith the three SNPs rs174545, rs174546 and rs174556 we
�c 2011 Blackwell Publishing Ltd, Clinical & Experimental Allergy, 41 : 1757–1766
1758 M. Standl et al

could tag 27 SNPs between basepair positions 61234329and 61372379 of FADS1 FADS2. The efficiency was 10.7fold although the two further SNPs rs174561 andrs3834458 could not be included as these are not includedin the hapmap database. Genotyping of SNPs was realizedwith the iPLEX (Sequenom, San Diego, CA, USA) methodby means of matrix assisted laser desorption ionization-time of flight mass spectrometry method (MALDI-TOF MS,Mass Array; Sequenom, San Diego, CA, USA) in onelaboratory according to the manufacturer’s instructions.Standard genotyping quality control included 10% dupli-cate and negative samples. Genotyping discordance ratewas below 0.3%.
Definition of outcome variables
Information on allergic diseases was collected using aself-administered questionnaire at 10 years of age com-pleted by the parents. The questions for physician-diag-nosed asthma, eczema or hayfever at age 6, 7, 8 or 9 wereused to define binary outcome variables for ever having adiagnose.
Allergic sensitization was defined by specific serum IgEconcentrations, which were assayed by the CAP-RASTFEIA system (Pharmacia Diagnostics, Freiburg, Germany)according to the manufacturer’s instructions. Screeningtests were used for testing allergic sensitization againstfood allergens (fx5: egg, cow milk, wheat, peanut, soy-bean, and codfish) and inhalant allergens (sx1: Dermato-phagoides pteronyssinus, cat, dog, rye, timothy grass,Cladosporium herbarum, birch, mugwort). The limit ofdetection for specific IgE was 0.35 kU/L. Children wereassigned as IgE positive, if their IgE values exceeded thedetection limit in at least one of both RAST tests.
Statistical analysis
Variables of interest were the ratio of n-3 (ALA1EPA1D-PA1DHA) to n-6 (LA1AA) fatty acids and daily margar-ine intake. Due to implausible values of the total n-3/totaln-6 ratio, eight subjects were excluded from this analysis.
To evaluate the differences between the genotypes astratified analysis was used.
Multiple logistic regression analysis was applied toestimate the adjusted odds ratios (aOR) with 95% con-fidence intervals (CI) for the association between fattyacid intake and the binary health outcomes asthma,hayfever, eczema and IgE positive. Statistical significancewas defined by a two-sided alpha level of 5%.
According to Nyholt [19], the number of effective lociof the six SNPs in the FADS gene cluster was computed as2. In order to correct for multiple testing, the alpha level isdivided by the two effective loci multiplied by the fourphenotypes, which leads to a corrected two-sided alphalevel of 0.63%.
The adjusted odds ratios are shown for interquartilerange (IQR) increase. Differences between both studieswere tested using Fisher’s exact test, Wilcoxon rank sumtest or Pearson’s chi-squared test.
Statistical power was calculated for both margarineconsumption and total n-3/total n-6 fatty acid intake.Owing to the distribution of the variables of interest, thefatty acid intake was log transformed and power calcula-tion was approximated with a two sample t-test regardingthe differences of the means in the group with atopicdiseases or allergic sensitization and the control group.
All models are adjusted for gender, age, maternaleducation level (low, medium and high) and study centre(Munich, Leipzig, Wesel and Bad Honnef).
Statistical analysis was performed using the statisticalsoftware R, version 2.9.1 (R Development Core Team,2009) [20]. For haplotype construction, haplo.em() fromthe package Haplo Stats, version 1.4.0 was used.
Results
Complete information on dietary fatty acid and margarineintake, FADS1 FADS2 genotype and allergic diseases wasavailable for 2000 children [1301 (65.05%) children fromthe GINIplus Study and 699 (34.95%) children from theLISAplus Study]. IgE data existed for 1703 of thesechildren [1102 (64.71%) children from the GINIplus Studyand 601 (35.29%) children from the LISAplus Study].
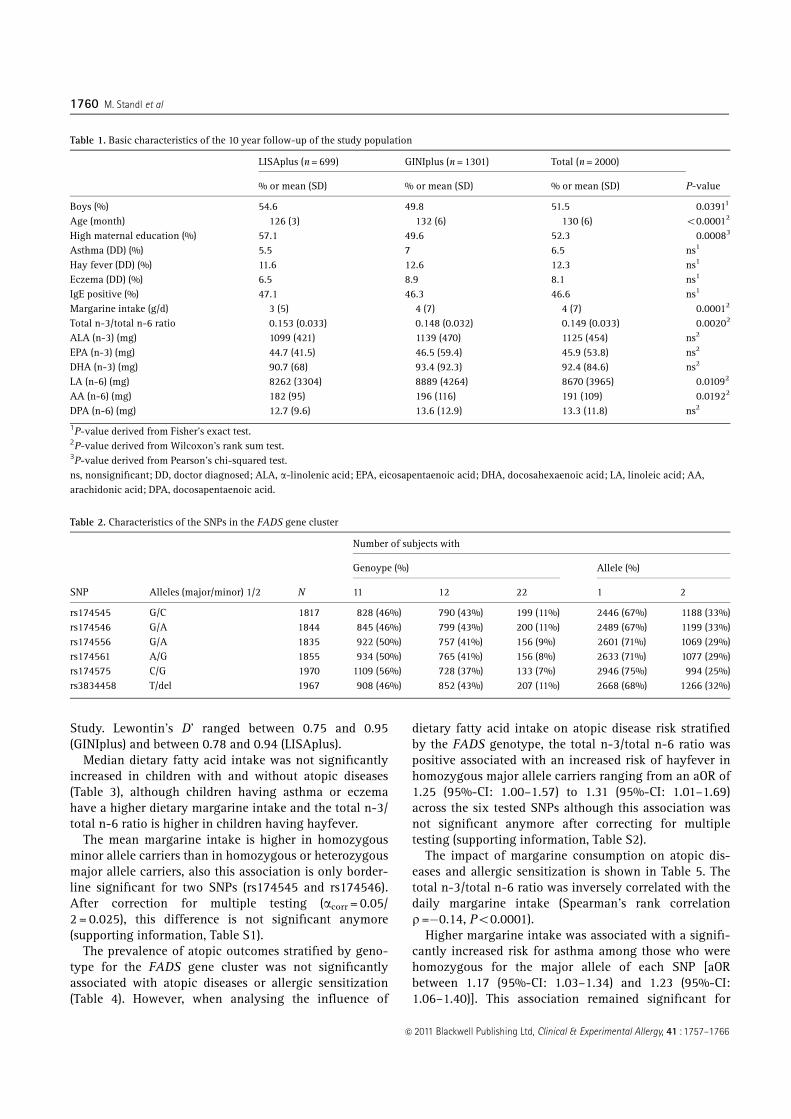
Basic characteristics of the study population are de-scribed in the tables. Children from the GINIplus Studywere on average older than children in the LISAplus Study(mean age difference of 6 months) (Table 1). Owing to theage difference, total nutrient and dietary fatty acid intakewas higher in children from the GINIplus Study. 52.3% ofthe cohort had mothers with education beyond 10th grade.The prevalence for atopic outcome variables ranged fromabout 6.5% for asthma to 46.6% for IgE positive. Themargarine intake and total n-3/total n-6 ratio were foundto be significantly different in the GINIplus and LISAplusStudy (P-value 0.0001 and 0.002, respectively). In theGINIplus Study, the intake of the fatty acids LA and AAwas significantly higher than in the LISAplus Study (P-value 0.0109 and 0.0192, respectively).
The genotype and allele frequencies of the six SNPswhich were included in the analysis are shown in Table 2.Five of the six SNPs (rs174545, rs174546, rs174556,rs174561 and rs3834458) are in high LD with each other(supporting information, Figure S1). For these five SNPs,the pairwise squared correlations r2 ranged between 0.82and 0.99 and Lewontin’s D’ ranged between 0.98 and 1 inthe GINIplus Study. For the LISAplus Study r2 rangedbetween 0.85 and 1 and D’ ranged between 0.99 and 1.
For rs174575, the LD is lower. The pairwise correlationr2 for this SNP ranged between 0.48 and 0.66 in theGINIplus Study and between 0.49 and 0.62 in the LISAplus
�c 2011 Blackwell Publishing Ltd, Clinical & Experimental Allergy, 41 : 1757–1766
FADS genes, fat intake and atopy 1759
Study. Lewontin’s D’ ranged between 0.75 and 0.95(GINIplus) and between 0.78 and 0.94 (LISAplus).
Median dietary fatty acid intake was not significantlyincreased in children with and without atopic diseases(Table 3), although children having asthma or eczemahave a higher dietary margarine intake and the total n-3/total n-6 ratio is higher in children having hayfever.
The mean margarine intake is higher in homozygousminor allele carriers than in homozygous or heterozygousmajor allele carriers, also this association is only border-line significant for two SNPs (rs174545 and rs174546).After correction for multiple testing (acorr = 0.05/2 = 0.025), this difference is not significant anymore(supporting information, Table S1).
The prevalence of atopic outcomes stratified by geno-type for the FADS gene cluster was not significantlyassociated with atopic diseases or allergic sensitization(Table 4). However, when analysing the influence of
dietary fatty acid intake on atopic disease risk stratifiedby the FADS genotype, the total n-3/total n-6 ratio waspositive associated with an increased risk of hayfever inhomozygous major allele carriers ranging from an aOR of1.25 (95%-CI: 1.00–1.57) to 1.31 (95%-CI: 1.01–1.69)across the six tested SNPs although this association wasnot significant anymore after correcting for multipletesting (supporting information, Table S2).
The impact of margarine consumption on atopic dis-eases and allergic sensitization is shown in Table 5. Thetotal n-3/total n-6 ratio was inversely correlated with thedaily margarine intake (Spearman’s rank correlationr=�0.14, Po0.0001).
Higher margarine intake was associated with a signifi-cantly increased risk for asthma among those who werehomozygous for the major allele of each SNP [aORbetween 1.17 (95%-CI: 1.03–1.34) and 1.23 (95%-CI:1.06–1.40)]. This association remained significant for
Table 1. Basic characteristics of the 10 year follow-up of the study population
LISAplus (n = 699) GINIplus (n = 1301) Total (n = 2000)
P-value% or mean (SD) % or mean (SD) % or mean (SD)
Boys (%) 54.6 49.8 51.5 0.03911
Age (month) 126 (3) 132 (6) 130 (6) o0.00012
High maternal education (%) 57.1 49.6 52.3 0.00083
Asthma (DD) (%) 5.5 7 6.5 ns1
Hay fever (DD) (%) 11.6 12.6 12.3 ns1
Eczema (DD) (%) 6.5 8.9 8.1 ns1
IgE positive (%) 47.1 46.3 46.6 ns1
Margarine intake (g/d) 3 (5) 4 (7) 4 (7) 0.00012
Total n-3/total n-6 ratio 0.153 (0.033) 0.148 (0.032) 0.149 (0.033) 0.00202
ALA (n-3) (mg) 1099 (421) 1139 (470) 1125 (454) ns2
EPA (n-3) (mg) 44.7 (41.5) 46.5 (59.4) 45.9 (53.8) ns2
DHA (n-3) (mg) 90.7 (68) 93.4 (92.3) 92.4 (84.6) ns2
LA (n-6) (mg) 8262 (3304) 8889 (4264) 8670 (3965) 0.01092
AA (n-6) (mg) 182 (95) 196 (116) 191 (109) 0.01922
DPA (n-6) (mg) 12.7 (9.6) 13.6 (12.9) 13.3 (11.8) ns2
1P-value derived from Fisher’s exact test.2P-value derived from Wilcoxon’s rank sum test.3P-value derived from Pearson’s chi-squared test.ns, nonsignificant; DD, doctor diagnosed; ALA, a-linolenic acid; EPA, eicosapentaenoic acid; DHA, docosahexaenoic acid; LA, linoleic acid; AA,arachidonic acid; DPA, docosapentaenoic acid.
Table 2. Characteristics of the SNPs in the FADS gene cluster
SNP Alleles (major/minor) 1/2 N
Number of subjects with
Genoype (%) Allele (%)
11 12 22 1 2
rs174545 G/C 1817 828 (46%) 790 (43%) 199 (11%) 2446 (67%) 1188 (33%)rs174546 G/A 1844 845 (46%) 799 (43%) 200 (11%) 2489 (67%) 1199 (33%)rs174556 G/A 1835 922 (50%) 757 (41%) 156 (9%) 2601 (71%) 1069 (29%)rs174561 A/G 1855 934 (50%) 765 (41%) 156 (8%) 2633 (71%) 1077 (29%)rs174575 C/G 1970 1109 (56%) 728 (37%) 133 (7%) 2946 (75%) 994 (25%)rs3834458 T/del 1967 908 (46%) 852 (43%) 207 (11%) 2668 (68%) 1266 (32%)
�c 2011 Blackwell Publishing Ltd, Clinical & Experimental Allergy, 41 : 1757–1766
1760 M. Standl et al
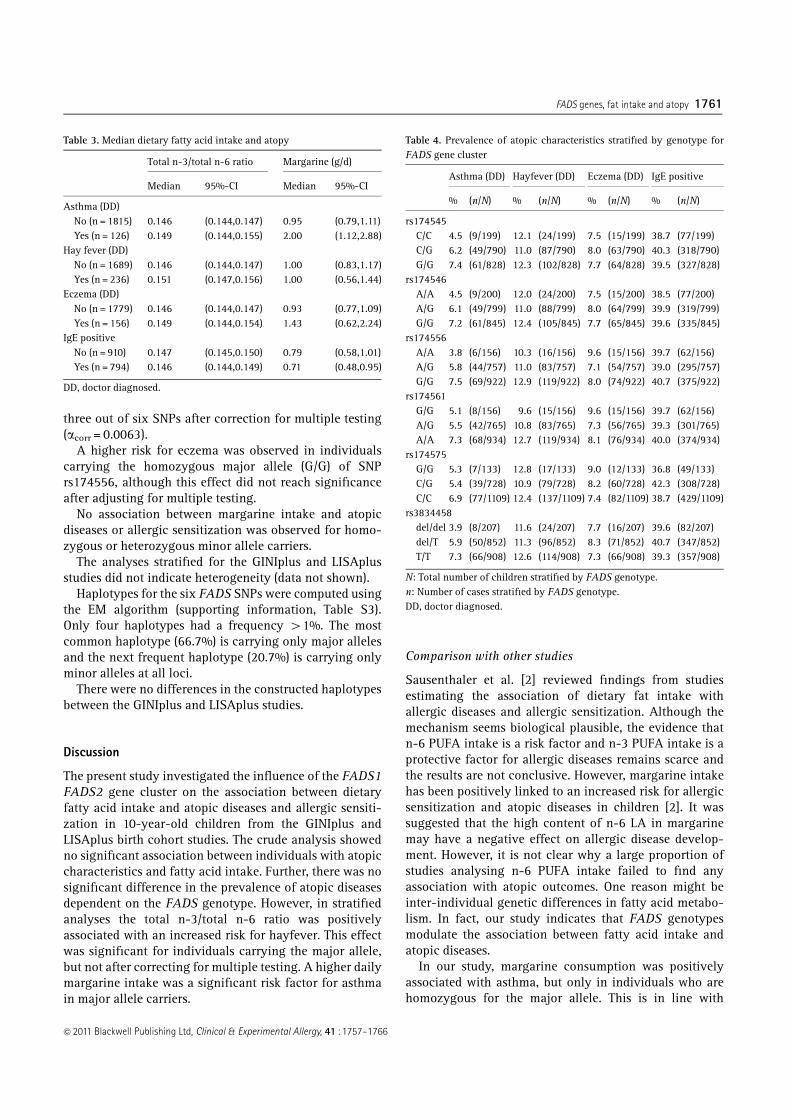
three out of six SNPs after correction for multiple testing(acorr = 0.0063).
A higher risk for eczema was observed in individualscarrying the homozygous major allele (G/G) of SNPrs174556, although this effect did not reach significanceafter adjusting for multiple testing.
No association between margarine intake and atopicdiseases or allergic sensitization was observed for homo-zygous or heterozygous minor allele carriers.
The analyses stratified for the GINIplus and LISAplusstudies did not indicate heterogeneity (data not shown).
Haplotypes for the six FADS SNPs were computed usingthe EM algorithm (supporting information, Table S3).Only four haplotypes had a frequency 41%. The mostcommon haplotype (66.7%) is carrying only major allelesand the next frequent haplotype (20.7%) is carrying onlyminor alleles at all loci.
There were no differences in the constructed haplotypesbetween the GINIplus and LISAplus studies.
Discussion
The present study investigated the influence of the FADS1FADS2 gene cluster on the association between dietaryfatty acid intake and atopic diseases and allergic sensiti-zation in 10-year-old children from the GINIplus andLISAplus birth cohort studies. The crude analysis showedno significant association between individuals with atopiccharacteristics and fatty acid intake. Further, there was nosignificant difference in the prevalence of atopic diseasesdependent on the FADS genotype. However, in stratifiedanalyses the total n-3/total n-6 ratio was positivelyassociated with an increased risk for hayfever. This effectwas significant for individuals carrying the major allele,but not after correcting for multiple testing. A higher dailymargarine intake was a significant risk factor for asthmain major allele carriers.
Comparison with other studies
Sausenthaler et al. [2] reviewed findings from studiesestimating the association of dietary fat intake withallergic diseases and allergic sensitization. Although themechanism seems biological plausible, the evidence thatn-6 PUFA intake is a risk factor and n-3 PUFA intake is aprotective factor for allergic diseases remains scarce andthe results are not conclusive. However, margarine intakehas been positively linked to an increased risk for allergicsensitization and atopic diseases in children [2]. It wassuggested that the high content of n-6 LA in margarinemay have a negative effect on allergic disease develop-ment. However, it is not clear why a large proportion ofstudies analysing n-6 PUFA intake failed to find anyassociation with atopic outcomes. One reason might beinter-individual genetic differences in fatty acid metabo-lism. In fact, our study indicates that FADS genotypesmodulate the association between fatty acid intake andatopic diseases.
In our study, margarine consumption was positivelyassociated with asthma, but only in individuals who arehomozygous for the major allele. This is in line with
Table 3. Median dietary fatty acid intake and atopy
Total n-3/total n-6 ratio Margarine (g/d)
Median 95%-CI Median 95%-CI
Asthma (DD)No (n = 1815) 0.146 (0.144,0.147) 0.95 (0.79,1.11)Yes (n = 126) 0.149 (0.144,0.155) 2.00 (1.12,2.88)
Hay fever (DD)No (n = 1689) 0.146 (0.144,0.147) 1.00 (0.83,1.17)Yes (n = 236) 0.151 (0.147,0.156) 1.00 (0.56,1.44)
Eczema (DD)No (n = 1779) 0.146 (0.144,0.147) 0.93 (0.77,1.09)Yes (n = 156) 0.149 (0.144,0.154) 1.43 (0.62,2.24)
IgE positiveNo (n = 910) 0.147 (0.145,0.150) 0.79 (0.58,1.01)Yes (n = 794) 0.146 (0.144,0.149) 0.71 (0.48,0.95)
DD, doctor diagnosed.
Table 4. Prevalence of atopic characteristics stratified by genotype forFADS gene cluster
Asthma (DD) Hayfever (DD) Eczema (DD) IgE positive
% (n/N) % (n/N) % (n/N) % (n/N)
rs174545C/C 4.5 (9/199) 12.1 (24/199) 7.5 (15/199) 38.7 (77/199)C/G 6.2 (49/790) 11.0 (87/790) 8.0 (63/790) 40.3 (318/790)G/G 7.4 (61/828) 12.3 (102/828) 7.7 (64/828) 39.5 (327/828)
rs174546A/A 4.5 (9/200) 12.0 (24/200) 7.5 (15/200) 38.5 (77/200)A/G 6.1 (49/799) 11.0 (88/799) 8.0 (64/799) 39.9 (319/799)G/G 7.2 (61/845) 12.4 (105/845) 7.7 (65/845) 39.6 (335/845)
rs174556A/A 3.8 (6/156) 10.3 (16/156) 9.6 (15/156) 39.7 (62/156)A/G 5.8 (44/757) 11.0 (83/757) 7.1 (54/757) 39.0 (295/757)G/G 7.5 (69/922) 12.9 (119/922) 8.0 (74/922) 40.7 (375/922)
rs174561G/G 5.1 (8/156) 9.6 (15/156) 9.6 (15/156) 39.7 (62/156)A/G 5.5 (42/765) 10.8 (83/765) 7.3 (56/765) 39.3 (301/765)A/A 7.3 (68/934) 12.7 (119/934) 8.1 (76/934) 40.0 (374/934)
rs174575G/G 5.3 (7/133) 12.8 (17/133) 9.0 (12/133) 36.8 (49/133)C/G 5.4 (39/728) 10.9 (79/728) 8.2 (60/728) 42.3 (308/728)C/C 6.9 (77/1109) 12.4 (137/1109) 7.4 (82/1109) 38.7 (429/1109)
rs3834458del/del 3.9 (8/207) 11.6 (24/207) 7.7 (16/207) 39.6 (82/207)del/T 5.9 (50/852) 11.3 (96/852) 8.3 (71/852) 40.7 (347/852)T/T 7.3 (66/908) 12.6 (114/908) 7.3 (66/908) 39.3 (357/908)
N: Total number of children stratified by FADS genotype.n: Number of cases stratified by FADS genotype.DD, doctor diagnosed.
�c 2011 Blackwell Publishing Ltd, Clinical & Experimental Allergy, 41 : 1757–1766
FADS genes, fat intake and atopy 1761

Tabl
e5.
Res
ults
oflo
gist
icre
gres
sion
mod
els
ofda
ilym
arga
rine
inta
kean
dat
opic
outc
omes
stra
tifi
edby
geno
type
rs17
4545
Mar
gari
ne(g
/d)
Mar
gari
ne(g
/d)
Mar
gari
ne(g
/d)
C/C
(n=
199)
C/G
(n=
790)
G/G
(n=
828)
aOR
IQR�
95%
-CI
P-v
alue
waO
RIQ
R�
95%
-CI
P-v
alue
waO
RIQ
R�
95%
-CI
P-v
alue
w
Ast
hma
(DD
)0.
47(0
.16,
1.40
)0.
1747
1.02
(0.8
3,1.
24)
0.86
901.
22(1
.06,
1.40
)0.
0051
Hay
feve
r(D
D)
1.19
(0.7
1,1.
99)
0.50
421.
04(0
.88,
1.23
)0.
6288
1.03
(0.8
9,1.
20)
0.68
17Ec
zem
a(D
D)
1.14
(0.7
4,1.
76)
0.54
131.
01(0
.83,
1.22
)0.
9586
1.12
(0.9
8,1.
28)
0.10
85Ig
Epo
sitive
1.07
(0.8
4,1.
36)
0.60
901.
10(0
.97,
1.24
)0.
1372
0.97
(0.8
8,1.
08)
0.63
03
rs17
4546
A/A
(n=
200)
A/G
(n=
799)
G/G
(n=
845)
aOR
IQR�
95%
-CI
P-v
alue
waO
RIQ
R�
95%
-CI
P-v
alue
waO
RIQ
R�
95%
-CI
P-v
alue
w
Ast
hma
(DD
)0.
47(0
.15,
1.44
)0.
1856
1.01
(0.8
3,1.
23)
0.93
321.
22(1
.06,
1.40
)0.
0051
Hay
feve
r(D
D)
1.19
(0.7
1,2.
00)
0.49
881.
04(0
.89,
1.23
)0.
5948
1.03
(0.8
8,1.
19)
0.72
86Ec
zem
a(D
D)
1.15
(0.7
5,1.
78)
0.51
730.
99(0
.82,
1.20
)0.
9440
1.12
(0.9
7,1.
28)
0.11
88Ig
Epo
sitive
1.09
(0.8
6,1.
40)
0.47
251.
08(0
.96,
1.22
)0.
1923
0.97
(0.8
7,1.
08)
0.55
37
rs17
4556
A/A
(n=
156)
A/G
(n=
757)
G/G
(n=
922)
aOR
IQR�
95%
-CI
P-v
alue
waO
RIQ
R�
95%
-CI
P-v
alue
waO
RIQ
R�
95%
-CI
P-v
alue
w
Ast
hma
(DD
)0.
79(0
.32,
1.97
)0.
6118
0.96
(0.7
7,1.
20)
0.72
861.
20(1
.05,
1.37
)0.
0073
Hay
feve
r(D
D)
0.75
(0.2
9,1.
92)
0.54
921.
09(0
.93,
1.28
)0.
2650
1.00
(0.8
6,1.
16)
0.98
31Ec
zem
a(D
D)
1.09
(0.7
1,1.
69)
0.68
580.
95(0
.76,
1.17
)0.
6116
1.15
(1.0
0,1.
31)
0.04
41Ig
Epo
sitive
1.03
(0.7
9,1.
33)
0.84
261.
08(0
.96,
1.22
)0.
2186
0.99
(0.8
9,1.
09)
0.78
87
rs17
4561
G/G
(n=
156)
A/G
(n=
765)
A/A
(n=
934)
aOR
IQR�
95%
-CI
P-v
alue
waO
RIQ
R�
95%
-CI
P-v
alue
waO
RIQ
R�
95%
-CI
P-v
alue
w
Ast
hma
(DD
)0.
67(0
.24,
1.84
)0.
4333
1.04
(0.8
5,1.
28)
0.68
801.
17(1
.03,
1.34
)0.
0194
Hay
feve
r(D
D)
0.76
(0.3
0,1.
96)
0.57
131.
09(0
.93,
1.27
)0.
2965
1.01
(0.8
7,1.
17)
0.94
37Ec
zem
a(D
D)
1.14
(0.7
4,1.
74)
0.56
020.
97(0
.80,
1.19
)0.
7957
1.12
(0.9
8,1.
28)
0.08
98Ig
Epo
sitive
1.02
(0.7
9,1.
33)
0.85
211.
09(0
.97,
1.23
)0.
1623
0.98
(0.8
8,1.
08)
0.65
12
�c 2011 Blackwell Publishing Ltd, Clinical & Experimental Allergy, 41 : 1757–1766
1762 M. Standl et al

previous studies [2]. Although the fatty acid intake wascalculated based on the dietary intake, we could not findany significant association between the total n-3/total n-6ratio and asthma. It is likely that the negative effect ofmargarine consumption on allergic diseases is not exclu-sively caused by the high content of n-6 fatty acids.
In contrast to the theory by Black and Sharpe [1], ahigher total n-3/total n-6 ratio did not show protectiveeffects on atopic diseases and allergic sensitization. Actu-ally, a higher total n-3/total n-6 ratio was linked to anincreased risk for hayfever in individuals carrying thehomozygous major allele. However, homozygous minorallele carriers also had an increased risk for hayfever, butthis was nonsignificant, possibly due to loss of power fromthe reduced sample size.
Molto-Puigmartı et al. [21] reported that FADS genevariants modify the association between fish intake andDHA contents in human milk lipids. The percentagecontribution of DHA to total milk lipids was similar inwomen with low fish intake for all genotypes, whereasDHA increased with higher fish consumption in carriers ofmajor but not of homozygous minor alleles. Lu et al. [22]examined the influence of the FADS1 genotype on theassociation between dietary intake of n-6 and n-3 PUFAsand plasma concentrations of total, HDL- and non-HDL-cholesterol. Significant associations were observed inmajor allele carriers, but only in the groups with highdietary intake of n-6 and n-3 PUFAs and not in the groupswith low intake. Both studies observed effects of a higherdietary intake only in individuals carrying the majorallele. In the current study we also found significanteffects only in homozygous major allele carriers.
In our study, margarine intake was positively associatedwith the development of atopic diseases. It was previouslysuggested that the high content of n-6 LA in margarine isassociated with allergic diseases and symptoms. LA is aprecursor of AA, which can act as a substrate of inflam-matory eicosanoids. Thirty percent of the variance of AAis explained by genetic predisposition. In individualscarrying the major allele of the FADS gene cluster, ahigher percentage of LA is metabolized to AA [7]. There-fore, it is hypothesized that the negative effect of margar-ine consumption on the development of atopic diseases isstronger in major allele carriers.
It is hypothesized that n-6 PUFA may increase the IgEsynthesis and thus enhance the development of allergicdiseases [4, 5]. Our data does not support this hypothesis.There was no association between fatty acid intake andincreased specific IgE against food or inhalant allergens.
While the association between FADS genotype andfatty acid composition in serum phospholipids or plasmais well established [6], the association between FADSvariants and atopic diseases is less clear. A study in adultsreported a decreased risk for allergic rhinitis and atopiceczema in minor allele carriers [7], although thers
1745
75
G/G
(n=
133)
C/G
(n=
728)
C/C
(n=
1109
)
aOR
IQR�
95%
-CI
P-v
alue
waO
RIQ
R�
95%
-CI
P-v
alue
waO
RIQ
R�
95%
-CI
P-v
alue
w
Ast
hma
(DD
)0.
68(0
.22,
2.11
)0.
4992
0.96
(0.7
7,1.
20)
0.71
921.
17(1
.03,
1.32
)0.
0165
Hay
feve
r(D
D)
1.45
(0.7
6,2.
76)
0.26
261.
07(0
.91,
1.24
)0.
4193
1.02
(0.8
9,1.
16)
0.78
01Ec
zem
a(D
D)
1.00
(0.5
1,1.
95)
0.99
911.
01(0
.85,
1.21
)0.
8880
1.07
(0.9
3,1.
22)
0.34
92Ig
Epo
sitive
1.00
(0.6
7,1.
49)
0.98
511.
04(0
.93,
1.16
)0.
5261
1.01
(0.9
2,1.
11)
0.78
64
rs38
3445
8
del/
del(
n=
207)
del/
T(n
=85
2)T/
T(n
=90
8)
aOR
IQR�
95%
-CI
P-v
alue
waO
RIQ
R�
95%
-CI
P-v
alue
waO
RIQ
R�
95%
-CI
P-v
alue
w
Ast
hma
(DD
)0.
57(0
.19,
1.69
)0.
3061
0.95
(0.7
7,1.
16)
0.60
531.
22(1
.07,
1.40
)0.
0036
Hay
feve
r(D
D)
1.19
(0.7
2,1.
96)
0.50
211.
07(0
.93,
1.23
)0.
3651
1.01
(0.8
7,1.
17)
0.89
17Ec
zem
a(D
D)
1.09
(0.7
1,1.
67)
0.69
990.
92(0
.75,
1.12
)0.
3900
1.14
(1.0
0,1.
30)
0.05
36Ig
Epo
sitive
1.00
(0.7
9,1.
28)
0.97
301.
09(0
.98,
1.22
)0.
1118
0.96
(0.8
6,1.
06)
0.42
27
� Odd
sra
tios
per
inte
rqua
rtile
rang
ein
crea
sead
just
edfo
rge
nder
,age
,mat
erna
ledu
cation
and
stud
yce
ntre
.IQ
R(M
arga
rine
(g/d
))=
4.29
g/d.
w 5%
sign
ifica
nce
leve
ladj
uste
dfo
rm
ultipl
ete
stin
g:a c
orr
=0.
0063
.D
D,d
octo
rdi
agno
sed.
�c 2011 Blackwell Publishing Ltd, Clinical & Experimental Allergy, 41 : 1757–1766
FADS genes, fat intake and atopy 1763

associations did not reach the significance level afteradjusting for multiple testing. Singmann et al. [23] in-vestigated the association between five SNPs in theFADS1 FADS2 gene cluster and doctor-diagnosed atopicdiseases in 6-year-old children from the GINIplus andLISAplus birth cohort studies. None of the atopic out-comes were associated with any of the SNPs. Rzehak et al.[24] combined data from the LISAplus study in Munichand the KOALA study in Dutch children. There were nosignificant association between FADS1 FADS2 variantsand parental reported eczema during the first 2 years oflife.
A review by Lattka et al. [25] reported a modulatingeffect of FADS genotypes on fatty acid related phenotypessuch as intelligence development, risk of myocardialinfarction and metabolic syndrome. This illustrates thatFADS genotypes have a modulating effect on fatty acidmetabolism and may explain the findings of this study.
The haplotype construction revealed four haplotypeswith frequencies 41%. The two most frequent haplotypesare the same haplotypes Schaeffer et al. [7] computed inthe 5-Locus haplotype analysis. The frequencies of thesetwo haplotypes were also very similar to the haplotypesprovided by Schaeffer et al. [7] (66.7% vs. 68.8% and20.7% vs. 25.7%).
Strength and limitations
Blood levels of the fatty acids LA and ALA and theirderivatives are influenced mainly by diet, but also bygenetic variants [26]. Consequently, we assessed bothdietary intake and the genotype. The FFQ used in thepresent study measured dietary intake over the past 12months. We could not measure fatty acid blood levels overa year due to study constraints, so it was not possible tocompare fatty acid intake to blood levels.
To evaluate the effect of the single FADS genotypes westratified the data by alleles for analysis. Owing to thisstratification the sample size was reduced, especially inthe group of homozygous minor allele carriers. Dependingon the different magnitudes of the prevalence of atopicoutcomes, the retrospective assessment of the statisticalpower was heterogeneous. Additionally, the analysedFADS variants do not cover the complete FADS genecluster as they were selected for genotyping based onprevious publications [7].
Population stratification is present in Northern Europe[27] and also in Germany [28]. Although only Caucasianswere included in both studies and the analyses wereadjusted for study centre, population substructure mightstill be present. Steffens et al. [28] observed only lowlevels of population sub-structuring within the Germanpopulation, therefore we do not think that a potentialpopulation substructure would affect our results substan-tially.
A major strength of our investigation compared withother studies is the assessment of the physician-diagnosedatopic diseases such as asthma, hayfever and eczema.Further, specific IgE against common food and inhalantallergens from blood samples were measured.
Conclusion and clinical relevance
The association between dietary intake of fatty acids andallergic diseases might be modulated by FADS genevariants in children.
Acknowledgements
This work was supported financially in part by the ‘Kom-petenznetz Adipositas’ (‘Competence Network Obesity’)funded by the German Federal Ministry of Education andResearch (FKZ: 01GI0826) and by the Munich Center ofHealth Sciences (MCHEALTH). The LISAplus study wasfunded by grants of the Federal Ministry for Education,Science, Research and Technology (Grant No. 01 EG 9705/2 and 01EG9732) and the 6 years follow-up of theLISAplus study was partly funded by the Federal Ministryof Environment (IUF, FKS 20462296). Berthold Koletzko isthe recipient of a Freedom to Discover Award of theBristol-Myers Squibb Foundation, New York, NY, USA.
ContributorsM. S. carried out the statistical analysis and wrote the
manuscript. J. H. and S. S. were involved in developmentof the statistical analysis plan and interpreting the results.E. L. and B. K. helped to interpret the results by revisingthe manuscript. N. K. performed the typing of the FADSvariants. S. K., C. P. B., H.-E. W., A. v. B., D. B., U. K., B. S.,S. R., O. H. and J. H. designed and/or conducted the studyand revised the manuscript. All authors had full access toall of the data in the study and can take responsibility forthe integrity of the data and the accuracy of the dataanalysis. All authors read and approved the final manu-script.
GINIplus Study Group and LISAplus Study GroupGINIplus Study GroupHelmholtz Zentrum Munchen, German Research Center
for Environmental Health, Institute of Epidemiology,Munich (Heinrich J, Wichmann HE, Sausenthaler S, Zuta-vern A, Chen, Chih-Mei, Schnappinger M, Rzehak P);Department of Pediatrics, Marien-Hospital, Wesel (BerdelD, von Berg A, Beckmann C, Groß I); Department ofPediatrics, Ludwig Maximilians University, Munich (Ko-letzko S, Reinhardt D, Krauss-Etschmann S); Departmentof Pediatrics, Technical University, Munich (Bauer CP,Brockow I, Grubl A, Hoffmann U); IUF – Institut furUmweltmedizinische Forschung at the Heinrich-Heine-University, Dusseldorf (Kramer U, Link E, Cramer C);Centre for Allergy and Environment, Technical University,Munich (Behrendt H).
�c 2011 Blackwell Publishing Ltd, Clinical & Experimental Allergy, 41 : 1757–1766
1764 M. Standl et al

LISAplus Study GroupHelmholtz Zentrum Munchen, German Research Center
for Environmental Health, Institute of Epidemiology,Munich (Heinrich J, Wichmann HE, Sausenthaler S, ChenCM, Schnappinger M); Department of Pediatrics, Munici-pal Hospital ‘St.Georg’, Leipzig (Borte M, Diez U), Marien-Hospital Wesel, Department of Pediatrics, Wesel (von BergA, Beckmann C, Groß I); Pediatric Practice, Bad Honnef(Schaaf B); Helmholtz Centre for Environmental Research– UFZ, Department of Environmental Immunology/CoreFacility Studies, Leipzig (Lehmann I, Bauer M, Grabsch C,Roder S, Schilde M); University of Leipzig, Institute of
Hygiene and Environmental Medicine, Leipzig (HerbarthO, Dick C, Magnus J); IUF – Institut fur Umweltmedizi-nische Forschung, Dusseldorf (Kramer U, Link E, CramerC); Technical University Munich, Department of Pedia-trics, Munich (Bauer CP, Hoffmann U); ZAUM – Center forAllergy and Environment, Technical University, Munich(Behrendt H, Grosch J, Martin F).
Conflicts of interestThe authors’ work was independent of the funders, who
had no role in the study design, analysis of data, writing ofthe manuscript, or decision to submit for publication.
References
1 Black PN, Sharpe S. Dietary fat andasthma: is there a connection? Eur Re-spir J 1997; 10:6–12.
2 Sausenthaler S, Koletzko B, Heinrich J.Dietary fat intake and allergic diseases.Curr Nutr Food Sci 2006; 2:351–9.
3 Sala-Vila A, Miles EA, Calder PC. Fattyacid composition abnormalities in atopicdisease: evidence explored and role inthe disease process examined. Clin ExpAllergy 2008; 38:1432–50.
4 Sprecher H. Biochemistry of essentialfatty acids. Prog Lipid Res 1981;20:13–22.
5 Calder PC, Miles EA. Fatty acids andatopic disease. Pediatr Allergy Immunol2000; 11 (Suppl 13):29–36.
6 Lattka E, Illig T, Koletzko B, Heinrich J.Genetic variants of the FADS1 FADS2gene cluster as related to essential fattyacid metabolism. Curr Opin Lipidol2010; 21:64–9.
7 Schaeffer L, Gohlke H, Muller M et al.Common genetic variants of the FADS1FADS2 gene cluster and their recon-structed haplotypes are associated withthe fatty acid composition in phospholi-pids. Hum Mol Genet 2006; 15:1745–56.
8 Xie L, Innis SM. Genetic variants of theFADS1 FADS2 gene cluster are asso-ciated with altered (n-6) and (n-3) essen-tial fatty acids in plasma and erythrocytephospholipids in women during preg-nancy and in breast milk during lacta-tion. J Nutr 2008; 138:2222–8.
9 Baylin A, Ruiz-Narvaez E, Kraft P, Cam-pos H. alpha-Linolenic acid, Delta6-de-saturase gene polymorphism, and therisk of nonfatal myocardial infarction.Am J Clin Nutr 2007; 85:554–60.
10 Malerba G, Schaeffer L, Xumerle L et al.SNPs of the FADS gene cluster are
associated with polyunsaturated fattyacids in a cohort of patients with cardio-vascular disease. Lipids 2008; 43:289–9.
11 Koletzko B, Lattka E, Zeilinger S, Illig T,Steer C. Genetic variants of the fatty aciddesaturase gene cluster predict amountsof red blood cell docosahexaenoic andother polyunsaturated fatty acids inpregnant women: findings from the avonlongitudinal study of parents and chil-dren. Am J Clin Nutr 2011; 93:211–9.
12 Lattka E, Illig T, Heinrich J, Koletzko B.FADS gene cluster polymorphisms: im-portant modulators of fatty acid levelsand their impact on atopic diseases. JNutrigenet Nutrigenom 2009; 2:119–28.
13 Heinrich J, Bolte G, Holscher B et al.Allergens and endotoxin on mothers’mattresses and total immunoglobulin Ein cord blood of neonates. Eur Respir J2002; 20:617–23.
14 von Berg A, Koletzko S, Grubl A et al.The effect of hydrolyzed cow’s milk for-mula for allergy prevention in the firstyear of life: the German Infant Nutri-tional Intervention Study, a randomizeddouble-blind trial. J Allergy Clin Immu-nol 2003; 111:533–40.
15 Bohlscheid-Thomas S, Hoting I, BoeingH, Wahrendorf J. Reproducibility andrelative validity of food group intake ina food frequency questionnaire devel-oped for the German part of the EPICproject. European Prospective Investiga-tion into Cancer and Nutrition. Int JEpidemiol 1997; 26 (Suppl 1):S59–S70.
16 Hartmann BM, Bell S, Vasquez-CaicedoAL, Gotz A, Erhardt J, Brombach C.. DerBundeslebensmittelschlussel. GermanNutrient Data Base. Karlsruhe. 2005
17 Stiegler P, Sausenthaler S, Buyken AE etal. A new FFQ designed to measure theintake of fatty acids and antioxidants in
children. Public Health Nutr 2010;13:38–46.
18 Rzehak P, Heinrich J, Klopp N et al.Evidence for an association betweengenetic variants of the fatty acid desa-turase 1 fatty acid desaturase 2 (FADS1FADS2) gene cluster and the fatty acidcomposition of erythrocyte membranes.Br J Nutr 2009; 101:20–6.
19 Nyholt DR. A simple correction for mul-tiple testing for single-nucleotide poly-morphisms in linkage disequilibriumwith each other. Am J Hum Genet 2004;74:765–9.
20 R Development Core Team. R: A Lan-guage and Environment for StatisticalComputing. Vienna, Austria; 2009. ISBN3-900051-07-0
21 Molto-Puigmartı C, Plat J, Mensink RP etal. FADS1 FADS2 gene variants modifythe association between fish intake andthe docosahexaenoic acid proportions inhuman milk. Am J Clin Nutr 2010;91:1368–76.
22 Lu Y, Feskens EJ, Dolle ME et al. Dietaryn-3 and n-6 polyunsaturated fatty acidintake interacts with FADS1 genetic var-iation to affect total and HDL-cholester-ol concentrations in the DoetinchemCohort Study. Am J Clin Nutr 2010;92:258–65.
23 Singmann P, Rzehak P, Berdel D, Wich-mann HE, Heinrich J. No associationbetween FADS polymorphisms and ato-pic diseases in children from the GINIand LISA birth cohorts. Allergy 2010;65:1627–9.
24 Rzehak P, Thijs C, Standl M et al. Var-iants of the FADS1 FADS2 gene cluster,blood levels of polyunsaturated fattyacids and eczema in children within thefirst 2 years of life. PLoS ONE 2010;5:e13261.
�c 2011 Blackwell Publishing Ltd, Clinical & Experimental Allergy, 41 : 1757–1766
FADS genes, fat intake and atopy 1765

25 Lattka E, Illig T, Heinrich J, Koletzko B.Do FADS genotypes enhance ourknowledge about fatty acid relatedphenotypes? Clin Nutr 2010; 29:277–8.
26 Glaser C, Heinrich J, Koletzko B. Role ofFADS1 and FADS2 polymorphisms in
polyunsaturated fatty acid metabolism.Metabolism 2010; 59:993–9.
27 Salmela E, Lappalainen T, Fransson Iet al. Genome-wide analysis of singlenucleotide polymorphisms uncovers po-pulation structure in Northern Europe.PLoS One 2008; 3:e3519.
28 Steffens M, Lamina C, Illig T et al. SNP-based analysis of genetic substructure inthe German population. Hum Hered 2006;62:20–9.
Supporting information
Additional Supporting Information may be found in theonline version of this article:
Figure S1. Pairwise LD pattern between the six SNPs in theFADS gene cluster measured by Lewontin’s D’ (a. LISAplusstudy, c. GINIplus study) and r2 (b. LISAplus study, d.GINIplus study).Table S1. Margarine intake [g/d] stratified by genotype.Table S2. Logistic regression analyses of total n-3/total n-6 ratio and atopic outcomes.
Table S3. Haplotype characteristics for the haplotypesconstructed based on the six SNPs in the FADS1 FADS2gene cluster with frequency 41%.
Please note: Wiley-Blackwell is not responsible for thecontent or functionality of any supporting materialssupplied by the authors. Any queries (other than missingmaterial) should be directed to the corresponding authorfor the article.
�c 2011 Blackwell Publishing Ltd, Clinical & Experimental Allergy, 41 : 1757–1766
1766 M. Standl et al

Paper 1: Supplementary Material
31


1
Supplementary Material
Supplementary Table S1 Margarine intake [g/d] stratified by genotype
Homozygous minor allele Heterozygous allele Homozygous
major allele p-value1
rs174545 Mean (25%Q.,75%Q.) 4.21 (0.08,4.71) 3.99 (0.00,4.57) 3.60 (0.00,4.03) 0.0469
rs174546 Mean (25%Q.,75%Q.) 4.12 (0.08,4.71) 4.04 (0.00,4.62) 3.59 (0.00,4.03) 0.0470
rs174556 Mean (25%Q.,75%Q.) 4.15 (0.08,4.43) 4.05 (0.00,4.86) 3.59 (0.00,4.00) 0.0951
rs174561 Mean (25%Q.,75%Q.) 3.97 (0.07,4.33) 4.11 (0.00,5.00) 3.60 (0.00,4.00) 0.1005
rs174575 Mean (25%Q.,75%Q.) 4.01 (0.14,4.71) 3.99 (0.00,4.41) 3.65 (0.00,4.13) 0.0859
rs3834458 Mean (25%Q.,75%Q.) 4.01 (0.07,4.45) 4.04 (0.00,4.57) 3.54 (0.00,4.00) 0.0838
1 p-value derived from Kruskal-Wallis test

2
Supplementary Table S2 Logistic regression analyses of total n-3/total n-6 ratio and atopic outcomes
rs174545 total n-3/total n-6 ratio total n-3/total n-6 ratio total n-3/total n-6 ratio
C/C (n=199) C/G (n=790) G/G (n=828) aORIQR
$ 95%-CI p-value$$ aORIQR$ 95%-CI p-value$$ aORIQR
$ 95%-CI p-value$$ Asthma (DD) 1.44 (0.51,4.06) 0.4948 0.97 (0.67,1.41) 0.8777 1.27 (0.91,1.75) 0.1567 Hay fever (DD) 1.46 (0.78,2.71) 0.2346 1.06 (0.80,1.41) 0.6862 1.29 (1.00,1.68) 0.0526 Eczema (DD) 1.89 (0.85,4.20) 0.1195 0.93 (0.67,1.30) 0.6795 0.98 (0.70,1.37) 0.9114 IgE positive 0.88 (0.57,1.35) 0.5610 0.91 (0.75,1.11) 0.3601 0.91 (0.74,1.10) 0.3245
rs174546
A/A (n=200) A/G (n=799) G/G (n=845) aORIQR
$ 95%-CI p-value$$ aORIQR$ 95%-CI p-value$$ aORIQR
$ 95%-CI p-value$$ Asthma (DD) 1.33 (0.47,3.73) 0.5873 0.98 (0.68,1.42) 0.9227 1.28 (0.92,1.77) 0.1375 Hay fever (DD) 1.46 (0.78,2.71) 0.2359 1.07 (0.81,1.42) 0.6444 1.31 (1.01,1.69) 0.0410 Eczema (DD) 1.84 (0.83,4.08) 0.1340 0.92 (0.67,1.28) 0.6348 0.97 (0.70,1.36) 0.8748 IgE positive 0.86 (0.56,1.32) 0.4852 0.93 (0.76,1.12) 0.4379 0.93 (0.76,1.12) 0.4398
rs174556
A/A (n=156) A/G (n=757) G/G (n=922) aORIQR
$ 95%-CI p-value$$ aORIQR$ 95%-CI p-value$$ aORIQR
$ 95%-CI p-value$$ Asthma (DD) 0.84 (0.23,3.12) 0.7995 0.93 (0.62,1.38) 0.7087 1.30 (0.96,1.75) 0.0903 Hay fever (DD) 1.32 (0.65,2.70) 0.4399 1.04 (0.77,1.40) 0.8118 1.31 (1.03,1.66) 0.0291 Eczema (DD) 1.88 (0.85,4.14) 0.1168 0.97 (0.68,1.38) 0.8700 0.94 (0.69,1.28) 0.6734 IgE positive 0.85 (0.53,1.35) 0.4804 0.96 (0.78,1.18) 0.7072 0.88 (0.74,1.06) 0.1876
rs174561
G/G (n=156) A/G (n=765) A/A (n=934) aORIQR
$ 95%-CI p-value$$ aORIQR$ 95%-CI p-value$$ aORIQR
$ 95%-CI p-value$$ Asthma (DD) 1.35 (0.47,3.92) 0.5795 0.85 (0.57,1.29) 0.4523 1.30 (0.96,1.76) 0.0879 Hay fever (DD) 1.50 (0.71,3.15) 0.2881 1.04 (0.77,1.41) 0.7800 1.30 (1.03,1.65) 0.0296 Eczema (DD) 1.97 (0.90,4.31) 0.0897 0.96 (0.68,1.36) 0.8260 0.94 (0.69,1.27) 0.6765 IgE positive 0.88 (0.55,1.40) 0.5908 0.99 (0.81,1.22) 0.9440 0.88 (0.74,1.06) 0.1814
rs174575
G/G (n=133) C/G (n=728) C/C (n=1109) aORIQR
$ 95%-CI p-value$$ aORIQR$ 95%-CI p-value$$ aORIQR
$ 95%-CI p-value$$ Asthma (DD) 1.00 (0.30,3.37) 0.9971 1.08 (0.72,1.62) 0.7172 1.18 (0.89,1.58) 0.2515 Hay fever (DD) 1.40 (0.68,2.91) 0.3616 1.06 (0.79,1.44) 0.6871 1.25 (1.00,1.57) 0.0518 Eczema (DD) 1.31 (0.56,3.08) 0.5302 0.95 (0.67,1.35) 0.7805 0.96 (0.72,1.29) 0.8039 IgE positive 0.87 (0.51,1.46) 0.5889 0.92 (0.75,1.13) 0.4409 0.94 (0.79,1.11) 0.4685
rs3834458
del/del (n=207) del/T (n=852) T/T (n=908) aORIQR
$ 95%-CI p-value$$ aORIQR$ 95%-CI p-value$$ aORIQR
$ 95%-CI p-value$$ Asthma (DD) 0.67 (0.22,2.07) 0.4853 1.08 (0.76,1.54) 0.6725 1.27 (0.93,1.73) 0.1309 Hay fever (DD) 1.46 (0.79,2.71) 0.2238 1.05 (0.80,1.38) 0.7171 1.29 (1.01,1.65) 0.0430 Eczema (DD) 1.74 (0.81,3.72) 0.1560 0.94 (0.69,1.28) 0.6712 0.95 (0.68,1.32) 0.7515 IgE positive 0.88 (0.58,1.33) 0.5348 0.92 (0.76,1.11) 0.3830 0.95 (0.79,1.14) 0.5780
$ Odds ratios per interquartile range increase adjusted for gender, age, maternal education and study centre. IQR(total n-3/total n-6 ratio) = 0.041
$$ 5% significance level adjusted for multiple testing: αcorr=0.0063 DD doctor diagnosed
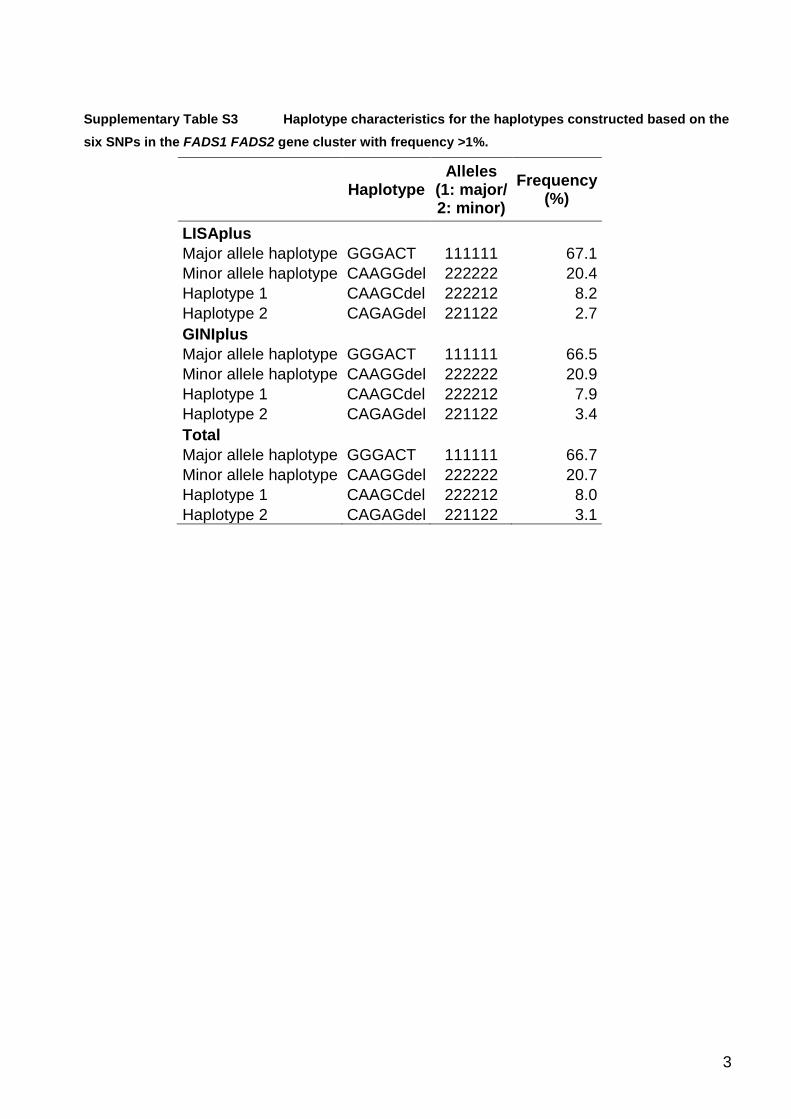
3
Supplementary Table S3 Haplotype characteristics for the haplotypes constructed based on the six SNPs in the FADS1 FADS2 gene cluster with frequency >1%.
Haplotype
Alleles (1: major/ 2: minor)
Frequency (%)
LISAplus Major allele haplotype GGGACT 111111 67.1
Minor allele haplotype CAAGGdel 222222 20.4 Haplotype 1 CAAGCdel 222212 8.2 Haplotype 2 CAGAGdel 221122 2.7 GINIplus
Major allele haplotype GGGACT 111111 66.5 Minor allele haplotype CAAGGdel 222222 20.9 Haplotype 1 CAAGCdel 222212 7.9 Haplotype 2 CAGAGdel 221122 3.4 Total
Major allele haplotype GGGACT 111111 66.7 Minor allele haplotype CAAGGdel 222222 20.7 Haplotype 1 CAAGCdel 222212 8.0 Haplotype 2 CAGAGdel 221122 3.1

4
Legend to Figure
Supplementary Figure 1
Pairwise LD pattern between the six SNPs in the FADS gene cluster measured by Lewontin’s D’
(a. LISAplus study, c. GINIplus study) and r² (b. LISAplus study, d. GINIplus study).

a b
c d
rs3834458rs174575rs174561rs174556rs174546rs174545
rs3834458rs174575rs174561rs174556rs174546rs174545
rs3834458rs174575rs174561rs174556rs174546rs174545
rs3834458rs174575rs174561rs174556rs174546rs174545

5 Paper 2: FADS Variants, ExclusiveBreastfeeding and Asthma in Children(Standl et al. Allergy, 2012)
Original title: FADS gene cluster modulates the e�ect of breastfeeding on asthma.Results from the GINIplus and LISAplus studies.
Authors: M Standl, S Sausenthaler, E Lattka, S Koletzko, C-P Bauer, H-EWichmann, A von Berg, D Berdel, U Krämer, B Schaaf, I Lehmann,O Herbarth, N Klopp, B Koletzko, J Heinrich
Journal: AllergyVolume: 67Pages: 83�90Year: 2012
Reproduced with permission from John Wiley and Sons.
39


ORIGINAL ARTICLE EPIDEMIOLOGY AND GENETICS
FADS gene cluster modulates the effect of breastfeedingon asthma. Results from the GINIplus and LISAplus studiesM. Standl1, S. Sausenthaler1, E. Lattka2, S. Koletzko3, C.-P. Bauer4, H.-E. Wichmann1,5, A. vonBerg6, D. Berdel6, U. Kramer7, B. Schaaf8, I. Lehmann9, O. Herbarth10, N. Klopp2, B. Koletzko3 &J. Heinrich1 for the GINIplus* and LISAplus� Study Group
1Helmholtz Zentrum Munchen, German Research Centre for Environmental Health, Institute of Epidemiology I, Neuherberg; 2Research Unit
of Molecular Epidemiology, Helmholtz Zentrum Munchen, German Research Centre for Environmental Health, Neuherberg; 3Dr. von Hauner
Children’s Hospital, University of Munich Medical Centre, Munich; 4Department of Pediatrics, Technical University of Munich, Munich;5Institute of Medical Data Management, Biometrics and Epidemiology, Ludwig Maximilians University, Munich; 6Department of Pediatrics,
Marien-Hospital Wesel, Wesel; 7IUF – Leibniz-Institut fur umweltmedizinische Forschung, Dusseldorf; 8Medical Practice for Pediatrics, Bad
Honnef; 9UFZ – Helmholtz Centre for Environmental Research, Department for Environmental Immunology, Leipzig; 10Faculty of Medicine,
University of Leipzig, Environmental Medicine and Hygiene, Leipzig, Germany
To cite this article: Standl M, Sausenthaler S, Lattka E, Koletzko S, Bauer C-P, Wichmann H-E, von Berg A, Berdel D, Kramer U, Schaaf B, Lehmann I, Herbarth
O, Klopp N, Koletzko B, Heinrich J For the GINIplus and LISAplus study Group. FADS gene cluster modulates the effect of breastfeeding on asthma. Results from
the GINIplus and LISAplus studies. Allergy 2012; 67: 83–90.
Breastfeeding (BF) is widely recognized to have beneficial
effects on asthma and atopy (1), although not all results are
conclusive (2) and the underlying biological mechanism is not
entirely clear. Among other factors in breast milk, the com-
position of polyunsaturated fatty acids (PUFA) of breast
milk has been proposed to cause the protective effect (3).
Linoleic acid (LA, 18:2n-6), the most common dietary n-6
PUFA, is metabolized to arachidonic acid (AA, 20:4n-6).
Arachidonic acid can act as substrate of inflammatory eico-
sanoids. Eicosapentaenoic acid (EPA, 20:5n-3) and docosa-
hexaenoic acid (DHA, 22:6n-3), products of the metabolism
of the essential n-3 fatty acid a-linolenic acid (ALA,
Keywords
asthma; breastfeeding; children;
epidemiology; FADS.
Correspondence
Dr. Joachim Heinrich, Helmholtz
Zentrum Munchen, German Research
Centre for Environmental Health, Institute of
Epidemiology I, Ingolstadter Landstr. 1,
D-85764 Neuherberg, Germany.
Tel.: +498931874150
Fax: +498931873380
E-mail: joachim.heinrich@helmholtz-
muenchen.de
Accepted for publication 13 August 2011
DOI:10.1111/j.1398-9995.2011.02708.x
Edited by: Marek Sanak
*The GINIplus Study Group, see Acknowl-
edgements. �The LISAplus Study Group,
see Acknowledgements.
Abstract
Background: The protective effect of breastfeeding (BF) on the development of
asthma has been widely recognized, even if not all results have been consistent.
Gene variants of the FADS gene cluster have a major impact on fatty acid composi-
tion in blood and in breast milk. Therefore, we evaluated the influence of the
FADS1 FADS2 gene cluster polymorphisms on the association between BF and
asthma.
Methods: The analysis was based on data (N = 2245) from two German prospective
birth cohort studies. Information on asthma and BF during the first 6 months was
collected using questionnaires completed by the parents. Logistic regression model-
ling was used to analyse the association between exclusive BF and ever having
asthma stratified by genotype.
Results: In the stratified analyses, BF for 3 or 4 months after birth had a protective
effect for heterozygous and homozygous carriers of the minor allele (adjusted odds
ratio between 0.37 (95% CI: 0.18–0.80) and 0.42 (95% CI: 0.20–0.88). Interaction
terms of BF with genotype were significant and ranged from )1.17 (P-value: 0.015)
to )1.33 (0.0066). Moreover, heterozygous and homozygous carriers of the minor
allele who were exclusively breastfed for 5 or 6 months after birth had a reduced
risk of asthma [0.32 (0.18–0.57) to 0.47 (0.27–0.81)] in the stratified analyses. For
individuals carrying the homozygous major allele, BF showed no significant effect
on the development of asthma.
Conclusions: The association between exclusive BF and asthma is modified by the
genetic variants of FADS genotypes in children.
Allergy
Allergy 67 (2012) 83–90 ª 2011 John Wiley & Sons A/S 83

18:3n-3), have been suggested to have beneficial effects on
allergic inflammation. n-6 and n-3 fatty acids use the same
enzymatic pathway (4, 5). This led to the hypothesis that
n-6 PUFA intake may enhance the development of allergic
diseases in susceptible individuals. In contrast, n-3 PUFA
are suggested to have protective effects against allergic dis-
eases (6).
The fatty acid desaturase 1 and 2 genes (FADS1 and
FADS2) encode the enzymes delta-5-desaturase and delta-6-
desaturase, respectively, which regulate the conversion of the
precursor essential fatty acids to long chain metabolites (7).
Several studies have shown strong associations between the
FADS gene cluster and fatty acid levels in serum phospholip-
ids (8, 9), plasma and adipose tissue samples (10), erythrocyte
cell membranes (9, 11), breast milk (9, 12, 13) and red blood
cell lipids (14). Carriers of the minor allele exhibit increased
levels of desaturase substrates and decreased levels of desat-
urase products. This might arise from lowered transcriptional
levels or diminished conversion rates of the enzymes in indi-
viduals carrying the minor alleles.
Inter-individual genetic differences in fatty acid metabo-
lism might be one of the reasons for the controversial associ-
ation between BF and atopic phenotypes (3). Therefore, we
investigated whether the association between exclusive BF
and later development of asthma could be modified by
genetic variants of the FADS gene cluster.
Methods
Study population
Data from two ongoing German birth cohort studies were
included in this investigation, the German LISAplus (Life-
style Related Factors on the Immune System and the
Development of Allergies in Childhood) and GINIplus
(German Infant Nutritional Intervention) studies. LISAplus
is a population-based birth cohort study. A total of 3097
neonates were recruited between 1997 and 1999 in Munich,
Leipzig, Wesel and Bad Honnef. The participants were not
preselected based on family history of allergic diseases (15).
A total of 5991 mothers and their newborns were recruited
to the GINIplus study between September 1995 and June
1998 in Munich and Wesel. Infants with at least one aller-
gic parent and/or sibling were allocated to the intervention-
al study arm investigating the effect of different hydrolysed
formulas for allergy prevention in the first year of life (16).
All children without a family history of allergic diseases
and children whose parents did not give consent for the
intervention were allocated to the noninterventional arm.
Detailed descriptions of the LISAplus and GINIplus stud-
ies have been published elsewhere [(15) and (16), respec-
tively].
In both studies, only individuals with Caucasian German
descent were included.
For both studies, approval by the local ethics committees
(Bavarian Board of Physicians, University of Leipzig, Board
of Physicians of North-Rhine-Westphalia) and written con-
sent from participant’s families were obtained.
Definition of exclusive breastfeeding
Questions on infant feeding during the first 6 months of life
were answered by the parents during the 1-year follow-up in
the GINIplus study and during the 6-month follow-up in the
LISAplus study. The parents were asked for each of the first
6 months of life whether the newborns were exclusively
breastfed, exclusively bottle-fed or both breastfed and bottle-
fed. Mutually exclusive categories were built based on the
number of months the children were exclusively breastfed
after birth (no exclusive BF, up to 2 months, up to 4 months
or more than 4 months of exclusive BF). Children who were
exclusively bottle-fed or mixed breastfed and bottle-fed were
categorized as the reference group ‘No exclusive BF’ to reach
sufficient numbers for the reference group.
Genotyping
Six single-nucleotide polymorphisms (SNPs) of the FADS1
FADS2 gene cluster (rs174545, rs174546, rs174556, rs174561,
rs174575 and rs3834458) were typed. Five of these variants
(rs174545, rs174546, rs174556, rs174561 and rs3834458) have
been previously shown to be in strong linkage disequilibrium
(LD) with each other (r2 > 0.7, D’ > 0.9) (8). These five
SNPs were selected based on the previous publications in
adult populations (8, 17). Moreover, we included the SNP
rs174575. In addition, applying the tagger server program
(http://www.broadinstitute.org/mpg/tagger/) in combination
with HapMap, we found that with the three SNPs rs174545,
rs174546 and rs174556 we could tag 27 SNPs between base
pair positions 61234329 and 61372379 of FADS1 FADS2.
The efficiency was 10.7-fold although the two further SNPs
rs174561 and rs3834458 could not be included as these are
not included in the HapMap database. Genotyping of SNPs
was realized with the iPLEX (Sequenom, San Diego, CA,
USA) method by means of matrix-assisted laser desorption
ionization–time of flight mass spectrometry method
(MALDI-TOF MS, Mass Array; Sequenom) in one labora-
tory according to the manufacturer’s instructions. Standard
genotyping quality control included 10% duplicate and nega-
tive samples. Genotyping discordance rate was below 0.3%.
Definition of outcome variables
Information on ever having physician-diagnosed asthma was
collected using self-administered questionnaires completed by
the parents. The questionnaires were completed at 6, 12, 18
and 24 months and 4, 5, 6 and 10 years of age in the LISA-
plus study and 1, 2, 3, 4, 6 and 10 years in the GINIplus
study. Each questionnaire asked for information pertaining
to the timeframe since the previous follow-up. Based on these
questions for asthma for each year of age up to 10 years, a
binary outcome variable for ever having a diagnosis was
defined. Blood was collected at age 6 and 10 years. Specific
serum IgE concentrations were assayed by the CAP-RAST
FEIA system (Pharmacia Diagnostics, Freiburg, Germany)
according to the manufacturer’s instructions. Screening tests
were used to test allergic sensitization against food allergens
FADS genes, breastfeeding and asthma Standl et al.
84 Allergy 67 (2012) 83–90 ª 2011 John Wiley & Sons A/S

(fx5: egg, cow milk, wheat, peanut, soybean and codfish) and
inhalant allergens (sx1: Dermatophagoides pteronyssinus, cat,
dog, rye, timothy grass, Cladosporium herbarum, birch and
mugwort). The limit of detection for allergen-specific IgE was
0.35 kU/l.
Atopic asthma was defined as ever having physician-diag-
nosed asthma and having an IgE value exceeding the detection
limit in at least one of both RAST tests at 6 or 10 years of age.
Nonatopic asthma was defined as ever having physician-diag-
nosed asthma and having an IgE value below the detection
limit in both RAST tests administered at 6 and 10 years of age.
Statistical analysis
Preliminary analyses showed similar results for the homozy-
gous and heterozygous minor allele carriers. Therefore, we
assumed a dominant model and compared homozygous or
heterozygous minor allele carriers with homozygous major
allele carriers.
Multiple logistic regression analysis stratified by genotype
was applied to estimate the adjusted odds ratios (aOR) with
95% confidence intervals (CI) for the association between
exclusive BF and asthma. Additionally, the interaction
between FADS genotype and category of BF was tested.
Statistical significance was defined by a two-sided alpha
level of 5%. According to Nyholt (18), the number of effec-
tive loci of the six SNPs in the FADS gene cluster was com-
puted as 2. To correct for multiple testing, the alpha level is
divided by the number of effective loci, which leads to a cor-
rected two-sided alpha level of 5%/2 = 2.5%.
All models are adjusted for gender, age, maternal educa-
tion level (low, medium and high), study centre (Munich,
Leipzig, Wesel and Bad Honnef), presence of older siblings
(yes/no) and study (GINI intervention, GINI noninterven-
tion, LISA). In bivariate analyses, testing was performed
using Pearson’s chi-squared test. Statistical analysis was per-
formed using the statistical software R, version 2.13.1 (http://
www.R-project.org) (19).
Results
Complete information on BF, FADS1 FADS2 genotype and
asthma was available for 2245 children [1456 (65%) children
from the GINIplus study and 789 (35%) children from the
LISAplus study]. Basic characteristics of the study population
are presented in Table 1. Forty-nine per cent of the neonates
were exclusively breastfed for at least 5 months after birth.
The prevalence for doctor-diagnosed asthma up to 10 years
of age is in total 11%.
The genotype and allele frequencies of the six SNPs that
were included in the analysis are shown in Table 2. Five of
the six SNPs (rs174545, rs174546, rs174556, rs174561 and
rs3834458) are in high LD with each other. For these five
SNPs, the pairwise squared correlations r2 ranged between
0.84 and 0.99 and Lewontin’s D’ ranged between 0.99 and 1.
For rs174575, the LB is lower. The pairwise correlation r2 for
this SNP ranged between 0.49 and 0.64 and Lewontin’s D’
ranged between 0.77 and 0.95.
The association between asthma and exclusive BF is
presented in Table 3. Asthma prevalence is decreasing with
increasing duration of exclusive BF (P = 0.0172). Table 4
shows the asthma prevalence stratified by genotype. The
asthma prevalence is lower in minor allele carriers than in
homozygous major allele carriers, although this effect is non-
significant.
Figure 1 shows the association between asthma prevalence
and the number of months of exclusive BF stratified by geno-
type for each of the six SNPs. The asthma prevalence is
reduced in children who were exclusively breastfed for at
least 3 months and are carrying the minor allele, whereas no
effect is observed in homozygous major allele carriers.
The results of logistic regression models of exclusive BF
on asthma stratified by genotype show similar effects
(Table 5). Individuals carrying the minor allele have a signifi-
cant decreased asthma risk if they are exclusively breastfed
for 3 or 4 months [aOR between 0.37 (95% CI: 0.18–0.80)
and 0.42 (95% CI: 0.20–0.88)] or more than 5 months [0.32
(0.18–0.57) to 0.47 (0.27–0.81)]. These associations remained
significant after correction for multiple testing
(acorr = 0.025).
In children carrying at least one minor allele of the FADS
variants rs174545, rs174546, rs174556, rs174561 and
rs3834458, asthma risk reduction is strongest for exclusive
BF for 3 or 4 months after birth. Only for minor allele carri-
ers of one SNP, rs174575, the asthma risk is further
decreased for further extended exclusive BF. Additionally,
adjusting for parental atopy did not modify these associa-
tions substantially.
The results of a stratified analysis for atopic (Supplemen-
tary Table S2) and nonatopic asthma (Supplementary Table
S3) did not change substantially. In an additional model, the
Table 1 Basic characteristics of the study population
LISAplus
(n = 789)
GINIplus
(n = 1456)
Total
(n = 2245)
Boys 56% 50% 52%
Intervention group 0% 50% 32%
High maternal
education
58% 50% 53%
Presence of
older siblings
47% 48% 48%
Study centre
Munchen 53% 56% 55%
Leipzig 25% 0% 9%
Bad Honnef 13% 0% 5%
Wesel 9% 44% 32%
Breastfeeding (BF)
Number of months
of exclusive BF
18% 26% 23%
1–2 13% 11% 12%
3–4 18% 16% 17%
5–6 51% 47% 48%
Asthma (DD) 9% 12% 11%
Atopic asthma (DD) 7% 8% 8%
Nonatopic asthma (DD) 1% 3% 2%
Standl et al. FADS genes, breastfeeding and asthma
Allergy 67 (2012) 83–90 ª 2011 John Wiley & Sons A/S 85

interaction between FADS genotype and exclusive BF was
tested. In Supplementary Table S1, only the interactive
effects are presented. These effects also show a highly
decreased risk of asthma in children carrying at least one
minor allele who are breastfed for more than 3 months. After
correction for multiple testing (acorr = 0.025), the interaction
is significant for children breastfed for 3 to 4 months for all
of the six tested SNPs [interaction effect ranging from )1.17(P = 0.015) to )1. 33 (P = 0.0066)]. The asthma risk is also
decreased in minor allele carriers who are breastfed for more
than 5 months [)0.64 (P = 0.0861) to )1.33 (P = 0.0005)].
After correction for multiple testing, the interaction is signifi-
cant for four SNPs (rs174545, rs174546, rs174575 and
rs3834458).
Discussion
The present study investigated the modulating effect of the
FADS gene cluster on the association between exclusive BF
and the development of asthma up to 10 years of age. Exclu-
sive BF for more than 3 months was found to reduce the risk
of asthma in homozygous or heterozygous carriers of the
minor allele. In homozygous major allele carriers, no effect
of the duration of exclusive BF on the development of
asthma was observed. We identified a strong interaction of
the association between exclusive BF and asthma by FADS
gene polymorphism in children.
Comparison with other studies
We could not find another study that investigated the associ-
ation between BF, FADS genotype and atopy. Two studies
reported a modulating effect of the FADS genotype on the
association between BF and IQ (20, 21). Caspi et al. (20)
Table 2 Characteristics of the SNPs in the FADS gene cluster
SNP
Alleles
(major/minor)
1/2 N
Number of subjects with
Genotype (%) Allele (%)
11 12/22 1 2
rs174545 G/C 2047 931 (45%) 1116 (55%) 2757 (67%) 1337 (33%)
rs174546 G/A 2076 946 (46%) 1130 (54%) 2799 (67%) 1353 (33%)
rs174556 G/A 2069 1033 (50%) 1036 (50%) 2927 (71%) 1211 (29%)
rs174561 A/G 2082 1040 (50%) 1042 (50%) 2951 (71%) 1213 (29%)
rs174575 C/G 2212 1236 (56%) 976 (44%) 3300 (75%) 1124 (25%)
rs3834458 T/del 2211 1016 (46%) 1195 (54%) 2995 (68%) 1427 (32%)
SNP, single-nucleotide polymorphisms.
Table 3 Prevalence of doctor-diagnosed asthma stratified by number of months of exclusive breastfeeding
Number of months of exclusive BF 1–2 3–4 5–6
P-value*% (n/N) % (n/N) % (n/N) % (n/N)
Asthma ever (DD)
No 86.0 (442/513) 87.0 (233/268) 89.0 (338/379) 91.0 (988/1085) 0.0172
Yes 14.0 (71/513) 13.0 (35/268) 11.0 (41/379) 9.0 (97/1085)
BF, breastfeeding.
*Chi-squared test.
Table 4 Prevalence of doctor-diagnosed asthma stratified by geno-
type
Asthma ever (DD)
% (n/N) P-value*
rs174545
Allele 12/22 10.5 (117/1116) 0.3372
Allele 11 11.9 (111/931)
rs174546
Allele 12/22 10.4 (118/1130) 0.3105
Allele 11 11.9 (113/946)
rs174556
Allele 12/22 10.0 (104/1036) 0.1190
Allele 11 12.3 (127/1033)
rs174561
Allele 12/22 10.1 (105/1042) 0.1790
Allele 11 12.0 (125/1040)
rs174575
Allele 12/22 10.2 (100/976) 0.4944
Allele 11 11.2 (139/1236)
rs3834458
Allele 12/22 10.0 (120/1195) 0.2062
Allele 11 11.8 (120/1016)
*Chi-squared test.
FADS genes, breastfeeding and asthma Standl et al.
86 Allergy 67 (2012) 83–90 ª 2011 John Wiley & Sons A/S
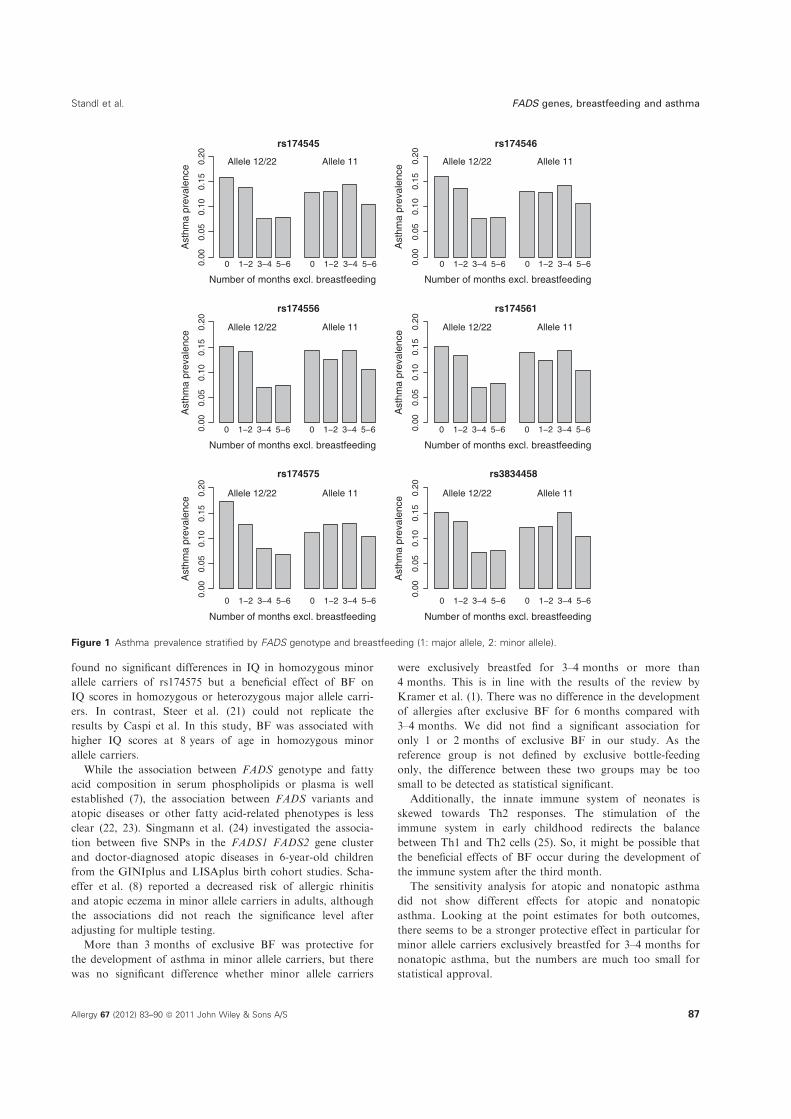
found no significant differences in IQ in homozygous minor
allele carriers of rs174575 but a beneficial effect of BF on
IQ scores in homozygous or heterozygous major allele carri-
ers. In contrast, Steer et al. (21) could not replicate the
results by Caspi et al. In this study, BF was associated with
higher IQ scores at 8 years of age in homozygous minor
allele carriers.
While the association between FADS genotype and fatty
acid composition in serum phospholipids or plasma is well
established (7), the association between FADS variants and
atopic diseases or other fatty acid-related phenotypes is less
clear (22, 23). Singmann et al. (24) investigated the associa-
tion between five SNPs in the FADS1 FADS2 gene cluster
and doctor-diagnosed atopic diseases in 6-year-old children
from the GINIplus and LISAplus birth cohort studies. Scha-
effer et al. (8) reported a decreased risk of allergic rhinitis
and atopic eczema in minor allele carriers in adults, although
the associations did not reach the significance level after
adjusting for multiple testing.
More than 3 months of exclusive BF was protective for
the development of asthma in minor allele carriers, but there
was no significant difference whether minor allele carriers
were exclusively breastfed for 3–4 months or more than
4 months. This is in line with the results of the review by
Kramer et al. (1). There was no difference in the development
of allergies after exclusive BF for 6 months compared with
3–4 months. We did not find a significant association for
only 1 or 2 months of exclusive BF in our study. As the
reference group is not defined by exclusive bottle-feeding
only, the difference between these two groups may be too
small to be detected as statistical significant.
Additionally, the innate immune system of neonates is
skewed towards Th2 responses. The stimulation of the
immune system in early childhood redirects the balance
between Th1 and Th2 cells (25). So, it might be possible that
the beneficial effects of BF occur during the development of
the immune system after the third month.
The sensitivity analysis for atopic and nonatopic asthma
did not show different effects for atopic and nonatopic
asthma. Looking at the point estimates for both outcomes,
there seems to be a stronger protective effect in particular for
minor allele carriers exclusively breastfed for 3–4 months for
nonatopic asthma, but the numbers are much too small for
statistical approval.
0 1−2 3−4 5−6 0 1−2 3−4 5−6
rs174545
Number of months excl. breastfeeding
Ast
hma
prev
alen
ce
0.00
0.05
0.10
0.15
0.20
Allele 12/22 Allele 11
0 1−2 3−4 5−6 0 1−2 3−4 5−6
rs174546
Number of months excl. breastfeeding
Ast
hma
prev
alen
ce
0.00
0.05
0.10
0.15
0.20
Allele 12/22 Allele 11
0 1−2 3−4 5−6 0 1−2 3−4 5−6
rs174556
Number of months excl. breastfeeding
Ast
hma
prev
alen
ce
0.00
0.05
0.10
0.15
0.20
Allele 12/22 Allele 11
0 1−2 3−4 5−6 0 1−2 3−4 5−6
rs174561
Number of months excl. breastfeeding
Ast
hma
prev
alen
ce
0.00
0.05
0.10
0.15
0.20
Allele 12/22 Allele 11
0 1−2 3−4 5−6 0 1−2 3−4 5−6
rs174575
Number of months excl. breastfeeding
Ast
hma
prev
alen
ce
0.00
0.05
0.10
0.15
0.20
Allele 12/22 Allele 11
0 1−2 3−4 5−6 0 1−2 3−4 5−6
rs3834458
Number of months excl. breastfeeding
Ast
hma
prev
alen
ce
0.00
0.05
0.10
0.15
0.20
Allele 12/22 Allele 11
Figure 1 Asthma prevalence stratified by FADS genotype and breastfeeding (1: major allele, 2: minor allele).
Standl et al. FADS genes, breastfeeding and asthma
Allergy 67 (2012) 83–90 ª 2011 John Wiley & Sons A/S 87

The underlying biological mechanism that causes the asso-
ciation between BF, FADS1 FADS2 genotype and asthma is
not completely clear although there are a number of biologi-
cally plausible indicators (3, 26). Minor allele carriers have a
lower proportion of products of the fatty acid metabolism
and therefore a lower proportion of AA, a product of the
n-6 pathway which may reduce the risk of asthma. But this is
highly speculative as the underlying biological mechanisms
that cause these associations are unknown.
Strength and limitations
The fatty acid composition of the breast milk varies depend-
ing on the FADS genotype of the mother (9, 12, 13). The
breast milk of women carrying the homozygous minor allele
contains lower proportions of products of the fatty acid
metabolism compared to the breast milk of woman carrying
the major allele. As we do not know the genotype of the
mother, we cannot take the variation of the fatty acid
composition in the breast milk into account.
The prevalence of doctor-diagnosed asthma is in total 11%
up to 10 years of age. Owing to this low prevalence, the out-
come variable was defined as ever having a diagnosis, and it was
not possible to apply a more appropriate longitudinal model.
Indeed, Scholtens et al. (27) could show in a longitudinal analy-
sis that BF for more than 16 weeks decreases the risk of asthma
until 8 years of age, but no age-dependent differences.
Additionally, the percentage of exclusively bottle-fed neo-
nates was very low in our study. Therefore, the reference
category ‘No exclusive BF’ covers all children that were
exclusively bottle-fed and both breastfed and bottle-fed after
birth. Thus, the effect estimates of our study might even
underestimate the true magnitude, if a bottle-fed-only group
could have been used. Further, the asthma definition is based
on parental report of a doctor diagnosis for each year up to
10 years of age, but there was no clinical ascertainment of
the parentally reported diagnosis. A major strength of our
study is the prospective design and the long-term follow-up
until 10 years of a large study population.
Conclusion
The association between exclusive BF and asthma is modified
by the genetic variants of FADS genotypes in children. Our
results suggest that only minor allele carriers benefit from
exclusive BF in regard to asthma development, while homo-
zygous major allele carriers have no advantage in this respect.
This might explain the partly inconsistent results from previ-
ous studies on BF and asthma prevalence, which suggests the
inclusion of genetic data in future studies.
Acknowledgments
We gratefully acknowledge partial financial support from
the Commission of the European Communities, specific
RTD Programme ‘Quality of Life and Management of
Living Resources’, within the 7th Framework Programme
NUTRIMENTHE, FP7-212652. This manuscript does not
necessarily reflect the views of the Commission and in no
way anticipates the future policy in this area. This work
Table 5 Results of logistic regression models of breastfeeding (BF) on asthma stratified by genotype, adjusted for gender, study centre,
maternal education level, study (GINI intervention, GINI nonintervention, LISA) and presence of older siblings (reference category: never
exclusive breastfeeding)
N
Never exclusive BF 1–2 months exclusive BF 3–4 months exclusive BF 5–6 months exclusive BF
aOR aOR (95% CI) P-value* aOR(95% CI) P-value* aOR (95% CI) P-value*
rs174545
Allele 12/22 1073 1 0.89 (0.48, 1.66) 0.7120 0.38 (0.19, 0.76) 0.0062 0.41 (0.24, 0.69) 0.0007
Allele 11 905 1 1.33 (0.61, 2.89) 0.4686 1.47 (0.75, 2.92) 0.2639 1.07 (0.60, 1.91) 0.8177
rs174546
Allele 12/22 1085 1 0.90 (0.48, 1.68) 0.7462 0.38 (0.19, 0.77) 0.0073 0.41 (0.24, 0.68) 0.0006
Allele 11 919 1 1.33 (0.62, 2.89) 0.4640 1.48 (0.75, 2.92) 0.2600 1.09 (0.61, 1.94) 0.7725
rs174556
Allele 12/22 997 1 0.98 (0.51, 1.87) 0.9413 0.37 (0.18, 0.80) 0.0107 0.41 (0.24, 0.72) 0.0018
Allele 11 1000 1 1.16 (0.56, 2.38) 0.6947 1.37 (0.73, 2.57) 0.3308 0.95 (0.56, 1.62) 0.8609
rs174561
Allele 12/22 1003 1 1.02 (0.53, 1.95) 0.9624 0.39 (0.18, 0.83) 0.0148 0.47 (0.27, 0.81) 0.0065
Allele 11 1008 1 1.14 (0.55, 2.34) 0.7224 1.38 (0.73, 2.59) 0.3200 0.94 (0.55, 1.59) 0.8039
rs174575
Allele 12/22 934 1 0.81 (0.41, 1.59) 0.5388 0.42 (0.20, 0.88) 0.0224 0.32 (0.18, 0.57) 0.0001
Allele 11 1204 1 1.44 (0.74, 2.81) 0.2844 1.32 (0.72, 2.41) 0.3706 1.17 (0.71, 1.94) 0.5372
rs3834458
Allele 12/22 1149 1 0.94 (0.51, 1.73) 0.8338 0.40 (0.20, 0.81) 0.0104 0.42 (0.25, 0.71) 0.0011
Allele 11 988 1 1.25 (0.59, 2.68) 0.5609 1.44 (0.75, 2.76) 0.2745 1.07 (0.61, 1.86) 0.8189
aOR, adjusted odds ratios; 1, major allele; 2, minor allele.
*Estimates reaching significance after correcting for multiple testing (acorr = 0.05/2 = 0.025) are marked in bold.
FADS genes, breastfeeding and asthma Standl et al.
88 Allergy 67 (2012) 83–90 ª 2011 John Wiley & Sons A/S

was supported financially in part by the ‘Kompetenznetz
Adipositas’ (‘Competence Network Obesity’) funded by the
German Federal Ministry of Education and Research (FKZ:
01GI0826) and by the Munich Center of Health Sciences
(MCHEALTH). The LISAplus study was funded by grants
of the Federal Ministry for Education, Science, Research
and Technology (Grant No. 01 EG 9705/2 and 01EG9732),
and the 6-year follow-up of the LISAplus study was partly
funded by the Federal Ministry of Environment (IUF, FKS
20462296). Berthold Koletzko is the recipient of a Freedom
to Discover Award of the Bristol-Myers Squibb Foundation,
New York, NY, USA.
The GINIplus study group: Helmholtz Zentrum Munchen,
German Research Center for Environmental Health, Institute
of Epidemiology I, Munich (Heinrich J, Wichmann HE, Sau-
senthaler S, Zutavern A, Chen, Chih-Mei, Schnappinger M,
Rzehak P); Department of Pediatrics, Marien-Hospital,
Wesel (Berdel D, von Berg A, Beckmann C, Groß I); Depart-
ment of Pediatrics, Ludwig Maximilians University, Munich
(Koletzko S, Reinhardt D, Krauss-Etschmann S); Depart-
ment of Pediatrics, Technical University, Munich (Bauer CP,
Brockow I, Grubl A, Hoffmann U); IUF – Leibniz Research
Institute for Environmental Medicine, Dusseldorf (Kramer
U, Link E, Cramer C); Centre for Allergy and Environment,
Technical University, Munich (Behrendt H).
The LISAplus study group: Helmholtz Zentrum Mun-
chen, German Research Center for Environmental Health,
Institute of Epidemiology I, Munich (Heinrich J, Wichmann
HE, Sausenthaler S, Chen CM, Schnappinger M); Depart-
ment of Pediatrics, Municipal Hospital ‘St.Georg’, Leipzig
(Borte M, Diez U), Marien-Hospital Wesel, Department of
Pediatrics, Wesel (von Berg A, Beckmann C, Groß I); Pedi-
atric Practice, Bad Honnef (Schaaf B); Helmholtz Centre for
Environmental Research – UFZ, Department of Environ-
mental Immunology/Core Facility Studies, Leipzig (Leh-
mann I, Bauer M, Grabsch C, Roder S, Schilde M);
University of Leipzig, Institute of Hygiene and Environmen-
tal Medicine, Leipzig (Herbarth O, Dick C, Magnus J); IUF
– Leibniz Research Institute for Environmental Medicine,
Dusseldorf (Kramer U, Link E, Cramer C); Technical Uni-
versity Munich, Department of Pediatrics, Munich (Bauer
CP, Hoffmann U); ZAUM – Center for Allergy and Envi-
ronment, Technical University, Munich (Behrendt H, Gros-
ch J, Martin F).
Authors contributions
MS carried out the statistical analysis and wrote the manu-
script. JH and SS were involved in the development of the sta-
tistical analysis plan and interpreting the results. EL and BK
helped to interpret the results by revising the manuscript. NK
performed the typing of the FADS variants. SK, CPB, HEW,
AvB, DB, UK, BS, IL, OH and JH designed and/or conducted
the study and revised the manuscript. All authors had full
access to all of the data in the study and can take responsibil-
ity for the integrity of the data and the accuracy of the data
analysis. All authors read and approved the final manuscript.
Conflict of interest statement
None declared.
Supporting Information
Additional Supporting Information may be found in the
online version of this article found at: http://www.wileyonline
library.com
Table S1. Results of logistic regression models of exclusive
breastfeeding (BF) and SNP interaction on asthma, adjusted
for gender, study centre, maternal education level, study
(GINI intervention, GINI non-intervention, LISA) and pres-
ence of older siblings (reference category: never excl. BF and
major allele).
Table S2. Results of logistic regression models of breast-
feeding (BF) on atopic asthma stratified by genotype,
adjusted for gender, study centre, maternal education level,
study (GINI intervention, GINI non-intervention, LISA) and
presence of older siblings (reference category: never exclusive
breastfeeding).
Table S3. Results of logistic regression models of breast-
feeding (BF) on non-atopic asthma stratified by genotype,
adjusted for gender, study centre, maternal education level,
study (GINI intervention, GINI non-intervention, LISA) and
presence of older siblings (reference category: never exclusive
breastfeeding).
Please note: Wiley-Blackwell are not responsible for the
content or functionality of any supporting materials supplied
by the authors. Any queries (other than missing material)
should be directed to the corresponding author for the article.
References
1. Kramer MS, Kakuma R. Optimal
duration of exclusive breastfeeding.
Cochrane Database Syst Rev
2002;1:CD003517.
2. Fewtrell M, Wilson DC, Booth I, Lucas
A. Six months of exclusive breast feeding:
how good is the evidence? BMJ
2011;342:c5955.
3. Friedman NJ, Zeiger RS. The role of
breast-feeding in the development of
allergies and asthma. J Allergy Clin
Immunol 2005;115:1238–1248.
4. Sprecher H. Biochemistry of essential fatty
acids. Prog Lipid Res 1981;20:13–22.
5. Calder PC, Miles EA. Fatty acids and atopic
disease. Pediatr Allergy Immunol
2000;11(Suppl 13):29–36.
6. Sausenthaler S, Koletzko B, Heinrich J.
Dietary fat intake and allergic diseases. Curr
Nutr Food Sci 2006;2:351–359.
7. Lattka E, Illig T, Koletzko B, Heinrich J.
Genetic variants of the FADS1 FADS2 gene
cluster as related to essential fatty acid meta-
bolism. Curr Opin Lipidol 2010;21:64–69.
8. Schaeffer L, Gohlke H, Muller M, Heid IM,
Palmer LJ, Kompauer I et al. Common
genetic variants of the FADS1 FADS2 gene
cluster and their reconstructed haplotypes
are associated with the fatty acid composi-
tion in phospholipids. Hum Mol Genet
2006;15:1745–1756.
9. Xie L, Innis SM. Genetic variants of the
FADS1 FADS2 gene cluster are associated
with altered (n-6) and (n-3) essential fatty
acids in plasma and erythrocyte phospho-
lipids in women during pregnancy and in
Standl et al. FADS genes, breastfeeding and asthma
Allergy 67 (2012) 83–90 ª 2011 John Wiley & Sons A/S 89
breast milk during lactation. J Nutr
2008;138:2222–2228.
10. Baylin A, Ruiz-Narvaez E, Kraft P, Campos
H. alpha-Linolenic acid, Delta6-desaturase
gene polymorphism, and the risk of nonfatal
myocardial infarction. Am J Clin Nutr
2007;85:554–560.
11. Malerba G, Schaeffer L, Xumerle L, Klopp
N, Trabetti E, Biscuola M et al. SNPs of the
FADS gene cluster are associated with poly-
unsaturated fatty acids in a cohort of
patients with cardiovascular disease. Lipids
2008;43:289–299.
12. Lattka E, Rzehak P, Szabo E, Jakobik V,
Weck M, Weyermann M et al. Genetic vari-
ants in the FADS gene cluster are associated
with arachidonic acid concentrations of
human breast milk at 1.5 and 6 mo postpar-
tum and influence the course of milk do-
decanoic, tetracosenoic, and trans-9-
octadecenoic acid concentrations over the
duration of lactation. Am J Clin Nutr
2011;93:382–391.
13. Molto-Puigmartı C, Plat J, Mensink RP,
Muller A, Jansen E, Zeegers MP et al.
FADS1 FADS2 gene variants modify the
association between fish intake and the
docosahexaenoic acid proportions in human
milk. Am J Clin Nutr 2010;91:1368–1376.
14. Koletzko B, Lattka E, Zeilinger S, Illig T,
Steer C. Genetic variants of the fatty acid
desaturase gene cluster predict amounts of
red blood cell docosahexaenoic and other
polyunsaturated fatty acids in pregnant
women: findings from the Avon Longitudi-
nal Study of Parents and Children. Am J
Clin Nutr 2011;93:211–219.
15. Heinrich J, Bolte G, Holscher B, Douwes J,
Lehmann I, Fahlbusch B et al. Allergens
and endotoxin on mothers’ mattresses and
total immunoglobulin E in cord blood of
neonates. Eur Respir J 2002;20:617–623.
16. von Berg A, Koletzko S, Grubl A, Filipiak-
Pittroff B, Wichmann HE, Bauer CP et al.
The effect of hydrolyzed cow’s milk formula
for allergy prevention in the first year of life:
the German Infant Nutritional Intervention
Study, a randomized double-blind trial. J
Allergy Clin Immunol 2003;111:533–540.
17. Rzehak P, Heinrich J, Klopp N, Schaeffer
L, Hoff S, Wolfram G et al. Evidence for an
association between genetic variants of the
fatty acid desaturase 1 fatty acid desaturase
2 (FADS1 FADS2) gene cluster and the fatty
acid composition of erythrocyte membranes.
Br J Nutr 2009;101:20–26.
18. Nyholt DR. A simple correction for multiple
testing for single-nucleotide polymorphisms
in linkage disequilibrium with each other.
Am J Hum Genet 2004;74:765–769.
19. R Development Core Team. R: a language
and environment for statistical computing.
Vienna, Austria: R Foundation for Statisti-
cal Computing, 2011. ISBN 3-900051-07-0.
20. Caspi A, Williams B, Kim-Cohen J, Craig
IW, Milne BJ, Poulton R et al. Moderation
of breastfeeding effects on the IQ by genetic
variation in fatty acid metabolism. Proc Natl
Acad Sci USA 2007;104:18860–18865.
21. Steer CD, Smith GD, Emmett PM, Hibbeln
JR, Golding J. FADS2 polymorphisms mod-
ify the effect of breastfeeding on child IQ.
PLoS ONE 2010;5:e11570.
22. Lattka E, Illig T, Heinrich J, Koletzko B.
FADS gene cluster polymorphisms: impor-
tant modulators of fatty acid levels and their
impact on atopic diseases. J Nutrigenet
Nutrigenomics 2009;2:119–128.
23. Lattka E, Illig T, Heinrich J, Koletzko B.
Do FADS genotypes enhance our knowledge
about fatty acid related phenotypes? Clin
Nutr 2010;29:277–287.
24. Singmann P, Rzehak P, Berdel D, Wich-
mann HE, Heinrich J. No association
between FADS polymorphisms and atopic
diseases in children from the GINI and
LISA birth cohorts. Allergy 2010;65:1627–
1629.
25. Belderbos M, Levy O, Bont L. Neonatal
innate immunity in allergy development.
Curr Opin Pediatr 2009;21:762–769.
26. Oddy WH. Breast feeding and childhood
asthma. Thorax 2009;64:558–559.
27. Scholtens S, Wijga AH, Brunekreef B, Kerk-
hof M, Hoekstra MO, Gerritsen J et al.
Breast feeding, parental allergy and asthma
in children followed for 8 years. The PI-
AMA birth cohort study. Thorax
2009;64:604–609.
FADS genes, breastfeeding and asthma Standl et al.
90 Allergy 67 (2012) 83–90 ª 2011 John Wiley & Sons A/S

Paper 2: Supplementary Material
49


Supplementary Table 1 Results of logistic regression models of exclusive breastfeeding (BF) and SNP interaction on asthma, adjusted for gender, study centre, maternal
education level, study (GINI intervention, GINI non‐intervention, LISA) and presence of older siblings (reference category: never excl. BF and major allele)
1‐2 months excl. bf 3‐4 months excl. bf 5‐6 months excl. bf Estimate Sd p‐value$ Estimate Sd p‐value$ Estimate Sd p‐value$
rs174545
Allele 12 /22 vs. Allele 11 ‐0.34 0.50 0.4914 ‐1.33 0.49 0.0066 ‐0.91 0.38 0.0168
rs174546
Allele 12 /22 vs. Allele 11 ‐0.34 0.50 0.4964 ‐1.31 0.49 0.0069 ‐0.95 0.38 0.0122
rs174556
Allele 12 /22 vs. Allele 11 ‐0.13 0.49 0.7858 ‐1.30 0.50 0.0087 ‐0.79 0.38 0.0365
rs174561
Allele 12 /22 vs. Allele 11 ‐0.07 0.49 0.8861 ‐1.27 0.50 0.0108 ‐0.64 0.37 0.0861
rs174575
Allele 12 /22 vs. Allele 11 ‐0.56 0.48 0.2414 ‐1.17 0.48 0.0150 ‐1.33 0.38 0.0005
rs3834458
Allele 12 /22 vs. Allele 11 ‐0.26 0.49 0.5984 ‐1.24 0.48 0.0095 ‐0.87 0.37 0.0187 $ Significance level after correcting for multiple testing: αcorr=0.05/2=0.025
1: major allele, 2: minor allele

Supplementary Table 2 Results of logistic regression models of breastfeeding (BF) on atopic asthma stratified by genotype, adjusted for gender, study centre, maternal
education level, study (GINI intervention, GINI non‐intervention, LISA) and presence of older siblings (reference category: never exclusive breastfeeding)
never excl. BF 1‐2 months excl. BF 3‐4 months excl. BF 5‐6 months excl. BF N aOR aOR 95%‐CI p‐value$ aOR 95%‐CI p‐value$ aOR 95%‐CI p‐value$
rs174545 Allele 12 / 22 1039 1 0.74 (0.34,1.63) 0.4548 0.43 (0.19,0.96) 0.0394 0.44 (0.23,0.81) 0.0082
Allele 11 885 1 1.33 (0.57,3.08) 0.5060 1.05 (0.47,2.30) 0.9127 1.11 (0.59,2.08) 0.7442rs174546 Allele 12 / 22 1051 1 0.75 (0.34,1.66) 0.4794 0.44 (0.19,0.98) 0.0446 0.43 (0.23,0.80) 0.0078
Allele 11 899 1 1.33 (0.58,3.08) 0.5000 1.05 (0.48,2.32) 0.8955 1.13 (0.61,2.12) 0.6948rs174556 Allele 12 / 22 967 1 0.72 (0.31,1.65) 0.4332 0.42 (0.18,0.98) 0.0453 0.38 (0.20,0.74) 0.0045
Allele 11 976 1 1.29 (0.58,2.84) 0.5337 1.07 (0.51,2.27) 0.8573 1.10 (0.61,1.98) 0.7440rs174561 Allele 12 / 22 973 1 0.72 (0.31,1.66) 0.4390 0.42 (0.18,0.98) 0.0446 0.41 (0.21,0.78) 0.0070
Allele 11 984 1 1.27 (0.58,2.79) 0.5548 1.08 (0.51,2.30) 0.8328 1.08 (0.60,1.95) 0.7951rs174575 Allele 12 / 22 905 1 0.79 (0.34,1.84) 0.5881 0.56 (0.24,1.32) 0.1850 0.35 (0.17,0.71) 0.0037
Allele 11 1175 1 1.24 (0.59,2.60) 0.5690 0.93 (0.46,1.88) 0.8482 1.10 (0.64,1.90) 0.7333rs3834458 Allele 12 / 22 1112 1 0.85 (0.39,1.83) 0.6698 0.47 (0.21,1.07) 0.0715 0.44 (0.23,0.83) 0.0110
Allele 11 967 1 1.17 (0.52,2.64) 0.7028 1.03 (0.49,2.15) 0.9420 1.02 (0.56,1.84) 0.9513$ Significance level after correcting for multiple testing: αcorr=0.05/2=0.025
1: major allele, 2: minor allele

Supplementary Table 3 Results of logistic regression models of breastfeeding (BF) on non‐atopic asthma stratified by genotype, adjusted for gender, study centre,
maternal education level, study (GINI intervention, GINI non‐intervention, LISA) and presence of older siblings (reference category: never exclusive breastfeeding)
never excl. BF 1‐2 months excl. BF 3‐4 months excl. BF 5‐6 months excl. BF N aOR aOR 95%‐CI p‐value$ aOR 95%‐CI p‐value$ aOR 95%‐CI p‐value$
rs174545 Allele 12 / 22 997 1 1.08 (0.35,3.38) 0.8893 0.30 (0.06,1.47) 0.1384 0.50 (0.19,1.33) 0.1645
Allele 11 814 1 1.27 (0.11,14.83) 0.8470 4.87 (0.87,27.16) 0.0712 1.42 (0.26,7.76) 0.6871rs174546 Allele 12 / 22 1009 1 1.09 (0.35,3.40) 0.8797 0.31 (0.06,1.49) 0.1439 0.49 (0.18,1.31) 0.1538
Allele 11 827 1 1.28 (0.11,14.86) 0.8431 4.80 (0.86,26.74) 0.0734 1.43 (0.26,7.84) 0.6817rs174556 Allele 12 / 22 929 1 1.74 (0.50,6.03) 0.3811 0.25 (0.03,2.11) 0.2005 0.80 (0.27,2.39) 0.6915
Allele 11 900 1 0.48 (0.05,4.33) 0.5160 2.11 (0.58,7.59) 0.2543 0.53 (0.14,1.95) 0.3397rs174561 Allele 12 / 22 934 1 2.17 (0.59,7.95) 0.2413 0.32 (0.04,2.83) 0.3052 1.16 (0.37,3.64) 0.8004
Allele 11 909 1 0.47 (0.05,4.23) 0.5033 2.10 (0.58,7.56) 0.2581 0.53 (0.14,1.94) 0.3369rs174575 Allele 12 / 22 873 1 0.85 (0.25,2.94) 0.8027 0.16 (0.02,1.32) 0.0880 0.36 (0.12,1.05) 0.0622
Allele 11 1094 1 2.42 (0.33,17.81) 0.3862 5.07 (0.98,26.16) 0.0523 2.89 (0.61,13.66) 0.1807rs3834458 Allele 12 / 22 1075 1 0.98 (0.32,2.99) 0.9686 0.29 (0.06,1.39) 0.1226 0.54 (0.22,1.36) 0.1914
Allele 11 890 1 2.52 (0.15,42.45) 0.5202 8.55 (0.93,78.24) 0.0574 3.62 (0.42,31.22) 0.2411$ Significance level after correcting for multiple testing: αcorr=0.05/2=0.025
1: major allele, 2: minor allele


6 Paper 3: Meta-analysis of Genome-wideAssociation Studies on Atopic Dermatitis(Paternoster* & Standl* et al. Nature Genetics, 2012)
Original title: Meta-analysis of genome-wide association studies identi�es three newrisk loci for atopic dermatitis
Authors: L Paternoster*, M Standl*, CM Chen, A Ramasamy, K Bønnelykke,L Duijts, MA Ferreira, AC Alves, JP Thyssen, E Albrecht, H Bau-recht, B Feenstra, PM Sleiman, P Hysi, NM Warrington, I Curjuric,R Myhre, JA Curtin, MM Groen-Blokhuis, M Kerkhof, A Sääf, AFranke, D Ellinghaus, R Fölster-Holst, E Dermitzakis, SB Mont-gomery, H Prokisch, K Heim, AL Hartikainen, A Pouta, J Pekkanen,AI Blakemore, JL Buxton, M Kaakinen, DL Du�y, PA Madden, ACHeath, GW Montgomery, PJ Thompson, MC Matheson, P Le Souëf,B St Pourcain, GD Smith, J Henderson, JP Kemp, NJ Timpson, PDeloukas, SM Ring, HE Wichmann, M Müller-Nurasyid, N Novak, NKlopp, E Rodríguez, W McArdle, A Linneberg, T Menné, EA Nohr,A Hofman, AG Uitterlinden, CM van Duijn, F Rivadeneira, JC deJongste, RJ van der Valk, M Wjst, R Jogi, F Geller, HA Boyd, JCMurray, C Kim, F Mentch, M March, M Mangino, TD Spector, VBataille, CE Pennell, PG Holt, P Sly, CM Tiesler, E Thiering, T Il-lig, M Imboden, W Nystad, A Simpson, JJ Hottenga, D Postma,GH Koppelman, HA Smit, C Söderhäll, B Chawes, E Kreiner-Møller,H Bisgaard, E Melén, DI Boomsma, A Custovic, B Jacobsson, NMProbst-Hensch, LJ Palmer, D Glass, H Hakonarson, M Melbye, DLJarvis, VW Jaddoe, C Gieger, DP Strachan, NG Martin, MR Jarvelin,J Heinrich, DM Evans, S Weidinger* These authors contributed equally to this work.
Journal: Nature GeneticsVolume: 44Pages: 187�192Year: 2012
Reproduced with permission from Nature Publishing Group.
55

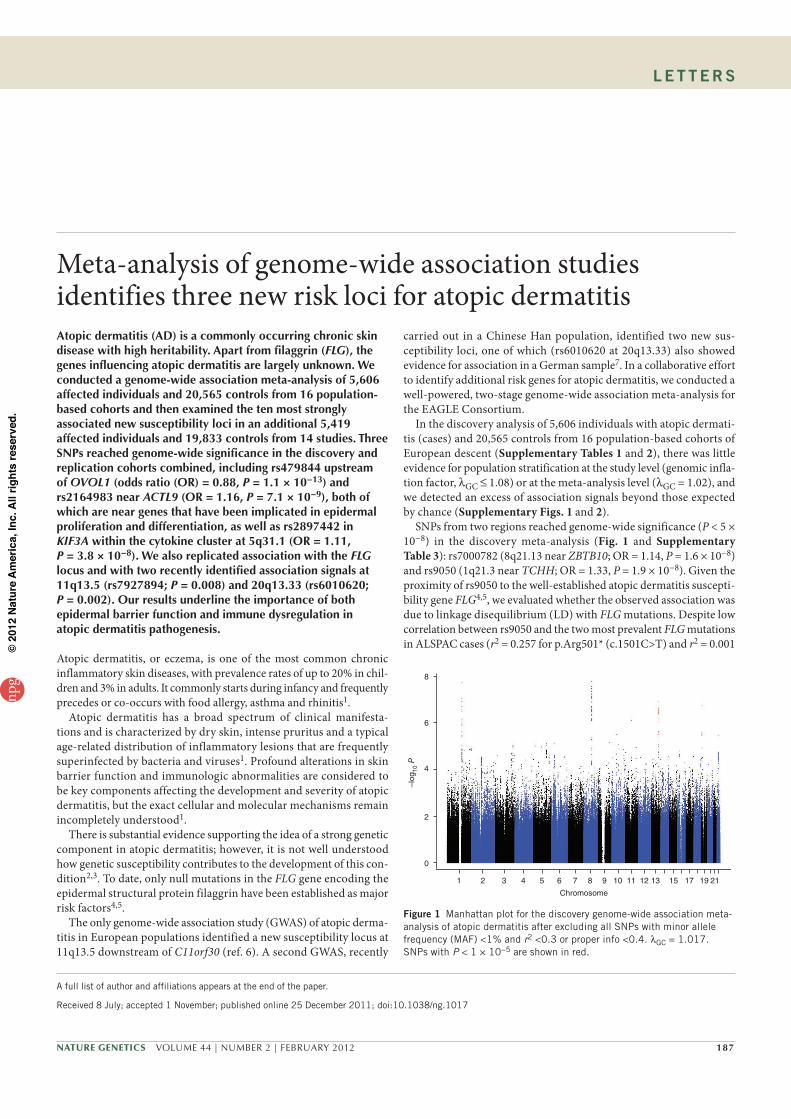
Nature GeNetics VOLUME 44 | NUMBER 2 | FEBRUARY 2012 187
Atopic dermatitis (AD) is a commonly occurring chronic skin disease with high heritability. Apart from filaggrin (FLG), the genes influencing atopic dermatitis are largely unknown. We conducted a genome-wide association meta-analysis of 5,606 affected individuals and 20,565 controls from 16 population-based cohorts and then examined the ten most strongly associated new susceptibility loci in an additional 5,419 affected individuals and 19,833 controls from 14 studies. Three SNPs reached genome-wide significance in the discovery and replication cohorts combined, including rs479844 upstream of OVOL1 (odds ratio (OR) = 0.88, P = 1.1 × 10⁻¹³) and rs2164983 near ACTL9 (OR = 1.16, P = 7.1 × 10⁻⁹), both of which are near genes that have been implicated in epidermal proliferation and differentiation, as well as rs2897442 in KIF3A within the cytokine cluster at 5q31.1 (OR = 1.11, P = 3.8 × 10⁻⁸). We also replicated association with the FLG locus and with two recently identified association signals at 11q13.5 (rs7927894; P = 0.008) and 20q13.33 (rs6010620; P = 0.002). Our results underline the importance of both epidermal barrier function and immune dysregulation in atopic dermatitis pathogenesis.
Atopic dermatitis, or eczema, is one of the most common chronic inflammatory skin diseases, with prevalence rates of up to 20% in chil-dren and 3% in adults. It commonly starts during infancy and frequently precedes or co-occurs with food allergy, asthma and rhinitis1.
Atopic dermatitis has a broad spectrum of clinical manifesta-tions and is characterized by dry skin, intense pruritus and a typical age-related distribution of inflammatory lesions that are frequently superinfected by bacteria and viruses1. Profound alterations in skin barrier function and immunologic abnormalities are considered to be key components affecting the development and severity of atopic dermatitis, but the exact cellular and molecular mechanisms remain incompletely understood1.
There is substantial evidence supporting the idea of a strong genetic component in atopic dermatitis; however, it is not well understood how genetic susceptibility contributes to the development of this con-dition2,3. To date, only null mutations in the FLG gene encoding the epidermal structural protein filaggrin have been established as major risk factors4,5.
The only genome-wide association study (GWAS) of atopic derma-titis in European populations identified a new susceptibility locus at 11q13.5 downstream of C11orf30 (ref. 6). A second GWAS, recently
carried out in a Chinese Han population, identified two new sus-ceptibility loci, one of which (rs6010620 at 20q13.33) also showed evidence for association in a German sample7. In a collaborative effort to identify additional risk genes for atopic dermatitis, we conducted a well-powered, two-stage genome-wide association meta-analysis for the EAGLE Consortium.
In the discovery analysis of 5,606 individuals with atopic dermati-tis (cases) and 20,565 controls from 16 population-based cohorts of European descent (Supplementary Tables 1 and 2), there was little evidence for population stratification at the study level (genomic infla-tion factor, λGC ≤ 1.08) or at the meta-analysis level (λGC = 1.02), and we detected an excess of association signals beyond those expected by chance (Supplementary Figs. 1 and 2).
SNPs from two regions reached genome-wide significance (P < 5 × 10⁻⁸) in the discovery meta-analysis (Fig. 1 and Supplementary Table 3): rs7000782 (8q21.13 near ZBTB10; OR = 1.14, P = 1.6 × 10⁻⁸) and rs9050 (1q21.3 near TCHH; OR = 1.33, P = 1.9 × 10⁻⁸). Given the proximity of rs9050 to the well-established atopic dermatitis suscepti-bility gene FLG4,5, we evaluated whether the observed association was due to linkage disequilibrium (LD) with FLG mutations. Despite low correlation between rs9050 and the two most prevalent FLG mutations in ALSPAC cases (r2 = 0.257 for p.Arg501* (c.1501C>T) and r2 = 0.001
Meta-analysis of genome-wide association studies identifies three new risk loci for atopic dermatitis
A full list of author and affiliations appears at the end of the paper.
Received 8 July; accepted 1 November; published online 25 December 2011; doi:10.1038/ng.1017
0
1 2 3 4 5 6 7 8 9 10
Chromosome
11 12 13 15 17 19 21
2
4
–log
10 P
6
8
Figure 1 Manhattan plot for the discovery genome-wide association meta-analysis of atopic dermatitis after excluding all SNPs with minor allele frequency (MAF) <1% and r2 <0.3 or proper info <0.4. λGC = 1.017. SNPs with P < 1 × 10⁻⁵ are shown in red.
l e t t e r s
npg
© 2
012
Nat
ure
Am
eric
a, In
c. A
ll rig
hts
rese
rved
.

188 VOLUME 44 | NUMBER 2 | FEBRUARY 2012 Nature GeNetics
l e t t e r s
After excluding the rs9050 SNP, we attempted to replicate the remaining 10 most strongly associated loci (P < 1 × 10⁻⁵ in the dis-covery meta-analysis) (Fig. 2, Table 1, Supplementary Fig. 5 and Supplementary Table 3) in 5,419 cases and 19,833 controls from 14 studies (Supplementary Tables 1 and 2). Three of the ten SNPs showed significant association after conservative Bonferroni correc-tion (P < 0.05/10 = 0.005) in the replication meta-analysis (with the same direction of effect as in the discovery meta-analysis), includ-ing rs479844 near OVOL1, rs2164983 near ACTL9 and rs2897442 in intron 8 of KIF3A (Fig. 2 and Table 1). All three SNPs reached
Study
a b
c
Discovery phaseALSPAC_discB58C-T1DGCB58C-WTCCCCHOPCOPSACDNBCGENR_discGOYAKORA F3KORA F4LISANFBC66PIAMAQIMRRAINETWINS UKSubtotal
Replication phase
ALSPAC_replAAGC
B58C_replBAMSEECRHSGENR_replHealth2006KORA/GENEVALISA/GINIMAASMoBaNFBC86NTRSAPALDIASubtotal
Overall
0.99
0.97
0.960.970.97
1.001.00
1.00
1.001.001.00
1.001.00
MACHr2 Proper info MAF
rs479844(A)
0.6OR
0.8 1 1.2 1.4 1.6
1.001.00
1.00
0.450.44
0.440.440.440.48
0.480.46
0.46
0.460.42
0.450.40
0.43
0.430.43
0.440.500.390.430.430.420.460.470.450.430.440.440.440.44
1.001.001.001.001.001.00
0.981.00
1.000.96
Study
Discovery phaseALSPAC_discCHOPCOPSACDNBCGENR_discGOYAKORA F4PIAMAQIMRRAINETWINS UKSubtotal
Replication phase
ALSPAC_replAAGC
BAMSEECRHSGENR_replHealth2006KORA/GENEVALISA/GINIMAASMoBaNFBC86NTRSAPALDIASubtotal
Overall
MACHr2 Proper info
0.95
0.960.960.96
0.89
0.960.95
0.160.130.190.140.150.150.150.150.170.130.14
0.160.160.14
0.140.140.160.170.150.240.150.14
0.6OR
0.8 1 1.2 1.4 1.6
0.150.15
0.94
0.89
0.440.99
0.890.96
0.91*
0.960.970.950.98
0.960.950.97
MAF
rs2164983(A)
Study
Discovery phaseALSPAC_discB58C-T1DGCB58C-WTCCCCHOPCOPSACDNBCGENR_discGOYAKORA F3KORA F4LISANFBC66PIAMAQIMRRAINETWINS UKSubtotal
Replication phase
ALSPAC_replAAGC
B58C_replBAMSEECRHSGENR_replHealth2006KORA/GENEVALISA/GINIMAASMoBaNFBC86NTRSAPALDIASubtotal
Overall
1.001.001.00
1.001.001.00
1.00
1.00
1.001.001.00
0.99
0.99
0.99
0.90
0.96
0.980.99
0.99
0.99
0.990.990.99
1.001.00
0.25
0.25
0.25
0.25
0.250.250.250.310.29
0.290.30
0.300.450.270.28
0.26
0.270.28
0.28
0.280.46
0.270.290.270.27
0.270.24
0.26
0.26
0.24
1.01*
1.01
0.6OR
0.8 1 1.2 1.4 1.6
MACHr2 Proper info MAF
rs2897442(C)
Figure 2 Forest plots for the association of SNP markers with atopic dermatitis. (a–c) Data are shown for rs479844 (a), rs2164983 (b) and rs2897442 (c). Black circles, ORs; horizontal lines, 95% CIs. Arrows indicate where a CI extends beyond the range of the plot. Blue boxes, imputed SNPs; red boxes, SNPs on the genotyping chip in the discovery cohorts and either on the genotyping chip or individually genotyped in the replication cohorts. The sizes of the red and blue boxes indicate the relative weight of each study (using inverse variance weighting). All ORs are reported with the minor allele (in parentheses) as the effect allele. The subtotals (for discovery and replication) and overall ORs and CIs are indicated by the center and range of the diamonds. rs2164983 was not included in HapMap release 21 and was therefore missing for some discovery cohorts. *MoBa imputation quality score was ‘info’ from PLINK. GENR, Generation R. Only Health2006, KORA/GENEVA and NFBC86 underwent individual SNP genotyping.
for c.2282del4) and high levels of recombination between the TCHH and FLG regions (peak of 20 cM/Mb at ~150.4 Mb in HapMap), in a meta-analysis across eight studies conditional on the two FLG mutations, rs9050 was no longer associated with atopic dermatitis (OR = 0.98, P = 0.88) (Supplementary Fig. 3) and was therefore not investigated further. rs9050 might represent a far-reaching haplotype of the FLG null mutations, but we cannot exclude the possibility that there are additional atopic dermatitis risk variants in this complex region.
The 11q13.5 locus previously reported to be associated in the only other European GWAS on atopic dermatitis to date6 was confirmed in our meta-analysis (rs7927894: OR = 1.07, 95% confidence interval (CI)1.02–1.12, P = 0.008) (Supplementary Fig. 4). Association with the rs6010620 variant, which was reported in a recent Chinese GWAS7, was similarly confirmed (OR = 1.09, 95% CI 1.03–1.15, P = 0.002).
Of the 15 loci reported to be associated with asthma or total serum immunoglobulin E (IgE) levels in a recent GWAS8, two showed suggestive evidence for association with atopic dermatitis (IL13: rs1295686, P = 0.0008 and rs20541, P = 0.0007; STAT6: rs167769, P = 0.0379) (Supplementary Table 4).
npg
© 2
012
Nat
ure
Am
eric
a, In
c. A
ll rig
hts
rese
rved
.

Nature GeNetics VOLUME 44 | NUMBER 2 | FEBRUARY 2012 189
l e t t e r s
remodeling and extracellular matrix turnover20,21. Actin proteins have well-characterized cytoskeletal functions, are important for the maintenance of epithelial morphology and cell migration and have also been implicated in nuclear activities22–24. The low recombina-tion rate between rs2164983 and ACTL9 and the recombination peak between this SNP and ADAMTS10 in the HapMap reference set of Utah residents of Northern and Western European descent (CEU) (Supplementary Fig. 2) suggests the functional variant may be located within the ACTL9 region. There was no evidence for association between rs2164983 and altered expression of genes within 500 kb of this marker in either the ALSPAC LCL eQTL analysis or the MuTHER skin eQTL data (Supplementary Fig. 6).
rs2897442 is located in intron 8 of KIF3A, which encodes a sub-unit of the kinesin II complex required for the assembly of primary cilia, which are essential for Hedgehog signaling and are implicated in β-catenin–dependent Wnt signaling to induce expression of a variety of genes that influence proliferation and apoptosis25,26. Of note, KIF3A is located at 5q31, which is characterized by a complex LD pattern and contains a cluster of cytokine and immune-related genes. This chromosomal location has been linked to several autoimmune and inflammatory diseases, including psoriasis27,28, Crohn’s disease29,30 and asthma8,29,31 (Supplementary Table 4). In particular, distinct functional IL13 (interleukin 13) variants have been associated with asthma susceptibility32. Although rs2897442 is within the KIF3A gene, there is little recombination between this locus and IL4 (encod-ing interleukin 4). There is a recombination peak between this region and IL13 (Supplementary Fig. 7a); however, there also seems to be a secondary association signal in the IL13-RAD50 region, and when making association conditional on rs2897442 in the discovery meta-analysis, the signal in the IL13-RAD50 region is still present, provid-ing evidence of two independent signals (Supplementary Fig. 7b). In an attempt to further refine the association at this locus, we analyzed Immunochip data from 1,553 German atopic dermatitis cases and 3,640 population controls, of whom 767 cases and 983 controls were part of the replication stage. The Immunochip is a custom-content Illumina iSelect array that focuses on genes involved in autoimmune disorders and offers an increased resolution at 5q31. In the population tested, the strongest association signal was seen for the rs848 SNP in IL13 (P = 1.93 × 10⁻¹⁰), which is in high LD with the functional IL13 variant rs20541 (r2 = 0.979; D′ = 0.995). Additional significantly associated signals were observed for a cluster of tightly linked variants in IL4 (lead SNP rs66913936: P = 2.58 × 10⁻⁸) and KIF3A (rs2897442: P = 8.84 × 10⁻⁷) (Supplementary Fig. 8 and Supplementary Tables 6 and 7). Whereas rs2897442 showed only weak LD with rs848
genome-wide significance in the combined meta-analysis of the discovery and replication sets: rs479844 with OR = 0.88, P = 1.1 × 10⁻¹³; rs2164983 with OR = 1.16, P = 7.1 × 10⁻⁹; and rs2897442 with OR = 1.11, P = 3.8 × 10⁻⁸. In contrast, rs7000782, which had reached genome-wide significance in the discovery analysis, showed no evi-dence of association in the replication cohort (P = 0.296). There was no evidence of interaction between the three replicated SNPs (Supplementary Table 5).
rs479844 (at 11q13.1) is located <3 kb upstream of OVOL1. The pattern of LD is complex at this locus, but there is a low recombination rate between rs479844 and OVOL1 in Europeans (Supplementary Fig. 2). OVOL1 belongs to a highly conserved family of genes involved in regulation of the development and differentiation of epithelial tis-sues and germ cells9–11. The encoded OVOL1 protein functions as a c-Myc repressor in keratinocytes, is activated by the β-catenin–LEF1 complex during epidermal differentiation and is a downstream target of the Wg-Wnt and TGF-β–BMP7–Smad4 developmental signaling pathways10,12,13. Apart from their role in the organogenesis of skin and skin appendages14,15, these pathways are also implicated in postnatal regulation of epidermal proliferation and differentia-tion16–18. Disruption of Ovol1 in mice leads to keratinocyte hyper-proliferation, hair shaft abnormalities, kidney cysts and defective spermatogenesis10,11. In addition, OVOL1 regulates loricrin (LOR) expression, thereby preventing premature terminal differentiation10. Thus, it is reasonable to speculate that variation at this locus might influence epidermal proliferation and/or differentiation, which are known to be disturbed in atopic dermatitis. Analysis of transcript levels of all genes within 500 kb of rs479844 in Epstein-Barr virus (EBV)-transformed lymphoblastoid cell lines (LCLs) from 949 ALSPAC individuals revealed a significant association (P = 7 × 10⁻⁵) between rs479844 and the nearby DKFZp761E198 locus, which encodes a hypothetical protein. Likewise, analysis of SNP-transcript pairs in the Multiple Tissue Human Expression Resource (MuTHER) pilot database of skin genome-wide expression quantitative trait loci (eQTL) from 160 samples19 provided suggestive evidence for an asso-ciation with DKFZp761E198 in the same direction in one of the twin sets (Supplementary Fig. 6). Further investigations are needed to clarify whether the causal variant(s) at this locus exerts its effect by regulating the expression of the DKFZp761E198 transcript.
rs2164983 (at 19p13.2) is located in an intergenic region 70 kb upstream of ADAMTS10 and 18 kb downstream of ACTL9 (encoding a hypothetical protein). ADAMTS proteins are a group of complex, secreted zinc-dependent metalloproteinases, which bind to and cleave extracellular matrix components and are involved in connective tissue
table 1 Discovery and replication results for loci associated with atopic dermatitis
Chr. SNP Position (bp) GeneEffect allele
Other allele
Effect allele freq. Stage N OR (95% CI) P value Phet
11 rs479844 65,308,533 OVOL1 A G 0.44 I 26,151 0.89 (0.85–0.93) 7.8 × 10⁻⁷
II 25,098 0.87 (0.83–0.92) 2.4 × 10⁻⁸
I + II 51,249 0.88 (0.85–0.91) 1.1 × 10⁻¹³ 0.23
19 rs2164983a 8,650,381 ACTL9 A C 0.15 I 17,403 1.22 (1.13–1.32) 1.8 × 10⁻⁷
II 22,996 1.11 (1.04–1.19) 0.002
I + II 40,399 1.16 (1.10–1.22) 7.1 × 10⁻⁹ 0.004
5 rs2897442 132,076,926 KIF3A C T 0.29 I 26,164 1.12 (1.07–1.18) 7.8 × 10⁻⁶
II 25,064 1.09 (1.04–1.15) 0.001
I + II 51,228 1.11 (1.07–1.15) 3.8 × 10⁻⁸ 0.52
Results are for the fixed-effect, inverse variance meta-analysis, with genomic control applied to the individual studies in the discovery meta-analysis. Chr., chromosome; Stage I, discovery screen; stage II, replication; stages I + II, combined analysis; N, number of subjects in each analysis. The heterogeneity P value (Phet) for overall heterogeneity between all discovery and replication studies was generated using Cochran’s Q test for heterogeneity. All ORs are given with the minor allele representing the effect allele.ars2164983 was not included in HapMap release 21 and was therefore missing for some discovery cohorts. This SNP showed evidence of heterogeneity (P = 0.004). The random-effects combined (I + II) result for this SNP was OR = 1.14 (95%CI 1.05–1.24), P = 0.001.
npg
© 2
012
Nat
ure
Am
eric
a, In
c. A
ll rig
hts
rese
rved
.

190 VOLUME 44 | NUMBER 2 | FEBRUARY 2012 Nature GeNetics
l e t t e r s
(r2 = 0.160; D′ = 0.483), it was strongly correlated with rs66913936 (r2 = 0.858; D′ = 0.982). Likewise, pairwise genotype-conditioned ana-lyses showed that the significant association of rs2897442 with atopic dermatitis was abolished upon conditioning for rs66913936, whereas there an association signal remained after conditioning for rs848 (Supplementary Tables 6 and 7). Analysis of the expression levels of all genes within 500 kb of rs2897442 in LCLs derived from ALSPAC individuals revealed a modest association between rs2897442 and IL13 transcript levels (P = 2.7 × 10⁻³). No association with transcript levels for any gene within 500 kb of the proxy variant, rs2299009, (r2 = 1) was seen in the MuTHER skin eQTL data (Supplementary Fig. 6). However, this result does not exclude the possibilities that this vari-ation may cause a regulatory effect in another tissue or physiological state, that this variant or causative variants in LD may be involved in long-range control of more distant genes33 or that different functional effects, such as alternative splicing, may be affected.
It is well known that genes that participate in the same pathway tend to be located adjacent to one another in the human genome and are coordinately regulated34. Thus, our results and previous findings suggest that there are distinct effects at the 5q31 locus, which might involve loci that are part of a regulatory block in this region. Further efforts, including detailed sequencing and functional exploration, are necessary to fully explore this locus.
The rs2164983, rs1327914 and rs10983837 variants showed evi-dence of heterogeneity in the meta-analysis (P < 0.01). The over-all random-effects results for these variants were OR = 1.14 (95% CI 1.05–1.24), P = 0.001; OR = 1.06 (95% CI 1.00–1.13), P = 0.058; and OR = 1.11 (95% CI 0.98–1.20), P = 0.155, respectively. Stratified analysis showed that the effects of rs2164983 and rs1327914 were stronger in the childhood atopic dermatitis cohorts (OR = 1.23, P = 2.9 × 10⁻⁹ and OR = 1.12, P = 2.5 × 10⁻⁴) than in studies that included atopic dermatitis cases of any age (OR = 1.17, P = 0.002 and OR = 1.02, P = 0.584; P values for the differences = 0.031 and 0.028, respectively) (Supplementary Fig. 9). This stratification did not fully explain the heterogeneity for rs2164983 (in the childhood-only cohorts, the P value for heterogeneity was still <0.01). In the COPSAC cohort, results were noticeably in the opposite direc-tion, and excluding this study gave a heterogeneity P value of 0.069 (OR = 1.17, P = 8.1 × 10⁻¹⁰). However, the COPSAC cases are diagnos-tically and demographically comparable to those in the other cohorts, and, thus, there is no obvious reason why this cohort should give such a different result. Neither stratification by age of diagnosis nor by whether a physician’s diagnosis was required for definition as a case explained the heterogeneity observed for rs10983837. Stratified analyses also indicated a stronger effect of rs2897442 in studies with a more stringent definition of atopic dermatitis (reported physician’s diagnosis) (OR = 1.14, P = 7.0 × 10⁻⁹) compared to studies in which atopic dermatitis was defined using only self-reported histories of the disease (OR = 1.05, P = 0.119) (Supplementary Fig. 9). These obser-vations highlight the importance of careful phenotyping and support the claim that atopic dermatitis encompasses distinct disease entities rather than being one illness, as is reflected by the current, relatively broad and inclusive concept of this condition. It is anticipated that the results of molecular studies will enable a more precise classification of atopic dermatitis.
In summary, in this large-scale GWAS of 11,025 atopic dermatitis cases and 40,398 controls, we have identified and replicated two newly identified risk loci for atopic dermatitis near genes that have annota-tions suggesting roles in epidermal proliferation and differentiation, supporting the importance of abnormalities in skin barrier function in the pathobiology of atopic dermatitis. In addition, we observed
an association signal of genome-wide significance from within the cytokine cluster at 5q31.1, which seemed to be composed of two dis-tinct signals, one centered at IL13-RAD50 and the other at IL4-KIF3A, both of which showed moderate association with IL13 expression. We further observed a signal in the epidermal differentiation com-plex, representing the FLG locus, and replicated the association with the 11q13.5 variant identified in the only other (smaller) published European GWAS of atopic dermatitis to date. Our results are con-sistent with the hypothesis that atopic dermatitis is caused by both epidermal barrier abnormalities and immunological features. Further studies are needed to identify the causal variants at the associated loci and to understand the mechanisms through which they confer risk for atopic dermatitis.
MeThODSMethods and any associated references are available in the online version of the paper at http://www.nature.com/naturegenetics/.
Note: Supplementary information is available on the Nature Genetics website.
AcknowledgmentsThe full list of acknowledgments for each study is provided in the Supplementary Note.
AUtHoR contRIBUtIonsStudy-level data analysis: L.P., M.S., A.R., K.B., L.D., M.A.F., A.C.A., J.P.T., E.A., H. Baurecht, B.F., P.H., N.M.W., I.C., R.M., J.A.C., M.M.G.-B., M. Kerkhof, A. Sääf, A.F., D.E., S.B.M., B.S.P., J.P.K., N.J.T., M.M.-N., F.G., M. March, M. Mangino, T.D.S., V.B., C.M.T.T., E.T., M.I., A. Simpson, J.-J.H., H.A.S., B.C., E.K.-M., E.M., A.C., B.J., N.M.P.-H., D.G., D.L.J., H.P., K.H. and D.P.S. Study design: L.P., M.S., C.-M.C., L.D., J.P.T., B.F., P.M.A.S., M. Kerkhof, E.D., A.-L.H., A.P., J.P., M. Kaakinen, G.D.S., J. Henderson, H.-E.W., N.N., A.L., T.M., E.A.N., A.H., A.G.U., C.M.v.D., F.R., J.C.d.J., R.J.P.v.d.V., H.A.B., J.C.M., T.D.S., P.S., W.N., A. Simpson, D.P., G.H.K., H.A.S., H. Bisgaard, D.I.B., A.C., N.M.P.-H., H.H., M. Melbye, D.L.J., V.W.V.J., C.G., M.-R.J., J. Heinrich, D.M.E. and S.W. Manuscript writing: L.P., M.S., A.R., K.B., J. Heinrich, D.M.E. and S.W. Data collection: K.B., L.D., J.P.T., B.F., R.M., M. Kerkhof, R.F.-H., E.D., S.B.M., A.-L.H., A.P., J.P., M. Kaakinen, D.L.D., P.A.M., A.C.H., G.W.M., P.J.T., M.C.M., P.L.S., J. Henderson, S.M.R., W.M., A.L., T.M., E.A.N., J.C.d.J., R.J.P.v.d.V., M.W., R.J., F.G., H.A.B., J.C.M., F.M., T.D.S., V.B., C.E.P., P.G.H., P.S., M.I., W.N., A. Simpson, D.P., G.H.K., H.A.S., B.C., E.K.-M., H. Bisgaard, E.M., D.I.B., A.C., B.J., N.M.P.-H., L.J.P., M. Melbye, D.L.J., V.W.V.J., N.G.M., M.-R.J., J. Heinrich and S.W. Genotyping: R.M., A.F., A.I.F.B., J.L.B., P.D., S.M.R., N.K., E.R., W.M., A.L., A.G.U., F.R., M.W., C.K., C.E.P., T.I., C.S., B.J., L.J.P. and M.-R.J. Revising and reviewing paper: L.P., M.S., C.-M.C., A.R., K.B., L.D., M.A.F., A.C.A., J.P.T., E.A., H. Baurecht, B.F., P.M.A.S., P.H., N.M.W., I.C., R.M., J.A.C., M.M.G.-B., M. Kerkhof, A. Sääf, A.F., D.E., R.F. -H., E.D., S.B.M., A.-L.H., A.P., J.P., A.I.F.B., J.L.B., M. Kaakinen, D.L.D., P.A.M., A.C.H., G.W.M., P.J.T., M.C.M., P.L.S., B.S.P., G.D.S., J. Henderson, J.P.K., N.J.T., P.D., S.M.R., H.-E.W., M.M.-N., N.N., N.K., E.R., W.M., A.L., T.M., E.A.N., A.H., A.G.U., C.M.v.D., F.R., J.C.d.J., R.J.P.v.d.V., M.W., R.J., F.G., H.A.B., J.C.M., C.K., F.M., M. March, M. Mangino, T.D.S., V.B., C.E.P., P.G.H., P.S., C.M.T.T., E.T., T.I., M.I., W.N., A. Simpson, J.-J.H., D.P., G.H.K., H.A.S., C.S., B.C., E.K.-M., H. Bisgaard, E.M., D.I.B., A.C., B.J., N.M.P.-H., L.J.P., D.G., H.H., M. Melbye, D.L.J., V.W.V.J., C.G., D.P.S., N.G.M., M.-R.J., J. Heinrich, D.M.E., H.P., K.H. and S.W.
AAGC provided results for the replication analysis, and GOYA provided results for the discovery analysis.
COMPETING FINANCIAL INTERESTSThe authors declare competing financial interests: details accompany the full-text HTML version of the paper at http://www.nature.com/naturegenetics/.
Published online at http://www.nature.com/naturegenetics/. Reprints and permissions information is available online at http://www.nature.com/reprints/index.html.
1. Bieber, T. Atopic dermatitis. N. Engl. J. Med. 358, 1483–1494 (2008).2. Brown, S.J. & McLean, W.H.I. Eczema genetics: current state of knowledge and
future goals. J. Invest. Dermatol. 129, 543–552 (2009).3. Morar, N., Willis-Owen, S.A.G., Moffatt, M.F. & Cookson, W.O. The genetics of
atopic dermatitis. J. Allergy Clin. Immunol. 118, 24–34 (2006).
npg
© 2
012
Nat
ure
Am
eric
a, In
c. A
ll rig
hts
rese
rved
.

Nature GeNetics VOLUME 44 | NUMBER 2 | FEBRUARY 2012 191
l e t t e r s
4. Palmer, C.N.A. et al. Common loss-of-function variants of the epidermal barrier protein filaggrin are a major predisposing factor for atopic dermatitis. Nat. Genet. 38, 441–446 (2006).
5. Rodríguez, E. et al. Meta-analysis of filaggrin polymorphisms in eczema and asthma: robust risk factors in atopic disease. J. Allergy Clin. Immunol. 123, 1361–1370 e7 (2009).
6. Esparza-Gordillo, J. et al. A common variant on chromosome 11q13 is associated with atopic dermatitis. Nat. Genet. 41, 596–601 (2009).
7. Sun, L.D. et al. Genome-wide association study identifies two new susceptibility loci for atopic dermatitis in the Chinese Han population. Nat. Genet. 43, 690–694 (2011).
8. Moffatt, M.F. et al. A large-scale, consortium-based genomewide association study of asthma. N. Engl. J. Med. 363, 1211–1221 (2010).
9. Li, B. et al. Ovol1 regulates meiotic pachytene progression during spermatogenesis by repressing Id2 expression. Development 132, 1463–1473 (2005).
10. Nair, M. et al. Ovol1 regulates the growth arrest of embryonic epidermal progenitor cells and represses c-myc transcription. J. Cell Biol. 173, 253–264 (2006).
11. Dai, X. et al. The ovo gene required for cuticle formation and oogenesis in flies is involved in hair formation and spermatogenesis in mice. Genes Dev. 12, 3452–3463 (1998).
12. Kowanetz, M., Valcourt, U., Bergström, R., Heldin, C.H. & Moustakas, A. Id2 and Id3 define the potency of cell proliferation and differentiation responses to transforming growth factor β and bone morphogenetic protein. Mol. Cell. Biol. 24, 4241–4254 (2004).
13. Li, B. et al. The LEF1/β-catenin complex activates movo1, a mouse homolog of Drosophila ovo required for epidermal appendage differentiation. Proc. Natl. Acad. Sci. USA 99, 6064–6069 (2002).
14. Owens, P., Han, G., Li, A.G. & Wang, X.J. The role of Smads in skin development. J. Invest. Dermatol. 128, 783–790 (2008).
15. Widelitz, R.B. Wnt signaling in skin organogenesis. Organogenesis 4, 123–133 (2008).
16. Buschke, S. et al. A decisive function of transforming growth factor-β/Smad signaling in tissue morphogenesis and differentiation of human HaCaT keratinocytes. Mol. Biol. Cell 22, 782–794 (2011).
17. Maganga, R. et al. Secreted Frizzled related protein-4 (sFRP4) promotes epidermal differentiation and apoptosis. Biochem. Biophys. Res. Commun. 377, 606–611 (2008).
18. Romanowska, M. et al. Wnt5a exhibits layer-specific expression in adult skin, is upregulated in psoriasis, and synergizes with type 1 interferon. PLoS ONE 4, e5354 (2009).
19. Nica, A.C. et al. The architecture of gene regulatory variation across multiple human tissues: the MuTHER study. PLoS Genet. 7, e1002003 (2011).
20. Apte, S.S. A disintegrin-like and metalloprotease (reprolysin-type) with thrombospondin type 1 motif (ADAMTS) superfamily: functions and mechanisms. J. Biol. Chem. 284, 31493–31497 (2009).
21. Porter, S., Clark, I.M., Kevorkian, L. & Edwards, D.R. The ADAMTS metalloproteinases. Biochem. J. 386, 15–27 (2005).
22. Pollard, T.D. The cytoskeleton, cellular motility and the reductionist agenda. Nature 422, 741–745 (2003).
23. Pollard, T.D. & Borisy, G.G. Cellular motility driven by assembly and disassembly of actin filaments. Cell 112, 453–465 (2003).
24. Winder, S.J. Structural insights into actin-binding, branching and bundling proteins. Curr. Opin. Cell Biol. 15, 14–22 (2003).
25. Goetz, S.C. & Anderson, K.V. The primary cilium: a signalling centre during vertebrate development. Nat. Rev. Genet. 11, 331–344 (2010).
26. Mosimann, C., Hausmann, G. & Basler, K. β-catenin hits chromatin: regulation of Wnt target gene activation. Nat. Rev. Mol. Cell Biol. 10, 276–286 (2009).
27. Chang, M. et al. Variants in the 5q31 cytokine gene cluster are associated with psoriasis. Genes Immun. 9, 176–181 (2008).
28. Nair, R.P. et al. Genome-wide scan reveals association of psoriasis with IL-23 and NF-κB pathways. Nat. Genet. 41, 199–204 (2009).
29. Li, Y. et al. The 5q31 variants associated with psoriasis and Crohn’s disease are distinct. Hum. Mol. Genet. 17, 2978–2985 (2008).
30. Wellcome Trust Case Control Consortium. Genome-wide association study of 14,000 cases of seven common diseases and 3,000 shared controls. Nature 447, 661–678 (2007).
31. Weidinger, S. et al. Genome-wide scan on total serum IgE levels identifies FCER1A as novel susceptibility locus. PLoS Genet. 4, e1000166 (2008).
32. Vercelli, D. Discovering susceptibility genes for asthma and allergy. Nat. Rev. Immunol. 8, 169–182 (2008).
33. Kleinjan, D.A. & van Heyningen, V. Long-range control of gene expression: emerging mechanisms and disruption in disease. Am. J. Hum. Genet. 76, 8–32 (2005).
34. Sproul, D., Gilbert, N. & Bickmore, W.A. The role of chromatin structure in regulating the expression of clustered genes. Nat. Rev. Genet. 6, 775–781 (2005).
lavinia Paternoster1,75, marie standl2,75, chih-mei chen3, Adaikalavan Ramasamy4–6, klaus Bønnelykke7, liesbeth duijts8–10, manuel A Ferreira11, Alexessander couto Alves5, Jacob P thyssen12, eva Albrecht13, Hansjörg Baurecht14–16, Bjarke Feenstra17, Patrick m A sleiman18, Pirro Hysi19, nicole m warrington20, Ivan curjuric21,22, Ronny myhre23, John A curtin24, maria m groen-Blokhuis25, marjan kerkhof26, Annika sääf27, Andre Franke28, david ellinghaus28, Regina Fölster-Holst15, emmanouil dermitzakis29,30, stephen B montgomery29,30, Holger Prokisch31,32, katharina Heim32, Anna-liisa Hartikainen33, Anneli Pouta33,34, Juha Pekkanen34,35, Alexandra I F Blakemore36, Jessica l Buxton36, marika kaakinen37, david l duffy11, Pamela A madden38, Andrew c Heath38, grant w montgomery11, Philip J thompson39,40, melanie c matheson41, Peter le souëf42, Australian Asthma genetics consortium (AAgc)43, Beate st. Pourcain44, george davey smith1, John Henderson44, John P kemp1, nicholas J timpson1, Panos deloukas30, susan m Ring44, H-erich wichmann2,45,46, martina müller-nurasyid13,45,47,48, natalija novak49, norman klopp50, elke Rodríguez15,51, wendy mcArdle52, Allan linneberg53, torkil menné12, ellen A nohr54, Albert Hofman8,9, André g Uitterlinden8,9,55, cornélia m van duijn9, Fernando Rivadeneira8,9,55, Johan c de Jongste10, Ralf J P van der Valk8–10, matthias wjst56, Rain Jogi57, Frank geller17, Heather A Boyd17, Jeffrey c murray58, cecilia kim18, Frank mentch18, michael march18, massimo mangino19, tim d spector19, Veronique Bataille19, craig e Pennell20, Patrick g Holt59, Peter sly60, carla m t tiesler2,61, elisabeth thiering2, thomas Illig50,62, medea Imboden21,22, wenche nystad63, Angela simpson24, Jouke-Jan Hottenga25, dirkje Postma64, gerard H koppelman65, Henriette A smit66, cilla söderhäll67, Bo chawes7, eskil kreiner-møller7, Hans Bisgaard7, erik melén27,68, dorret I Boomsma25, Adnan custovic24, Bo Jacobsson23,69, nicole m Probst-Hensch21,22, lyle J Palmer70, daniel glass19, Hakon Hakonarson18,71, mads melbye17, deborah l Jarvis4, Vincent w V Jaddoe8,9,72, christian gieger13, the genetics of overweight Young Adults (goYA) consortium43, david P strachan73, nicholas g martin11, marjo-Riitta Jarvelin5,34,37,74, Joachim Heinrich2,76, david m evans1,76 & stephan weidinger15,76 for the eArly genetics & lifecourse epidemiology (eAgle) consortium43
1Medical Research Council (MRC) Centre for Causal Analyses in Translational Epidemiology (CAiTE), School of Social & Community Medicine, University of Bristol, Bristol, UK. 2Institute of Epidemiology I, Helmholtz Zentrum München, German Research Center for Environmental Health, Neuherberg, Germany. 3Department for Paediatric Pneumology, Allergy and Neonatology, Hannover Medical School, Hannover, Germany. 4Respiratory Epidemiology and Public Health, Imperial College London, London, UK. 5Department of Epidemiology and Biostatistics, School of Public Health, Imperial College London, London, UK. 6Department of Medical and
npg
© 2
012
Nat
ure
Am
eric
a, In
c. A
ll rig
hts
rese
rved
.

192 VOLUME 44 | NUMBER 2 | FEBRUARY 2012 Nature GeNetics
Molecular Genetics, King’s College London, Guy’s Hospital, London, UK. 7Copenhagen Prospective Studies on Asthma in Childhood (COPSAC), Health Sciences, University of Copenhagen and Copenhagen University Hospital, Gentofte, Denmark. 8The Generation R Study Group, Erasmus Medical Center, Rotterdam, The Netherlands. 9Department of Epidemiology, Erasmus Medical Center, Rotterdam, The Netherlands. 10Department of Pediatrics, Division of Respiratory Medicine, Erasmus Medical Center, Rotterdam, The Netherlands. 11Queensland Institute of Medical Research, Brisbane, Queensland, Australia. 12Department of Dermato-Allergology, National Allergy Research Centre, Gentofte Hospital, University of Copenhagen, Copenhagen. Denmark. 13Institute of Genetic Epidemiology, Helmholtz Zentrum München, German Research Center for Environmental Health, Neuherberg, Germany. 14Department of Dermatology and Allergy, Technische Universität München, Munich, Germany. 15Department of Dermatology, Allergology, and Venerology, University Hospital Schleswig-Holstein, Campus Kiel, Kiel, Germany. 16Graduate School of Information Science in Health, Technische Universität München, Munich, Germany. 17Department of Epidemiology Research, Statens Serum Institut, Copenhagen, Denmark. 18The Center for Applied Genomics, The Children’s Hospital of Philadelphia, Philadelphia, Pennsylvania, USA. 19Department of Twin Research and Genetic Epidemiology, King’s College London, London, UK. 20School of Women’s and Infants’ Health, The University of Western Australia, Perth, Western Australia, Australia. 21Swiss Tropical and Public Health Institute (Swiss TPH), Basel, Switzerland. 22University of Basel, Basel, Switzerland. 23Department of Genes and Environment, Division of Epidemiology, Norwegian Institute of Public Health, Oslo, Norway. 24Manchester Academic Health Science Centre, National Institute for Health Research (NIHR) Translational Research Facility in Respiratory Medicine, The University of Manchester, University Hospital of South Manchester National Health Service Foundation Trust, Manchester, UK. 25Department of Biological Psychology, VU University Amsterdam, Amsterdam, The Netherlands. 26Department of Epidemiology, Groningen Research Institute for Asthma and COPD (GRIAC), University of Groningen, University Medical Center Groningen, Groningen, The Netherlands. 27Institute of Environmental Medicine, Karolinska Institutet, Stockholm, Sweden. 28Institute of Clinical Molecular Biology, Christian-Albrechts-Universität zu Kiel, Kiel, Germany. 29Department of Genetic Medicine and Development, University of Geneva Medical School, Geneva, Switzerland. 30Wellcome Trust Sanger Institute, Cambridge, UK. 31Institute of Human Genetics, Technische Universität München, Munich, Germany. 32Institute of Human Genetics, Helmholtz Zentrum München, German Research Center for Environmental Health, Neuherberg, Germany. 33Department of Obstetrics and Gynaecology, University of Oulu, Oulu, Finland. 34National Institute for Health and Welfare (THL), Kuopio & Oulu, Finland. 35Department of Public Health and Clinical Nutrition, University of Eastern Finland, Kuopio, Finland. 36Department of Genomics of Common Disease, Imperial College London, London, UK. 37Institute of Health Sciences, Biocenter Oulu, University of Oulu, Oulu, Finland. 38Washington University School of Medicine, Saint Louis, Missouri, USA. 39Lung Institute of Western Australia, Perth, Western Australia, Australia. 40Centre for Asthma, Allergy and Respiratory Research, University of Western Australia, Perth, Western Australia, Australia. 41Centre for Molecular, Environmental, Genetic and Analytic Epidemiology, The University of Melbourne, Melbourne, Victoria, Australia. 42School of Paediatrics and Child Health, Princess Margaret Hospital for Children, Perth, Western Australia, Australia. 43A full list of consortium members is provided in the supplementary Note. 44The School of Social & Community Medicine, University of Bristol, Bristol, UK. 45Chair of Epidemiology, Institute of Medical Informatics, Biometry and Epidemiology, Ludwig-Maximilians-Universität München, Munich, Germany. 46Klinikum Grosshadern, Munich, Germany. 47Chair of Genetic Epidemiology, Institute of Medical Informatics, Biometry and Epidemiology, Ludwig-Maximilians-Universität München, Munich, Germany. 48Department of Medicine I, University Hospital Grosshadern, Ludwig-Maximilians-Universität München, Munich, Germany. 49Department of Dermatology and Allergy, University of Bonn Medical Center, Bonn, Germany. 50Unit for Molecular Epidemiology, Helmholtz Zentrum München, German Research Center for Environmental Health, Neuherberg, Germany. 51ZAUM–Center for Allergy and Environment, Helmholtz-Zentrum and Technische Universität, Munich, Germany. 52Avon Longitudinal Study of Parents and Children (ALSPAC) Laboratory, School of Social & Community Medicine, University of Bristol, Bristol, UK. 53Research Center for Prevention and Health, Glostrup University Hospital, Copenhagen, Denmark. 54Institute of Public Health, Aarhus University, Aarhus, Denmark. 55Department of Internal Medicine, Erasmus Medical Center, Rotterdam, The Netherlands. 56Comprehensive Pneumology Center and Institute of Lung Biology and Disease, Helmholtz Zentrum München, German Research Center for Environmental Health, Neuherberg, Germany. 57Lung Clinic, Tartu University Hospital, Tartu, Estonia. 58Department of Pediatrics, University of Iowa, Iowa City, Iowa, USA. 59Telethon Institute for Child Health Research and Centre for Child Health Research, The University of Western Australia, Perth, Western Australia, Australia. 60Queensland Children’s Medical Research Institute, University of Queensland, World Health Organization (WHO) Collaborating Centre for Research on Children’s Environmental Health, Brisbane, Queensland, Australia. 61Division of Metabolic Diseases and Nutritional Medicine, Dr von Hauner Children’s Hospital, Ludwig-Maximilians-Universität München, Munich, Germany. 62Hannover Unified Biobank, Hannover Medical School, Hannover, Germany. 63Division of Epidemiology, Norwegian Institute of Public Health, Oslo, Norway. 64Department of Pulmonology, University Medical Center Groningen, University of Groningen, Groningen, The Netherlands. 65Department of Pediatric Pulmonology and Pediatric Allergology, Beatrix Children’s Hospital, GRIAC, University Medical Center Groningen, University of Groningen, Groningen, The Netherlands. 66Julius Center for Health Sciences and Primary Care, University Medical Center Utrecht, Utrecht, The Netherlands. 67Department of Biosciences and Nutrition, Karolinska Institutet, Stockholm, Sweden. 68Astrid Lindgren Children’s Hospital, Karolinska University Hospital, Stockholm, Sweden. 69Department of Obstetrics and Gynecology, Sahlgrenska University Hospital, Sahlgrenska Academy, Göteborg University, Göteborg, Sweden. 70Ontario Institute for Cancer Research, Toronto, University of Toronto, Toronto, Canada. 71Department of Pediatrics, University of Pennsylvania School of Medicine, Philadelphia, Pennsylvania, USA. 72Department of Pediatrics, Erasmus Medical Center, Rotterdam, The Netherlands. 73Division of Population Health Sciences and Education, St George’s University of London, London, UK. 74MRC-HPA Centre for Environment and Health, Faculty of Medicine, Imperial College London, London, UK. 75These authors contributed equally to this work. 76These authors jointly directed this work. Correspondence should be addressed to L.P. ([email protected]).
l e t t e r s
npg
© 2
012
Nat
ure
Am
eric
a, In
c. A
ll rig
hts
rese
rved
.

Nature GeNeticsdoi:10.1038/ng.1017
ONLINe MeThODSDiscovery analysis. For the discovery analysis, we used 5,606 atopic derma-titis cases and 20,565 controls of European descent from 16 population-based cohorts, 10 of which were birth cohorts. Local research ethics committees approved the individual studies, and informed consent was obtained from all participants when necessary (see the Supplementary Note for full details of ethics and consent procedures for each study). Additional details on sample recruitment and phenotypes and summary details for each collection are given in the Supplementary Note and in Supplementary Table 1. Genome-wide genotyping was performed independently in each cohort with the use of various standard genotyping technologies (see Supplementary Table 2). Imputation was independently conducted for each study with reference to HapMap release 21 or 22 CEU phased genotypes, and association analysis was performed using logistic regression models based on an expected allelic dosage model for SNPs, adjusting for sex- and ancestry-informative principal components as necessary. SNPs with MAF <1% and poor imputation quality (r2 <0.3, if using MACH, or proper info <0.4, if using the IMPUTE imputation algorithm) were excluded. After genomic control at the level of the individual studies, we combined association data for ~2.5 million imputed and genotyped autosomal SNPs into an inverse variance fixed-effects additive model meta-analysis. There was little evidence for population stratification at the study level (λGC ≤ 1.08; Supplementary Table 2) or at the meta-analysis level (λGC = 1.02), and the quantile-quantile plot of the meta-statistic showed a marked excess of detectable association signals well beyond those expected by chance (Supplementary Fig. 1).
Replication analysis. For replication, we selected the most strongly associ-ated SNPs from the 10 most strongly associated loci in the discovery meta-analysis (all with P < 1 × 10⁻⁵ in stage I; Table 1). These SNPs were analyzed using in silico data from 11 GWAS sample sets not included in the discov-ery meta-analysis and de novo genotyping data from an additional 3 studies (Supplementary Tables 1 and 2), for a maximum possible replication sample size of 5,419 cases and 19,833 controls, all of European descent. Association analyses were again conducted for each study using a logistic regression model with similar covariate adjustments, based on expected allelic dosage for the in silico studies and allele counts in the de novo genotyping studies, and the results underwent meta-analysis with Stata 11.1 software (Statacorp LP). We applied a threshold of P < 5 × 10⁻⁸ for genome-wide significance and tested for overall heterogeneity of the discovery and replication studies using the Cochran’s Q statistic.
Immunochip analysis. In this analysis, we evaluated 1,553 German atopic dermatitis cases and 3,640 German population controls. Cases were obtained
from German university hospitals (Technical University Munich, as part of the GENEVA study, and University of Kiel). Atopic dermatitis was diagnosed on the basis of a skin examination by experienced dermatologists according to standard criteria, which included the presence of chronic or chronically relaps-ing pruritic dermatitis with the typical morphology and distribution6. Controls were derived from the Kooperative Gesundheitsforschung in der Region Augsburg (KORA) population-based surveys35 and the previously described population-based Popgen Biobank36. Of these samples, 767 of the cases and 983 of the controls were also part of the replication stage. Samples with >10% missing data, individuals from pairs of unexpected duplicates or relatives and individuals with outlier heterozygosities of greater than ±5 s.d. from the mean were excluded. The remaining Immunochip samples were tested for popula-tion stratification using the principal-components stratification method, as implemented in EIGENSTRAT37. The results of principal-component analysis revealed no evidence for population stratification. SNPs that had >5% missing data, MAF <1% or exact Hardy-Weinberg equilibrium (Pcontrols <1 × 10⁻⁴) were excluded. Association P values were calculated using χ2 tests (degree of freedom (d.f.) = 1) and conditional association was analyzed using logistic regression, with both implemented in PLINK38, from which we also derived OR values and their respective CIs.
ALSPAC expression analysis. RNA was extracted from LCLs generated from 997 unrelated ALSPAC individuals using an RNeasy extraction kit (Qiagen) and was amplified using the Illumina TotalPrep-96 RNA Amplification kit (Ambion). Expression was evaluated using Illumina HT-12 v3 BeadChip arrays. Each individual sample was run with two replicates. Expression data were normalized by quantile normalization between replicates and then by median normalization across individuals. For 949 ALSPAC individuals, both expression levels and imputed genome-wide SNP data were available (see ALSPAC replication cohort genotyping). For each of the three replicated SNPs that were associated with atopic dermatitis (rs479844, rs2164983 and rs2897442), we used linear regression in Mach2QTL to investigate the associa-tion between each SNP and any transcript within 500 kb of this SNP.
35. Holle, R., Happich, M., Löwel, H. & Wichmann, H.E. & MONICA/KORA Study Group. KORA—a research platform for population based health research. Gesundheitswesen 67 (suppl. 1), S19–S25 (2005).
36. Krawczak, M. et al. PopGen: population-based recruitment of patients and controls for the analysis of complex genotype-phenotype relationships. Community Genet. 9, 55–61 (2006).
37. Price, A.L. et al. Principal components analysis corrects for stratification in genome-wide association studies. Nat. Genet. 38, 904–909 (2006).
38. Purcell, S. et al. PLINK: a tool set for whole-genome association and population-based linkage analyses. Am. J. Hum. Genet. 81, 559–575 (2007).
npg
© 2
012
Nat
ure
Am
eric
a, In
c. A
ll rig
hts
rese
rved
.


Paper 3: Supplementary Material
65


1
META-ANALYSIS OF GENOME-WIDE ASSOCIATION STUDIES IDENTIFIES THREE NEW RISK LOCI FOR
ATOPIC DERMATITIS
Lavinia Paternoster; Marie Standl; Chih-Mei Chen; Adaikalavan Ramasamy; Klaus Bønnelykke;
Liesbeth Duijts; Manuel A Ferreira; Alexessander Couto Alves; Jacob P Thyssen; Eva Albrecht;
Hansjörg Baurecht; Bjarke Feenstra; Patrick MA Sleiman; Pirro Hysi; Nicole M Warrington; Ivan
Curjuric; Ronny Myhre; John A Curtin; Maria M Groen-Blokhuis; Marjan Kerkhof; Annika Sääf; Andre
Franke; David Ellinghaus; Regina Fölster-Holst; Emmanouil Dermitzakis; Stephen B Montgomery;
Holger Prokisch; Katharina Heim; Anna-Liisa Hartikainen; Anneli Pouta; Juha Pekkanen; Alexandra IF
Blakemore; Jessica L Buxton; Marika Kaakinen; David L Duffy; Pamela A Madden; Andrew C Heath;
Grant W Montgomery; Philip J Thompson; Melanie C Matheson; Peter Le Souëf; AAGC collaborators;
Beate St Pourcain; George Davey Smith; John Henderson; John P Kemp; Nicholas J Timpson; Panos
Deloukas; Susan M Ring; H-Erich Wichmann; Martina Müller-Nurasyid; Natalija Novak; Norman
Klopp; Elke Rodríguez; Wendy McArdle; Allan Linneberg; Torkil Menné; Ellen A Nohr; Albert Hofman;
André G Uitterlinden; Cornélia M van Duijn; Fernando Rivadeneira; Johan C de Jongste; Ralf JP van
der Valk; Matthias Wjst; Rain Jogi; Frank Geller; Heather A Boyd; Jeffrey C Murray; Cecilia Kim; Frank
Mentch; Michael March; Massimo Mangino; Tim D Spector; Veronique Bataille; Craig E Pennell;
Patrick G Holt; Peter Sly; Carla MT Tiesler; Elisabeth Thiering; Thomas Illig; Medea Imboden; Wenche
Nystad; Angela Simpson; Jouke-Jan Hottenga; Dirkje Postma; Gerard H Koppelman; Henriette A Smit;
Cilla Söderhäll; Bo Chawes; Eskil Kreiner-Møller; Hans Bisgaard; Erik Melén; Dorret I Boomsma;
Adnan Custovic; Bo Jacobsson; Nicole M Probst-Hensch; Lyle J Palmer; Daniel Glass; Hakon
Hakonarson; Mads Melbye; Deborah L Jarvis; Vincent WV Jaddoe; Christian Gieger; The GOYA
consortium; David P Strachan; Nicholas G Martin; Marjo-Riitta Jarvelin; Joachim Heinrich; David M
Evans; Stephan Weidinger for the EArly Genetics and Lifecourse Epidemiology (EAGLE) Consortium
Nature Genetics: doi:10.1038/ng.1017

2
SUPPLEMENTARY MATERIAL
i. Supplementary Note
Study sample descriptions
Collaborating consortia members
Acknowledgements
Funding
ii. Supplementary Tables
Supplementary Table 1. Study characteristics - discovery & replication
Supplementary Table 2. Study genetic & analysis methods - discovery & replication
Supplementary Table 3. Discovery and replication results of the top 11 SNPs for AD
Supplementary Table 4. AD association results from the discovery meta-analysis for the 15
loci associated with asthma or total serum IgE levels in a recent GWAS.
Supplementary Table 5. Meta-analysis results for interactions between the three identified
loci.
Supplementary Table 6. Immunochip association results for region 5q31.1
Supplementary Table 7. Immunochip linkage disequilibrium for region 5q31.1
iii. Supplementary Figures
Supplementary Figure 1. QQ plot for the discovery genome-wide association meta-analysis
Supplementary Figure 2. Regional association plots for the top 11 regions
Supplementary Figure 3. FLG adjusted meta-analysis
Supplementary Figure 4. 11q13 regional association plot and forest plot
Supplementary Figure 5. Forest plots of the association of the 7 SNPs which did not meet
genome-wide significance.
Supplementary Figure 6. MuTHER pilot skin eQTL data for probes within 1Mb of the SNP (a)
rs479844, (b) rs2164983 and (c) rs2897442 for 160 female twins.
Supplementary Figure 7. Regional association plots for 5q31.1 in the discovery cohorts (a)
no conditional SNPs and (b) conditional on rs2897442.
Supplementary Figure 8. Regional association plot of markers within the cytokine cluster
on 5q31.1.
Supplementary Figure 9. Stratified forest plots for SNPs associated with AD or with
evidence of heterogeneity.
iv. Supplementary References
Nature Genetics: doi:10.1038/ng.1017

3
SUPPLEMENTARY NOTE
Note on nomenclature
The extant nosology of atopic disease is confusing, and terms such as atopic dermatitis, eczema, atopic
eczema, endogenous eczema and flexural dermatitis are frequently used interchangeably in the literature.
Recently, a World Allergy Organization (WAO) report suggested the use of eczema as preferable to atopic
dermatitis1. However, in this article, we continued to use the term atopic dermatitis, as many studies used for
this project were designed prior to the WAO report and because this is the term used in many questionnaires
on which the results presented here are based.
STUDY SAMPLE DESCRIPTIONS
Australian Asthma Genetics Consortium (AAGC) replication cohort
As part of the AAGC, we performed a GWAS of asthma in 7,197 unrelated individuals of European ancestry
ascertained from the Australian population as described in detail elsewhere {Ferreira, submitted}. For this
analysis, we tested 10 SNPs for association with AD status in 3,881 individuals (49% males, mean age 35 years,
range 3 to 89), including 269 who reported having had AD at any point in their lifetime diagnosed by a doctor
and 3,612 AD-free controls. These individuals participated in one of five studies: QIMR (N=3,132), CAPS (N=53),
LIWA (N=474), MESCA (N=64) or TAHS (N=158). The QIMR individuals included in the AAGC analysis are
unrelated to those included in the QIMR discovery cohort described below. Genotyping was performed with
Illumina 610K or 370K arrays and stringent quality control filters applied as described in Supplementary Table
2. Imputation to HapMap 3 (all 11 populations, Feb 2009 release) and 1000 Genomes Project (CEU, Mar 2010
release) SNPs was performed with Impute2 and SNPs tested for association with disease status using logistic
regression in PLINK, with sex and array type included as a covariate. Participants provided informed consent to
participate in this study, which was approved by the respective ethics committees.
The Avon Longitudinal Study of Parents and Children (ALSPAC)
The Avon Longitudinal Study of Parents and their Children (ALSPAC) is a longitudinal population-based birth
cohort that recruited pregnant women residing in Avon, UK, with an expected delivery data between 1st April
1991 and 31st December 1992. 14,541 pregnant women were initially enrolled with 14,062 children born (see
2 and website http://www.alspac.bris.ac.uk). Biological samples including DNA have been collected for 10,121
of the children from this cohort. Ethical approval was obtained from the ALSPAC Law and Ethics committee
and relevant local ethics committees, and written informed consent provided by all parents. Questionnaire
data has been collected regularly, with extensive questions, including those relating to AD. In this study we
included data from the following questions, asked when the children were approximately 81, 91, 103 months,
10, 13 and 14 years [possible answers]:
Nature Genetics: doi:10.1038/ng.1017
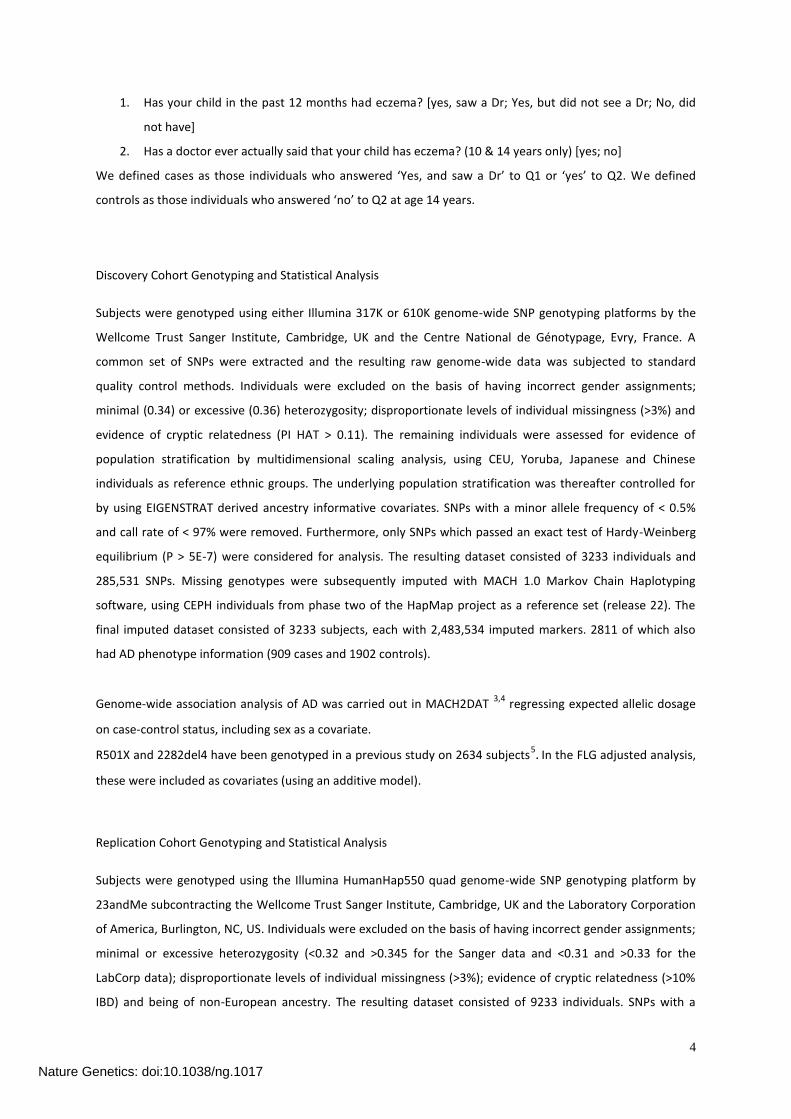
4
1. Has your child in the past 12 months had eczema? [yes, saw a Dr; Yes, but did not see a Dr; No, did
not have]
2. Has a doctor ever actually said that your child has eczema? (10 & 14 years only) [yes; no]
We defined cases as those individuals who answered ‘Yes, and saw a Dr’ to Q1 or ‘yes’ to Q2. We defined
controls as those individuals who answered ‘no’ to Q2 at age 14 years.
Discovery Cohort Genotyping and Statistical Analysis
Subjects were genotyped using either Illumina 317K or 610K genome-wide SNP genotyping platforms by the
Wellcome Trust Sanger Institute, Cambridge, UK and the Centre National de Génotypage, Evry, France. A
common set of SNPs were extracted and the resulting raw genome-wide data was subjected to standard
quality control methods. Individuals were excluded on the basis of having incorrect gender assignments;
minimal (0.34) or excessive (0.36) heterozygosity; disproportionate levels of individual missingness (>3%) and
evidence of cryptic relatedness (PI HAT > 0.11). The remaining individuals were assessed for evidence of
population stratification by multidimensional scaling analysis, using CEU, Yoruba, Japanese and Chinese
individuals as reference ethnic groups. The underlying population stratification was thereafter controlled for
by using EIGENSTRAT derived ancestry informative covariates. SNPs with a minor allele frequency of < 0.5%
and call rate of < 97% were removed. Furthermore, only SNPs which passed an exact test of Hardy-Weinberg
equilibrium (P > 5E-7) were considered for analysis. The resulting dataset consisted of 3233 individuals and
285,531 SNPs. Missing genotypes were subsequently imputed with MACH 1.0 Markov Chain Haplotyping
software, using CEPH individuals from phase two of the HapMap project as a reference set (release 22). The
final imputed dataset consisted of 3233 subjects, each with 2,483,534 imputed markers. 2811 of which also
had AD phenotype information (909 cases and 1902 controls).
Genome-wide association analysis of AD was carried out in MACH2DAT 3,4
regressing expected allelic dosage
on case-control status, including sex as a covariate.
R501X and 2282del4 have been genotyped in a previous study on 2634 subjects5.
In the FLG adjusted analysis,
these were included as covariates (using an additive model).
Replication Cohort Genotyping and Statistical Analysis
Subjects were genotyped using the Illumina HumanHap550 quad genome-wide SNP genotyping platform by
23andMe subcontracting the Wellcome Trust Sanger Institute, Cambridge, UK and the Laboratory Corporation
of America, Burlington, NC, US. Individuals were excluded on the basis of having incorrect gender assignments;
minimal or excessive heterozygosity (<0.32 and >0.345 for the Sanger data and <0.31 and >0.33 for the
LabCorp data); disproportionate levels of individual missingness (>3%); evidence of cryptic relatedness (>10%
IBD) and being of non-European ancestry. The resulting dataset consisted of 9233 individuals. SNPs with a
Nature Genetics: doi:10.1038/ng.1017
5
minor allele frequency of < 1% and call rate of < 95% were removed. Furthermore, only SNPs which passed an
exact test of Hardy-Weinberg equilibrium (P > 5E-7) were considered for analysis. Genotypes were
subsequently imputed with MACH 1.0.16 Markov Chain Haplotyping software, using CEPH individuals from
phase 2 of the HapMap project as a reference set (release 22). Of the 9233 ALSPAC genotyped individuals,
2903 also had AD phenotype information (895 cases and 2008 controls) and were not included in the ALSPAC
discovery set.
Replication association analysis of the 10 SNPs was carried out as per the discovery cohort methods.
BAMSE
BAMSE is a Swedish birth cohort study. A total number of 4,089 newborn infants were recruited between 1994
and 1996 in the Stockholm area6.
The first questionnaire data, dealing with parental allergic diseases, socio-
economic status and residential characteristics, was obtained when the children were about 2 months. Similar
questionnaires with a focus on the children’s symptoms related to asthma and allergic diseases including
eczema were answered by the parents when the children were approximately 1, 2, 4 and 8 years old. At 8
years of age, all children were invited to clinical testing, and blood samples were obtained from 2,480 children
(~60%). DNA was extracted from 2,033 samples after exclusion of samples with too little blood, lack of
questionnaire data, or if parental consent to genetic analysis of the sample was not obtained. From these
samples, all children with a doctor’s diagnosis of asthma (ever) and children with no history of eczema or other
allergic diseases (controls) underwent GWAS genotyping7.
Among asthmatics, all children with doctor’s
diagnosis of eczema (ever) were identified and after QC, a total of 100 eczema (ever) cases and 246 controls
were included in this study.
BAMSE genotyping was conducted as part of the GABRIEL consortium. Genotyping in GABRIEL was carried out
at Centre National de Génotypage (Evry, France) using the Illumina Human610 quad array (Illumina, Inc., San
Diego, CA)7. An ancestry analysis was performed using EIGENSTRAT, and putative non-Caucasian samples were
flagged as outliers and eliminated from subsequent analyses. Imputation to HapMap CEU release 22 was
conducted using MACH v.1.0.16 with option MLE (original genotypes were only replaced if the underlying
reference haplotypes strongly contradict the input genotypes). Samples from the British 1958 birth cohort
(B58C) with greater than 95% genotyping success rate were selected to estimate model parameters of error
rates and recombination rates for step 1 of the imputation procedure. In step 2, all GABRIEL cohorts were
imputed, no SNP/sample QC filters were applied to individual cohorts prior to this.
Genome-wide association analysis of AD was carried out in ProbAbel8 regressing expected allelic dosage on
case-control status, including sex as a covariate. The study was approved by the Ethics Committee of
Karolinska Institutet, Stockholm, Sweden.
British 1958 birth cohort (B58C)
Nature Genetics: doi:10.1038/ng.1017

6
The British 1958 birth cohort is an ongoing follow-up of all persons born in England, Scotland and Wales during
one week in 1958. At age 7 years, a history of eczematous rashes was obtained by interview with a parent, and
the presence of visible AD on skin examination was recorded by a school medical officer9.
For the purpose of
this meta-analysis, cases were defined by a positive interview response for either AD during the first year of
life, or AD after the first year (ie. ages 1-7), or both. (The results of skin examination were not used to define
cases.) Controls were defined as children with no parentally reported history of AD by age 7, and no record of
AD on skin examination at age 7.
At the age of 44-45 years, the cohort were followed up with a biomedical examination and blood sampling 10
,
from which a DNA collection was established as a nationally representative reference panel
(http://www.b58cgene.sgul.ac.uk/). The discovery phase of the analysis used two non-overlapping subsets of
the DNA collection which were selected as controls for use by the Wellcome Trust Case-Control Consortium
(WTCCC) 11
and the Type 1 Diabetes Genetics Consortium (T1DGC)12.
Genotyping by the WTCCC used the
Affymetrix 500K array and the T1DGC used the Illumina 550K array. Imputations using the HapMap 2 (release
21) template were performed using SNPTEST for the WTCCC subset and MACH for the T1DGC subset. Within-
cohort logistic regression analyses for AD were performed using Quicktest for the WTCCC subset and ProbAbel
for the T1DGC subset.
In silico replication analyses were performed using Illumina 550K/610K genotypes deposited by the GABRIEL
consortium 7 and by the WTCCC on cohort members that had not been included in the discovery sets.
Imputations for the replication set using the HapMap 2 (release 21) template were performed using MACH and
within-cohort logistic regression analyses for eczema were performed using ProbAbel.
CHOP
CHOP patients and controls were recruited at the Children’s Hospital of Philadelphia between 2006 and 2010.
All subjects were of self-reported Caucasian origin and resident in the Greater Philadelphia area. Ethical
approval for this study was obtained from the Institutional Revue Board of the Children’s Hospital of
Philadelphia. The study included 519 patients with physician-diagnosed eczema and 1004 disease-free controls
without eczema. Cases were defined by the presence of the ICD9 code for eczema (691.8) in their electronic
medical records. All CHOP samples were genotyped on either the Illumina HH550 or HH610 BeadChips
(Illumina, San Diego) at the Center for Applied Genomics.
In addition to self-reported ancestry, Principal Component Analysis was carried on all cases and controls using
smartPCA to reduce the risk of population stratification. Mean age of the case cohort was 9 years and 51%
were males and 49% females.
Genotyping QC measures, imputation, analysis
Prior to imputation, quality control was carried out in plink resulting in the exclusion of 10,930 SNPs with call
rates <95%, 22,252 SNPs with a minor allele frequency (MAF) <1% and 13,181 SNPs with Hardy Weinberg
Nature Genetics: doi:10.1038/ng.1017

7
equilibrium P<10-5
; the genomic inflation factor (GIF) was 1.05. Imputation was carried out using Impute
version 1, and the HapMap release 22 haplotypes as a reference. Statistical analysis was carried out using
SNPTEST, assuming an additive model and taking genotype uncertainty into account.
COPSAC
The COPSAC birth cohort study is a prospective clinical study of a birth cohort of 411 infants born to mothers
with a history of asthma. The newborns were enrolled at the age of 1 month, the recruitment of which was
previously described in detail13-15.
The study was approved by the Ethics Committee for Copenhagen (KF 01-
289/96) and The Danish Data Protection Agency (2008-41-1754) and informed consent was obtained from
both parents. The families used doctors employed at the clinical research unit, and not the family practitioner,
for diagnosis and treatment of AD and other skin-related symptoms. Skin lesions were described at both
scheduled visits at 6-monthly intervals and acute visits with skin symptoms according to pre-defined
morphology and localization; AD was defined based on the Hanifin-Rajka criteria as previously detailed16-18.
High throughput genome-wide SNP genotyping were performed using the Illumina Infinium™ II HumanHap550
v1, v3 or quad BeadChip platform (Illumina, San Diego), at the Children’s Hospital of Philadelphia’s Center for
Applied Genomics, as described previously19.
Statistical analysis was carried out using SNPTEST, assuming an additive model and taking genotype
uncertainty into account.
Danish National Birth Cohort (DNBC)
DNBC is a population-based cohort of more than 100,000 pregnancies, recruited in the years 1996-200220.
Extensive phenotype information was collected by computer-assisted telephone interviews twice during
pregnancy as well as 6 and 18 months after delivery. An additional questionnaire-based follow-up survey was
conducted when the children reached 7 years of age. Cases with early onset AD were identified from the 18
months telephone interview data using an algorithm specifically developed for this purpose21.
In addition,
children with a positive response to both of the following two questions from the 7 year survey were included
in the case group: 1) “Has a doctor ever said that your child had AD, also known as allergic rash?” and 2) “Has
your child ever had an itchy rash which was coming and going for at least 6 months?”. Finally, children with
ICD10 diagnosis code L20 in the Danish Hospital Discharge Register were also included in the case group.
Controls were required not to have any AD or AD symptoms recorded in interview, questionnaire, or register
data. GWAS data were generated for 3,840 individuals from the DNBC (mothers and their children) in a study
of prematurity and its complications (Principal investigator Jeff Murray) within the Gene Environment
Association Studies (GENEVA) consortium. AD information and genome-wide genotype and imputed data were
available for 1,641 children. Imputation was carried out with MACH, using HapMap CEU release 22 as the
reference panel. Logistic regression analysis for AD was performed with MACH2DAT, using imputed allele
dosages and including sex as a covariate.
Nature Genetics: doi:10.1038/ng.1017

8
The DNBC study protocol was approved by the Danish Scientific Ethical Committee and the Danish Data
Protection Agency.
ECRHS
Details of the methods of ECRHS I and ECRHS II, a multicentre international cohort study, have been published
elsewhere22,23.
Participants within the ECRHS were eligible for inclusion in this analysis if they were identified
by random sampling of those who fulfilled the following criteria 1) lived in centres that took part in genome-
wide genotyping initiative under the auspices of GABRIEL7 AND 2) were initially selected to take part in the
ECRHS clinical measurements as part of the random sample (ie not specifically selected for inclusion because
of any pre-existing disease). Cases were those answering positively to the questions ‘Have you ever had an
itchy rash that was coming and going for at least 6 months?’ AND yes to ‘Have you had this itchy rash in the
last 12 months?’ during ECRHS II (aged 27-58). Further information on the distribution of eczema within the
cohort is available24.
Genotyping and imputation was carried out within the GABRIEL consortium, details in BAMSE methods (page
S5). Genome-wide association analysis of AD was carried out in ProbABEL regressing expected allelic dosage on
case-control status, adjusted for sex, recruitment centre and first two principal components informative of
European ancestry.
Each participating centre obtained ethical permission from the appropriate local committee.
Generation R
The Generation R Study is a population-based prospective cohort study of pregnant women and their children
from fetal life onwards in Rotterdam, The Netherlands25,26.
All children were born between April 2002 and
January 2006, and currently followed until young adulthood. Of all eligible children in the study area, 61% were
participating in the study at birth26.
Cord blood samples including DNA have been collected at birth. Postnatal
data about eczema was annually collected by questionnaires at the ages of 1 to 5 years. Response rates for the
questionnaires were 71%, 76%, 72%, 73% and 74%, respectively26.
For the current study, 1,115 children were
included in the discovery analysis (males, n = 594 (53%)). A total number of 620 children were available for the
replication analyses (males, n = 299 (48%). Questions about eczema were ‘Has your child in the past 12 months
had eczema [yes, saw a doctor; Yes, but did not see a doctor; No, did not have] (age 1 to 4 years)?’ and ‘Has
your child ever had eczema [yes; no] (age 5)?’. We defined cases as those children of whom parents answered
their child ‘Yes, had eczema and saw a doctor’ or ‘Yes, ever had eczema’. We defined controls as those children
of whom parents answered their child ‘No, never had eczema’ and ‘Yes, had eczema but did not see a
doctor/No, did not have eczema’. The current study used the first set of Generation R samples of Northern
European Ancestry. Samples were genotyped using Illumina Infinium II HumanHap610 Quad Arrays following
standard manufacturer's protocols. Intensity files were analyzed using the Beadstudio Genotyping Module
software v.3.2.32 and genotype calling based on default cluster files. Any sample displaying call rates below
97.5%, excess of autosomal heterozygosity (F<mean-4SD) and mismatch between called and phenotypic
Nature Genetics: doi:10.1038/ng.1017

9
gender were excluded. In addition, individuals identified as genetic outliers by the IBS clustering analysis (> 3
standard deviations away from the HapMap CEU population mean) an one of 2 pairs of identical twins (IBD
probabilities =1) were excluded from the analysis. After quality control (QC) 2,729 children were included in
the analyses. Genotypes were imputed for all polymorphic SNPs from phased haplotypes in autosomal
chromosomes of the HapMap CEU Phase II panel (release 22, build 36) oriented to the positive (forward)
strand. Genotyped SNPs with minor allele frequency < 0.01, SNP Call Rate < 0.98 and HWE P-value < 1x10⁻⁶
were filtered. After marker pruning 503,248 SNPs were used for imputation (MACH v 1.0.16) of 2,543,887
SNPs. Association analysis for directly genotyped data were carried out in PLINK implemented on BCSNPmax
and for imputed data were ran using MACH2DAT implemented in the GRIMP27
user interface platform. The
study protocol was approved by the Medical Ethical Committee of the Erasmus Medical Centre, Rotterdam
(MEC 217.595/2002/20). Written informed consent was obtained from all participants.
Genetics of Overweight Young Adults (GOYA) women’s study
In total, 91,387 pregnant women were recruited to the Danish National Birth Cohort during 1996-2002, 67,853
of whom gave birth to a live born infant and had provided a blood sample during pregnancy. The GOYA study
includes a subset of these women, selected for genome-wide genotyping according to their BMI and is
described in full elsewhere28,29.
The 4% (2,451) of the women with the largest residuals from the regression of
BMI on age and parity and a random sample of similar size (2,450) drawn from the remaining distribution were
selected for genotyping. Pertinent to this study, the women were asked questions about eczema during a
telephone interview at ~16 weeks of gestation. The questions were:
1. Have you ever had any skin disease?
2. Was the skin disease diagnosed by a doctor?
3. What kind of skin disease?
Cases were defined as those that answered “yes” to Qs 1 and 2, and ‘AD’ to Q3. Controls were defined as
those that answered “no” to Q1.
The GOYA study was approved by the regional scientific ethics committee and by the Danish Data Protection
Board.
Genome-wide genotyping on the Illumina 610k quad chip was carried out at the Centre National de
Génotypage (CNG), Evry, France. We excluded SNPs with minor allele frequency <1%, >5% missing genotypes
or which failed an exact test of Hardy-Weinberg equilibrium (HWE) in the controls (p<10-7). We also excluded
any individual who did not cluster with the CEU individuals (Utah residents with ancestry from northern and
western Europe) in a multidimensional scaling analysis seeded with individuals from the International HapMap
release 22, who had >5% missing data, outlying heterozygosity of >35% or <30.2%, both samples in the case of
genetic duplicates, one of each pair of genetically related individuals, individuals with sex discrepancies and
individuals whose genotyping was discordant with a previous project. After data cleaning, 3,908 women and
545,349 SNPs remained. We carried out imputation to HapMap release 22 (CEU individuals) using Mach 1.0,
Markov Chain Haplotyping3,4.
Nature Genetics: doi:10.1038/ng.1017

10
Logistic genome-wide association analysis for AD (with no covariates) was carried out in MACH2DAT3,4.
The Danish Glostrup Cohort (Health2006)
Between June 2006 and May 2008, a cross-sectional study was performed in the general population in
Copenhagen, the Capital of Denmark. A random sample of 7931 subjects aged 18–69 years old was obtained
from the Danish Central Personal Register, Ministry of Internal Affairs. All were Danish adults with Danish
citizenship and born in Denmark. A total of 3471 (44%) subjects participated in a general health examination
and 3329 (95.9%) responded to the question about atopic dermatitis. The participation rate was higher among
older age-groups than among younger age groups in both genders30.
The Ethical Committee of Copenhagen
County approved the study (KA-20060011). A written informed consent form was obtained from all
participants prior to the beginning of the study.
All participants were mailed a standard invitation letter and a questionnaire about health, lifestyle, and
socioeconomic factors. AD was defined by the U.K. Working Party’s diagnostic criteria for atopic dermatitis as a
history of an itchy skin condition plus a minimum of two of four minor criteria31.
Genotyping of SNPs was performed by the PCR KASPar genotyping system (KBiosciences, Hoddesdon, UK).
None of the SNPs deviated from HW equilibrium (p>0.05 for all SNPs). Lowest call rate for SNPs was 0.98.
Data analyses were performed using the Statistical Products and Service Solutions package (SPSS Inc., Chicago,
IL, U.S.A.) for Windows (release 15.0).
KORA
The Cooperative Health Research in the Region of Augsburg (KORA) study is a series of independent
population-based epidemiological surveys and follow-up studies of participants living in the region of
Augsburg, Southern Germany32.
All participants are of German nationality identified through the registration
office and informed consent has been given by all participants. The study has been approved by the local
ethics committee. Participants were examined in 1994/95 (KORA S3) or 1999/2001 (KORA S4) and in the
follow-up examinations in 2004/05 (KORA F3) and 2006/08 (KORA F4). All KORA subjects had completed a
standardized questionnaire which next to demographic data included the basis allergy questions of the
European Community Respiratory Health Survey (ECRHS) on respiratory health22.
AD was diagnosed based on a
reported physician’s diagnosis in the past. For the genome-wide association study we genotyped 1,644
randomly selected participants of KORA F3 using Affymetrix 500K and 1,814 randomly selected participants of
KORA F4 using Affymetrix 6.033
. Genome-wide association analysis of AD was carried out using logistic
regression in SNPTEST V2 (http://www.stats.ox.ac.uk/~marchini/software/gwas/snptest.html), including sex as
a covariate.
For replication purpose 1100 AD cases of self-reported German ethnicity were obtained from the GENEVA
(Genetic evaluation of atopic dermatitis) study from the Department of Dermatology and Allergy, Technical
Nature Genetics: doi:10.1038/ng.1017
11
University Munich34.
AD was diagnosed on the basis of a skin examination by experienced dermatologists
according to standard criteria in the presence of a chronic or chronically relapsing pruritic dermatitis with the
typical morphology and distribution35.
KORA controls were selected of the remaining KORA F4 sample which
was not included in the GWAS analysis. De novo replication analysis was carried with R 2.12.2 (http://www.R-
project.org) using logistic regression adjusted for sex. Genetic information entered the model as allele counts.
LISA/GINI
The influence of Life-style factors on the development of the Immune System and Allergies in East and West
Germany PLUS the influence of traffic emissions and genetics (LISAplus) Study is a population based birth
cohort study. A total of 3097 healthy, fullterm neonates were recruited between 1997 and 1999 in Munich,
Leipzig, Wesel and Bad Honnef. The participants were not pre-selected based on family history of allergic
diseases36.
A total of 5991 mothers and their newborns were recruited into the German Infant study on the influence of
Nutrition Intervention PLUS environmental and genetic influences on allergy development (GINIplus) between
September 1995 and June 1998 in Munich and Wesel. Infants with at least one allergic parent and/or sibling
were allocated to the interventional study arm investigating the effect of different hydrolysed formulas for
allergy prevention in the first year of life37.
All children without a family history of allergic diseases and children
whose parents did not give consent for the intervention were allocated to the non-interventional arm.
Detailed descriptions of the LISAplus and GINIplus studies have been published elsewhere 36
and 37
,
respectively).
Information on ever having physician-diagnosed AD was collected using self-administered questionnaires
completed by the parents. The questionnaires were completed at 6, 12, 18 and 24 months and 4, 5, 6 years of
age in the LISAplus study and 1, 2, 3, 4 and 6 years in the GINIplus study asking for each year of age since the
previous follow-up. DNA was collected at the age 6 and 10 years. For both studies, approval by the local Ethics
Committees and written consent from participant’s families were obtained.
In the discovery analysis, 379 children from the LISAplus study from Munich were included (number of boys:
227 (57%)). DNA was analysed using the Affymetrix Human SNP Array 5.0 for each individual. Genome-wide
data was called using BRLMM-P algorithm and imputed in IMPUTE38.
Genome-wide association analysis of AD was carried out in SNPTEST V1
(http://www.stats.ox.ac.uk/~marchini/software/gwas/snptest.html) regressing expected allelic dosage on
case-control status, including sex as a covariate.
For replication, 665 children from Munich from both studies were included (499 (75%) children from the
GINIplus study and 166 (25%) children from the LISAplus study)). 583 individuals (499 from the GINIplus study
and 84 from the LISA study) were analysed using the Affymetrix Human SNP Array 5.0 and 82 individuals from
the LISAplus study were analysed using Affymetrix Human SNP Array 6.0. Genotypes were called using
BRLMM-P algorithm (5.0), respectively BIRDSEED V2 algorithm (6.0), imputed in IMPUTE239
and genome-wide
Nature Genetics: doi:10.1038/ng.1017

12
association analysis of AD was carried out in SNPTEST V2
(http://www.stats.ox.ac.uk/~marchini/software/gwas/snptest.html) regressing expected allelic dosage on
case-control status, including sex as a covariate.
Manchester Asthma and Allergy Study (MAAS)
The Manchester Asthma and Allergy Study is an unselected, population-based prospective study which follows
the development of atopic disorders in a cohort of children described in detail elsewhere40-44.
The setting is the
maternity catchment area of Wythenshawe and Stepping Hill Hospitals, comprising of 50 square miles of South
Manchester and Cheshire, UK, a stable mixed urban-rural population. Study was approved by the Local
Research Ethics Committee. Informed consent was obtained from all parents.
Screening & Recruitment
All pregnant women were screened for eligibility at antenatal visits (8th-10th week of pregnancy). The study
was explained to the parents, and informed consent for initial questionnaires and skin prick testing was
obtained. Both parents completed a questionnaire about their and their partner’s history of asthma and
allergic diseases and smoking habits.
If the pregnant woman’s partner was not present at the antenatal clinic visit, an invitation was sent for him to
attend an open-access evening clinic for skin prick testing and questionnaire. Once both parents had
completed questionnaires and skin prick testing, a full explanation of the proposed future follow-up for the
child was given. Of the 1499 couples who met the inclusion criteria (<10 weeks of pregnancy, maternal age >18
years, questionnaire and skin test data available for both parents), 288 declined to take part in the study. A
total of 1185 participants had at least some evaluable data.
Follow-up
The children have been followed prospectively, and attended review clinics at ages 1, 3, 5 and 8 years (±4
weeks).
Definitions of outcomes
AD: Information on the age of onset of parentally-reported AD was collected using an interviewer-
administered validated ISAAC questionnaire to collect information on parentally reported symptoms,
physician-diagnosed illnesses and treatments received.
In this analysis eczema was defined as a positive answer to the question “Has your child ever suffered from
eczema?”. The association study was carried out in the 761 MAAS individuals for which both genotype and
phenotype data was available.
Genotyping
DNA samples were genotyping on an illumina 610 quad chip. The illumina genotypes were called using the
Illumina GenCall application following the manufacturer’s instructions. Quality control criteria for samples
Nature Genetics: doi:10.1038/ng.1017

13
included: 97% call rate, exclusion of samples with an outlier autosomal heterozygosity (scree-plot visualisation)
gender validation and sequenome genotype concordance. Quality control criteria for SNPs included a 95% call
rate, HWE > 5.9x10⁻⁷
, minor allele frequency > 0.005. Genotypes were imputated with IMPUTE version 2.1.2
with 1000 genomes and hapmap phase 3 reference genotypes. Association analysis was carried out using
SNPTEST version 2.1 using frequentist with the score method.
The Norwegian Mother and Child Cohort Study (MoBa)
The Norwegian Mother and Child Cohort Study (MoBa) is a prospective population-based pregnancy cohort
study conducted by the Norwegian Institute of Public Health45,46.
Participants were recruited from all over
Norway from 1999-2008, and 38.5% of invited women consented to participate. The cohort now includes
108,000 children, 90,700 mothers and 71,500 fathers. Blood samples were obtained from both parents during
pregnancy and from mothers and children (umbilical cord) at birth. Follow-up is conducted by questionnaires
at regular intervals and by linkage to national health registries.
The current study is based on version 4 of the quality-assured data files and included participants that were
recruited between 1999-2005. Informed consent was obtained from each MoBa participant upon recruitment.
The study was approved by The Regional Committee for Medical Research Ethics in South-Eastern Norway and
the Norwegian Data Inspectorate.
The cases were indentified from questionnaires at the child’s age 6, 18 and 36 months defined by the following
questions: Does your child have or has he/she had any of the following health problems? Atopic eczema was
listed as one of several items here. If yes was entered on the first question, a second were asked: has the
mother and child health care centre or someone else referred your child for further specialist investigation Our
cases were restricted to unique cases across age 6, 18 and 36 months with yes on both questions.
Consequently the controls were unique controls across age 6, 18 and 36 months with no on both questions.
The genotype platform used were Illumina 660W and imputed SNPs were only included if the met the
recommended threshold for imputation quality (PLINK INFO >0.8). Logistic regression analyses for AD was
performed using an additive model in PLINK, including sex as a covariate. The children included in this study
are originally genotyped for a case control study (n=1200 children) of spontaneous preterm delivery.
The Northern Finland Birth Cohort 1966 (NFBC66)
The Northern Finland Birth Cohort 1966 is a prospective follow-up study of children from the two
northernmost provinces of Finland47.
Women with expected delivery dates in 1966 were recruited through
maternity health centres48.
Cohort members living in northern Finland or in the capital area were invited to a
clinical examination as well as questionnaire at age 31 years. DNA was extracted from blood samples given at
the clinical examination49.
For the purpose of this meta-analysis, we included data from the following
questions:
Nature Genetics: doi:10.1038/ng.1017

14
1. Have you had eczema (infantile, atopic or allergic)?
2. If yes, have you ever been treated by a doctor
Individuals who answered yes to both questions were defined as cases (1208). Individuals that answered no to
the first question were defined as controls (2294). Genotyping was completed at the Broad Institute Biological
Sample Repository in participants with available DNA using Illumina HumanCNV370DUO Analysis BeadChip
array for 339,629 SNPs. We excluded 3,345 SNPs from analysis because HWE was not met at a level p <0.0001,
55 because of low call rate (<95%) and 7,681 because the MAF was <1%, leaving 329,091 SNPs for the
association analysis. Imputation was conducted using the algorithm implemented in IMPUTE and association
analysis using quicktest50.
Informed consent for the use of the data including DNA was obtained from all
subjects. The study was approved by the ethics committees in Oulu (Finland) and Oxford (UK) universities in
accordance with the Declaration of Helsinki.
Northern Finland Birth Cohort 1986 (NFBC86)
The Northern Finland Birth Cohort 1986 comprises 9432 live-born children with an expected date of birth
between July 1, 1985, and June 30, 1986 from the two northernmost provinces of Finland, Oulu and Lapland.
The cohort covers over 99% of all the deliveries in the target area during that time (N=9,362 mothers with
N=9,432 liveborn children)51.
At the age of 16, the cohort members were sent a postal questionnaire including
questions on eczema, and 80% returned it. At the same time, they were invited to a clinical examination with
74% taking part in it. DNA was extracted from blood samples given at the clinical examination for 6,266
subjects. For the purpose of this meta-analysis, we included data from 1717 individuals that answered the
following questions:
1. Have you ever had eczema which has been called infantile eczema, atopic eczema or allergic eczema?
2. Diagnosed or treated by a doctor?
Individuals who answered yes to both questions were defined as cases (316). Individuals that answered no to
the first question were defined as controls (1401). Genotyping was performed by KBiosciences (Hoddesdon)
using their own system of fluorescence-based competitive allele-specific PCR (KASPar) with genotype success
rate >97%. Association analysis was conducted using quicktest50.
Informed consent for the use of the data
including DNA was obtained from all subjects at the age of 16 years. The study was approved by ethics
committees in Oulu (Finland) university in accordance with the Declaration of Helsinki.
Netherlands Twin Register (NTR)
The Netherlands Twin Register (NTR) is a large population based study that registers approximately 40% of all
multiple births in the Netherlands since 198652.
At age 5 of the children, a survey is sent out in which the
Nature Genetics: doi:10.1038/ng.1017

15
parents of the twins are asked to indicate for each child separately whether a doctor has ever diagnosed
eczema. A similar question concerns doctor diagnosed baby eczema53.
Blood and/or buccal samples for DNA extraction were collected for a subsample of the NTR in several projects.
Genotyping was performed on the Affymetrix Human SNP Array 6.0 in the Avera Institute, Sioux Falls, South
Dakota (USA). Genotypes were called using the BIRDSEED V2 algorithm and imputed in BEAGLE in the MD
Anderson Cancer Center, Houston, Texas (USA). After QC, one individual of each family was selected. If both
twins were cases or controls, one individual was picked at random, otherwise the case was selected. A total of
123 cases and 306 controls were included in the study. Logistic regression analyses were performed using an
additive model in PLINK, including sex as a covariate. The study was approved by the Medical Ethical
Committee of the VU Medical Centre, Amsterdam, the Netherlands (IRB00002991).
PIAMA
PIAMA is a birth cohort study consisting of two parts: a placebo controlled intervention study in which the
effect of mite impermeable mattress covers was studied and a natural history study in which no intervention
took place. Details of the study design have been published previously54.
Recruitment took place in 1996-1997.
A screening questionnaire was distributed to pregnant women visiting one of 52 prenatal clinics at three
regions in the Netherlands. A total of 10,232 pregnant women completed a validated screening questionnaire.
Mothers reporting a history of asthma, current hay fever or allergy to pets or house dust mite were defined as
allergic. Based on this screening, 7862 women were invited to participate, of whom 4,146 women (1327
allergic and 2819 nonallergic) gave written informed consent. The response rates to the annual questionnaires
ranged from 3030 (92%) at age 1 to 2732 (83%) at age 8 years. DNA was collected from 2162 children at age 4
and/or 8 years. Genome-wide genotyping was performed within the framework of the Gabriel Consortium7.
For this, DNA samples from 213 children with parental reported doctor diagnosed asthma ever at age 8 years
and from 213 controls without doctor diagnosed asthma or wheeze ever at age 8 years were provided. From
these children, 186 cases of eczema and 167 controls were selected for the current study. Cases of eczema
were defined as parental reported doctor diagnosed eczema ever at age 2 years or doctor diagnosed eczema
in the last 12 months at ages 3, 4, 5, 6 ,7 or 8 years. Controls were defined as children whose parents denied
the presence of doctor diagnosed eczema in the last 12 months at all ages. Genotyping was performed with an
Illumina Human610 quad array. SNPs were excluded that fullfilled one or more of the following criteria: p-
value for test of Hardy-Weinberg equilibrium 1E -7, genotyping call rate <95% or MAF < 1%. SNPs were
imputed with IMPUTE version 2 software using HAPMAP CEU release #22 b36. Genome-wide association
analyses were performed using SNPTEST version 1.1.5. The Medical Ethical Committees of the participating
institutes approved the study.
QIMR discovery cohort
We recently performed a GWAS of asthma in 2,832 unrelated individuals of European ancestry ascertained
from the Australian population as described in detail elsewhere55.
Of these, 2,148 individuals (34% males,
mean age 32 years, range 10 to 92) reported information on their AD status in health questionnaires, including
Nature Genetics: doi:10.1038/ng.1017
16
482 individuals who reported having had AD at any point in their lifetime (32% diagnosed by a doctor) and
1,666 AD-free controls. Genotyping was performed with Illumina 610K or 370K arrays and stringent quality
control filters applied as described in Supplementary Table 2. Imputation of HapMap 2 SNPs (CEU release 21)
was performed with MACH and SNPs tested for association with disease status using logistic regression in
PLINK, with sex included as a covariate. Participants provided informed consent to participate in this study,
which was approved by the QIMR ethics committee.
Western Australian Pregnancy (Raine) cohort
Recruitment of the Western Australian Pregnancy (Raine) cohort has previously been described in detail56-58.
In brief, between 1989 and 1991 2,900 pregnant women were recruited prior to 18-weeks gestation into a
randomised controlled trial to evaluate the effects of repeated ultrasound in pregnancy. Recruitment
predominantly took place at King Edward Memorial Hospital (Perth, Western Australia). Women were
randomised to repeat ultrasound measurements at 18, 24, 28, 34 and 38 weeks gestation or to a regular
ultrasound assessment at 18-weeks. Children have been comprehensively phenotyped from birth to 21 years
of age (average ages of one, two, three, six, eight, ten, 14, 17 and currently 21) by trained members the Raine
research team. Data collection included questionnaires completed by the child’s primary carer and by the
adolescent from age 14, physical assessments by trained assessors at all follow up years, DNA collection from
the year 14 follow-up. Information on ever having AD diagnosed by a paediatrician or GP was collected using a
questionnaire at 6 and 8 years of age. The study was conducted with appropriate institutional ethics approval,
and written informed consent was obtained from all mothers and the children from age 18-years. The cohort
has been shown to be representative of the population presenting to the antenatal tertiary referral centre in
Western Australia56.
Genotyping was performed using the Illumina 660w quad array and imputation of
HapMap 2 (CEU release 22) SNPs was performed using MACH. Association testing was performed using
MACH2DAT.
SAPALDIA
SAPALDIA data are derived from among 6,055 SAPALDIA cohort subjects that participated in both, the baseline
(1991) and follow-up (2002) examinations and agreed to providing blood for genetic analysis.
SAPALDIA is a population-based cohort that originally recruited subjects aged 18 to 60 from population
registries in eight Swiss communities representing the three largest language groups (German, French, Italian)
as well as different levels of air pollution, altitude and degrees of urbanization59,60.
At both baseline and
follow-up examination subjects underwent spirometry as well as a detailed interview on respiratory health and
allergies, smoking history, lifestyle factors and anthropometry. At follow-up, 8,047 of 9,651 baseline subjects
re-participated in at least one part of the study and a formal biobank was established. AD was defined as
positive answer to the question “Have you ever had atopic dermatitis or any other kind of skin allergy?“ at
either examination. The basis for this study formed control subjects and a random sample of all asthmatics
(sampled proportionally to the overall asthma prevalence in the study) that were part of a nested asthma case-
Nature Genetics: doi:10.1038/ng.1017

17
control sample subjected for genomewide genotyping in the context of the GABRIEL genome-wide association
study on asthma7.
Genotyping and imputation was carried out within the GABRIEL consortium, details in
BAMSE methods (page S5).
Association analysis was performed in ProbABEL. All study participants gave written informed consent, and the
study was approved by the national and respective cantonal ethics committees.
The Department of Twin Research and Genetic Epidemiology at King’s College London
(TwinsUK)
The TwinsUK adult twin registry based at St Thomas’ Hospital in London is a volunteer cohort of over 12,000
identical and non-identical twins61
recruited since 1993. The cohort is predominantly female (92%). Twins
largely volunteered unaware of the study in which they would subsequently be included, gave fully informed
consent under a protocol reviewed by the St Thomas’ Hospital Local Research Ethics Committee.
Subjects were genotyped using Illumina's Human Hap 300k Duo and Human Hap610 Quad. Genotyping was
performed in part at the Wellcome Trust Sanger Institute (Hinxton, UK) and in part at the Center for Inherited
Disease Research, NIH, Baltimore, MD, United States. Genotypes were quality controlled and were excluded
from the analysis for low genotype rate defined as less than 95% for alleles with a minor allele frequency
(MAF) of 0.05 and above or less than 99% for loci with a MAF of 0.05 or below or for Hardy-Weinberg
disequilibrium (p<0.0001). Individual samples were included in the analysis if they were of non-admixed
Caucasian descent, did not show lack or excess heterozygocity, had high (defined as in excess of 99% success
rate) individual genotypes available.
Genotypes were imputed using IMPUTE 2.0 using Linkage Disequilibrium patterns observed in the HapMap 2
CEU population as a template. A total of 1,236 unrelated subjects for which both genetic and phenotypic
information was available was analyzed using PLINK.
Nature Genetics: doi:10.1038/ng.1017
18
Collaborating Consortia Members
AAGC - Australian Asthma Genetics Consortium
Graham Jones1, Patrick Danoy
2, Svetlana Baltic
3, Desiree Mészáros
4, Catherine Hayden
5, Sarah E Medland
6,
Andrew J. Kemp7, Faang Cheah
3, Dale R. Nyholt
6, Melissa C. Southey
8, Mary Roberts
9, Scott D. Gordon
6, Euan R.
Tovey1, Loren Price
3, Margaret J. Wright
6, James Markos1
0, Anjali K. Henders
6, Graham Giles
11, Li P. Chung
3,
Paul S. Thomas12
, Ian Feather13
, Pamela A. Madden14
, Suzanna Temple3, Stephen Morrison
15, Chalermchai
Mitrpant3, Brad Shelton
3, Andrew C. Heath
14, Mark Jenkins
2, Warwick J. Britton
16, John L. Hopper
17, Stephen R.
Leeder18
, Haydn Walters4, Michael J. Abramson
19, Colin F. Robertson
9, Matthew A Brown
2, Guy B. Marks
1,
Shyamali C. Dharmage17
1 Woolcock Institute of Medical Research, University of Sydney, Sydney, Australia.
2 University of Queensland Diamantina Institute, Princess Alexandra Hospital, Brisbane, Australia.
3 Lung Institute of WA and Centre for Asthma, Allergy and Respiratory Research, University of WA, Perth,
Australia.
4 Menzies Research Institute, Hobart, Australia.
5 School of Paediatrics and Child Health, Princess Margaret Hospital for Children, Perth, Australia.
6 The Queensland Institute of Medical Research, Brisbane, Australia.
7 The Children's Hospital, Westmead, Sydney, Australia.
8 Department of Pathology, The University of Melbourne, Melbourne, Australia.
9 Department of Respiratory Medicine, Royal Children's Hospital, Parkville, Australia.
10 Launceston General Hospital, Lauceston, Australia.
11 Cancer Epidemiology Centre, The Cancer Council Victoria, Melbourne, Australia.
12 Faculty of Medicine, University of New South Wales, Sydney, Australia.
13 Gold Coast Hospital, Southport, Australia.
14 Washington University School of Medicine, St Louis, United States.
15 University of Queensland, Brisbane, Australia.
16 Centenary Institute of Cancer Medicine & Cell Biology, Royal Prince Alfred Hospital, Camperdown, Australia.
17 Centre for Molecular, Environmental, Genetic and Analytic Epidemiology, University of Melbourne,
Melbourne, Australia.
18 Australian Health Policy Institute, University of Sydney, Sydney, Australia.
19 Department of Epidemiology& Preventive Medicine, Monash University, Melbourne, Australia.
GOYA - Genetics of Overweight Young Adults
Lavinia Paternoster1,2
, David M. Evans1,2
, Ellen Aagaard Nohr3, Claus Holst
4, Mark Lathrop
5,6, Nicholas J.
Timpson1,2
, George Davey Smith1,2
, Thorkild I. A. Sørensen4
Nature Genetics: doi:10.1038/ng.1017
19
1 MRC CAiTE centre, University of Bristol, Bristol, United Kingdom.
2 School of Social and Community Medicine, University of Bristol, Bristol, United Kingdom.
3 Institute of Public Health, Aarhus University, Aarhus, Denmark.
4 Institute of Preventive Medicine, Copenhagen University Hospitals, Copenhagen, Denmark.
5 Centre National de Génotypage, Evry, France.
6 Foundation Jean Dausset, CEPH, Paris, France.
Acknowledgements
ALSPAC
We are extremely grateful to all the families who took part in this study, the midwives for their help in
recruiting them, and the whole ALSPAC team, which includes interviewers, computer and laboratory
technicians, clerical workers, research scientists, volunteers, managers, receptionists, and nurses.
COPSAC
We thank all the families participating in the COPSAC cohort for their effort and commitment; Kirsten Hinsby
Mathiesen, Lotte Klansø, Lena Vind and the rest of the COPSAC study team.
DNBC
The GENEVA consortium (https:www.genevastudy.org/) supported the genotyping in DNBC.
Generation R
The Generation R Study is conducted by the Erasmus Medical Center in close collaboration with the School of
Law and Faculty of Social Sciences of the Erasmus University Rotterdam, the Municipal Health Service
Rotterdam area, Rotterdam, the Rotterdam Homecare Foundation, Rotterdam and the Stichting
Trombosedienst & Artsenlaboratorium Rijnmond (STAR-MDC), Rotterdam. We gratefully acknowledge the
contribution of children and parents, general practitioners, hospitals, midwives and pharmacies in Rotterdam.
The generation and management of GWAS genotype data for the Generation R Study was done at the Genetic
Laboratory of the Department of Internal Medicine, Erasmus MC, The Netherlands. We would like to thank
Karol Estrada, Dr. Tobias A. Knoch, Anis Abuseiris, Luc V. de Zeeuw, and Rob de Graaf, for their help in creating
GRIMP, and BigGRID, MediGRID, and Services@MediGRID/D-Grid, (funded by the German Bundesministerium
fuer Forschung und Technology; grants 01 AK 803 A-H, 01 IG 07015 G) for access to their grid computing
resources. We thank Pascal Arp, Mila Jhamai, Marijn Verkerk, Lizbeth Herrera and Marjolein Peters for their
help in creating, managing and QC of the GWAS database. Also, we thank Karol Estrada and Carolina Medina-
Gomez for their support in creation and analysis of imputed data.
Nature Genetics: doi:10.1038/ng.1017

20
Health2006
Professor Jeanne Duus Johansen participated in the study design.
LISA/GINI
LISAplus Study:
The study team wishes to acknowledge the following: Helmholtz Zentrum Muenchen - German Research
Center for Environment and Health, Institute of Epidemiology I, Neuherberg (Heinrich J, Wichmann HE,
Sausenthaler S, Chen C-M); University of Leipzig, Department of Pediatrics (Borte M), Department of
Environmental Medicine and Hygiene (Herbarth O); Department of Pediatrics, Marien-Hospital, Wesel (von
Berg A); Bad Honnef (Schaaf B); UFZ-Centre for Environmental Research Leipzig-Halle, Department of
Environmental Immunology (Lehmann I); IUF – Leibniz Research Institute for Environmental Medicine,
Düsseldorf (Krämer U); Department of Pediatrics, Technical University, Munich (Bauer CP, Hoffman U).
GINIplus Study:
The study team wishes to acknowledge the following: Helmholtz Zentrum Muenchen - German Research
Center for Environmental Health, Institute of Epidemiology I, Munich (Heinrich J, Wichmann HE, Sausenthaler
S, Chen C-M, Thiering E, Tiesler C, Standl M, Schnappinger M, Rzehak P); Department of Pediatrics, Marien-
Hospital, Wesel (Berdel D, von Berg A, Beckmann C, Groß I); Department of Pediatrics, Ludwig Maximilians
University, Munich (Koletzko S, Reinhardt D, Krauss-Etschmann S); Department of Pediatrics, Technical
University, Munich (Bauer CP, Brockow I, Grübl A, Hoffmann U); IUF – Leibniz Research Institute for
Environmental Medicine, Düsseldorf (Krämer U, Link E, Cramer C); Centre for Allergy and Environment,
Technical University, Munich (Behrendt H).
MoBa
We are grateful to all the participating families in Norway who take part in this ongoing cohort study.
NFBC66 and NFBC86
We thank Professor Paula Rantakallio (launch of NFBC1966 and 1986), Ms Outi Tornwall and Ms Minttu Jussila
(DNA biobanking).
NTR
We thank all twin families for their participation in the NTR and acknowledge Toos van Beijsterveldt and Meike
Bartels (phenotype collection); Eco de Geus, Gonneke Willemsen and Jim Hudziak (study design); Erik Ehli and
Gareth Davies (DNA processing and genotyping); and Paul Scheet and Xiao Xiangjun (genotype calling and
imputation) for their contributions.
QIMR
Nature Genetics: doi:10.1038/ng.1017

21
We thank the twins and their families for their participation; Dixie Statham, Ann Eldridge, Marlene Grace,
Kerrie McAloney (sample collection); Lisa Bowdler, Steven Crooks (DNA processing); David Smyth, Harry Beeby,
Daniel Park (IT support).
RAINE
The authors are grateful to the Raine Study participants and their families, and to the Raine Study research
staff for cohort coordination and data collection.
SAPALDIA
Current SAPALDIA Team
Study directorate: T Rochat (p), , JM Gaspoz (c), N Künzli (e/exp), LJS Liu (exp), NM Probst Hensch (e/g), C
Schindler (s).
Scientific team: JC Barthélémy (c), W Berger (g), R Bettschart (p), A Bircher (a), G Bolognini (p), O Brändli (p), C
Brombach (n), M Brutsche (p), L Burdet (p), M Frey (p), U Frey (pd), MW Gerbase (p), D Gold (e/c/p), E de
Groot (c), W Karrer (p), R Keller (p), B Knöpfli (p), B Martin (pa), D Miedinger (o), U Neu (exp), L Nicod (p), M
Pons (p), F Roche (c), T Rothe (p), E Russi (p), P Schmid-Grendelmeyer (a), A Schmidt-Trucksäss (pa), A Turk (p),
J Schwartz (e), D. Stolz (p), P Straehl (exp), JM Tschopp (p), A von Eckardstein (cc), E Zemp Stutz (e).
Scientific team at coordinating centers: M Adam (e/g), E Boes (g), PO Bridevaux (p), D Carballo (c), E Corradi
(e), I Curjuric (e), J Dratva (e), A Di Pasquale (s), L Grize (s), D Keidel (s), S Kriemler (pa), A Kumar (g), M
Imboden (g), N Maire (s), A Mehta (e), F Meier (e), H Phuleria (exp), E Schaffner (s), GA Thun (g) A Ineichen
(exp), M Ragettli (e), M Ritter (exp), T Schikowski (e), G Stern (pd), M Tarantino (s), M Tsai (e), M Wanner (pa)
(a) allergology, (c) cardiology, (cc) clinical chemistry, (e) epidemiology, (exp) exposure, (g) genetic and
molecular biology, (m) meteorology, (n) nutrition, (o) occupational health, (p) pneumology, (pa) physical
activity, (pd) pediatrics, (s) statistics
Acknowledgements
The study could not have been done without the help of the study participants, technical and administrative
support and the medical teams and field workers at the local study sites.
Local fieldworkers : Aarau: S Brun, G Giger, M Sperisen, M Stahel, Basel: C Bürli, C Dahler, N Oertli, I Harreh, F
Karrer, G Novicic, N Wyttenbacher, Davos: A Saner, P Senn, R Winzeler, Geneva: F Bonfils, B Blicharz, C Landolt,
J Rochat, Lugano: S Boccia, E Gehrig, MT Mandia, G Solari, B Viscardi, Montana: AP Bieri, C Darioly, M Maire,
Payerne: F Ding, P Danieli A Vonnez, Wald: D Bodmer, E Hochstrasser, R Kunz, C Meier, J Rakic, U Schafroth, A
Walder.
Administrative staff: C Gabriel, R Gutknecht.
TWINS UK
We thank the staff from the Genotyping Facilities at the Wellcome Trust Sanger Institute for sample
preparation, Quality Control and Genotyping led by Leena Peltonen and Panos Deloukas; Le Centre National de
Nature Genetics: doi:10.1038/ng.1017

22
Génotypage, France, led by Mark Lathrop, for genotyping; Duke University, North Carolina, USA, led by David
Goldstein, for genotyping; and the Finnish Institute of Molecular Medicine, Finnish Genome Center, University
of Helsinki, led by Aarno Palotie.
Nature Genetics: doi:10.1038/ng.1017
23
Funding
AAGC
The NHMRC (including grant 613627), Asthma Foundations in Tasmania, Queensland and Victoria, The Clifford
Craig Trust in Northern Tasmania, Lew Carty Foundation, Royal Hobart Research Foundation and the University
of Melbourne, Cooperative Research Centre for Asthma, New South Wales Department of Health, Children’s
Hospital Westmead, University of Sydney. Contributions of goods and services were made to the CAPS study
by Allergopharma Joachim Ganzer KG Germany, John Sands Australia, Hasbro, Toll refrigerated, AstraZeneca
Australia, and Nu-Mega Ingredients Pty Ltd. Goods were provided at reduced cost to the CAPS study by
Auspharm, Allersearch and Goodman Fielder Foods. MCM, SCD and MAB are supported by the NHMRC
Fellowship Scheme.
ALSPAC
The UK Medical Research Council (Grant ref:74882), the Wellcome Trust (Grant ref: 076467), and the
University of Bristol provide core support for the Avon Longitudinal Study of Parents and their Children
(ALSPAC). L.Paternoster and D.M.Evans were supported by a Medical Research Council New Investigator
Award (MRC G0800582 to DME). J.P.Kemp is funded by a Wellcome Trust 4-year PhD studentship in molecular,
genetic, and life course epidemiology (WT083431MA).
The Sample Logistics and Genotyping Facilities at the Wellcome Trust Sanger
Institute and 23andMe generated the ALSPAC GWA data. The Wellcome Trust and Swiss National Science
Foundation funded the expression data.
BAMSE
BAMSE was funded by the Swedish Research Council, Stockholm County Council, Centre for Allergy Research,
Karolinska Institutet, GABRIEL contract number 018996 under Integrated Program LSH-2004-1.2.5-1 and the
Wellcome Trust [WT084703MA]. EM has received post doc grants from the Swedish Heart Lung Foundation,
the Swedish Fulbright Commission and Riksbankens Jubileumsfond - Erik Rönnberg Scholarship.
B58C
We acknowledge use of phenotype and genotype data from the British 1958 Birth Cohort DNA collection,
funded by the Medical Research Council grant G0000934 and the Wellcome Trust grant 068545/Z/02.
(http://www.b58cgene.sgul.ac.uk/). Genotyping for the B58C-WTCCC subset was funded by the Wellcome
Trust grant 076113/B/04/Z. The B58C-T1DGC genotyping utilized resources provided by the Type 1 Diabetes
Genetics Consortium, a collaborative clinical study sponsored by the National Institute of Diabetes and
Digestive and Kidney Diseases (NIDDK), National Institute of Allergy and Infectious Diseases (NIAID), National
Human Genome Research Institute (NHGRI), National Institute of Child Health and Human Development
(NICHD), and Juvenile Diabetes Research Foundation International (JDRF) and supported by U01 DK062418.
B58C-T1DGC GWAS data were deposited by the Diabetes and Inflammation Laboratory, Cambridge Institute
Nature Genetics: doi:10.1038/ng.1017

24
for Medical Research (CIMR), University of Cambridge, which is funded by Juvenile Diabetes Research
Foundation International, the Wellcome Trust and the National Institute for Health Research Cambridge
Biomedical Research Centre; the CIMR is in receipt of a Wellcome Trust Strategic Award (079895). The B58C-
GABRIEL genotyping was supported by a contract from the European Commission Framework Programme 6
(018996) and grants from the French Ministry of Research.
CHOP
This research was supported in part by the PA research grant- 4100042728 from the state of Pennsylvania and
an Institute Development Award from the Children's Hospital of Philadelphia.
COPSAC
COPSAC is funded by: the Lundbeck Foundation, the Danish Council for Strategic Research, the Augustinus
Foundation, the Pharmacy Foundation, the Danish Agency for Science, Technology and Innovation, the EU
Seventh Framework Programme, Ronald McDonald House Charities, the Global Excellence in Health award
Programme, the Danish Medical Research Council, the Director K. GAD and family Foundation, the A. P. Møller
og Hustru Chastine Mc-Kinney Møller General Purpose Foundation, the Aage Bang Foundation, the Health
Insurance Foundation, the East Danish Medical Research Council, the Copenhagen City Council Research
Foundation, the Kai and Gunhild Lange Foundation, the Dagmar Marshall Foundation, the Ville Heise legacy,
the Region of Copenhagen, the Ib Henriksen foundation, the Birgit and Svend Pock-Steen foundation, the
Danish Ministry of the Interior and Health’s Research Centre for Environmental Health, the Gerda and Aage
Hensch foundation, the Rosalie Petersens Foundation, the Hans and Nora Buchard Foundation, the Gangsted
Foundation, the Danish Medical Association, Asthma-Allergy Denmark, the Danish Otolaryngology Association,
the Oda Pedersen legacy, the Højmosegaard Legacy, the A. P. Møller og Hustru Chastine Mc-Kinney Møller
Foundation for the advancement of Medical Knowledge, the Jacob and Olga Madsen Foundation, the Aase and
Einar Danielsen Foundation, and Queen Louise’s Children’s’ Hospital Research Foundation.
The funding agencies did not have any role in study design, data collection and analysis, decision to publish, or
preparation of the manuscript.
DNBC
The DNBC was established with the support of a major grant from the Danish National Research Foundation.
Additional support for the DNBC has been obtained from the Danish Pharmacists’ Fund, the Egmont
Foundation, the March of Dimes Birth Defects Foundation, the Augustinus Foundation and the Health Fund of
the Danish Health Insurance Societies. The generation of GWAS genotype data for the DNBC samples was
carried out within the GENEVA consortium with funding provided through the NIH Genes, Environment and
Health Initiative (GEI) (U01HG004423). Assistance with phenotype harmonization and genotype cleaning, as
well as with general study coordination, was provided by the GENEVA Coordinating Center (U01HG004446).
Genotyping was performed at Johns Hopkins University Center for Inherited Disease Research, with support
from the NIH GEI (U01HG004438).
Nature Genetics: doi:10.1038/ng.1017

25
ECRHS
Funding acknowledgements
The co-ordination of ECRHS II was supported by the European Commission, as part of their Quality of Life
programme.
The genotyping was funded through the EU funded GABRIEL initiative - GRANT Number 018996
The following bodies funded the local studies in ECRHS II:
Funding sources
Financial support for ECRHS II: Albacete: Fondo de Investigaciones Santarias (FIS) (grant code: 97/0035-01,
99/0034-01 and 99/0034-02), Hospital Universitario de Albacete, Consejeria de Sanidad; Barcelona: SEPAR,
Public Health Service (grant code: R01 HL62633-01), Fondo de Investigaciones Santarias (FIS) (grant code:
97/0035-01, 99/0034-01 and 99/0034-02) CIRIT (grant code: 1999SGR 00241) Red Respira ISCII; CIBER
Epidemiologia y Salud Pública (CIBERESP), Spain Basel: Swiss National Science Foundation, Swiss Federal Office
for Education & Science, Swiss National Accident Insurance Fund (SUVA), USC NIEHS Center grant 5P30
ES07048; Bergen: Norwegian Research Council, Norwegian Asthma & Allergy Association (NAAF), Glaxo
Wellcome AS, Norway Research Fund; Erfurt: Helmholtz Center Munich - National Research Centre for
Environment & Health, Deutsche Forschungsgemeinschaft (DFG) (grant code FR 1526/1-1); Galdakao: Basque
Health Dept; Grenoble: Programme Hospitalier de Recherche Clinique-DRC de Grenoble 2000 no. 2610,
Ministry of Health, Direction de la Recherche Clinique, CHU de Grenoble, Ministere de l'Emploi et de la
Solidarite, Direction Generale de la Sante, Comite des Maladies Respiratoires de l’Isere; Hamburg: Helmholtz
Center Munich - National Reasearch Centre for Environment & Health, Deutsche Forschungsgemeinschaft
(DFG) (grant code MA 711/4-1); Ipswich and Norwich: Asthma UK (formerly known as National Asthma
Campaign); Huelva: Fondo de Investigaciones Santarias (FIS) (grant code: 97/0035-01, 99/0034-01 and
99/0034-02); Oviedo: Fondo de Investigaciones Santarias (FIS) (grant code: 97/0035-01, 99/0034-01 and
99/0034-02) ; Paris: Ministere de l'Emploi et de la Solidarite, Direction Generale de la Sante, UCB-Pharma
(France), Aventis (France), Glaxo France, Programme Hospitalier de Recherche Clinique-DRC de Grenoble 2000
no. 2610, Ministry of Health, Direction de la Recherche Clinique, CHU de Grenoble; Tartu: Estonian Science
Foundation; Umeå: Swedish Heart Lung Foundation, Swedish Foundation for Health Care Sciences & Allergy
Research, Swedish Asthma & Allergy Foundation, Swedish Cancer & Allergy Foundation; Uppsala: Swedish
Heart Lung Foundation, Swedish Foundation for Health Care Sciences & Allergy Research, Swedish Asthma &
Allergy Foundation, Swedish Cancer & Allergy Foundation.
Financial support for ECRHS I: Ministère de la Santé, Glaxo France, Insitut Pneumologique d'Aquitaine, Contrat
de Plan Etat-Région Languedoc-Rousillon, CNMATS, CNMRT (90MR/10, 91AF/6), Ministre delegué de la santé,
RNSP, France; Helmholtz Center Munich, and the Bundesminister für Forschung und Technologie, Bonn,
Germany; Norwegian Research Council project no. 101422/310; Ministero Sanidad y Consumo FIS (grants
Nature Genetics: doi:10.1038/ng.1017

26
#91/0016060/00E-05E and #93/0393), and grants from Hospital General de Albacete, Hospital General Juan
Ramón Jiménenz, Consejeria de Sanidad Principado de Asturias, Spain; The Swedish Medical Research Council,
the Swedish Heart Lung Foundation, the Swedish Association against Asthma and Allergy; Swiss National
Science Foundation grant 4026-28099; National Asthma Campaign, British Lung Foundation, Department of
Health, South Thames Regional Health Authority, UK.
Generation R
The Generation R Study is made possible by financial support from the Erasmus Medical Center, Rotterdam,
the Erasmus University Rotterdam, the Netherlands Organization for Health Research and Development
(ZonMw), the Netherlands Organisation for Scientific Research (NWO), the Ministry of Health, Welfare and
Sport and the Ministry of Youth and Families. Dr. Liesbeth Duijts received funding by means of a European
Respiratory Society / Marie Curie Joint Research Fellowship (nr. MC 1226-2009) under grant agreement
RESPIRE, PCOFUND-GA-2008-229571. Dr. Vincent Jaddoe received additional grants from the Netherlands
Organization for Health Research and Development (ZonMw 90700303, 916.10159).
GOYA
The genotyping for GOYA was funded by the Wellcome Trust (WT 084762). GOYA was conducted as part of the
activities of the Danish Obesity Research Centre (DanORC, www.danorc.dk) and the MRC centre for Causal
Analyses in Translational Epidemiology (MRC CAiTE). L.Paternoster, who conducted the GOYA genotyping QC,
imputation and analysis is supported by a Medical Council New Investigator Award (MRC G0800582) awarded
to D.M.Evans.
Health2006
The Danish Board of Health, The Danish Environmental Protection Agency, The Copenhagen County Research
Foundation, The Velux Foundation, ALK-Abello´ A ⁄S, Denmark and The Danish Scientific Research Council.
None of the funders had any influence on the design, data collection, analysis or interpretation of data.
KORA/GENEVA
The KORA research platform was initiated and financed by the Helmholtz Center Munich, German Research
Center for Environmental Health, which is funded by the German Federal Ministry of Education and Research
(BMBF) and by the State of Bavaria. Part of this work was financed by the German National Genome Research
Network (NGFN-2 and NGFNPlus: 01GS0823). S.W. is supported by grants of the DFG (grant WE 2678/6-1 and
WE 2678/8-1), the BMBF as part of the NGFN (01GS 0818), and the Christiane Kühne Center for Allergy
Research and Education (http://www.ck-care.ch/). The work of S.W. is further supported by the Graduate
School of Information Science in Health of the Technische Universität München (TUM-GSISH), the Munich
Center of Health Sciences (MC Health) as part of LMUinnovativ, and the COST action “Skinbad”.
LISA/GINI
Nature Genetics: doi:10.1038/ng.1017

27
Personal and financial support by the Munich Center of Health Sciences (MCHEALTH) as part of the Ludwig-
Maximilians University Munich LMU innovative is gratefully acknowledged.
MAAS
MAAS was supported by the Asthma UK Grants No 301 (1995-1998), No 362 (1998-2001), No 01/012 (2001-
2004), No 04/014 (2004-2007) and The Moulton Charitable Foundation (2004-current); age 11 years clinical
follow-up is funded by the Medical Research Council (MRC) Grant G0601361.
MoBa
The Norwegian Mother and Child Cohort Study is supported by the Norwegian Ministry of Health and the
Ministry of Education and Research, NIH/NIEHS (contract no NO-ES-75558), NIH/NINDS (grant no.1 UO1 NS
047537-01), and the Norwegian Research Council/FUGE (grant no. 151918/S10 and no 183220/S10),
Norwegian Research Council, Oslo, Norway (FUGE 183220/S10). Swedish government grants to researchers in
public health service (ALF) (ALFGBG-136431), Sahlgrenska University Hospital, Sahlgrenska Academy,
Gothenburg, Sweden, Swedish Medical Society, Stockholm, Sweden (2008-21198) an Jane and Dan Olsson
Research Foundation, Gothenburg, Sweden.
NFBC66 and NFBC86
Financial support was received from the Academy of Finland (project grants 104781, 120315 and Center of
Excellence in Complex Disease Genetics), University Hospital Oulu, Biocenter, University of Oulu, Finland, the
European Commission (EURO-BLCS, Framework 5 award QLG1-CT-2000-01643), NHLBI grant 5R01HL087679-
02 through the STAMPEED program (1RL1MH083268-01), NIH/NIMH (5R01MH63706:02), ENGAGE project and
grant agreement HEALTH-F4-2007-201413, and the Medical Research Council (G0500539, PrevMetSyn/SALVE).
The DNA extractions, sample quality controls, biobank up-keeping and aliquotting was performed in the
National Public Health Institute, Biomedicum Helsinki, Finland and supported financially by the Academy of
Finland and Biocentrum Helsinki. A. Couto Alves acknowledges the European Commission, Framework 7, grant
number 223367. Jess L Buxton acknowledges the Wellcome Trust fellowship grant, number WT088431MA.
NTR
Genotyping was supported by Genomics of Developmental Trajectories in Twins (1RC2MH089995-01). The
NTR studies were supported by grants from the European Research Council (ERC-230374); NWO: the
Netherlands Organization for Scientific Research (NWO/SPI 56-464-14192 and NWO 480-04-004) and ZonMw:
the Netherlands Organisation for Health Research and Development.
PIAMA
Nature Genetics: doi:10.1038/ng.1017

28
The PIAMA study is supported by the Dutch Asthma Foundation (grant 3.4.01.26, 3.2.06.022, 3.4.09.081 and
3.2.10.085CO), the ZonMw (a Dutch organization for health research and development; grant 912-03-031), and
the ministry of the environment.
Genome-wide genotyping was funded by the European Commission as part of GABRIEL (A multidisciplinary
study to identify the genetic and environmental causes of asthma in the European Community) contract
number 018996 under the Integrated Program LSH-2004-1.2.5-1 Post genomic approaches to understand the
molecular basis of asthma aiming at a preventive or therapeutic control.
QIMR
Funding was provided by the Australian National Health and Medical Research Council (NHMRC; grants
241944, 339462, 389927, 389875, 389891, 389892, 389938, 442915, 442981, 496739, 552485, 552498), the
Australian Research Council (A7960034, A79906588, A79801419, DP0770096, DP0212016, DP0343921), the
FP-5 GenomEUtwin Project (QLG2-CT-2002-01254) and the U.S. National Institutes of Health (NIH grants
AA07728, AA07535, AA10248, AA11998, AA13320, AA13321, AA13326, AA14041, DA12854, MH66206). A
portion of the genotyping on which this study was based (Illumina 370k scans on 4300 individuals) was carried
out at the Center for Inherited Disease Research, Baltimore (CIDR) through an access award to our late
colleague Dr. Richard Todd (Psychiatry, Washington University School of Medicine, St Louis).
RAINE
The authors gratefully acknowledge the NH&MRC for their long term contribution to funding the study over
the last 20 years and also the following Institutions for providing funding for Core Management of the Raine
Study: The University of Western Australia (UWA) Raine Medical Research Foundation UWA, Faculty of
Medicine, Dentistry and Health Sciences, The Telethon Institute for Child Health Research Women and Infants
Research Foundation. The authors gratefully acknowledge the assistance of the Western Australian DNA Bank
(National Health and Medical Research Council of Australia National Enabling Facility). The authors also
acknowledge the support of the National Health and Medical Research Council of Australia (Grant ID 572613
and ID 003209) and the Canadian Institutes of Health Research (Grant ID 166067).
SAPALDIA
Research support: the Swiss National Science Foundation (grants no 33CSCO-108796, 3247BO-104283,
3247BO-104288, 3247BO-104284, 3247-065896, 3100-059302, 3200-052720, 3200-042532, 4026-028099,
3233-054996, PDFMP3-123171), the Federal Office for Forest, Environment and Landscape, the Federal Office
of Public Health, the Federal Office of Roads and Transport, the canton's government of Aargau, Basel-Stadt,
Basel-Land, Geneva, Luzern, Ticino, Zurich, the Swiss Lung League, the canton's Lung League of Basel Stadt/
Basel Landschaft, Geneva, Ticino and Zurich, SUVA, Freiwillige Akademische Gesellschaft, UBS Wealth
Foundation, Talecris Biotherapeutics GmbH, Abbott Diagnostics, European Commission 018996 (GABRIEL),
Wellcome Trust WT 084703MA
Nature Genetics: doi:10.1038/ng.1017

29
TWINS UK
Twins UK (TUK): The study was funded by the Wellcome Trust and the European Community’s Seventh
Framework Programme. The study also receives support from the Dept of Health via the National Institute for
Health Research (NIHR) comprehensive Biomedical Research Centre award to Guy's & St Thomas' NHS
Foundation Trust in partnership with King's College London. TDS is an NIHR senior Investigator. The project
also received support from a Biotechnology and Biological Sciences Research Council (BBSRC) project grant.
(G20234). DG is supported by an MRC fellowship. PH ids supported by a Marie Curie Fellowship. The authors
acknowledge the funding and support of the National Eye Institute via an NIH/CIDR genotyping project (PI:
Terri Young)
Genotyping of TwinsUK samples: Genotyping was also performed by CIDR as part of an NEI/NIH project grant.
Nature Genetics: doi:10.1038/ng.1017

30
Supplementary Table 1. Study characteristics - discovery & replication
Cohort Type N Percent male Mean age @
interview Atopic dermatitis question
Physician diagnosis required
Case response case # Control response control #
Discovery cohorts
ALSPAC Birth cohort 2811 50% 81m, 91m, 103m, 10y, 13y, 14y
1. Has your child in the past 12 months had eczema?
1. Yes, and saw a Dr
10y, 14y 2. Has a doctor ever actually said that your child has eczema?
2. Yes 2. No (@ 14 y)
yes Yes to 1 or 2 at any timepoint 909 1902
B58C-WTCCC Birth cohort 1285 50% 7y 1. Parent interview: History of atopic dermatitis in first year?
1. Yes
7y 2. Parent interview: History of atopic dermatitis after first year?
2. Yes
7y 3. Medical examination
no Yes to 1 or 2 103 No to 1 and 2 and 3 1182
B58C-T1DGC Birth cohort 2186 48% 7y 1. Parent interview: History of atopic dermatitis in first year?
1. Yes
7y 2. Parent interview: History of atopic dermatitis after first year?
2. Yes
7y 3. Medical examination
no Yes to 1 or 2 188 No to 1 and 2 and 3 1998
CHOP Population based cohort
1523 51% 9y ICD9 diagnosis in electronic medical record yes 519 1004
COPSAC Birth cohort 332 49% 0-6y Diagnosis prospectively by dermatologist at the research unit based on Hanifin-Rajka criteria
yes Diagnosed atopic dermatitis 171 No atopic dermatitis diagnosis and followed up to 6 yr
161
DNBC Birth cohort 1641 52% 18m 1. Has your child had itchy rash? 1. Yes
18m 2. Has a doctor told you that your child had atopic dermatitis?
2. Yes
18m 3. Was the rash recurrent? 3. Yes
18m 4. In which 0.5 month periods did your child have the rash?
4. Rash for at least 4 consecutive 0.5-month periods
Nature Genetics: doi:10.1038/ng.1017

31
18m 5. Where was the rash located? 5. Localization in elbow creases, behind the knees, face, wrists/hands or generalized/4 or more localizations
7y 6. Has your child ever had atopic dermatitis? 6. Yes
7y 7. Has your child ever had an itchy rash which was coming and going for at least 6 months?
7. Yes
9. Hospital Discharge Record of ICD10 code L20
no [Yes to 1 or 2 and Yes to 3 or 4 and 5] or [Yes to 6 and 7] or 9
225 No AD or AD symptoms recorded in interview, questionnaire, or register data
1416
Generation R Birth cohort 1115 53% 1y, 2y, 3y, 4y 1. Has your child had atopic dermatitis in the last 12 months for which he/she attended a general practitioner/hospital?
5y 2. Has your child ever had atopic dermatitis?
no Yes to 1 (at any timepoint) or 2 676 No to 1 and 2 439
GOYA Mothers from birth cohort
3359 0% 29y 1. Have you ever had any skin disease? yes Yes to 1 and 2 and ‘atopic dermatitis‘ to 3
180 No to 1 3179
2. Was the skin disease diagnosed by a doctor?
3. What kind of skin disease?
KORA F3 Cohort study 1375 49% 61y 1. Did a physician ever diagnose you with atopic eczema?
yes Yes 42 No 1333
KORA F4 Cohort study 1791 49% 61y 1. Did you ever have atopic dermatitis/eczema?
2. If yes, was it diagnosed by a physician?
yes Yes to 1 and 2 101 No to 1 or 2 1690
LISA Birth cohort 379 57% 6m, 12m, 18m, 24m 1. Did a physician diagnose your child having atopic dermatitis in the past 6 months?
1. Yes
4y, 5y, 6y 2. Did a physician diagnose your child having atopic dermatitis in the past 12 months?
2. Yes
yes Yes to 1 or 2 at any timepoint 93 No to all of the time points
286
NFBC66 Birth cohort 3502 47% 31y 1. Have you had eczema (infantile, atopic or allergic)?
1. Yes
2. if yes, have you ever been treated by a doctor 2. Yes
yes Yes to 1 and 2 1208 No to 1 2294
Nature Genetics: doi:10.1038/ng.1017

32
PIAMA Birth cohort 353 53% 3m,1y,2y,3y,4y,5y,6y,7y,8y
1. Has your child ever had atopic dermatitis? 1. Yes
2y,3y,4y,6y,7y,8y 2. Did a doctor ever diagnose atopic dermatitis in your child?
2. Yes
2y,3y,4y,6y,7y,8y 3. Did your child have atopic dermatitis during the past 12 months?
3. Yes
yes Yes to 1 and 2 and 3 186 No to 1 and 2 and 3 at ages 2-8
167
RAINE Birth cohort 1135 53% 5y 1. Do you think your child has ever had atopic dermatitis? Has anyone ever told you your child has atopic dermatitis?[yes and who(paediatrician, GP, child health nurse, naturopath, friend, relative)
1. Yes
8y 2. Has your child had atopic dermatitis in the last 12 month?
yes Yes to 1 and were diagnosed by a paediatrician/GP
245 No to 1 and 2 (subject excluded in case of missing).subjects who answered 'Yes' to 1 and were diagnosed to someone other than a paediatrician/GP were coded as missing
890
QIMR Population based cohort
2148 (adolescent=765,
asthma=55, adult=1328)
34% Mean=32, SD=15, range=10-92
1. Adolescent/Asthma study: Have you (your child) ever had eczema confirmed by a doctor?
1. Yes 1. No
2. Adult study: How often have you had any eczema? [“Only as a child”, “Quite often”, “Sometimes”, “Often”, "Never"]
2. Yes to “Only as a child”, “Quite often”, “Sometimes” or “Often”
2. Yes to “Never“
no Yes to 1 or 2 482 No to 1 or 2 1666
Twins UK cohort study 1236 8% 46 years 1. Have you ever had eczema? no Yes 278 No 958
Nature Genetics: doi:10.1038/ng.1017

33
Replication cohorts
AAGC 3881 49% Mean=35, SD=17, range=3-89
Population base cohort
QIMR 1. QIMR study: Have you (your child) ever had eczema confirmed by a doctor?
yes 1. Yes 241 1. No 2891
Birth cohort CAPS 2. CAPS study: Has your child ever had eczema confirmed by a doctor?
yes 2. Yes 28 2. No 25
Population based cohort
LIWA 0 474
Birth cohort MESCA 0 64
Birth cohort TAHS 0 158
yes Yes to 1 or 2 at any timepoint 269 3612
ALSPAC Birth cohort 2903 50% 81m, 91m, 103m, 10y, 13y, 14y
1. Has your child in the past 12 months had eczema?
1. Yes, and saw a Dr
10y, 14y 2. Has a doctor ever actually said that your child has eczema?
2. Yes 2. No (@ 14 y)
yes Yes to 1 or 2 at any timepoint 895 2008
BAMSE Birth cohort 346 Cases: 62% 1y, 2y, 4y, 8y 1. Has a doctor diagnosed your child as having atopic dermatitis after the age of x year
1. Yes
Controls:48% 1y 2. Has a doctor ever diagnosed your child as having atopic dermatitis up to 1 year of age
2. Yes
yes Yes to 1 and/or 2 100 No to both Q at all times 246
B58C-REPL Birth cohort 2090 51.3% 7y 1. Parent interview: History of atopic dermatitis in first year?
1. Yes
7y 2. Parent interview: History of atopic dermatitis after first year?
2. Yes
7y 3. Medical examination
Nature Genetics: doi:10.1038/ng.1017

34
no Yes to 1 or 2 170 No to 1 and 2 and 3 1920
ECRHS Population based cohort study. Information provided is based on follow-up
1650 49.03% 42.8 (7.1) 1. Have you ever had an itchy rash that was coming and going for more than six months?
1. Yes
2. Have you had this itchy rash in the last 12 months?
2. Yes
no Yes to 1 and 2 176 No to 1 or 2 1474
Generation R Birth cohort 620 48% 1y, 2y, 3y, 4y 1. Has your child had eczema in the last 12 months for which he/she attended a general practitioner/hospital?
5y 2. Has your child ever had eczema?
no Yes to 1 (at any timepoint) or 2 182 No to 1 and 2 438
Health2006 Population based cohort
3329 44.7% 49.4 years The U.K. Working Party's diagnostic criteria for atopic dermatitis as a history of an itchy skin condition plus a minimum of two of four minor criteria were used. The major criteria was an itchy skin condition and the minor criteria were: 1) a history of involvement of the skin creases, 2) a personal history of asthma or hay fever, 3) a history of general dry skin in the last year, 4) onset under the age of 2 years.
no AD cases according to U.K. Working Party's diagnostic criteria for atopic dermatitis
337 non-AD U.K. Working Party's diagnostic criteria for atopic dermatitis
2992
KORA F4 Population based controls
1100 49% 25.4 1. Did a physician ever diagnose you with atopic dermatitis/eczema?
2. Dermatologic examination, UK Working Party Criteria
GENEVA Tertiary care cases
1100 42% 49.3 1. Did a physician ever diagnose you with atopic dermatitis/eczema?
Nature Genetics: doi:10.1038/ng.1017

35
2. Dermatologic examination, UK Working Party Criteria
Yes to 1 and actual dermatologist's diagnosis
1100 No to 1 and no actual dermatologist's diagnosis
1100
yes Yes to 1 1100 No to 2 1100
LISA/GINI Birth cohort 665 (GINI: 499, LISA:
166)
51% LISA: 6m, 12m, 18m, 24m
1. Did a physician diagnose your child having atopic dermatitis in the past 6 months?
1. Yes
LISA: 3y-6y, GINI: 1y-6y
2. Did a physician diagnose your child having atopic dermatitis in the past 12 months?
2. Yes
yes Yes to 1 or 2 at any timepoint 231 No to all of the time points
434
MAAS Unselected birth cohort
761 55% 1y, 3y, 5y, 8y 1. Has your child ever suffered from atopic dermatitis
no ‘Yes’ at any timepoint 435 No 326
MoBa Pregnancy cohort
937 51% 6m, 18m, 36m 1. Does your child have or has he/she had any of the following health problems? (Enter a cross in a box for each item.) Atopic eczema (childhood eczema) - listed as an item
1. yes
2. If yes, has the mother and child health centre or someone else referred your child for further specialist investigation?
2. yes
yes Yes to 1 and 2 at any timepoint 70 No to all of the time points
867
NFBC86 Birth cohort 4465 50% 15-16y 1. Have you ever had eczema which has been called infantile eczema, atopic eczema or allergic eczema?
2. Diagnosed or treated by a doctor? yes yes to 1+2 798 no to 1 3667
NTR Population based cohort study
429 50.8% 5y 1. Did a physician since birth ever diagnosed your children with eczema? (Oldest/youngest answered seperately )
2. Did a physician since birth ever diagnosed your children with baby eczema? (Oldest/youngest answered seperately )
yes Yes to 1 or 2 123 1. No to 1 and 2 306
Nature Genetics: doi:10.1038/ng.1017

36
SAPALDIA
Population based cohort study.
976 50% 2 examinations: baseline in 1991,
follow-up in 2002.
Age (sd) in 2002:
53.2 (11.1)
Have you ever had atopic dermatitis or any other kind of skin allergy?
no Yes. At either of the 2 examinations (1991 & 2002)
533 No' at both examinations 'No' at follow-up, if missing at baseline ('No' at baseline & missing at follow-up set to missing)
443
Nature Genetics: doi:10.1038/ng.1017
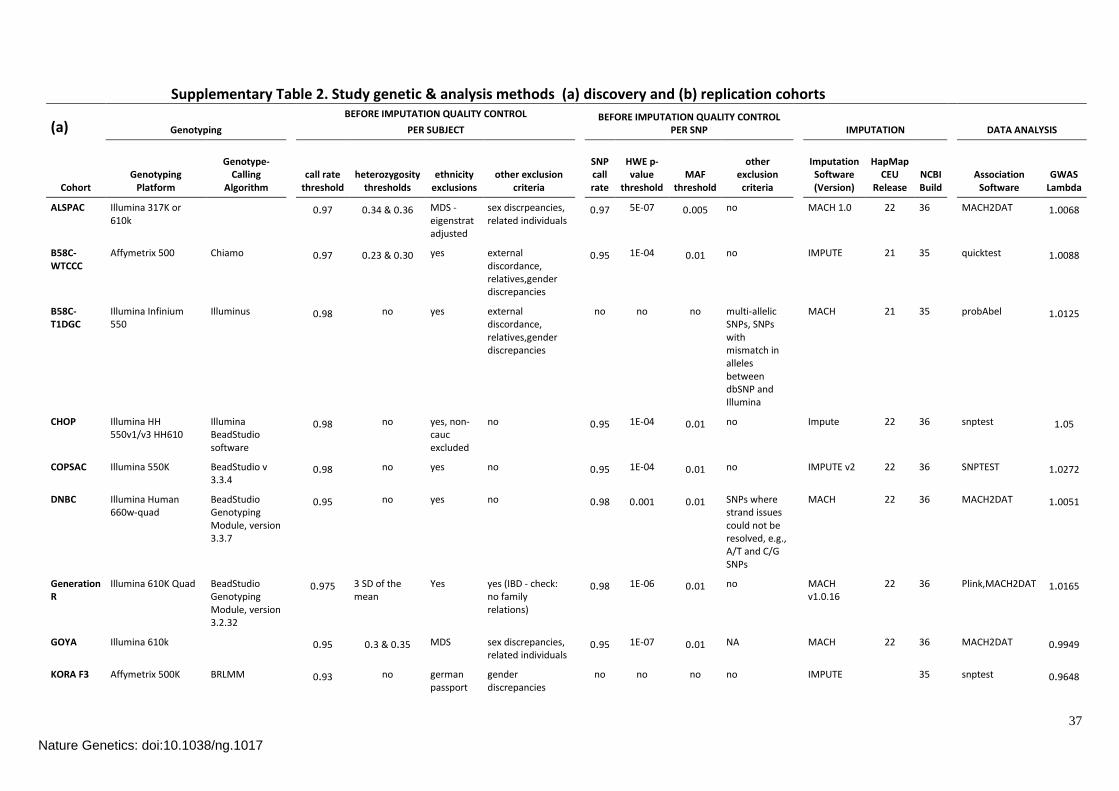
37
Supplementary Table 2. Study genetic & analysis methods (a) discovery and (b) replication cohorts
(a) Genotyping
BEFORE IMPUTATION QUALITY CONTROL
PER SUBJECT BEFORE IMPUTATION QUALITY CONTROL
PER SNP IMPUTATION DATA ANALYSIS
Cohort Genotyping
Platform
Genotype-Calling
Algorithm call rate
threshold heterozygosity
thresholds ethnicity
exclusions other exclusion
criteria
SNP call rate
HWE p-value
threshold MAF
threshold
other exclusion
criteria
Imputation Software (Version)
HapMap CEU
Release NCBI Build
Association Software
GWAS Lambda
ALSPAC Illumina 317K or 610k
0.97 0.34 & 0.36 MDS - eigenstrat adjusted
sex discrpeancies, related individuals
0.97 5E-07 0.005 no MACH 1.0 22 36 MACH2DAT 1.0068
B58C-WTCCC
Affymetrix 500 Chiamo 0.97 0.23 & 0.30 yes external discordance, relatives,gender discrepancies
0.95 1E-04 0.01 no IMPUTE 21 35 quicktest 1.0088
B58C-T1DGC
Illumina Infinium 550
Illuminus 0.98 no yes external discordance, relatives,gender discrepancies
no no no multi-allelic SNPs, SNPs with mismatch in alleles between dbSNP and Illumina
MACH 21 35 probAbel 1.0125
CHOP Illumina HH 550v1/v3 HH610
Illumina BeadStudio software
0.98 no yes, non-cauc excluded
no 0.95 1E-04 0.01 no Impute 22 36 snptest 1.05
COPSAC Illumina 550K BeadStudio v 3.3.4
0.98 no yes no 0.95 1E-04 0.01 no IMPUTE v2 22 36 SNPTEST 1.0272
DNBC Illumina Human 660w-quad
BeadStudio Genotyping Module, version 3.3.7
0.95 no yes no 0.98 0.001 0.01 SNPs where strand issues could not be resolved, e.g., A/T and C/G SNPs
MACH 22 36 MACH2DAT 1.0051
Generation R
Illumina 610K Quad BeadStudio Genotyping Module, version 3.2.32
0.975 3 SD of the mean
Yes yes (IBD - check: no family relations)
0.98 1E-06 0.01 no MACH v1.0.16
22 36 Plink,MACH2DAT 1.0165
GOYA Illumina 610k 0.95 0.3 & 0.35 MDS sex discrepancies, related individuals
0.95 1E-07 0.01 NA MACH 22 36 MACH2DAT 0.9949
KORA F3 Affymetrix 500K BRLMM 0.93 no german passport
gender discrepancies
no no no no IMPUTE 35 snptest 0.9648
Nature Genetics: doi:10.1038/ng.1017

38
KORA F4 Affymetrix Genome‐Wide Human SNP Array 6.0
Birdseed2 0.93 no german passport
gender discrepancies
no no no no IMPUTE 36 snptest 0.9997
LISA Affymetrix Genome‐Wide Human SNP Array 5.0
BRLMM-P 0.95 no no no 0.95 0.01 0.01 no IMPUTE v1.06
22 36 SNPTEST 1.0223
NFBC66 Illumina HumanCNV370DUO Analysis BeadChip
Beadstudio 0.95 no no no phenotype data, IBD, withdrew consent, gender discrepancies, contaminated or duplicate samples
0.95 1E-04 0.01 no IMPUTE v1.0
21 35 quicktest 1.0097
PIAMA Illumina Human610 quad array
GenomeStudio Software
0.95 no no inconsistent sex 0.95 1E-07 0.01 no IMPUTE v2 22 36 snptest 1.053
QIMR Illumina 610K or CNV370
Illumina BeadStudio software
0.95 no yes no 0.95 1E-06 0.01 yes (BeadStudio GenCall score
<0.7; SNPs
exclusive to 610K or CNV370)
MACH 21 35 Plink 0.9968
RAINE Illumina 660K Illumina’s Bead Studio Genotyping Module software v.3.1
0.95 no Yes yes - IBD check and exclude family relations, congenital abnormalities
0.95 5.7E-07 0.01 no MACH 22 36 MACH2DAT 0.9931
Twins UK Illumina 317K (3/5) & 610K (2/5)
Illuminus 0.95 Yes Yes, only caucasian
no 0.95 1E-04 0.01 no IMPUTE 22 36 Plink 1.0846
Nature Genetics: doi:10.1038/ng.1017
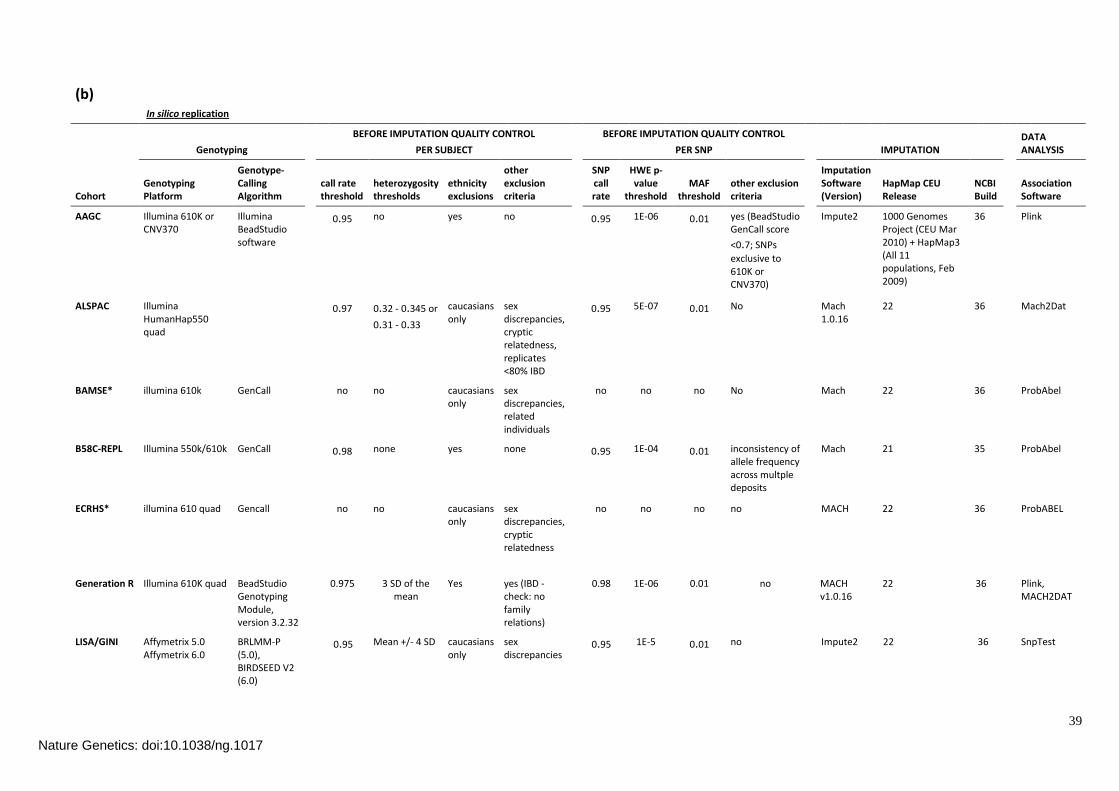
39
(b) In silico replication
Genotyping
BEFORE IMPUTATION QUALITY CONTROL
PER SUBJECT
BEFORE IMPUTATION QUALITY CONTROL
PER SNP IMPUTATION DATA ANALYSIS
Cohort Genotyping Platform
Genotype-Calling Algorithm
call rate threshold
heterozygosity thresholds
ethnicity exclusions
other exclusion criteria
SNP call rate
HWE p-value
threshold MAF
threshold other exclusion criteria
Imputation Software (Version)
HapMap CEU Release
NCBI Build
Association Software
AAGC Illumina 610K or CNV370
Illumina BeadStudio software
0.95 no yes no 0.95 1E-06 0.01 yes (BeadStudio GenCall score
<0.7; SNPs
exclusive to 610K or CNV370)
Impute2 1000 Genomes Project (CEU Mar 2010) + HapMap3 (All 11 populations, Feb 2009)
36 Plink
ALSPAC Illumina HumanHap550 quad
0.97 0.32 - 0.345 or
0.31 - 0.33
caucasians only
sex discrepancies, cryptic relatedness, replicates <80% IBD
0.95 5E-07 0.01 No Mach 1.0.16
22 36 Mach2Dat
BAMSE* illumina 610k GenCall no no caucasians only
sex discrepancies, related individuals
no no no No Mach 22 36 ProbAbel
B58C-REPL Illumina 550k/610k GenCall 0.98 none yes none 0.95 1E-04 0.01 inconsistency of allele frequency across multple deposits
Mach 21 35 ProbAbel
ECRHS* illumina 610 quad Gencall no no caucasians only
sex discrepancies, cryptic relatedness
no no no no MACH 22 36 ProbABEL
Generation R Illumina 610K quad BeadStudio Genotyping Module, version 3.2.32
0.975 3 SD of the mean
Yes yes (IBD - check: no family relations)
0.98 1E-06 0.01 no MACH v1.0.16
22 36 Plink, MACH2DAT
LISA/GINI Affymetrix 5.0 Affymetrix 6.0
BRLMM-P (5.0), BIRDSEED V2 (6.0)
0.95 Mean +/- 4 SD caucasians only
sex discrepancies
0.95 1E-5 0.01 no Impute2 22 36 SnpTest
Nature Genetics: doi:10.1038/ng.1017

40
MAAS illumina 610 quad Illumina GenCall application
0.97 outliers caucasians only
sex discrepancies, were non-concordant on sequenome genotyping
0.95 5.9E-07 0.01 No Impute2 3 + 1000 genomes 36 SnpTest
MoBa illumina 610 quad Gen Call 0.97 sex discrepancies
0.95 1E-03 0.01 Plink 22 36 Plink
NTR Affymetrix 6.0 Birdseed V2 no no no Clear sample switches based on fingerprint data (64 SNPs)
0.95 1E-04 0.01 MI>35 Beagle 22 36 Plink
SAPALDIA* illumina 610 quad Gencall no no caucasians only
sex discrepancies, cryptic relatedness
no no no no Mach 22 36 ProbABEL
de novo genotyping replication
QUALITY CONTROL PER SUBJECT QUALITY CONTROL PER SNP
Cohort Genotyping Method
Genotype-Calling Algorithm
call rate threshold ethnicity exclusions
other exclusion criteria
lowest SNP
call rate
SNPs with HWE
p-values <0.05 Association Software
Health2006 The PCR KASPar genotyping system (KBiosciences, Hoddesdon, UK).
Kraken (Kbioscience)
0.98 caucasians Danish citizenship, born in Denmark
0.98 0 SPSS
KORA F4 / GENEVA
Sequenom MALDI-TOF MS 4.0
Sequenom Typer 4.0
0.97 caucasian sex discrepancies 0.97 0 R
NFBC86 The PCR KASPar genotyping system (KBiosciences, Hoddesdon, UK).
Klustercaller (Kbioscience)
0.97 0.97 0 Quicktest
.
*GABRIEL cohorts had QC applied only after the imputation step, see BAMSE methods for details.
Nature Genetics: doi:10.1038/ng.1017

41
Supplementary Table 3. Discovery and replication results of the top 11 SNPs for atopic dermatitis. 1 SNP per region was followed up in the replication stage. Results are for
the fixed effect inverse-variance meta-analysis, with genomic control applied to the individual studies in the discovery meta-analysis. The heterogeneity p-value (het p), testing for overall
heterogeneity between all discovery and replication studies was generated using Cochran's Q-test for heterogeneity. All OR (odds ratios) are given with the minor allele representing the
effect allele (Eff). CI denotes the confidence interval
*rs9050 (and other associated SNP rs11205006 in the same region) were excluded from the replication phase after they were found to not be independent from the association with the
FLG mutations in the same region.
†rs2164983 was not included in the HapMap release 21 and so was missing for some discovery cohorts.
The SNP rs1327914 was replaced by the SNP rs927709 (r2=1.00) in the B58C-WTCCC, B58C-T1DGC, KORA-F3, NFBC66 and the B58C replication cohort
Alleles Discovery Replication
Combined
chr SNP Position
(bp) Gene Eff Alt
Effect Allele Freq N OR (95% CI) pvalue N OR (95% CI) pvalue N OR(95%CI) pvalue het p
11 rs479844 65308533 OVOL1 A G 0.44 26,151 0.89 (0.85, 0.93) 7.8E-07 25,098 0.87 (0.83,0.92) 2.4E-08 51,249 0.88 (0.85,0.91) 1.1E-13 0.23
19 rs2164983 8650381 ACTL9 A C 0.15 17,403† 1.22 (1.13, 1.32) 1.8E-07 22,996 1.11 (1.04,1.19) 0.002 40,399 1.16 (1.10,1.22) 7.1E-09 0.004
1 rs9050* 150345938 TCHH A C 0.06 25,788 1.33 (1.20, 1.47) 1.9E-08 - - - - - - 0.95
5 rs2897442 132076926 KIF3A C T 0.29 26,164 1.12 (1.07, 1.18) 7.8E-06 25,064 1.09 (1.04,1.15) 0.001 51,228 1.11 (1.07,1.15) 3.8E-08 0.52
8 rs7000782 81470705 ZBTB10 A T 0.43 26,077 1.14 (1.09, 1.20) 1.6E-08 20,873 1.03 (0.98,1.08) 0.296 46,950 1.09 (1.05,1.13) 1.1E-06 0.24
22 rs4821544 35588449 NCF4 C T 0.29 24,770 1.13 (1.07, 1.19) 3.5E-06 25,103 1.05 (0.99,1.10) 0.077 49,873 1.09 (1.05,1.13) 5.5E-06 0.53
6 rs3853601 31607582 BAT1 G C 0.12 25,528 1.17 (1.09, 1.26) 7.6E-06 21,964 1.09 (1.01,1.17) 0.031 47,492 1.13 (1.08,1.19) 1.9E-06 0.04
10 rs10994675 51233999 MSMB A G 0.42 24,787 1.12 (1.07, 1.17) 3.1E-06 22,903 1.00 (0.95,1.05) 0.929 47,690 1.06 (1.03,1.10) 0.001 0.39
13 rs1327914 95891570 HS6ST3 C T 0.17 26,168 1.16 (1.10, 1.24) 8.9E-07 25,088 0.98 (0.92,1.04) 0.434 51,256 1.07 (1.02,1.12) 0.003 0.005
10 rs4520482 67139368 CTNNA3 A G 0.43 26,031 0.90 (0.86, 0.94) 8.7E-06 25,109 1.02 (0.97,1.07) 0.457 51,140 0.96 (0.92,0.99) 0.008 0.32
9 rs10983837 119738636 TLR4 A C 0.03 26,101 1.35 (1.18, 1.54) 6.8E-06 24,168 0.92 (0.80,1.05) 0.229 50,269 1.12 (1.02,1.24) 0.015 0.002
Nature Genetics: doi:10.1038/ng.1017

42
Supplementary Table 4. AD association results from the discovery meta-analysis for the 15 loci associated with asthma or total serum IgE levels in a recent GWAS. Moffat MF, Gut IG, Demenais F, et al. A large-scale consortium-based genomewide association study of asthma. N Engl J Med 2010;125:328-35.
Moffat et al. (2010) asthma association
results AD association results from current
meta-analysis
SNP Gene Position effect allele
other allele OR (95% CI) pvalue OR (95% CI) pvalue
rs3771166 IL18R1 2q12.1 a g 0.87 (0.83-0.91) 3.4E-09 1.00 (0.95-1.05) 0.9791
rs9273349 HLA-DQB1 6p21.32 g a 1.18 (1.13-1.24) 7.0E-14 0.95 (0.86-1.04) 0.2647
rs1342326 IL33 9p24.1 c a 1.20 (1.13-1.28) 9.2E-10 0.99 (0.93-1.05) 0.7789
rs744910 SMAD3 15q22.33 a g 0.89 (0.86-0.92) 3.9E-09 0.98 (0.94-1.03) 0.3987
rs2305480 GSDMB 17q12 a g 0.85 (0.81-0.90) 9.6E-08 1.00 (0.96-1.05) 0.8723
rs3894194 GSDM1 17q21.1 a g 1.17 (1.11-1.23) 4.6E-09 1.00 (0.95-1.04) 0.8893
rs2284033 IL2RB 22q12.3 a g 0.89 (0.86-0.93) 1.1E-08 1.03 (0.98-1.07) 0.2845
rs1295686 IL13 5q31.1 c t 0.85 (0.79-0.90) 1.4E-07 0.91 (0.86-0.96) 0.0008
rs2073643 SLC22A5 5q31.1 c t 0.89 (0.84-0.93) 2.2E-07 0.96 (0.92-1.00) 0.0771
rs11071559 RORA 15q22.2 t c 0.88 (0.81-0.95) 1.1E-07 1.01 (0.95-1.08) 0.7475
Moffat et al. (2010) total serum IgE
association results AD association results from current
meta-analysis
SNP Gene Position effect allele
other allele beta pvalue OR (95% CI) pvalue
rs2252226 FCER1A 1q23.2 t c NA 6.6E-05 0.96 (0.92-1.01) 0.0817
rs20541 IL13 5q31.1 a g NA 1.0E-06 1.10 (1.04-1.16) 0.0007
rs9271300 HLA-DRB1 6p21.32 c g NA 8.3E-15 0.99 (0.90-1.09) 0.9013
rs167769 STAT6 12q13.3 t c NA 8.5E-07 1.05 (1.00-1.10) 0.0379
rs1859308 IL4-R/IL21R 16p12.1 a g NA 8.2E-06 0.97 (0.91-1.04) 0.4477
Nature Genetics: doi:10.1038/ng.1017
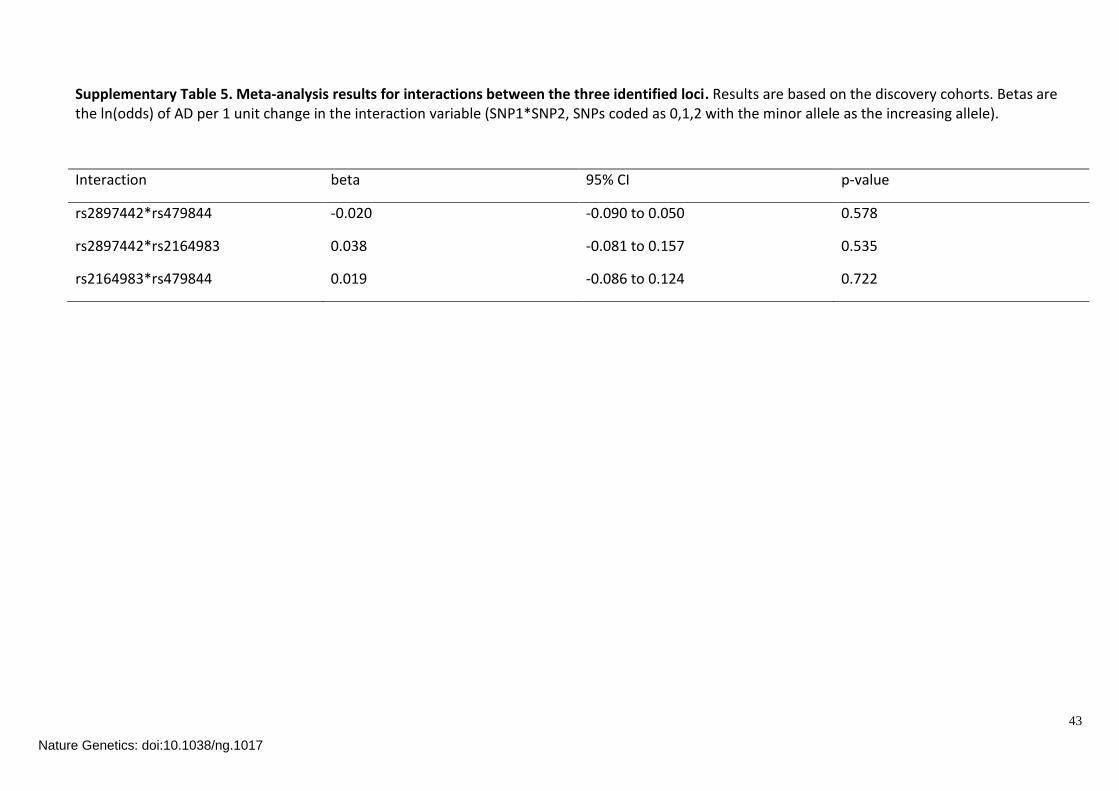
43
Supplementary Table 5. Meta-analysis results for interactions between the three identified loci. Results are based on the discovery cohorts. Betas are the ln(odds) of AD per 1 unit change in the interaction variable (SNP1*SNP2, SNPs coded as 0,1,2 with the minor allele as the increasing allele).
Interaction beta 95% CI p-value
rs2897442*rs479844 -0.020 -0.090 to 0.050 0.578
rs2897442*rs2164983 0.038 -0.081 to 0.157 0.535
rs2164983*rs479844 0.019 -0.086 to 0.124 0.722
Nature Genetics: doi:10.1038/ng.1017

44
Supplementary Table 6. Immunochip association results on region 5q31.1. Conditional association analysis for markers of the cytokine cluster on 5q31.1
including IL13 polymorphisms previously shown to be associated with asthma and psoriasis risk, as well as the GWAS KIF3A polymorphism showing the strongest
association in the meta-analysis and the lead SNP of the corresponding putative LD-block from the finemapping approach.
Marker 1
rs1800925 (IL13) rs20541 (IL13) rs848 (IL13) rs66913936 (IL4) rs2897442 (KIF3A)
Marker 2 rs1800925 (IL13) 1.32 (1.20-1.46)
P=1.74 x 10⁻⁸
1.26 (1.11-1.41)
P=0.0002
1.27 (1.12-1.42)
P=0.0001
1.23 (1.11-1.35)
P=5.36 x 10⁻⁵
1.19 (1.08-1.31)
P=0.0005
rs20541 (IL13) 1.17 (1.04-1.32)
P=0.0085
1.37 (1.24-1.52)
P=4.07 x 10⁻¹⁰
1.42 (0.72-2.81)
P=0.3090
1.18 (1.06-1.31)
P=0.0018
1.14 (1.03-1.26)
P=0.0096
rs848 (IL13) 1.17 (1.04-1.31)
P=0.0107
0.97 (0.49-1.92)
P=0.9249
1.38 (1.25-1.52)
P=1.93 x 10⁻¹⁰
1.18 (1.06-1.31)
P=0.0022
1.14 (1.03-1.26)
P=0.0113
rs66913936 (IL4) 1.24 (1.12-1.37)
P=3.53 x 10⁻⁵
1.27 (1.13-1.42)
P=2.86 x 10
1.28 (1.14-1.42)
P=1.74 x 10⁻⁵
1.31 (1.19-1.43)
P=2.58 x 10⁻⁸
0.91 (0.71-1.17)
P=0.4742
rs2897442 (KIF3A) 1.26 (1.14-1.39)
P=1.01 x 10⁻⁵
1.29 (1.16-1.44)
P=3.42 x 10⁻⁶
1.30 (1.17-1.45)
P=2.00 x 10⁻⁶
1.43 (1.10-1.84)
P=0.0069
1.26 (1.15-1.38)
P=8.84 x 10⁻⁷
Conditional analysis of Marker 1 conditioned on Marker 2 using the logistic regression framework. The diagonal elements shows results of the unconditional analysis.
Displayed are odds ratios with corresponding 95% confidence intervals in brackets and P-values
Nature Genetics: doi:10.1038/ng.1017

45
Supplementary Table 7. Immunochip linkage disequilibrium (LD) in region 5q31.1. Pair-wise LD measures between markers of the cytokine cluster on 5q31.1
including IL13 polymorphisms previously shown to be associated with asthma and psoriasis risk, as well as the GWAS KIF3A polymorphism showing the strongest
association in the meta-analysis and the lead SNP of the corresponding putative LD-block from the finemapping approach.
Marker 1
Marker 2 rs1800925 (IL13) rs20541 (IL13) rs848 (IL13) rs66913936 (IL4) rs2897442 (KIF3A)
rs1800925 (IL13) 1 0.301 0.298 0.090 0.078
rs20541 (IL13) 0.564 1 0.979 0.192 0.164
rs848 (IL13) 0.558 0.995 1 0.194 0.166
rs66913936 (IL4) 0.328 0.493 0.492 1 0.858
rs2897442 (KIF3A) 0.323 0.483 0.483 0.982 1
The upper triangular matrix shows r2 values, whereas the lower triangular matrix displays D’ values. The color coding refers to the strength of LD.
Values R2 D’
<0.2
0.2-0.4
0.4-0.6
0.6-0.8
>0.8
Nature Genetics: doi:10.1038/ng.1017

46
Supplementary Figure 1. QQ plot for the discovery genome-wide association meta-
analysis, after excluding all SNPs MAF<1% and Rsqr<0.3 or proper_info<0.4. =1.017.EDC=epidermal
differentiation complex region (which contains FLG) defined as Chr 1:150.2-151.9Mb.
Nature Genetics: doi:10.1038/ng.1017
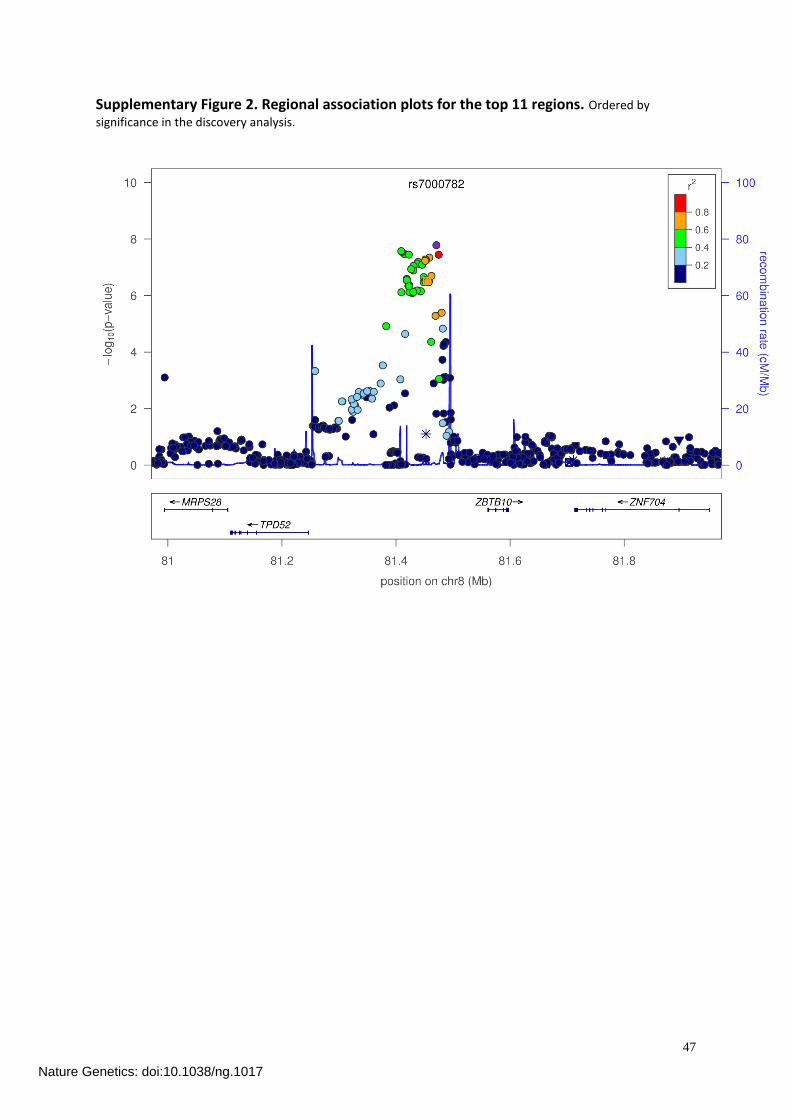
47
Supplementary Figure 2. Regional association plots for the top 11 regions. Ordered by
significance in the discovery analysis.
Nature Genetics: doi:10.1038/ng.1017

48
Nature Genetics: doi:10.1038/ng.1017

49
Nature Genetics: doi:10.1038/ng.1017
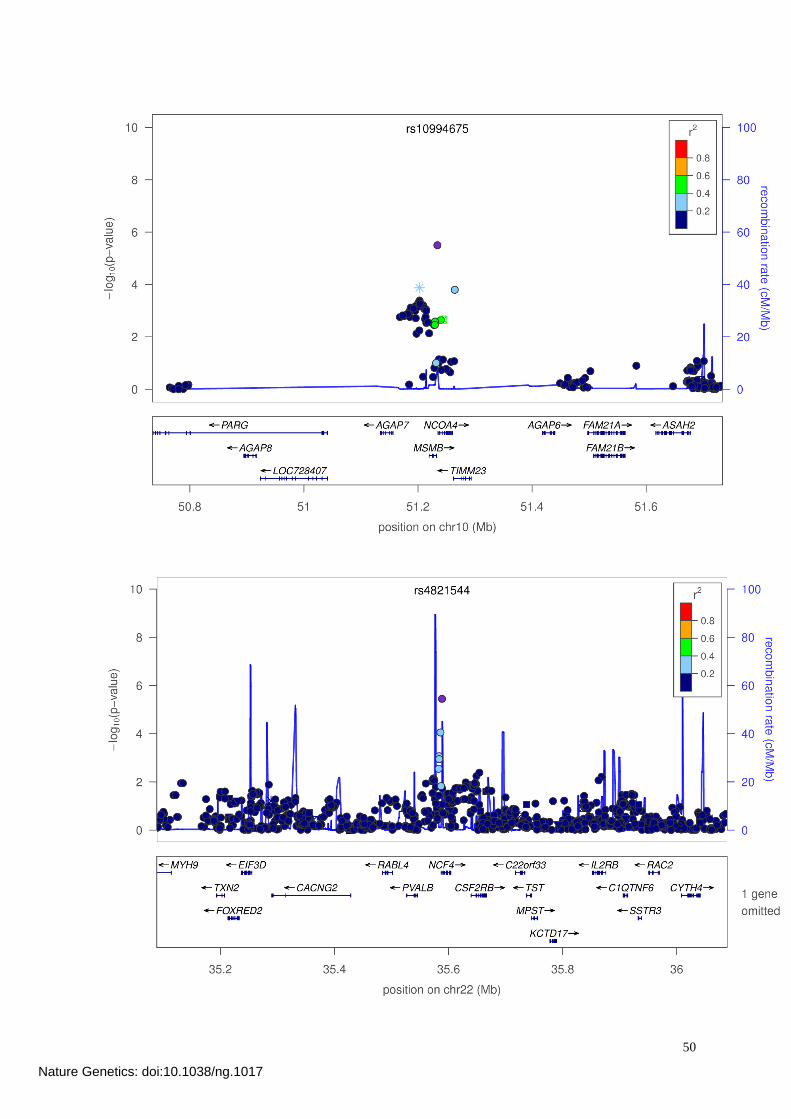
50
Nature Genetics: doi:10.1038/ng.1017

51
Nature Genetics: doi:10.1038/ng.1017

52
Nature Genetics: doi:10.1038/ng.1017

53
Supplementary Figure 3. Meta-analysis of 8 studies with no adjustment for FLG mutations (a) and with adjustment for FLG R501X and 2282del4 mutations (b). rs9050 (purple diamond)
OR=1.28, p-value=0.008 in (a) and OR=0.98, p-value=0.88 in (b). A second SNP in the region (rs11205006 at ~150.7Mb) OR=1.21, p-value=8x10
-5 in (a) and OR=1.09, p-value=0.15 in (b). Plotted using LocusZoom
(csg.sph.umich.edu/locuszoom/). Data from ALSPAC, BAMSE, COPSAC, KORA F3, KORA F4, LISA, MAAS and PIAMA studies contributed to these analyses.
a.
b.
Nature Genetics: doi:10.1038/ng.1017

54
Supplementary Figure 4. Previously known 11q13 (rs7927894) association in our study. (a)
The regional association plot for the discovery meta-analysis (top SNP, rs11236810 p=0.0002), (b) The forest plot for the association in each of the discovery cohorts for rs7927894 with T as the risk allele (het p=0.127). GENR= Generation R.
a.
b.
Nature Genetics: doi:10.1038/ng.1017
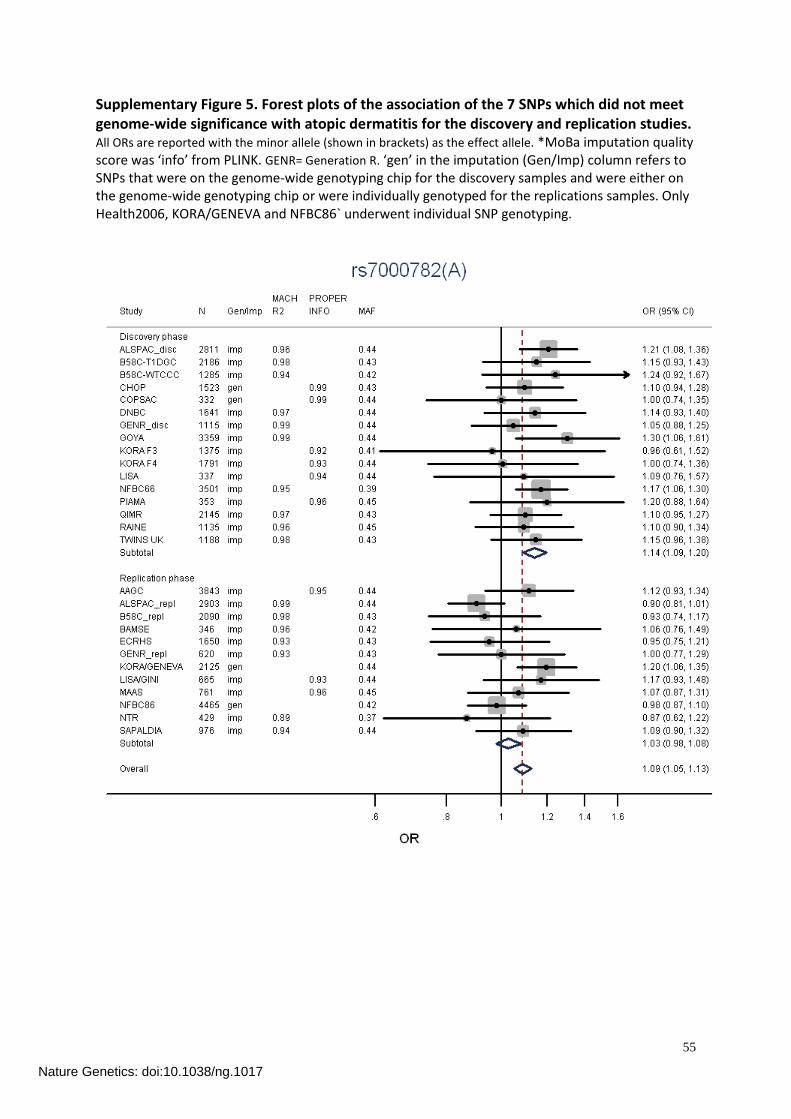
55
Supplementary Figure 5. Forest plots of the association of the 7 SNPs which did not meet genome-wide significance with atopic dermatitis for the discovery and replication studies. All ORs are reported with the minor allele (shown in brackets) as the effect allele. *MoBa imputation quality score was ‘info’ from PLINK. GENR= Generation R. ‘gen’ in the imputation (Gen/Imp) column refers to SNPs that were on the genome-wide genotyping chip for the discovery samples and were either on the genome-wide genotyping chip or were individually genotyped for the replications samples. Only Health2006, KORA/GENEVA and NFBC86` underwent individual SNP genotyping.
Nature Genetics: doi:10.1038/ng.1017

56
Nature Genetics: doi:10.1038/ng.1017

57
Nature Genetics: doi:10.1038/ng.1017

58
Nature Genetics: doi:10.1038/ng.1017

59
Nature Genetics: doi:10.1038/ng.1017

60
Nature Genetics: doi:10.1038/ng.1017
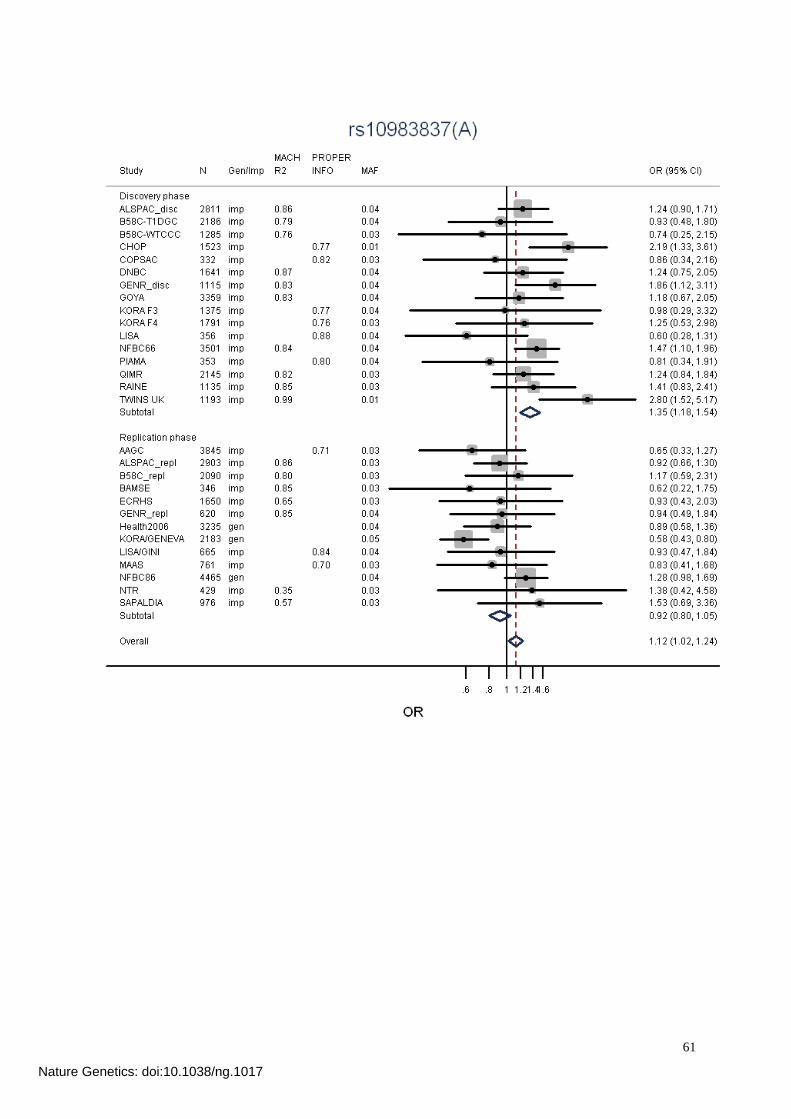
61
Nature Genetics: doi:10.1038/ng.1017
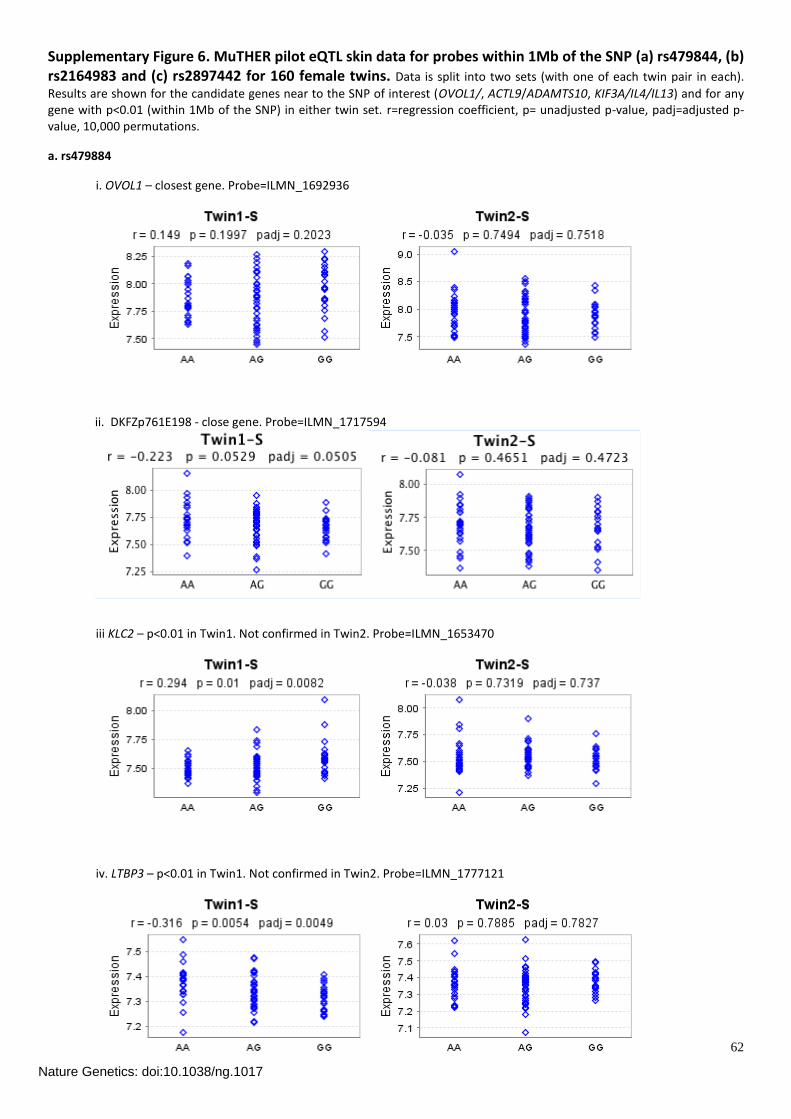
62
Supplementary Figure 6. MuTHER pilot eQTL skin data for probes within 1Mb of the SNP (a) rs479844, (b) rs2164983 and (c) rs2897442 for 160 female twins. Data is split into two sets (with one of each twin pair in each).
Results are shown for the candidate genes near to the SNP of interest (OVOL1/, ACTL9/ADAMTS10, KIF3A/IL4/IL13) and for any gene with p<0.01 (within 1Mb of the SNP) in either twin set. r=regression coefficient, p= unadjusted p-value, padj=adjusted p-value, 10,000 permutations.
a. rs479884
i. OVOL1 – closest gene. Probe=ILMN_1692936
ii. DKFZp761E198 - close gene. Probe=ILMN_1717594
iii KLC2 – p<0.01 in Twin1. Not confirmed in Twin2. Probe=ILMN_1653470
iv. LTBP3 – p<0.01 in Twin1. Not confirmed in Twin2. Probe=ILMN_1777121
Nature Genetics: doi:10.1038/ng.1017

63
v. SLC25A45 – p<0.01 in Twin2. Not confirmed in Twin1. Probe=ILMN_1810727
b. rs2967675 – best available proxy for rs2164983 (r2=0.94)
i. ACTL9 – closest gene. Probe=ILMN_1656193
c. rs2299009 – best available proxy for rs2897442 (r2=1.0)
i. KIF3A – close gene. Probe=ILMN_1653385
Nature Genetics: doi:10.1038/ng.1017
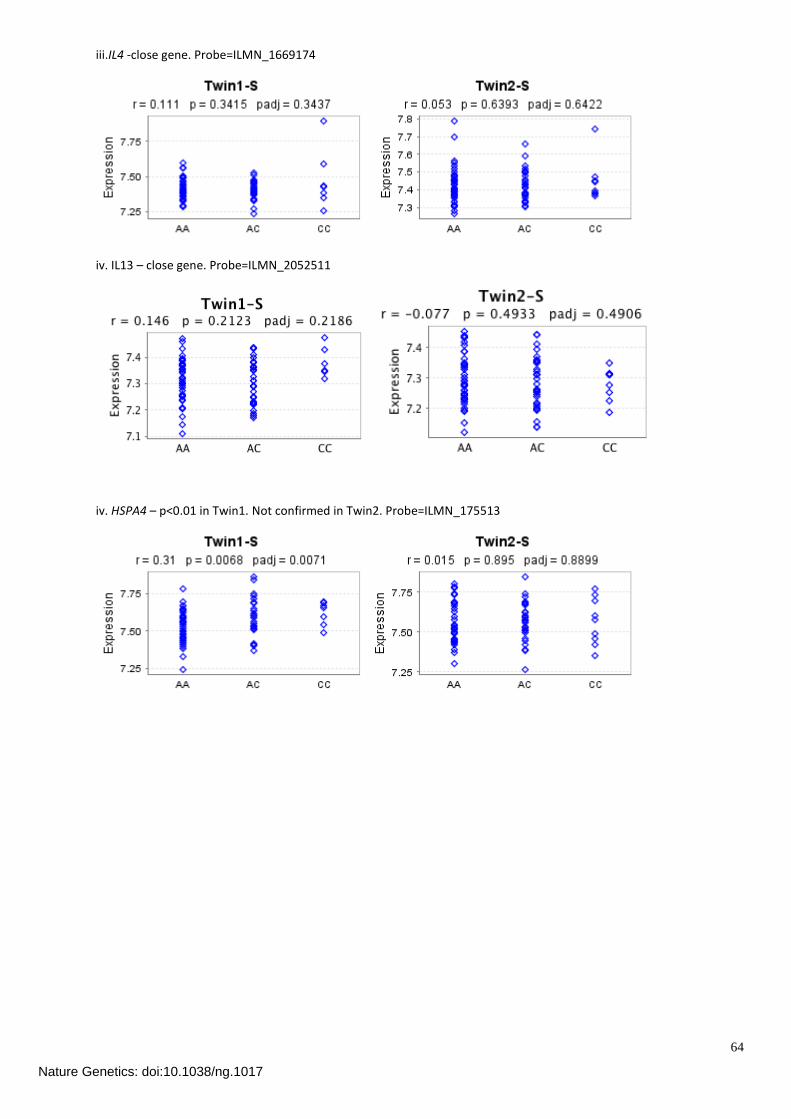
64
iii.IL4 -close gene. Probe=ILMN_1669174
iv. IL13 – close gene. Probe=ILMN_2052511
iv. HSPA4 – p<0.01 in Twin1. Not confirmed in Twin2. Probe=ILMN_175513
Nature Genetics: doi:10.1038/ng.1017

65
Supplementary Figure 7. Regional Association Plots for 5q31.1 in the discovery cohorts (a) no conditional SNPs and (b) conditional on rs2897442. N=26,164.
a.
b.
Nature Genetics: doi:10.1038/ng.1017

66
Supplementary Figure 8. Regional association plot of markers within the cytokine cluster on 5q31.1. Results from the Immunochip (custom genotyping SNP- chip designed for
immunogenetic studies) including IL13 polymorphisms previously shown to be associated with asthma and psoriasis risk, as well as the GWAS KIF3A polymorphism showing the strongest
association in the meta-analysis and the lead SNP of the corresponding putative LD-block from the finemapping approach.
Nature Genetics: doi:10.1038/ng.1017

67
Supplementary Figure 9. Stratified forest plots for SNPs associated with AD (rs479844, rs2164983, rs2897442) or with evidence of heterogeneity (rs2164983, rs1327914, rs10983837). Stratified by (a) reported physician AD diagnosis versus reported history of AD, (b) diagnosis
before the age of 15 (child) versus up to and including adults. GENR = Generation R.
a. reported physician AD diagnosis versus reported history of AD. Difference between subgroup p-values: rs479844 p=0.653; rs2164983 p=0.134; rs2897442 p=0.023; rs1327914 p=0.191; rs10983837 p=0.568.
*CHOP used sub-optimal ICD9 diagnosis in medical record to identify cases. Reported physician’s AD diagnosis subgroup result with CHOP excluded: OR=0.89 (95%CI 0.85 - 0.93).
Nature Genetics: doi:10.1038/ng.1017

68
*CHOP used sub-optimal ICD9 diagnosis in medical record to identify cases. Reported physician’s AD diagnosis subgroup result with CHOP excluded: OR=1.18 (95%CI 1.10 - 1.26).
Nature Genetics: doi:10.1038/ng.1017

69
*CHOP used sub-optimal ICD9 diagnosis in medical record to identify cases. Reported physician’s AD diagnosis subgroup result with CHOP excluded: OR=1.15 (95%CI 1.09 - 1.20).
Nature Genetics: doi:10.1038/ng.1017

70
*CHOP used sub-optimal ICD9 diagnosis in medical record to identify cases. Reported physician’s AD diagnosis subgroup result with CHOP excluded: OR=1.07 (95%CI 1.01 - 1.14).
Nature Genetics: doi:10.1038/ng.1017

71
*CHOP used sub-optimal ICD9 diagnosis in medical record to identify cases. Reported physician’s AD diagnosis subgroup result with CHOP excluded: OR=1.06 (95%CI 0.94 - 1.19).
Nature Genetics: doi:10.1038/ng.1017

72
b. diagnosis before the age of 15 (child) versus up to and including adults. Difference between subgroup p-values: rs479844 p=0.224; rs2164983 p=0.037; rs2897442 p=0.465; rs1327914 p=0.028; rs10983837 p=0.773.
Nature Genetics: doi:10.1038/ng.1017

73
Nature Genetics: doi:10.1038/ng.1017
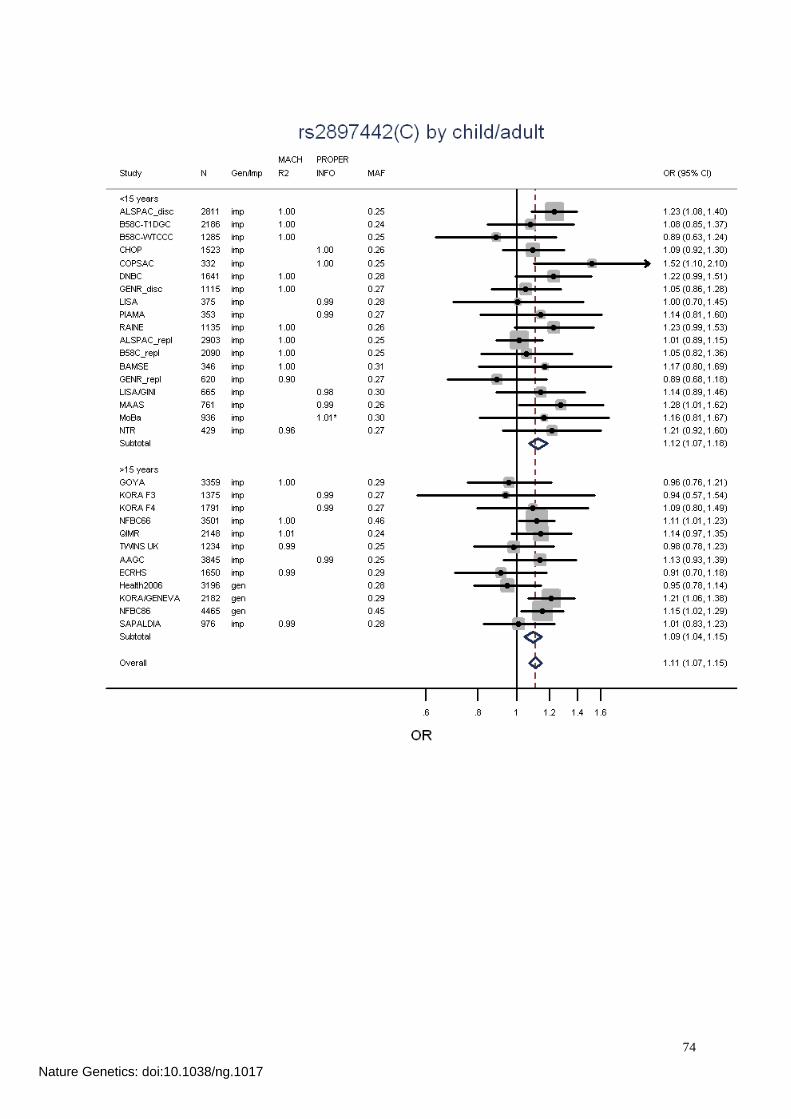
74
Nature Genetics: doi:10.1038/ng.1017

75
Nature Genetics: doi:10.1038/ng.1017
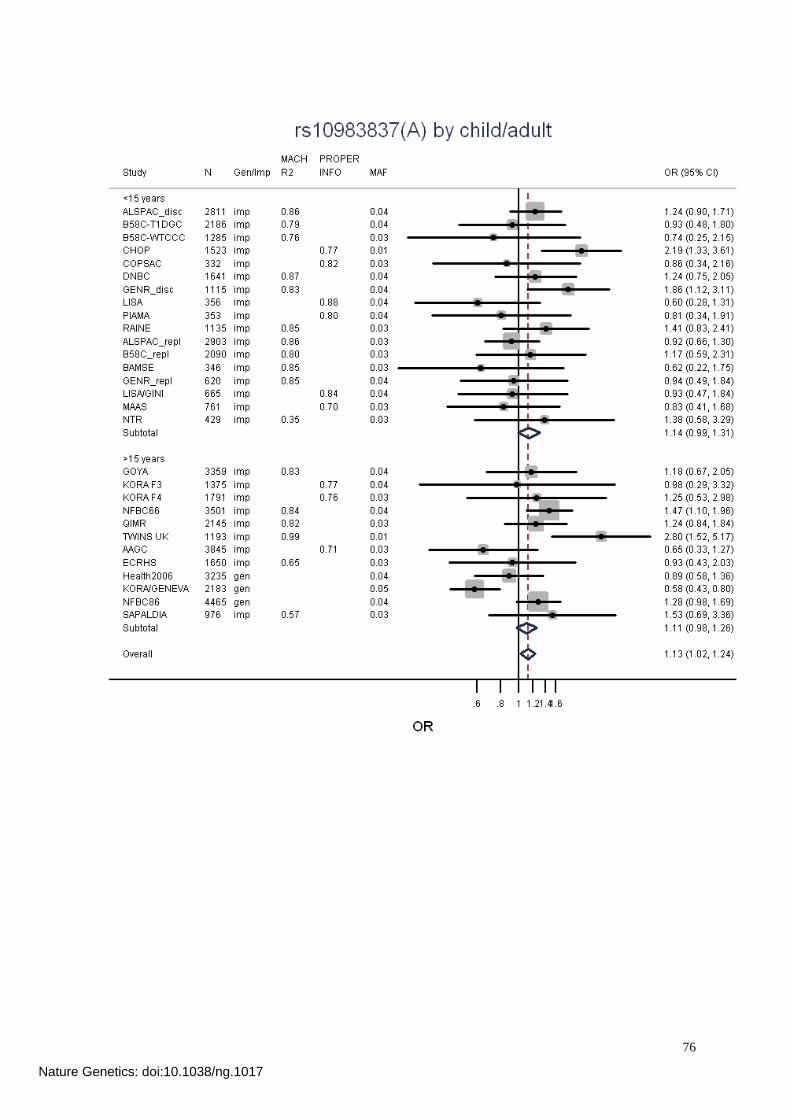
76
Nature Genetics: doi:10.1038/ng.1017

77
Supplementary References
1 Johansson SGO et al. Revised nomenclature for allergy for global use: Report of the Nomenclature
Review Committee of the World Allergy Organization, October 2003. J Allergy Clin Immunol. 113,
832–836 (2004).
2 Golding J, Pembrey M, Jones R, Team ALSPACS. ALSPAC–the Avon Longitudinal Study of Parents and
Children. I. Study methodology. Paediatr Perinat Epidemiol. 15, 74–87 (2001).
3 Li Y, Willer C, Sanna S, Abecasis G. Genotype imputation. Annu Rev Genomics Hum Genet. 10, 387–
406 (2009).
4 Li Y, Willer CJ, Ding J, Scheet P, Abecasis GR. MaCH: using sequence and genotype data to estimate
haplotypes and unobserved genotypes. Genet Epidemiol. 34, 816–834 (2010).
5 Henderson J et al. The burden of disease associated with filaggrin mutations: a population-based,
longitudinal birth cohort study. J Allergy Clin Immunol. 121, 872–7.e9 (2008).
6 Kull I et al. Breast-feeding in relation to asthma, lung function, and sensitization in young
schoolchildren. J Allergy Clin Immunol. 125, 1013–1019 (2010).
7 Moffatt MF et al. A large-scale, consortium-based genomewide association study of asthma. N Engl J
Med. 363, 1211–1221 (2010).
8 Aulchenko YS, Struchalin MV, van Duijn CM. ProbABEL package for genome-wide association analysis
of imputed data. BMC Bioinformatics. 11, 134 (2010).
9 Williams HC, Strachan DP, Hay RJ. Childhood eczema: disease of the advantaged? BMJ. 308, 1132–
1135 (1994).
10 Strachan DP et al. Lifecourse influences on health among British adults: effects of region of residence
in childhood and adulthood. Int J Epidemiol. 36, 522–531 (2007).
11 Wellcome Trust Case Control Consortium. Genome-wide association study of 14,000 cases of seven
common diseases and 3,000 shared controls. Nature. 447, 661–678 (2007).
12 Barrett JC et al. Genome-wide association study and meta-analysis find that over 40 loci affect risk of
type 1 diabetes. Nat Genet. 41, 703–707 (2009).
13 Bisgaard H. The Copenhagen Prospective Study on Asthma in Childhood (COPSAC): design, rationale,
and baseline data from a longitudinal birth cohort study. Ann Allergy Asthma Immunol. 93, 381–389
(2004).
14 Bisgaard H, Hermansen MN, Loland L, Halkjaer LB, Buchvald F. Intermittent inhaled corticosteroids in
infants with episodic wheezing. N Engl J Med. 354, 1998–2005 (2006).
15 Bisgaard H et al. Childhood asthma after bacterial colonization of the airway in neonates. N Engl J
Med. 357, 1487–1495 (2007).
16 Bisgaard H et al. Gene-environment interaction in the onset of eczema in infancy: filaggrin loss-of-
function mutations enhanced by neonatal cat exposure. PLoS Med. 5, e131 (2008).
17 Halkjaer LB et al. Development of atopic dermatitis during the first 3 years of life: the Copenhagen
prospective study on asthma in childhood cohort study in high-risk children. Arch Dermatol. 142,
561–566 (2006).
Nature Genetics: doi:10.1038/ng.1017

78
18 Palmer CNA et al. Common loss-of-function variants of the epidermal barrier protein filaggrin are a
major predisposing factor for atopic dermatitis. Nat Genet. 38, 441–446 (2006).
19 Hakonarson H et al. A genome-wide association study identifies KIAA0350 as a type 1 diabetes gene.
Nature. 448, 591–594 (2007).
20 Olsen J et al. The Danish National Birth Cohort–its background, structure and aim. Scand J Public
Health. 29, 300–307 (2001).
21 Benn CS et al. Atopic dermatitis in young children: diagnostic criteria for use in epidemiological
studies based on telephone interviews. Acta Derm Venereol. 83, 347–350 (2003).
22 Burney PG, Luczynska C, Chinn S, Jarvis D. The European Community Respiratory Health Survey. Eur
Respir J. 7, 954–960 (1994).
23 European Community Respiratory Health Survey II Steering Committee. The European Community
Respiratory Health Survey II. Eur Respir J. 20, 1071–1079 (2002).
24 Harrop J et al. Eczema, atopy and allergen exposure in adults: a population-based study. Clin Exp
Allergy. 37, 526–535 (2007).
25 Jaddoe VWV et al. The Generation R Study Biobank: a resource for epidemiological studies in children
and their parents. Eur J Epidemiol. 22, 917–923 (2007).
26 Jaddoe VWV et al. The Generation R Study: design and cohort update 2010. Eur J Epidemiol. 25, 823–
841 (2010).
27 Estrada K et al. GRIMP: a web- and grid-based tool for high-speed analysis of large-scale genome-
wide association using imputed data. Bioinformatics. 25, 2750–2752 (2009).
28 Nohr EA et al. Severe obesity in young women and reproductive health: the Danish National Birth
Cohort. PLoS ONE. 4, e8444 (2009).
29 Paternoster L et al. Genome-Wide Population-Based Association Study of Extremely Overweight
Young Adults – The GOYA Study. PLoS ONE. 6, e24303 (2011).
30 Thyssen JP, Linneberg A, Menné T, Nielsen NH, Johansen JD. The prevalence and morbidity of
sensitization to fragrance mix I in the general population. Br J Dermatol. 161, 95–101 (2009).
31 Thyssen JP, Linneberg A, Menné T, Nielsen NH, Johansen JD. The effect of tobacco smoking and
alcohol consumption on the prevalence of self-reported hand eczema: a cross-sectional population-
based study. Br J Dermatol. 162, 619–626 (2010).
32 Holle R, Happich M, Löwel H, Wichmann HE, MONICA/KORA Study Group. KORA–a research platform
for population based health research. Gesundheitswesen. 67 Suppl 1, S19–S25 (2005).
33 Wichmann HE, Gieger C, Illig T, MONICA/KORA Study Group. KORA-gen–resource for population
genetics, controls and a broad spectrum of disease phenotypes. Gesundheitswesen. 67 Suppl 1, S26–
S30 (2005).
34 Esparza-Gordillo J et al. A common variant on chromosome 11q13 is associated with atopic
dermatitis. Nat Genet. 41, 596–601 (2009).
35 Williams HC et al. The U.K. Working Party’s Diagnostic Criteria for Atopic Dermatitis. I. Derivation of a
minimum set of discriminators for atopic dermatitis. Br J Dermatol. 131, 383–396 (1994).
Nature Genetics: doi:10.1038/ng.1017

79
36 Heinrich J et al. Allergens and endotoxin on mothers’ mattresses and total immunoglobulin E in cord
blood of neonates. Eur Respir J. 20, 617–623 (2002).
37 von Berg A et al. The effect of hydrolyzed cow’s milk formula for allergy prevention in the first year of
life: the German Infant Nutritional Intervention Study, a randomized double-blind trial. J Allergy Clin
Immunol. 111, 533–540 (2003).
38 Marchini J, Howie B, Myers S, McVean G, Donnelly P. A new multipoint method for genome-wide
association studies by imputation of genotypes. Nat Genet. 39, 906–913 (2007).
39 Howie BN, Donnelly P, Marchini J. A flexible and accurate genotype imputation method for the next
generation of genome-wide association studies. PLoS Genet. 5, e1000529 (2009).
40 Custovic A, Simpson BM, Murray CS, Lowe L, Woodcock A, N A C Manchester Asthma and Allergy
Study Group. The National Asthma Campaign Manchester Asthma and Allergy Study. Pediatr Allergy
Immunol. 13 Suppl 15, 32–37 (2002).
41 Lowe LA et al. Wheeze phenotypes and lung function in preschool children. Am J Respir Crit Care
Med. 171, 231–237 (2005).
42 Murray CS et al. Lung function at one month of age as a risk factor for infant respiratory symptoms in
a high risk population. Thorax. 57, 388–392 (2002).
43 Nicolaou NC et al. Exhaled breath condensate pH and childhood asthma: unselected birth cohort
study. Am J Respir Crit Care Med. 174, 254–259 (2006).
44 Nicolaou NC et al. Day-care attendance, position in sibship, and early childhood wheezing: a
population-based birth cohort study. J Allergy Clin Immunol. 122, 500–6.e5 (2008).
45 Magnus P et al. Cohort profile: the Norwegian Mother and Child Cohort Study (MoBa). Int J
Epidemiol. 35, 1146–1150 (2006).
46 Rønningen KS et al. The biobank of the Norwegian Mother and Child Cohort Study: a resource for the
next 100 years. Eur J Epidemiol. 21, 619–625 (2006).
47 Rantakallio P. The longitudinal study of the northern Finland birth cohort of 1966. Paediatr Perinat
Epidemiol. 2, 59–88 (1988).
48 Sovio U et al. Genetic determinants of height growth assessed longitudinally from infancy to
adulthood in the northern Finland birth cohort 1966. PLoS Genet. 5, e1000409 (2009).
49 Frayling TM et al. A common variant in the FTO gene is associated with body mass index and
predisposes to childhood and adult obesity. Science. 316, 889–894 (2007).
50 Sabatti C et al. Genome-wide association analysis of metabolic traits in a birth cohort from a founder
population. Nat Genet. 41, 35–46 (2009).
51 Järvelin MR, Hartikainen-Sorri AL, Rantakallio P. Labour induction policy in hospitals of different
levels of specialisation. Br J Obstet Gynaecol. 100, 310–315 (1993).
52 Boomsma DI et al. Netherlands Twin Register: from twins to twin families. Twin Res Hum Genet. 9,
849–857 (2006).
53 van Beijsterveldt CEM, Boomsma DI. Genetics of parentally reported asthma, eczema and rhinitis in
5-yr-old twins. Eur Respir J. 29, 516–521 (2007).
Nature Genetics: doi:10.1038/ng.1017

80
54 Brunekreef B et al. The prevention and incidence of asthma and mite allergy (PIAMA) birth cohort
study: design and first results. Pediatr Allergy Immunol. 13 Suppl 15, 55–60 (2002).
55 Ferreira MAR et al. Association between ORMDL3, IL1RL1 and a deletion on chromosome 17q21 with
asthma risk in Australia. Eur J Hum Genet. 19, 458–464 (2011).
56 Evans S, Newnham J, MacDonald W, Hall C. Characterisation of the possible effect on birthweight
following frequent prenatal ultrasound examinations. Early Hum Dev. 45, 203–214 (1996).
57 Newnham JP, Evans SF, Michael CA, Stanley FJ, Landau LI. Effects of frequent ultrasound during
pregnancy: a randomised controlled trial. Lancet. 342, 887–891 (1993).
58 Williams LA, Evans SF, Newnham JP. Prospective cohort study of factors influencing the relative
weights of the placenta and the newborn infant. BMJ. 314, 1864–1868 (1997).
59 Ackermann-Liebrich U et al. Follow-up of the Swiss Cohort Study on Air Pollution and Lung Diseases
in Adults (SAPALDIA 2) 1991-2003: methods and characterization of participants. Soz Praventivmed.
50, 245–263 (2005).
60 Downs SH et al. Reduced exposure to PM10 and attenuated age-related decline in lung function. N
Engl J Med. 357, 2338–2347 (2007).
61 Spector TD, Williams FMK. The UK Adult Twin Registry (TwinsUK). Twin Res Hum Genet. 9, 899–906
(2006).
Nature Genetics: doi:10.1038/ng.1017
7 Paper 4: Regional and SocioeconomicDi�erences in Dietary Intake in Children(Sausenthaler* & Standl* et al. Public Health Nutrition, 2011)
Original title: Regional and socio-economic di�erences in food, nutrient and sup-plement intake in school-age children in Germany: results from theGINIplus and the LISAplus studies.
Authors: S Sausenthaler*, M Standl*, A Buyken, P Rzehak, S Koletzko, C-PBauer, B Schaaf, A von Berg, D Berdel, M Borte, O Herbarth, ILehmann, U Krämer, H-E Wichmann, J Heinrich* These authors contributed equally to this work.
Journal: Public Health NutritionVolume: 14Pages: 1724�1735Year: 2011
Reproduced with permission from Cambridge University Press.
147


Public Health Nutrition: page 1 of 12 doi:10.1017/S1368980010003575
Regional and socio-economic differences in food, nutrient andsupplement intake in school-age children in Germany: resultsfrom the GINIplus and the LISAplus studies
Stefanie Sausenthaler1,*,†, Marie Standl1,†, Anette Buyken2, Peter Rzehak1,3,Sibylle Koletzko4, Carl Peter Bauer5, Beate Schaaf6, Andrea von Berg7,Dietrich Berdel7, Michael Borte8,9, Olf Herbarth10, Irina Lehmann11, Ursula Kramer12,H-Erich Wichmann1,2 and Joachim Heinrich1,‡ for the GINIplus and theLISAplus Study Groups1Helmholtz Zentrum Munchen, German Research Center for Environmental Health, Institute of Epidemiology,Ingolstadter Landstr. 1, 85764 Neuherberg, Germany: 2Research Institute of Child Nutrition, University of Bonn,Dortmund, Germany: 3Institute of Medical Data Management, Biometrics and Epidemiology, Ludwig-Maximilians-University of Munich, Munich, Germany: 4Dr von Hauner Children’s Hospital, Ludwig-Maximilians-Universityof Munich, Munich, Germany: 5Department of Pediatrics, Technical University of Munich, Munich, Germany:6Medical Practice for Pediatrics, Bad Honnef, Germany: 7Department of Pediatrics, Marien-Hospital Wesel,Wesel, Germany: 8Department of Pediatrics, University of Leipzig, Leipzig, Germany: 9Municipal Hospital‘St. Georg’ Leipzig, Children’s Hospital, Leipzig, Germany: 10Faculty of Medicine, Environmental Hygiene andEnvironmental Medicine, University of Leipzig, Leipzig, Germany: 11Department for Environmental Immunology,Helmholtz Centre for Environmental Research – UFZ, Leipzig, Germany: 12Institut fur UmweltmedizinischeForschung, University of Dusseldorf, Dusseldorf, Germany
Submitted 1 March 2010: Accepted 23 November 2010
Abstract
Objective: To describe regional differences between eastern and westernGermany with regard to food, nutrient and supplement intake in 9–12-year-oldchildren, and analyse its association with parental education and equivalentincome.Design: Data were obtained from the 10-year follow-up of the two prospectivebirth cohort studies – GINIplus and LISAplus. Data on food consumption andsupplement intake were collected using an FFQ, which had been designed forthe specific study population. Information on parental educational level andequivalent income was derived from questionnaires. Logistic regression model-ling was used to analyse the effect of parental education, equivalent income andregion on food intake, after adjusting for potential confounders.Setting: Germany.Subjects: A total of 3435 children aged 9–12 years.Results: Substantial regional differences in food intake were observed betweeneastern and western Germany. Intakes of bread, butter, eggs, pasta, vegetables/saladand fruit showed a significant direct relationship with the level of parental educationafter adjusting for potential confounders, whereas intakes of margarine, meatproducts, pizza, desserts and soft drinks were inversely associated with parentaleducation. Equivalent income had a weaker influence on the child’s food intake.Conclusions: Nutritional education programmes for school-age children shouldtherefore account for regional differences and parental education.
KeywordsDiet
ChildrenGermany
Regional differencesSocio-economic determinants
In Germany, in the early 1990s, shortly after reunification,
substantial differences in diet between the eastern and
western parts were reported in adults(1). Although food
consumption patterns have since largely converged, dif-
ferences still existed in 1998(2) and hence they probably
do even today.
Furthermore, socio-economic inequalities in food
choice and dietary intakes have been reported constantly
in the past(3–6). These studies supported the hypothesis
that people from higher socio-economic classes have higher
SPublic
Hea
lth
Nutr
itio
n
y Both authors have contributed equally to the manuscript.
z Members of and institutions affiliated with the LISAplus and theGINIplus study groups are listed in the Appendix.
*Corresponding author: Email [email protected] r The Authors 2011

intakes of healthy foods, such as whole grains, fish, low-fat
dairy products, fresh fruit and vegetables, and lower intakes
of unfavourable foods, such as meat and added fat, and
were thus more likely meet dietary recommendations than
people from lower socio-economic classes. Although these
associations have been studied mainly in adults, as reviewed
recently(7), it is less clear how parental socio-economic
position influences food intake in school-age children. In
this context, it would be worth knowing whether and how
dietary supplement use in children depends on parental
education and household income, as this has become
common in German children and adolescents over the past
years(8). According to the German Health Interview and
Examination Survey for Children and Adolescents (KiGGS),
15% of 12–13-year-old boys and 23% of 12–13-year-old
girls were taking dietary supplements in 2006(9). Educational
inequalities were found; however, as most dietary supple-
ments are quite expensive, household income is likely to
further limit supplement intake in children.
Detailed knowledge of dietary differences associated
with socio-economic inequalities or region of living has
important implications, both for the analysis of epide-
miological studies and for improving interventions to
promote healthy eating. Therefore, the aim of the present
study was to describe potential differences between
eastern and western Germany and the effect of parental
education and equivalent income on food, nutrient and
supplement intake in our study population of 9–12-year-
old children living in Germany.
We hypothesise that the intake of favourable foods in
children, such as fruit and vegetables, as well as the
intake of clearly unfavourable foods such as sweets and
cakes, shows a social gradient, which is probably mainly
determined by the level of parental education and
equivalent income. We further hypothesise that, in addi-
tion to socio-economic differences, regional differences
between eastern and western Germany exist for particular
foods and food groups.
Methods
Study population
Data from two ongoing German birth cohort studies were
combined for the present analysis.
The GINIplus (German Infant Nutritional Intervention)
study is a prospective birth cohort study that comprises the
GINI intervention study (I) and the GINI non-intervention
study (NI) and was initiated to investigate the influence of
nutritional intervention during infancy, as well as that of air
pollution and genetics on allergy development. Details on
study design, recruitment and exclusion criteria have been
described elsewhere(10,11). In brief, between September
1995 and June 1998, a total of 5991 healthy full-term
newborns were recruited from obstetric clinics in two
regions of Germany (urban Munich and rural Wesel).
Group I (n 2252) included infants with a family history of
allergy. In this prospective, double-blind intervention
trial, newborns were randomized at birth to one of three
hydrolysed formulae or to a conventional cow’s milk
formula. The formulae were provided only if the recom-
mended exclusive breast-feeding for the first 4 months
was not feasible or wanted. Infants with no family history
of allergy (n 2507) or with a positive family history but
from parents who refused to participate in the interven-
tion trial (n 1232) were allocated to the NI group. This
group was sent only the yearly questionnaires and did not
receive any of the additional intervention procedures.
All children (I and NI groups) were followed up with
identical questionnaires at 1, 2, 3, 4, 6 and 10 years of age to
collect information on health outcomes and covariates,
such as children’s nutrition and other lifestyle factors. A
total of 3317 children (55?4%) of the original study popu-
lation participated in the 10-year follow-up. Loss to follow-
up was associated with a lower level of parental education,
a negative history of parental atopy, the absence of atopic
diseases in the child during the first 2 years of life and
residency in Wesel; the presence of older siblings was not
associated with discontinuation of the study.
The LISAplus study is a population-based birth cohort
investigating ‘influences of lifestyle-related factors on
the immune system and the development of allergies in
childhood’. Details on study design are described else-
where(12,13). In brief, between November 1997 and January
1999, a total of 3097 newborns were initially recruited
from four German cities: Munich, Leipzig, Wesel and Bad
Honnef. Questionnaires on family history of atopy, par-
ental education and other lifestyle factors were completed
by parents shortly after delivery. Data on the child’s health
were collected by repeated parental-completed ques-
tionnaires at regular time intervals during the first 10 years
(0?5, 1, 1?5, 2, 4, 6 and 10 years of age). Since the 6-year
follow-up, the influences of traffic emission and genetics
on allergy development have become the focus of the
study. A total of 1761 children (56?9%) of the original study
population participated in the 10-year follow-up. Loss to
follow-up was strongly associated with a lower level of
parental education and residency in Wesel or Leipzig,
whereas the absence of older siblings, a negative history of
parental atopy and absence of atopic diseases in the child
during the first 2 years of life showed a weak association
with discontinuation of the study.
In the 10-year follow-up of both studies, an FFQ was
sent to all parents of children who completed the main
questionnaire in advance and who indicated a willingness
to participate in the dietary assessment. Since the FFQ
was provided subsequent to the main questionnaire and
only one written reminder was sent, the participation rate
in the FFQ was overall 67?9 %, based on participation in
the 10-year main questionnaire. Subjects were excluded
because of excessive missing information in the FFQ (n 6)
or because of implausible energy intake (n 6). Thus, the
SPublic
Hea
lth
Nutr
itio
n
2 S Sausenthaler et al.

present analysis is based on 3435 subjects from GINIplus
(n 2190) and LISAplus (n 1245).
For both studies, approval from the local ethics com-
mittees (Bavarian General Medical Council, University of
Leipzig, Medical Council of North-Rhine-Westphalia) and
written consent from participant’s families were obtained.
FFQ
The FFQ administered to parents was designed to measure
children’s usual food and nutrient intake over the past year,
and more specifically to estimate energy, fatty acid and
antioxidant intake at 10 years of age. The development
including the selection process of the food item list and
validation of the FFQ has been described previously(14).
The FFQ comprised a list of eighty-two food items
accompanied by several questions about the preferred fat
and energy content of products, preparation methods,
diets and food preferences, buying habits and dietary
supplement use. To estimate how often food was con-
sumed by their child on average over the previous year,
parents were asked to choose one of nine frequency
categories, ranging from ‘never’ to ‘four times a day or
more’. In addition, common portion sizes were assigned
for each food item to enable an estimation of quantities.
For food items that are difficult to describe in common
household measures, coloured photographs from the
EPIC (European Prospective Investigation into Cancer
and Nutrition) study showing three different portion sizes
were included(15). The consumption frequencies and
portion size estimates were converted into average con-
sumption in g/d and this information was linked to the
German Food Code and Nutrient Database (BLS) version
II?3?1(16). Where food portions were not illustrated by
pictures, portion size data were obtained from a German
list of portion sizes, and weighting of single foods of
one FFQ item was carried out according to information
obtained from the DONALD (Dortmund Nutritional and
Anthropometric Longitudinally Designed) Study(17) in
order to represent the common consumption frequencies
among the children’s age group. This has been described
in more detail by Stiegler et al.(14). Missing categorical and
continuous variables were replaced by median and mean
frequencies of consumption, respectively, obtained from
the remaining study population.
For food items rich in fat, such as butter, margarine,
sausages and dairy products, additional questions on the
fat content that subjects usually choose were asked and
answers were applied to the relevant items on the list.
Likewise, the energy content of beverages such as soft
drinks and fruit drinks was considered.
Summation questions as introduced by Block et al.(18)
about the average consumption frequencies (per day or
per week) of the food groups bread, fruit, vegetables and
beverages were included at the end of the FFQ as general
consumption frequencies have been assumed to be more
valid than the sum of single frequencies(19). They permit
the adjustment of food consumption to reduce the over-
estimation resulting from the use of a long food item list
while retaining the reported distribution of these foods. If
the sum of the single food items was different from the
overall estimate, individual correction factors were calcu-
lated by dividing the food group intake obtained by the
summation question by the sum of intakes from the single
food items belonging to this food group. Daily food intake
was then multiplied by individual correction factors.
Questions on regular dietary vitamin and mineral sup-
plement use were included at the end of the FFQ. The list
of possible answers included ‘multivitamins’, ‘vitamin C’,
‘vitamin E’, ‘vitamin B’, ‘b-carotene’, ‘Ca’, ‘Mg’, ‘fluorine’ and
‘others’, allowing to specify other supplements regularly
used by the participant. For the purpose of nutrient calcu-
lation, this information was linked to the supplement data-
base of the DONALD Study, which contains detailed data on
all supplement products ever recorded in the study’s 3d
weighted dietary records(17). However, as the contribution
of vitamin intake by supplements was not significant and as
we had only rough information about the dosage and fre-
quency of supplement use, we abstained from including
vitamin intake from supplements for our analyses. Fatty acid
intake by supplementation such as fish oil could anyway
not be considered because this was not recorded in the
DONALD supplement database.
Socio-economic status: parental education
and household income
Parental education was determined on the basis of ques-
tionnaire-derived information about school education
according to the German educational system, and was
defined by the highest grade completed by either the
mother or the father. Thus, children were assigned to the
group of low (less than tenth grade), medium (tenth grade)
or high (more than tenth grade) parental education.
Net household income per month was reported in the 10-
year questionnaire using a 9-point scale ranging from
,h500 to .h3500. The calculation of equivalent income
according to the OECD (Organisation for Economic Coop-
eration and Development) guidelines(20) was carried out by
dividing the net household income by an equivalence fac-
tor, which gives a weight of 1?0 to the first adult, 0?5 to all
other adults and children .14 years, and 0?3 to all children
up to 14 years. As income was measured categorically, we
took the mid-point of each income class to calculate the
income level. For the lowest income level (,h500) we
calculated two-thirds (h333) of this limit, and for the highest
income level (.h3500) four-thirds (h4667), as described
before(21). Finally, the new variable was collapsed into three
groups of low, medium and high household income. To
enable comparing parental education with household
income, a similar class size for both variables was needed.
Therefore, the classification was based on quintiles so that
the percentage of subjects in each group of household
income equals the percentage of children in the respective
SPublic
Hea
lth
Nutr
itio
n
Socio-economic determinants of children’s diet 3
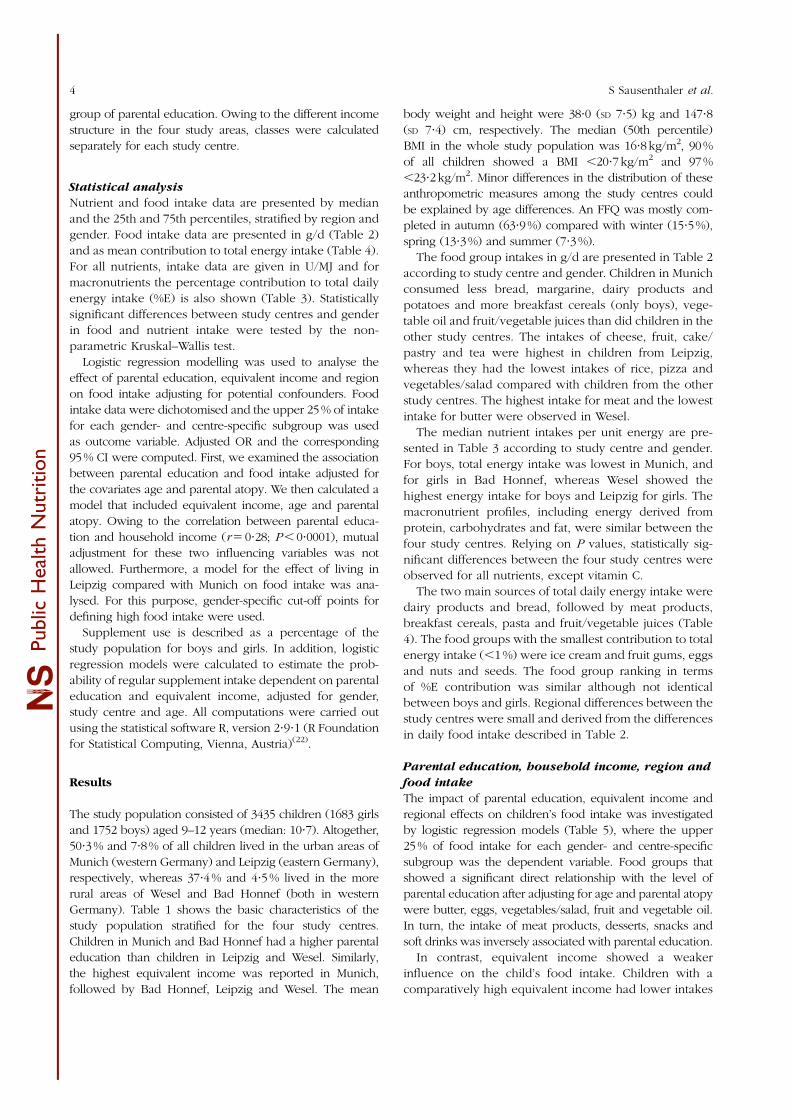
group of parental education. Owing to the different income
structure in the four study areas, classes were calculated
separately for each study centre.
Statistical analysis
Nutrient and food intake data are presented by median
and the 25th and 75th percentiles, stratified by region and
gender. Food intake data are presented in g/d (Table 2)
and as mean contribution to total energy intake (Table 4).
For all nutrients, intake data are given in U/MJ and for
macronutrients the percentage contribution to total daily
energy intake (%E) is also shown (Table 3). Statistically
significant differences between study centres and gender
in food and nutrient intake were tested by the non-
parametric Kruskal–Wallis test.
Logistic regression modelling was used to analyse the
effect of parental education, equivalent income and region
on food intake adjusting for potential confounders. Food
intake data were dichotomised and the upper 25% of intake
for each gender- and centre-specific subgroup was used
as outcome variable. Adjusted OR and the corresponding
95% CI were computed. First, we examined the association
between parental education and food intake adjusted for
the covariates age and parental atopy. We then calculated a
model that included equivalent income, age and parental
atopy. Owing to the correlation between parental educa-
tion and household income (r 5 0?28; P , 0?0001), mutual
adjustment for these two influencing variables was not
allowed. Furthermore, a model for the effect of living in
Leipzig compared with Munich on food intake was ana-
lysed. For this purpose, gender-specific cut-off points for
defining high food intake were used.
Supplement use is described as a percentage of the
study population for boys and girls. In addition, logistic
regression models were calculated to estimate the prob-
ability of regular supplement intake dependent on parental
education and equivalent income, adjusted for gender,
study centre and age. All computations were carried out
using the statistical software R, version 2?9?1 (R Foundation
for Statistical Computing, Vienna, Austria)(22).
Results
The study population consisted of 3435 children (1683 girls
and 1752 boys) aged 9–12 years (median: 10?7). Altogether,
50?3% and 7?8% of all children lived in the urban areas of
Munich (western Germany) and Leipzig (eastern Germany),
respectively, whereas 37?4% and 4?5% lived in the more
rural areas of Wesel and Bad Honnef (both in western
Germany). Table 1 shows the basic characteristics of the
study population stratified for the four study centres.
Children in Munich and Bad Honnef had a higher parental
education than children in Leipzig and Wesel. Similarly,
the highest equivalent income was reported in Munich,
followed by Bad Honnef, Leipzig and Wesel. The mean
body weight and height were 38?0 (SD 7?5) kg and 147?8
(SD 7?4) cm, respectively. The median (50th percentile)
BMI in the whole study population was 16?8kg/m2, 90%
of all children showed a BMI ,20?7kg/m2 and 97%
,23?2kg/m2. Minor differences in the distribution of these
anthropometric measures among the study centres could
be explained by age differences. An FFQ was mostly com-
pleted in autumn (63?9%) compared with winter (15?5%),
spring (13?3%) and summer (7?3%).
The food group intakes in g/d are presented in Table 2
according to study centre and gender. Children in Munich
consumed less bread, margarine, dairy products and
potatoes and more breakfast cereals (only boys), vege-
table oil and fruit/vegetable juices than did children in the
other study centres. The intakes of cheese, fruit, cake/
pastry and tea were highest in children from Leipzig,
whereas they had the lowest intakes of rice, pizza and
vegetables/salad compared with children from the other
study centres. The highest intake for meat and the lowest
intake for butter were observed in Wesel.
The median nutrient intakes per unit energy are pre-
sented in Table 3 according to study centre and gender.
For boys, total energy intake was lowest in Munich, and
for girls in Bad Honnef, whereas Wesel showed the
highest energy intake for boys and Leipzig for girls. The
macronutrient profiles, including energy derived from
protein, carbohydrates and fat, were similar between the
four study centres. Relying on P values, statistically sig-
nificant differences between the four study centres were
observed for all nutrients, except vitamin C.
The two main sources of total daily energy intake were
dairy products and bread, followed by meat products,
breakfast cereals, pasta and fruit/vegetable juices (Table
4). The food groups with the smallest contribution to total
energy intake (,1 %) were ice cream and fruit gums, eggs
and nuts and seeds. The food group ranking in terms
of %E contribution was similar although not identical
between boys and girls. Regional differences between the
study centres were small and derived from the differences
in daily food intake described in Table 2.
Parental education, household income, region and
food intake
The impact of parental education, equivalent income and
regional effects on children’s food intake was investigated
by logistic regression models (Table 5), where the upper
25% of food intake for each gender- and centre-specific
subgroup was the dependent variable. Food groups that
showed a significant direct relationship with the level of
parental education after adjusting for age and parental atopy
were butter, eggs, vegetables/salad, fruit and vegetable oil.
In turn, the intake of meat products, desserts, snacks and
soft drinks was inversely associated with parental education.
In contrast, equivalent income showed a weaker
influence on the child’s food intake. Children with a
comparatively high equivalent income had lower intakes
SPublic
Hea
lth
Nutr
itio
n
4 S Sausenthaler et al.
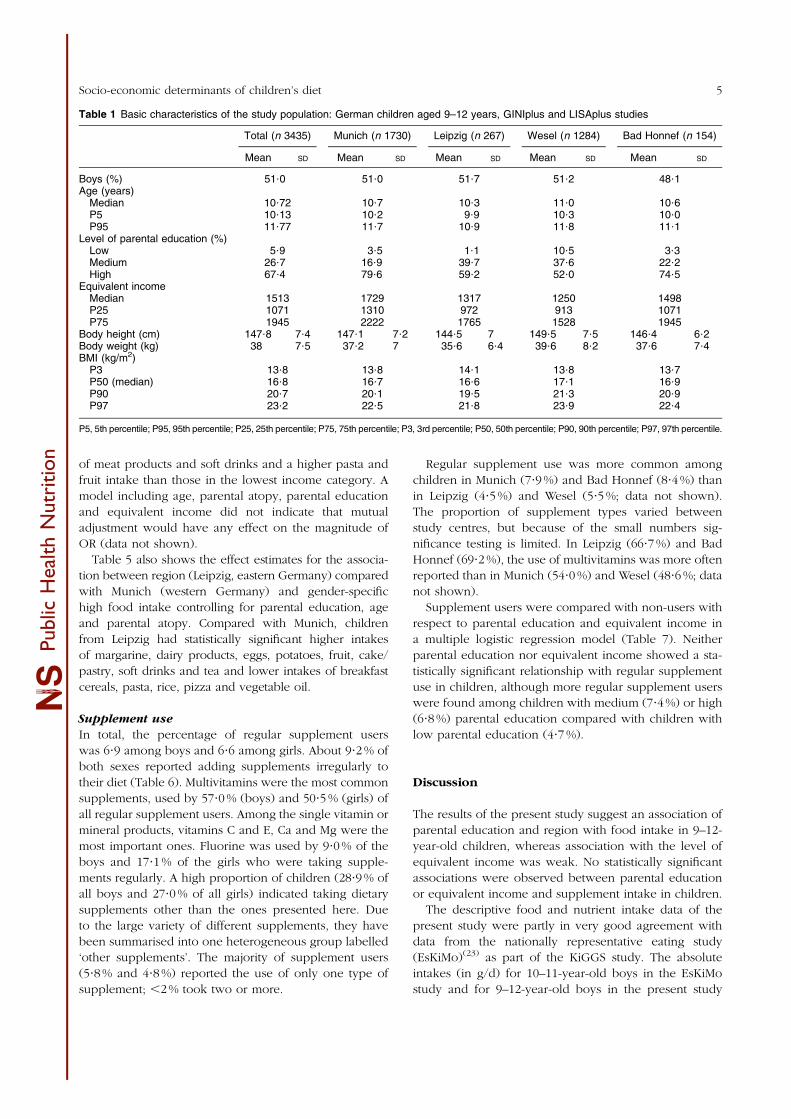
of meat products and soft drinks and a higher pasta and
fruit intake than those in the lowest income category. A
model including age, parental atopy, parental education
and equivalent income did not indicate that mutual
adjustment would have any effect on the magnitude of
OR (data not shown).
Table 5 also shows the effect estimates for the associa-
tion between region (Leipzig, eastern Germany) compared
with Munich (western Germany) and gender-specific
high food intake controlling for parental education, age
and parental atopy. Compared with Munich, children
from Leipzig had statistically significant higher intakes
of margarine, dairy products, eggs, potatoes, fruit, cake/
pastry, soft drinks and tea and lower intakes of breakfast
cereals, pasta, rice, pizza and vegetable oil.
Supplement use
In total, the percentage of regular supplement users
was 6?9 among boys and 6?6 among girls. About 9?2 % of
both sexes reported adding supplements irregularly to
their diet (Table 6). Multivitamins were the most common
supplements, used by 57?0 % (boys) and 50?5 % (girls) of
all regular supplement users. Among the single vitamin or
mineral products, vitamins C and E, Ca and Mg were the
most important ones. Fluorine was used by 9?0 % of the
boys and 17?1 % of the girls who were taking supple-
ments regularly. A high proportion of children (28?9 % of
all boys and 27?0 % of all girls) indicated taking dietary
supplements other than the ones presented here. Due
to the large variety of different supplements, they have
been summarised into one heterogeneous group labelled
‘other supplements’. The majority of supplement users
(5?8 % and 4?8 %) reported the use of only one type of
supplement; ,2 % took two or more.
Regular supplement use was more common among
children in Munich (7?9 %) and Bad Honnef (8?4 %) than
in Leipzig (4?5 %) and Wesel (5?5 %; data not shown).
The proportion of supplement types varied between
study centres, but because of the small numbers sig-
nificance testing is limited. In Leipzig (66?7 %) and Bad
Honnef (69?2 %), the use of multivitamins was more often
reported than in Munich (54?0 %) and Wesel (48?6 %; data
not shown).
Supplement users were compared with non-users with
respect to parental education and equivalent income in
a multiple logistic regression model (Table 7). Neither
parental education nor equivalent income showed a sta-
tistically significant relationship with regular supplement
use in children, although more regular supplement users
were found among children with medium (7?4 %) or high
(6?8 %) parental education compared with children with
low parental education (4?7 %).
Discussion
The results of the present study suggest an association of
parental education and region with food intake in 9–12-
year-old children, whereas association with the level of
equivalent income was weak. No statistically significant
associations were observed between parental education
or equivalent income and supplement intake in children.
The descriptive food and nutrient intake data of the
present study were partly in very good agreement with
data from the nationally representative eating study
(EsKiMo)(23) as part of the KiGGS study. The absolute
intakes (in g/d) for 10–11-year-old boys in the EsKiMo
study and for 9–12-year-old boys in the present study
SPublic
Hea
lth
Nutr
itio
n
Table 1 Basic characteristics of the study population: German children aged 9–12 years, GINIplus and LISAplus studies
Total (n 3435) Munich (n 1730) Leipzig (n 267) Wesel (n 1284) Bad Honnef (n 154)
Mean SD Mean SD Mean SD Mean SD Mean SD
Boys (%) 51?0 51?0 51?7 51?2 48?1Age (years)
Median 10?72 10?7 10?3 11?0 10?6P5 10?13 10?2 9?9 10?3 10?0P95 11?77 11?7 10?9 11?8 11?1
Level of parental education (%)Low 5?9 3?5 1?1 10?5 3?3Medium 26?7 16?9 39?7 37?6 22?2High 67?4 79?6 59?2 52?0 74?5
Equivalent incomeMedian 1513 1729 1317 1250 1498P25 1071 1310 972 913 1071P75 1945 2222 1765 1528 1945
Body height (cm) 147?8 7?4 147?1 7?2 144?5 7 149?5 7?5 146?4 6?2Body weight (kg) 38 7?5 37?2 7 35?6 6?4 39?6 8?2 37?6 7?4BMI (kg/m2)
P3 13?8 13?8 14?1 13?8 13?7P50 (median) 16?8 16?7 16?6 17?1 16?9P90 20?7 20?1 19?5 21?3 20?9P97 23?2 22?5 21?8 23?9 22?4
P5, 5th percentile; P95, 95th percentile; P25, 25th percentile; P75, 75th percentile; P3, 3rd percentile; P50, 50th percentile; P90, 90th percentile; P97, 97th percentile.
Socio-economic determinants of children’s diet 5

were very similar for the food groups bread (105 g and
115 g), cheese (17 g and 15 g), eggs (9 g and 8 g), potatoes
(53 g and 51 g), pasta (37 g and 38 g) and fruit (112 g and
110 g). In contrast, the reported intakes of meat (52 g and
25 g), breakfast cereals (25 g and 9 g), dairy products
(341 g and 244 g) and fruit/vegetable juice (368 g and
193 g) derived from our FFQ were much higher than the
corresponding EsKiMo intake data and may have even
overestimated the true intakes. However, absolute intake
data are in general hardly comparable because of differ-
ent food group definitions and aggregation levels. In any
case, the main sources of total daily energy intake in our
study population were comparable to those reported by
the EsKiMo study. Dairy products (15?5 % and 11 %),
bread (13?8 % and 14 %), fruit/vegetable juices (5?7 % and
7 %) and cake/pastry (5?0 % and 7 %) were ranked among
the first eight food groups in both studies, where the first
value given in brackets corresponds to all boys of the
SPublic
Hea
lth
Nutr
itio
n
Table 2 Median intake of food groups per day in the study population by gender and region
Total (n 3435) Munich (n 1730) Leipzig (n 267) Wesel (n 1284) Bad Honnef (n 154)
Food group (g/d) Gender Mean P25 P75 Mean P25 P75 Mean P25 P75 Mean P25 P75 Mean P25 P75 P value*
Bread Boys 115 82 158 104 77 146 124 93 180 134 92 216 124 92 205 ,0?0001Girls 103 76 141 98 72 137 127 96 170 118 76 176 125 82 162 ,0?0001
Butter Boys 2 0 8 4 1 10 2 1 6 0 0 3 3 0 9 ,0?0001Girls 2 0 6 4 1 10 4 1 10 0 0 2 2 0 5 ,0?0001
Margarine Boys 1 0 5 0 0 2 3 0 9 4 1 10 1 0 4 ,0?0001Girls 1 0 5 0 0 1 3 0 10 3 1 9 3 1 6 ,0?0001
Cheese Boys 15 6 35 17 7 36 21 8 38 13 4 33 12 4 23 ,0?0001Girls 16 6 33 17 7 34 23 12 40 13 5 29 22 8 40 ,0?0001
Meat Boys 52 33 81 45 30 70 46 33 70 64 43 91 47 32 79 ,0?0001Girls 43 28 64 35 24 55 44 28 61 54 35 79 45 32 65 ,0?0001
Meat products Boys 49 29 75 47 29 73 49 30 73 51 30 82 46 27 74 0?0492Girls 38 22 59 38 20 57 44 26 60 38 22 63 33 25 52 0?0841
Breakfast cereals Boys 25 8 54 36 11 54 27 9 50 18 7 49 19 9 51 ,0?0001Girls 19 7 40 21 8 50 20 8 36 18 6 37 22 7 43 0?0074
Dairy products Boys 341 210 580 294 190 464 358 219 571 449 243 740 335 175 577 ,0?0001Girls 263 153 427 246 134 369 302 176 471 307 166 521 272 147 397 ,0?0001
Eggs Boys 8 5 16 8 5 16 8 8 16 8 5 16 8 5 19 0?0150Girls 8 5 9 8 5 8 8 5 14 8 5 10 8 5 8 0?5300
Potatoes Boys 51 29 83 38 23 65 64 41 87 73 46 110 65 43 83 ,0?0001Girls 46 28 73 32 21 63 52 41 77 63 43 98 63 37 83 ,0?0001
Pasta Boys 38 18 61 38 24 61 38 18 38 38 15 38 38 18 55 ,0?0001Girls 38 18 61 38 24 61 38 15 38 38 15 38 38 18 61 ,0?0001
Rice Boys 13 7 19 13 7 22 8 7 13 13 7 18 10 6 13 0?0123Girls 13 7 13 13 7 18 8 4 13 13 7 13 13 7 13 0?0060
Pizza Boys 28 13 33 28 16 47 13 11 28 28 13 33 28 11 33 ,0?0001Girls 28 11 28 28 13 33 11 6 28 28 11 28 28 11 28 ,0?0001
Fish Boys 17 10 28 17 10 28 19 11 28 17 10 28 18 10 31 0?2765Girls 14 7 24 16 7 25 17 10 26 12 7 22 12 7 23 0?0214
Vegetablesand salad
Boys 104 65 157 111 69 167 54 24 91 100 62 145 119 79 171 ,0?0001
Girls 115 72 171 123 78 177 54 34 102 106 70 160 109 63 161 ,0?0001Fruit Boys 110 66 159 110 65 156 131 77 232 108 66 154 110 69 161 ,0?0001
Girls 114 79 162 115 83 162 137 93 234 111 67 157 113 67 156 ,0?0001Cake and pastry Boys 24 15 38 23 15 37 30 19 49 24 15 38 22 13 34 0?0005
Girls 23 15 37 23 14 35 28 19 53 23 15 38 23 15 32 0?0010Desserts Boys 10 3 18 10 3 17 10 8 18 10 4 18 8 3 18 ,0?0001
Girls 8 3 14 8 3 14 8 4 14 8 3 16 8 4 14 0?0296Chocolate Boys 11 6 23 10 5 23 12 7 19 12 7 23 10 4 23 0?0653
Girls 10 5 19 9 4 18 9 5 19 10 5 19 10 6 18 0?0871Ice cream and
fruit gumsBoys 7 4 12 7 4 12 7 3 16 7 4 12 8 4 15 0?5502
Girls 6 4 11 6 3 11 8 4 14 6 4 11 7 4 12 0?1968Snacks Boys 4 1 7 2 1 4 4 2 6 4 2 7 2 1 7 ,0?0001
Girls 2 1 6 2 1 4 2 1 4 4 2 7 2 1 4 ,0?0001Nuts and seeds Boys 1 0 3 1 0 3 1 0 2 1 0 2 1 0 3 0?4357
Girls 1 0 2 1 0 2 1 0 2 1 0 2 1 0 4 0?0670Vegetable oil Boys 2 1 5 3 2 6 1 1 2 2 1 4 2 1 4 ,0?0001
Girls 2 1 4 3 2 5 1 1 3 2 1 3 2 1 5 ,0?0001Fruit/vegetable
juiceBoys 368 132 714 429 145 744 313 133 665 328 124 683 248 85 624 0?0184
Girls 331 115 630 367 120 656 363 128 640 283 99 584 313 114 623 0?0478Soft drinks Boys 34 13 120 31 12 94 36 10 132 42 15 162 30 10 83 0?0008
Girls 22 8 65 18 7 48 27 8 78 28 10 94 24 7 98 ,0?0001Tea Boys 15 0 79 25 5 104 76 22 276 4 0 25 13 2 53 ,0?0001
Girls 24 4 99 34 7 123 90 24 249 11 0 51 21 0 104 ,0?0001
P25, 25th percentile; P75, 75th percentile.*Kruskal–Wallis test.
6 S Sausenthaler et al.

S Public Health Nutrition
Table 3 Median nutrient intakes per unit energy in the study population by gender and region
Total (n 3435) Munich (n 1730) Leipzig (n 267) Wesel (n 1284) Bad Honnef (n 154)
Nutrient Gender Mean P25 P75 Mean P25 P75 Mean P25 P75 Mean P25 P75 Mean P25 P75 P value*
Energy (kJ) Boys 8971 7349 11 016 8658 7077 10 499 8855 7388 10 991 9472 7707 11 681 8947 7226 10 908 0?0000Girls 7708 6295 9352 7604 6250 8991 8261 6519 9948 7854 6334 9698 7432 6261 9557 0?0033
Energy (kcal) Boys 2143 1756 2631 2069 1691 2508 2116 1765 2626 2262 1841 2791 2139 1727 2606 ,0?0001Girls 1840 1503 2234 1816 1493 2147 1973 1557 2373 1874 1512 2316 1775 1496 2281 0?0034
Protein (%E) Boys 14 11 18 14 12 18 14 12 17 15 11 19 14 12 18 ,0?0001Girls 14 11 18 14 11 17 14 11 17 15 12 19 15 12 20 ,0?0001
Carbohydrates (%E) Boys 54 44 67 55 44 67 56 45 68 54 43 67 57 42 65 ,0?0001Girls 55 44 68 54 44 66 54 42 68 54 44 68 58 46 72 0?0093
Total fat (%E) Boys 29 22 37 29 23 37 28 22 36 29 23 38 29 21 37 ,0?0001Girls 29 22 36 29 22 36 29 23 36 28 23 36 29 24 40 0?0406
SFA (mg/MJ) Boys 3237 2433 4268 3212 2445 4170 3265 2494 4114 3264 2457 4359 3123 2228 4499 0?0000Girls 3163 2425 4080 3138 2388 4098 3324 2536 4015 3146 2401 3955 3237 2493 4316 0?0202
MUFA (mg/MJ) Boys 2707 2068 3519 2754 2094 3587 2617 2190 3239 2707 2049 3582 2767 2024 3323 0?0013Girls 2645 2025 3391 2634 2016 3409 2663 2087 3232 2600 2021 3374 2679 2149 3374 0?1191
PUFA (mg/MJ) Boys 1130 866 1458 1126 863 1455 1073 861 1268 1150 889 1440 1065 865 1387 ,0?0001Girls 1140 882 1439 1106 848 1391 1048 813 1327 1183 904 1492 1172 985 1516 ,0?0001
Linoleic acid (n-6; mg/MJ) Boys 955 729 1233 959 726 1235 908 707 1085 974 744 1249 905 705 1165 ,0?0001Girls 960 741 1230 939 714 1185 872 679 1097 1005 766 1287 981 834 1267 ,0?0001
Arachidonic acid (n-6; mg/MJ) Boys 21 15 28 20 14 27 19 14 24 22 16 31 21 16 31 ,0?0001Girls 20 15 28 19 13 26 19 13 24 22 17 32 22 17 30 ,0?0001
EPA (n-3; mg/MJ) Boys 3767 2038 6845 3713 2014 6895 4454 2674 8068 3603 2054 6431 3817 1909 7358 0?0284Girls 3498 1898 6904 3695 1946 7487 4124 2210 8338 3301 1782 5802 3052 1913 6730 0?0151
DPA (n-3; mg/MJ) Boys 1262 720 2010 1195 676 1939 1491 827 2127 1259 741 2076 1303 766 1853 0?0022Girls 1212 691 2068 1199 660 2058 1373 797 2352 1218 703 1993 1068 727 2236 0?1037
Vitamin A (mg/MJ) Boys 114 75 172 117 77 176 117 77 178 108 72 166 122 88 171 0?6453Girls 121 86 183 128 89 188 117 82 195 112 82 169 126 89 203 0?0098
Vitamin E (mg/MJ) Boys 999 781 1311 1042 802 1374 942 724 1205 959 763 1259 961 835 1207 0?0166Girls 1077 835 1382 1092 850 1408 1007 751 1211 1053 820 1352 1183 904 1488 0?3731
Vitamin C (mg/MJ) Boys 10 7 14 10 7 14 10 6 14 10 7 13 10 7 14 0?2121Girls 11 8 15 11 8 15 10 8 15 11 8 16 12 8 16 0?9318
P25, 25th percentile; P75, 75th percentile.*Kruskal–Wallis test.
Socio
-eco
nom
icdete
rmin
ants
ofch
ildre
n’s
die
t7

present study population and the second value to 6–11-
year-old boys of the EsKiMo study. This general good
agreement was also reflected on the nutrient level, as
intakes of the macronutrients fat, protein and carbohy-
drates as well as vitamins E and C corresponded to the
values reported by the EsKiMo study. Only total energy
intake in boys (8971 kJ (2143kcal) and 7586kJ (1813kcal))
seemed to be overestimated in the present study.
For children, the KiGGS study suggests no persisting
dietary differences in intakes between children from
eastern and western Germany(24), which is in contrast to
our findings. We compared food group intakes between
metropolitan areas such as Leipzig in the east and Munich
in the west of Germany and observed some significant
differences for the food groups margarine, dairy products,
eggs, potatoes, fruit, cake/pastry, soft drinks, tea, breakfast
cereals, pasta, rice, pizza and vegetable oil. The study
centres Wesel and Bad Honnef have been excluded
from the analysis although they are located in the west
of Germany. Owing to the heterogeneity of the three
western study centres, rural/urban and north/west differ-
ences would be implied in the east/west comparison.
Certainly, the different socio-economic structures of the
two study centres might have contributed to the observed
regional effects as, for example, parents in Munich (79?6%)
more likely had a high educational level than in Leipzig
(59?2%; see Table 1). Thus, the correlation between
parental education and region (r 5 0?17; P , 0?0001) might
have led to residual confounding even after controlling for
parental education. As this could also affect the association
between parental education and food intake, we calcu-
lated gender- and centre-specific cut-off points for defining
high food intake for analysing the association with parental
education to minimise the described effect.
Comparing present findings with other studies is difficult
because various measures for socio-economic position
have been used, including education, income or occupa-
tion, which have been shown not to serve as adequate
proxies for one another(25). According to the findings of
the present study, the intakes of butter, eggs, vegetables/
salad, fruit, vegetable oil, meat products, desserts, snacks
and soft drinks in children varied by level of parental
education. Our findings are thus in line with probably the
most consistent evidence of dietary inequalities in adults,
showing a lower consumption of fruit and vegetables
among socio-economically disadvantaged groups(4). This
has also been reported by a study carried out in German
schoolchildren, a part of WHO’s cross-sectional survey
HBSC (Health Behaviour in School-Aged Children)(26),
showing that the impact of the social situation was parti-
cularly strong for healthy foods, such as raw vegetables,
fruit and wholegrain wheat bread. A Finnish study in
children aged 9–15 years also reported that children of
families with higher socio-economic status used more fruit
than did children of families with lower socio-economic
status, where family’s socio-economic status was defined
according to the father’s educational level, his occupation
and family income(27). Contrary to our findings, they
reported that high socio-economic status was associated
with a higher margarine intake, whereas children of low
SPublic
Hea
lth
Nutr
itio
n
Table 4 Mean contribution of food groups to total energy intake in boys and girls
Boys (n 1752) Girls (n 1683)
Food groupMean contribution to
total energy intake (%) Food groupMean contribution to
total energy intake (%)
Dairy products 15?5 Bread 14?3Bread 13?8 Dairy products 13?6Meat products 8?7 Meat products 7?7Breakfast cereals 6?6 Pasta 7?2Pasta 6?4 Fruit/vegetable juices 6?1Fruit/vegetable juices 5?7 Breakfast cereals 5?8Meat 5?5 Cake and pastry 5?5Cake and pastry 5?0 Meat 5?3Chocolate 3?9 Fruit 4?5Fruit 3?5 Chocolate 3?9Cheese 3?0 Cheese 3?3Soft drinks 3?0 Butter 2?9Butter 2?9 Rice 2?8Potatoes 2?5 Potatoes 2?6Rice 2?4 Soft drinks 2?3Vegetable oil 1?7 Vegetable oil 1?8Pizza 1?6 Vegetables, salad 1?7Fish 1?4 Pizza 1?5Vegetables and salad 1?3 Fish 1?4Margarine 1?2 Margarine 1?3Desserts 1?2 Desserts 1?1Snacks 1?2 Snacks 1?1Ice cream and fruit gums 0?8 Ice cream and fruit gums 0?8Eggs 0?7 Eggs 0?7Nuts and seeds 0?7 Nuts and seeds 0?7
8 S Sausenthaler et al.

S Public Health Nutrition
Table 5 Results of logistic regression models of parental education, equivalent income and region on children’s food intake (defined as the upper 25 % of each gender- and center-specificsubgroups)
Parental education Equivalent income Region
Medium v. low (n 888) High v. low (n 2236) Medium v. low (n 699) High v. low (n 2401) Leipzig v. Munich (n 267)
Food group (g/d) aOR* 95 % CI aOR* 95 % CI aOR* 95 % CI aOR* 95 % CI aOR- 95 % CI
Bread 0?89 0?61, 1?29 1?16 0?82, 1?65 0?68 0?48, 0?95 0?90 0?66, 1?22 1?05 0?75, 1?48Butter 1?11 0?73, 1?67 1?88 1?28, 2?78 1?06 0?74, 1?54 1?37 0?98, 1?92 0?99 0?70, 1?40Margarine 1?09 0?77, 1?54 0?79 0?57, 1?09 0?95 0?68, 1?32 0?79 0?58, 1?07 3?89 2?85, 5?32Cheese 0?95 0?66, 1?37 1?12 0?80, 1?58 0?76 0?54, 1?05 0?79 0?58, 1?06 1?19 0?85, 1?65Meat 1?10 0?78, 1?57 0?81 0?58, 1?14 1?04 0?74, 1?46 0?95 0?70, 1?30 1?15 0?82, 1?60Meat products 0?78 0?55, 1?10 0?64 0?46, 0?88 0?82 0?59, 1?14 0?68 0?50, 0?92 1?03 0?74, 1?44Breakfast cereals 1?34 0?91, 1?96 1?43 0?99, 2?07 0?84 0?60, 1?17 0?87 0?64, 1?18 0?64 0?45, 0?92Dairy products 1?06 0?74, 1?50 0?85 0?61, 1?18 0?82 0?59, 1?14 0?78 0?58, 1?05 1?81 1?31, 2?48Eggs 1?39 0?94, 2?04 1?45 1?01, 2?09 1?17 0?83, 1?65 1?02 0?74, 1?39 1?39 1?00, 1?92Potatoes 0?92 0?65, 1?31 0?89 0?64, 1?25 0?87 0?63, 1?21 0?74 0?55, 1?00 2?23 1?63, 3?05Pasta 1?09 0?79, 1?50 1?25 0?92, 1?69 1?07 0?78, 1?46 1?36 1?02, 1?81 0?42 0?29, 0?59Rice 1?11 0?80, 1?56 1?09 0?80, 1?50 1?23 0?88, 1?72 1?25 0?92, 1?70 0?60 0?43, 0?83Pizza 0?85 0?61, 1?17 0?77 0?57, 1?05 1?05 0?76, 1?45 0?99 0?74, 1?33 0?27 0?18, 0?41Fish 0?83 0?58, 1?18 0?85 0?61, 1?19 1?00 0?71, 1?40 0?93 0?68, 1?27 1?08 0?77, 1?50Vegetables and salad 1?43 0?95, 2?14 1?70 1?16, 2?51 1?07 0?75, 1?52 1?08 0?78, 1?49 0?73 0?51, 1?05Fruit 1?99 1?27, 3?10 2?44 1?60, 3?74 1?16 0?80, 1?68 1?44 1?03, 2?02 2?32 1?69, 3?18Cake and pastry 1?16 0?80, 1?68 1?10 0?77, 1?56 0?85 0?61, 1?19 0?78 0?58, 1?06 1?94 1?42, 2?66Desserts 0?66 0?48, 0?91 0?53 0?39, 0?73 0?88 0?64, 1?22 0?89 0?66, 1?19 1?15 0?84, 1?58Chocolate 0?88 0?63, 1?24 0?73 0?53, 1?01 1?00 0?71, 1?41 0?95 0?70, 1?29 0?86 0?61, 1?21Ice cream and fruit gums 1?01 0?71, 1?43 0?83 0?60, 1?17 1?17 0?84, 1?64 0?86 0?63, 1?17 1?18 0?85, 1?63Snacks 1?07 0?78, 1?48 0?73 0?54, 0?99 0?95 0?70, 1?29 0?77 0?58, 1?03 1?19 0?88, 1?62Nuts and seeds 1?14 0?79, 1?64 1?14 0?81, 1?61 1?04 0?74, 1?45 0?88 0?65, 1?19 0?78 0?55, 1?11Vegetable oil 1?28 0?86, 1?92 1?68 1?15, 2?45 1?24 0?86, 1?80 1?37 0?98, 1?92 0?20 0?12, 0?34Fruit/vegetable juice 1?06 0?74, 1?52 1?00 0?71, 1?40 1?25 0?87, 1?78 1?16 0?84, 1?61 0?84 0?60, 1?19Soft drinks 0?67 0?49, 0?93 0?44 0?32, 0?59 0?81 0?59, 1?12 0?63 0?47, 0?84 1?44 1?04, 2?00Tea 1?03 0?71, 1?49 1?14 0?80, 1?61 0?78 0?55, 1?09 0?82 0?60, 1?10 2?55 1?86, 3?49
aOR, adjusted OR.Low parental education, low family income and the study centre in Munich formed the reference category.*OR adjusted for age and parental atopy; centre- and gender-specific cut-off points were used to define high intake (upper 25 %).-OR adjusted for parental education, age and parental atopy; gender-specific cut-off points were used to define high intake (upper 25 %)
Socio
-eco
nom
icdete
rmin
ants
ofch
ildre
n’s
die
t9

socio-economic status had a higher intake of butter.
However, although the parental education level was
lower in Leipzig compared with Munich, fruit intake was
higher in this eastern German city. This result strongly
points to the additional impact of further influencing
factors on food intake.
Another study showed that among several potential
predictors of fruit and vegetable consumption analysed in
pre-school children, maternal education emerged to be
positively associated with children’s vegetable consump-
tion whereas no effect of fruit intake was reported(28).
Although the dependence of healthy food intake, such as
fruit and vegetables, on social class has been studied well,
the situation is less clear for some of the foods for which
significant associations have been described in the pre-
sent study. Within the ALSPAC (Avon Longitudinal Study
of Parents and Children) study(29), a positive association
between maternal education and intake of meat products
and soft drinks was shown in 18-month-old children.
Compared with school age, food choice at this age is
completely under the control of parents, which is why
parental socio-economic position might have a different
effect than later in childhood.
Several possible limitations of the study should be
considered. First, it should be noticed that the present
findings are based on a cross-sectional analysis within the
two cohort studies – LISAplus and GINIplus. Even though
study sampling was primarily population-based, the study
population is, as almost every cohort study, subject to
selection bias, and thus the findings are not representative
for Germany. Owing to non-random loss to follow-up,
both cohorts on which the present analysis is based under-
represent children from lower social classes. The true
social inequalities might therefore even be stronger than
reported here. Furthermore, the intakes of a large number
of nutrients and foods were examined, many of which are
correlated with one another. As a result there is the pos-
sibility of type I errors occurring. However, the significant
associations that we have found are either similar to pre-
vious findings or are in line with our previous hypothesis,
which leads us to believe that they are unlikely to be
the result of type I error. Certainly, it has to be considered
that the FFQ was actually not designed to measure, for
example, carbohydrate and protein intakes. However,
since total energy intake as well as the percentage con-
tribution to total daily energy intake of carbohydrates and
protein shows plausible values, we think that this justifies
the analysis of the respective macronutrients. However, it
has to be considered that the food item list included only
those foods that significantly contribute to the intake of
total energy, fatty acids and selected antioxidants.
Unfortunately, we do not have any information on
whether fortified foods were consumed. However,
according to a recent publication(30), the contribution of
fortified foods to total nutrient intake is rather low in
Germany, in particular for vitamins E and A. The authors
further conclude that the base diet is the major con-
tributor to intakes of all nutrients in Europe. When we
included nutrients from supplement intake in our ana-
lyses, the numbers did not change substantially, as the
rather low frequency of regular supplement use in our
study population (,7 %) let assume. However, the rather
SPublic
Hea
lth
Nutr
itio
n Table 6 Prevalence of supplement use in boys and girls
Boys Girls
n % n %
Number of supplements (n 1752) (n 1683)0 1631 93?1 1572 93?41 101 5?8 80 4?8$2 20 1?1 31 1?8
FrequencyRegular supplement use 121 6?9 111 6?6Irregular supplement use 161 9?2 155 9?2
Specification (only regularsupplement user)*
(n 121) (n 111)
Multivitamins 69 57?0 56 50?5Vitamin C 26 21?5 28 25?2Vitamin E 16 13?2 13 11?7Vitamin B 3 2?5 7 6?3b-Carotene 1 0?8 4 3?6Ca 12 9?9 19 17?1Mg 18 14?9 16 14?4Fluorine 11 9?0 19 17?1Zn 12 9?9 13 11?7Iodine 5 4?1 9 8?1Fe 4 3?3 8 7?2Others 35 28?9 30 27?0
*Multiple answers possible.
Table 7 Results of logistic regression models of parental education and equivalent income on children’s supplement use
Parental education Equivalent income
Low (n 193) Medium (n 888) High (n 2236) Low (n 335) Medium (n 699) High (n 2401)
n % n % n % n % n % n %
User v. non-user 9 4?7 66 7?4 153 6?8 25 7?5 47 6?7 160 6?7
aOR* 95 % CI aOR* 95 % CI aOR* 95 % CI aOR* 95 % CI
1?00 1?62 0?83, 3?55 1?48 0?78, 3?18 1?00 0?89 0?54, 1?50 0?88 0?58, 1?40
aOR, adjusted OR.*Adjusted for gender, study centre and age.
10 S Sausenthaler et al.

vague estimation of nutrient intake from supplements
and the missing information on fortified foods could
have led to misclassification of nutrient intake. However,
the statistical models for the association between socio-
economic factors and region on food intake are not
affected by this matter.
One of the major strengths of the present study was the
food selection method underlying the dietary assessment
method as described previously(14). In brief, this newly
developed FFQ was designed for the specific purpose of
measuring diet, especially fatty acid and antioxidant intake,
in school-age children. The food selection method was
based on a regression approach using data from 9–11-year
old children from the German DONALD Study. The FFQ has
been validated against one 24h dietary recall and has shown
good practicability in the past. In summary, even if the FFQ
is generally believed to overestimate dietary intakes(31), we
believe that this FFQ is valid to rank individuals according
to their dietary intakes and to detect differences between
levels of socio-economic status. Furthermore, this is one of
the few studies in children collecting specific information on
dietary supplement use.
In conclusion, we have found that food intake in
school-age children differs by the level of parental edu-
cation and area of living, but the differences cannot be
attributed to healthy or unhealthy dietary habits. This
suggests that particular efforts should be made to adjust
nutrition education programmes to the target population
characterised not only in terms of education but also by
considering regional particularities.
Acknowledgements
The present study has been carried out partially with finan-
cial support from the Commission of the European Com-
munities, within the FP 6 priority 5.4.3.1 Food quality and
safety (Early nutrition programming – long-term follow-up of
efficacy and safety trials and integrated epidemiological,
genetic, animal, consumer and economic research, EARN-
EST, Food-CT-2005-007036). This research was supported by
‘Kompetenznetz Adipositas (Competence Network Obesity)’
and NGFNplus funded by the Federal Ministry of Education
and Research (FKZ: 01GI0826, 01GI0823, 01GS0820). Per-
sonal and financial support by the Munich Center of Health
Sciences (MCHEALTH), which contributed to this research,
is gratefully acknowledged. None of the authors have any
conflict of interest. S.S. and M.S. were responsible for data
analysis, interpretation of data and manuscript preparation
and contributed equally to the manuscript; A.B., P.R., S.K., I.L.
and J.H. assisted in the interpretation of results and critical
revision of the manuscript; C.P.B., B.S., A.v.B., D.B., M.B.,
O.H., I.L., U.K., H.-E.W. and J.H. were responsible for data
collection; S.S., M.S. and J.H. developed the design and
analysis plan of the present study. The authors thank all the
families for their participation.
References
1. Winkler G, Brasche S & Heinrich J (1997) Trends in foodintake in adults from the city of Erfurt before and after theGerman reunification. Ann Nutr Metab 41, 283–290.
2. Mensink GB & Beitz R (2004) Food and nutrient intake inEast and West Germany, 8 years after the reunification –The German Nutrition Survey 1998. Eur J Clin Nutr 58,1000–1010.
3. Giskes K, Turrell G, van Lenthe FJ et al. (2006) A multilevelstudy of socio-economic inequalities in food choicebehaviour and dietary intake among the Dutch population:the GLOBE study. Public Health Nutr 9, 75–83.
4. Giskes K, Avendano M, Brug J et al. (2010) A systematicreview of studies on socioeconomic inequalities in dietaryintakes associated with weight gain and overweight/obesity conducted among European adults. Obes Rev 11,413–419.
5. Irala-Estevez JD, Groth M, Johansson L et al. (2000) Asystematic review of socio-economic differences in foodhabits in Europe: consumption of fruit and vegetables. EurJ Clin Nutr 54, 706–714.
6. Lopez-Azpiazu I, Sanchez-Villegas A, Johansson L et al.(2003) Disparities in food habits in Europe: systematicreview of educational and occupational differences in theintake of fat. J Hum Nutr Diet 16, 349–364.
7. Darmon N & Drewnowski A (2008) Does social classpredict diet quality? Am J Clin Nutr 87, 1107–1117.
8. Sichert-Hellert W & Kersting M (2004) Vitamin and mineralsupplements use in German children and adolescentsbetween 1986 and 2003: results of the DONALD Study. AnnNutr Metab 48, 414–419.
9. Six J, Richter A, Rabenberg M et al. (2008) Dietarysupplement use among adolescents in Germany. Resultsof EsKiMo. Bundesgesundheitsblatt GesundheitsforschungGesundheitsschutz 51, 1202–1209.
10. von Berg A, Koletzko S, Grubl A et al. (2003) The effect ofhydrolyzed cow’s milk formula for allergy prevention inthe first year of life: the German Infant NutritionalIntervention Study, a randomized double-blind trial.J Allergy Clin Immunol 111, 533–540.
11. von Berg A, Filipiak-Pittroff B, Kramer U et al. (2008)Preventive effect of hydrolyzed infant formulas persistsuntil age 6 years: long-term results from the GermanInfant Nutritional Intervention Study (GINI). J Allergy ClinImmunol 121, 1442–1447.
12. Heinrich J, Bolte G, Holscher B et al. (2002) Allergensand endotoxin on mothers’ mattresses and total immuno-globulin E in cord blood of neonates. Eur Respir J 20,617–623.
13. Zutavern A, Brockow I, Schaaf B et al. (2006) Timing ofsolid food introduction in relation to atopic dermatitis andatopic sensitization: results from a prospective birth cohortstudy. Pediatrics 117, 401–411.
14. Stiegler P, Sausenthaler S, Buyken AE et al. (2010) A newFFQ designed to measure the intake of fatty acids andantioxidants in children. Public Health Nutr 13, 38–46.
15. Bohlscheid-Thomas S, Hoting I, Boeing H et al. (1997)Reproducibility and relative validity of food group intake ina food frequency questionnaire developed for the Germanpart of the EPIC project. European Prospective Investiga-tion into Cancer and Nutrition. Int J Epidemiol 26, Suppl. 1,S59–S70.
16. Hartmann BM, Bell S, Vasquez-Caiquedo AL et al. (2005)Der Bundeslebensmittelschlussel. German Nutrient DataBase. Karlsruhe: Federal Research Centre for Nutrition andFood (BfEL).
17. Kroke A, Manz F, Kersting M et al. (2004) The DONALDStudy. History, current status and future perspectives. Eur JNutr 43, 45–54.
SPublic
Hea
lth
Nutr
itio
n
Socio-economic determinants of children’s diet 11

18. Block G, Woods M, Potosky A et al. (1990) Validation of aself-administered diet history questionnaire using multiplediet records. J Clin Epidemiol 43, 1327–1335.
19. Haraldsdottir J (1993) Minimizing error in the field: qualitycontrol in dietary surveys. Eur J Clin Nutr 47, Suppl. 2,S19–S24.
20. Hauser R (1998) Adequacy and poverty among the retired.In Maintaining Prosperity in an Ageing Society. AgeingWorking Paper no. 3.2. Paris: OECD.
21. Sausenthaler S, Kompauer I, Mielck A et al. (2007) Impactof parental education and income inequality on children’sfood intake. Public Health Nutr 10, 24–33.
22. R Development Core Team (2009) R: A Language andEnvironment for Statistical Computing. Vienna, Austria: RFoundation for Statistical Computing.
23. Mensink GB, Heseker H, Richter A et al. (2007) Ernah-rungsstudie als KiGGS-Modul (EsKiMo) – Forschungsber-icht. Berlin, Paderborn: Robert-Koch Institut, UniversitatPaderborn.
24. Stahl A, Vohmann C, Richter A et al. (2009) Changes in foodand nutrient intake of 6- to 17-year-old Germans betweenthe 1980s and 2006. Public Health Nutr 12, 1912–1923.
25. Turrell G, Hewitt B, Patterson C et al. (2003) Measuringsocio-economic position in dietary research: is choice of
socio-economic indicator important? Public Health Nutr 6,191–200.
26. Klocke A (1997) The impact of poverty on nutritionbehaviour in young Europeans. In Poverty and Food inWelfare Societies, pp. 224–237 [B Kohler, E Feichtinger,E Barlosius, et al., editors]. Berlin: Sigma.
27. Laitinen S, Rasanen L, Viikari J et al. (1995) Diet of Finnishchildren in relation to the family’s socio-economic status.Scand J Soc Med 23, 88–94.
28. Cooke LJ, Wardle J, Gibson EL et al. (2004) Demographic,familial and trait predictors of fruit and vegetable consump-tion by pre-school children. Public Health Nutr 7, 295–302.
29. Rogers I & Emmett P (2003) The effect of maternal smokingstatus, educational level and age on food and nutrientintakes in preschool children: results from the AvonLongitudinal Study of Parents and Children. Eur J ClinNutr 57, 854–864.
30. Flynn A, Hirvonen T, Mensink GB et al. (2009) Intake ofselected nutrients from foods, from fortification and fromsupplements in various European countries. Food Nutr ResSuppl. 1, 53.
31. Robinson S, Godfrey K, Osmond C et al. (1996) Evaluationof a food frequency questionnaire used to assess nutrientintakes in pregnant women. Eur J Clin Nutr 50, 302–308.
Appendix
GINIplus study group
Institute of Epidemiology, Helmholtz Zentrum
Muenchen, German Research Center for Environmental
Health, Neuherberg (Wichmann HE, Heinrich J, Schoet-
zau A, Popescu M, Mosetter M, Schindler J, Franke K,
Laubereau B, Sausenthaler S, Thaqi A, Zirngibl A, Zuta-
vern A, Filipiak B, Gehring U); Department of Pediatrics,
Marien-Hospital, Wesel (Berdel D, von Berg A, Albrecht
B, Baumgart A, Bollrath C, Buttner S, Diekamp S, Groß I,
Jakob T, Klemke K, Kurpiun S, Mollemann M, Neususs J,
Varhelyi A, Zorn C); Ludwig Maximilians University of
Munich, Dr von Hauner Children’s Hospital (Koletzko S,
Reinhard D, Weigand H, Antonie I, Baumler-Merl B,
Tasch C, Gohlert R, Sonnichsen C); Clinic and Polyclinic
for Child and Adolescent Medicine, University Hospital
Rechts der Isar of the Technical University Munich (Bauer
CP, Grubl A, Bartels P, Brockow I, Hoffmann U, Lotzbeyer
F, Mayrl R, Negele K, Schill E-M, Wolf B); IUF-Environ-
mental Health Research Institute, Dusseldorf (Kramer U,
Link E, Sugiri D, Ranft U).
LISAplus study group
Institute of Epidemiology, Helmholtz Zentrum Muenchen,
German Research Center for Environmental Health,
Neuherberg (Wichmann HE, Heinrich J, Bolte G, Belcredi P,
Jacob B, Schoetzau A, Mosetter M, Schindler J, Hohnke A,
Franke K, Laubereau B, Sausenthaler S, Thaqi A, Zirngibl A,
Zutavern A); Department of Pediatrics, University of Leipzig
(Borte M, Schulz R, Sierig G, Mirow K, Gebauer C, Schulze
B, Hainich J); Institute for Clinical Immunology and Trans-
fusion Medicine (Sack U, Emmrich F); Department of
Pediatrics, Marien-Hospital, Wesel (von Berg A, Schaaf B,
Scholten C, Bollrath C, Groß I, Mollemann M); Department
of Human Exposure-Research and Epidemiology, UFZ-
Center for Environmental Research Leipzig-Halle (Herbarth
O, Diez U, Rehwagen M, Schlink U, Franck U, Jorks A,
Roder S); Department of Environmental Immunology, UFZ-
center for Environmental Research Leipzig-Halle (Lehmann
I, Herberth G, Daegelmann C); Ludwig Maximilians Uni-
versity Munich, Dr von Hauner Children’s Hospital,
Department of Infectious Diseases and Immunology (Weiss
M, Albert M); Friedrich-Schiller-University Jena, Institute for
Clinical Immunology (Fahlbusch B), Institute for Social,
Occupational and Environmental Medicine (Bischof W,
Koch A); IUF Environmental Health Research Institute,
Dusseldorf (Kramer U, Link E, Ranft U, Schins R); Clinic and
Polyclinic for Child and Adolescent Medicine, University
Hospital Rechts der Isar of the Technical University Munich
(Bauer CP, Brockow I, Grubl A); Department of Dermatology
and Allergy Biederstein, Technical University Munich
(Ring J, Grosch J, Weidinger S).
SPublic
Hea
lth
Nutr
itio
n
12 S Sausenthaler et al.

8 Paper 5: FADS Variants, Dietary Fatty AcidIntake and Lipids in Children(Standl et al. PLoS ONE, 2012)
Original title: FADS1 FADS2 Gene Cluster, PUFA Intake and Blood Lipids in Chil-dren. Results from the GINIplus and LISAplus Studies.
Authors: M Standl, E Lattka, B Stach, S Koletzko, C-P Bauer, A von Berg,D Berdel, U Krämer, B Schaaf, S Röder, O Herbarth, A Buyken, TDrogies, J Thiery, B Koletzko, J Heinrich
Journal: PLoS ONEVolume: 7Pages: e37780Year: 2012
161


FADS1 FADS2 Gene Cluster, PUFA Intake and BloodLipids in Children: Results from the GINIplus andLISAplus StudiesMarie Standl1, Eva Lattka2, Barbara Stach3, Sibylle Koletzko4, Carl-Peter Bauer5, Andrea von Berg6,
Dietrich Berdel6, Ursula Kramer7, Beate Schaaf8, Stefan Roder9, Olf Herbarth10, Anette Buyken11,
Tim Drogies3, Joachim Thiery3, Berthold Koletzko4, Joachim Heinrich1* for the GINIplus Study Group"
and LISAplus Study Group"
1 Institute of Epidemiology I, Helmholtz Zentrum Munchen – German Research Centre for Environmental Health, Neuherberg, Germany, 2 Research Unit of Molecular
Epidemiology, Helmholtz Zentrum Munchen – German Research Centre for Environmental Health, Neuherberg, Germany, 3 Faculty of Medicine, Institute of Laboratory
Medicine, Clinical Chemistry, and Molecular Diagnostics, University Hospital Leipzig, Leipzig, Germany, 4 University of Munich Medical Centre, Dr. von Hauner Children’s
Hospital, Munich, Germany, 5 Department of Pediatrics, Technical University of Munich, Munich, Germany, 6 Department of Pediatrics, Marien-Hospital Wesel, Wesel,
Germany, 7 IUF, Leibniz Institut fur Umweltmedizinische Forschung at the University of Dusseldorf, Dusseldorf, Germany, 8 Medical Practice for Pediatrics, Bad Honnef,
Germany, 9 Department for Environmental Immunology, Helmholtz Centre for Environmental Research – UFZ, Leipzig, Germany, 10 Faculty of Medicine, Environmental
Medicine and Hygiene, University of Leipzig, Leipzig, Germany, 11 Research Institute of Child Nutrition, University of Bonn, Dortmund, Germany
Abstract
Background: Elevated cholesterol levels in children can be a risk factor for cardiovascular diseases in later life. In adults, ithas been shown that blood lipid levels are strongly influenced by polymorphisms in the fatty acid desaturase (FADS) genecluster in addition to nutritional and other exogenous and endogenous determinants. Our aim was to investigate whetherlipid levels are determined by the FADS genotype already in children and whether this association interacts with dietaryintake of n-3 fatty acids.
Methods: The analysis was based on data of 2006 children from two German prospective birth cohort studies. Totalcholesterol, HDL, LDL and triglycerides were measured at 10 years of age. Six single nucleotide polymorphisms (SNPs) of theFADS gene cluster were genotyped. Dietary n-3 fatty acid intake was assessed by food frequency questionnaire. Linearregression modeling was used to assess the association between lipid levels, n-3 fatty acid intake and FADS genotype.
Results: Individuals carrying the homozygous minor allele had lower levels of total cholesterol [means ratio (MR) rangingfrom 0.96 (p = 0.0093) to 0.98 (p = 0.2949), depending on SNPs] and LDL [MR between 0.94 (p = 0.0179) and 0.97 (p = 0.2963)]compared to homozygous major allele carriers. Carriers of the heterozygous allele showed lower HDL levels [b between20.04 (p = 0.0074) to 20.01 (p = 0.3318)] and higher triglyceride levels [MR ranging from 1.06 (p = 0.0065) to 1.07(p = 0.0028)] compared to homozygous major allele carriers. A higher n-3 PUFA intake was associated with higherconcentrations of total cholesterol, LDL, HDL and lower triglyceride levels, but these associations did not interact with theFADS1 FADS2 genotype.
Conclusion: Total cholesterol, HDL, LDL and triglyceride concentrations may be influenced by the FADS1 FADS2 genotypealready in 10 year old children. Genetically determined blood lipid levels during childhood might differentially predisposeindividuals to the development of cardiovascular diseases later in life.
Citation: Standl M, Lattka E, Stach B, Koletzko S, Bauer C-P, et al. (2012) FADS1 FADS2 Gene Cluster, PUFA Intake and Blood Lipids in Children: Results from theGINIplus and LISAplus Studies. PLoS ONE 7(5): e37780. doi:10.1371/journal.pone.0037780
Editor: Vincent W. V. Jaddoe, Erasmus Medical Center, The Netherlands
Received November 17, 2011; Accepted April 27, 2012; Published May 21, 2012
Copyright: � 2012 Standl et al. This is an open-access article distributed under the terms of the Creative Commons Attribution License, which permitsunrestricted use, distribution, and reproduction in any medium, provided the original author and source are credited.
Funding: This work was supported financially in part by the ‘‘Kompetenznetz Adipositas’’ (‘‘Competence Network Obesity’’) funded by the German FederalMinistry of Education and Research (FKZ: 01GI0826) and by the Munich Center of Health Sciences (MCHEALTH). The LISAplus study was funded by grants of theFederal Ministry for Education, Science, Research and Technology (Grant No. 01 EG 9705/2 and 01EG9732) and the 6 years follow-up of the LISAplus study waspartly funded by the Federal Ministry of Environment (IUF, FKS 20462296). BK is the recipient of a Freedom to Discover Award of the Bristol-Myers SquibbFoundation, New York, NY, USA. The authors gratefully acknowledge partial financial support from the Commission of the European Communities, specific RTDProgramme ‘‘Quality of Life and Management of Living Resources’’, within the 7th Framework Programme NUTRIMENTHE, FP7-212652. This manuscript does notnecessarily reflect the views of the Commission and in no way anticipates the future policy in this area. The funders had no role in study design, data collectionand analysis, decision to publish, or preparation of the manuscript.
Competing Interests: The authors have declared that no competing interests exist.
* E-mail: [email protected]
" Membership of the the GINIplus Study Group is provided in the Acknowledgments." Membership of the LISAplus Study Group is provided in the Acknowledgments.
PLoS ONE | www.plosone.org 1 May 2012 | Volume 7 | Issue 5 | e37780

Introduction
Lipid concentrations in blood are associated with cardiovascular
diseases [1–4]. Elevated cholesterol levels during childhood and
adolescence increases the risk for cardiovascular diseases in
adulthood. Moreover treatments which effectively lower choles-
terol levels early in life have been shown to prevent disease
manifestation in later life [5–7].
Among other factors, dietary polyunsaturated fatty acid (PUFA)
intake can attenuate high blood lipid concentrations [8–10].
In addition to dietary influences, recent genome wide associ-
ation studies have identified several genetic loci that are associated
with blood lipid levels in adults [11–15]. Among the top hits for
the determination of lipid levels are polymorphisms in the fatty
acid desaturase (FADS) gene cluster. Lower total cholesterol [11],
low-density lipoprotein (LDL) [11–13], high-density lipoprotein
(HDL) [13,14] and higher triglyceride levels [14,15] are all
associated with the minor alleles of the tested FADS polymor-
phisms. The genes FADS1 and FADS2, which are both located in
this gene cluster, encode the enzymes delta-5-desaturase and delta-
6-desaturase, which are involved in the conversion of dietary n-3
and n-6 fatty acids to their longer chain metabolites [16].
Polymorphisms in these genes are associated with n-3 and n-6
fatty acid levels in blood and several tissues [17–23]. Carriers of
the minor alleles exhibit increased levels of desaturase substrates
and decreased levels of desaturase products. This trend may be the
result of lower transcription levels or diminished enzyme
conversion rates in individuals carrying the minor alleles [17].
The previously reported strong association of FADS polymor-
phisms with lipid levels in adults makes these genes good
candidates for genetic association studies focused on lipid levels
in children. Given the role of the gene products in the conversion
of dietary fatty acids to biologically important longer chain
polyunsaturated fatty acids, which in turn have been shown to
influence lipid levels, interaction analysis between genetic poly-
morphisms and dietary intake of fatty acids for individual lipid
levels is of interest.
In this study we investigated whether genetic variations of the
FADS gene cluster already pre-determines total cholesterol, HDL,
LDL and triglyceride levels in 10 year old children and whether
genetic variation interacts with dietary intake of n-3 PUFAs to
determine individual blood lipid levels.
Results
Information on lipid concentrations in blood and FADS1 FADS2
genotype was available for 2006 children (1288 (64%) children
from the GINIplus study and 718 (36%) children from the
LISAplus study). Information on n-3 PUFA intake was only
available for 1697 of these children (1100 (65%) children from the
GINIplus study and 597 (35%) children from the LISAplus study).
Basic characteristics of the study population are presented in
Table 1. Total cholesterol, LDL and triglyceride concentrations
were significantly higher in the GINIplus study, whereas HDL
concentrations were higher in the LISAplus study.
The genotype and allele frequencies of the six SNPs which were
included in the analysis are shown in Table 2. There was no
difference in the allele frequency distribution between the
GINIplus and LISAplus studies.
Five of the six SNPs (rs174545, rs174546, rs174556, rs174561
and rs3834458) are in high LD with each other. For these five
SNPs, the pairwise squared correlations r2 ranged from 0.83 to
0.99, and Lewontin’s D’ ranged from 0.98 to 1.
For rs174575, the linkage disequilibrium is lower. The pairwise
correlation r2 for this SNP ranged from 0.49 to 0.66 and
Lewontin’s D’ ranged from 0.77 to 0.96.
Median levels of total cholesterol, HDL, LDL and triglyceride
concentrations, stratified by FADS genotype, are presented in
Table 3. Homozygous minor allele carriers had lower levels of
total cholesterol and LDL compared to homozygous or heterozy-
gous major allele carriers. In contrast, triglyceride concentrations
were higher in minor allele carriers compared to homozygous
major allele carriers. After adjustment for multiple testing
(acorr = 0.025), these associations remained significant for triglyc-
eride levels and LDL (rs174556 and rs174561).
The results of the linear regression models for total cholesterol,
HDL, LDL and triglyceride concentrations, the FADS genotype
and n-3 PUFA intake are presented in Table 4. Adjusted means
ratios for total cholesterol, LDL and triglyceride concentrations
and effect estimates for HDL are shown.
The p-values describing the association between n-3 PUFA
intake and elevated concentrations of total cholesterol [MR = 1.01
for all six SNPs (p-value ranging from 0.0288 to 0.0884)], LDL
[MR from 1.01 (p = 0.1075) to 1.02 (p = 0.0411)], HDL [b= 0.02
for all six SNPs (p-value between 0.0126 and 0.0306)] and reduced
triglyceride levels [MR between 0.97 (p = 0.0219) and 0.98
(p = 0.0841)] were statistically significant. However, after correct-
ing for multiple testing, only five (out of six) SNPs for HDL and
triglyceride levels and rs3834458 remained significant.
Additional analyses showed similar results for the n-3 PUFAs
ALA, EPA, DPA and DHA, which were combined into the total
dietary n-3 PUFA intake (data not shown).
There was no association between dietary n-6 PUFA intake and
lipid levels (data not shown).
Homozygous minor allele carriers had decreased levels of total
cholesterol [MR ranging from 0.96 (p = 0.0093) to 0.98
(p = 0.2949)] and LDL [MR between 0.94 (p = 0.0179) and 0.97
(p = 0.2963)] compared to homozygous major allele carriers. After
correcting for multiple testing (acorr = 0.025), the association
remained significant for rs174556 and rs174561 and total
cholesterol and LDL.
HDL concentrations were reduced in carriers of the heterozy-
gous genotype compared to homozygous major allele carriers [bbetween 20.04 (p = 0.0074) to 20.01 (p = 0.3318)]. These
associations remained significant for four SNPs after correction
for multiple testing.
Individuals carrying the heterozygous genotype showed signif-
icantly increased triglyceride levels compared to homozygous
major allele carriers [MR ranging from 1.06 (p = 0.0065) to 1.07
(p = 0.0028)]. These associations remained significant after
correcting for multiple testing. Although homozygous minor allele
carriers also showed increased triglyceride levels, these effects did
not reach statistical significance. Additional analyses restricted to
fasting blood samples did not show substantially different results
and the magnitude of the association between FADS genotype, n-3
PUFA and lipid concentration was similar. However, this result
did not reach statistical significance, likely because of the reduced
sample size (Table S1).
For each model, including the FADS SNP increased the
percentage of explained variance compared to the model without
any SNPs (Table S2). The maximal increase in the explained
variance was 0.71% for the total cholesterol model (1.98% to
2.69%), 1.28% for the LDL model (from 4.21% to 5.49%), 0.96%
for the HDL model (from 7.83% to 8.79%) and 0.48% for the
triglycerides model (from 12.38% to 12.86%). Additional analyses
stratified by study (GINIplus and LISAplus) showed similar results,
FADS Genes, PUFA and Lipids in Children
PLoS ONE | www.plosone.org 2 May 2012 | Volume 7 | Issue 5 | e37780

although again, the lack of statistical significance is likely
attributable to the reduced sample size (Figure S1).
There was no significant interaction between n-3 PUFA intake
and FADS1 FADS2 genotype for any of the tested lipid
concentrations (data not shown).
Discussion
The present study investigated the association between n-3
PUFA intake and FADS genotype with total cholesterol, HDL,
LDL and triglyceride concentrations in 10-year-old children from
the GINIplus and LISAplus birth cohort studies.
Although not all associations were statistically significant after
adjustment for multiple testing, in these children, a higher n-3
PUFA intake was associated with higher total cholesterol, HDL
and LDL and lower triglyceride levels. These associations
remained significant after adjustment for multiple testing for
HDL (five out of six tested SNPs) and triglyceride concentrations
(rs3834458).
Minor alleles of FADS1 and FADS2 SNPs were significantly
associated with higher levels of triglycerides and lower levels of
total cholesterol, HDL, and LDL levels. However, not all of these
associations reached statistical significance after correcting for
multiple testing.
Generally, our results on trends in children are in line with
previously published GWA studies that report an association
between the minor allele of the tested FADS variant with lower
total cholesterol [11], LDL [11–13], HDL [13,14] and higher
triglyceride [14,15] concentrations in adults. Although the sample
size of our cohort is relatively large, failure to reach statistical
significance for all SNPs after correcting for multiple testing may
be due to a lack of statistical power and small effect sizes.
Nevertheless, our effect sizes for total cholesterol and triglycerides
are comparable to those reported for adults [11,14]. Bokor et al.
[24] investigated the association between FADS haplotypes and
lipid levels in adolescents, and reported no associations between
any of the haplotypes and total cholesterol, HDL or LDL.
However, the haplotype carrying the minor allele of rs174546 was
significantly associated with higher triglyceride levels and the effect
size reported is similar to that observed in our study.
The lack of statistical significance with respect to triglyceride
levels in homozygous minor allele carriers may be due to the small
size of this group (7% to 12% of the complete sample).
The inclusion of the FADS SNPs to the model lead to an
increase of explained variance ranging from 0.48% for the
triglyceride model to 1.28% for the LDL model, which showed a
similar level as reported by several studies [25].
Table 1. Basic characteristics of the study population.
GINIplus(n = 1288)
LISAplus(n = 718)
Total(n = 2006) p-value
Median (25%-Qu.,75%-Qu.) or %
Gender [% male] 49.0 55.6 51.3 0.00521
Age [weeks] 531 (526,538) 529 (525,536) 530 (525,537) 0.00722
BMI 17 (16,19) 17 (15,18) 17 (16,19) ,0.00012
Fasting blood samples [%] 16.5 21.9 18.4 0.00321
n-3 PUFA intake [mg/MJ] 0.14 (0.13,0.16) 0.14 (0.13,0.16) 0.14 (0.13,0.16) 0.59502
Total energy intake [MJ] 8237 (6900,9907) 8198 (6654,9906) 8231 (6824,9906) 0.40122
Total cholesterol [mmol/L] 4.81 (4.28,5.39) 4.75 (4.30,5.23) 4.79 (4.28,5.32) 0.04222
HDL [mmol/L] 1.20 (1.02,1.41) 1.33 (1.15,1.50) 1.24 (1.06,1.44) ,0.00012
LDL [mmol/L] 2.14 (1.73,2.58) 2.08 (1.72,2.45) 2.12 (1.72,2.53) 0.02252
Triglyceride [mmol/L] 1.24 (0.94,1.67) 1.11 (0.83,1.58) 1.19 (0.90,1.64) ,0.00012
1p-value derived from Fisher’s exact test.2p-value derived from Wilcoxon rank sum test.doi:10.1371/journal.pone.0037780.t001
Table 2. Characteristics of the SNPs in the FADS gene cluster.
SNP Alleles N Number of subjects with
(major/minor) genotype (%) allele (%)
A/a aa Aa AA a A
rs174545 G/C 1829 211 (12%) 793 (43%) 825 (45%) 1215 (33%) 2443 (67%)
rs174546 G/A 1854 211 (11%) 804 (43%) 839 (45%) 1226 (33%) 2482 (67%)
rs174556 G/A 1849 165 (9%) 758 (41%) 926 (50%) 1088 (29%) 2610 (71%)
rs174561 A/G 1867 165 (9%) 766 (41%) 936 (50%) 1096 (29%) 2638 (71%)
rs174575 C/G 1974 139 (7%) 738 (37%) 1097 (56%) 1016 (26%) 2932 (74%)
rs3834458 T/DEL 1971 216 (11%) 855 (43%) 900 (46%) 1287 (33%) 2655 (67%)
doi:10.1371/journal.pone.0037780.t002
FADS Genes, PUFA and Lipids in Children
PLoS ONE | www.plosone.org 3 May 2012 | Volume 7 | Issue 5 | e37780

Lipid levels in children are determinants for cardiovascular
diseases in adulthood [5–7]. Analysis of the underlying causes for
disturbances in lipid metabolism during childhood can contribute
to the prevention of cardiovascular diseases later in life. Our study
suggests that the FADS1 FADS2 gene cluster may influence lipid
levels in early life.
The underlying causal biological mechanism between an
individual’s FADS genotype and their lipid concentrations is not
Table 3. Median total cholesterol, HDL, LDL and triglyceride concentrations [mmol/L] in with 25%- and 75%-quantiles stratified byFADS genotype (A: major allele/ a: minor allele).
Total cholesterol HDL LDL Triglyceride
rs174545
AA 4.81(4.29,5.34)
1.27(1.06,1.47)
2.13(1.74,2.57)
1.14(0.87,1.57)
Aa 4.77(4.28,5.30)
1.23(1.06,1.42)
2.13(1.74,2.51)
1.23(0.93,1.67)
aa 4.68(4.18,5.16)
1.26(1.09,1.43)
2.01(1.67,2.47)
1.23(0.92,1.69)
p-value1 0.1189 0.2246 0.0718 0.0058
rs174546
AA 4.82(4.29,5.34)
1.27(1.07,1.47)
2.13(1.74,2.57)
1.14(0.88,1.57)
Aa 4.77(4.28,5.31)
1.23(1.06,1.42)
2.13(1.74,2.51)
1.24(0.94,1.68)
aa 4.66(4.18,5.15)
1.26(1.09,1.43)
2.01(1.67,2.47)
1.22(0.92,1.68)
p-value1 0.0793 0.1494 0.0701 0.0078
rs174556
AA 4.83(4.30,5.38)
1.27(1.07,1.47)
2.14(1.74,2.58)
1.15(0.88,1.58)
Aa 4.76(4.28,5.30)
1.23(1.06,1.41)
2.12(1.73,2.49)
1.23(0.94,1.69)
aa 4.65(4.18,5.08)
1.25(1.09,1.43)
1.98(1.65,2.38)
1.22(0.90,1.68)
p-value1 0.0263 0.0842 0.0182 0.0071
rs174561
AA 4.83(4.30,5.38)
1.27(1.07,1.47)
2.14(1.74,2.59)
1.15(0.88,1.58)
Aa 4.76(4.28,5.29)
1.23(1.06,1.42)
2.12(1.73,2.49)
1.23(0.94,1.69)
aa 4.65(4.18,5.11)
1.25(1.09,1.43)
2.00(1.65,2.38)
1.25(0.92,1.68)
p-value1 0.0288 0.1042 0.0145 0.0076
rs174575
AA 4.80(4.28,5.32)
1.26(1.06,1.46)
2.12(1.73,2.53)
1.15(0.88,1.57)
Aa 4.80(4.31,5.35)
1.23(1.06,1.43)
2.16(1.75,2.54)
1.25(0.93,1.72)
aa 4.63(4.18,5.08)
1.24(1.04,1.41)
1.96(1.68,2.36)
1.24(0.98,1.70)
p-value1 0.0390 0.3346 0.0325 0.0032
rs3834458
AA 4.81(4.30,5.35)
1.26(1.06,1.47)
2.13(1.73,2.56)
1.15(0.88,1.58)
Aa 4.79(4.28,5.33)
1.23(1.06,1.42)
2.16(1.75,2.53)
1.24(0.94,1.68)
aa 4.65(4.23,5.14)
1.25(1.06,1.43)
2.01(1.68,2.40)
1.22(0.94,1.69)
p-value1 0.0434 0.2505 0.0414 0.0081
1p-value derived from Kruskal-Wallis rank sum test. Significance level after correction for multiple testing: acorr = 0.025. Values reaching significance after adjustment formultiple testing are highlighted in bold.doi:10.1371/journal.pone.0037780.t003
FADS Genes, PUFA and Lipids in Children
PLoS ONE | www.plosone.org 4 May 2012 | Volume 7 | Issue 5 | e37780
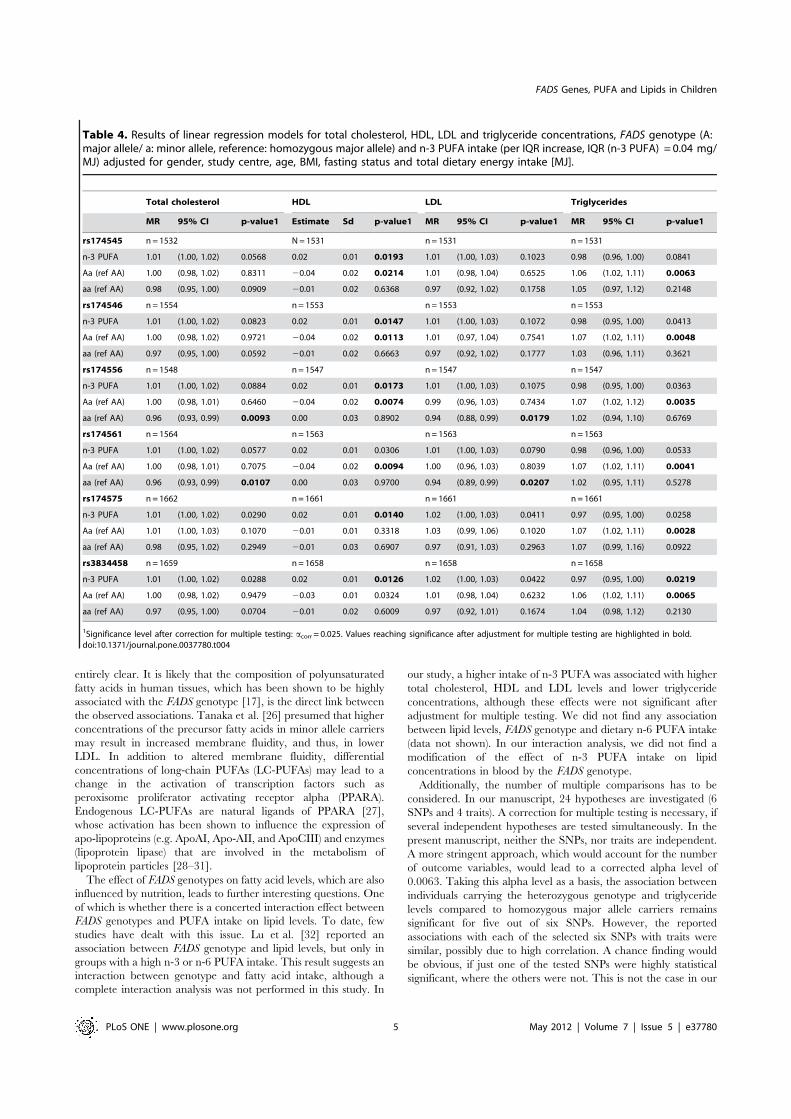
entirely clear. It is likely that the composition of polyunsaturated
fatty acids in human tissues, which has been shown to be highly
associated with the FADS genotype [17], is the direct link between
the observed associations. Tanaka et al. [26] presumed that higher
concentrations of the precursor fatty acids in minor allele carriers
may result in increased membrane fluidity, and thus, in lower
LDL. In addition to altered membrane fluidity, differential
concentrations of long-chain PUFAs (LC-PUFAs) may lead to a
change in the activation of transcription factors such as
peroxisome proliferator activating receptor alpha (PPARA).
Endogenous LC-PUFAs are natural ligands of PPARA [27],
whose activation has been shown to influence the expression of
apo-lipoproteins (e.g. ApoAI, Apo-AII, and ApoCIII) and enzymes
(lipoprotein lipase) that are involved in the metabolism of
lipoprotein particles [28–31].
The effect of FADS genotypes on fatty acid levels, which are also
influenced by nutrition, leads to further interesting questions. One
of which is whether there is a concerted interaction effect between
FADS genotypes and PUFA intake on lipid levels. To date, few
studies have dealt with this issue. Lu et al. [32] reported an
association between FADS genotype and lipid levels, but only in
groups with a high n-3 or n-6 PUFA intake. This result suggests an
interaction between genotype and fatty acid intake, although a
complete interaction analysis was not performed in this study. In
our study, a higher intake of n-3 PUFA was associated with higher
total cholesterol, HDL and LDL levels and lower triglyceride
concentrations, although these effects were not significant after
adjustment for multiple testing. We did not find any association
between lipid levels, FADS genotype and dietary n-6 PUFA intake
(data not shown). In our interaction analysis, we did not find a
modification of the effect of n-3 PUFA intake on lipid
concentrations in blood by the FADS genotype.
Additionally, the number of multiple comparisons has to be
considered. In our manuscript, 24 hypotheses are investigated (6
SNPs and 4 traits). A correction for multiple testing is necessary, if
several independent hypotheses are tested simultaneously. In the
present manuscript, neither the SNPs, nor traits are independent.
A more stringent approach, which would account for the number
of outcome variables, would lead to a corrected alpha level of
0.0063. Taking this alpha level as a basis, the association between
individuals carrying the heterozygous genotype and triglyceride
levels compared to homozygous major allele carriers remains
significant for five out of six SNPs. However, the reported
associations with each of the selected six SNPs with traits were
similar, possibly due to high correlation. A chance finding would
be obvious, if just one of the tested SNPs were highly statistical
significant, where the others were not. This is not the case in our
Table 4. Results of linear regression models for total cholesterol, HDL, LDL and triglyceride concentrations, FADS genotype (A:major allele/ a: minor allele, reference: homozygous major allele) and n-3 PUFA intake (per IQR increase, IQR (n-3 PUFA) = 0.04 mg/MJ) adjusted for gender, study centre, age, BMI, fasting status and total dietary energy intake [MJ].
Total cholesterol HDL LDL Triglycerides
MR 95% CI p-value1 Estimate Sd p-value1 MR 95% CI p-value1 MR 95% CI p-value1
rs174545 n = 1532 N = 1531 n = 1531 n = 1531
n-3 PUFA 1.01 (1.00, 1.02) 0.0568 0.02 0.01 0.0193 1.01 (1.00, 1.03) 0.1023 0.98 (0.96, 1.00) 0.0841
Aa (ref AA) 1.00 (0.98, 1.02) 0.8311 20.04 0.02 0.0214 1.01 (0.98, 1.04) 0.6525 1.06 (1.02, 1.11) 0.0063
aa (ref AA) 0.98 (0.95, 1.00) 0.0909 20.01 0.02 0.6368 0.97 (0.92, 1.02) 0.1758 1.05 (0.97, 1.12) 0.2148
rs174546 n = 1554 n = 1553 n = 1553 n = 1553
n-3 PUFA 1.01 (1.00, 1.02) 0.0823 0.02 0.01 0.0147 1.01 (1.00, 1.03) 0.1072 0.98 (0.95, 1.00) 0.0413
Aa (ref AA) 1.00 (0.98, 1.02) 0.9721 20.04 0.02 0.0113 1.01 (0.97, 1.04) 0.7541 1.07 (1.02, 1.11) 0.0048
aa (ref AA) 0.97 (0.95, 1.00) 0.0592 20.01 0.02 0.6663 0.97 (0.92, 1.02) 0.1777 1.03 (0.96, 1.11) 0.3621
rs174556 n = 1548 n = 1547 n = 1547 n = 1547
n-3 PUFA 1.01 (1.00, 1.02) 0.0884 0.02 0.01 0.0173 1.01 (1.00, 1.03) 0.1075 0.98 (0.95, 1.00) 0.0363
Aa (ref AA) 1.00 (0.98, 1.01) 0.6460 20.04 0.02 0.0074 0.99 (0.96, 1.03) 0.7434 1.07 (1.02, 1.12) 0.0035
aa (ref AA) 0.96 (0.93, 0.99) 0.0093 0.00 0.03 0.8902 0.94 (0.88, 0.99) 0.0179 1.02 (0.94, 1.10) 0.6769
rs174561 n = 1564 n = 1563 n = 1563 n = 1563
n-3 PUFA 1.01 (1.00, 1.02) 0.0577 0.02 0.01 0.0306 1.01 (1.00, 1.03) 0.0790 0.98 (0.96, 1.00) 0.0533
Aa (ref AA) 1.00 (0.98, 1.01) 0.7075 20.04 0.02 0.0094 1.00 (0.96, 1.03) 0.8039 1.07 (1.02, 1.11) 0.0041
aa (ref AA) 0.96 (0.93, 0.99) 0.0107 0.00 0.03 0.9700 0.94 (0.89, 0.99) 0.0207 1.02 (0.95, 1.11) 0.5278
rs174575 n = 1662 n = 1661 n = 1661 n = 1661
n-3 PUFA 1.01 (1.00, 1.02) 0.0290 0.02 0.01 0.0140 1.02 (1.00, 1.03) 0.0411 0.97 (0.95, 1.00) 0.0258
Aa (ref AA) 1.01 (1.00, 1.03) 0.1070 20.01 0.01 0.3318 1.03 (0.99, 1.06) 0.1020 1.07 (1.02, 1.11) 0.0028
aa (ref AA) 0.98 (0.95, 1.02) 0.2949 20.01 0.03 0.6907 0.97 (0.91, 1.03) 0.2963 1.07 (0.99, 1.16) 0.0922
rs3834458 n = 1659 n = 1658 n = 1658 n = 1658
n-3 PUFA 1.01 (1.00, 1.02) 0.0288 0.02 0.01 0.0126 1.02 (1.00, 1.03) 0.0422 0.97 (0.95, 1.00) 0.0219
Aa (ref AA) 1.00 (0.98, 1.02) 0.9479 20.03 0.01 0.0324 1.01 (0.98, 1.04) 0.6232 1.06 (1.02, 1.11) 0.0065
aa (ref AA) 0.97 (0.95, 1.00) 0.0704 20.01 0.02 0.6009 0.97 (0.92, 1.01) 0.1674 1.04 (0.98, 1.12) 0.2130
1Significance level after correction for multiple testing: acorr = 0.025. Values reaching significance after adjustment for multiple testing are highlighted in bold.doi:10.1371/journal.pone.0037780.t004
FADS Genes, PUFA and Lipids in Children
PLoS ONE | www.plosone.org 5 May 2012 | Volume 7 | Issue 5 | e37780

analyses. Therefore, we do not consider these results as chance
finding.
Nevertheless, our results suggest that there is an effect of n-3
PUFA intake as well as an effect of FADS genotype on lipid levels,
although these effects do not interact with each other. It is known,
that the conversion rate from dietary PUFA intake to longer chain
metabolites is depending on the FADS genotype [17]. Therefore, it
might be possible that dietary n-3 PUFA intake as well as the
FADS genotype have a linear influence on the endogenous PUFA
levels. This would be in line with the results presented by Molto-
Puigmartı et al. [22]. They reported lower DHA proportions in
plasma phospholipids in women carrying the homozygous minor
allele, but the DHA proportions increased with higher intake of
fatty fish to a similar extent for all genotypes.
To our knowledge, this is the first study which has examined the
complex associations between genetics, diet, and lipid levels in
10 year old children.
In addition to its strength, our study also faces some limitations
which must be considered. Although lipid levels were measured
from blood samples, the dietary fatty acid intake was assessed by a
FFQ. The FFQ used in the present study measured dietary intake
over the past 12 months and was validated for the dietary n-3
PUFA intake. Alternatively, it might be interesting to examine the
association of FADS genes, lipid concentrations and measured fatty
acid blood levels. A further limitation of our study is the low
proportion of fasting blood samples (18.4%). The presented results
were adjusted for fasting status. Additionally, the magnitude of the
association between FADS genotype, n-3 PUFA and lipid
concentration was similar when the sample was restricted to those
with information on fasting blood, although statistical significance
was lacking due to a reduced sample size (Results for triglyceride
levels are presented in Table S1).
In order to increase the power, the two independent studies
GINIplus and LISAplus were analyzed together. Additional
analyses stratified for the GINIplus and LISAplus studies showed
consistent results (Figure S1), except for LDL, although signifi-
cance was missed due to the reduced sample size. This
investigation addressed a complex hypothesis and is based on a
specific data situation: Dietary fatty acid intake was assessed using
a FFQ, which was especially developed and validated for dietary
fatty acid intake in this specific study population [33], blood lipid
levels of total cholesterol, HDL, LDL and triglycerides were
measured and genotyping of six variants of the FADS1 FADS2 gene
cluster was performed. Nevertheless, the results in the two
independent studies GINIplus and LISAplus, which are based
on the same methodology, are similar and our results are
comparable to those reported for adults.
Our study suggests that the FADS1 FADS2 gene cluster may
affect lipid levels already in childhood. Although the explained
variance is low, and can therefore not be used for prevention or
prediction purposes, these results underline the hypothesis that
there is a causal association between dietary n-3 PUFA intake and
lipid levels in children and may help to identify the causal
biological mechanism.
However, further studies are needed to investigate the long-term
effects of the impact of dietary intervention on the development of
cardiovascular diseases, while considering the influence of the
FADS gene cluster.
Materials and Methods
Study populationData from two ongoing German birth cohort studies were
included in this investigation: the German LISAplus (Life-style
Related Factors on the Immune System and the Development of
Allergies in Childhood PLUS the influence of traffic emissions and
genetics) and GINIplus (German Infant Nutritional Intervention
PLUS environmental and genetic influences on allergy develop-
ment) studies. LISAplus is a population based birth cohort study in
which a total of 3097 neonates were recruited between 1997 and
1999 from the German cities of Munich, Leipzig, Wesel and Bad
Honnef. The participants were not pre-selected based on family
history of allergic diseases [34]. A total of 5991 mothers and their
newborns were recruited from Munich and Wesel into the
GINIplus study between September 1995 and June 1998. Infants
with at least one allergic parent and/or sibling were allocated to
the interventional study arm which investigated the effect of
different hydrolysed formulas consumed during the first year of life
on the development of allergies [35]. All children without a family
history of allergic diseases and children whose parents did not give
consent for the randomized clinical trial were allocated to the non-
interventional arm. Given that the entire current GINIplus study is
composed of both the interventional and non-interventional arm,
this cohort is also population-based. Detailed descriptions of the
LISAplus and GINIplus studies have been published elsewhere
[34–36]).
In both studies only individuals with Caucasian German descent
were included.
For this analysis, only data from the 10 year follow-up is used.
During this follow-up, blood samples were collected and in a
subset of almost 20% of the children fasting blood samples could
be collected.
For both studies, approval by the local Ethics Committees
(Bavarian Board of Physicians, University of Leipzig, Board of
Physicians of North-Rhine-Westphalia) and written consent from
participant’s families were obtained.
Dietary n-3 PUFA intakeA food frequency questionnaire (FFQ) was developed to
measure a child’s usual food and nutrient intake during one year,
and more specifically, to estimate energy, fatty acid and
antioxidant intake at 10 years of age. The FFQ comprised a list
of 82 food items accompanied by several questions about the
preferred fat and energy content of products, preparation
methods, diet and food preferences, buying habits and dietary
supplement use. The consumption frequencies and portion size
estimates were converted to average consumption in grams per
day and linked to the German Nutrient Data Base, version II.3.1
[37]. The design of the FFQ, including the selection of the food
item list, validation, and the calculation of food and nutrient intake
is described in more detail by Stiegler et al. [33].
The intake of n-3 PUFA was calculated by summing a child’s
daily intake of a-linolenic acid (ALA, 18: 3n-3), eicosapentaenoic
acid (EPA, 20: 5n-3), docosapentaenoic acid (DPA, 22: 5n-3) and
docosahexaenoic acid (DHA, 22: 6n-3).
GenotypingSix single nucleotide polymorphisms (SNPs) in the FADS1
FADS2 gene cluster (rs174545, rs174546, rs174556, rs174561,
rs174575 and rs3834458) were genotyped. Five of these variants
(rs174545, rs174546, rs174556, rs174561 and rs3834458) are in
strong linkage disequilibrium (LD) with each other (r2.0.7,
D’.0.9) [17], and were selected based on previous publications in
adult populations [17,38]. Additionally, we included the rs174575
SNP in order to obtain a better coverage of the FADS gene cluster.
This SNP was selected based on a previous publication in children
[39]. By applying the tagger server program (http://www.
broadinstitute.org/mpg/tagger/) in combination with HapMap
FADS Genes, PUFA and Lipids in Children
PLoS ONE | www.plosone.org 6 May 2012 | Volume 7 | Issue 5 | e37780

(http://hapmap.ncbi.nlm.nih.gov/), we were able to tag 27
additional SNPs between base pair positions 61234329 and
61372379 in the FADS1 FADS2 gene cluster using three of our
original SNPs (rs174545, rs174546 and rs174556). The efficiency
was 10.7 fold, however of these new 27 SNPs, rs174561 and
rs3834458 could not be used in the analysis as these are not
included in the HapMap database. Genotyping of SNPs was
conducted using the iPLEX (Sequenom, San Diego, CA, USA)
method by means of matrix assisted laser desorption ionization-
time of flight mass spectrometry (MALDI-TOF MS, Mass Array;
Sequenom) in one laboratory, according to the manufacturer’s
instructions. Standard genotyping quality control included 10%
duplicate and negative samples. The genotyping discordance rate
was below 0.3%.
Measurement of lipidsThe measurement of serum lipids and lipoproteins was
performed using homogenous enzymatic colorimetric methods
according to the manufactures instructions (Roche Diagnostics
GmbH Mannheim). All parameters and controls were analysed on
a Modular Analytics System from Roche Diagnostics GmbH
Mannheim.
External controls were used in accordance with the guidelines of
the German Society of Clinical Chemistry and Laboratory
Medicine.
Statistical analysisBecause of the skewed distribution, total cholesterol, LDL and
triglyceride concentrations were naturally log-transformed. After-
wards, linear regression modelling was used to assess the
association between log-transformed total cholesterol, HDL, log-
transformed LDL and log-transformed triglyceride concentrations,
n-3 PUFA intake and FADS genotype. Therefore, for HDL, the
regression coefficient b (Estimate) with standard deviation (Sd) is
shown.
For total cholesterol, LDL and triglyceride, the results are
presented as means ratio (MR) with 95% confidence interval (95%
CI). The MR can be easily calculated for lognormal distributed
variables and is derived by applying the exponential function on
the regression coefficient b (i.e. MR = exp (b)). It describes the
ratio of the mean of the outcome variable in one group compared
to the mean of the outcome variable in the reference group. The
MR can be interpreted as percentage change in the mean of the
outcome variable in one group compared to the reference group
adjusted for confounder variables.
The dietary n-3 PUFA intake was included in the regression
analyses as nutrient density (n-3 PUFA intake divided by total
energy intake). Additionally, the results were adjusted for total
energy intake [40]. In order to compare the effect size of high
(75% quantile) and low (25% quantile) dietary n-3 PUFA intake,
the influence of n-3 PUFA intake is given per interquartile range
increase (IQR (n-3 PUFA) = 0.04 mg/MJ).
All regression models were adjusted for gender, study centre
(Munich, Wesel, Leipzig and Bad Honnef), age, BMI at 10 years
of age and fasting status.
Moreover, in additional analyses, an interaction between n-3
PUFA and FADS genotype (reference: homozygous major allele),
was included in the linear regression models in order to test
whether the effect of dietary n-3 PUFA intake is modified by FADS
variants.
Statistical significance was defined by a two-sided alpha level of
5%. We corrected for multiple testing according to Nyholt [41]. In
brief, this method takes the correlation pattern between the SNPs
into account and reduces the number of variables in a set to the
effective number of variables and provides thereby an estimate of
the number of independent tests.
The alpha level is divided by the number of effective loci (which
was computed as two, based on the number of effective loci of the
six SNPs in the FADS gene cluster), which yields a corrected two-
sided alpha level of 0.025 (5%/2 = 2.5%).
Differences between the GINIplus and LISAplus studies were
tested using Fisher’s exact test or Wilcoxon rank sum test. The
association between lipid concentrations and FADS genotype was
tested using Kruskal-Wallis rank sum test, a nonparametric
method to test whether the median of the lipid concentrations is
different between the FADS genotypes.
Statistical analysis was performed using the statistical software
R, version 2.13.1 (http://www.R-project.org) [42].
Supporting Information
Figure S1 Results of linear regression models on totalcholesterol, HDL, LDL and triglycerides stratified forthe GINIplus and LISAplus studies. Presented are means
ratios (total cholesterol, LDL and triglycerides) and effect estimates
(HDL) of FADS genotype (A: major allele/ a: minor allele,
reference: homozygous major allele) and n-3 PUFA intake (per
IQR increase, IQR (n-3 PUFA) = 0.04 mg/MJ). All models are
adjusted for gender, study centre, age, BMI and total dietary
energy intake [MJ]. a) Total cholesterol b) HDL c) LDL d)
Triglycerides
(DOC)
Table S1 Results of linear regression models restrictedto fasting blood samples for triglyceride concentrations,FADS genotype (A: major allele/ a: minor allele,reference: homozygous major allele) and n-3 PUFAintake (per IQR increase, IQR (n-3 PUFA) = 0.04 mg/MJ) adjusted for gender, study centre, age, BMI andtotal dietary energy intake [MJ].(DOC)
Table S2 Percentage of variance explained in themodels without and with the FADS variants.(DOC)
Acknowledgments
The GINIplus study group.
Helmholtz Zentrum Munchen, German Research Center for Environ-
mental Health, Institute of Epidemiology I, Munich (Heinrich J,
Wichmann HE, Sausenthaler S, Zutavern A, Chen, Chih-Mei, Schnap-
pinger M, Rzehak P); Department of Pediatrics, Marien-Hospital, Wesel
(Berdel D, von Berg A, Beckmann C, Groß I); Department of Pediatrics,
Ludwig Maximilians University, Munich (Koletzko S, Reinhardt D,
Krauss-Etschmann S); Department of Pediatrics, Technical University,
Munich (Bauer CP, Brockow I, Grubl A, Hoffmann U); IUF – Leibniz
Research Institute for Environmental Medicine, Dusseldorf (Kramer U,
Link E, Cramer C); Centre for Allergy and Environment, Technical
University, Munich (Behrendt H).
The LISAplus study group.
Helmholtz Zentrum Munchen, German Research Center for Environ-
mental Health, Institute of Epidemiology I, Munich (Heinrich J,
Wichmann HE, Sausenthaler S, Chen CM, Schnappinger M); Department
of Pediatrics, Municipal Hospital ‘‘St. Georg’’, Leipzig (Borte M, Diez U),
Marien-Hospital Wesel, Department of Pediatrics, Wesel (von Berg A,
Beckmann C, Groß I); Pediatric Practice, Bad Honnef (Schaaf B);
Helmholtz Centre for Environmental Research – UFZ, Department of
Environmental Immunology/Core Facility Studies, Leipzig (Lehmann I,
Bauer M, Grabsch C, Roder S, Schilde M); University of Leipzig, Institute
of Hygiene and Environmental Medicine, Leipzig (Herbarth O, Dick C,
Magnus J); IUF – Leibniz Research Institute for Environmental Medicine,
Dusseldorf (Kramer U, Link E, Cramer C); Technical University Munich,
FADS Genes, PUFA and Lipids in Children
PLoS ONE | www.plosone.org 7 May 2012 | Volume 7 | Issue 5 | e37780

Department of Pediatrics, Munich (Bauer CP, Hoffmann U); ZAUM –
Center for Allergy and Environment, Technical University, Munich
(Behrendt H, Grosch J, Martin F).
Author Contributions
Conceived and designed the experiments: SK CPB AvB DB UK B. Schaaf
OH JH. Analyzed the data: MS. Wrote the paper: MS. Development of
statistical analysis plan: EL JH. Lipid measurement: B. Stach TD JT.
Interpretation of the findings: MS EL B. Stach SK CPB AvB DB UK B.
Schaaf SR OH AB TD JT BK JH. Read and approved the manuscript:
MS EL B. Stach SK CPB AvB DB UK B. Schaaf SR OH AB TD JT BK
JH.
References
1. Kannel WB, Dawber TR, Kagan A, Revotskie N, Stokes J (1961) Factors of risk
in the development of coronary heart disease – six year follow-up experience.The Framingham Study. Ann Intern Med 55: 33–50.
2. Miller NE, Miller GJ (1975) Letter: High-density lipoprotein and atherosclerosis.
Lancet 1: 1033.3. Gordon T, Castelli WP, Hjortland MC, Kannel WB, Dawber TR (1977) High
density lipoprotein as a protective factor against coronary heart disease. TheFramingham Study. Am J Med 62: 707–714.
4. Kareinen A, Viitanen L, Halonen P, Lehto S, Laakso M (2001) Cardiovascular
risk factors associated with insulin resistance cluster in families with early-onsetcoronary heart disease. Arterioscler Thromb Vasc Biol 21: 1346–1352.
5. Newman WP, Freedman DS, Voors AW, Gard PD, Srinivasan SR, et al. (1986)Relation of serum lipoprotein levels and systolic blood pressure to early
atherosclerosis. The Bogalusa Heart Study. N Engl J Med 314: 138–144.6. Berenson GS, Srinivasan SR, Bao W, Newman WP, Tracy RE, et al. (1998)
Association between multiple cardiovascular risk factors and atherosclerosis in
children and young adults. The Bogalusa Heart Study. N Engl J Med 338:1650–1656.
7. McGill HC, McMahan CA, Zieske AW, Sloop GD, Walcott JV, et al. (2000)Associations of coronary heart disease risk factors with the intermediate lesion of
atherosclerosis in youth. The Pathobiological Determinants of Atherosclerosis in
Youth (PDAY) Research Group. Arterioscler Thromb Vasc Biol 20: 1998–2004.8. Phillipson BE, Rothrock DW, Connor WE, Harris WS, Illingworth DR (1985)
Reduction of plasma lipids, lipoproteins, and apoproteins by dietary fish oils inpatients with hypertriglyceridemia. N Engl J Med 312: 1210–1216.
9. Calabresi L, Villa B, Canavesi M, Sirtori CR, James RW, et al. (2004) An
omega-3 polyunsaturated fatty acid concentrate increases plasma high-densitylipoprotein 2 cholesterol and paraoxonase levels in patients with familial
combined hyperlipidemia. Metabolism 53: 153–158.10. Mozaffarian D, Micha R, Wallace S (2010) Effects on coronary heart disease of
increasing polyunsaturated fat in place of saturated fat: a systematic review andmeta-analysis of randomized controlled trials. PLoS Med 7: e1000252.
11. Aulchenko YS, Ripatti S, Lindqvist I, Boomsma D, Heid IM, et al. (2009) Loci
influencing lipid levels and coronary heart disease risk in 16 Europeanpopulation cohorts. Nat Genet 41: 47–55.
12. Sabatti C, Service SK, Hartikainen AL, Pouta A, Ripatti S, et al. (2009)Genome-wide association analysis of metabolic traits in a birth cohort from a
founder population. Nat Genet 41: 35–46.
13. Chasman DI, Pare G, Mora S, Hopewell JC, Peloso G, et al. (2009) Forty-threeloci associated with plasma lipoprotein size, concentration, and cholesterol
content in genome-wide analysis. PLoS Genet 5: e1000730.14. Kathiresan S, Willer CJ, Peloso GM, Demissie S, Musunuru K, et al. (2009)
Common variants at 30 loci contribute to polygenic dyslipidemia. Nat Genet 41:56–65.
15. De Silva NMG, Freathy RM, Palmer TM, Donnelly LA, Luan J, et al. (2011)
Mendelian randomization studies do not support a role for raised circulatingtriglyceride levels influencing type 2 diabetes, glucose levels, or insulin resistance.
Diabetes 60: 1008–1018.16. Lattka E, Illig T, Koletzko B, Heinrich J (2010) Genetic variants of the FADS1
FADS2 gene cluster as related to essential fatty acid metabolism. Curr Opin
Lipidol 21: 64–69.17. Schaeffer L, Gohlke H, Muller M, Heid IM, Palmer LJ, et al. (2006) Common
genetic variants of the FADS1 FADS2 gene cluster and their reconstructedhaplotypes are associated with the fatty acid composition in phospholipids. Hum
Mol Genet 15: 1745–1756.18. Xie L, Innis SM (2008) Genetic variants of the FADS1 FADS2 gene cluster are
associated with altered (n-6) and (n-3) essential fatty acids in plasma and
erythrocyte phospholipids in women during pregnancy and in breast milk duringlactation. J Nutr 138: 2222–2228.
19. Baylin A, Ruiz-Narvaez E, Kraft P, Campos H (2007) alpha-Linolenic acid,Delta6-desaturase gene polymorphism, and the risk of nonfatal myocardial
infarction. Am J Clin Nutr 85: 554–560.
20. Malerba G, Schaeffer L, Xumerle L, Klopp N, Trabetti E, et al. (2008) SNPs ofthe FADS gene cluster are associated with polyunsaturated fatty acids in a
cohort of patients with cardiovascular disease. Lipids 43: 289–299.21. Lattka E, Rzehak P, Szabo E, Jakobik V, Weck M, et al. (2011) Genetic variants
in the FADS gene cluster are associated with arachidonic acid concentrations ofhuman breast milk at 1.5 and 6 mo postpartum and influence the course of milk
dodecanoic, tetracosenoic, and trans-9-octadecenoic acid concentrations over
the duration of lactation. Am J Clin Nutr 93: 382–391.
22. Molto-Puigmartı C, Plat J, Mensink RP, Muller A, Jansen E, et al. (2010)
FADS1 FADS2 gene variants modify the association between fish intake and thedocosahexaenoic acid proportions in human milk. Am J Clin Nutr 91:
1368–1376.
23. Koletzko B, Lattka E, Zeilinger S, Illig T, Steer C (2011) Genetic variants of thefatty acid desaturase gene cluster predict amounts of red blood cell
docosahexaenoic and other polyunsaturated fatty acids in pregnant women:findings from the Avon Longitudinal Study of Parents and Children. Am J Clin
Nutr 93: 211–219.
24. Bokor S, Dumont J, Spinneker A, Gonzalez-Gross M, Nova E, et al. (2010)Single nucleotide polymorphisms in the FADS gene cluster are associated with
delta-5 and delta-6 desaturase activities estimated by serum fatty acid ratios.J Lipid Res 51: 2325–2333.
25. Stranger BE, Stahl EA, Raj T (2011) Progress and promise of genome-wideassociation studies for human complex trait genetics. Genetics 187: 367–383.
26. Tanaka T, Shen J, Abecasis GR, Kisialiou A, Ordovas JM, et al. (2009)
Genome-wide association study of plasma polyunsaturated fatty acids in theInCHIANTI Study. PLoS Genet 5: e1000338.
27. Fruchart JC, Duriez P, Staels B (1999) Peroxisome proliferator-activatedreceptor-alpha activators regulate genes governing lipoprotein metabolism,
vascular inflammation and atherosclerosis. Curr Opin Lipidol 10: 245–257.
28. Hertz R, Bishara-Shieban J, Bar-Tana J (1995) Mode of action of peroxisomeproliferators as hypolipidemic drugs. Suppression of apolipoprotein C-III. J Biol
Chem 270: 13470–13475.29. Schoonjans K, Peinado-Onsurbe J, Lefebvre AM, Heyman RA, Briggs M, et al.
(1996) PPARalpha and PPARgamma activators direct a distinct tissue-specific
transcriptional response via a PPRE in the lipoprotein lipase gene. EMBO J 15:5336–5348.
30. Vu-Dac N, Schoonjans K, Laine B, Fruchart JC, Auwerx J, et al. (1994)Negative regulation of the human apolipoprotein A-I promoter by fibrates can
be attenuated by the interaction of the peroxisome proliferator-activatedreceptor with its response element. J Biol Chem 269: 31012–31018.
31. Vu-Dac N, Schoonjans K, Kosykh V, Dallongeville J, Fruchart JC, et al. (1995)
Fibrates increase human apolipoprotein A-II expression through activation ofthe peroxisome proliferator-activated receptor. J Clin Invest 96: 741–750.
32. Lu Y, Feskens EJ, Dolle ME, Imholz S, Verschuren WM, et al. (2010) Dietary n-3 and n-6 polyunsaturated fatty acid intake interacts with FADS1 genetic
variation to affect total and HDL-cholesterol concentrations in the Doetinchem
Cohort Study. Am J Clin Nutr 92: 258–265.33. Stiegler P, Sausenthaler S, Buyken AE, Rzehak P, Czech D, et al. (2010) A new
FFQ designed to measure the intake of fatty acids and antioxidants in children.Public Health Nutr 13: 38–46.
34. Heinrich J, Bolte G, Holscher B, Douwes J, Lehmann I, et al. (2002) Allergensand endotoxin on mothers’ mattresses and total immunoglobulin E in cord
blood of neonates. Eur Respir J 20(3): 617–623.
35. von Berg A, Koletzko S, Grubl A, Filipiak-Pittroff B, Wichmann HE, et al.(2003) The effect of hydrolyzed cow’s milk formula for allergy prevention in the
first year of life: the German Infant Nutritional Intervention Study, arandomized double-blind trial. J Allergy Clin Immunol 111(3): 533–540.
36. von Berg A, Kramer U, Link E, Bollrath C, Heinrich J, et al. (2010) Impact of
early feeding on childhood eczema: development after nutritional interventioncompared with the natural course – the GINIplus study up to the age of 6 years.
Clin Exp Allergy 40(4): 627–636.37. Hartmann BM, Bell S, Vasquez-Caicedo AL, Gotz A, Erhardt J, et al. (2005)
Der Bundeslebensmittelschlussel. German Nutrient Data Base. Karlsruhe.38. Rzehak P, Heinrich J, Klopp N, Schaeffer L, Hoff S, et al. (2009) Evidence for
an association between genetic variants of the fatty acid desaturase 1 fatty acid
desaturase 2 (FADS1 FADS2) gene cluster and the fatty acid composition oferythrocyte membranes. Br J Nutr 101: 20–26.
39. Caspi A, Williams B, Kim-Cohen J, Craig IW, Milne BJ, et al. (2007)Moderation of breastfeeding effects on the IQ by genetic variation in fatty acid
metabolism. Proc Natl Acad Sci U S A 104: 18860–18865.
40. Willett WC, Howe GR, Kushi LH (1997) Adjustment for total energy intake inepidemiologic studies. Am J Clin Nutr 65: 1220S–1228S; discussion 1229S–
1231S.41. Nyholt DR (2004) A simple correction for multiple testing for single-nucleotide
polymorphisms in linkage disequilibrium with each other. Am J Hum Genet 74:765–769.
42. R Development Core Team (2011) R: A Language and Environment for
Statistical Computing. Vienna, Austria.
FADS Genes, PUFA and Lipids in Children
PLoS ONE | www.plosone.org 8 May 2012 | Volume 7 | Issue 5 | e37780

Paper 5: Supplementary Material
171


1
Figure S1
a) Total cholesterol
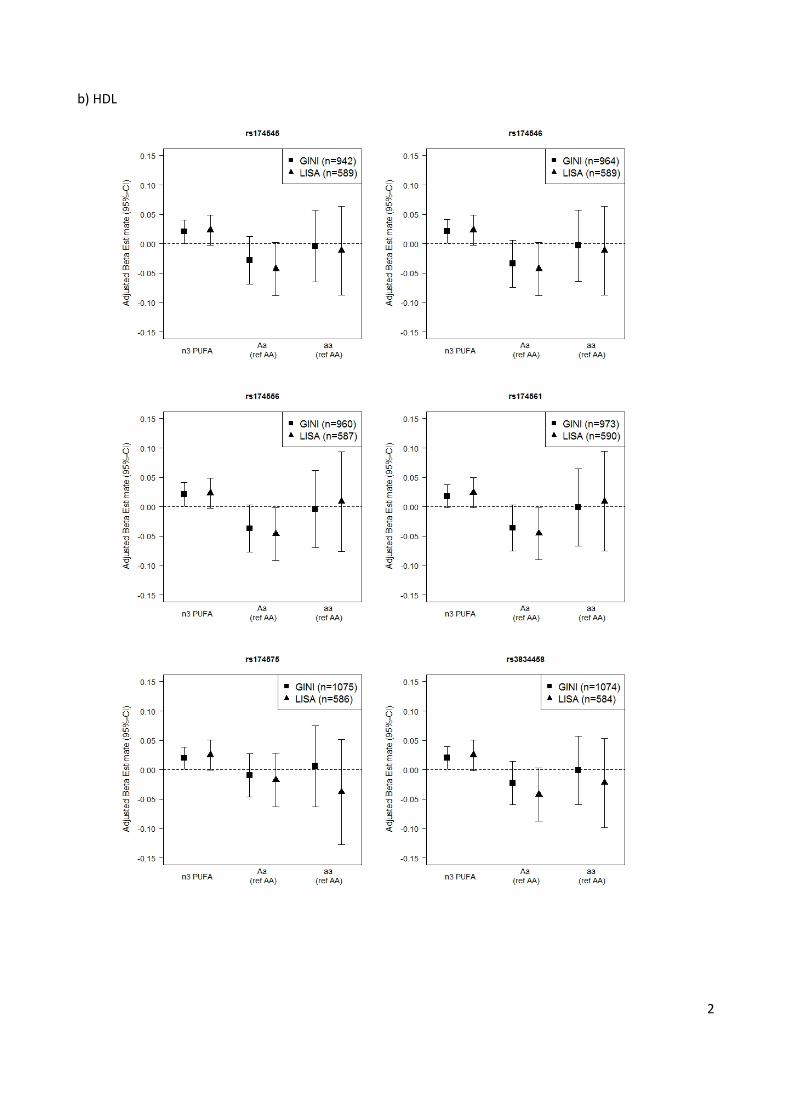
2
b) HDL

3
c) LDL

4
d) Triglycerides

1
Table S1
MR 95% CI p-value
rs174545 n=293 n-3 PUFA 0.97 (0.94, 1.01) 0.1573
Aa 1.02 (0.93, 1.11) 0.7443 aa 1.09 (0.93, 1.27) 0.2813 rs174546 n=296
n-3 PUFA 0.97 (0.93, 1.01) 0.1486 Aa 1.02 (0.94, 1.12) 0.6004 aa 1.05 (0.91, 1.23) 0.4927 rs174556 n=296
n-3 PUFA 0.97 (0.93, 1.01) 0.1429 Aa 1.02 (0.93, 1.12) 0.6167 aa 1.04 (0.88, 1.23) 0.6426 rs174561 n=298
n-3 PUFA 0.97 (0.93, 1.01) 0.1310 Aa 1.02 (0.93, 1.12) 0.6457 aa 1.04 (0.88, 1.23) 0.6504 rs174575 n=316
n-3 PUFA 0.97 (0.94, 1.01) 0.1342 Aa 0.99 (0.91, 1.08) 0.8606 aa 1.02 (0.86, 1.21) 0.7950 rs3834458 n=315
n-3 PUFA 0.97 (0.94, 1.01) 0.1331 Aa 1.03 (0.94, 1.12) 0.5267 aa 1.06 (0.92, 1.23) 0.4059
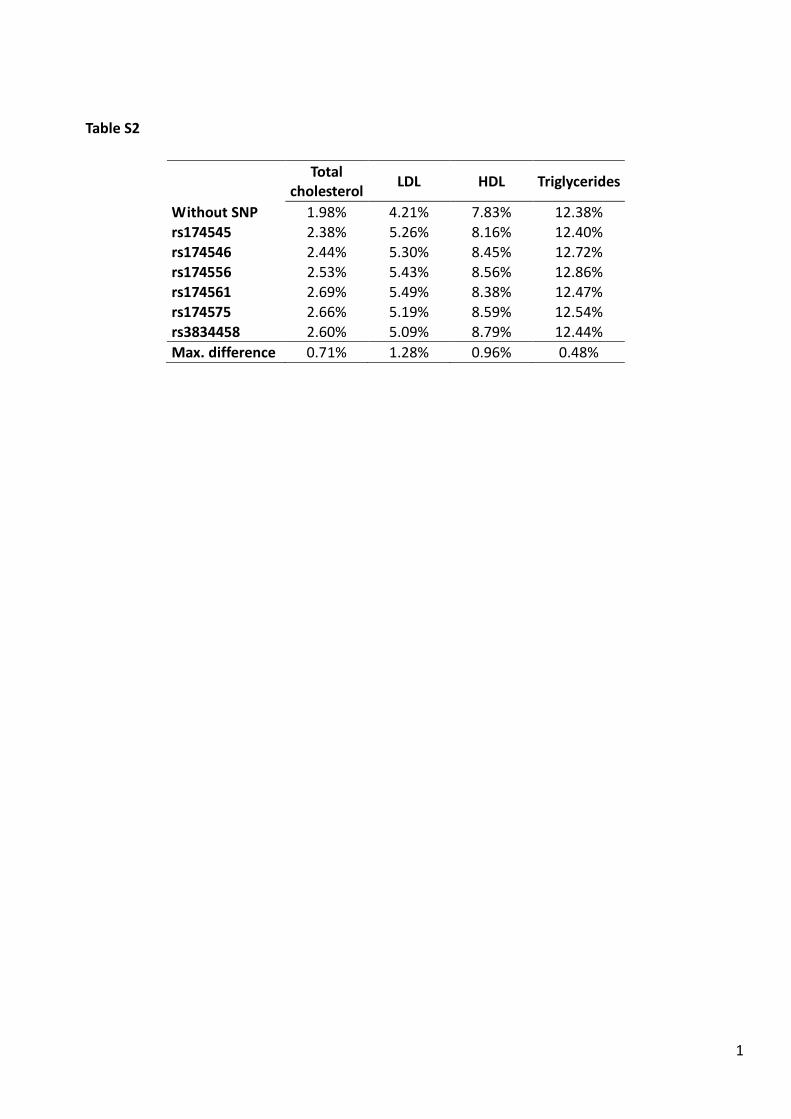
1
Table S2
Total
cholesterol LDL HDL Triglycerides
Without SNP 1.98% 4.21% 7.83% 12.38% rs174545 2.38% 5.26% 8.16% 12.40% rs174546 2.44% 5.30% 8.45% 12.72% rs174556 2.53% 5.43% 8.56% 12.86% rs174561 2.69% 5.49% 8.38% 12.47% rs174575 2.66% 5.19% 8.59% 12.54% rs3834458 2.60% 5.09% 8.79% 12.44% Max. difference 0.71% 1.28% 0.96% 0.48%
Acknowledgments
First, I thank Prof. Dr. Berthold Koletzko at the Dr. von Hauner Children's Hospital
at the Ludwig-Maximilians-University of Munich for the professional supervision of this
thesis.
I thank Prof. Dr. Dr. H.-Erich Wichmann, former Chair of Epidemiology, Insti-
tute of Medical Information Processing, Biometry and Epidemiology of the Ludwig-
Maximilians-University of Munich and former Director of the Institute of Epidemiology
I at the Helmholtz Zentrum München, German Research Center for Environmental
Health, for making this work possible.
Further I am grateful to Dr. Joachim Heinrich, acting director of the Institute of
Epidemiology I at the Helmholtz Zentrum München, German Research Center for
Environmental Health, for giving me the opportunity to join his research group and to
start this thesis, for his excellent advice, suggestions and comments.
I thank the GINIplus and LISAplus study groups and all families and participants of
these studies. In additon, I highly acknowledge the support and contribution of Dr.
Stefanie Sausenthaler and Dr. Eva Lattka.
Finally, I would like to express my gratitude to my colleagues who were supportive
during the realization of this work, for their constructive comments and patience.
179


Curriculum Vitae
Name Marie Sophie Standl
Date/Place of birth 26.02.1983 in Munich
Education
08/2009 � present Ludwigs-Maximilians-University, MunichPhD student Human Biology
08/2008 � 02/2009 Diploma Thesis at the Department of Statistics ofthe Ludwig-Maximilians-University Munich: `Semi-parametrische Regressionsmodelle mit �exibler Link-funktion'
10/2003 � 03/2009 Ludwigs-Maximilians-University, MunichDiploma (Univ.) in Statistics (1.7)
Work experience
08/2009 � present PhD student at Helmholtz Zentrum München, Ger-man Research Center for Environmental Health, In-stitute of Epidemiology I, Neuherberg
181


Publications
Publications included in this thesis
M Standl, S Sausenthaler, E Lattka, S Koletzko, C-P Bauer, H-E Wichmann, et al.
FADS gene variants modulate the e�ect of dietary fatty acid intake on allergic diseases
in children. Clin Exp Allergy, 2011, 41, 1757�1766.
M Standl, S Sausenthaler, E Lattka, S Koletzko, C-P Bauer, H-E Wichmann, et al.
FADS gene cluster modulates the e�ect of breastfeeding on asthma. Results from the
GINIplus and LISAplus studies. Allergy, 2012, 67, 83�90.
L Paternoster*, M Standl*, CM Chen, A Ramasamy, K Bønnelykke, L Duijts, et al.
Meta-analysis of genome-wide association studies identi�es three new risk loci for
atopic dermatitis. Nat Genet, 2012, 44, 187�192.
* These authors contributed equally to this work.
S Sausenthaler*, M Standl*, A Buyken, P Rzehak, S Koletzko, C-P Bauer, et al.
Regional and socio-economic di�erences in food, nutrient and supplement intake in
school-age children in Germany: results from the GINIplus and the LISAplus studies.
Public Health Nutr, 2011, 14, 1724�1735.
* These authors contributed equally to this work.
M Standl, E Lattka, B Stach, S Koletzko, C-P Bauer, A von Berg, et al. FADS1
FADS2 Gene Cluster, PUFA Intake and Blood Lipids in Children. Results from the
GINIplus and LISAplus Studies. PLoS ONE, 2012, 7, e37780.
Further publications
P Rzehak, C Thijs, M Standl, M Mommers, C Glaser, E Jansen, et al. Variants of the
FADS1 FADS2 gene cluster, blood levels of polyunsaturated fatty acids and eczema
in children within the �rst 2 years of life. PLoS ONE, 2010, 5, e13261.
G Kohlboeck, C Glaser, C Tiesler, H Demmelmair, M Standl, M Romanos, et al. E�ect
of fatty acid status in cord blood serum on children's behavioral di�culties at 10 y of
age: results from the LISAplus study. Am J Clin Nutr, 2011, 94, 1592�1599.
HR Taal, B St Pourcain, E Thiering, S Das, DO Mook-Kanamori, . . . , M Standl,
. . . , et al. Common variants at 12q15 and 12q24 are associated with infant head
circumference. Nat Genet, 2012, 44, 532�538.
183


Erklärung
Hiermit erkläre ich, Marie Standl, dass ich die vorliegende Dissertation selbstständig an-
gefertigt habe. Ich habe mich auÿer der angegebenen keiner weiterer Hilfsmittel bedient
und alle Erkenntnisse, die aus dem Schrifttum ganz oder annähernd übernommen sind
als solche kenntlich gemacht und nach ihrer Herkunft unter Bezeichnung der Fundstelle
einzeln nachgewiesen. Ich habe bisher noch keinen Promotionsversuch unternommen,
und die vorliegende Dissertation wurde nicht in gleicher oder ähnlicher Form bei einer
anderen Stelle zur Erlangung eines akademischen Grades eingereicht.
München, 10. 07. 2013
Marie Standl
185