faecal virome transplantation decrease symptoms of type-2 ... · 41 • obesity and type-2-diabetes...
TRANSCRIPT
Page 1 of 19
Faecal virome transplantation decrease symptoms of type-2-1
diabetes and obesity in a murine model 2
Torben Sølbeck Rasmussen1*, Caroline M. Junker Mentzel2, Witold Kot3, Josué L. Castro-3
Mejía1, Simone Zuffa4, Jonathan Swann4, Lars Hestbjerg Hansen3, Finn Kvist Vogensen1, 4
Axel Kornerup Hansen2*, Dennis Sandris Nielsen1* 5
Author affiliations 6
1 Section of Microbiology and Fermentation, Dept. of Food Science, University of Copenhagen, Frederiksberg, Denmark 7
2 Section of Experimental Animal Models, Dept. of Veterinary and Animal Sciences, University of Copenhagen, 8
Frederiksberg, Denmark 9
3 Section of Microbial Ecology and Biotechnology, Department of Plant and Environmental Sciences, University of 10
Copenhagen, Frederiksberg, Denmark 11
4 Department of Metabolism, Digestion and Reproduction, Faculty of Medicine, Imperial College, London, United 12
Kingdom 13
*Address correspondence to [email protected] (+45 35 33 32 87) / [email protected] (+45 35 32 80 73), Rolighedsvej 26 14
4th floor, 1958 Frederiksberg C, Denmark. 15
16
.CC-BY-ND 4.0 International licensenot certified by peer review) is the author/funder. It is made available under aThe copyright holder for this preprint (which wasthis version posted October 4, 2019. . https://doi.org/10.1101/792556doi: bioRxiv preprint

Page 2 of 19
ABSTRACT 17
Objective: Development of obesity and type-2-diabetes (T2D) are associated with gut microbiota 18
(GM) changes. The gut viral community is predominated by bacteriophages (phages), which are 19
viruses that attack bacteria in a host-specific manner. As a proof-of-concept we demonstrate the 20
efficacy of faecal virome transplantation (FVT) from lean donors for shifting the phenotype of obese 21
mice into closer resemblance of lean mice. 22
Design: The FVT consisted of viromes extracted from the caecal content of mice fed a low-fat (LF) 23
diet for fourteen weeks. Male C57BL/6NTac mice were divided into five groups: LF (as control), 24
high-fat diet (HF), HF+Ampicillin (Amp), HF+Amp+FVT and HF+FVT. At week six and seven of the 25
study the HF+FVT and HF+Amp+FVT mice were treated with FVT by oral gavage. The Amp 26
groups were treated with ampicillin 24 h prior to first FVT treatment. 27
Results: Six weeks after first FVT the HF+FVT mice showed a significant decrease in weight gain 28
compared to the HF group. Further, glucose tolerance was comparable between the lean LF and 29
HF+FVT mice, while the other HF groups all had impaired glucose tolerance. These observations 30
were supported by significant shifts in GM composition, blood plasma metabolome, and expression 31
levels of genes involved in obesity and T2D development. 32
Conclusions: Transfer of gut viral communities from mice with a lean phenotype into those with an 33
obese phenotype reduce weight gain and normalise blood glucose parameters relative to lean 34
mice. We hypothesise that this effect is mediated via FVT-induced GM changes. 35
36
Key words: Obesity; type-2-diabetes; gut virome; bacteriophages; gut microbiota; metabolomics 37
38
.CC-BY-ND 4.0 International licensenot certified by peer review) is the author/funder. It is made available under aThe copyright holder for this preprint (which wasthis version posted October 4, 2019. . https://doi.org/10.1101/792556doi: bioRxiv preprint
Page 3 of 19
Significance of this study 39
What is already known about this subject? 40
• Obesity and type-2-diabetes (T2D) are associated with gut microbiota (GM) dysbiosis. 41
• Faecal microbiota transplant from lean donors has previously shown potential in treating 42
obesity and T2D. 43
• Patients suffering from recurrent Clostridium difficile infections (rCDI) have been cured with 44
sterile filtered donor faeces (containing enteric viruses and no bacteria), here defined as 45
faecal virome transplantation (FVT). 46
What are the new findings? 47
• FVT from lean donors lead to decreased weight gain and normalised blood sugar tolerance 48
in a diet-induced obesity (DIO) mouse model. 49
• FVT significantly changed the bacterial and viral GM component, as well as the plasma 50
metabolome and the expression profiles of obesity and T2D associated genes. 51
• Initial treatment with ampicillin prior FVT seems to counteract the beneficial effects 52
associated with FVT. 53
How might it impact on clinical practice in the foreseeable future? 54
• We here show a proof-of-concept, providing a solid base for designing a clinical study of 55
FVT targeting obesity and T2D in humans. This is further augmented by the increased 56
safety related to FVT, since bacteria and other microorganisms are removed from the donor 57
faeces, and therefore minimises the risk of disease transmission. 58
• These findings highlight the potential application of FVT treatment of various diseases 59
related to GM dysbiosis and further support the vital role of the viral community in 60
maintaining and shaping the GM. 61
62
.CC-BY-ND 4.0 International licensenot certified by peer review) is the author/funder. It is made available under aThe copyright holder for this preprint (which wasthis version posted October 4, 2019. . https://doi.org/10.1101/792556doi: bioRxiv preprint

Page 4 of 19
INTRODUCTION 63
Obesity and type-2-diabetes (T2D) constitute a world-wide health threat[1]. During the last decade 64
it has become evident that certain diseases, including obesity and T2D, are associated with gut 65
microbiota (GM) dysbiosis[2]. Interestingly, germ free (GF) mice do not develop diet-induced-66
obesity (DIO)[3], but when exposed to faecal microbiota transplantation (FMT) from an obese 67
human donor they increase their body weight significantly more compared to GF mice exposed to 68
FMT from a lean donor[4]. At present FMT is widely used to efficiently treat recurrent Clostridium 69
difficile infections (rCDI)[5], and is suggested to have therapeutic potential against metabolic 70
syndrome, a condition related to obesity and T2D[6]. FMT is considered as a safe treatment, 71
however, safety issues remain since screening methods cannot fully prevent adverse effects 72
caused by disease transmission from the donor faeces[7]. A failure in the screening procedure 73
caused recently in a death (June 2019) of a patient following FMT[8] due to a bacterial infection. 74
The gut viral community (virome) is dominated by prokaryotic viruses[9], also called 75
bacteriophages (phages), which are viruses that attack bacteria in a host-specific manner[10]. 76
During recent years, evidence has mounted that the gut virome plays a key role in shaping the 77
composition of the GM[11,12] as well as influencing the host metabolome[13]. Interestingly, rCDI 78
have been successfully treated with a transfer of filtered donor faeces (containing phages, but no 79
intact bacterial cells)[14]. Five out of five patients were successfully treated[14]. This approach is 80
referred to as faecal virome transplantation (FVT). Further, antibiotic treatment alters the GM 81
composition, but Draper et al. 2019 recently showed that the murine GM can be reshaped with 82
FVT after antibiotic treatment[15]. 83
DIO mice is a common animal model of metabolic syndrome, including symptoms such as obesity 84
and insulin resistance/pre-T2D[16]. With C57BL/6NTac mice as the model, we hypothesised that 85
FVT (originating from lean healthy donor mice) treatment of DIO mice would change the GM 86
composition and directly or indirectly counteract the symptoms of obesity and T2D. To the best of 87
our knowledge, this is the first study investigating the effect of FVT targeting obesity and T2D. 88
89
.CC-BY-ND 4.0 International licensenot certified by peer review) is the author/funder. It is made available under aThe copyright holder for this preprint (which wasthis version posted October 4, 2019. . https://doi.org/10.1101/792556doi: bioRxiv preprint

Page 5 of 19
METHODS 90
Detailed methods are enclosed in the online supplementary materials. 91
Animal study design 92
Forty male C57BL/6NTac mice (Taconic Biosciences A/S, Lille Skensved, Denmark) were divided 93
into 5 groups at 5 weeks of age: low-fat diet (LF, as lean control), high-fat diet (HF), HF+Ampicillin 94
(Amp), HF+Amp+faecal virome transplantation (FVT) and HF+FVT (Figure 1). For thirteen weeks 95
mice were fed ad libitum a HF diet (Research Diets D12492, USA) or a LF diet (Research Diets 96
D12450J, USA). After six weeks on their respective diets, the HF+FVT and HF+Amp+FVT mice 97
were treated twice with 0.15 mL FVT by oral gavage with a one-week interval (week 6 and 7) 98
between the FVT. On the day before the first FVT inoculation the HF+Amp and HF+Amp+FVT 99
animals were treated with a single dose of ampicillin (1 g/L) in the drinking water. The FVT viromes 100
were extracted from the caecal content of eighteen mice fed a LF diet for 14 weeks, that were 101
earlier isolated, sequenced, and analysed[17]. 102
103
Figure 1: Experimental setup of the faecal virome transplantation (FVT). Forty male C57BL/6NTac mice (5 weeks old) 104 were divided into five groups: Low-fat diet (LF, as healthy control), High-fat diet (HF), HF+Ampicillin (Amp), 105 HF+Amp+FVT and HF+FVT. Their respective diets were provided continuously for 13 weeks until termination (18 weeks 106 old). The HF+FVT and HF+Amp+FVT mice were treated with FVT twice with one-week interval by oral gavage at week 6 107 and 7 of the study. Ampicillin was added once to the drinking water one day before first FVT (week 6) for HF+Amp and 108 HF+Amp+FVT. Mouse icon originates from https://smart.servier.com/ under the CC BY 3.0 license. 109
The titer of the FVT viromes was approximately 2 x 10¹⁰ Virus-Like-Particles/mL (FigureS1). The 110
mice were subjected to an oral glucose tolerance test (OGTT)[18] at week 12 of the study and food 111
intake and mouse weight was monitored. The study was approved by the Danish Competent 112
Authority, The Animal Experimentation Inspectorate, under the Ministry of Environment and Food 113
of Denmark, and performed under license No. 2017-15-0201-01262 C1-3. Procedures were carried 114
.CC-BY-ND 4.0 International licensenot certified by peer review) is the author/funder. It is made available under aThe copyright holder for this preprint (which wasthis version posted October 4, 2019. . https://doi.org/10.1101/792556doi: bioRxiv preprint
Page 6 of 19
out in accordance with the Directive 2010/63/EU and the Danish law LBK Nr 726 af 09/091993, 115
and housing conditions as earlier described[17]. Blood plasma, intestinal content from the cecum 116
and colon as well as tissue from the liver and ileum were sampled at termination at week 13 (18 117
weeks old). Mouse data (weight, OGTT levels, etc.) were analysed in GraphPad Prism using one-118
way ANOVA with Tukeys test. 119
Pre-processing of faecal samples 120
This study included in total 79 intestinal content samples, of which 40 were isolated from cecum 121
and 39 from colon. Pre-processing was performed as earlier described[17]. 122
Bacterial DNA extraction, sequencing, and pre-processing of raw data 123
Tag-encoded 16S rRNA gene amplicon sequencing was performed on an Illumina NextSeq using 124
v2 MID output 2x150 cycles chemistry (Illumina, CA, USA). DNA extraction and library building for 125
amplicon sequencing was performed in accordance with Krych et al.[19]. The average sequencing 126
depth (Accession: PRJEB32560, available at ENA) for the cecum 16S rRNA gene amplicons was 127
164,147 reads (min. 22,732 reads and max. 200,2003 reads) and 166,012 reads for colon (min. 128
89,528 reads and max. 207,924 reads) (TableS1). bOTU tables (bacterial-operational taxonomic 129
units) were generated and taxonomy assigned as earlier described[17]. Bacterial density of the 130
caecal and colon content was estimated by quantitative real-time polymerase chain reaction 131
(qPCR) as previously described[20], using the 16S rRNA gene primers (V3 region) also applied for 132
the amplicon sequencing[19]. 133
Viral DNA extraction, sequencing and pre-processing of raw data 134
The enteric viral community was purified, DNA extracted and the gut metavirome determined as 135
previously described[17]. The average sequencing depth (Accession: PRJEB32560, available at 136
ENA) for the cecum viral metagenome was 612,640 reads/sample (min. 277,582 reads and max. 137
1,219,178 reads) and 356,976 reads/sample for colon (min. 33,773 reads and max. 584,681 reads) 138
(TableS1). For each sample, reads were treated with Trimmomatic[21] and Usearch[22] and 139
subjected to within-sample de novo assembly with MetaSpades v.3.5.0[23,24]. Viral contigs were 140
identified with Kraken2[25], VirFinder[26], PHASTER[27], and virus orthologous proteins 141
(www.vogdb.org). Contaminations of non-viral contigs like bacteria, human, mice, and plant DNA 142
were removed (FigureS2). The remaining contigs constituted the vOTU (viral-operational 143
taxonomic unit) table. 144
Gene expression assay 145
Genes investigated for expression analysis were selected based on relevant pathways for each 146
tissue. For the liver, genes involved in metabolic pathways (triglyceride, carbohydrate, bile and 147
.CC-BY-ND 4.0 International licensenot certified by peer review) is the author/funder. It is made available under aThe copyright holder for this preprint (which wasthis version posted October 4, 2019. . https://doi.org/10.1101/792556doi: bioRxiv preprint

Page 7 of 19
cholesterol metabolism) and inflammation were selected. For the ileum, genes involved in 148
inflammation, gut microbiota signalling and gut barrier function were selected [28,29]. Primer 149
sequences are listed in Table S2. qPCR was performed using the Biomark HD system (Fluidigm 150
Corporation) on 2x 96.96 IFC chips on pre-amplified cDNA duplicates following the instructions of 151
the manufacturer with minor adjustments as previously described[30]. Gene expression data was 152
analysed in R using linear models (one-way ANOVA) with either HF or LF as control groups. 153
Blood plasma metabolome analysis 154
Plasma samples were prepared for ultra-performance liquid chromatography mass spectrometry 155
(UPLC-MS) analysis according to a previously published protocol[31]. Principal component 156
analysis (PCA) and orthogonal projection to latent structures-discriminant analysis (OPLS-DA) 157
models were built on the plasma metabolic profiles to identify biochemical variation between the 158
groups. Among the features driving the different OPLS-DA models, only those with variable 159
importance in the projection (VIP) scores > 2 were further investigated. Putative annotation was 160
achieved through searching for the m/z values in online databases such as HMDB 161
(http://www.hmdb.ca), METLIN (http://metlin.scripps.edu) and Lipidmaps 162
(http://www.lipidmaps.org). Additionally, fragmentation patterns derived from MSe experiment were 163
compared to online spectra when available. 164
Bioinformatic analysis of bacterial and viral DNA 165
Prior to any analysis the raw read counts in vOTU-tables were normalised by reads per kilo base 166
per million mapped reads (RPKM)[32]. b- and vOTU’s that were detected in less than 8% of the 167
samples were discarded to reduce noise while still maintaining an average total abundance close 168
to 98%. ANOSIM and Kruskal Wallis was used to evaluate multiple group comparisons. 169
Regularised Canonical Correlation Analysis (rCCA) was performed with mixOmics v. 6.8.0. R-170
package[33] to predict correlations between bacterial and viral taxa. Only vOTUs ≥ 5000 bp were 171
included in the rCCA. The machine learning algorithm random forest[34] was applied to select 172
variables explaining the dataset and normalised in range of -1:1 ((x-mean)/max(abs(x-mean)) and 173
visualised by Heatmap3[35]. 174
RESULTS 175
Here we investigated the potential of faecal virome transplantation (FVT) to shift the phenotype of 176
obesity and T2D in DIO male C57BL/6NTac mice towards a lean mice phenotype. Intestinal 177
contents from the cecum and colon were isolated, but here only results from the cecum samples 178
are be reported. Complete equivalent analysis of colon samples can be found in Figure S10. 179
.CC-BY-ND 4.0 International licensenot certified by peer review) is the author/funder. It is made available under aThe copyright holder for this preprint (which wasthis version posted October 4, 2019. . https://doi.org/10.1101/792556doi: bioRxiv preprint

Page 8 of 19
FVT from lean donor decreases weight gain and normalises blood glucose tolerance 180
in DIO mice 181
Mice were weighed pre and post FVT with 1-2 weeks of interval. At both 4- and 6-weeks post first 182
FVT (15 and 17 weeks old) a significantly lower body weight gain was observed in the HF+FVT (p 183
< 0.017) and the HF+Amp mice (p < 0.006) compared to the HF mice (Figure 2a). Intriguingly, 184
OGTT showed no significant differences (p > 0.842) between the LF and the HF+FVT mice, while 185
the OGTT level of the HF mice was significantly increased (p < 0.0001) compared to both the LF 186
and HF+FVT group suggesting that FVT had normalised the blood glucose tolerance in the 187
HF+FVT mice (Figure 2b). Furthermore, the OGTT of HF+Amp+FVT was comparable to the HF 188
mice (p > 0.999), indicating that the initial disruption of the bacterial composition by the ampicillin 189
treatment had counteracted the effect of the FVT in the HF+Amp+FVT mice. Which simultaneously 190
suggest that the effects associated to the FVT occurs via alterations in the GM component. Non-191
fasted blood glucose was measured regularly in addition to HbA1c levels and food consumption pr. 192
cage (FigureS4). 193
194
Figure 2: a) Bar plot of body weight gain measured at 2, 4, and 6 weeks (13, 15, 17 weeks old respectively) post first 195 faecal virome transplantation (FVT). b) Oral glucose tolerance test (OGTT) levels measured 6 weeks post first FVT (17 196 weeks old). Values are based on the total area under curve (tAUC) relatively to the blood glucose levels of the individual 197 mouse. Significant differences of the pairwise comparison at week 4 and 6 post first FVT was excluded in the figures to 198 increase the visualisation. HF = high-fat, LF = low-fat, Amp = ampicillin, ns = not significant. * = p < 0.05, ** = p < 0.006, 199 *** = p < 0.0005, **** = p < 0.0001. 200
201
.CC-BY-ND 4.0 International licensenot certified by peer review) is the author/funder. It is made available under aThe copyright holder for this preprint (which wasthis version posted October 4, 2019. . https://doi.org/10.1101/792556doi: bioRxiv preprint

Page 9 of 19
FVT enhances the expression of genes involved in whole-body and energy 202
homeostasis 203
Gene expression panels were designed to target genes relevant for obesity and T2D in liver and 204
ileum tissue to measure if the expression of these genes in the HF+FVT mice were significantly 205
different to the HF mice, while being comparable to the LF mice. These conditions were 206
represented by several genes involved in whole-body and energy homeostasis (Figure 3). Gene 207
expression analysis suggested that the FVT had blunted the differences in gene expression 208
caused by the HF diet resulting in an expression profile closer resembling that of the healthy LF 209
mice. The expression levels of LeprLiver, Ffar2Ileum, KlbLiver, Ppargc1aLiver, and Igfbp2 Liver were 210
significantly increased in the HF+FVT compared to the HF mice, whereas Socs3Liver and MycLiver 211
were significantly decreased (Figure 3). Generally, the gene expression levels (except Socs3Liver) in 212
the HF+FVT mice fell between the levels observed in the LF and HF mice. Significant differences 213
(p < 0.05) were observed in the expression of several other genes (57 of 74 for liver tissue and 58 214
of 74 for ileum tissue) between the experimental groups (see TableS3 for complete list). 215
216
Figure 3: Gene expression levels at termination (18 weeks old) of a) LeprLiver (leptin cytokine receptors), b) Ffar2Ileum (free 217 fatty acid receptor), c) KlbLiver (Beta-klotho), d) Ppargc1aLiver (Peroxisome proliferator-activated receptor gamma 218 coactivator 1-alpha), e) Igfbp2 Liver(insulin like growth factor binding protein), f) Socs3Liver (suppressor of cytokine 219 signalling), and g) MycLiver (transcription factor). Linear models (one-way ANOVA) with either HF or LF as control groups 220 was performed to calculate group significance. The log2 fold change is a measure of the relative gene expression and is 221 based on log2 transformed expression values normalised to the sample with the lowest value. HF = high-fat, LF = low-222 fat, Amp = ampicillin, FVT = faecal virome transplantation. 223
224
.CC-BY-ND 4.0 International licensenot certified by peer review) is the author/funder. It is made available under aThe copyright holder for this preprint (which wasthis version posted October 4, 2019. . https://doi.org/10.1101/792556doi: bioRxiv preprint

Page 10 of 19
FVT-mediated shift in the gut microbiota component 225
At termination the number of 16S rRNA gene copies/g of the cecum samples varied from 1.46 x 226
1010 – 2.70 x 10¹⁰ (FigureS3). The bacterial Shannon diversity index of the LF mice was 227
significantly higher than the HF mice (p < 0.005) but similar to the HF+FVT mice (p = 0.816). The 228
ampicillin-treated HF+Amp mice had the lowest Shannon diversity index of all groups at 229
termination (i.e. 7 weeks after treatment with ampicillin) – and FVT increased the Shannon 230
diversity index of ampicillin treated HF+Amp+FVT mice (p < 0.016) (Figure 4a). The FVT had no 231
significant (p > 0.09) impact on the viral Shannon index, whereas the ampicillin treatment 232
significantly (p < 0.0003) increased the viral Shannon index (Figure 4b), possibly due to induction 233
of prophages (FigureS6).234
235
Figure 4: Shannon index of the caecal a) bacterial and b) viral community at termination (18 weeks old). The 236 parentheses show the number of samples from each group included in the plot and grey dots indicate outliers. HF = 237 high-fat, LF = low-fat, Amp = ampicillin, FVT = faecal virome transplantation, ns = not significant. * = p < 0.05, ** = p < 238 0.0051. 239
The FVT strongly influenced both the bacterial (Figure 5a, p < 0.003) and viral (Figure 5b, p < 240
0.001) composition as determined by the Bray-Curtis dissimilarity-metric, as illustrated by a clear 241
separation of the HF+FVT compared with the HF mice and HF+Amp+FVT with the HF+Amp mice. 242
Further, all experimental groups were pairwise significantly separated (p < 0.003) in both the viral 243
and bacterial community (TableS4), including LF vs. HF+FVT (p < 0.001). Overall, our findings 244
suggest that FVT strongly influenced and partly reshape the GM composition both with and without 245
ampicillin treatment. 246
247
.CC-BY-ND 4.0 International licensenot certified by peer review) is the author/funder. It is made available under aThe copyright holder for this preprint (which wasthis version posted October 4, 2019. . https://doi.org/10.1101/792556doi: bioRxiv preprint

Page 11 of 19
248
Figure 5: Bray Curtis dissimilarity metric PCoA based plots of a) the caecal bacterial community and b) viral community 249 at termination (18 weeks old). Tables include ANOSIM of the Bray Curtis dissimilarity to show the effect of the faecal 250 virome transplantation (FVT) on the gut microbiota (GM) composition. HF = high-fat, LF = low-fat, Amp = ampicillin. 251
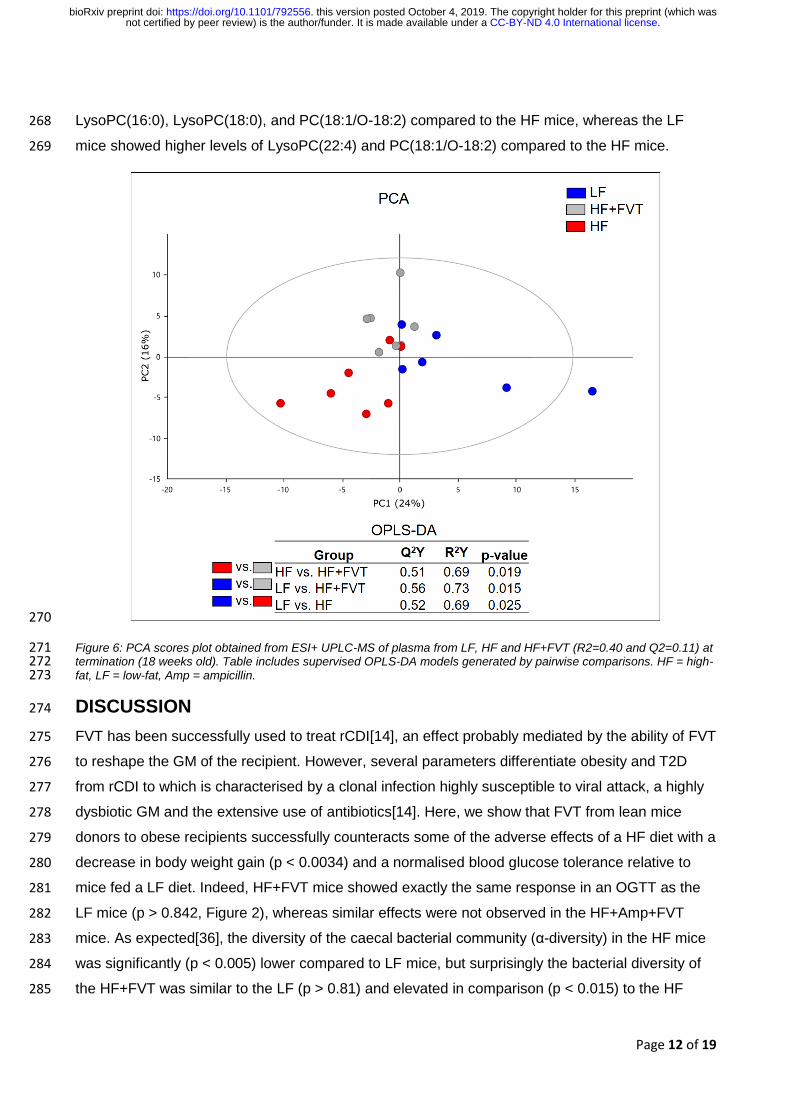
FVT-mediated shift in the blood plasma metabolome profile 252
The influence of FVT on host metabolome was determined by untargeted UPLC-MS analysis of 253
plasma samples. A PCA model was built on a refined dataset comparing LF, HF and HF+FVT 254
profiles (Figure 6 and FigureS5 for all groups). Consistent with the other measures, the plasma 255
profiles of HF+FVT mice were positioned between the HF and LF mice. Pairwise OPLS-DA models 256
were constructed and all the models (LF vs. HF, LF vs. HF+FVT, HF vs. HF+FVT) were significant 257
(p < 0.025), supporting the separation of the three groups. Among the selected features with a VIP 258
score > 2, only those correlating with relevant gene expression (based on rCCA), bacterial or viral 259
abundance were further investigated for annotation. These features investigated consisted mainly 260
of saturated and unsaturated lyso-phosphatidylcholine (LysoPC) and/or phosphatidylcholines 261
(PCs), whereas the remaining features consisted of varieties of amino acids or unidentifiable 262
metabolites (Table S5). Overall the HF mice had higher levels of LysoPC(18:2), LysoPC(22:2), and 263
PC(16:0/22:6) than the LF mice which on the other hand had higher plasma levels of LysoPC(22:4) 264
and PC(18:1/O-18:2). The HF+FVT mice had increased levels of circulating LysoPC(16:0), 265
LysoPC(18:2), and PC(16:0/22:6) compared to the LF mice while the levels of LysoPC(22:4) and 266
PC(18:1/O-18:2) were decreased. Further, the HF+FVT mice appeared with higher levels of 267
.CC-BY-ND 4.0 International licensenot certified by peer review) is the author/funder. It is made available under aThe copyright holder for this preprint (which wasthis version posted October 4, 2019. . https://doi.org/10.1101/792556doi: bioRxiv preprint
Page 12 of 19
LysoPC(16:0), LysoPC(18:0), and PC(18:1/O-18:2) compared to the HF mice, whereas the LF 268
mice showed higher levels of LysoPC(22:4) and PC(18:1/O-18:2) compared to the HF mice. 269
270
Figure 6: PCA scores plot obtained from ESI+ UPLC-MS of plasma from LF, HF and HF+FVT (R2=0.40 and Q2=0.11) at 271 termination (18 weeks old). Table includes supervised OPLS-DA models generated by pairwise comparisons. HF = high-272 fat, LF = low-fat, Amp = ampicillin. 273
DISCUSSION 274
FVT has been successfully used to treat rCDI[14], an effect probably mediated by the ability of FVT 275
to reshape the GM of the recipient. However, several parameters differentiate obesity and T2D 276
from rCDI to which is characterised by a clonal infection highly susceptible to viral attack, a highly 277
dysbiotic GM and the extensive use of antibiotics[14]. Here, we show that FVT from lean mice 278
donors to obese recipients successfully counteracts some of the adverse effects of a HF diet with a 279
decrease in body weight gain (p < 0.0034) and a normalised blood glucose tolerance relative to 280
mice fed a LF diet. Indeed, HF+FVT mice showed exactly the same response in an OGTT as the 281
LF mice (p > 0.842, Figure 2), whereas similar effects were not observed in the HF+Amp+FVT 282
mice. As expected[36], the diversity of the caecal bacterial community (α-diversity) in the HF mice 283
was significantly (p < 0.005) lower compared to LF mice, but surprisingly the bacterial diversity of 284
the HF+FVT was similar to the LF (p > 0.81) and elevated in comparison (p < 0.015) to the HF 285
.CC-BY-ND 4.0 International licensenot certified by peer review) is the author/funder. It is made available under aThe copyright holder for this preprint (which wasthis version posted October 4, 2019. . https://doi.org/10.1101/792556doi: bioRxiv preprint
Page 13 of 19
mice. No significant viral diversity differences were observed between LF vs. HF, LF vs. HF+FVT, 286
and HF vs. HF+FVT. The significantly increased (p < 0.003) diversity of the viral community in the 287
ampicillin treated mice (Figure 4b) was likely due to induction of prophages[37], as indicated by an 288
increased (p < 0.05) presence of viral contigs containing integrase genes in the ampicillin treated 289
groups (FigureS6). The composition of the viral community was dominated by order Caudovirales 290
and family Microviridae viruses, which is in accordance with former studies investigating the enteric 291
viral community in mammals[9,12]. The FVT strongly influenced both the bacterial and viral GM 292
composition (Figure 5), with HF+FVT being significantly (p < 0.003) different from both the HF as 293
well as the LF mice. The highly diverse donor virome[17] as well as the distinct nutrition profiles 294
(HF-diet vs. LF-diet) most likely explain the divergence in the GM composition profiles between the 295
HF+FVT and the LF mice. 296
Gene expression analysis of obesity and T2D associated genes in liver and ileum showed that 297
seven relevant genes (Figure 3) were differentially expressed (p < 0.05) between HF+FVT and HF 298
mice. The Ffar2 gene is involved in energy homeostasis and can influence glucose homeostasis 299
through GLP-1 regulation and leptin production[38,39], which might lower food intake and via GLP-300
1 decrease blood glucose levels by enhancing the production of insulin[38]. The Ffar2 gene may 301
also influence whole-body homeostasis through regulation of adipogenesis and lipid storage of 302
adipocytes[40]. The expression of Ffar2Ileum was comparable between LF and HF+FVT while in the 303
HF mice expression was clearly reduced (Figure 3a). The Lepr genes are involved in the regulation 304
of food intake, and Lepr deficient subjects rapidly increase body weight[41]. Klb contributes to the 305
repression of cholesterol 7-alpha-hydroxylase and thereby regulate bile acid synthesis[42] with 306
reduced expression in obese subjects[43]. Ppargc1a expression has been reported to be reduced 307
and linked with islet insulin secretion in T2D patients[44], as well as playing a pivotal role in 308
regulating energy homeostasis[45]. Igfbp2 is involved in the insulin-like growth factor-axis 309
influencing cell growth and proliferation[46] and high expression levels have been linked to the 310
protection against T2D in human studies[47]. The gene expression of LeprLiver (Figure3b), KlbLiver 311
(Figure3c), Ppargc1aLiver (Figure3d), and Igfbp2Liver (Figure3e) were all significantly increased in the 312
LF and HF+FVT mice compared to the HF mice. Knock-out of Socs genes have been reported to 313
prevent insulin resistance in obesity as the result of a decrease in ceramide synthesis[48]. The 314
Socs3Liver levels were significantly (p < 0.0001) decreased in HF+FVT compared to both HF and LF 315
mice (Figure 3f). However, the overall Socs3Liver levels in the LF mice was affected by high inter-316
group variation. The expression of Myc has been found to be increased in mice provided HF diet, 317
and a decrease in bodyweight was obtained with haploin-sufficient mice (c-Myc+/-)[49]. The 318
expression of MycLiver was comparable between LF and HF+FVT while in the HF mice expression 319
was clearly increased (Figure 3g). Overall, these findings indicate that FVT treatment affects the 320
.CC-BY-ND 4.0 International licensenot certified by peer review) is the author/funder. It is made available under aThe copyright holder for this preprint (which wasthis version posted October 4, 2019. . https://doi.org/10.1101/792556doi: bioRxiv preprint

Page 14 of 19
expression of genes involved in stimulating appetite, blood glucose tolerance, and whole-body and 321
energy homeostasis. 322
An extensive study of metabolic syndrome in humans, showed strong correlations between certain 323
blood plasma metabolites and the GM component[50], and some of these correlations appear 324
specific to the pre-diabetic state[50]. Furthermore, blood plasma metabolome seem to predict the 325
GM diversity[51]. The blood plasma metabolome profile of the HF+FVT mice differed significantly 326
(p < 0.025) from both the LF and HF mice. SCFAs are expected to regulate the Ffar2 gene[52] but 327
our feature annotation did not detect any clear differences in circulating SCFAs between treatment 328
groups. Further, LysoPCs are reduced in obesity and T2D[53], and we indeed observed a 329
decrease in LysoPCs levels when comparing the HF with HF+FVT group and HF with the LF 330
group, although the results were not clear. The beneficial effects associated to FVT were knocked 331
down by the ampicillin treatment (except for weight gain), which was also reduced in the HF+Amp 332
relative to HF, but the FVT consistently reshaped the GM composition profile in the HF+Amp+FVT 333
mice as well. 334
Regularized Canonical Correlation Analysis (rCCA) suggested potential host-phage pair relations 335
by strong (r > 0.75) positive and negative correlations between certain bacterial (order 336
Bacteroidales, Clostridiales) and viral (order Caudovirales, family Microviridae and uncharacterised 337
viruses) taxa. Likewise, random forest selected variables showed bacterial and viral co-abundance 338
profiles that differentiated the five experimental groups (Figure 7) supporting the effect of the FVT 339
on the GM component. 340
341
Figure 7: Heatmaps illustrating the bacterial a) and viral b) profile of all five experimental groups, as well as strong 342 correlations between certain clusters of bacteria and viruses c). Detailed information and high-resolution images can be 343 found as supplemental materials in Figure S7 and S8. 344
.CC-BY-ND 4.0 International licensenot certified by peer review) is the author/funder. It is made available under aThe copyright holder for this preprint (which wasthis version posted October 4, 2019. . https://doi.org/10.1101/792556doi: bioRxiv preprint

Page 15 of 19
Zuo et al.[54] investigated how the phage community could be related to the effect of FMT against 345
rCDI and found that a few patients did not respond on the treatment. The common denominator of 346
the patients that did respond on the FMT treatment was that the Caudovirales richness in the 347
donor faeces was higher than the Caudovirales richness in the recipient, whereas most of the non-348
responder recipients had a higher Caudovirales richness than the donor. Based on these findings, 349
Zuo et al. hypothesised that a higher Caudovirales richness in the donor compared to the recipient 350
is important for a successful FMT treatment[54]. The Caudovirales richness of the FVT donor 351
virome in our study (faecal virome from mice purchased at three different vendors[17]) was higher 352
than any of the recipient groups at termination (FigureS9). Whereas the Caudovirales richness of 353
the viromes from the individual mouse vendors were notably less compared to the FVT virome and 354
both recipient groups. Although further studies are needed, these findings are consistent with those 355
of Zuo et al. and suggests that a virome from a single vendor/donor might not have the same effect 356
as when multiple viromes are combined for FVT. 357
We expect that phages transferred with the FVT in the HF+FVT mice have reshaped the GM 358
component and thereby shifted the phenotype of the obese HF mice to be in closer resemblance of 359
the lean LF mice. This hypothesis seems plausible since several recent studies have reported a 360
correlation between phage diversity and intestinal microbiome diversity[12], a FVT-mediated 361
restoration of the GM of antibiotic treated mice[15], and a phage-mediated shift in the gut 362
metabolome profile[13]. 363
In conclusion, we here demonstrate the use of FVT targeting obesity and T2D in an animal model. 364
Although the study is a proof-of-concept, our findings highlight the potential of using phage-365
mediated therapy against obesity and T2D[6] that represents a world-wide health threat[1]. 366
Acknowledgement 367
Thanks to Julie Mou Larsen for assisting with sampling of mouse tissue and associated method 368
description. In addition, we thank Helene Farlov, Mette Nelander at Section of Experimental Animal 369
Models and Liv de Vries at Section for Microbiology and Fermentation (University of Copenhagen, 370
Denmark) for taking care of the animals. We thank Helle Keinicke and Marina Kjærgaard 371
Gerstenberg for selecting the genes and providing the primers for the liver gene expression panel. 372
Contributors 373
T.S.R., C.M.M., A.K.H., D.S.N, and F.K.V. conceived the research idea and designed the study; 374
C.M.M. and T.S.R. performed the animal experiments; T.S.R., C.M.M., and S.Z. processed the 375
samples in the laboratory; T.S.R., C.M.M., L.H.H., W.K., D.S.N, J.S., S.Z., J.C.M., and F.K.V 376
performed data analysis; T.S.R. and D.S.N was responsible for the first and final draft of the 377
.CC-BY-ND 4.0 International licensenot certified by peer review) is the author/funder. It is made available under aThe copyright holder for this preprint (which wasthis version posted October 4, 2019. . https://doi.org/10.1101/792556doi: bioRxiv preprint

Page 16 of 19
manuscript, as well as all requested revisions. All authors critically revised and approved the final 378
version of the manuscript. 379
Competing interests 380
All authors declare no conflicts of interest. 381
Funding 382
Funding was provided by the Danish Council for Independent Research with grant ID: DFF-6111-383
00316 (PhageGut) and the Danish Innovation Fund project - 7076-00129B, MICROHEALTH. 384
References 385
1 Leitner DR, Frühbeck G, Yumuk V, et al. Obesity and type 2 diabetes: Two diseases with a 386 need for combined treatment strategies - EASO can lead the way. Obes Facts 387 2017;10:483–92. doi:10.1159/000480525 388
2 Maruvada P, Leone V, Kaplan LM, et al. The Human Microbiome and Obesity: Moving 389 beyond Associations. Cell Host Microbe 2017;22:589–99. doi:10.1016/j.chom.2017.10.005 390
3 Cho I, Yamanishi S, Cox L, et al. Antibiotics in early life alter the murine colonic microbiome 391 and adiposity. Nature 2012;488:621–6. doi:10.1038/nature11400 392
4 Ridaura VK, Faith JJ, Rey FE, et al. Gut microbiota from twins discordant for obesity 393 modulate metabolism in mice. Science (80- ) 2013;341:1241214. 394 doi:10.1126/science.1241214 395
5 Kelly CR, Kahn S, Kashyap P, et al. Update on Fecal Microbiota Transplantation 2015: 396 Indications, Methodologies, Mechanisms, and Outlook. Gastroenterology 2015;149:223–37. 397 doi:10.1053/j.gastro.2015.05.008 398
6 Gupta S, Allen-vercoe E, Petrof EO. Fecal microbiota transplantation : in perspective. 399 Therap Adv Gastroenterol 2016;9:229–39. doi:10.1177/1756283X15607414 400
7 Wang JYJWJYJW, Kuo CH, Kuo FC, et al. Fecal microbiota transplantation: Review and 401 update. J Formos Med Assoc 2019;118:S23–31. doi:10.1016/j.jfma.2018.08.011 402
8 FDA. FDA - Important Safety Alert Regarding Use of Fecal Microbiota for Transplantation 403 and Risk of Serious Adverse Reactions Due to Transmission of Multi-Drug Resistant 404 Organisms. 2019.https://www.fda.gov/vaccines-blood-biologics/safety-availability-405 biologics/important-safety-alert-regarding-use-fecal-microbiota-transplantation-and-risk-406 serious-adverse (accessed 4 Jul 2019). 407
9 Reyes A, Haynes M, Hanson N, et al. Viruses in the faecal microbiota of monozygotic twins 408 and their mothers. Nature 2011;466:334–8. doi:10.1038/nature09199 409
10 Ross A, Ward S, Hyman P. More Is Better : Selecting for Broad Host Range 410 Bacteriophages. 2016;7:1–6. doi:10.3389/fmicb.2016.01352 411
11 Howe A, Ringus DL, Williams RJ, et al. Divergent responses of viral and bacterial 412 communities in the gut microbiome to dietary disturbances in mice. ISME J 2016;10:1217–413 27. doi:10.1038/ismej.2015.183 414
12 Moreno-Gallego JL, Chou SP, Di Rienzi SC, et al. Virome Diversity Correlates with Intestinal 415
.CC-BY-ND 4.0 International licensenot certified by peer review) is the author/funder. It is made available under aThe copyright holder for this preprint (which wasthis version posted October 4, 2019. . https://doi.org/10.1101/792556doi: bioRxiv preprint

Page 17 of 19
Microbiome Diversity in Adult Monozygotic Twins. Cell Host Microbe 2019;25:261-272.e5. 416 doi:10.1016/j.chom.2019.01.019 417
13 Hsu BB, Gibson TE, Yeliseyev V, et al. Dynamic Modulation of the Gut Microbiota and 418 Metabolome by Bacteriophages in a Mouse Model. Cell Host Microbe 2019;25:803-814.e5. 419 doi:10.1016/j.chom.2019.05.001 420
14 Ott SJ, Waetzig GH, Rehman A, et al. Efficacy of Sterile Fecal Filtrate Transfer for Treating 421 Patients With Clostridium difficile Infection. Gastroenterology 2017;152:799–811. 422 doi:10.1053/j.gastro.2016.11.010 423
15 Draper LA, Ryan FJ, Dalmasso M, et al. Autochthonous faecal virome transplantation (FVT) 424 reshapes the murine microbiome after antibiotic perturbation. bioRxiv 2019;:591099. 425 doi:10.1101/591099 426
16 Fraulob JC, Ogg-Diamantino R, Fernandes-Santos C, et al. A Mouse Model of Metabolic 427 Syndrome: Insulin Resistance, Fatty Liver and Non-Alcoholic Fatty Pancreas Disease 428 (NAFPD) in C57BL/6 Mice Fed a High Fat Diet. J Clin Biochem Nutr 2010;46:212–23. 429 doi:10.3164/jcbn.09-83 430
17 Rasmussen TS, de Vries L, Kot W, et al. Mouse Vendor Influence on the Bacterial and Viral 431 Gut Composition Exceeds the Effect of Diet. Viruses 2019;11:435. doi:10.3390/v11050435 432
18 Rune I, Rolin B, Lykkesfeldt J, et al. Long-term Western diet fed apolipoprotein E-deficient 433 rats exhibit only modest early atherosclerotic characteristics. Sci Rep 2018;8:1–12. 434 doi:10.1038/s41598-018-23835-z 435
19 Krych Ł, Kot W, Bendtsen KMB, et al. Have you tried spermine ? A rapid and cost-e ff ective 436 method to eliminate dextran sodium sulfate inhibition of PCR and RT-PCR. J Microbiol 437 Methods J 2018;144:1–7. doi:10.1016/j.mimet.2017.10.015 438
20 Ellekilde M, Krych L, Hansen CHFHF, et al. Characterization of the gut microbiota in leptin 439 deficient obese mice - Correlation to inflammatory and diabetic parameters. Res Vet Sci 440 2014;96:241–50. doi:10.1016/j.rvsc.2014.01.007 441
21 Bolger AM, Lohse M, Usadel B. Trimmomatic: A flexible trimmer for Illumina sequence data. 442 Bioinformatics 2014;30:2114–20. doi:10.1093/bioinformatics/btu170 443
22 Edgar RC. UPARSE: highly accurate OTU sequences from microbial amplicon reads. Nat 444 Methods 2013;10:996–8. doi:10.1038/nmeth.2604 445
23 Bankevich A, Nurk S, Antipov D, et al. SPAdes: A new genome assembly algorithm and its 446 applications to single-cell sequencing. J Comput Biol 2012;19:455–77. 447 doi:10.1089/cmb.2012.0021 448
24 Nurk S, Meleshko D, Korobeynikov A, et al. metaSPAdes: a new versatile metagenomic 449 assembler. Genome Res 2017;27:824–34. doi:10.1101/gr.213959.116 450
25 Wood DE, Salzberg SL. Kraken: ultrafast metagenomic sequence classification using exact 451 alignments. Genome Biol 2014;15:R46. doi:10.1186/gb-2014-15-3-r46 452
26 Ren J, Ahlgren NA, Lu YY, et al. VirFinder: a novel k-mer based tool for identifying viral 453 sequences from assembled metagenomic data. Microbiome 2017;5:69. doi:10.1186/s40168-454 017-0283-5 455
27 Arndt D, Grant JR, Marcu A, et al. PHASTER: a better, faster version of the PHAST phage 456 search tool. Nucleic Acids Res 2016;44:1–6. doi:10.1093/nar/gkw387 457
.CC-BY-ND 4.0 International licensenot certified by peer review) is the author/funder. It is made available under aThe copyright holder for this preprint (which wasthis version posted October 4, 2019. . https://doi.org/10.1101/792556doi: bioRxiv preprint
Page 18 of 19
28 Bendtsen KM, Hansen CHF, Krych Ł, et al. Immunological effects of reduced mucosal 458 integrity in the early life of BALB/c mice. PLoS One 2017;12:1–20. 459 doi:10.1371/journal.pone.0176662 460
29 Zachariassen LF, Krych L, Rasmussen SH, et al. Cesarean Section Induces Microbiota-461 Regulated Immune Disturbances in C57BL/6 Mice. J Immunol 2019;202:142–50. 462 doi:10.4049/jimmunol.1800666 463
30 Mentzel CMJ, Cardoso TF, Pipper CB, et al. Deregulation of obesity-relevant genes is 464 associated with progression in BMI and the amount of adipose tissue in pigs. Mol Genet 465 Genomics 2018;293:129–36. doi:10.1007/s00438-017-1369-2 466
31 Sarafian MH, Gaudin M, Lewis MR, et al. Objective Set of Criteria for Optimization of 467 Sample Preparation Procedures for Ultra-High Throughput Untargeted Blood Plasma Lipid 468 Profiling by Ultra Performance Liquid Chromatography−Mass Spectrometry. Anal Chem 469 2014;86:5766–74. doi:10.1021/ac500317c 470
32 Roux S, Emerson JB, Eloe-Fadrosh EA, et al. Benchmarking viromics: an in silico evaluation 471 of metagenome-enabled estimates of viral community composition and diversity. PeerJ 472 2017;5:e3817. doi:10.7717/peerj.3817 473
33 Rohart F, Gautier B, Singh A, et al. mixOmics: An R package for ‘omics feature selection 474 and multiple data integration. PLOS Comput Biol 2017;13:e1005752. 475 doi:10.1371/journal.pcbi.1005752 476
34 Breiman L. Random forests. Mach Learn 2001;45:5–32. doi:10.1023/A:1010933404324 477
35 Zhao S, Guo Y, Sheng Q, et al. Heatmap3: An improved heatmap package with more 478 powerful and convenient features. BMC Bioinformatics 2014;15:P16. doi:10.1186/1471-479 2105-15-S10-P16 480
36 Sun L, Ma L, Ma Y, et al. Insights into the role of gut microbiota in obesity: pathogenesis, 481 mechanisms, and therapeutic perspectives. Protein Cell 2018;9:397–403. 482 doi:10.1007/s13238-018-0546-3 483
37 Allen HK, Looft T, Bayles DO, et al. Antibiotics in feed induce prophages in swine fecal 484 microbiomes. MBio 2011;2:1–9. doi:10.1128/mBio.00260-11 485
38 Hudson BD, Due-Hansen ME, Christiansen E, et al. Defining the molecular basis for the first 486 potent and selective orthosteric agonists of the FFA2 free fatty acid receptor. J Biol Chem 487 2013;288:17296–312. doi:10.1074/jbc.M113.455337 488
39 Ichimura A, Hasegawa S, Kasubuchi M, et al. Free fatty acid receptors as therapeutic 489 targets for the treatment of diabetes. Front Pharmacol 2014;5:1–6. 490 doi:10.3389/fphar.2014.00236 491
40 Murdock PR, Pike NB, Eilert MM, et al. The Orphan G Protein-coupled Receptors GPR41 492 and GPR43 Are Activated by Propionate and Other Short Chain Carboxylic Acids. J Biol 493 Chem 2003;278:11312–9. doi:10.1074/jbc.m211609200 494
41 Dubern B, Clement K. Leptin and leptin receptor-related monogenic obesity. Biochimie 495 2012;94:2111–5. doi:10.1016/j.biochi.2012.05.010 496
42 Ito S, Fujimori T, Furuya A, et al. Impaired negative feedback suppression of bile acid 497 synthesis in mice lacking βKlotho. J Clin Invest 2005;115:2202–8. doi:10.1172/JCI23076 498
43 Kruse R, Vienberg SG, Vind BF, et al. Effects of insulin and exercise training on FGF21, its 499 receptors and target genes in obesity and type 2 diabetes. Diabetologia 2017;60:2042–51. 500
.CC-BY-ND 4.0 International licensenot certified by peer review) is the author/funder. It is made available under aThe copyright holder for this preprint (which wasthis version posted October 4, 2019. . https://doi.org/10.1101/792556doi: bioRxiv preprint
Page 19 of 19
doi:10.1007/s00125-017-4373-5 501
44 Ling C, Del Guerra S, Lupi R, et al. Epigenetic regulation of PPARGC1A in human type 2 502 diabetic islets and effect on insulin secretion. Diabetologia 2008;51:615–22. 503 doi:10.1007/s00125-007-0916-5 504
45 Charos AE, Reed BD, Raha D, et al. A highly integrated and complex PPARGC1A 505 transcription factor binding network in HepG2 cells. Genome Res 2012;22:1668–79. 506 doi:10.1101/gr.127761.111 507
46 Rajpathak SN, Gunter MJ, Wylie-Rosett J, et al. The role of insulin-like growth factor-I and 508 its binding proteins in glucose homeostasis and type 2 diabetes. Diabetes Metab Res Rev 509 2009;25:3–12. doi:10.1002/dmrr.919 510
47 Wittenbecher C, Ouni M, Kuxhaus O, et al. Insulin-like growth factor binding protein 2 511 (IGFBP-2) and the risk of developing type 2 diabetes. Diabetes 2019;68:188–97. 512 doi:10.2337/db18-0620 513
48 Yang G, Badeanlou L, Bielawski J, et al. Central role of ceramide biosynthesis in body 514 weight regulation, energy metabolism, and the metabolic syndrome. Am J Physiol Metab 515 2009;297:E211–24. doi:10.1152/ajpendo.91014.2008 516
49 Liu S, Kim TH, Franklin DA, et al. Protection against High-Fat-Diet-Induced Obesity in 517 MDM2C305F Mice Due to Reduced p53 Activity and Enhanced Energy Expenditure. Cell 518 Rep 2017;18:1005–18. doi:10.1016/j.celrep.2016.12.086 519
50 Org E, Blum Y, Kasela S, et al. Relationships between gut microbiota, plasma metabolites, 520 and metabolic syndrome traits in the METSIM cohort. Genome Biol 2017;18:1–14. 521 doi:10.1186/s13059-017-1194-2 522
51 Wilmanski T, Rappaport N, Earls JC, et al. Blood metabolome predicts gut microbiome α-523 diversity in humans. Nat Biotechnol 2019;37. doi:10.1038/s41587-019-0233-9 524
52 Le Poul E, Loison C, Struyf S, et al. Functional characterization of human receptors for short 525 chain fatty acids and their role in polymorphonuclear cell activation. J Biol Chem 526 2003;278:25481–9. doi:10.1074/jbc.M301403200 527
53 Barber MN, Risis S, Yang C, et al. Plasma lysophosphatidylcholine levels are reduced in 528 obesity and type 2 diabetes. PLoS One 2012;7:1–12. doi:10.1371/journal.pone.0041456 529
54 Zuo T, Wong SH, Lam K, et al. Bacteriophage transfer during faecal microbiota 530 transplantation in Clostridium difficile infection is associated with treatment outcome. Gut 531 2018;67:634–43. doi:10.1136/gutjnl-2017-313952 532
533
.CC-BY-ND 4.0 International licensenot certified by peer review) is the author/funder. It is made available under aThe copyright holder for this preprint (which wasthis version posted October 4, 2019. . https://doi.org/10.1101/792556doi: bioRxiv preprint