fair tax monitor - occupied palestinian territory
TRANSCRIPT

See discussions, stats, and author profiles for this publication at: https://www.researchgate.net/publication/332934037
Fair Tax Monitor - occupied Palestinian territory
Book · December 2018
CITATIONS
0READS
7
2 authors, including:
Some of the authors of this publication are also working on these related projects:
Analysis of social security and social protection in Palestine View project
Tax Justice View project
Firas Jaber
Social & Economic Policies Monitor (Al Marsad)
28 PUBLICATIONS 1 CITATION
SEE PROFILE
All content following this page was uploaded by Firas Jaber on 08 May 2019.
The user has requested enhancement of the downloaded file.

2018
FAIR TAXMONITOR
FAIR TAXMONITOR
مؤشر العدالةالــضــريــبــيــة

FAIR TAX MONITORFirst Edition: 2018
Publications of MIFTAH 2018Copyright
Prepared by:Dr. Naser Abdelkarim EconomistMr. Firas Jaber Researcher - Development Studies
MIFTAH Staff:Mrs. Lamis Shua’ibi Hantouli Director of the “Policy Dialogue and Good Governance” ProgrammeMr. Hassan Mahareeq Coordinator of the “Finance for Development” Project
Under the Dialogue & Dissent Programme
Editing and Proofreading: Mrs. Karen MannTranslation: Mr. Arsen Aghazarian
The content of this study does not reflect the official opinion of Oxfam. Responsibility for the information and views expressed in the study lies entirely with the author.

Acknowledgements
The Fair Tax Monitor Report is a key achievement in the Finance for Development project funded by the Dutch Ministry of Foreign Affairs. MIFTAH thanks all those who participated for their invaluable contributions and support in the drafting of this report. In particular, we wish to thank and express gratitude to local Palestinian experts Dr. Naser Abdelkarim and Mr. Firas Jaber, both of whom invested significant time and effort in preparing this document. Special thanks are also due to Oxfam and Tax Justice Network Africa (TJNA), especially its project and technical teams, for their support and assistance in developing the common research framework. In particular Riva Jalipa From TJNA for her time on the report.
Finally, we extend our appreciation to MIFTAH’s team for their commitment and extensive efforts throughout the process of publishing this one-of-a-kind national report that explores and examines the fiscal policies and tax system of Palestine through a social lens.

4 | FAIR TAX MONITOR | 5
Table of Contents
5 Summary of Figures5 Summary of Tables6 List of Abbreviations7 Glossary9 Executive Summary 11 Objectives12 Rationale13 Category 1: Brief Description of the Palestinian Tax System20 Category 2: Distribution of the Tax Burden and Progressivity30 Gender Analysis of Taxes32 Category 3: Revenue Sufficiency and Tax Leakages37 Category 4: Corporate Tax Exemption - Governance and Transparency40 Category 5: Effectiveness of the Tax Administration44 Category 6: Government Spending49 Category 7: Transparency and Accountability53 Concluding Remarks and General Recommendations 58 References

4 | FAIR TAX MONITOR | 5
Summary of Figures
22 Figure 1: Average percentage of taxpayers’ contribution to income tax revenue 2011 - 201625 Figure 2: PA clearance revenues 1996 - 201626 Figure 3: Change in clearance revenues and Palestinian trade balance deficit46 Figure 4: Distribution of public expenditure by sector in 2016
Summary of Tables
19 Table 1: Amendment of individual tax brackets19 Table 2: Amendment of corporate tax brackets 21 Table 3: Direct tax revenues and its share of total tax revenues since 2008 (in NIS million)22 Table 4: Value and average percentage of taxpayers’ contribution to income tax revenue 2011-2016 (in NIS million)23 Table 5: Value and average percentage of PIT contribution to total tax revenue 2011-2016 (in NIS million)24 Table 6: Value and average percentage of CIT contribution to total tax revenue 2011-2016 (in NIS million)24 Table 7: Property tax revenues and its share of total tax revenue since 2008 (in NIS million)25 Table 8: Structure of actual revenues from indirect taxes in 2017 (in NIS million)26 Table 9: VAT revenues and its share of total tax revenue since 2008 (in NIS million)27 Table 10: Purchase/production tax revenues and share of total tax revenues and GDP since 2008 (in NIS million)28 Table 11: Petroleum excise revenues and its share of total tax revenues and GDP since 2008 (in NIS million)33 Table 12: Public revenues and grants (cash basis) at current prices 1996-2016 (in USD million)33 Table 13: PA public revenues 2013-201734 Table 14: Non-tax revenues and its share of total GDP since 2008 (in NIS million)35 Table 15: Taxpayer files registered over selected years42 Table 16: Staffing of tax administration 2011-201742 Table 17: Total of non-wage costs per tax department 2014-2016 (in NIS)45 Table 18: Size and structure of PA public spending 2013-2017 (in NIS million)46 Table 19: Size and share of spending on three sectors 2014-2017 (in NIS million) 46 Table 20: Share of spending on three sectors for 2017 per capita (in NIS)47 Table 21: Share of education spending from total government spending and GDP since 2011 (in NIS million)48 Table 22: Share of health spending from total government sending and GDP since 2011 (in NIS million)48 Table 23: Share of agriculture spending from total government spending and GDP since 2011 (in NIS million)

6 | FAIR TAX MONITOR | 7
List of Abbreviations
CIT: Corporate Income Tax CSR: Corporate Social ResponsibilityCSO: Civil Society OrganizationFTA: Free Trade AgreementFTM: Fair Tax MonitorFY: Financial Year GDIT: General Directorate of Income Tax GDP: Gross Domestic Production IFF: Illicit Financial Flows ILO: International Labour OrganizationIMF: International Monetary Fund INTOSAI: International Organization of Supreme Audit InstitutionsITA: Income Tax ActLGs: Local GovernmentsMIFTAH: The Palestinian Initiative for the Promotion of Global Dialogue and DemocracyMoEHE: Ministry of Education and Higher EducationMoF: Ministry of FinanceMoH: Ministry of HealthSMEs: Small & Medium EnterprisesNDP: National Development PlanNIS: New Israeli ShekelOPT: Occupied Palestinian TerritoriesPCBS: Palestinian Central Bureau of Statistics PIEFZA: Palestinian Industrial Estates and Free Zones Authority PIPA: Palestinian Investment Promotion Agency PIT: Personal Income Tax PLC: Palestinian Legislative Council PLO: Palestinian Liberation OrganizationPA: Palestinian Authority PPFI: Palestine Public Finance InstituteSAACB: State Audit and Administrative Control Bureau TIN: Tax Identification Number UNCTAD: United Nations Conference on Trade and DevelopmentUNRWA: United Nations Relief and Works Agency for Palestine Refugees in the Near EastVAT: Value Added TaxWTO: World Trade Organization

6 | FAIR TAX MONITOR | 7
Glossary
Net Lending/Borrowing - Net operating balance/net acquisition of non-financial assets. This includes net lending by the Ministry of Finance and net lending deducted from clearance revenues. In particular, payments due to be remunerated by local authorities and Palestinian electricity companies.
Direct Taxes - Taxes imposed/levied on income, wealth and property such as Personal Income Tax, Corporate Income Tax, Property Tax and Capital Gains Tax. The tax burden is always on an individual or an entity and cannot be shifted by the taxpayer to someone else.
Equity/Fairness - Making the rich and/or people with greater ability pay more taxes (vertical equity) while taxpayers in similar circumstances should pay similar amounts of tax (horizontal equity).
Fair Tax Monitor - A tool which measures tax fairness and compares the levels and trends of tax injustice that exist across national tax systems and over time.
Fair Tax System - To be considered fair, a tax system should have the following characteristics: (1) is progressive and serves as a mechanism to redistribute income in a gender-sensitive way; (2) raises sufficient revenue to perform government functions and provide essential services; (3) refrains from and eliminates tax exemptions and incentives for the elites; and (4) tackles causes of illicit capital flight and tax evasion by international companies and the wealthy.
Illicit Financial Flows - The cross-border movement of funds that are illegally acquired, transferred or used. The sources of these cross-border transfers may be bribery; theft by government officials; the trafficking of drugs, arms and humans; smuggling; commercial tax evasion; and mispricing or abusive transfer pricing.
Indirect Taxes - Taxes on consumption such as VAT/sales taxes/goods and services tax, customs duties and excise duties. Generally assumed to be more regressive than direct taxes.
Progressivity - A progressive tax is one that places the biggest burden on those most able to pay. Most often applied in the form of income tax, a progressive tax is one where the tax rates rise as incomes increase so that those who earn high incomes have a greater proportion of their income taken as tax.
Public Spending - Expenditure by the government on public infrastructure/goods and social services such as education and health.
Regressivity - A regressive tax, versus a progressive tax, is one where everyone pays the same amount of tax regardless of their income or ability to pay; or a tax in which the tax rate decreases as the taxable amount increases. This results in a greater tax burden on those with a low ability to pay tax (the poor) rather than on those with a higher ability to pay (the rich). Indirect taxes are often thought to be regressive.
Sales Tax - Indirect tax imposed on sales of goods and services. This tax may be imposed as a percentage of gross receipts, or ad valorem tax, or as an amount per unit of product. The tax is generally paid by the buyer but the seller is responsible for collecting and remitting the tax to

8 | FAIR TAX MONITOR | 9
the appropriate authorities. Most sales taxes are designed as consumption taxes i.e. as taxes on consumer expenditure. They may be levied at either a single stage in the production or trade process (e.g. on manufacture, wholesale or retail sale) or at multiple stages, such as the case with a value added tax or turnover taxes.
Tax Avoidance - The practice of seeking to minimize the tax one pays. Tax avoidance seeks to reduce tax payment by arranging affairs in a way that fits within the letter of the law, although it may not necessarily be within the spirit of the law. A common method is the realization of operations and transactions without an economic purpose, done exclusively with the objective of reducing tax liability. As a result, while tax avoidance can be strictly legal, it frequently contradicts the intent or spirit of the law, and is usually wrong from a moral perspective.
Tax Evasion - The illegal, fraudulent non-payment or under-payment of tax. Tax evasion frequently involves unreported income and falsified documents. It is generally punishable under criminal law.
Value Added Tax (VAT) – A specific type of turnover tax levied at each stage of the production and distribution process. In its purest form, VAT is a tax on all final consumption of goods and services, calculated as a percentage of the price each supplier charges their customer. The suppliers of goods or services are liable to remit it to the tax authorities.
Wealth Tax – A tax based on the market value of assets owned by individuals. These assets include, but are not limited to, cash, bank deposits, shares, fixed assets, private cars, assessed value of real property, pension plans, money funds, owner-occupied housing and trusts. An ad valorem tax on real estate and an intangible tax on financial assets are both examples of a wealth tax. Not all countries have this type of a tax. In this study, property, land and capitals gains tax represent wealth taxes.

8 | FAIR TAX MONITOR | 9
Executive Summary
According to the United Nations Technical Report of the High-level Panel on Financing for Development, taxes retain a vital role in financing state spending on basic social services such as education, health care and social security. Effective public spending, which responds to the needs of the people, requires the collection of sufficient tax revenue. Experience has shown that tax structures, no matter how brilliant on paper, are of limited effectiveness if applied in an inefficient or corrupt manner. Thus, a simple tax system and a transparent, accountable and corruption-free tax administration capable of reducing tax evasion and avoidance should be created.1
Public revenue management is said to be effective not only when the amount collected is sufficient, but also when political decision makers build on a well-considered and comprehensive plan that reflects and links revenues to macro-economic and social indicators. Above all, revenues and their structure should contribute to social justice and support quality public services - education, health and social services - for all. Poor tax administration tends to collect taxes by focusing on low-income sectors (through indirect taxation) or social groups that are easy to tax, such as public and private sector employees who are subject to payroll source deduction. A fair tax system is one of the foundations of social justice. It marks the relationship between the state and its citizens by effectively implementing the social contract, and is an effective instrument designed to reduce social and economic inequalities.2
Inequality is at the forefront of current policy debate in both developed and developing countries.3 The Palestinian taxation scheme is structurally complex due to the occupation’s domination of most legal mechanisms related to taxation, not to mention its complete control over borders and ports. Furthermore, the taxation system is linked to the Paris Protocol, which has sustained the occupation’s hegemony and did not grant the Palestinian Authority (PA) any sovereignty over taxation.
In Palestine, the effects of tax policy and its responsiveness to social justice are relatively new topics of scholarly research.4 There are ample reasons and observations to support the assumption that the Palestinian tax system does not comply with social justice, and does not take into account the gender ramifications of policies that reinforce inequalities between the rich and poor, and between men and women. Therefore, in-depth research in this area strives to provide evidence of the gaps that exist in taxation and the distribution of income, wealth and opportunities in Palestine. These inequalities disproportionally affect the poorest and most vulnerable segments of the population, and place ever-growing financial burdens on low-income earners and the middle class. Palestine’s Gini coefficiency for inequality5 was reported at 35 percent, which is relatively high compared with similar countries.6 Furthermore, the Commitment to Reducing Inequality Index (CRII) ranked the Occupied Palestinian Territories (OPT) at 85; this is considerably lower than Tunisia, which is ranked 40 and is the first Arab state on the Index.7
Economic growth in the OPT over the past two decades was insignificant and volatile, with growth neither fairly distributed nor inclusive. In fact, the system has failed Palestine’s poor and helped the rich to become even wealthier. Over the past 10 years the Palestinian economy has achieved real cumulative growth of over 40 percent,8 yet the average daily wage has increased only slightly. This suggests that a small number of wealthy Palestinians have benefitted most from this economic growth, exacerbating existing inequalities. The data reported suggest that the average nominal wage of workers in the West Bank and Gaza increased by only 13 percent between 2007 and 2015, from NIS 73.7 to 83.2 a day.9 If the cumulative increase in the Consumer Price Index

10 | FAIR TAX MONITOR | 11
is considered, the average real wage remained stagnant over that period. Low-income workers witnessed a minimal share of Gross Domestic Production (GDP) growth between 2008 and 2014; the economic growth has mostly benefitted the rich who own capital or businesses.10
Palestine continues to face high unemployment and poverty rates, deteriorating living conditions and a growing trade deficit. These conditions require new economic and social policies significantly different from those that have prevailed since the creation of the PA in 1994.11 The tax system is at the forefront of these policies because it has an immediate and significant impact on the living conditions of each citizen. The Palestinian Authority (PA) is aware of the economic and social ramifications of the ongoing occupation. Since its establishment, the PA has had fairly broad discretion over the management of tax policy, which is not the case with other macroeconomic policies, particularly trade and monetary policies.
The establishment of the PA did not deter the dominance of the occupation and its measures that prevent the development of any Palestinian sovereignty. The occupation has been prolonged through new mechanisms, such as the Paris Protocol, which paved the road for the occupation to continue its looting and impoverishment of Palestinian society. The occupation’s policies have prevented the development of agricultural and industrial production. The “legitimization” of hegemony, and the exploitation of mechanisms implemented by intermediaries, have clouded their impact despite the fact that the content and effects remain the same. This has led to the stabilization of free market options under the control of the occupation and the adoption of economic liberalism, with significant negative results such as deterioration in the size of manufacturing sectors; more commercial agreements that reinforce dependency on the occupation; and reliance on rigorous taxes that are spent on security and salaries.12
The Paris Protocol regulates the relationship of the PA with the Occupying Power in all respects. This has made the areas under PA control fully subordinate to the Israeli economy; the same customs regulations are applicable, except for some customs exemptions on specific goods and products from Jordan and Egypt. Economists and experts believe that this type of economic relationship has made the occupation of Palestine profitable. The agreement is allegedly a solid economic base between the PA and the occupation aimed at preserving mutual interests and commercial relations. However, this agreement has turned the Israeli occupation of the Palestinian territories into the cheapest occupation in the world because it has become such a profitable economic project.13
This assessment of the different components of the Palestinian tax system aims to open public debate on the fairness and progressiveness of current policies – an issue of internal dialogue between Palestinian citizens and public authorities. The study addresses the fact that over the past decade, only the Income Tax Law has undergone numerous modifications and the tax system is still striving to regulate all facets of taxation and to strengthen tax administration. Thus, this assessment aims to contribute to the development of the revenue system in the OPT in line with the declared social and economic goals of the Palestinian government, while advocating for stronger direct and indirect fiscal support to the most marginalized and vulnerable segments of the Palestinian population.

10 | FAIR TAX MONITOR | 11
Objectives
The objective of the present Fair Tax Monitor (FTM) OPT is to provide the public, that is to say the citizens, and civil society organizations (CSOs) with a quantitative and qualitative analysis and overview of all components of the Palestinian tax system. The FTM relies on publicly available data on the tax burden, distribution of taxes and management of tax administration to establish an evidentiary base for effective assessment of the fairness of the tax system, and to identify the gaps and consequences of existing policy solutions.
In particular, the assessment seeks to:
1. Provide detailed analysis of the types of taxes levied in Palestine, in addition to a historical overview of legislative and administrative changes to the tax system in the OPT;
2. Showcase some of the trends in policy development and their ramifications;
3. Measure the size, structure and distribution of the tax burden - the distribution of income tax between individuals and companies, and the contribution of direct and indirect tax on total collected revenues;
4. Identify and assess tax justice according to a common research framework (CRF) developed by Oxfam, Tax Justice Network Africa and other partners14 within six main categories:
i. Progressive tax system; ii. Sufficient revenues, tax evasion and tax avoidance;iii. Well-governed tax exemptions;iv. Effective tax administration;v. Pro-poor public spending; vi. Accountable and transparent public finances.
5. Identify the main policies and practices that affect the fairness of the tax system;
6. Propose policy recommendations that can address and improve the existing tax system, and promote progressiveness and greater efficiency.

12 | FAIR TAX MONITOR | 13
Rationale
The findings and recommendations of this study are expected to help policymakers, in partnership with other stakeholders such as CSOs and citizens, to introduce appropriate amendments to the Palestinian tax system in a manner that ensures fairness in the distribution of the tax burden. The aim of this study is to set the stage for an open policy dialogue on a new approach to the PA tax policy: an approach based on participation, shared decision making and social justice.
The Palestinian taxation scheme is determined by three main features: The first is its links and high dependency, legally and monetarily, on Israel. The second feature is its reliance on indirect taxes. The third is that the Palestinian economy relies heavily on the service and aid sectors. These three factors combined will result in a deterioration of the production sector and its contribution to employment, GDP, and most particularly its tax contribution. These features are discussed thoroughly in this study to draw the attention of relevant parties and convince them to take the steps necessary to improve the Palestinian taxation system.
Most tax and customs rates and regulations are determined in accordance with the terms of the Paris Protocol,15 which deepens the dependency of the Palestinian economy on that of the occupation. Independence from the occupation’s economy, a unified Palestinian customs framework and a comprehensive tax scheme will improve revenue collection and distribution, thereby increasing justice and levels of equality.
We believe that strengthening the credibility of the tax system and taxpayers’ confidence in the system will improve compliance and revenue collection for greater investment in social spending. In addition, our conclusions may help to hold the government more accountable in managing public finances. This study comes at a time when we are witnessing a significant decline in foreign aid and internal revenue collection is becoming more important to support public spending.
Analysis of the features of the Palestinian economy and taxation shows that the production base has shrunk over recent years under the difficult political and security conditions with very limited natural resources. Data published by the Palestinian Central Bureau of Statistics (PCBS) show that the contribution of the agricultural sector to GDP has declined from 11.7 percent in 1994 to less than three percent in 2017, while the contribution of the manufacturing sector has declined from 24 percent in 1994 to 13.9 percent in 2017.16 The Palestinian tax burden relative to GDP is high, standing now at 21 percent of GDP and almost 85 percent of the total recurrent budget. As the Palestinian taxpaying public are an important, and perhaps the most meaningful, source of public revenues, they have the right to hold accountable those responsible for public policy, and to participate in the design of these policies. Meanwhile, the government must be transparent in designing and implementing tax and budget policies.

12 | FAIR TAX MONITOR | 13
Category 1Brief Description of the Palestinian Tax System
| 13
FAIR TAXMONITOR
مؤشر العدالةالــضــريــبــيــة

14 | FAIR TAX MONITOR | 15
Category 1 | Brief Description of the Palestinian Tax System
Types of Taxes – Historical Development
Since its creation in 1994, the PA has faced significant challenges in regulating the tax system. The PA inherited multiple and fragmented legal regulations for public finances: from the Ottomans, the British Mandate, Jordan, Egypt and Israel. Over the past 20 years, the PA has developed and amended several economic laws on taxation, the most important of which is the Income Tax Law introduced in 2004. The PA has not issued any legislation on indirect taxation but has amended some existing laws and regulations, mainly regarding the collection and administration of these forms of taxation.17
It has amended other indirect taxation laws and by-laws addressing collection and administration but has taken no steps towards inclusive tax reform.
In light of expanding globalization and its effects on international and domestic trade, the OPT is no exception to ensuring that its national tax system is compatible with those of its neighboring countries. However, it is operating with one great limitation. The binding bilateral economic agreements with Israel only allow the PA a narrow margin to design tax policies that take into consideration the Palestinian economic and social context. According to the signed agreements, the PA does not have the power to enact or amend VAT or purchase tax laws, or even to determine customs duties for goods imported via Israel. Nonetheless, it does have full power over direct taxation, i.e. the income tax system.
The Paris Protocol signed on April 29, 1994, stipulates that the PA has the right to levy direct taxes on activities within its jurisdiction. Also, it expressly states that the PA has the right to independently define and regulate its direct taxation policies, including income tax for individuals and corporations, and property tax.18
Palestinian Tax System
The Palestinian tax system consists of two types of taxes: direct taxes and indirect taxes. Indirect taxes are generally subject to military orders and agreements with Israel, the occupying power, and constitute more than 90 percent of Palestinian tax revenues.
Direct Taxes:
1. Income tax, which includes: 1) Personal Income Tax (PIT) and 2) Corporate Income Tax (CIT)
2. Property tax
Indirect Taxes:
Indirect taxes are levied on consumption, production and trade activities. As mentioned earlier, the Paris Protocol significantly limits the PA’s ability to set tax rates freely. These include rates for the following:
1. Value Added Tax (VAT)2. Purchase/Production tax

14 | FAIR TAX MONITOR | 15
3. Clearance tax4. Fuel tax (Petroleum excise)5. Customs and excise duties
Tax Collection Responsibilities and Procedures
All taxes are collected by the central government, represented by the Ministry of Finance (MoF). Local government units do not collect any type of tax, except what is called “Education Tax or Fees”. This tax is imposed on building operators, who pay seven percent of the annual rent as an education tax. Ninety percent of this amount is distributed to municipalities, while the remaining 10 percent is given to the MoF. This tax is used to finance the rehabilitation of existing public schools or the building of new ones. The origin of this tax comes from an old Jordanian Law (No.1 for 1956). Two public departments within the MoF are responsible for tax collection (except for property tax, which is collected by the General Administration of Property Tax): the General Administration of Customs and VAT; and the General Directorate of Income Tax (GDIT). The MoF has recently created a special department that reports to GDIT, which is responsible for managing the tax files of major taxpayers. The department uses the ‘one tax file’ method which links the databases in both administrations. Sub-departments operate in individual governorates across the country. Another general administration, the Audit and Inspection Authority, is responsible for verifying the proper implementation of tax procedures and compliance with the law by tax departments.
The Collection Procedures
Taxpayers provide the tax department with tax returns together with financial documents signed by certified acccountants.
The tax department examines the accuracy of the returns and their technicla and legal validity.
In this case, the tax department enters into negotiations with the taxpayers, or the accountant representing him/her. Usually the two parties reach a compromise in which the amount of the tax due and the payment schedule are determined.
Such a procedure is likely to prejudice the right of the taxpayers, who may then choose to appeal to the committee for objections or the competent court.
If approved, the dues are paid in checks or throught wire transfers deposited in accounts made for that purpose.
In case of non-approval, the department may accept a taxpayer’s offer to settle his/her tax liacility for less than thefull anount due.
Similar procedures are used in collecting VAT and purchase tax.19

16 | FAIR TAX MONITOR | 17
The collection of tax at source from salaries and wages is a smooth process and does not involve administrative complications. The employer deducts the tax directly from the employee’s income and transfers it to the MoF. Private taxpayers follow the same procedures described above. Clearance revenues and customs duties are collected by Israel and then transferred to the PA, minus sums owed by the Palestinians for Israeli utilities (electricity and water).
Pension and Social Security System
Social security20 is a global economic and social right. It serves to protect workers in cases of illness, injury, disability and old age, while also seeking to provide a dignified and decent life for workers before and after retirement. It aims to guarantee social rights that are enshrined in Article 22 of the Universal Declaration of Human Rights:
“Everyone, as a member of society, has the right to social security and is entitled to its realization, through national effort and international co-operation and in accordance with the organization and resources of each State, of the economic, social and cultural rights indispensable for his dignity and the free development of his personality.”21
It is important to differentiate between: (1) Social services or welfare based on care for vulnerable and marginalized groups such as children, the disabled, elderly and unemployed people under the framework of the state’s responsibility; and (2) Social security based on the idea of subscriptions from workers to secure pensions for themselves and their families (i.e. providing social security to ensure that people are able to cope with emergency conditions such as disability, unemployment, old age and illness). Social security must then be differentiated between: (2.a) a social security system for public servants; and (2.b) social security for workers and employees in other sectors, such as the private sector, CSOs, and Palestinians working inside the Green Line for Israeli employers.
A variety of social assistance programs are administered in the OPT. For instance, the Palestinian Ministry of Social Development (formerly Social Affairs) has managed a social assistance programme since 2007 providing cash and non-cash allowances to poor families, funded by the World Bank and the European Union (EU). Poverty and unemployment rates are increasing in the OPT: there were 111,860 poor families in 2017. Sums given as assistance vary between NIS 3,000 and 7,200 a year per family. The International Labor Organization (ILO) and United Nations Relief and Works Agency for Palestine Refugees in the Near East (UNRWA) run similar social assistance programs for the refugee population. According to data published by the PCBS on poverty and unemployment, the unemployment rate is 27.7 percent.22 The unemployment rate in Gaza is almost twice that in the West Bank, and continues to rise in both areas. The poverty rate (the poverty line and deep poverty line for a household of five individuals, comprising two adults and three children, is NIS 2,470 and 1,974 respectively)23 remains high at around 29.2 percent and has grown to 53 percent in the Gaza Strip.24 The Ministry of Social Development database shows that the number of poor and marginalized families receiving cash transfers as assistance increased steadily from 106,000 families in 2009 to 110,000 in 2013 and 120,000 in 2016, later dropping to almost 112,000 families in 2017 as reported above.
As described above, there are two social security schemes in the OPT. The first one, for the public servants, was launched in 2005. The other one was finally decreed in 2016, after a long struggle, for workers and employees in other sectors such as the private sector, CSOs and Palestinians working inside the Green Line for Israeli employers.

16 | FAIR TAX MONITOR | 17
The new Social Security Law was welcomed by many parties, including the National Campaign for Social Security, one of the largest civil society campaigns which launched on April 5, 2016.25 In the first stage of implementation, the Social Security Fund will address three factors: 1. Old age, disability and death insurance; 2. Employment injury insurance; and 3. Maternity insurance.
The Social Security Fund assigned the responsibility of managing this system collects monthly contributions from employees and employers. These contributions are defined in the new law at seven percent of the employee’s monthly salary, versus seven and a half percent under the old law. The employer’s contribution is set at nine percent of the employee’s salary versus eight and a half percent under the previous law. In other amendments, the pension’s coefficient was increased from 1.7 percent to two percent, which will raise the value of pensions for employees. The minimum pension was increased from 50 percent to 75 percent of the minimum monthly wage, which amounts to NIS 1,450 [roughly $380].26
Developments in Income Tax Law
Over the past 20 years, Palestinian lawmakers have developed and amended income tax legislation on several occasions to achieve increased tax revenues, stimulate investment and redistribute income across different social groups.
The frequent rearrangement of tax legislation (through annual revisions and amendments) arguably indicates the lack of a strategic policy on how the tax system can contribute to the financial, economic and social objectives set out in the National Development Plans (NDPs), and have created a sense of financial insecurity and lack of predictability among taxpayers.
2011 Income Tax Law
The current tax legislation came into force on September 26, 2011, when the Palestinian President issued Decree No. 8 of the 2011 Income Tax Law.27 The most important amendments and policy solutions contained in the 2011 Decree are related to tax brackets, personal exemptions and tax-exempt income.
The 2012 Amendments Based on the powers granted by the 2011 Law, the Council of Ministers proposed in early 2012 to increase the number of tax brackets from three to five, adding two new brackets, namely 22.5 percent and 30 percent, on high-income earners.
The proposed amendments triggered a wave of discontent among businesses and individuals before they were even published to the public. The argument against introducing new brackets was that the law overburdens taxpayers who have already suffered a decline in their business activity. This public debate forced the government to enter into an open dialogue with representatives of the private and civil sectors. After a lengthy debate, a compromise was reached in which the two proposed brackets would be abolished and replaced with a fourth bracket at 20 percent. The 2012 amendment of the 2011 Income Tax Law set tax income rates at five percent, 10 percent, 15 percent and 20 percent respectively.28

18 | FAIR TAX MONITOR | 19
The 2014 Amendments
In March 2014, the PA President issued Decree No. 4 of 2014 with some limited amendments to the original law.29 The amendment re-established full exemption for capital gains arising from assets and securities, which had only had an exemption of 25 percent in the previous amendment to the Income Tax Law. The amendment also imposed a tax of 10 percent on the profits of micro-finance, and a similar rate on dividends, cash payments and stock shares.
The 2015 and 2016 Amendments
This amendment to the Income Tax Law30 raised personal income tax exemptions from NIS 30,000 to 36,000 and abolished personal exemptions such as education tax deductions. PIT brackets have been modified significantly to become more generous to individual taxpayers, including suppression of the fourth bracket:
• NIS 36,001-75,000: five percent tax rate • NIS 75,001-150,000: 10 percent tax rate • More than NIS 150,000: 15 percent tax rate
The amendment lowered the highest tax rate for individuals and companies from 20 percent to 15 percent, and left the 20 percent rate solely for businesses enjoying a monopoly position in the market and telecom operators.
Anticipated Amendments in 2018
Proposed amendments to the Income Tax Law are expected to include improvements to the efficiency of tax performance, developing the tax system through promoting tax liability and expanding the tax base. In addition to attracting new taxpayers, the amendments are expected to reduce tax evasion and avoidance, and increase the link between direct and indirect taxes.31 This will be achieved by creating a unit to provide integrated VAT and income tax services to large taxpaying bodies.
Tax revenues should be increased as the income tax bracket will range from zero to 20 percent, leading to a 10 percent increase in tax liability and a 35 percent increase in tax revenues in 2018, especially with the tax payments collected from the self-employed. Corporate tax policy will be adjusted by reducing income tax from 15 percent to 10 percent for small and medium-sized enterprises (SMEs) with a net annual income of NIS 3,500,000. This will stimulate growth and stability in these businesses that represent 90 percent of operating enterprises in Palestine.
Other tax exemptions and incentives could be designed to stimulate companies to recruit graduates. This would require the private sector to contribute to training programmes to pave the way for some 5,000 graduates to enter the labor market annually, a step that could contribute positively to the growth and sustainability of these companies. A new tax bracket of 20 percent will be designated for banks and financial institutions whose income exceeds NIS 7,000,000. This will include 52 prominent companies and monopolies32 in Palestine.
There remain serious concerns that the amendments fail to realize the three envisioned objectives - financial, economic and social - of the current tax policies. The efforts of policy makers are primarily focused on improving tax collection and revenues. As repeatedly stated in the official budget documents and national plans, the Palestinian government aims to increase reliance on self-generated resources rather than on foreign aid to finance public expenditure.33

18 | FAIR TAX MONITOR | 19
The amendments have done little to increase the contribution of income tax to total domestic revenues as receipts have remained relatively low at only eight percent of total tax revenues at best (see Table 3).
The following tables illustrate corporate and individual income tax brackets. It is evident that there is a lack of progressive taxation for both individuals and corporations with large incomes, resulting in less income tax contributions to total tax revenues.
Table 1: Amendment to individual tax brackets
Income Tax Rate Adjusted Income Adjusted Tax Rate1-36000 Exempt 1-40000 Exempt
36000-75000 5% 40001-75000 5%75001-150000 10% 75000-150000 10%
More than 150000 15% 150000-300000 15%Highest Bracket More than 300000 20%
Table 2: Amendment to corporate tax brackets
Income Tax Rate Adjusted Income Adjusted Tax RateFull Tax Base 15% 1-3,500,000 10%
Other Companies (Franchises and
Monopolies)20% 3,500,000-7,000,000 15%
Highest Bracket More than 7,000,000 20%

20 | FAIR TAX MONITOR | 21
Category 2Distribution of the Tax Burden and Progressivity
20 | FAIR TAX MONITOR
FAIR TAXMONITOR
مؤشر العدالةالــضــريــبــيــة

20 | FAIR TAX MONITOR | 21
Category 2 | Distribution of the Tax Burden and Progressivity
Palestinian public revenues have three main sources:
• Domestic revenues - mainly comprised of income tax, VAT, property tax, production tax, service fees, and customs and excise on beverages and tobacco.
• Clearance revenues - VAT, customs duties and fuel excise, purchase tax and income tax that are collected by Israel and transferred monthly to the PA after deducting three percent as collection fees.
• Grants and foreign aid - meant to finance current budget and public investments.
Cross-Cutting ProgressivityDirect taxes: size, source and collection trends
The table below shows changes in direct tax revenue since 2008. The share of direct taxes (income tax and property tax) is between six to 10 percent of total tax revenue. By analyzing the figures, we can measure the extent to which the amendments succeeded in increasing the contribution of income tax to total revenues.
Table 3: Direct tax revenues and its share of total tax revenues since 2008 (in NIS million)34
Year 2008 2009 2010 2011 2012 2013 2014 2015 2016 2017Direct tax35 310 310.3 324.4 514.1 678.2 767.9 744.8 733 704.3 983.4
Total tax revenues 4604 4604 5256 6405.6 7035 7426.4 8851.4 9962.7 11289.1 11476.1As percentage of total tax revenues 6.7% 6.7% 6.2% 8% 9.6% 10.3% 8.4% 7.3% 6.2% 8.6%
The 2011 Income Tax Law contributed to increasing tax revenues by changing the tax brackets and improving tax collection procedures. However, amendments by later governments included elimination of the 20 percent tax bracket, which gave large corporations immense exemptions. The greater exemptions granted to other corporations and industrial zones resulted in a smaller contribution of income tax revenues to total tax revenues.
It appears that frequent amendments to the Income Tax Law have done little to boost the contribution of direct tax to total tax revenues. Although income tax revenue collection grew significantly in 2012 to 2013 compared with 2011, its contribution to total revenues has remained relatively low at only 8.6 percent in 2017. In other comparable economies in the region, the income tax contribution to total tax revenue is much higher: 17 percent in Jordan, 28 percent in Egypt and an average of 34.3 percent in other economies.36
Tax and Gender Equality
The tax law in Palestine is free from explicit biases against women; it views both women and men as taxpayers equally and neutrally. However, exemptions and deductions allowed legally for dependents is awarded more often in practice to the man (the husband in the case of married couples as he will buy an apartment, for instance). Women can claim these deductions and exemptions only if they head the family, are divorced or widowed. This differential treatment affects income tax liability for men and women if both husband and wife are working.

22 | FAIR TAX MONITOR | 23
PIT vs CIT
Income tax is imposed and collected from all taxpayers working in the territory of a sovereign state. Despite the fact that the OPT is not a fully sovereign state, the PA has the authority to levy income tax on business profits, salaries and other earnings generated by individuals and companies across all sectors of the economy.
Figure 1: Average percentage contribution of taxpayers to income tax revenue 2011-2016
Companies
50%
Individuals
14%
Deductions
36%
Source: The authors worked out the shares based on data obtained from the Income Tax Department, MoF.
The next table suggests that there is a slight shift in the components of the PIT in favour of tax contribution by individuals, which may suggest an improvement in tax justice.
Table 4: Value and average percentage contribution of taxpayers to income tax revenue 2011-2016 (in NIS million)
Deductions fromsalariesIndividuals Companies Year
41%211,713%67,245%232,0201132%212,111%73,458%386,7201235%261,410%78,855%411,2201338%286,119%144,242%314,2201438%30019%15043%350201536%32020%17044%4002016
Personal Income Tax (PIT)
PIT is imposed on a Palestinian resident who has resided continuously in Palestine for a period of no less than 120 days during the year and who receives a taxable income. The tax is levied on the income derived from any business, job, profession or any taxable income in accordance with the law and within three tax brackets.
There is much debate on the most appropriate number of tax brackets in the OPT. Amidst this controversy, there is only one plausible fact: increasing the number of brackets would improve economic and social equity, and distribution of income.

22 | FAIR TAX MONITOR | 23
Equally contested are tax exemptions for individuals. Amendments to the Income Tax Law steadily reduced the number and the amount of tax exemptions over the years. The obvious preference of the government has been to increase standard deduction for individual taxpayers and reduce, or even abolish, itemized deductions for education, medical treatments, housing and capital income.
Table 5: Value and average percentage contribution of PIT to total tax revenues 2011-2016 (in NIS million)37
Year Individuals Deductions from salaries Total PIT Percentage of
total tax revenue2011 67,2 211,7 278.9 4.4%2012 73,4 212,1 285.4 4%2013 78,8 261,4 340.2 4.6%2014 144,2 286,1 430.3 4.9%2015 150 300 450 4.5%2016 170 320 490 4.4%
This table shows low individual income taxation contributions to total tax revenues of no more than five percent, and demonstrates that consecutive amendments to the Income Tax Law did not increase the proportion of income tax contribution.
Collections from individuals (liberal professions, workers over the Green Line, self-employment and car importers) make up only 14 percent of total income tax revenue. This contribution is very small considering the constituent segments, particularly the self-employed. According to the PCBS, roughly 208,000 and 150,000 of the Palestinian workforce are self-employed and work in Israel respectively. Both categories represent around 40 percent of the workforce, yet they only contribute 14 percent of income tax collection. Deductions from salaries of public, private and civil sector staff (payroll tax) represent 36 percent of total income tax revenues, with the income tax deducted directly by employers and transferred to the tax department. These data suggest that most individual and payroll taxpayers fall in the first tax bracket with a rate of five percent, while few pay taxes at the highest rate of 15 percent. This contention is based on the fact that the average salary of employees is as low as NIS 3000 a month. Thus, a high proportion of employees are earning a monthly salary of less than the minimum taxable income (above NIS 36000 a year), and a small proportion of employees earn an average annual income above that line.
Corporate Income Tax (CIT)
Corporate income in the OPT is currently taxed at a fixed, uniform rate of 15 percent, except for monopolies, banking and financial institutions, and telecom companies, which are taxed at 20 percent rate. The current rate signifies a decline from highs of 30 percent in 2012 and 22.5 percent in 2014. Discussions are taking place aimed at unifying the tax bracket at between 15 and 20 percent for the 52 large corporations of monopolies, banking and financial institutions, and telecom companies.

24 | FAIR TAX MONITOR | 25
Table 6: Value and average percentage contribution of CIT to total tax revenue 2011-2016 (in NIS million)38
Year CIT Tax brackets Percentage of total tax revenue
2011 232
15%20%
22.5%30%
3.6%
2012 386.7 15%20% 5.5%
2013 411.2 -- 5.5%2014 314.2 -- 3.2%
2015 35015%
20% monopoly, telecom operators
3.2%
2016 400 --- 3.6%
This table shows that the contribution of CIT to total tax revenues is very low and has not reached four percent during the past three years. It indicates that the amendments to the Income Tax Law and the exemptions given to companies have reduced their contribution to total tax revenue. The trend of lowering the tax burden for companies is also evident in light of the fact that the current law reduced taxes on life insurance premiums from 10 percent to five percent for companies.
Property Tax
The Jordanian Property Tax Law No. 11 of 195439 is still in effect in the OPT. Property tax is collected annually at 17 percent of the annual rent value of buildings and real estate, after deducting 20 percent as consumption from the total cost of the lease. This rental valuation should be responsive to changes in market conditions but has not been changed for most municipalities since 1988. The central Tax Department collects this tax and transfers 90 percent of the money collected to local government departments, while the PA treasury withholds 10 percent. At the end of 2017, the value of property tax transferred to local governments was NIS 130.9 million, while revenues withheld by the PA from property tax totaled NIS 13.3 million.40 However, in practice, the central government has been withholding most, if not all, property tax dues against deficits in utility collections by most municipalities. Israel also deducts the deficit from clearance revenues. This deduction against deficits is what generated a relatively large expenditure item called “Net Lending” in the central government budget in recent years.
Table 7: Property tax revenues and its share of total tax revenues since 2008 (in NIS million)41
Year 2008 2009 201042 2011 2012 2013 2014 2015 2016 2017Property Tax 21 22 17 121.5 123.3 219.5 233 112.7 206.8 130.9
Total Tax Revenues 4604 4604 5256 6405.6 7035 7426.4 8851.4 9962.7 11289.1 11476.1
As percentage of total tax revenues 0.5% 0.5% 0.3% 1.9% 1.8% 3% 2.6% 1.1% 1.8% 1.1%

24 | FAIR TAX MONITOR | 25
Indirect Taxes: size, source and collection trends
Indirect taxes are levied on the consumption of goods and services as well as on domestic and foreign trade. Examples of indirect taxes include VAT, customs duties, excise, purchase tax and fuel tax. These taxes are collected locally and by Israel (clearance revenues) on behalf of the PA treasury in accordance with the Paris Protocol. The table below shows revenues from various types of indirect taxes for 2017. The share of these taxes exceeds 92 percent of total tax revenues, with annual changes remaining insignificant.
Table 8: Structure of actual revenues from indirect taxes in 2017 (in NIS million)43
Item Collected through clearance Collected locally Total Percentage
Customs 3353.7 737.2 4090.9 39%VAT 2288 1011.3 3299.3 31.4%
Purchase tax -4.7 0 -4.7 0%Cigarettes and drinks excise
duties 0 198.8 198.8 1.9%
Fuel tax 2,903.5 0 2903.5 26.7%Total 8545.2 1947.3 10487.8 100%
The relative importance of clearance revenues has increased in recent years due to the worsening of the trade balance deficit as shown in Table 8 above and Figures 2 and 3 below. Clearance revenues constituted about two-thirds of total public revenues between 2011 and 2016, and more than 75 percent of total tax revenues in that same period. Despite its significant contribution, this source is particularly volatile as Israel frequently uses it as a tool for political pressure. In times of tense Israeli-Palestinian relations, Israel often withholds these Palestinian funds. This seriously restrains the delivery of public services and undermines the PA’s ability to meet its financial obligations, forcing it to accumulate private sector arrears and increase borrowing.
Figure 2: PA clearance revenues 1996 – 201644
Data in million USD.

26 | FAIR TAX MONITOR | 27
Figure 3 below shows that changes in clearance revenues correlate to changes in the trade balance deficit. An increase in the trade balance deficit usually indicates growth in foreign imports, thereby increasing the total value of Palestinian customs duties collected by Israel on behalf of the PA. These duties on imports via Israeli ports constitute a large part of clearance revenues, and therefore an increase in imports and trade deficit will necessarily raise public revenues.
Figure 3: Change in clearance revenues and Palestinian trade balance deficit45
Trade Deficit
Clearance Revenues
Value Added Tax - VAT
In the OPT, VAT is levied on all goods and services consumed by the population, without distinguishing between basic and luxury goods. Under the Paris Protocol, the Palestinian VAT rate cannot be two percent lower or higher than the Israeli VAT rate. Up until 2014, the VAT rate in Palestine was 17 percent, but it was lowered to 14.5 percent following a reduction in Israel. It was later raised to 16 percent when Israel raised its rate to 18 percent. In 2015, Israel lowered the rate to 17 percent, but a similar reduction is yet to be made in Palestine. Only crop production and commercial transactions carried out by charitable societies and donor organizations operating in the OPT are subject to what is called “zero VAT” i.e. they are exempt from this tax. Output VAT is collected from companies registered in the value-added tax departments, after deducting production VAT inputs and sales tax. The total VAT cost is ultimately borne by the final consumer.
Table 9: VAT revenues and its share of total tax revenues since 2008 (in NIS million)46
Year 2008 2009 2010 2011 2012 2013 2014 2015 2016 2017Local VAT 452.5 452.5 554.4 677.3 675.5 852.3 950.9 1002.9 924.6 1011.3
Clearance VAT 1387 1387 1346 1620.1 1861 2016.5 2278.3 2276.2 2686.2 2288Total Tax Revenues 4604 4604 5256 6405.6 7035 7426.4 8851.4 9962.7 11289.1 11476.1
As percentage of total tax revenues 40% 40% 36.1% 35.9% 36% 38.6% 36.5% 33% 32% 28.7%
The table above shows that VAT contributions account for between 30 to 40 percent of total tax revenues. This indicates a lack of tax justice since it is a regressive tax targeting all without distinguishing between the poor and those with high incomes. As the same VAT rate is charged to all citizens, poor individuals are taxed more heavily in proportion to their disposable income. Value Added Tax in the OPT also does not include distinct tax brackets for basic materials or luxury products with 16 percent being charged on all goods and services.

26 | FAIR TAX MONITOR | 27
Purchase/Production Tax This tax in Palestine is regulated by the Jordanian Law No. 16 of 1963,47 which set rates on local and imported products such as alcohol, cigarettes, automobiles, chemicals and some electric appliances. The tax rate on cigarettes (banderole fee) is set at 80 percent, while for automobiles it ranges from 50 to 70 percent depending on the engine size and environmental effects. The impact of this tax on local production is fairly small, with revenues not exceeding $25 million a year, while revenues from imported cars total up to $200 million a year; tax from cigarettes and tobacco generates between $50 and $100 million a year.48 All these taxes are classified under local tax revenues, not clearance revenues, and are indirect taxes borne by end consumers.
Table 10: Purchase/production tax revenues and its share of total tax revenues and GDP since 2008 (in NIS million)49
Year 2008 2009 2010 2011 2012 2013 2014 2015 2016 2017Excises on Tobacco 163.5 163.5 253.3 310.8 337.2 378.2 234.4 183.1 204.9 193.7
Excises on Beverages 1 1.4 0.8 3.4 8.6 5.7 3.3 4.4 4.6 5.1
Purchase Tax/ Clearance 12.7 12.7 14.6 0 15 2.6 6.6 -6.2 -9.9 -4.7
Total Tax Revenues 4604 4604 5256 6405.6 7035 7426.4 8851.4 9962.7 11289.1 11476.1As percentage of total tax revenues 3.8% 3.8% 5.1% 4.9% 5.1% 5.2% 2.8% 1.8% 1.8% 1.7%
GDP50 30291.4 32915.3 39601.7 40450 46234.3 44313.5 43742.9 49298 50690.3 52483.1As percentage of
total of GDP 0.59% 0.54% 0.68% 0.78% 0.78% 0.87% 0.56% 0.37% 0.4% 0.37%
This table shows a decrease in the ratio of purchase/production tax in total tax revenues: it has declined from about five percent to two percent between 2010 and 2015. The lowering in the impact of this tax is a negative trend as the contribution of taxes from luxury goods should be higher in the PA’s total tax revenues.
Fuel Tax (Petroleum Excise) Fuel tax (also called blue tax) is imposed on every kind of fuel used in the OPT. There is no law in Palestine regulating this tax and it is therefore considered a purchase or excise tax exactly like that levied on cigarettes and tobacco. The legal framework for this tax is the Jordanian Customs and Excise Law No. 1 of 1962.51 Fuel tax constitutes around 50 percent of the consumer’s final purchase price and is very similar to that applied in Israel. Like other indirect taxes, the burden of this tax is borne by the final consumer. The “blue tax” is NIS 3 per litre, in addition to the VAT imposed by the PA.52 As mentioned above, fuel tax is part of the PA’s clearance revenue. In 2016, fuel tax collected NIS 2.97 billion and represented 33.26 percent of the total clearance revenues for that year.

28 | FAIR TAX MONITOR | 29
Table 11: Petroleum excise revenues and its share of total tax revenues and GDP since 2008 (in NIS million)53
Year 2008 2009 2010 2011 2012 2013 2014 2015 2016 2017Petroleum Excise 1218.8 1218.8 1412.1 1635.5 1758.1 1970.5 2474.2 2773.8 2970.9 2903.5
Total Tax Revenues 4604 4604 5256 6405.6 7035 7426.4 8851.4 9962.7 11289.1 11476.1As percentage of total tax revenues 26.5% 26.5% 26.9% 25.5% 25% 26.5% 28% 27..8% 26.3% 25.3%
GDP54 30291.4 32915.3 39601.7 40450 46234.3 44313.5 43742.9 49298 50690.3 52483.1As percentage of
total GDP 4% 3.7% 3.6% 4% 3.8% 4.4% 5.7% 5.6% 5.9% 5.5%
Clearance Tax
This is an indirect tax levied on imports destined for the Palestinian Territories from/via Israel. Clearance tax is considered as part of the PA’s revenue collection and comprises customs, VAT, purchase tax, petroleum tax, and income tax from Palestinians working in Israel and Israeli settlements. The Israeli tax administration collects these revenues and transfers them to the Palestinian MoF at the end of each month through the clearance mechanism. The rate is 16 percent, the same as for VAT in the OPT. However, the PA can make use of developments in the Israeli VAT system. For example, Israel increased the VAT exemption threshold to NIS 100,000 versus NIS 54,000 in the Palestinian economy. Moreover, the Israeli system uses the so-called “zero file”55 to support some economic sectors.56
The occupation transfers only 75 percent of the total income tax collected by Palestinians working over the Green Line and in settlements, retaining 25 percent of the total income tax of these workers. There were 139,600 Palestinian workers in these areas in the first quarter of 2017, 48,700 of them without a work permit.57
Customs and Excise Duties These taxes are regulated by the Jordanian Customs and Excise Law No. 1 of 196258 and Israeli military orders. This type of tax is levied on private sector commodity and service imports. Under the Paris Protocol, it is collected by the Israeli customs department on behalf of the Palestinian treasury. The Paris Protocol lists that defined duty-free A and B commodities in specific quantities59 have remained unchanged since 1994. The customs duties on imported goods (except those on the lists) are similar to those applied in Israel. When Israel joined the World Trade Organization (WTO) in the mid-1990s, the tariff began to drop gradually.
In 2016, the PA generated a total of NIS 3,788.3 billion from customs (621.3 from local tax revenues and 3167 from clearance revenues).60 In 2017, the PA generated NIS 4,090.9 billion (737.2 from local tax revenues and 3353.7 from clearance revenues).
Customs and excises are the largest source of tax revenues in the OPT. In 2017, actual collections were around NIS 4.3 billion, including NIS 4,090.9 million in customs duties and almost NIS 198.8 million as excise levied on cigarettes and alcoholic beverages. This is translated into 39.4 percent of total indirect taxes. Just like VAT, the share of customs duties in tax revenues has grown steadily in the past few years due to a worsening trade deficit with countries besides Israel, and an

28 | FAIR TAX MONITOR | 29
increase in direct imports at the expense of imports via Israeli agents. In the last 10 years, trade with Israel has dropped significantly from an average of 85 percent to 73 percent.61 The substantial collection from customs duties is unlikely to continue in the future because Israel plans to abolish tariffs on all its imports as part of the requirements for its membership in the WTO. As mentioned above, Israel and Palestine comprise a single customs territory, albeit with certain exceptions.
Presumptive/Turnover Taxes
Presumptive taxes in Palestine are imposed on the income of public transportation vehicles (taxis and buses); it is classified as constant and predictable over time. This tax ranges from NIS 70 to 100 per month per car, depending on the vehicle’s source, origin and year of manufacture. The amount payable may not be high if one considers that a taxi or a bus generates an average net income of NIS 3000. Thus, the average tax rate stands at around five percent, which is the minimum tax rate by law. Presumptive tax is also imposed on regular income generated from the lease of properties and facilities of charities and public institutions. There is no presumptive tax system for the informal sector. Compliance of presumptive taxpayers, particularly taxi and bus owners, is relatively high due to the fact that the Ministry of Transportation requires that owners of such vehicles submit a Tax Compliance Certificate when they renew their vehicle licenses.
There are no exact figures available on the amount of revenue collected from this tax but it is expected to be below NIS two million a year considering that an estimated 10,000 cars, trucks and heavy duty vehicles are licensed for public transportation. The amount of revenue is considered minimal and has not changed significantly over the years.

30 | FAIR TAX MONITOR | 31
Gender Analysis of Taxes
30 | FAIR TAX MONITOR
FAIR TAXMONITOR
مؤشر العدالةالــضــريــبــيــة

30 | FAIR TAX MONITOR | 31
Gender Analysis of Taxes
Women are at an economic disadvantage in the OPT, as evidenced in data published by the PCBS in 2017 that put female unemployment at 47.8 percent versus 22.5 percent for males.62 The monthly average wage for female workers is only 76 percent of that earned by male workers. Further data indicate that women are more active in the informal sector, and that poverty rates are higher for families headed by women due to their lower participation in the formal labor market and the subsequent lower wages. With regard to capital and assets ownership, self-employed women constitute only 14 percent of this segment of the workforce. Only two percent of business owners or business CEOs in the OPT are women.
The tax law in Palestine is free from explicit biases against women, and views both women and men as taxpayers equally and neutrally. Yet, several indirect biases against women in the Palestinian tax system can be identified as follows:
• The allocation of deductions, exemptions and other tax incentives allows indirect gender discrimination to occur in a system of individual filing like that in Palestine. Typically, countries give exemptions or deductions for purposes such as dependent children, a non-working spouse and so on. Under a system of individual filing, these exemptions and deductions must be allocated across spouses. In Palestine, no joint tax filing is allowed and in single filing, the priority of claiming legal exemptions and deductions for dependents is given to the man (or the husband in the case of married couples). Women can claim these deductions and exemptions only if they head the family, are divorced or widowed. This differential treatment affects income tax liability for men and women if both are working.
• With respect to CIT, legislation on tax and private investment promotion in Palestine specifically exempts corporate income, or a significant part of it, from taxes, and even allows huge expense deductions when calculating taxable income. Promotion of tax exemptions and deductions to corporate income may encourage gender inequality in terms of the tax burden because men tend to benefit disproportionately from such exemptions. This is mainly due to the fact that they are more likely to run a business, be a shareholder or be a house-owner who can claim these deductions and exemptions. As a result, these rules introduce gender bias.
• Gains generated from trading transactions in real estate properties are often untaxed because they are not usually reported for tax calculation. This is a form of tax evasion that benefits men more than women as women are less likely to engage in this kind of economic activity. Data indicate that only five percent of women possess land or have a share in land versus 24 percent of men. Only seven percent of women own a house or real estate property versus 57 percent of men.63
• All indirect taxes may introduce implicit biases that result from different consumption patterns by men and women of goods and services, though the exact nature of these implicit biases is difficult to establish.

32 | FAIR TAX MONITOR | 33
Category 3Revenue Sufficiency and Tax Leakages
32 | FAIR TAX MONITOR
FAIR TAXMONITOR
مؤشر العدالةالــضــريــبــيــة

32 | FAIR TAX MONITOR | 33
Category 3: Revenue Sufficiency and Tax Leakages
Tax Revenues: Size and Sources
The PA relies heavily on clearance revenues and progressively less on foreign aid, both of which are outside the ambit of its control. These sources fluctuate in line with the political and economic conditions in the region, as well as on the size of the deficit in the trade balance. Local tax revenues are controlled by the PA but are relatively insignificant, with their share in overall revenue collection declining over time. The current revenue structure poses a long-term risk to the fiscal sustainability of the PA and weakens its ability to meet its current obligations.
Table 12: Public revenues and grants (cash basis) at current prices 1996-2016 (in million USD)64
Period Total
revenues and grants
Domestic revenue as percentage
of total revenues
and grants
Clearance revenue as percentage
of total revenues
and grants
Grants and aid as percentage
of total revenues
and grants
Grants to support budget
Grants to support de-velopmental expenditure
1996-1999 1,075.9 30.5% 45.3% 24.2% 15.3 245.02000-2005 1,392.8 23.4% 32.8% 43.9% 336.0 274.82006-2010 2,958.8 18.5% 34.6% 46.9% 1199.9 186.32011-2016 3,842.3 22.3% 50.6% 27.1% 915.8 144.3
Table 13: PA Public Revenues (2013-2017)65
NIS million
Item 2013 2014 2015 Actual 2016
Actual2017
Net public revenues 8,347.6 9817.4 10931.3 13598.5 12880.2Total revenues66 9181.3 10,432.3 11,495.4 13,895.7 13,385.71. Domestic revenues 3,078.5 3,114.3 3,542.4 5,023.2 4,419.41.1 Tax revenues 2,157.1 2,148.8 2,354.1 2,391 2,750.61.2 Non-tax revenues 921.3 965.6 968.6 2,309.1 1404.11.3 Earmarked Collections67 0 0 219.7 323 264.7Clearance revenues 6,102.8 7,318 7,953 8,872.5 8,966.3
Tax Revenues
Tax collection grows annually for reasons that include improvements in management efficiency; economic growth between 2008 and 2013; and an increase in imports from Israel and abroad. Currently, tax revenue covers 82 percent of the total current expenditure in the Palestinian Territories, or 22 to 25 percent of national GDP. This upward trend has helped the PA reduce its reliance on declining foreign aid and lower the public debt burden. Progress was reported in public debt and arrears in 2016, with the PA reducing private sector arrears by about $370 million and issuing NIS 607 million in promissory notes. The PA has also continued its policy of avoiding borrowing from banks, but its total public debt remained high at $4.88 billion (equivalent to NIS

34 | FAIR TAX MONITOR | 35
17.6 billion) as of the end of 2017,68 despite efforts to contain it. The PA has managed to counter some international lawsuits filed against it that would have cost the treasury millions of dollars.
The structure of tax revenues has seen no changes. Indirect taxes continue to dominate with 92 percent of total tax revenues. VAT (local and clearance) and customs tax account for almost 80 percent of indirect taxes (67 percent from clearance). Given the nature of this tax, collection is effective and covers most of the tax base, with little evasion or avoidance. However, this tax allows some revenue to leak to the Israeli treasury, as described above. In contrast, source-deducted income taxes make up a significant share of total income tax revenues, suggesting that taxes levied on the self-employed, liberal professionals, informal economic sectors and non-wage income taxes are very modest. Naturally, collection from low wage earners is very modest because under the law their income may not be subject to taxation due to exemption thresholds. Another negative aspect is that revenue collected from companies is low and not commensurate with the profits they generate, either because of evasion and avoidance or because of generous incentives (refer to the earlier CIT section).69
Non-Tax Revenues
Non-tax revenue contributed 10-15 percent of total public revenues in the last two years. According to the December 2016 MoF statement, non-tax revenues accounted for NIS 2309.1 million.70 This figure is as an exception due to the one-time collection of mobile/telecom operator license fees and dues from workers in Israel. Non-tax revenues, which have remained unchanged over the past few years, largely come from the profits of the Palestinian Investment Fund (Sovereign Fund) with an annual average of $30 million.71 The remaining $50 million come from transactions and services fees, traffic tickets and license fees from telecommunication operators: PalTel-Jawwal and Wataniya mobile, Palestine. The Palestinian economy has few natural resources and therefore, the population bears the burden of financing public expenditure.
Table 14: Non-tax revenues and share of total GDP since 2008 (in NIS million)72
Year 2008 2009 2010 2011 2012 2013 2014 2015 2016 2017Non-tax revenues 1750.7 1750.7 1134.4 915.2 954.4 921.3 965.6 968.6 2309.1 1404.1
GDP73 30291.4 32915.3 39601.7 40450 46234.3 44313.5 43742.9 49298 50690.3 52483.1As a percentage of
total GDP 5.8% 5.3% 2.9% 2.3% 2.1% 2.1% 2.2% 2% 4.6% 2.7%
The table shows that the share, size and contribution of non-tax revenues versus GDP was above five percent in 2009. It then declined against the increase in tax revenues for other years, except for 2014 and 2016 when high fees were paid by telecommunications companies.
Taxpayers
The income tax base in Palestine consists of individuals and corporations. It includes all wage earners and self-employed people in the formal sector. Since taxes paid by wage earners are deducted directly from their salaries by their employers, they are not required to file returns to the tax department. Self-employed individuals should open a tax file as registered operators in the tax department (first in the VAT division and second in the income tax division). Public and private joint stock companies are required to open income tax files. The 2011 Income Tax Law even made non-profit organizations subject to taxation and required them to open tax files.

34 | FAIR TAX MONITOR | 35
The table below provides data on the number of taxpayers registered (individuals and corporations) with the income tax and VAT directorates.
Table 15: Taxpayer Files Registered over Selected Years74
Year Income tax files* VAT/Customs files2011 105337 514002014 117279 596702016 127754 66732
*These files do not include employees of public and private sectors who pay income tax at source, estimated at around 350,000 persons.
Informal sector
The informal sector in Palestine is relatively large. According to PCBS, in 2008 there were 90,607 projects under the informal sector, classified as follows: 22.8 percent in agricultural activities; 19.6 percent in industry and construction; 42 percent in internal trade; and 14.2 percent in transportation services.
The large size of the Palestinian informal sector may contribute to considerable tax evasion and leakage. In fact, this sector may be largely responsible for the narrow tax base and for most tax evasion. MoF records have no data that detail the percentage of businesses formally registered as taxpayers. Yet, the fact that the share of income tax in total government revenue has not exceeded eight percent in recent years – substantially lower than in neighbouring Arab countries with a similar level of economic development – of which only 14 percent comes from individual taxpayers, suggests that a large share of businesses and workers are not registered as taxpayers.
Tax Exemptions
The Palestinian tax system provides two types of exemptions: 1) Income tax exemptions and breaks to formal businesses in accordance with the 1998 Investment Promotion Law and its amendments thereafter;75 and 2) VAT and customs exemptions.76
Amendments to the Investment Promotion Law in 201177 reduced the capital size of firms eligible for income tax exemption to $100,000 instead of $250,000. Recent amendments in 201478 disregarded the capital size as a condition and substituted other criteria including export capacity (40 percent of total sales); number of employees (25 at least); use of local inputs in production (70 percent of total inputs); and whether or not they are operating in priority economic sectors like information and communication technology (ICT), tourism and manufacturing. Firms meeting any one of these conditions are entitled to income tax exemption for five years.79 There are no data or studies showing any cost-benefit analyses conducted prior to introducing any new incentives.
Although these amendments may seem to respond better to the consideration of justice, they still favour large and privileged companies, thereby benefitting the rich. Obviously, the number of businesses that are potentially eligible for tax exemption is very limited and may not represent more than one percent of all the firms operating in Palestine, given that more than 99 percent of firms are classified as SMEs. SMEs are businesses with an average capital of less than $50,000; who employ less than 10 people; and sell only to local markets.

36 | FAIR TAX MONITOR | 37
VAT and customs exemptions are granted to specific beneficiaries such as those who import small quantities of consumable goods defined in lists A and B of the Paris Protocol. Exemptions are also given on the purchase invoices of firms operating in animal farming; on cars used in the operation of firms already exempt from income tax; and on cars purchased by people with disabilities or returnees in 1994 when the PA was established.

36 | FAIR TAX MONITOR | 37
Category 4Corporate Tax Exemptions:
Governance and Transparency
| 37
FAIR TAXMONITOR
مؤشر العدالةالــضــريــبــيــة

38 | FAIR TAX MONITOR | 39
Category 4 - Corporate Tax Exemptions: Governance and Transparency
As explained above, corporations are exempt from income tax and VAT when their activities comply with Palestine’s Investment Promotion Law80 implemented by the Palestinian Investment Promotion Agency (PIPA).
The Palestinian Industrial Estates and Free Zones Authority (PIEFZA), another governmental agency, works in the field of industry and investment promotion and oversees five industrial cities: Bethlehem, Jericho, Tarqumiya, Gaza and Jenin. The agency operates under the Special Act No. 10 of 1998 on Cities and Industrial Zones81 and grants investors within these areas tax exemptions in accordance with the Investment Promotion Law. The agency encourages investors with additional incentive packages (e.g. tax and customs) to operate within these areas.
Decision No. 8 of 2017 from the Council of Ministers aimed to promote investment by designing incentive packages for projects in cities and free industrial zones. It includes supplementary incentives, such as tax and customs exemptions, to be considered in addition to other incentives from previous legislation, which include:
• Tax exemptions for new projects or to develop existing projects that have not previously benefitted from other grants, for an additional three-year period, on top of the five years stipulated in the Investment Promotion Law. This tax exemption is only available within agreed-upon areas.
• Further three-year tax exemptions for the same bracket of projects that already benefit from legal incentives but have not previously benefitted from the grant program and have transferred their activities to within the approved areas. Loans granted by financing institutions and banks to finance projects in approved areas are treated as loans granted to SMEs as stated in the Income Tax Law.
• VAT exemption on goods or services purchased or imported for the purpose of conducting export-oriented economic activity.
The 2018 amendments to the Income Tax Law stipulate that 150% of the minimum wage will be an acceptable income tax deduction applicable to companies employing more than 20 employees. This is expected to apply to approximately 900 companies. The tax rate on the credit portfolio profits of small-scale banks will be reduced by raising the ceiling from $200,000 to one million USD (i.e. expanding the definition of small projects in relation to financial capacity). If realized, this will increase the beneficiaries of income tax reduction over the portfolio’s financial income, which was reduced from 15 to 10 percent in 2014. This will stimulate banks to lend their profits as they are exempt from income tax. (The profit of the portfolio directed to small enterprises was 30 percent and subject to income tax of 10 percent, while the profits of other loan portfolios were 70 percent and subject to a 20 percent income tax, while the full adjustment was transferred to the other portfolio’s profits, Other 100 percent, subject to 20 percent tax rate). 82
A Parliament Without a Job
The parliament does not participate or contribute to the legislation process due to the political fragmentation and inactivity of the Palestinian Legislation Council (PLC). The Palestinian President issues presidential decrees in accordance with the provisions of the Palestinian Basic Law. Occasionally the President shares draft decrees with parliamentary members and consults with them before issuing the decree. The absence of the PLC and its committees, particularly the

38 | FAIR TAX MONITOR | 39
financial committee, means that most decrees related to investment and tax exemptions are issued without oversight.
PIEFZA and PIPA do not have any information or reports on the exemptions granted to industrial zone investors. The list of investors’ names is not available to the public so it is not possible to ascertain whether they comply with the investment exemptions. Additionally, no financial reports on investment exemptions are published.
The media generally report studies about tax exemptions but without discussing key issues or the names of corporations that qualify for exemption.

40 | FAIR TAX MONITOR | 41
Category 5Effectiveness of the Tax Administration
40 | FAIR TAX MONITOR
FAIR TAXMONITOR
مؤشر العدالةالــضــريــبــيــة

40 | FAIR TAX MONITOR | 41
Category 5 | Effectiveness of the Tax Administration
This section assesses the ability of the tax administration to collect taxes and to determine whether the sums collected match the potential revenues if proper tax policies were in place. It also provides information on the capacity of the tax administration’s human and financial resources.
Organization
As explained earlier in this study, three general directorates are assigned the responsibility of administering the tax system: Income Tax, VAT and Property Tax. Under each of these directorates, there are offices located in the 13 governorates to facilitate the processing of tax files. In 2014, a unit for large corporate taxpayers was established and assigned the responsibility of managing the tax files of almost 400 companies. In this unit, income tax and VAT database files are linked to enable the consolidation of tax settlement and collection.
The General Directorate of Property Tax is expanding its branches to operate in different governorates. It is also cooperating with a number of municipalities, including Al-Bireh, Beitunia and Ramallah,1 regarding property tax collection.
According to the Property Tax Law, 90 percent of all property tax collections must be transferred to municipalities. However, only a small fraction of this amount is transferred due to the fact that the municipalities’ electricity and water debts are deducted through the clearance bill. Therefore, the MoF does not transfer the full amount.
Revenue Shortfalls
In the uncertain and highly unpredictable political and economic environment prevailing in Palestine, it seems that building reliable and credible revenue projections is a tough task. Although the MoF has made good progress in building these projections, variations, both positive and negative, between actual and budgeted revenues still exist in almost all years due to the uncertain conditions on the ground. The MoF started to publish revenue projections within a mid-term economic and fiscal plan in the 2017 budget. Prior to then, the projections were made arbitrarily and based on the previous year’s budget, with a percentage increase depending on judgment and consensus rather than future planning. The MoF usually conducts consultations with local stakeholders and international partners, the World Bank and IMF, but the final responsibility for these projections lies with the MoF’s senior staff.
Available data on revenues suggest that in 2015, for example, actual revenues increased by more than 10 percent in comparison with budgeted figures, and exceptionally by 148 percent in 2016. In previous years, no trend of revenue shortfalls is detected, except in years of intense political instability. However, revenue shortfalls may not provide conclusive evidence of the effectiveness of tax administration, nor are they meaningful unless revenue projections are made with extreme care and in accordance with a well-designed methodology. Of course, this is not the case in Palestine.
Resources
Sufficient human and financial resources must be allocated to tax administration departments to enable them to function effectively. The table below summarizes the number of employees in the three different tax departments between 2011 and 2017.

42 | FAIR TAX MONITOR | 43
Table 16: Staffing of tax administration 2011-201783
Department 2011 2012 2013 2014 2015 2016 2017Income Tax 328 327 324 323 327 331 332
VAT/Customs 290 300 300 301 305 309 305Property Tax 157 157 157 156 156 157 157
Source: MoF database.
The table above shows that tax administration staffing has not changed significantly. This suggests that human resources for tax administration may have been sufficient and no additional resources were required. Such a conclusion should be viewed with caution considering the zero hiring rule in place since 2010. Tax officers are regularly trained in subjects such as financial analysis, tax regulations and applications, and tax audit and electronic data processing by the Institute of Public Finance, which operates under the auspices of the MoF.
The Palestine Public Finance Institute (PPFI) was established to build skills and competencies; develop knowledge; promote governance in the Palestinian Public Financial Management (PFM) system; and to ensure the high professional standards of employees by offering educational and continuous development opportunities in PFM-related fields.84 The Institute also provides a number of courses and workshops to public sector employees, such as specialized training on taxation and taxes.85
As such, any increase in tax collection was mainly due to an improvement in the administration’s effectiveness. To explain further, the number of tax files handled per income tax employee increased from 321 files in 2011 to 385 files in 2016, while the number of tax files per VAT employee increased from 177 to 215 files in the same period. The wage expenses incurred by these departments varies in proportion to the number of employees, given that all civil servants are subject to the same salary scale and classification. The Income Tax and VAT departments incur almost the same amount of salary expenses (around NIS 12 million a year, assuming an average monthly salary of around NIS 3400), while the Property Tax department incurs half of that amount. Women make up 55 percent of the tax administration staff, with men making up just 45 percent. Yet, the majority of high-ranking positions are occupied by men, which may reflect gender bias in hiring practices and career development within the tax administration.
The table below summarizes the costs of administering the three different components of the tax systems over the last three years, where data are available.
Table 17: Total of non-wage costs per tax department 2014-2016 (in NIS)
Department 2014 2015 2016Income Tax 1,236,000 524,500 390,000
VAT/Customs 1,288,000 202,250 177,000Property Tax 1,509,000 594,405 336,500
The table shows a decrease of more than 50 percent in operating non-wage costs in 2015 compared with 2014. This is due to cost reduction measures and the imposition of controls on many expenditure item lines by the government in 2015. As a result, tax administration has
42 | FAIR TAX MONITOR | 43
become more cost effective in the last two years. Further investment is also needed to enhance tax collection and ensure optimal standards. For illustration, the total wage and non-wage cost of every NIS in tax collected locally (excluding clearance tax revenues) is so minimal that it is less than .02 for every shekel collected.
Each taxpayer registered with the tax directorates is assigned a tax identification number (TIN) and all relevant information on the taxpayer is stored under this electronic number. There has been progress in the last two years towards digitalizing the whole tax information system, including archiving tax files and related documents. An initiative to digitalize the filing of tax invoices is under way, called the “Invoice Bank”. However, at present tax files are still processed manually by staff. Tax files need to be submitted in person and in hard copy via the taxpayer or an accountant licensed to conduct tax and accounting services.
The General Directorate of Property Tax has started work on digitalizing records and tax procedures, in addition to providing services such as electronic receipts and objecting to electronic guessing. However, the process has not been completed fully yet.
Conclusion
The overall operational effectiveness of the Palestinian tax system is satisfactory and improving over time in terms of administration costs and revenue shortfalls. Property tax administration seems to be less effective than the other two bodies. However, the tax administration still needs to improve further in its collection procedures, audit functions, and tax avoidance and evasion.

44 | FAIR TAX MONITOR | 45
Category 6Government Spending
44 | FAIR TAX MONITOR
FAIR TAXMONITOR
مؤشر العدالةالــضــريــبــيــة
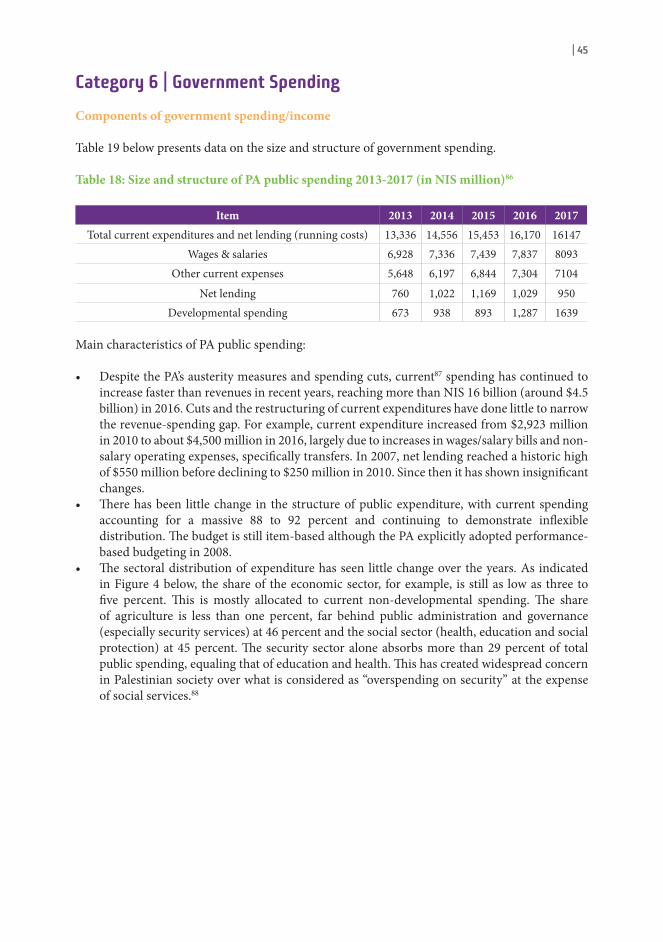
44 | FAIR TAX MONITOR | 45
Category 6 | Government Spending
Components of government spending/income
Table 19 below presents data on the size and structure of government spending.
Table 18: Size and structure of PA public spending 2013-2017 (in NIS million)86
Item 2013 2014 2015 2016 2017Total current expenditures and net lending (running costs) 13,336 14,556 15,453 16,170 16147
Wages & salaries 6,928 7,336 7,439 7,837 8093Other current expenses 5,648 6,197 6,844 7,304 7104
Net lending 760 1,022 1,169 1,029 950Developmental spending 673 938 893 1,287 1639
Main characteristics of PA public spending:
• Despite the PA’s austerity measures and spending cuts, current87 spending has continued to increase faster than revenues in recent years, reaching more than NIS 16 billion (around $4.5 billion) in 2016. Cuts and the restructuring of current expenditures have done little to narrow the revenue-spending gap. For example, current expenditure increased from $2,923 million in 2010 to about $4,500 million in 2016, largely due to increases in wages/salary bills and non-salary operating expenses, specifically transfers. In 2007, net lending reached a historic high of $550 million before declining to $250 million in 2010. Since then it has shown insignificant changes.
• There has been little change in the structure of public expenditure, with current spending accounting for a massive 88 to 92 percent and continuing to demonstrate inflexible distribution. The budget is still item-based although the PA explicitly adopted performance-based budgeting in 2008.
• The sectoral distribution of expenditure has seen little change over the years. As indicated in Figure 4 below, the share of the economic sector, for example, is still as low as three to five percent. This is mostly allocated to current non-developmental spending. The share of agriculture is less than one percent, far behind public administration and governance (especially security services) at 46 percent and the social sector (health, education and social protection) at 45 percent. The security sector alone absorbs more than 29 percent of total public spending, equaling that of education and health. This has created widespread concern in Palestinian society over what is considered as “overspending on security” at the expense of social services.88

46 | FAIR TAX MONITOR | 47
Figure 4: Distribution of public expenditure by sector in 2016
46% 45%
4%
5%
Basic Social Services (Health, Educational, and Social Protection)
Economic Development
Public Administration and Security
Other
Government Spending on Certain Sectors
Table 20 below presents key data on government spending in specific sectors that has significant implications on both sustainable development prospects and social justice.
Table 19: Size and share of spending on three sectors 2014-2017 (in NIS million)
2014 2015 2016 2017
SectorTotal
expendi-ture
Per-centage of total budget
Total expendi-
ture
Per-centage of total budget
Total expendi-
ture
Per-centage of total budget
Total expendi-
ture
Per-centage of total budget
Education 2,579,324 26.3% 2,547,530 23.3% 2,871,138 19.96% 3,039,907 20.10%Health 1,828,953 18.6% 1,352,943 12.4% 1,287,579 8.95% 1,643,127 10.8%
Agriculture 95,568 1% 122,471 1.1% 96,996 0.7% 98,750 0.7%
Source: MoF. http://www.pmof.ps/41*** Agriculture figures for 2016 and 2017 from the Public Budget Law for 2016, 2017.
Table 20: Share of spending on three sectors for 2017 per capita (in NIS)
2017Sector Total expenditure Per capita
Education 3,039,907 622Health 1,643,127 336
Agriculture 98,780 2
Spending on Education
The share of public spending on education over the past few years has averaged about 23 percent of total government expenditures, increasing from NIS 2.4 billion in 2011 to NIS 3 billion in 2017. This is higher than in neighbouring countries. However, we should not get carried away by such figures. For instance, in 2017, 65.9 percent of the education budget went on salaries and only 18.46 percent went towards development expenditures. This human resources bill means

46 | FAIR TAX MONITOR | 47
that less money reached actual education services. Ministry of Education and Higher Education staff make up 55 percent of the PA’s public servants with 56,524 employees, most of them teachers. This number has increased steadily due to the natural increase in the number of students in public schools. Recently, there has been a tendency to privatize education. Anecdotal reports demonstrate a tendency among well-off segments of the population to avoid the public school system.
On the other hand, spending on university education has followed a frugal pattern, with annual allocation barely exceeding NIS 40 million and spending on research negligible. Almost 50 percent of the education budget goes to primary education and 33.44 percent goes to secondary education. Higher education only receives 7.9 percent. In 2017 $30,152,412 were allocated from the public budget to support schools in East Jerusalem and Area “C”.89 The education budget is distributed across geographical regions or educational levels in line with population and student distribution, with no intended bias or deliberate policy of favouring one region or level over another. The costs of curriculum development, teacher training, and school buildings and furnishings are classified under the development budget and not under the recurring budget. Donors have funded 51.38 percent of this budget.
Table 21: Share of education spending in total government spending and GDP since 2011 (in NIS million)90
Year 2011 2012 2013 2014 2015 2016 2017Share of education 2179.5 2286.7 2427.2 2579.3 2547.5 2871.1 3039.9
Government spending 12058.4 12869.7 12655.3 13998 13751.1 14383.9 15186.6As percentage of total government
spending18.1% 17.8% 19.2% 18.4% 18.5% 19.3% 20%
GDP91 40450 46234.3 44313.5 43742.9 49298 50690.3 52483.1As percentage of total GDP 5.4% 4.9% 5.5% 5.9% 5.2% 5.7% 5.8%
Spending on Health Care
\On average, spending on health care has remained at around 10 percent of total public expenditures in the past few years. In 2011, this spending totaled NIS 1.2 billion, increasing to NIS 1.65 billion in the 2017 budget. The major budget items are salaries, supplies of medicine and medical equipment, and referrals to non-governmental hospitals inside or outside Palestine. Salaries of around 14,000 staff members consume about 42 percent of this budget, while 37 percent goes to supplies. The remaining resources are earmarked for other operating expenses. Similar to the education budget, no disaggregated data exist based on geography or type of health care. Spending on R&D and infrastructure facilities in the health care sector is minimal and totally funded by donors. Spending on health care may be considered as fair to the population and responds to the distribution of health care facilities. However, the geographic distribution of health facilities may lead to the conclusion that health care providers are concentrated in urban areas at the expense of rural areas. This unequal distribution of health care services can discriminate against poor families who endure extra transportation costs to receive the services needed.

48 | FAIR TAX MONITOR | 49
Table 22: Share of health spending in total government spending and GDP since 2011 (in NIS million)92
Year 2011 2012 2013 2014 2015 2016 2017Share of health 1227 1401.6 1228 1829 1359 1287.6 1643.1
Government spending 12058.4 12869.7 12655.3 13998 13751.1 14383.9 15186.6As percentage of total government spending 10.2% 10.9% 9.7% 13.1% 9.9% 9% 10.8%
GDP93 40450 46234.3 44313.5 43742.9 49298 50690.3 52483.1As percentage of total GDP 3% 3% 2.8% 4.2% 2.8% 2.5% 3.1%
Spending on Agriculture
The MoF database shows that total public spending on agriculture has remained small over the years, with insignificant changes, at around 0.7 percent of total public expenditures. Spending on agriculture increased from NIS 100 million ($30 million) in 2011 to NIS 102 million in 2014 and NIS 108 million in 2016, an annual increase of less than NIS two million. Salaries and wages represent more than 80 percent of the recurring budget, while other operating expenditures represent over 15 percent. The remaining five percent is allocated to development. The high share of salaries in the total expenditure stems from the fact that the Ministry of Agriculture’s mandate emphasizes regulatory, counselling and policy setting functions rather than engaging in development projects on the ground like landscaping, planting and farming or water management. These activities are usually carried out by farmers themselves or community-based organizations. Meanwhile, the Ministry of Agriculture hires a large number of administrative and technical staff to fulfill its responsibilities. Development expenditure remains as low as five percent of total spending on agriculture, while the remaining 95 percent is allocated to running expenses.
Table 23: Share of agriculture spending in total government spending and GDP since 2011 (in NIS million)94
Year 2011 2012 2013 2014 2015 2016 2017Share of agriculture 90.9 91.3 106.5 95.6 122.5 97 98.8
Government spending 12058.4 12869.7 12655.3 13998 13751.1 14383.9 15186.6As percentage of total government
spending 0.75% 0.71% 0.85% 0.7% 0.9% 0.7% 0.7%
GDP95 40450 46234.3 44313.5 43742.9 49298 50690.3 52483.1As percentage of total GDP 0.22% 0.2% 0.24% 0.22% 0.25% 0.2% 0.19%

48 | FAIR TAX MONITOR | 49
Category 7Transparency and Accountability
| 49
FAIR TAXMONITOR
مؤشر العدالةالــضــريــبــيــة

50 | FAIR TAX MONITOR | 51
Category 7: Transparency and Accountability
Information Availability
Despite recent reforms in the management of the Palestinian tax system, there are still several shortcomings related particularly to a lack of inclusiveness, transparency and accountability.
There is a gap in applying the principles of transparency related to the disclosure of the general budget figures as stipulated by the Organic Budget Law No. 7 of 199896 and Article 61 of the 2003 Amended Basic Law97, which states that the government shall present the draft budget to the Legislative Council at least two months prior to the start of the fiscal year.98 In almost every year since 2000, budgets were neither prepared nor approved on time. There is also a lack of transparency and community participation in developing the general budget, as well as in the availability of data from the final accounts of the previous budgets alongside an auditor report. The results of the Public Budget Transparency survey99 carried out by the Civil Society Team on Public Budget Transparency show that in 2016, the Palestinian MoF published only three out of eight documents that should be shared in accordance with transparency standards.
The optimal application of the principles of transparency and integrity requires that tax laws be clear and direct, with limited room for interpretation and no broad powers given to tax officers in the assessment and collection of taxes. One of the drawbacks of the Palestinian tax law is that it gave the Council of Ministers the right to modify tax exemptions, brackets and rates by Cabinet decision, thus breaching the rule that ‘no tax shall be levied or exemption given without a law’, as per the IMF’s Code of Good Practices on Transparency in Monetary and Financial Policies. The tax law gave unlimited powers to tax officers to assess and collect taxes, which created disputes between taxpayers and the tax department. Naturally, granting broad powers to a tax department increases the likelihood for administrative and financial corruption.
One need only look at the large number of tax cases brought before the courts to understand how different and contradictory the interpretations of the law are. The General Directorate of Income Tax (GDIT) has been criticized for not disclosing information to the public regarding the tax regime and the rights and duties of taxpayers. The GDIT does not issue leaflets or prospectuses, nor does it have a website that provides guidelines for filing taxes. Tax auditors have reported extremely complicated tax return forms used to file income taxes. In fact, the Palestinian Accountants and Auditors Association has had to hold training courses for auditors to explain these forms. The sections of the return forms to be filled by the taxpayers are extremely difficult.1
The MoF website does not provide detailed information on income tax, its brackets and rates, or even the classification of taxpayers (individuals, companies, self-employed etc). An individual requiring such information has to communicate directly with the tax department. Since Palestinian taxpayers know very little about tax law and its enforcement procedures, they always seek consulting services from tax experts for filing returns.
The need for transparency is not restricted to the behaviour of the tax authorities; taxpayers should also behave in a responsible, transparent manner. They should provide accurate information about their revenue to the relevant authority. According to the GDIT, taxpayers usually underestimate their revenues. This forces the GDIT to re-examine files and provide new estimates, which in turn creates tax disputes and increases collection costs.
1 An interview with Belal Fares, CEO, the Palestinian Accountants and Auditors Association.

50 | FAIR TAX MONITOR | 51
Article 44 of the Income Tax Law maintains the confidentiality of taxpayer information. However, the broad powers given to the tax staff (judicial police) or any tax employee with a written commission to enter any facility and retain taxpayers’ documents may harm the principle of confidentiality enshrined within the Law. The Law also allows tax staff and commissioned employees to use information obtained from the judicial police in tax courts when necessary, which allows for the abuse of rights or construing necessity based on discretion, thus harming the principle of confidentiality.
Corporations operating in Palestine are required by direct laws and regulations to publish audited interim and annual financial statements through the Capital Market Authority and Palestine Exchange. These statements and other material, non-financial information must be disclosed in an orderly and timely manner and becomes available to the public. Disclosure regulations and the Code of Corporate Governance imposed by the PCMA requires companies to publish periodic data on large and direct shareholdings, including the names of their largest shareholders and their percentage of holdings, with all corporations in fact complying with the requirement of stockholder disclosure.
Other forms of companies, mainly partnerships and sole proprietorships, are registered with the Companies Controller at the Ministry of National Economy. They are required to file periodic financial statements with that office. For tax purposes, all companies are required to register with tax departments and file tax returns with the respective departments (VAT and Income Tax), accompanied by audited financial statements at the end of the year. However, tax liabilities are determined based on the assessment of the tax officers and on negotiation with licensed accountants. All business firms file tax returns supported by audited financial statements and are required by law to disclose changes in ownerships.
Audit and Competence/Proficiency Test
Solid internal controls and external oversight are needed to ensure transparency and accountability. The absence of the Legislative Council, the holder of legislative and oversight authority, has encouraged the executive authorities to breach the principles of integrity and transparency. Usually, external controls guard against any possible misuse of power. When there is no such control, the executive bodies may abuse the powers transferred to them.
Other audit bodies such as the State Audit and Administrative Control Bureau (SAACB), charged with ensuring proper application of procedures and rules in government agencies, lack effective tools to hold executive bodies accountable. Under normal conditions, SAACB’s annual financial and administrative report would be presented to the Legislative Council for approval or rejection. Final accounts that present the actual financial results of the budget implementation, which are required under the effective laws, have been prepared just recently for 2011. They are still in progress for other subsequent years. The audit report on the final accounts for 2011100 was completed and submitted to the PLC and President in 2016.
OBI Questions
The Public Budget Law prepared by the MoF determines the different financing sources, including local tax revenues through the clearing mechanism. Also, the Local Revenues Act illustrates anticipated fees and foreign funds. The Public Budget Act illustrates government expenditure according to the responsibilities allocated to different ministries and governmental bodies. The

52 | FAIR TAX MONITOR | 53
Annual Financial Report issued by the MoF explains the difference between the actual and projected revenues for each budget item and the variances between them.
Public Engagement
Broader community participation helps to ensure more effective and transparent drafting and enforcement of the law. In the Palestinian context, lawmakers do not give enough time for taxpayers to discuss major amendments to tax legislation. More often than not, community engagement occurs after the enactment and approval of amendments.
There are no formal consultation mechanisms with civil society and citizens regarding any amendments to the Income Tax Law and annual budget. Most of these amendments are developed in the MoF, then discussed and issued in the Cabinet without engaging CSOs and citizens in any social dialogue. The only dialogue that could be identified was convened during Salam Fayyad’s period, when the 2011 Income Tax Law was passed. The government was forced to modify some sections after civil society actively protested against its initial format.
For good governance, community participation is needed to increase confidence in the tax departments, to encourage taxpayers to cooperate and file accurate tax returns, and to reduce incidences of tax evasion.
The Income Tax Law has some shortcomings related to the peremptoriness of the tax department’s decisions and the taxpayer’s right to litigation and appeal. Article 21 of the Law gave the assessor the right to reject tax returns and to withhold their justification for doing so. They only need to disclose these in a hearing session held for this purpose. The law also gave wide powers to the assessor to accept or reject a tax return, whether the information provided is true or not. The article relieved the assessor from the need to prove the invalidity of information provided by the taxpayer. The legislation gives the taxpayer the right to file an appeal against the decision of an assessor before the competent court. According to legal experts, filing a challenge before the court should be a last resort as in Palestine there are no judges specialized in considering tax disputes. There are two tax appeal courts in Palestine: one in the West Bank and another in Gaza. The judicial records do not indicate success from litigation before these courts. Therefore, the majority of taxpayers would prefer to reach a settlement with the tax departments and eventually acquiesce to the decisions of the taxation staff. In other words, the right to litigate and appeal does exist, yet it is of no tangible use to taxpayers.2
Conclusion
The administration of the tax system in Palestine still lacks sufficient transparency and accountability, and escapes effective institutional oversight. These gaps make it easier for the rich to evade or avoid taxes, thus jeopardizing tax justice. Companies and individuals very often succeed, through designated accountants, in benefitting from the loopholes in the tax system to pay lower taxes than they should. These companies benefit from many tax deductions and exemptions and may be considered as under-taxed.
2 An interview with Khalil Rizq, Head of the Federation of Palestinian Chambers of Commerce, October 12, 2015.

52 | FAIR TAX MONITOR | 53
Concluding Remarksand General Recommendations
| 53
FAIR TAXMONITOR
مؤشر العدالةالــضــريــبــيــة

54 | FAIR TAX MONITOR | 55
Concluding Remarks and General Recommendations:
The occupation of Palestine is the biggest hurdle hindering development and blocking the development of the Palestinian economy. It also prevents Palestinians from controlling their borders, which limits their ability to enforce customs and duties. In addition to the full siege on the Gaza Strip, which prevents imports and exports, restrictions on the movement of Palestinian labor has resulted in the systematic destruction of the economy there.
The reason for the lack of changes in taxation in the OPT lies in the fact that the Paris Protocol, an agreement on economic relations signed in 1994 between the PLO and Israel, the occupying power, created an effective trade union between two signatories. It gave the PA full authority over direct taxation policy but limited its authority over indirect taxes. The PA has used this limited space to introduce some changes to the indirect taxation system that have improved the quality of tax administration.
In addition, Palestinian political fragmentation has contributed to separating the West Bank economy from that of the Gaza Strip, preventing the Palestinian government from collecting most of the taxes from Gaza. The PLC has also failed to fulfil its role in legislation and oversight of the government. The President has the power to issue laws and to amend them without any legislative oversight or community considerations.
The economic vision of the Palestinian government sees taxation as an essential tool to collect revenues but does not link it to tax justice. Thus, any tax reforms will not fully achieve their goal until the government changes its tax vision.
Palestinian civil society and the media do not prioritize taxation and treat it as a financial and technical issue. Although some NGOs engage in limited activities, there is no systematic lobbying and advocacy work about tax justice.
This study found that the Palestinian tax system is far from being fair and does not serve its social objective, which is to facilitate the delivery of public services and to contribute to the redistribution of income and wealth among the various social groups. The system has not only failed to mobilize sufficient financial resources for the State Treasury to cover its public expenditure, but also suffers from weak and inefficient management. This has allowed tax evasion and avoidance, and has resulted in a lack of transparency, oversight and accountability. For a just tax system, this study proposes the following general recommendations, with specific recommendations at the end of each category in the study:
(a) Budget Format
The form of budget is still classified as an item line budget despite the fact that the Government decided to move to programme-based budgeting in 2008. Little progress has been made towards this objective for many reasons, including the technical rigidity of the accounting system. This format has many shortcomings, most importantly the complexity of linking planning with budgeting, and limitations on monitoring the results. This type of budget has also been criticized for its “neutrality” towards the needs and priorities of society and for not being linked to national plans. This type of budget is also inflexible and does not enable efficient use of available resources.
• The Government needs to shift its budget from item-based to one based on programmes and performance. This shift could start gradually with the budgets of ministries that provide basic social services such as education, health and employment.

54 | FAIR TAX MONITOR | 55
• The Government needs to move towards the application of gender-responsive budgeting by adopting economic and social policies that respond to the different needs of males and females. This is an important tool in reducing gender inequality, as it is in almost all Arab countries.
(b) Tax Policy
Justice and efficiency considerations should be a priority in tax reform rather than increasing the tax burden on individuals in resource-poor countries. In fact, these countries suffer from the unfair distribution of the tax burden, with the less advantaged bearing the brunt. Taxpayers, especially middle-class and low-income groups, cannot pay more taxes so taxes must be restructured to transfer part of this burden to the rich and large companies:
• The tax policy needs restructuring to ensure more focus on the collection of direct tax revenues (income and wealth) rather than indirect taxes (consumption taxes).
• It is important to increase the number of tax brackets to ensure better social equity. It is also important to raise marginal tax rates on the personal income of high-income categories and for investment activities (which will yield large and rapid profits) and reduce tax rates for low-incomes and SMEs. Thus, it is necessary to adopt a progressive tax policy on income.
• Redesign tax incentives to target fewer large investments and more SMEs, which account for more than 95 percent of businesses. These investments contribute significantly to both GDP and the labor market, while also playing a very important role in redistributing income and wealth, and reducing disparities between regions in the OPT. Tax incentives must also target entrepreneurial initiatives by young men and women.
• Tax incentives should be subjected to cost-benefit analysis on a periodic basis to capture their contribution to economic growth, labour and development.
• The tax burden must be reconsidered to contribute to social justice. This requires a review of the current tax base to include non-traditional activities and non-productive and non-value-added activities that generate high and rapid profits, such as real estate transactions and speculations in financial markets. At the same time, it is important to reform exemptions for low-income individuals and businesses engaged in productive activities located in fragile rural areas. Further policies for higher value-added activities and those that create new jobs are expected. Controls must be applied to ensure that companies pay the actual taxes due on their incomes and to reduce their tax evasion practices.
• It is also necessary to consider economic and social objectives. It is also important to tailor taxation to the social and economic conditions of taxpayers, such as offering tax advantages based on dependency, university education and health, and to extend preferential treatment for productive activities and vulnerable regions. Income tax laws should be reformed to increase the minimum income threshold, taking into account the country’s poverty lines and inflation rate.
• Apply strict rules to combat all forms of corruption and tax evasion in tax administration departments; ensure transparency and specify clear and decisive instructions regarding the assessment of the fair taxable income by tax officials. The horizontal rather than the vertical expansion of tax collection should be pursued to increase collected tax revenues without increasing the tax burden on committed taxpayers.
• Expand community participation, give preference to dialogue and discussion with social groups affected by tax legislation, and enhance the role of civil society by broadening the concept and applications of community accountability. This will contribute to enhancing cooperation, acceptance and understanding of the government’s goals and objectives in the field of taxation. It will also improve external control over the performance of executive bodies.
56 | FAIR TAX MONITOR | 57
• Tax laws and procedures should be clear and transparent, allowing for better external oversight (by the public, CSOs etc.). Building an effective audit system would maintain the rights of both the taxpayer and the tax department.
• It is necessary to improve the tax department’s outreach through annual and periodic reports on total tax revenues and channels of spending. Access by taxpayers to this information should be made easier through leaflets and other means of communication. It would also be possible to hold training sessions for taxpayers.
• Enforce strict standards to combat various forms of corruption in tax departments; ensure transparency; and define clear and decisive instructions for estimating income to regulate assessment by tax staff.
Tax Administration:
• Enhance transparency within PIEFZA and PIPA by publishing information and reports on investment exemptions, including investment assessment, financial analysis, the cost of investment exemptions and the names of investors.
• Work with SAACB on prioritizing tax evasion cases and document them in published audit reports.
• Collaborate with different media platforms and allocate resources to improve public awareness of tax evasion and avoidance.▶ Enhance coordination between tax departments and taxpayer representatives
(particularly trade unions) through a digital tax system; and exchange information with other government departments.
▶ Support the tax department with the financial resources and logistics needed to build staff capacity.
▶ The tax administration should expand community engagement and outreach through discussions with relevant groups. Community participation would enhance cooperation and accountability, help the government realize the goals of the tax system and strengthen external oversight on the performance of executive bodies.
▶ Tax laws and procedures should be clear and transparent to allow for better external oversight by the public and CSOs etc. An effective audit system would maintain the rights of both the taxpayer and the tax department.
▶ It is necessary to improve the tax department’s outreach through annual and periodic reports on total tax revenues and channels of spending. The taxpayer’s access to information should be made easier through leaflets and other means of communication. The tax administration should provide regular training for taxpayers in tax regulations, procedures and compliance.
▶ Enforce strict standards to combat various forms of corruption in tax departments; ensure transparency; and define clear and decisive instructions for estimating income to regulate assessments by tax staff.
(c) Government Spending
• Restructure government spending by reallocating more resources to public investments because of their long-term positive economic outcomes and sustainability.
• Reconsider the share of wages in total expenditure. This is currently very high and could be audited to exclude the payment of wages for fictitious employees, i.e. “purifying the payroll bill».
• Increase financial resources for social security and service programs that particularly benefit the poor. There is also a need to create, design and fund programmes to generate jobs for young men and women.

56 | FAIR TAX MONITOR | 57
• Increase the resources allocated to productive sectors such as agriculture, and to light and traditional transformative industries.
• Support for basic goods and services must be restructured to target the poor more than the rich.
• Government spending on arms and security must be reduced or rationalized and any financial surpluses should be channeled into social services and economic empowerment.
Based on the above, CSOs can lead an advocacy campaign focusing on two specific aspects:
• First: Advocate for amendments to the Income Tax Law that would increase tax brackets to become more progressive, as well as imposing a tax on wealth and real estate.
• Second: Deliver a campaign, in partnership with the media, to raise awareness of tax and tax evasion.
This will require raising the awareness of CSOs, building their capacities, and building a coalition to lead and implement the campaign.

58 | FAIR TAX MONITOR | 59
Reference
58 | FAIR TAX MONITOR
FAIR TAXMONITOR
مؤشر العدالةالــضــريــبــيــة

58 | FAIR TAX MONITOR | 59
Reference1 UN A/55/100 Report of the UN High-level Panel on Financing for Development, 2000 http://www.un.org/en/ga/
search/view_doc.asp?symbol=A/55/1000.2 See, for example, the Arab NGO Network for Development’s comparative study on tax systems in six Arab coun-
tries, 2014. www.aand.org.3 IMF 2014a: https://www.imf.org/external/np/pp/eng/2014/012314.pdf.4 Abdelkarim, Naser (2016), Assessment of Income Tax Policy in Palestine from Social Justice Perspective, MIFTAH,
Policy Paper.5 Gini Coefficient is a measure of the deviation of the distribution of income among individuals or households within
a country from a perfectly equal distribution. A value of 0 represents absolute equality, while a value of 100 repre-sents absolute inequality.
6 http://www.ps.undp.org/content/dam/papp/docs/Publications/UNDP-papp-research-PRC_Building%20Econom-ic%20Resilience%20.pdf.
7 Development Finance International and Oxfam report, The Commitment to Reducing Inequalities Index 2018. Oc-tober 2018.
8 Palestinian Central Bureau of Statistics (PCBS), Survey of National Accounts, various reports.9 Ibid., Average Daily Wage in NIS 2000-2015. Link: http://www.pcbs.gov.ps/Portals/_Rainbow/Documents/wages-
2015-01e.html. 10 See PCBS, Labor Market Survey, various Quarterly Reports; and Belal Al-Fallah, 2014, Evaluation of Employers’
Compliance with Minimum Wage Regulations in the West Bank, MAS.11 See, UNCTAD (2017), The Occupied Palestinian Territory: Twin-Deficits or Imposed Resource Gap?, Geneva.12 Jaber, Firas (2017), Colonial Taxation, Social and Economic Policies Monitor (Al Marsad).13 Ibid.14 The FTM is a unique evidence-based advocacy tool, developed by Oxfam and Tax Justice Network Africa (TJNA),
that identifies the main bottlenecks within tax systems and provides strong evidence for advocacy work at nation-al and international levels. The tool allows for a comparison of tax policies and practices in different countries, using a standardized methodology and unified research approach, thanks to a jointly developed common research framework. This study builds on the experience of and research conducted by Oxfam, TJNA, and local partners in Bangladesh, Uganda, Pakistan and Senegal. The FTM project was started in December 2014. The overall goal is to strengthen global and local advocacy activities. It provides an overview of national tax systems and identifies the main challenges they face. The tool provides reliable evidence for the advocacy and lobby work of our partners, which strengthens their position and increases their credibility as well as their influencing power. Furthermore, the FTM compares key elements of tax systems and thus complements the activities of Oxfam’s global Even it Up! campaign and TJNA’s activities in Africa. The project focuses on tax policies and practices and, deliberately, it pays only limited attention to issues related to public expenditure.
15 For the full protocol please see: https://www.paltrade.org/upload/agreements/Paris%20Economic%20Protocol.pdf.16 PCBS. 2018. Press Release. http://www.pcbs.gov.ps/postar.aspx?lang=ar&ItemID=3018.17 In accordance with the Paris Protocol on Economic Relations signed in 1994 between the PLO and Israel, the PA
has a full authority over direct taxation but very limited authority over indirect taxation due to the fact that this Protocol calls for the adoption of “the Custom Union or Envelope” relating to trade relations. This clause ties VAT and custom rates applied by the PA to that of Israel.
18 Ibid.19 An interview with Imad Abu Sabha, Acting Director General of Income Tax Administration at the Ministry of Fi-
nance (MoF). 20 Please review CRI for more information about how social protection in Palestine is being covered under the spend-
ing pillar.21 The Universal Declaration of Human Rights. Article 22.22 PCBS. 2018. Press Release “On the Eve of May 1st, PCBS President Ms. Ola Awad presents the current status of
Palestinian labour force on the occasion of International Workers’ Day”.23 Ibid., Poverty Profile in Palestine, 2017.24 Ibid., Living Standards in Palestine, 2017.25 Jaber, Firas. Rosa Luxemburg Stiftung, Regional Office, The Social Security Law in Palestine: A Seek for Justice,
January 2017.26 Ibid.27 Please see: http://muqtafi.birzeit.edu/pg/getleg.asp?id=16266.28 Ibid.29 Please see: http://muqtafi.birzeit.edu/pg/getleg.asp?id=16576.30 Please see: http://muqtafi.birzeit.edu/pg/getleg.asp?id=16702 and http://muqtafi.birzeit.edu/pg/getleg.as-
p?id=16814.31 Palestinian Ministerial Council. Ministerial Council Meeting (193). 2018 http://www.palestinecabinet.gov.ps/Website/ar/ViewDetails?ID=41298.

60 | FAIR TAX MONITOR | 61
32 Ibid.33 See The Ministry of Planning, National Development Plan 2008-2010, Building State Institutions and Draft Budget
Laws 2009-2011.34 MoF. http://www.pmof.ps/41.35 Approximately 95 percent of income tax is collected locally, the remainder is collected by Israel and transferred to
the PA Treasury through the clearance system. Direct tax includes: local income tax and property tax. Income tax is collected by the Occupation.
36 Abdelkarim, Naser (2016), Assessment of Income Tax Policy in Palestine from Social Justice Perspective, MIFTAH, Policy Paper.
37 Institute for Economic Policy Research - MAS. Background Paper: Amendments to the Income Tax Law - Objec-tives and Expected Results. June 2015.
38 Ibid.39 Please see: http://www.pmof.ps/92.40 MoF. Financial Reports 2017. Fiscal Operations: Revenues, Expenditures and Financing Sources. Palestine. http://
www.pmof.ps/documents/10180/813287/merged_2017+dec+all+new++arab.pdf. 41 Ibid. http://www.pmof.ps/41, http://www.pmof.ps/web/gdpt/70. 42 The authors estimated the property tax for 2008 to 2010 based on MoF reports.43 The cumulative monthly financial report for December 2017, MoF, 10 May 2018. http://www.pmof.ps/docu-
ments/10180/813287/decrep+2016+arab.pdf44 Palestine Monetary Authority, www.pma.ps.45 PCBS: Trade Balance Deficit Data; and MoF: Clearing Revenues Data.46 MoF. http://www.pmof.ps/41. Value Added Tax (VAT) is an important source of tax and public revenues, accounting
for 30 to 38 percent of total tax revenues. A large part of VAT, as shown in Table 4, comes through clearance. VAT that comes through clearance is two or three times more than that of local VAT.
47 Please see: https://www.qistas.com/legislations/jor/view/80798. 48 MoF. Financial Reports 2017. Fiscal Operations: Revenues, Expenditures and Financing Sources. Palestine http://
www.pmof.ps/documents/10180/813287/merged_2017+dec+all+new++arab.pdf. 49 Ibid., http://www.pmof.ps/4150 The GDP value in USD is from PCBS: http://www.pcbs.gov.ps/Portals/_Rainbow/Documents/E.NA_Con-
stant-2015.htm. The exchange rate from USD to NIS uses the actual rate provided by MoF reports: http://www.pmof.ps/41.
51 Please see: http://qanon.ps/news.php?action=view&id=16648. 52 United Nations Conference on Trade and Development (UNCTAD). Palestinian Fiscal Revenue Leakage to Israel
under the Paris Protocol on Economic Relations. 2014. http://unctad.org/en/PublicationsLibrary/gdsapp2013d1_en.pdf.
53 MoF. http://www.pmof.ps/41.54 The GDP value in USD is from PCBS: http://www.pcbs.gov.ps/Portals/_Rainbow/Documents/E.NA_Con-
stant-2015.htm. The exchange rate from USD to NIS is calculated using the actual rate provided by the MoF reports: http://www.pmof.ps/41.
55 Certain items are zero rated, including exported goods and the provision of certain services to non-residents.56 Abdel Razeq, Omar (2016), Assessing the Fiscal Policy of the Palestinian National Authority, MAS.57 Jaber, Firas (2017), Colonial Taxation, Social and Economic Policies Monitor (Al Marsad).58 Please see: http://qanon.ps/news.php?action=view&id=16648. 59 For more information please read: https://info.publicintelligence.net/lse.pdf. 60 MoF. http://www.pmof.ps/41.61 PCBS, Trade Statistics, 2010-2017.62 PCBS. 2018. Press Release “On the Eve of May 1st, PCBS President Ms. Ola Awad presents the current status of
Palestinian labour force on the occasion of International Workers’ Day”.63 Ministry of Women’s Affairs. Cross Sectorial National Gender Strategy: Promoting Gender Equality and Equity
2011-2013.64 The authors worked out the rates based on data obtained from regular MoF reports on revenues, expenditure and
sources of financing.65 MoF. http://www.pmof.ps/41. 66 Net revenues = total revenues- tax rebates or returns for VAT exempted imports like agricultural production inputs.67 Earmarked collections and earmarked payments are collections from taxes and revenues due to LGU, 90 percent of
property tax and 50 percent of transportation fees.68 MoF. http://www.pmof.ps/41.69 More details on tax exemptions and advantages granted to companies are presented in other sections of this study. 70 MoF. http://www.pmof.ps/41.71 Palestinian Investment Fund. Annual Report 2017. http://www.pif.ps/files/annual_report/AnnualReport2017en.pdf.72 MoF. http://www.pmof.ps/41

60 | FAIR TAX MONITOR | 61
73 The GDP value in USD is from PCBS: http://www.pcbs.gov.ps/Portals/_Rainbow/Documents/E.NA_Con-stant-2015.htm. The exchange rate from USD to NIS uses the actual rate provided by MoF reports: http://www.pmof.ps/41
74 Source: MoF database.75 The size of capital for companies eligible for income tax exemption was 100,000 USD in the original law, before it
increased to 250,000 USD.76 Please see: http://muqtafi.birzeit.edu/pg/getleg.asp?id=12442.77 Please see: http://muqtafi.birzeit.edu/pg/getleg.asp?id=16239.78 Please see: http://muqtafi.birzeit.edu/pg/getleg.asp?id=16582.79 Interview with the Director General of the PIPA, Mr. Haithem Wheidi, Ramallah, August 2016.80 Please see: http://www.pipa.ps/files/file/investment-law.pdf.81 Please see: http://muqtafi.birzeit.edu/pg/getleg.asp?id=12690.82 Jamil, Misyef. (March 2018). Public Budget 2018: Reconciliation and financial scenarios, tax development and
amendments. Palestine Economic Policy Research-MAS.83 The ratio of all tax staff to population is 1:6800, meaning one tax officer for every 6800 people.84 Palestine Public Finance Institute (PPFI), http://www.ppfi.ps/ar/الرئيسية/.85 Ibid. Training Manual. 2017. http://www.ppfi.ps/wp-content/uploads/2017/08/Files/TrainingManual.pdf.86 Naser Abdelkarim, Coalition for Accountability and Integrity - AMAN, (2016), Potential Areas of Budget Cut,
Policy Paper.87 The terms current expenditures, current spending and current expenses are used interchangeably in this text.88 See Naser Abdelkarim, AMAN, OPT.89 The Palestinian Initiative for the Promotion of Global Dialogue and Democracy (MIFTAH). 2017 Ministry of Edu-
cation and Higher Education citizen budget. http://miftah.org/Publications/Books/CitizenBudget2017BAr.PDF.90 MoF. http://www.pmof.ps/41.91 The GDP value in USD is from PCBS: http://www.pcbs.gov.ps/Portals/_Rainbow/Documents/E.NA_Con-
stant-2015.htm. The exchange rate from USD to NIS is calculated using the actual rate provided by MoF reports: http://www.pmof.ps/41.
92 MoF. http://www.pmof.ps/41.93 The GDP value in USD is from PCBS: http://www.pcbs.gov.ps/Portals/_Rainbow/Documents/E.NA_Con-
stant-2015.htm. The exchange rate from USD to NIS is calculated using the actual rate provided by MoF reports: http://www.pmof.ps/41.
94 MoF. http://www.pmof.ps/41.95 The GDP value in USD is from PCBS: http://www.pcbs.gov.ps/Portals/_Rainbow/Documents/E.NA_Con-
stant-2015.htm. The exchange rate from USD to NIS is calculated using the actual rate provided by MoF reports: http://www.pmof.ps/41.
96 Please see: http://muqtafi.birzeit.edu/pg/getleg.asp?id=12668.97 Please see: http://muqtafi.birzeit.edu/pg/getleg.asp?id=14138.98 Article 61 of the 2003 Amended Basic Law. 99 AMAN Coalition. https://www.aman-palestine.org/en/activities/6413.html.100 SAACB. Audit Opinion on Final Accounts 2011. http://www.saacb.ps/en/BruRpts/Accounts2011Report.pdf.
