fairfax county streams mapping project - quality control
TRANSCRIPT

FAIRFAX COUNTY STREAMS MAPPING PROJECT Quality Control/Quality Assurance Methodology and Results December 2004
Stormwater Planning Division Department of Public Works and Environmental Services County of Fairfax, Virginia

TABLE OF CONTENTS
Introduction ..................................................................................................................................... 1 Background ..................................................................................................................................... 1
The Chesapeake Bay ................................................................................................................... 1 The Chesapeake Bay Watershed ................................................................................................. 1 Fairfax County within the Chesapeake Bay Watershed ............................................................. 2 Chesapeake Bay Protection......................................................................................................... 2
Definitions....................................................................................................................................... 5 Quality Control/Quality Assurance (QC) Study ............................................................................. 5
Methodology ............................................................................................................................... 5 Results ......................................................................................................................................... 5
Recommendations ......................................................................................................................... 15 Next Steps ..................................................................................................................................... 16
APPENDICES
Appendix A: Protection Area Review and Additional Site Data ................................................... ii Appendix B: Perennial Stream Field Identification Protocol ....................................................... iii Appendix C: Perennial Stream Field Data Sheet ......................................................................... xx Appendix D: Glossary of Terms ................................................................................................ xxii Appendix E: List of Acronyms and Abbreviations.................................................................... xxv

Perennial Streams QC Study Report 12/12/2012
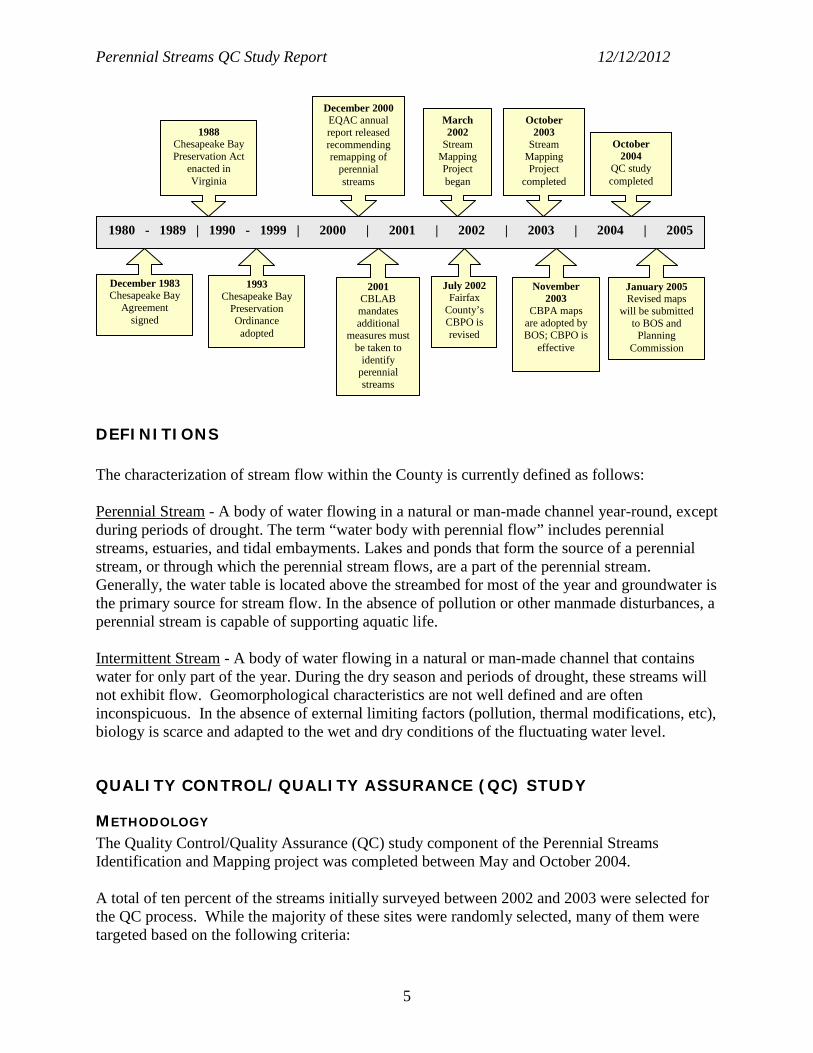
INTRODUCTION Nature has always been under pressure from human populations; the only thing that has really changed over time is the size and complexity of those pressures. In the last 100 years, government has tried to implement numerous policies to protect the Chesapeake Bay from adverse human impacts such as nutrient over-enrichment, dwindling underwater grasses, and toxic pollution. In 1988, the Commonwealth of Virginia through the Chesapeake Bay Local Assistance Board (CBLAB) approved the Chesapeake Bay Preservation Act (Bay Act). The Bay Act required the 84 Virginia communities, including Fairfax County, which border on the tidal portions of rivers that drain into the Chesapeake Bay (Tidewater jurisdictions) to institute water quality protection measures to improve the declining health of this unique national resource and its tributaries. In order to comply with the Bay Act, the Fairfax County Board of Supervisors enacted the Chesapeake Bay Preservation Ordinance in 1993 which regulates the type of development that can occur in sensitive areas along the streams that drain into the Potomac River and eventually the bay. In December 2001, CBLAB mandated additional measures that must be enacted by all Tidewater jurisdictions. The state mandated that Fairfax County and other Tidewater jurisdictions implement these changes to the regulation by December 31, 2003. The revisions include a requirement to perform site-specific surveys using a scientifically valid method to identify water bodies with perennial flow. Fairfax County implemented these changes by amending the Chesapeake Bay Preservation Ordinance in 2003. The amendment required Fairfax County’s Department of Public Works and Environmental Services (DPWES) to protect perennial streams in the county by field verifying the perennial steams marked on the U.S. Geological Survey 7.5 minute topographic quadrangle maps. Additionally, a Quality Control/Quality Assurance (QC) process was required to check the accuracy and precision of the perennial stream determinations. This report presents the methodology and results of the QC survey conducted in 2004, as well as recommendations and next steps suggested by DPWES.
BACKGROUND
THE CHESAPEAKE BAY The Chesapeake Bay is nearly 200 miles long and is 35 miles wide at its widest point. The Bay is the largest estuary in the United States. and is home to more than 3,600 species of plants, fish, and animals. The Bay provides habitat and food for these species and serves as a commercial and recreational resource for the more than 15 million people who live in its watershed. Every year, the Bay produces 500 million pounds of seafood.
THE CHESAPEAKE BAY WATERSHED A watershed is the area of land drained by a water body, such as a river, stream, lake, or bay. The size of a watershed can vary from a few acres for a small stream to many thousand square
1

Perennial Streams QC Study Report 12/12/2012
miles. A large watershed will have subwatersheds within it and will be part of a larger river basin. The Chesapeake Bay watershed is comprised of 64,000 square miles of land in parts of six states (Delaware; Maryland; New York; Pennsylvania; Virginia; and West Virginia) and the entire District of Columbia. The Chesapeake Bay and its tributaries (streams and rivers that supply water to the Bay) cover more than 4,500 square miles, and include an estimated 18 trillion gallons of water.
FAIRFAX COUNTY WITHIN THE CHESAPEAKE BAY WATERSHED Fairfax County, located in Northern Virginia, has an area of approximately 400 square miles and over one million residents. Within the county are 30 subwatersheds which all drain to the Potomac River. These 30 watersheds are part of the larger Potomac River watershed, which, in turn, is part of the even larger Chesapeake Bay watershed. Everything Fairfax County residents do on the land impacts the quality of local streams, the Occoquan Reservoir, the Potomac River, and eventually the Chesapeake Bay. The source of water for any water body comes from groundwater and surface runoff. Groundwater is water from rain and snow that has soaked into the ground. Conversely, surface runoff is water from rain and melting snow that cannot be absorbed into the ground due to impervious surfaces and therefore travels over land until reaching a water body. Before reaching a stream, surface runoff accumulates from the highest points in a watershed and flows downhill across lawns, rooftops, parking lots, roads, and other impervious surfaces, picking up many contaminants along the way. All surface runoff flows into streams and the Potomac River until reaching the Chesapeake Bay. Contaminants such as the discharge from damaged sewage pipes, industrial outfalls, uncontained oil spills, cigarette butts, pet waste, fertilizers, pesticides and more, travel with runoff to also reach the Bay. When soil erodes from farmland or a construction site, the uncontrolled sediment also travels with runoff to reach the Bay. The combination of runoff and the contaminants it carries have resulted in poor water quality in the Chesapeake Bay.
CHESAPEAKE BAY PROTECTION In December of 1983, the governors of Maryland, Virginia, and Pennsylvania; the mayor of the District of Columbia; the administrator of the EPA; and the chair of the Chesapeake Bay Commission, signed the first Chesapeake Bay Agreement. The stated goals of the 1983 Chesapeake Bay Agreement were to implement coordinated plans to improve and protect water quality and living resources of the Chesapeake Bay estuarine system. This Agreement established a unique tri-state partnership that recognized the regional importance of the Bay and the substantial problems associated with establishing environmental policy for an area that spans a diverse geographic and political area. In 1988, the Commonwealth of Virginia through CBLAB enacted the Chesapeake Bay Preservation Act (Bay Act) to comply with the 1983 Chesapeake Bay Agreement. The Bay Act required the 84 Virginia communities that border on tidal portions of rivers that drain into the Chesapeake Bay (Tidewater jurisdictions), including Fairfax County, to institute water quality
2

Perennial Streams QC Study Report 12/12/2012
protection measures to improve the declining health of this unique national resource and its tributaries. The goal was to plan for and manage the adverse environmental impacts of growth and development in a manner that balances the objectives of improved water quality and continued growth. One method to plan for and manage such impacts is to manage the land. The Bay Act directed each Tidewater jurisdiction to designate Chesapeake Bay Preservation Areas, which is land that if improperly used or developed could have the potential to cause significant harm to the water quality and adversely impact the Bay. These Chesapeake Bay Preservation areas could be divided into Resource Protection Areas (RPAs) and Resource Management Areas (RMAs). To comply with the Bay Act, the Fairfax County Board of Supervisors enacted a Chesapeake Bay Preservation Ordinance (Ordinance) in 1993 that regulates the kinds of development that can occur in Chesapeake Bay Preservation Areas in Fairfax County. The 1993 Ordinance states that RPAs shall consist of sensitive lands at or near the shoreline that have intrinsic water quality value due to the ecological and biological processes they perform or are sensitive to impacts that may cause significant degradation to the quality of state waters. In their natural conditions, these lands provide for the removal, reduction, or assimilation of sediments, nutrients, and potentially harmful or toxic substances in surface runoff entering the Bay and its tributaries, and minimize the adverse effects of human activities on state waters and aquatic resources. The Resource Protection Area shall include:
1. Tidal wetlands; 2. Nontidal wetlands connected by surface flow and contiguous to tidal wetlands or
tributary streams; 3. Tidal shores; 4. Such other lands under the provisions of subsection A of 9 VAC 10-20-80 necessary
to protect the quality of state waters; 5. A buffer area not less than 100 feet in width located adjacent to and landward of the
components listed in subdivisions 1 through 4 above, and along both sides of any tributary stream.
Under the 1993 CBPO, a tributary stream is defined as any perennial stream that is so depicted on the most recent U.S. Geological Survey 7.5 minute topographic quadrangle map (scale 1:24,000). The remainder of the land in Fairfax County has been designated as a Resource Management Area (RMA). RMAs are comprised of lands that, if improperly used or developed, have a potential for causing significant harm to the water quality or for diminishing the functional value of RPAs. In December of 2001, CBLAB adopted amendments to the Chesapeake Bay Preservation Area Designation and Management Regulations. The centerpiece of the revised state regulations is that RPAs must now be designated around all water bodies with perennial flow. Perennial flow means that water always flows in the stream or other water body except during periods of drought. The difference between the old language and the amended language is the replacement
3

Perennial Streams QC Study Report 12/12/2012
of “tributary streams” with “water bodies with perennial flow.” The state mandated that Fairfax County and other Tidewater jurisdictions implement these changes to the regulation by December 31, 2003. The revisions include a requirement to perform site-specific surveys using a scientifically valid method to identify water bodies with perennial flow. In 2002, the Fairfax County Department of Public Works and Environmental Services created a Perennial Stream Field Identification Protocol and Data Sheet to address the new regulations. The protocol is used for making site specific field determinations between perennial and non-perennial (intermittent or ephemeral) streams and supports fieldwork for the Fairfax County Perennial Streams Identification and Mapping project. Several existing protocols were used to develop this protocol including the following: • North Carolina Division of Water Quality’s “Perennial Stream Reconnaissance Protocols,”
January 2000. Version 2.0. • U.S. Corps of Engineers “Branch Guidance Letter No 95-01: Identification of Intermittent
versus Ephemeral Streams—Not Ditches,” October 1994. • Virginia Chesapeake Bay Local Assistant Department’s “Very Rough Draft Guidance for
Making Perennial vs. Intermittent Stream Determinations,” December 2000. • Williamsburg Environmental Group, Inc. “Qualitative Field Procedures for Perennial Stream
Determinations.” [unpublished manuscript] Corresponding Author: D.A. DeBerry. The determination between perennial and intermittent streams is based on the combination of hydrological, physical and biological characteristics of the stream. Field indicators of these characteristics are classed as primary or secondary and ranked using a four-tiered, weighted scoring system. The protocol developed and used by County staff was reviewed by CBLAB and approved as an acceptable method of determining perennial streams. All headwater streams in the County were surveyed from March 2002 through October 2003 and new RPA maps were published in November 2003, increasing the total length of RPA from 520 miles to 850 miles. Fairfax County’s Board of Supervisors approved the amendments which became effective on November 18, 2003. The recent amendments will improve the health of the Chesapeake Bay and will also safeguard the quality of Fairfax County’s rivers and streams. This report presents the results of the Quality Control/Quality Assurance (QC) study. The goal of the QC study was to assess both the accuracy and precision of the field surveys based on an evaluation of streams under different hydrologic conditions than the original survey was completed.
4
Perennial Streams QC Study Report 12/12/2012
DEFINITIONS The characterization of stream flow within the County is currently defined as follows: Perennial Stream - A body of water flowing in a natural or man-made channel year-round, except during periods of drought. The term “water body with perennial flow” includes perennial streams, estuaries, and tidal embayments. Lakes and ponds that form the source of a perennial stream, or through which the perennial stream flows, are a part of the perennial stream. Generally, the water table is located above the streambed for most of the year and groundwater is the primary source for stream flow. In the absence of pollution or other manmade disturbances, a perennial stream is capable of supporting aquatic life. Intermittent Stream - A body of water flowing in a natural or man-made channel that contains water for only part of the year. During the dry season and periods of drought, these streams will not exhibit flow. Geomorphological characteristics are not well defined and are often inconspicuous. In the absence of external limiting factors (pollution, thermal modifications, etc), biology is scarce and adapted to the wet and dry conditions of the fluctuating water level.
QUALITY CONTROL/QUALITY ASSURANCE (QC) STUDY
METHODOLOGY The Quality Control/Quality Assurance (QC) study component of the Perennial Streams Identification and Mapping project was completed between May and October 2004. A total of ten percent of the streams initially surveyed between 2002 and 2003 were selected for the QC process. While the majority of these sites were randomly selected, many of them were targeted based on the following criteria:
2001 CBLAB mandates additional
measures must be taken to
identify perennial streams
1980 - 1989 | 1990 - 1999 | 2000 | 2001 | 2002 | 2003 | 2004 | 2005
March 2002
Stream Mapping Project began
July 2002 Fairfax
County’s CBPO is revised
November 2003
CBPA maps are adopted by BOS; CBPO is
effective
October 2003
Stream Mapping Project
completed
October 2004
QC study completed
January 2005 Revised maps
will be submitted to BOS and
Planning Commission
1993 Chesapeake Bay
Preservation Ordinance
adopted
1988 Chesapeake Bay Preservation Act
enacted in Virginia
December 1983 Chesapeake Bay
Agreement signed
December 2000 EQAC annual report released recommending remapping of
perennial streams
5

Perennial Streams QC Study Report 12/12/2012
• Visual evaluation of tributaries to determine areas that may be suspect (large drainages or sites determined to be “borderline”),
• Sites where surveys were completed by our consultant teams, • Field notes from original surveys that indicate particular streams should be resurveyed in
a drier or wetter season, and • Contentious locations (development sites [rezoning or by-right] or citizen calls disputing
determinations).
QC surveys were completed throughout the moist to normal conditions of spring 2004 for watersheds originally surveyed during the 2002 hydrologic drought (approximately 35% of the total streams surveyed during the QC study). The remaining watersheds, originally surveyed in 2003 during a period of normal to above average rainfall, were assessed beginning in late July 2004 under normal to drier weather conditions (approximately 65% of the total streams surveyed during the QC study). All QC fieldwork was completed by October 2004 (Table 1). Table 1: Watersheds surveyed during the 2004 QC study
Spring 2004 Initially surveyed during hydrologic drought. Resurveyed under moist to normal conditions. Approximately 35% of the total streams surveyed during the QC study Horsepen Creek Popes Head Creek Little Hunting Creek Cub Run Difficult Run
July – October 2004 Initially surveyed under normal to moist conditions. Resurveyed under normal to drier conditions. Approximately 65% of the total streams surveyed during the QC study Cameron Run Pimmit Run Occoquan Kane Creek Nichols Run Pohick Creek Bull Neck Run Bull Run Pond Branch Accotink Creek Dead Run Wolf Run Belle Haven Sugarland Run Little Rocky Run Scotts Run Sandy Run Ryans Dam Old Mill Branch Johnny Moore Creek Turkey Run High Point Dogue Creek Mill Branch Four Mile Run The process of making a final determination for each stream was consistent with the method used during the original Perennial Streams Identification and Mapping project. At each site, reach boundaries were identified and documented on the field map. These boundaries were based on hydrological, physical, and/or biological features. Using the Fairfax County Perennial Stream Field Identification Protocol, a data sheet was completed for each reach until a confident determination was made. The general guidelines developed by the City of Greensboro, North Carolina for their Stream Identification and Mapping for Water-Supply Watershed Protection study∗ were also followed. These guidelines include:
• The upstream reach break point should be within 100 feet of the previously mapped reach break point
• The total score should be within ± 7 points of the original field survey, and
∗ Lawson, J., R. Darling, D. Penrose, and J.D. Gregory. 2002. Stream Identification and Mapping for Water-Supply Watershed Protection. In Proceedings, Watershed 2002, February 23-27, 2002, Fort Lauderdale, FL.
6

Perennial Streams QC Study Report 12/12/2012
• The final stream classification should be the same (perennial or non-perennial) as the original survey.
If these criteria were not met, the data collected from the original and QC surveys were reviewed by the field team members to determine the final classification. The Chesapeake Bay Preservation Area maps were adjusted accordingly, upstream or downstream, to reflect any changes.
RESULTS During the first two years of the Perennial Streams Identification and Mapping project, 330 additional miles of streams were added to existing RPA. During the year-long QC process only 5.5 additional miles were added bringing the total of streams protected by RPA to 855.5 miles, excluding shorelines (Table 2). There was a gross change of 1.2% (7.7 miles) in RPA during the QC process but only a net change of 0.6% (5.5 miles). Table 2: Length of Fairfax County’s Resource Protection Areas, after net increase from QC study
Length (miles) Shorelines 118 Streams 520 New 2003 330 Total 968 New 2004 7.7 Removed 2004 2.2 Net 2004 5.5 2004 Total (with shorelines) 973.5 2004 Total (without shorelines) 855.5
Eighty-one percent (124) of the sites visited during the QC process were randomly selected. Nineteen percent (30) of the sites were targeted, focusing on sites where additional data was submitted (Appendix A), sites where work was completed by our consultants, and sites that were originally determined as “borderline” by staff. Of 154 total sites visited during the QC process 68% of the sites remained unchanged and only 32% (27% extended plus 5% retracted) exhibited a change (Table 3). Table 3: Number of QC sites exhibiting a change in RPA. Percentage related to total number of QC sites.
Unchanged Extended Retracted Total Sites Net Change Random Sites 90 (58%) 27 (18%) 7 (5%) 124 (81%) 20 (13%) Targeted Sites 15 (10%) 14 (9%) 1 (~0%) 30 (19%) 13 (8%) All QC Sites 105 (68%) 41 (27%) 8 (5%) 154 33 (21%)
7

Perennial Streams QC Study Report 12/12/2012
Randomly Selected Sites Results and Examples Ninety percent of the randomly selected sites, with a change in the upper extent of perenniality, resulted in an extension or retraction of less than 1000 ft (Figure 1).
94
914
50 0 2
0
20
40
60
80
100
Num
ber
of S
ites
No change 0 - 499 500 - 999 1000 - 1499 1500 - 1999 2000 - 2499 2500 - 2658
Length of RPA change (feet)
Figure 1: Number of random sites exhibiting a change in length of RPA. Maximum distance changed is 2638 feet.
Site PH067402A (Figure 2) in the Popes Head Creek watershed is an example of an extreme case, where the upper extent of perenniality changed significantly by approximately 2638 feet. This randomly selected site was initially surveyed in August 2002 while the Northern Virginia region suffered from a hydrologic drought. The drought was severe enough to cause the groundwater table to drop, disconnecting the source of groundwater recharge to the stream. During June 2002, under severe hydrologic drought, the upper reaches of this stream were found to be dry. The origins of flow began at a pool downstream of the Fairfax County Parkway. A survey was completed downstream of the Fairfax County Parkway and was designated perennial (Figure 3). This stream was randomly selected for resurveyed as part of the QC study. The resurvey took place under normal weather conditions, in May 2004. Strong perennial characteristics, including strong flow, hydric soils, a strong presence of groundwater seeps and springs, a moderate amount of iron-oxidizing bacteria, and a prolific community of Net-spinning Caddisflies, Stoneflies, and tadpoles provided a confident indication that the stream was perennial well above the initial extent (Figure 4). The RPA was extended for this stream based on the conclusive data collected during the QC study, under normal weather conditions.
8

Perennial Streams QC Study Report 12/12/2012
ARKWAY
6 7 - 46 7 - 4
6 7 - 26 7 - 2
7 6 - 27 6 - 2
6 7 - 36 7 - 3
6 7 - 16 7 - 1
6 8 - 36 8 - 3
6 8 - 16 8 - 1
7 6 - 17 6 - 1 7 7 - 17 7 - 1
POPE
S HEAD C
RE
EK
Upstream Extent of RPA2004 QC Determination
(Normal Hydrologic Condition)Extended 2,638 ft
New RPA Adopted in 2003
(Extended 4,895 ft.)
RPA Adopted in 1993(Pope's Head Creek)
Perennial StreamsNon-Perennial Streams
1993 RPA
2003 RPA
2004 RPA0 570 1,140 1,710
Feet
Ceda
rest
Rd.
TextLee Hwy.
4 8 - 44 8 - 4
Stream: Unnamed Tributary Watershed: Pope's Head Creek
Springfield DistrictTax Maps 67-2, 67-4 Site ID: PH067402A
Upstream Extent of RPA2002 Determination
(Hydrologic Drought)
µFigure 2: Location of Popes Head Creek site - PH067402A
9

Perennial Streams QC Study Report 12/12/2012
Figure 3: Photograph of site PH067402A on 6/18/02. Picture taken downstream of Fairfax County Parkway.
Figure 4: Photograph of site PH067402A on 5/12/04, taken approximately 2,638 feet upstream of location survey on 6/18/02 (Figure 3).
10

Perennial Streams QC Study Report 12/12/2012
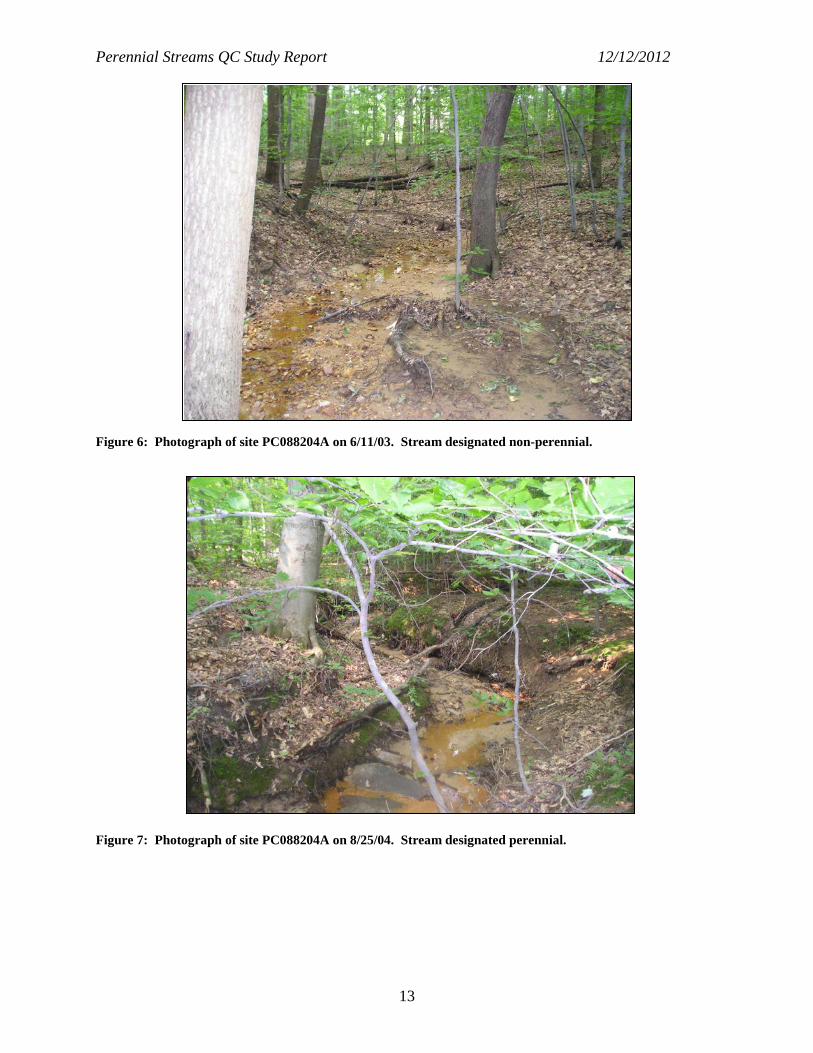
Site PC088204A (Figure 5) in the Pohick Creek watershed is an example of a less extreme case, where the upper extent of perenniality changed by approximately 814 feet. This randomly selected site was initially surveyed by staff in June 2003 while the region was in an extremely moist weather condition and designated the stream as non-perennial, based on a score of 20 points. PC088204A displayed strong flow and groundwater seeps and springs were prevalent throughout the reach. However, the final determination was based mostly on the lack of strong geomorphological and biological indicators (Figure 6). As part of the QC study, this site was resurveyed under near normal weather conditions. In August 2004, the stream received an overall score of 24 points and was designated perennial. Since the stream was seen in both extremely moist and near normal non-drought conditions, the team was able to give the stream a more confident perennial designation (Figure 7).
11

Perennial Streams QC Study Report 12/12/2012
ROAD
SYDENST R ICKER
8 8 - 28 8 - 2
8 8 - 48 8 - 4
8 9 - 18 9 - 1
7 8 - 47 8 - 4
8 9 - 38 9 - 3
7 9 - 37 9 - 3
Upstream Extent of RPA2004 QC Determination
Extended 814 ft
New RPA Adopted in 2003
(Extended 3,216 ft.)
RPA Adopted in 1993(Pohick Creek)
Perennial StreamsNon-Perennial Streams
1993 RPA
2003 RPA
2004 RPA0 550 1,100 1,650
Feet
Ceda
rest
Rd.
TextLee Hwy.
4 8 - 44 8 - 4
Stream: Unnamed Tributary Watershed: Pohick Creek
Springfield DistrictTax Maps 88-2
Site ID: PC088204A
µFigure 5: Location of Pohick Creek site - PC088204A
12
Perennial Streams QC Study Report 12/12/2012
Figure 6: Photograph of site PC088204A on 6/11/03. Stream designated non-perennial.
Figure 7: Photograph of site PC088204A on 8/25/04. Stream designated perennial.
13

Perennial Streams QC Study Report 12/12/2012
RPA Review and Additional Data Submitted Throughout 2004, additional data was submitted by citizens and environmental consultant firms for eight contentious locations where new developments are planned in the County. At four sites, the additional data resulted in a change in final determination and length of RPA. At two sites, the length of RPA did not change. At the release of this report, two sites are still pending a final decision as to the designation of the stream. Appendix A has detailed explanations for each site. Scoring Out of the 154 total sites visited in the QC study, there were 116 sites in which the original reach was used for the QC data (75%). For these sites the QC score can be directly compared to the original score. The remaining thirty-six QC sites were either re-scored slightly upstream or downstream of the original site or consisted of two to three sites combined. Of the 116 QC sites where the scored reaches were identical to the originals, 99 had a score that was within ±7 points of the original score and 17 had a difference of more than 7 points from the original (Figure 8).
99
17
0
20
40
60
80
100
Num
ber
of S
ites
Sites Within ± 7 Points Sites With More Than ± 7 PointsDifference in Points
Figure 8: QC sites that were identical to original sites, showing the difference in number of points between original and QC data. Overall, 95 out of the 116 sites experienced neither a change in final determination of perenniality, nor a change in the RPA length (Table 4).
14

Perennial Streams QC Study Report 12/12/2012
Table 4: QC sites that were identical to original sites. Difference in Points Between
Original and QA/QC No Change
in RPA Extended
RPA Retracted
RPA Total Sites Sites Within ±7 Points 84 13 2 99
Sites With More Than ±7 Points 11 4 2 17 Total Sites 95 17 4 116
There were seventeen sites that had a difference in score of over seven points from the original data. Of these, eleven did not have a change in RPA and six did have a change (Figure 9).
5
53
35
13
8
1 10
20
40
60
0 1-3 4 - 6 7 - 9 10 - 12 13 - 15 16 - 18
Difference in Points Between O riginal and Q C
Nu
mb
er o
f S
ites
Figure 9: Distribution of difference in score
RECOMMENDATIONS During the initial Perennial Stream Identification and Mapping project surveys, several streams were identified by field staff as good candidates for resurvey under opposite hydrologic conditions. These locations, along with surveys conducted by our consultant teams and contentious streams near new development areas were targeted in the QC study and were found to have the greatest degree of change in the location of the upper extent of perenniality (50%) (Table 5). Table 5: Number of targeted sites exhibiting a change in RPA.
Unchanged Extended Retracted Total Sites Net Change Targeted Sites Only 15 (50%) 14 (47%) 1 (3%) 30 13 (43%)
15

Perennial Streams QC Study Report 12/12/2012
On the other hand, randomly selected sites exhibited a change of only 28% (Table 6). For the majority of the random cases, the length of change was minimal (approximately 1000 feet or less), between the initial and QC surveys.
Table 6: Number of random sites exhibiting a change in RPA.
Unchanged Extended Retracted Total Sites Net Change Random Sites Only 90 (72%) 27 (22%) 7 (6%) 124 20 (16%) Based on the level of effort and time required to conduct the 2004 QC study, with a return of only 5.5 miles of newly designated perennial streams and a net increase of RPA at 0.6%, staff suggest that an annual QC study not occur. However, potential contentious areas and streams located in the watersheds surveyed under the severe hydrologic conditions of 2002 may warrant further attention and analysis in the future.
NEXT STEPS The maps will be updated with the QC data and presented to the Board of Supervisors in early 2005. Public hearings will be advertised in January 2005. In February and March 2005, public hearings for the Planning Commission and Board of Supervisors will be held.
16