fairfield public schools 2016-2017 data analysis...
TRANSCRIPT

Fairfield Public Schools2016-2017 Data Analysis:
Determining Areas of Growth and Continuing Need
Board of EducationNovember 28, 2017

Presentation Objectives• Review Related District Improvement Plan Goals and Action
Steps• Communicate Guiding Principles of Instructional Improvement• Describe the Instructional Improvement Process• Highlight Areas of Growth as They Relate to Past and Current
Actions• Highlight Areas of Continuing Need as They Relate to Past and
Future Actions

Focus Questions
• What is the work of the Fairfield Public Schools instructional staff to continually improve student achievement?
• What have we learned from areas of growth? What have we learned from areas of continued need?
• Where do we need to work next and what is needed to support growth in those areas?
Please hold your questions to the end.

District Improvement Plan: Priorities• Each staff member will support well-rounded academic success
including expressive, personal, physical, civic, and social development for all students. Each staff member will support all students in developing an appreciation and understanding of global issues
• Student achievement and performance shall rank among the best in the state and the nation
• Leadership will support, design, and implement a comprehensive educational program for PK-21+
• Improve resources through human staffing, time, and materials

Guiding Principles of Instructional Improvement• ALL students must learn to mastery content and skill levels• All efforts must improve the lesson-specific interactions of student-
teacher-content/skills• Identify a finite but powerful PK-12 set of learning expectations in content
and skills• Collaboratively build curriculum and implementation guides that achieve
the learning expectations in content and skills • Identify the needs in professional learning for all staff to support best
practices in every school, every classroom• Monitor and adjust implementation and supports in response to identified
areas of growth and continuing need

Challenges to the Principles of Instructional Improvement• Variability
• Size of the District• Staffing Changes• Needs of Students and Staff
• Budget Priorities• State and National Expectations

The Improvement Process

How many teachers does a child have from grades kindergarten to 12?


“The key to improved student learning is to ensure more good teaching in more classrooms more of the time.”
Richard DuFour and Mike Mattos (2013)

Overall Headlines
• Prior district and school initiatives demonstrate increased student achievement
• Work still must be done • The use of data helps identify and guide our work; it is not
the end in itself• How do the examples presented this evening demonstrate
the principles of instructional improvement?

Data Analysis: What Do We Look For?
• Grade-to-Grade (Cross-Sectional Analysis)• Cohort growth (Longitudinal Analysis)• Disaggregation by populations• District comparative performances

Secondary MathematicsDr. Paul RasmussenDirector of Secondary Mathematics and Student Achievement

Secondary Mathematics
• Provided PD on how to use assessment data (e.g., SBA Online Reporting System) and identified areas of need
• Worked with teacher teams to provide interventions to students based on the results identified in the data
• Used research-based instructional approaches to provide interventions with students
• Provided feedback to teachers on implementation of approaches

19% 14% 13%
26%23% 20%
24%27%
25%
31% 36% 42%
0%
10%
20%
30%
40%
50%
60%
70%
80%
90%
100%
2015 2016 2017
Per
cent
of S
tude
nts
SBA Year
Grade 8 SBA Math: 2015-2017
% Level 1 % Level 2 % Level 3 % Level 4
55% 65% 67%

10% 12% 13%
26% 27% 20%
35% 31%25%
29% 30%42%
0%
10%
20%
30%
40%
50%
60%
70%
80%
90%
100%
2015 2016 2017
Grade 6 Grade 7 Grade 8
Per
cent
of S
tude
nts
SBA Year and Grade
SBA Cohort: 2015 to 2017
% Level 1 % Level 2 % Level 3 % Level 4
64% 61% 67%

Moving Forward: Secondary Mathematics
• Build teacher capacity to support struggling learners
• Continue to implement researched-based instructional strategies to teachers and support school-based administrators in monitoring effectiveness

Elementary MathematicsWalter WakemanDirector of Elementary Mathematics, Science, & Enrichment

Elementary Mathematics• Analyzed formative and summative assessment data• Provided consistent embedded Professional Development
with teachers• Ensured commitment and follow-through – Program
Director, Principal, classroom teachers, and Math Science Teacher (MST)
• Reviewed student work to differentiate and plan targeted core instruction
• Reflected on and shared effective instructional strategies

24%10% 8%
37%
15% 22%
36%
57% 42%
4%18% 28%
0%10%20%30%40%50%60%70%80%90%
100%
2015 2016 2017
Grade 3
Per
cent
of S
tude
nts
SBA by Year
Elementary School Grade 3 SBA Math: 2015-2017
% Level 1 % Level 2 % Level 3 % Level 4
40% 75% 70%+3District Avg.
-1District Avg.
-25 DistrictAvg.

11% 3%
30%21%
38%
27%
21%
48%
0%
10%
20%
30%
40%
50%
60%
70%
80%
90%
100%
2016 2017
Grade 3 Grade 4
Per
cent
of S
tude
nts
SBA Year and Grade
Elementary School Cohort: 2016 to 2017
% Level 1 % Level 2 % Level 3 % Level 4
59% 75%
-13 District Avg. +7 District Avg.

Moving Forward: Elementary Mathematics
• Build Math Science Teacher (MST) and classroom teacher capacity to support all learners
• Continue to implement researched-based instructional strategies to teachers and support school-based administrators in monitoring effectiveness

SciencePatrice FaggellaDirector of K-12 STEAM & 6-12 Science

Secondary Science • Identified that student performance declined from grade 8 to
grade 10 on the content knowledge portion of the state assessment. Focused on the Cell Chemistry and Biotechnology strand in grade 9 and 10 (in Biology courses)
• Provided Professional Development on specific instructional and assessment strategies related to both standard specific content along with general problem solving
• Worked with teacher teams to examine local assessment data and provide interventions to specific students based on the results

+20 from State
+20 from State
+22 from State

+18 from State
+23 from State
+24 from State

+25 from State
+23 from State
+26 from State

2017 CAPT Science DRG A Performance

2017 CAPT Science DRG B Performance

Moving Forward:Secondary Science• Identified NGSS Science and Engineering Practices as an area
in need of further growth
• Provide Professional Development to continue to support teachers and administrators on the transition to NGSS

Program EvaluationDr. Gregg PuglieseDirector of PK-12 Social Studies & Student Centered Learning

Program Evaluation
• Use of Data to Improve Curriculum and Instruction• Classroom Observations• Feedback from Teachers, Students, and Families• Adapt to Changing Standards, Laws and Community
Expectations• Graduation Requirement Changes• NEASC evaluation• Portrait of a Graduate

Advanced Placement Five-Year Summary
Year Total AP Students
Number of Exams
% of Total AP Students with
Scores 3+2012-2013 600 1196 90.5%2013-2014 642 1220 90.0%2014-2015 679 1333 87.6%2015-2016 698 1336 89.4%2016-2017 672 1361 90.3%
+72Students
+165Exams


AP Course Redesigns by Year2011-2012AP French Language and Culture
2012-2013AP Biology, AP Latin
2013-2014AP Chemistry, AP Spanish
Language and Culture
2014-2015AP Physics 1, AP Physics 2,
AP U.S. History
2015-2016AP European History
2016-2017AP Calculus AB, AP Calculus BC,
AP Computer Science
2018-2019AP U.S. Government and Politics
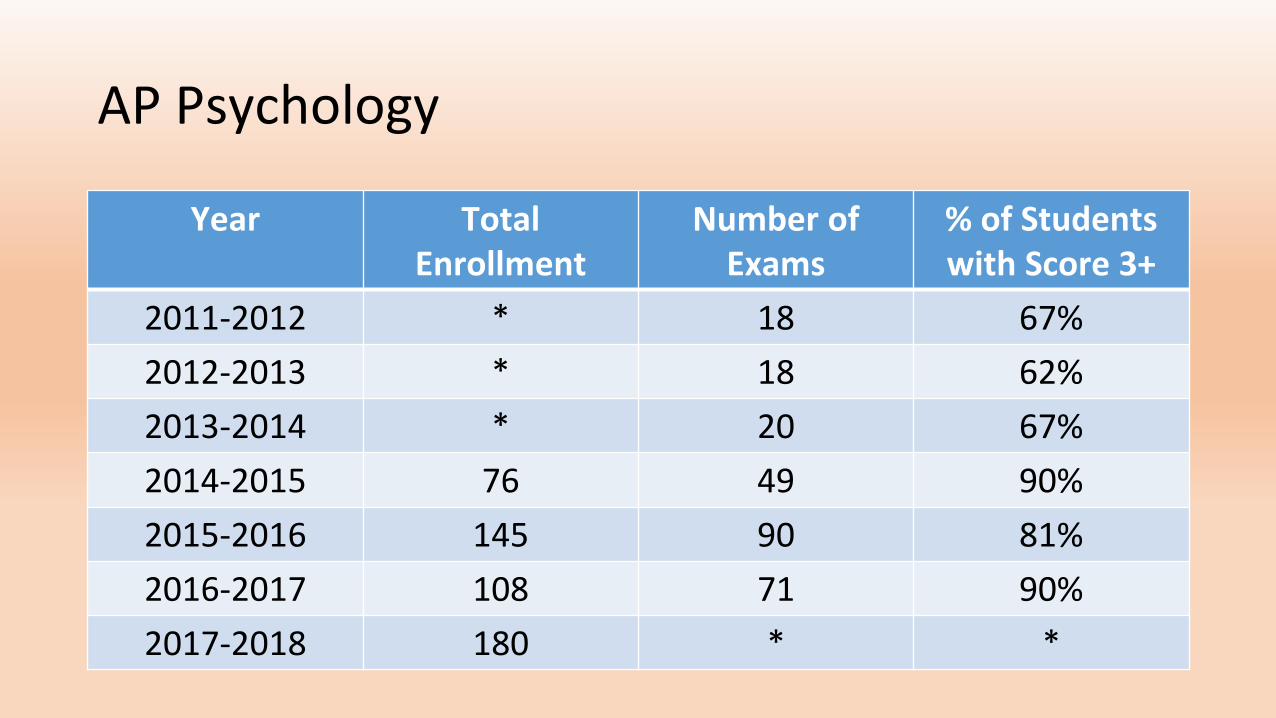
AP Psychology
Year Total Enrollment
Number of Exams
% of Students with Score 3+
2011-2012 * 18 67%2012-2013 * 18 62%2013-2014 * 20 67%2014-2015 76 49 90%2015-2016 145 90 81%2016-2017 108 71 90%2017-2018 180 * *

Moving Forward: Program Evaluation
• Continue professional learning to adapt to changing standards and instructional practices
• Revised High School Graduation Requirements • Revisions to the Curriculum Renewal Cycle
• Provide Professional Development and communication to support staff and community through changes
• Continue to improve functioning of data teams and collaborative planning teams

Subject Grade 15-16 16-17 17-18 18-19 19-20 20-21 21-22
Music PK-5 Implement ReviewRevise / Approve
Implement Implement Implement Status Update
Science PK-12 Implement ReviewRevise / Approve
Implement 9-12 Implement Implement Status Update
Music 6-12 Implement Implement ReviewRevise / Approve
Implement Implement Implement
Art PK-12 Implement Implement Implement ReviewRevise / Approve
Implement Implement
Health PK-12 Implement Implement Implement ReviewRevise / Approve
Implement Implement
Physical Education
PK-12 Implement Implement Implement ReviewRevise / Approve
Implement Implement
Math PK-12 Status Update Implement Implement Implement ReviewRevise / Approve
Implement
Dev. Guidance 6-12 Implement Implement Implement Implement ReviewRevise / Approve
Implement
English / Lang. Arts
PK-12 Implement Status Update Implement Implement Implement ReviewRevise / Approve
Business 9-12 Implement Implement Implement Status Update Implement Implement Review
Technology Ed. 6-12 Implement Implement Status Update Implement Implement Implement Review
Library Media Sci.
K-12 Implement Implement Status Update Implement Implement Implement Implement
World Language
3-12 Implement Implement Implement Status Update Implement Implement Implement
Computer App. 6 & 8Revise / Approve
Implement Implement Implement Status Update Implement Implement
Social Studies PK-12Revise / Approve
Implement Implement Implement Status Update Implement Implement
Family Con. Science
6-12 ReviewRevise / Approve
Implement Implement Implement Status Update ImplementFPS
Curr
icul
um R
evisi
on C
ycle

Secondary Language ArtsJohn ChiappettaDirector of Secondary Literacy & Learning

Secondary Language Arts
• Consistent Growth in Grade 8 • Strength of MS curriculum • Analyzed assessment data and and identified areas for
growth• Teacher teams designed instructional tasks and assessments
targeting needs identified in the data• Continued focus on question types and patterns.

8% 7% 6%
22% 19% 18%
46% 46% 45%
25% 29% 31%
0%
10%
20%
30%
40%
50%
60%
70%
80%
90%
100%
2015 2016 2017
Per
cent
of S
tude
nts
SBA Years
Grade 8 SBA ELA: 2015-2017
% Level 1 % Level 2 % Level 3 % Level 4
71% 75% 76%

Grade 8 Regional ELA SBA Scores
District 2015 2016 2017 Change 15 to 17Fairfield 70% 74% 76% 6%
Greenwich 76% 77% 78% 1%
Ridgefield 79% 81% 74% -5%
Westport 85% 81% 73% -12%
Weston 72% 78% 73% 1%
Wilton 87% 82% 73% -14%
West Hartford 69% 67% 71% 2%

Moving Forward:Secondary Language Arts• Utilize SRBI for early intervention in Reading and Writing
• Analyze assessment data to individualize instruction
• Continue professional development of teachers

Elementary Language ArtsPamela KhairallahDirector of Primary Literacy & Learning, ELL, and SRBI

Elementary Language Arts
• Steady Growth from grades 3 to 5• Strengths in grade 4-5 core curriculum • Efficacy of peer to peer coaching in grades 4 and 5• Focus of interventions in grades 3-5 results in gains• Streamlined data collection tools and process

12% 12% 10%
21% 13% 13%
27%28% 33%
40% 47% 44%
0%
10%
20%
30%
40%
50%
60%
70%
80%
90%
100%
2015 2016 2017
Grade 3 Grade 4 Grade 5
Per
cent
of S
tude
nts
SBA by Grade & Year
SBA Cohort: 2015 to 2017
% Level 1 % Level 2 % Level 3 % Level 4
67% 75% 77%

12% 10% 12%
21% 21% 22%
27% 25% 28%
40% 43% 39%
0%
10%
20%
30%
40%
50%
60%
70%
80%
90%
100%
2015 2016 2017
Per
cent
of S
tude
nts
Grade 3
Grade 3 SBA: 2015-2017
% Level 1 % Level 2 % Level 3 % Level 4
67% 68% 67%

Grade 3 Regional ELA SBA Scores
District 2015 2016 2017 Change 15 to 17Fairfield 67% 68% 67% 0%Darien 83% 83% 79% -4%Greenwich 79% 76% 78% -1%Westport 86% 83% 80% -6%West Hartford 72% 72% 71% -1%Monroe 90% 73% 81% -9%Trumbull 82% 81% 75% -7%

Moving Forward: Elementary Language Arts• Focus on SRBI as early intervention • Provide teachers in grades K-2 professional development in
phonics and reading foundations• Continue professional development of coaches and teachers• Integration of Social Studies, Library and Media and
Language Arts curriculum and instruction to provide more digital reading and writing experiences

Special EducationRob MancusiExecutive Director of SPED and Special Programs

Special Education• Continue focus of ongoing improvement to the District’s SRBI
procedures • Continue to provide appropriate professional development
opportunities to special education staff• Continue collaboration between general education and special
education staff • Continue to analyze delivery of services models (push in, pull out, co-
teaching)

SBA Levels Fairfield State
Level 4: Exceeding
12.5% 5.8%
Level 3: Meeting
11.1% 9.5%
Level 2: Approaching
30.6% 21.1%
Level 1: Not Meeting
45.8% 63.6%
Percentage of Students with Disabilities performing at each level of SBA
23.6% 15.3%

Students with Disabilities Grade 3 ELA SBA: 2016-2017
SBA Levels Fairfield Greenwich Trumbull West Hartford Westport
Level 4: Exceeding
12.5% 9.1% 16.7% 14.7% N/A
Level 3: Meeting
11.1 % 27.3% 16.7% 11.8% N/A
Level 2: Approaching
30.6% 28.8% 33.3% 22.1% 36.4%
Level 1: Not Meeting
45.8% 34.8% 33.3% 51.5% 42.4%
Percentage of Students with Disabilities performing at each level of SBA
23.6% 36.4% 33.4% 26.5% 21.2%

Students with Disabilities Grade 3-5 Cohort ELA SBA: 2015-2017
SBA Levels Grade 3 Grade 4 Grade 5
Level 4: Exceeding
7.7% 12.3% 6.7%
Level 3: Meeting
17.9% 17.3% 25.8%
Level 2: Approaching
32.1% 27.2% 22.5%
Level 1:Not Meeting
42.3% 43.2% 44.9%
Percentage of Students with Disabilities performing at each level of SBA
25.6% 29.6% 32.5%

Areas of Focus Moving Forward continued
• Continue to strengthen capacity of special education and related services staff on the administration of comprehensive literacy assessments to inform targeted instruction in this area
• Continue to strengthen analysis and interpretation of student progress monitoring data on IEP goals and objectives to promote mastery and to inform targeted instruction

English LearnersJohn ChiappettaDirector of Secondary Literacy & Learning

English Learners
Number of countries of origin: 52 Number of languages spoken: 28IndiaSyriaRussiaEgyptGuatemalaMexicoColumbiaKorea
GermanyBrazilBulgariaHungaryChinaNepalPakistanTurkeyChad
UrduSpanishRussianGermanHungarianBulgarianArabicBenglaFarsi
MandarinKurdishTurkishTeleguHausaPashtoKhmerTagalog

Fairfield English Learner EnrollmentYear Number of English Learners
2013-2014 2142014-2015 2292015-2016 2212016-2017 2512017-2018 261
+4722.0% Increase
Over the past year:Added 52 Students, while 42 left the district

English Learners: Proficiency Levels
Level 1 & 2: 44%• Level 1 - Basic
• Students at this level have very limited or no understanding of English
• Level 2 - Low Intermediate • These students can understand
short conversations on simple topics
Level 3 & 4: 56%• Level 3 - High Intermediate
• At this level students can understand standard speech delivered in most settings with some repetition and rewording
• Level 4 - Proficient• Students at this level have
adequate language skills for day-to-day communication

LAS Links Proficiency Level by Grade Level
Grade Level Level 1 Level 2 Level 3 Level 4Elementary School 29% 23% 39% 10%Middle School 14% 17% 46% 23%High School 16% 18% 51% 16%
District 24% 21% 42% 14%

Moving Forward:English Learner Program
• Consider a Newcomer Academy for Level 1 and Level 2 ELs• Provide cultural awareness training for all staff• Integrate ELs into the SRBI process• Identify social and emotional needs of EL students• Provide family support programs, possibly with community
collaboration• Support general education teachers with professional
development

STAR Math & ReadingDarla MinerExecutive Director of Innovation, Curriculum and Programs

STAR Reading Baseline 2016-2017 Grade Equivalent (GE)
Grade Fall 2016 Spring 2017 Change2 2.7 3.8 +1.13 3.7 4.8 +1.14 5.1 6.2 +1.15 6.2 7.4 +1.26 7.3 8.3 +1.07 8.1 9.0 +0.98 9.4 10.1 +0.79 9.7 10.2 +0.5
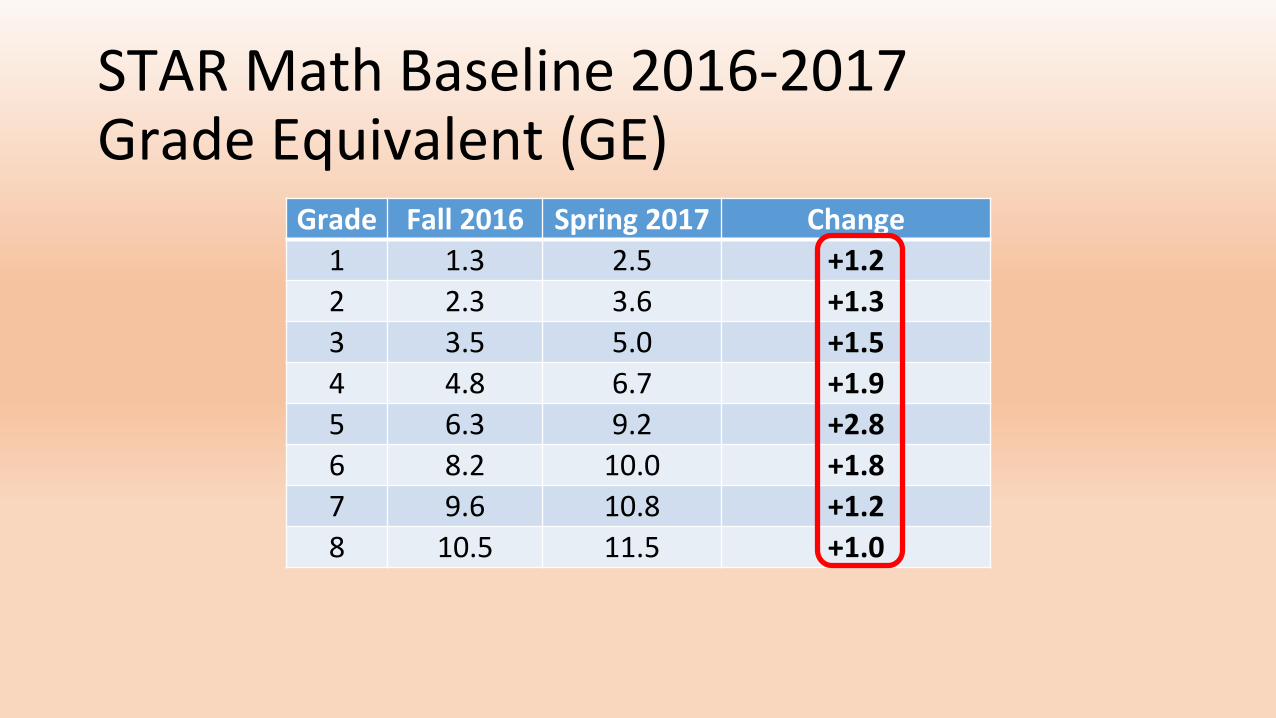
STAR Math Baseline 2016-2017 Grade Equivalent (GE)
Grade Fall 2016 Spring 2017 Change1 1.3 2.5 +1.22 2.3 3.6 +1.33 3.5 5.0 +1.54 4.8 6.7 +1.95 6.3 9.2 +2.86 8.2 10.0 +1.87 9.6 10.8 +1.28 10.5 11.5 +1.0

SRBI Practices• We use consistent tools to screen all
students
• Students who are identified as needing more help, get more help

SRBI Cohort Example: At Risk Students
47%
22% 16% 16%
0%10%20%30%40%50%60%70%80%90%
100%
Fall 2016 Winter 2017 Spring 2017 Fall 2017
Kindergarten 1st Grade
Per
cent
of S
tude
nts
F & P Administration
Elementary School:Students Below Benchmark F & P

Before we go . . .• We use data to identify instructional strengths and
growth goals and to drive professional learning for school leaders, teachers and support staff
• We prioritize resources to maximize student learning under an SRBI framework
•The most important work we do is to engage students and teachers in joyful learning as we improve daily instruction

Thank you!
Questions?