fall 20 public college enrollment and developmental course ... · fall 2011 public college...
TRANSCRIPT
Fall 2011 Public College Enrollment and Developmental Course Enrollment RatesHigh School Graduates in 20мм EnNJƻƭƭƛƴƎ ŀǎ CƛNJǎǘπ¢ƛƳŜ /ƻƭƭŜƎŜ {ǘdzŘŜƴǘǎ
at an Ohio Public College or University in Summer or Fall 20ммResults by High School of Graduation
Prepared by
December 2012

Fall 2011 Public College Enrollment and Developmental Course Enrollment Rates, 2010‐11 Ohio High School Graduates
Summary
College entry and preparation among recent high school graduates are key factors influencing the number of Ohioans who earn degrees and certificates. In fall 2011, 52,486 recent Ohio high school graduates enrolled in Ohio public colleges and universities as first‐time freshmen. Seventy four percent of these freshmen enrolled in public university main or regional campuses and 26% enrolled in public community colleges. The percentage of students that continue their studies after high school is a positive development, but a large proportion of them are not prepared for college‐level work in either mathematics or English. Forty one percent of these college freshmen enrolled in at least one developmental course in their first year of college. Thirty five percent enrolled in developmental math courses and 20% enrolled in developmental English courses.
Initial preparation for college level work is a critical factor in student success rates. For example, among a cohort of first‐time freshmen enrolling in Ohio’s public community colleges and universities in fall 2004, 13% of those who took developmental coursework in their first year earned a bachelor’s degree within six years, compared to 48% of those who did not take developmental courses in their first year. Strategies for improving college success rates include both reducing the need for developmental courses through better preparation in high school and improving outcomes for students who begin college with developmental course needs. The “Ohio Core” legislation requires that college preparatory courses become the default curriculum for graduates of Ohio’s public high schools, beginning with the 2013‐2014 graduating seniors. In addition, the funding formulas for public higher education institutions have been redesigned to reward colleges for increasing student success, with increased payments made for successful outcomes for students
with preparation needs.
In addition to reporting data for the state as a whole, this report presents participation and preparation outcomes for graduates of each of Ohio’s high schools. Those who are involved in K‐12 improvement efforts at the local level have found this detailed high school to college transition information useful in raising awareness of preparation needs and outcomes.
Proper interpretation and use of this data requires an understanding of its sources and limitations. First, the remediation rates reported here, taken by themselves, do not measure the overall college preparation levels of a high school’s graduating class. These results pertain only to the subset of graduates who attend public colleges and universities in Ohio, and do not reflect the preparation levels of students who do not go to college or who attend private or out‐of‐state institutions.
Second, developmental course enrollment is a useful, but not exact, indicator of the college preparation levels of freshmen. Students who need developmental coursework but do not take any in their first year are not included in the developmental course enrollment rates presented in this report. It should also be noted that developmental course placement policies vary across colleges, so the mix of students attending each institution will have some impact on the reported developmental course enrollment rates.
DATA DEFINITIONS AND SOURCE NOTES
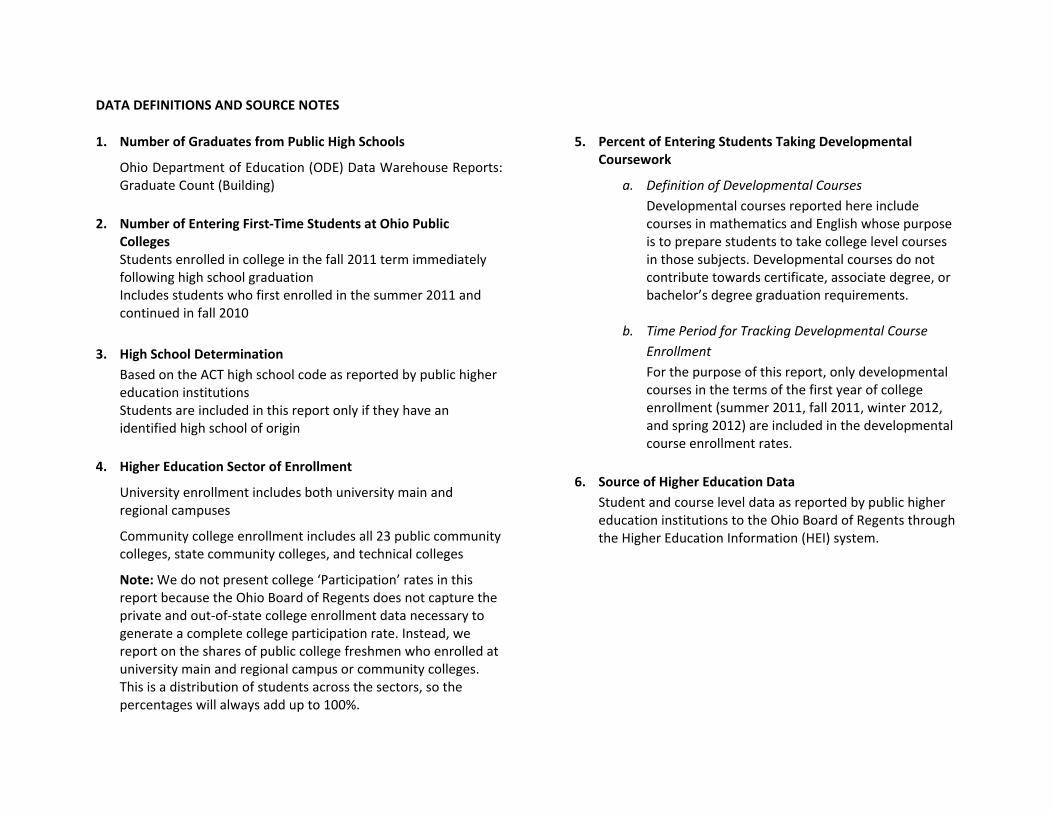
1. Number of Graduates from Public High Schools
Ohio Department of Education (ODE) Data Warehouse Reports: Graduate Count (Building)
2. Number of Entering First‐Time Students at Ohio Public
Colleges Students enrolled in college in the fall 2011 term immediately following high school graduation Includes students who first enrolled in the summer 2011 and continued in fall 2010
3. High School Determination Based on the ACT high school code as reported by public higher education institutions Students are included in this report only if they have an identified high school of origin
4. Higher Education Sector of Enrollment
University enrollment includes both university main and regional campuses
Community college enrollment includes all 23 public community colleges, state community colleges, and technical colleges
Note: We do not present college ‘Participation’ rates in this report because the Ohio Board of Regents does not capture the private and out‐of‐state college enrollment data necessary to generate a complete college participation rate. Instead, we report on the shares of public college freshmen who enrolled at university main and regional campus or community colleges. This is a distribution of students across the sectors, so the percentages will always add up to 100%.
5. Percent of Entering Students Taking Developmental Coursework
a. Definition of Developmental Courses Developmental courses reported here include courses in mathematics and English whose purpose is to prepare students to take college level courses in those subjects. Developmental courses do not contribute towards certificate, associate degree, or bachelor’s degree graduation requirements.
b. Time Period for Tracking Developmental Course Enrollment For the purpose of this report, only developmental courses in the terms of the first year of college enrollment (summer 2011, fall 2011, winter 2012, and spring 2012) are included in the developmental course enrollment rates.
6. Source of Higher Education Data Student and course level data as reported by public higher education institutions to the Ohio Board of Regents through the Higher Education Information (HEI) system.
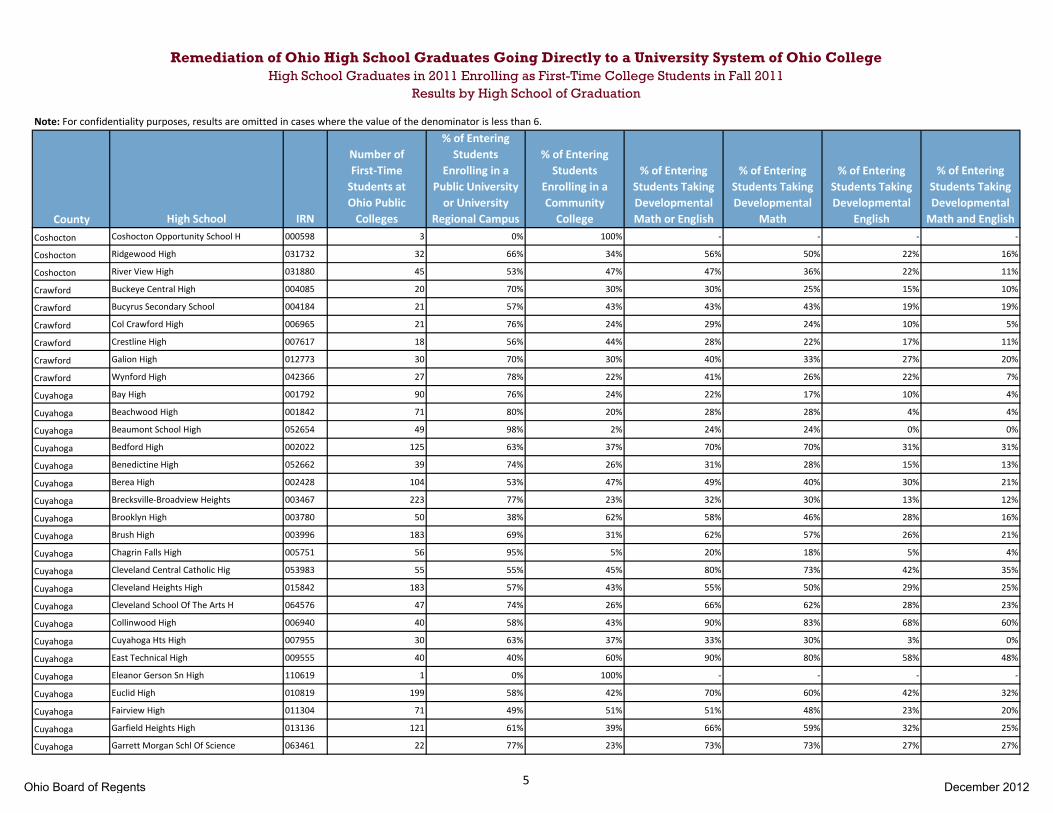
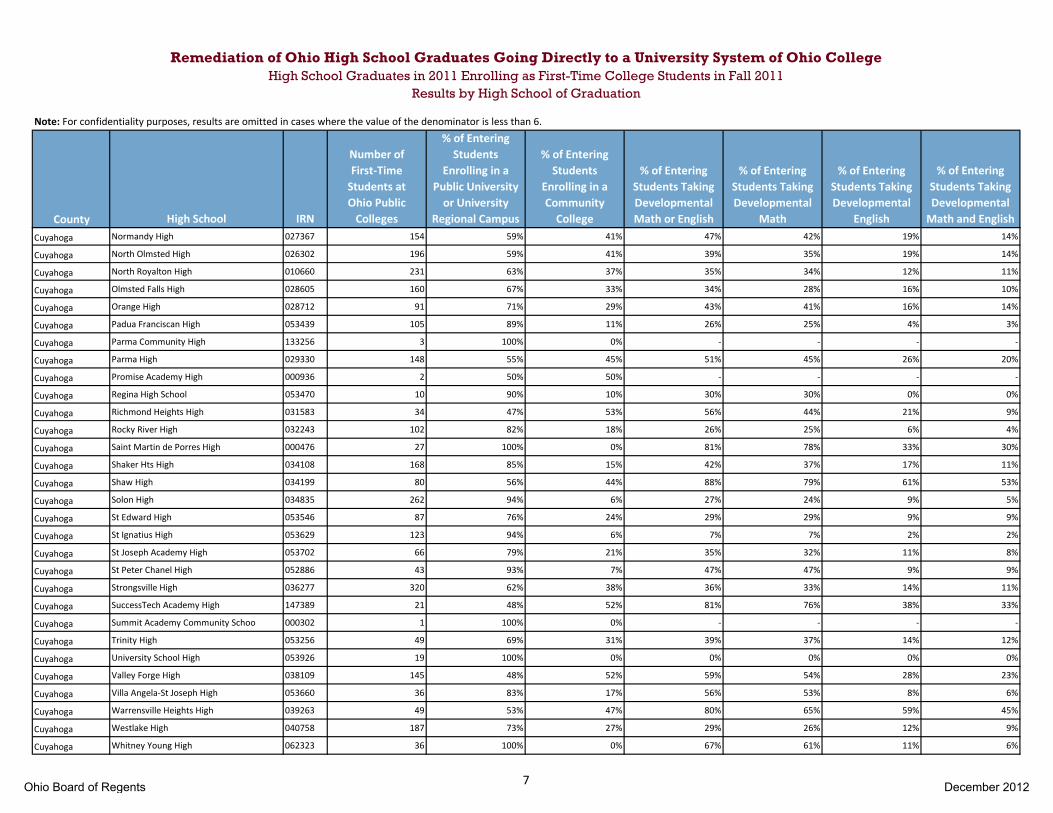
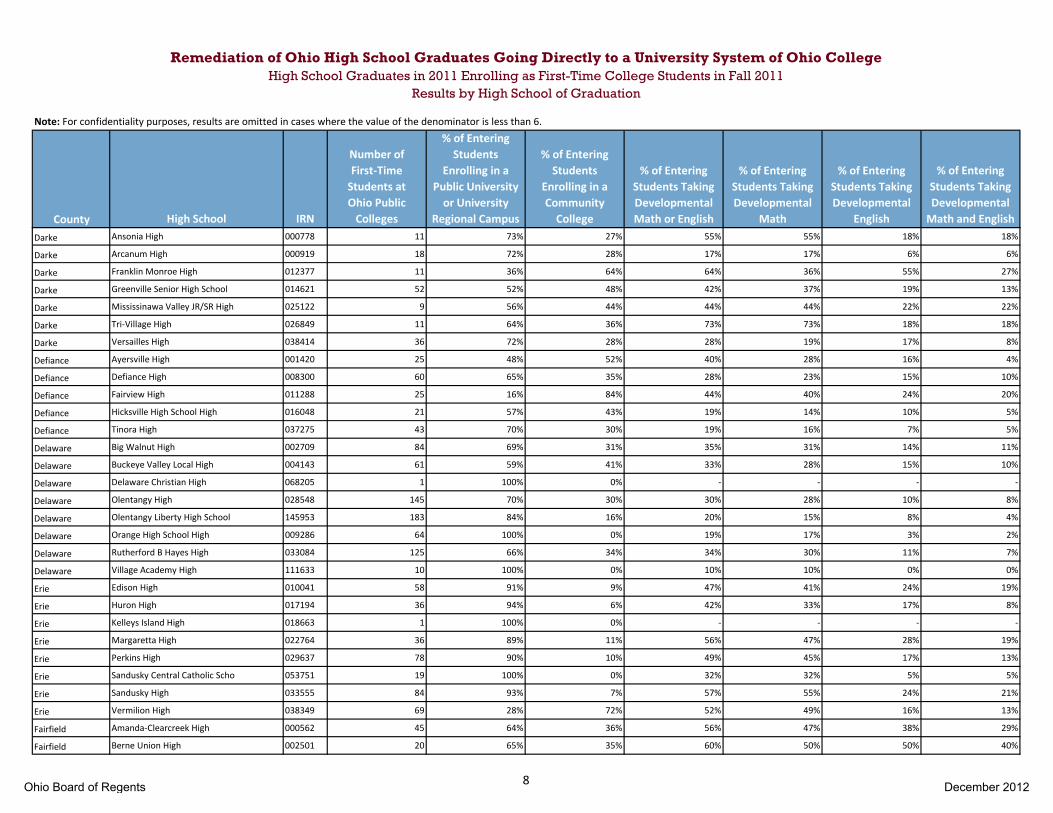
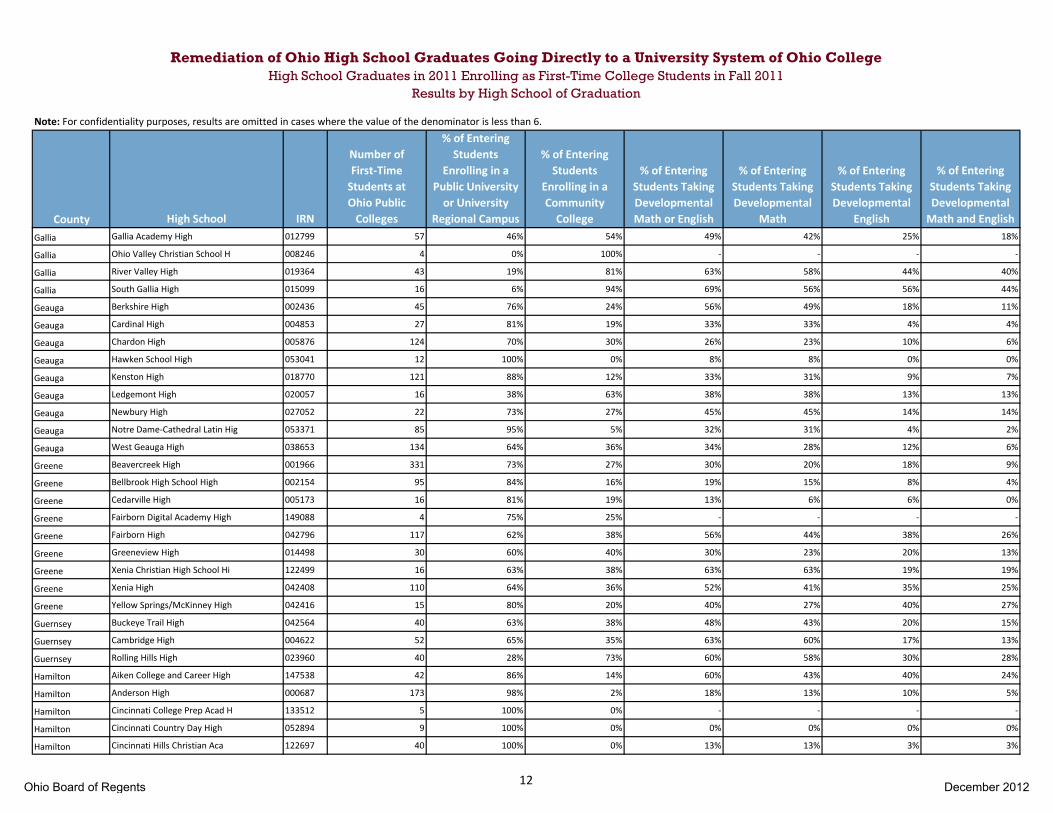
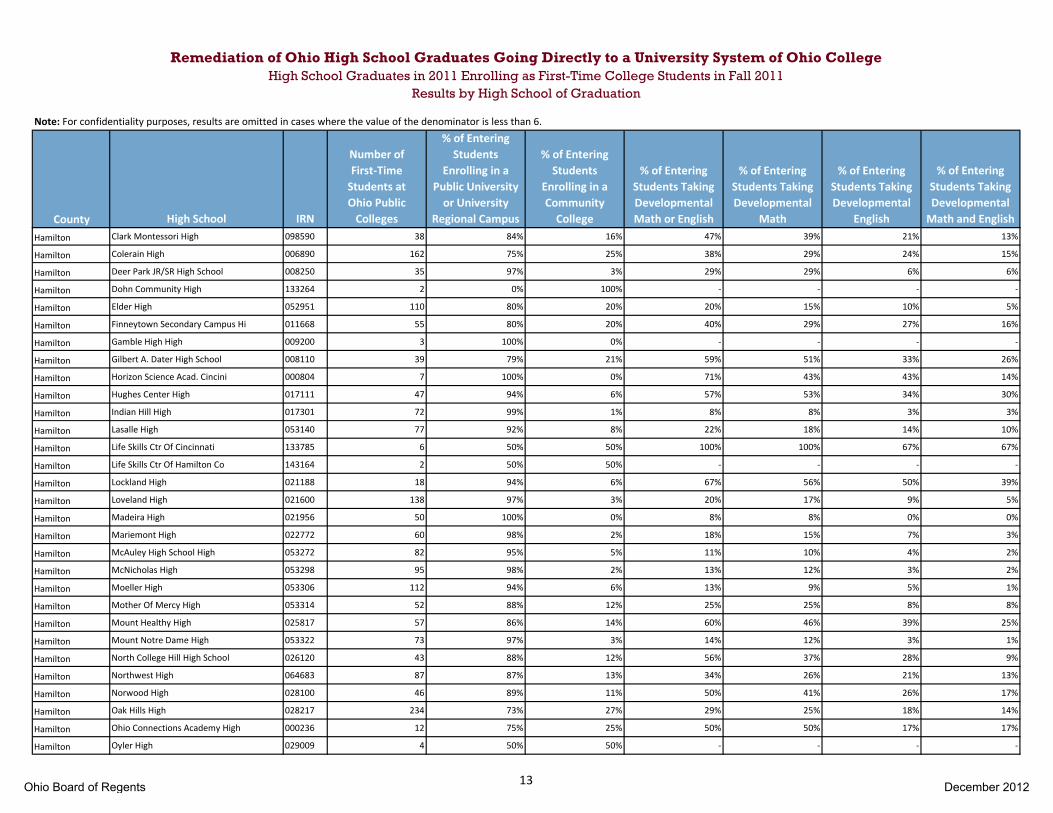
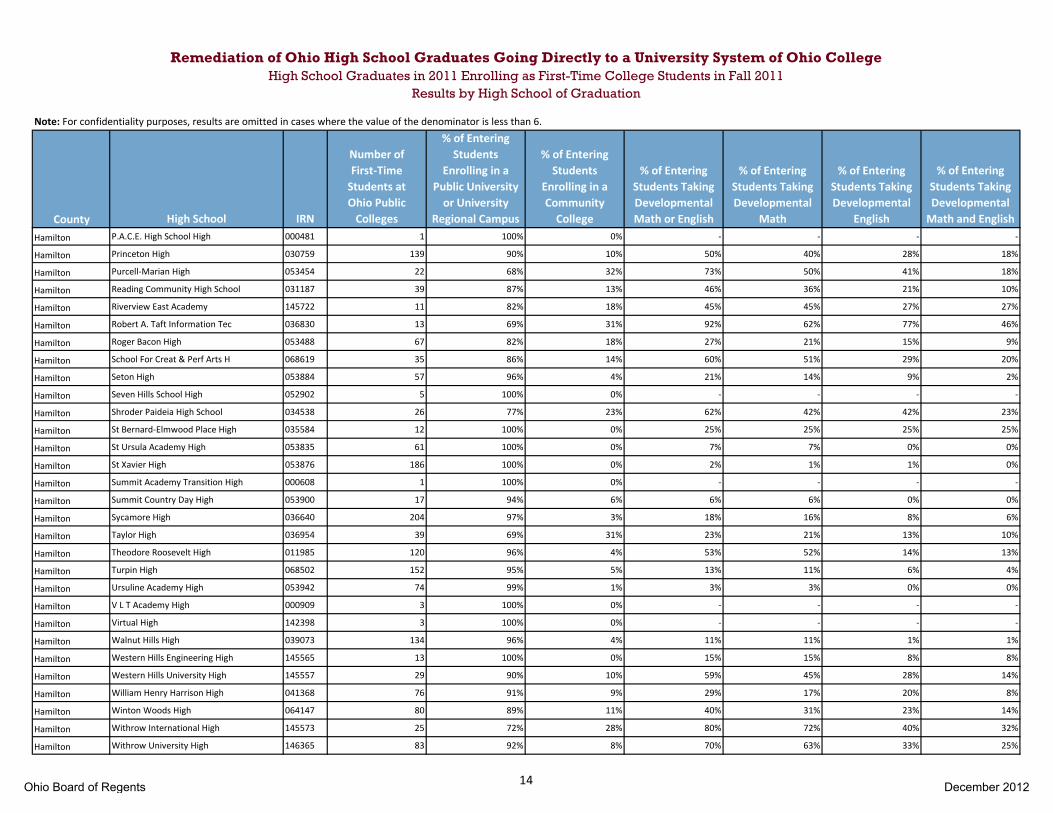
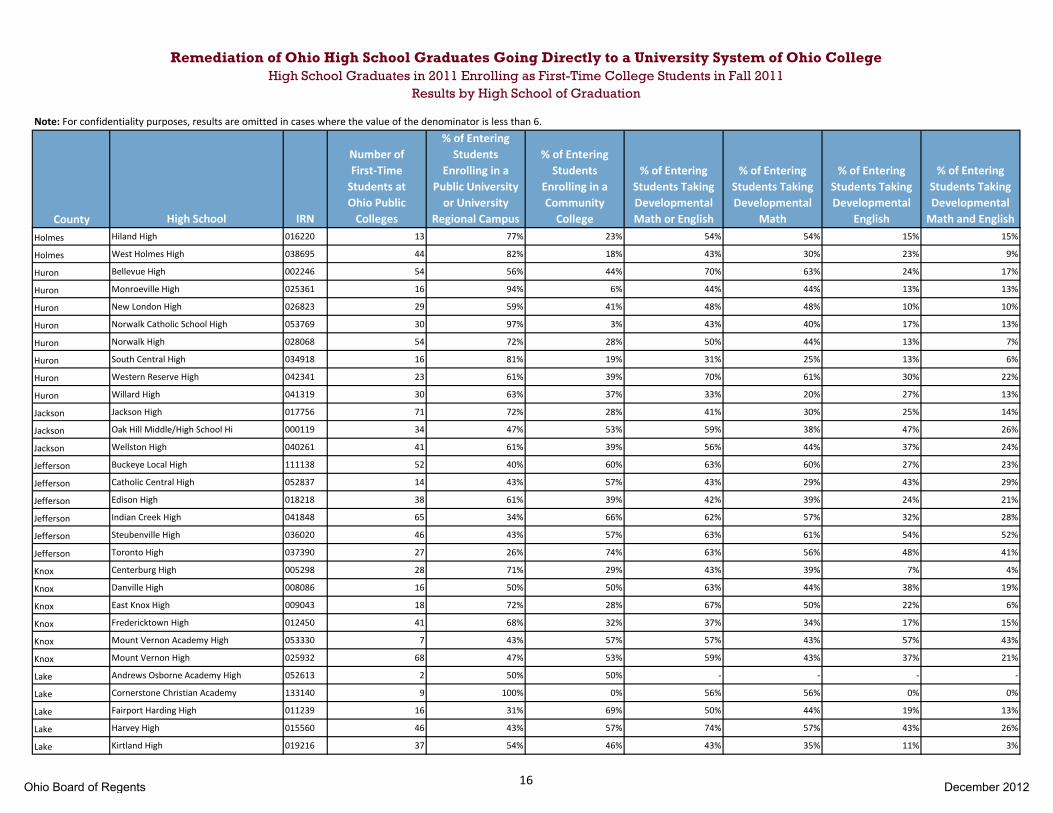
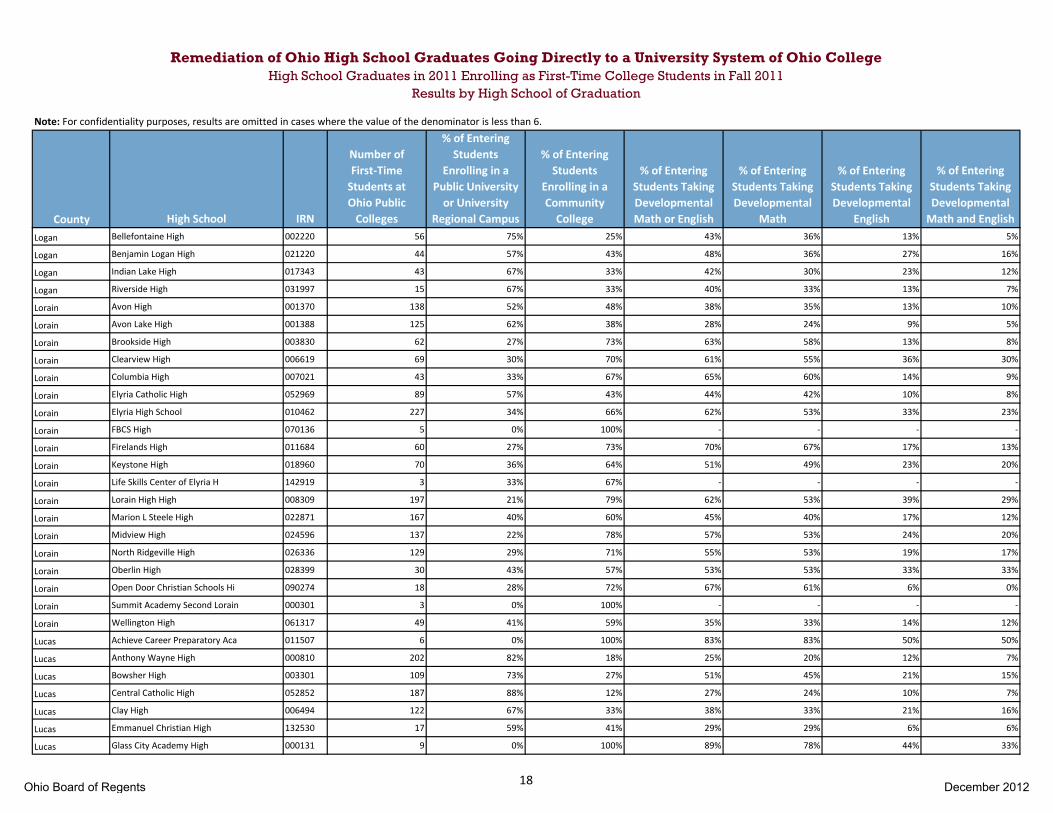
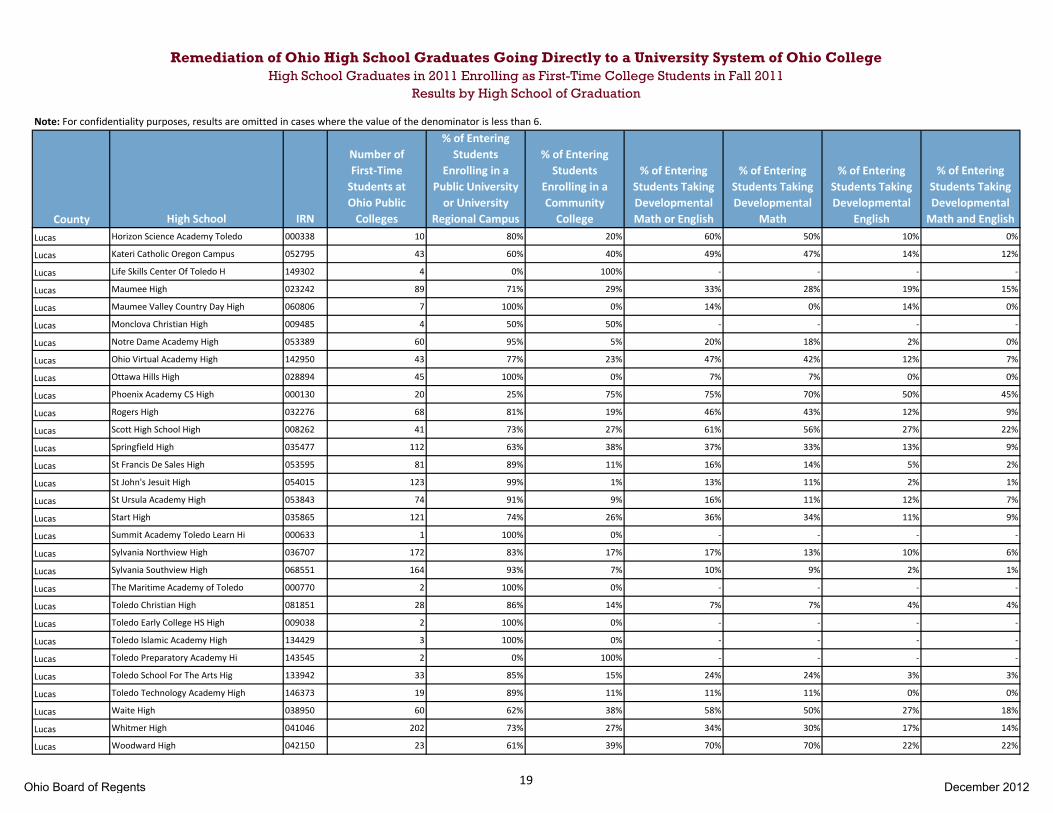
Note: For confidentiality purposes, results are omitted in cases where the value of the denominator is less than 6.
County High School IRN
Number of First‐Time Students at Ohio Public Colleges
% of Entering Students
Enrolling in a Public University or University
Regional Campus
% of Entering Students
Enrolling in a CommunityCollege
% of Entering Students Taking Developmental Math or English
% of Entering Students Taking Developmental
Math
% of Entering Students Taking Developmental
English
% of Entering Students Taking Developmental Math and English
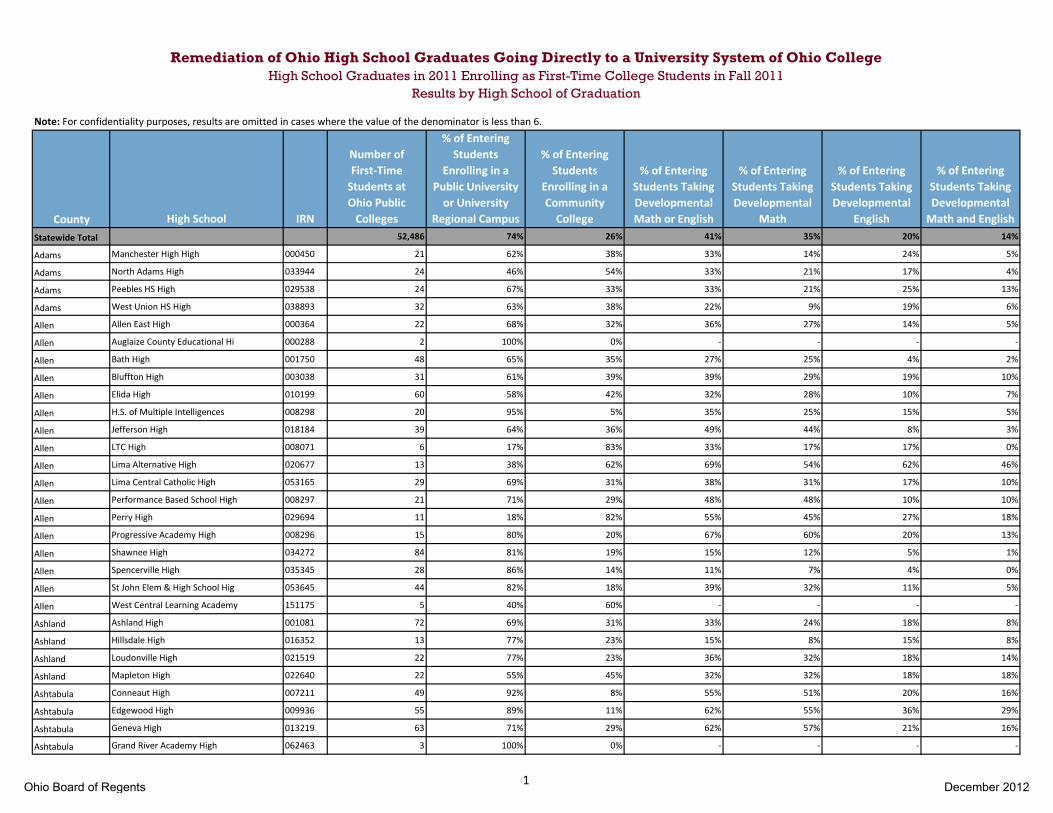
Statewide Total 52,486 74% 26% 41% 35% 20% 14%
Adams Manchester High High 000450 21 62% 38% 33% 14% 24% 5%
Adams North Adams High 033944 24 46% 54% 33% 21% 17% 4%
Adams Peebles HS High 029538 24 67% 33% 33% 21% 25% 13%
Adams West Union HS High 038893 32 63% 38% 22% 9% 19% 6%
Allen Allen East High 000364 22 68% 32% 36% 27% 14% 5%
Allen Auglaize County Educational Hi 000288 2 100% 0% ‐ ‐ ‐ ‐
Allen Bath High 001750 48 65% 35% 27% 25% 4% 2%
Allen Bluffton High 003038 31 61% 39% 39% 29% 19% 10%
Allen Elida High 010199 60 58% 42% 32% 28% 10% 7%
Allen H.S. of Multiple Intelligences 008298 20 95% 5% 35% 25% 15% 5%
Allen Jefferson High 018184 39 64% 36% 49% 44% 8% 3%
Allen LTC High 008071 6 17% 83% 33% 17% 17% 0%
Allen Lima Alternative High 020677 13 38% 62% 69% 54% 62% 46%
Allen Lima Central Catholic High 053165 29 69% 31% 38% 31% 17% 10%
Allen Performance Based School High 008297 21 71% 29% 48% 48% 10% 10%
Allen Perry High 029694 11 18% 82% 55% 45% 27% 18%
Allen Progressive Academy High 008296 15 80% 20% 67% 60% 20% 13%
Allen Shawnee High 034272 84 81% 19% 15% 12% 5% 1%
Allen Spencerville High 035345 28 86% 14% 11% 7% 4% 0%
Allen St John Elem & High School Hig 053645 44 82% 18% 39% 32% 11% 5%
Allen West Central Learning Academy 151175 5 40% 60% ‐ ‐ ‐ ‐
Ashland Ashland High 001081 72 69% 31% 33% 24% 18% 8%
Ashland Hillsdale High 016352 13 77% 23% 15% 8% 15% 8%
Ashland Loudonville High 021519 22 77% 23% 36% 32% 18% 14%
Ashland Mapleton High 022640 22 55% 45% 32% 32% 18% 18%
Ashtabula Conneaut High 007211 49 92% 8% 55% 51% 20% 16%
Ashtabula Edgewood High 009936 55 89% 11% 62% 55% 36% 29%
Ashtabula Geneva High 013219 63 71% 29% 62% 57% 21% 16%
Ashtabula Grand River Academy High 062463 3 100% 0% ‐ ‐ ‐ ‐
Remediation of Ohio High School Graduates Going Directly to a University System of Ohio CollegeHigh School Graduates in 2011 Enrolling as First-Time College Students in Fall 2011
Results by High School of Graduation
1Ohio Board of Regents December 2012

Note: For confidentiality purposes, results are omitted in cases where the value of the denominator is less than 6.
County High School IRN
Number of First‐Time Students at Ohio Public Colleges
% of Entering Students
Enrolling in a Public University or University
Regional Campus
% of Entering Students
Enrolling in a CommunityCollege
% of Entering Students Taking Developmental Math or English
% of Entering Students Taking Developmental
Math
% of Entering Students Taking Developmental
English
% of Entering Students Taking Developmental Math and English
Remediation of Ohio High School Graduates Going Directly to a University System of Ohio CollegeHigh School Graduates in 2011 Enrolling as First-Time College Students in Fall 2011
Results by High School of Graduation
Ashtabula Grand Valley High 014092 31 84% 16% 65% 65% 19% 19%
Ashtabula Jefferson Area High 017905 55 91% 9% 64% 62% 29% 27%
Ashtabula Lakeside High 001123 69 88% 12% 75% 65% 39% 29%
Ashtabula Pymatuning Valley High 030932 30 93% 7% 60% 57% 30% 27%
Ashtabula Sts John & Paul‐St John Campus 053637 7 100% 0% 71% 71% 14% 14%
Athens Alexander High 000315 52 56% 44% 54% 40% 37% 23%
Athens Athens High 001149 73 63% 37% 38% 25% 30% 16%
Athens Federal Hocking High 011478 31 35% 65% 45% 39% 26% 19%
Athens Nelsonville‐York High 026567 39 41% 59% 54% 41% 36% 23%
Athens Trimble High 013755 28 21% 79% 54% 43% 29% 18%
Auglaize Minster JR/SR High School 025114 46 93% 7% 15% 15% 4% 4%
Auglaize New Bremen High 026641 34 85% 15% 26% 24% 3% 0%
Auglaize New Knoxville High 026765 13 77% 23% 23% 23% 0% 0%
Auglaize St. Marys Memorial High School 024208 65 75% 25% 38% 31% 15% 8%
Auglaize Wapakoneta High 039164 77 77% 23% 30% 22% 14% 6%
Auglaize Waynesfield‐Goshen Local High 040097 11 27% 73% 27% 18% 9% 0%
Belmont Barnesville High 001602 31 35% 65% 65% 58% 32% 26%
Belmont Bellaire High 002139 34 44% 56% 76% 71% 47% 41%
Belmont Martins Ferry High 023036 31 58% 42% 61% 52% 42% 32%
Belmont Olney Friends High 052985 1 100% 0% ‐ ‐ ‐ ‐
Belmont Shadyside High 034090 23 39% 61% 74% 57% 48% 30%
Belmont St Clairsville High 035626 66 68% 32% 47% 45% 18% 17%
Belmont St John Central High 053652 12 83% 17% 50% 50% 17% 17%
Belmont The Bridgeport School District 003558 10 40% 60% 80% 50% 40% 10%
Belmont Union Local High 037846 31 74% 26% 65% 58% 48% 42%
Brown Eastern High 010769 32 63% 38% 19% 9% 13% 3%
Brown Fayetteville‐Perry High 011460 23 74% 26% 39% 35% 26% 22%
Brown Georgetown Jr/Sr High 013326 26 85% 15% 35% 19% 31% 15%
Brown Ripley‐Union‐Lewis‐Huntington 031815 19 84% 16% 37% 16% 26% 5%
Brown Western Brown High 025866 59 73% 27% 56% 42% 34% 20%
2Ohio Board of Regents December 2012

Note: For confidentiality purposes, results are omitted in cases where the value of the denominator is less than 6.
County High School IRN
Number of First‐Time Students at Ohio Public Colleges
% of Entering Students
Enrolling in a Public University or University
Regional Campus
% of Entering Students
Enrolling in a CommunityCollege
% of Entering Students Taking Developmental Math or English
% of Entering Students Taking Developmental
Math
% of Entering Students Taking Developmental
English
% of Entering Students Taking Developmental Math and English
Remediation of Ohio High School Graduates Going Directly to a University System of Ohio CollegeHigh School Graduates in 2011 Enrolling as First-Time College Students in Fall 2011
Results by High School of Graduation
Butler Cincinnati Christian Schools H 070409 16 94% 6% 25% 0% 25% 0%
Butler Edgewood High 037481 90 93% 7% 27% 18% 20% 11%
Butler Fairfield High 011049 290 94% 6% 29% 18% 22% 10%
Butler Hamilton High 036822 158 94% 6% 36% 24% 23% 11%
Butler Lakota East High 123836 295 94% 6% 22% 19% 10% 6%
Butler Lakota West High 019737 355 92% 8% 20% 14% 11% 6%
Butler Madison High School 022087 38 84% 16% 26% 21% 16% 11%
Butler Middletown High 024562 107 93% 7% 42% 33% 23% 14%
Butler Monroe High 139311 62 85% 15% 26% 19% 13% 6%
Butler New Miami High School 026872 16 94% 6% 50% 31% 31% 13%
Butler Ross High 032755 117 84% 16% 27% 12% 18% 3%
Butler Stephen T Badin High 052647 74 93% 7% 24% 14% 16% 5%
Butler Talawanda High 036863 108 94% 6% 19% 6% 13% 1%
Carroll Carrollton High 005017 55 56% 44% 42% 31% 25% 15%
Carroll Malvern High 022368 18 72% 28% 67% 56% 17% 6%
Champaign Graham Digital Academy High 151084 1 100% 0% ‐ ‐ ‐ ‐
Champaign Graham High 014027 55 47% 53% 25% 20% 16% 11%
Champaign Mechanicsburg High 024026 15 73% 27% 47% 33% 13% 0%
Champaign Triad High 037531 25 44% 56% 64% 56% 28% 20%
Champaign Urbana High 037994 35 69% 31% 49% 43% 20% 14%
Champaign West Liberty‐Salem MS/HS High 038760 33 52% 48% 48% 39% 21% 12%
Clark Catholic Central High School H 052829 30 90% 10% 27% 27% 10% 10%
Clark Emmanuel Christian Academy Hig 134619 14 71% 29% 36% 36% 21% 21%
Clark Greenon High 014571 53 75% 25% 38% 30% 21% 13%
Clark Kenton Ridge High 068577 67 57% 43% 46% 40% 15% 9%
Clark Northeastern High 027656 45 53% 47% 44% 40% 29% 24%
Clark Northwestern High 027896 43 63% 37% 28% 26% 16% 14%
Clark Shawnee High 034256 58 72% 28% 34% 31% 14% 10%
Clark Southeastern Sr. High School 035196 23 61% 39% 61% 43% 35% 17%
Clark Springfield High School 035527 128 38% 62% 70% 60% 44% 34%
3Ohio Board of Regents December 2012
Note: For confidentiality purposes, results are omitted in cases where the value of the denominator is less than 6.
County High School IRN
Number of First‐Time Students at Ohio Public Colleges
% of Entering Students
Enrolling in a Public University or University
Regional Campus
% of Entering Students
Enrolling in a CommunityCollege
% of Entering Students Taking Developmental Math or English
% of Entering Students Taking Developmental
Math
% of Entering Students Taking Developmental
English
% of Entering Students Taking Developmental Math and English
Remediation of Ohio High School Graduates Going Directly to a University System of Ohio CollegeHigh School Graduates in 2011 Enrolling as First-Time College Students in Fall 2011
Results by High School of Graduation
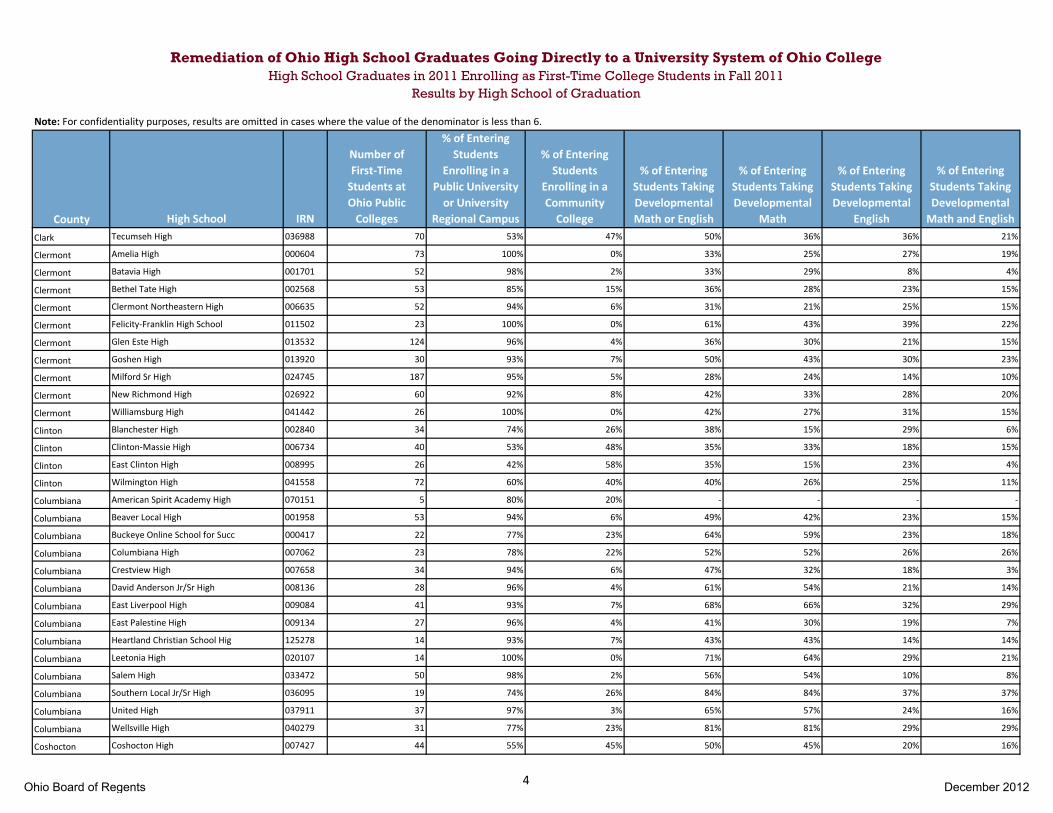
Clark Tecumseh High 036988 70 53% 47% 50% 36% 36% 21%
Clermont Amelia High 000604 73 100% 0% 33% 25% 27% 19%
Clermont Batavia High 001701 52 98% 2% 33% 29% 8% 4%
Clermont Bethel Tate High 002568 53 85% 15% 36% 28% 23% 15%
Clermont Clermont Northeastern High 006635 52 94% 6% 31% 21% 25% 15%
Clermont Felicity‐Franklin High School 011502 23 100% 0% 61% 43% 39% 22%
Clermont Glen Este High 013532 124 96% 4% 36% 30% 21% 15%
Clermont Goshen High 013920 30 93% 7% 50% 43% 30% 23%
Clermont Milford Sr High 024745 187 95% 5% 28% 24% 14% 10%
Clermont New Richmond High 026922 60 92% 8% 42% 33% 28% 20%
Clermont Williamsburg High 041442 26 100% 0% 42% 27% 31% 15%
Clinton Blanchester High 002840 34 74% 26% 38% 15% 29% 6%
Clinton Clinton‐Massie High 006734 40 53% 48% 35% 33% 18% 15%
Clinton East Clinton High 008995 26 42% 58% 35% 15% 23% 4%
Clinton Wilmington High 041558 72 60% 40% 40% 26% 25% 11%
Columbiana American Spirit Academy High 070151 5 80% 20% ‐ ‐ ‐ ‐
Columbiana Beaver Local High 001958 53 94% 6% 49% 42% 23% 15%
Columbiana Buckeye Online School for Succ 000417 22 77% 23% 64% 59% 23% 18%
Columbiana Columbiana High 007062 23 78% 22% 52% 52% 26% 26%
Columbiana Crestview High 007658 34 94% 6% 47% 32% 18% 3%
Columbiana David Anderson Jr/Sr High 008136 28 96% 4% 61% 54% 21% 14%
Columbiana East Liverpool High 009084 41 93% 7% 68% 66% 32% 29%
Columbiana East Palestine High 009134 27 96% 4% 41% 30% 19% 7%
Columbiana Heartland Christian School Hig 125278 14 93% 7% 43% 43% 14% 14%
Columbiana Leetonia High 020107 14 100% 0% 71% 64% 29% 21%
Columbiana Salem High 033472 50 98% 2% 56% 54% 10% 8%
Columbiana Southern Local Jr/Sr High 036095 19 74% 26% 84% 84% 37% 37%
Columbiana United High 037911 37 97% 3% 65% 57% 24% 16%
Columbiana Wellsville High 040279 31 77% 23% 81% 81% 29% 29%
Coshocton Coshocton High 007427 44 55% 45% 50% 45% 20% 16%
4Ohio Board of Regents December 2012
Note: For confidentiality purposes, results are omitted in cases where the value of the denominator is less than 6.
County High School IRN
Number of First‐Time Students at Ohio Public Colleges
% of Entering Students
Enrolling in a Public University or University
Regional Campus
% of Entering Students
Enrolling in a CommunityCollege
% of Entering Students Taking Developmental Math or English
% of Entering Students Taking Developmental
Math
% of Entering Students Taking Developmental
English
% of Entering Students Taking Developmental Math and English
Remediation of Ohio High School Graduates Going Directly to a University System of Ohio CollegeHigh School Graduates in 2011 Enrolling as First-Time College Students in Fall 2011
Results by High School of Graduation
Coshocton Coshocton Opportunity School H 000598 3 0% 100% ‐ ‐ ‐ ‐
Coshocton Ridgewood High 031732 32 66% 34% 56% 50% 22% 16%
Coshocton River View High 031880 45 53% 47% 47% 36% 22% 11%
Crawford Buckeye Central High 004085 20 70% 30% 30% 25% 15% 10%
Crawford Bucyrus Secondary School 004184 21 57% 43% 43% 43% 19% 19%
Crawford Col Crawford High 006965 21 76% 24% 29% 24% 10% 5%
Crawford Crestline High 007617 18 56% 44% 28% 22% 17% 11%
Crawford Galion High 012773 30 70% 30% 40% 33% 27% 20%
Crawford Wynford High 042366 27 78% 22% 41% 26% 22% 7%
Cuyahoga Bay High 001792 90 76% 24% 22% 17% 10% 4%
Cuyahoga Beachwood High 001842 71 80% 20% 28% 28% 4% 4%
Cuyahoga Beaumont School High 052654 49 98% 2% 24% 24% 0% 0%
Cuyahoga Bedford High 002022 125 63% 37% 70% 70% 31% 31%
Cuyahoga Benedictine High 052662 39 74% 26% 31% 28% 15% 13%
Cuyahoga Berea High 002428 104 53% 47% 49% 40% 30% 21%
Cuyahoga Brecksville‐Broadview Heights 003467 223 77% 23% 32% 30% 13% 12%
Cuyahoga Brooklyn High 003780 50 38% 62% 58% 46% 28% 16%
Cuyahoga Brush High 003996 183 69% 31% 62% 57% 26% 21%
Cuyahoga Chagrin Falls High 005751 56 95% 5% 20% 18% 5% 4%
Cuyahoga Cleveland Central Catholic Hig 053983 55 55% 45% 80% 73% 42% 35%
Cuyahoga Cleveland Heights High 015842 183 57% 43% 55% 50% 29% 25%
Cuyahoga Cleveland School Of The Arts H 064576 47 74% 26% 66% 62% 28% 23%
Cuyahoga Collinwood High 006940 40 58% 43% 90% 83% 68% 60%
Cuyahoga Cuyahoga Hts High 007955 30 63% 37% 33% 30% 3% 0%
Cuyahoga East Technical High 009555 40 40% 60% 90% 80% 58% 48%
Cuyahoga Eleanor Gerson Sn High 110619 1 0% 100% ‐ ‐ ‐ ‐
Cuyahoga Euclid High 010819 199 58% 42% 70% 60% 42% 32%
Cuyahoga Fairview High 011304 71 49% 51% 51% 48% 23% 20%
Cuyahoga Garfield Heights High 013136 121 61% 39% 66% 59% 32% 25%
Cuyahoga Garrett Morgan Schl Of Science 063461 22 77% 23% 73% 73% 27% 27%
5Ohio Board of Regents December 2012

Note: For confidentiality purposes, results are omitted in cases where the value of the denominator is less than 6.
County High School IRN
Number of First‐Time Students at Ohio Public Colleges
% of Entering Students
Enrolling in a Public University or University
Regional Campus
% of Entering Students
Enrolling in a CommunityCollege
% of Entering Students Taking Developmental Math or English
% of Entering Students Taking Developmental
Math
% of Entering Students Taking Developmental
English
% of Entering Students Taking Developmental Math and English
Remediation of Ohio High School Graduates Going Directly to a University System of Ohio CollegeHigh School Graduates in 2011 Enrolling as First-Time College Students in Fall 2011
Results by High School of Graduation
Cuyahoga Gilmour Academy High 052993 23 96% 4% 17% 13% 13% 9%
Cuyahoga Ginn Academy High 009421 12 100% 0% 75% 75% 33% 33%
Cuyahoga Glenville High 013680 46 65% 35% 83% 72% 57% 46%
Cuyahoga Hathaway Brown High 053033 11 91% 9% 0% 0% 0% 0%
Cuyahoga Health Careers Center High 086306 27 44% 56% 93% 78% 59% 44%
Cuyahoga Holy Name High 053348 99 69% 31% 48% 47% 19% 18%
Cuyahoga Horizon Science Acad Cleveland 133629 43 81% 19% 65% 60% 23% 19%
Cuyahoga Independence High 017285 81 47% 53% 53% 51% 30% 27%
Cuyahoga James Ford Rhodes High 017830 79 42% 58% 84% 77% 53% 47%
Cuyahoga Jane Addams Business Careers H 017863 37 54% 46% 89% 86% 51% 49%
Cuyahoga John Adams High 018325 65 51% 49% 74% 71% 42% 38%
Cuyahoga John F Kennedy High 018382 60 53% 47% 92% 83% 63% 55%
Cuyahoga John Hay Arch & Design High 019406 22 100% 0% 45% 36% 18% 9%
Cuyahoga John Hay Early College High Sc 018408 94 72% 28% 65% 59% 23% 17%
Cuyahoga John Hay Science & Med High 147397 24 100% 0% 38% 29% 13% 4%
Cuyahoga John Marshall High 018416 79 38% 62% 75% 72% 42% 39%
Cuyahoga Lakewood High 019687 182 57% 43% 53% 47% 24% 19%
Cuyahoga Laurel School High 060764 15 100% 0% 13% 13% 0% 0%
Cuyahoga Law & Municipal Careers @ MLK 093153 19 53% 47% 79% 74% 58% 53%
Cuyahoga Life Skills Of Northeast Ohio 151209 1 100% 0% ‐ ‐ ‐ ‐
Cuyahoga Lincoln‐West High 062315 52 21% 79% 73% 73% 52% 52%
Cuyahoga Lutheran East High 053199 6 50% 50% 67% 67% 50% 50%
Cuyahoga Lutheran West High 053207 56 52% 48% 41% 39% 11% 9%
Cuyahoga Magnificat High 053215 74 91% 9% 12% 12% 3% 3%
Cuyahoga Maple Heights High 022566 107 60% 40% 74% 69% 37% 33%
Cuyahoga Max S Hayes High 023259 27 22% 78% 85% 81% 74% 70%
Cuyahoga Mayfield High 023325 168 73% 27% 37% 33% 15% 11%
Cuyahoga Midpark High 024570 122 48% 52% 57% 52% 34% 28%
Cuyahoga Montessori High School High 011306 1 100% 0% ‐ ‐ ‐ ‐
Cuyahoga New Day Academy Boarding High 000677 1 100% 0% ‐ ‐ ‐ ‐
6Ohio Board of Regents December 2012
Note: For confidentiality purposes, results are omitted in cases where the value of the denominator is less than 6.
County High School IRN
Number of First‐Time Students at Ohio Public Colleges
% of Entering Students
Enrolling in a Public University or University
Regional Campus
% of Entering Students
Enrolling in a CommunityCollege
% of Entering Students Taking Developmental Math or English
% of Entering Students Taking Developmental
Math
% of Entering Students Taking Developmental
English
% of Entering Students Taking Developmental Math and English
Remediation of Ohio High School Graduates Going Directly to a University System of Ohio CollegeHigh School Graduates in 2011 Enrolling as First-Time College Students in Fall 2011
Results by High School of Graduation
Cuyahoga Normandy High 027367 154 59% 41% 47% 42% 19% 14%
Cuyahoga North Olmsted High 026302 196 59% 41% 39% 35% 19% 14%
Cuyahoga North Royalton High 010660 231 63% 37% 35% 34% 12% 11%
Cuyahoga Olmsted Falls High 028605 160 67% 33% 34% 28% 16% 10%
Cuyahoga Orange High 028712 91 71% 29% 43% 41% 16% 14%
Cuyahoga Padua Franciscan High 053439 105 89% 11% 26% 25% 4% 3%
Cuyahoga Parma Community High 133256 3 100% 0% ‐ ‐ ‐ ‐
Cuyahoga Parma High 029330 148 55% 45% 51% 45% 26% 20%
Cuyahoga Promise Academy High 000936 2 50% 50% ‐ ‐ ‐ ‐
Cuyahoga Regina High School 053470 10 90% 10% 30% 30% 0% 0%
Cuyahoga Richmond Heights High 031583 34 47% 53% 56% 44% 21% 9%
Cuyahoga Rocky River High 032243 102 82% 18% 26% 25% 6% 4%
Cuyahoga Saint Martin de Porres High 000476 27 100% 0% 81% 78% 33% 30%
Cuyahoga Shaker Hts High 034108 168 85% 15% 42% 37% 17% 11%
Cuyahoga Shaw High 034199 80 56% 44% 88% 79% 61% 53%
Cuyahoga Solon High 034835 262 94% 6% 27% 24% 9% 5%
Cuyahoga St Edward High 053546 87 76% 24% 29% 29% 9% 9%
Cuyahoga St Ignatius High 053629 123 94% 6% 7% 7% 2% 2%
Cuyahoga St Joseph Academy High 053702 66 79% 21% 35% 32% 11% 8%
Cuyahoga St Peter Chanel High 052886 43 93% 7% 47% 47% 9% 9%
Cuyahoga Strongsville High 036277 320 62% 38% 36% 33% 14% 11%
Cuyahoga SuccessTech Academy High 147389 21 48% 52% 81% 76% 38% 33%
Cuyahoga Summit Academy Community Schoo 000302 1 100% 0% ‐ ‐ ‐ ‐
Cuyahoga Trinity High 053256 49 69% 31% 39% 37% 14% 12%
Cuyahoga University School High 053926 19 100% 0% 0% 0% 0% 0%
Cuyahoga Valley Forge High 038109 145 48% 52% 59% 54% 28% 23%
Cuyahoga Villa Angela‐St Joseph High 053660 36 83% 17% 56% 53% 8% 6%
Cuyahoga Warrensville Heights High 039263 49 53% 47% 80% 65% 59% 45%
Cuyahoga Westlake High 040758 187 73% 27% 29% 26% 12% 9%
Cuyahoga Whitney Young High 062323 36 100% 0% 67% 61% 11% 6%
7Ohio Board of Regents December 2012
Note: For confidentiality purposes, results are omitted in cases where the value of the denominator is less than 6.
County High School IRN
Number of First‐Time Students at Ohio Public Colleges
% of Entering Students
Enrolling in a Public University or University
Regional Campus
% of Entering Students
Enrolling in a CommunityCollege
% of Entering Students Taking Developmental Math or English
% of Entering Students Taking Developmental
Math
% of Entering Students Taking Developmental
English
% of Entering Students Taking Developmental Math and English
Remediation of Ohio High School Graduates Going Directly to a University System of Ohio CollegeHigh School Graduates in 2011 Enrolling as First-Time College Students in Fall 2011
Results by High School of Graduation
Darke Ansonia High 000778 11 73% 27% 55% 55% 18% 18%
Darke Arcanum High 000919 18 72% 28% 17% 17% 6% 6%
Darke Franklin Monroe High 012377 11 36% 64% 64% 36% 55% 27%
Darke Greenville Senior High School 014621 52 52% 48% 42% 37% 19% 13%
Darke Mississinawa Valley JR/SR High 025122 9 56% 44% 44% 44% 22% 22%
Darke Tri‐Village High 026849 11 64% 36% 73% 73% 18% 18%
Darke Versailles High 038414 36 72% 28% 28% 19% 17% 8%
Defiance Ayersville High 001420 25 48% 52% 40% 28% 16% 4%
Defiance Defiance High 008300 60 65% 35% 28% 23% 15% 10%
Defiance Fairview High 011288 25 16% 84% 44% 40% 24% 20%
Defiance Hicksville High School High 016048 21 57% 43% 19% 14% 10% 5%
Defiance Tinora High 037275 43 70% 30% 19% 16% 7% 5%
Delaware Big Walnut High 002709 84 69% 31% 35% 31% 14% 11%
Delaware Buckeye Valley Local High 004143 61 59% 41% 33% 28% 15% 10%
Delaware Delaware Christian High 068205 1 100% 0% ‐ ‐ ‐ ‐
Delaware Olentangy High 028548 145 70% 30% 30% 28% 10% 8%
Delaware Olentangy Liberty High School 145953 183 84% 16% 20% 15% 8% 4%
Delaware Orange High School High 009286 64 100% 0% 19% 17% 3% 2%
Delaware Rutherford B Hayes High 033084 125 66% 34% 34% 30% 11% 7%
Delaware Village Academy High 111633 10 100% 0% 10% 10% 0% 0%
Erie Edison High 010041 58 91% 9% 47% 41% 24% 19%
Erie Huron High 017194 36 94% 6% 42% 33% 17% 8%
Erie Kelleys Island High 018663 1 100% 0% ‐ ‐ ‐ ‐
Erie Margaretta High 022764 36 89% 11% 56% 47% 28% 19%
Erie Perkins High 029637 78 90% 10% 49% 45% 17% 13%
Erie Sandusky Central Catholic Scho 053751 19 100% 0% 32% 32% 5% 5%
Erie Sandusky High 033555 84 93% 7% 57% 55% 24% 21%
Erie Vermilion High 038349 69 28% 72% 52% 49% 16% 13%
Fairfield Amanda‐Clearcreek High 000562 45 64% 36% 56% 47% 38% 29%
Fairfield Berne Union High 002501 20 65% 35% 60% 50% 50% 40%
8Ohio Board of Regents December 2012

Note: For confidentiality purposes, results are omitted in cases where the value of the denominator is less than 6.
County High School IRN
Number of First‐Time Students at Ohio Public Colleges
% of Entering Students
Enrolling in a Public University or University
Regional Campus
% of Entering Students
Enrolling in a CommunityCollege
% of Entering Students Taking Developmental Math or English
% of Entering Students Taking Developmental
Math
% of Entering Students Taking Developmental
English
% of Entering Students Taking Developmental Math and English
Remediation of Ohio High School Graduates Going Directly to a University System of Ohio CollegeHigh School Graduates in 2011 Enrolling as First-Time College Students in Fall 2011
Results by High School of Graduation
Fairfield Bloom‐Carroll High 004994 44 80% 20% 36% 32% 16% 11%
Fairfield Fairfield Christian Academy 134510 7 100% 0% 14% 0% 14% 0%
Fairfield Fairfield Union High 011072 54 65% 35% 44% 37% 24% 17%
Fairfield Lancaster Campus High 019752 108 73% 27% 38% 26% 28% 16%
Fairfield Liberty Union High 020420 33 61% 39% 39% 33% 27% 21%
Fairfield Millersport Jr/Sr High 039081 22 73% 27% 55% 45% 18% 9%
Fairfield Pickerington Central High 029876 200 73% 28% 43% 36% 22% 15%
Fairfield Pickerington HS North High 145086 235 84% 16% 26% 21% 9% 4%
Fairfield Wm V Fisher Catholic High 052670 32 91% 9% 31% 28% 9% 6%
Fayette Miami Trace High 024414 66 56% 44% 33% 24% 17% 8%
Fayette Washington High 039701 42 60% 40% 36% 31% 19% 14%
Franklin Academic Acceleration Academy 000912 1 100% 0% ‐ ‐ ‐ ‐
Franklin Arts & College Preparatory Aca 143610 6 33% 67% 83% 50% 50% 17%
Franklin Beechcroft High 068528 69 78% 22% 74% 59% 48% 33%
Franklin Bexley High 002675 80 85% 15% 16% 13% 9% 5%
Franklin Bishop Hartley High 052696 86 91% 9% 22% 21% 5% 3%
Franklin Bishop Ready High 052704 39 74% 26% 44% 36% 18% 10%
Franklin Bishop Watterson High 052720 128 88% 12% 16% 16% 2% 2%
Franklin Briggs High 067728 51 41% 59% 69% 69% 39% 39%
Franklin Brookhaven High 003764 43 58% 42% 77% 74% 47% 44%
Franklin COLUMBUS GLOBAL ACADEMY High 138099 1 100% 0% ‐ ‐ ‐ ‐
Franklin Canal Winchester High 004770 108 83% 17% 33% 27% 18% 11%
Franklin Centennial High 068536 79 56% 44% 49% 46% 14% 10%
Franklin Central Crossing High 142018 52 94% 6% 23% 15% 17% 10%
Franklin Columbus Academy High 052910 22 91% 9% 5% 5% 5% 5%
Franklin Columbus Africentric Early Col 142034 33 82% 18% 58% 52% 30% 24%
Franklin Columbus Alternative High 023606 79 78% 22% 48% 44% 13% 9%
Franklin Columbus Downtown High School 070102 20 100% 0% 90% 75% 55% 40%
Franklin Columbus School For Girls High 052928 17 100% 0% 0% 0% 0% 0%
Franklin Columbus Torah Academy High 062620 5 60% 40% ‐ ‐ ‐ ‐
9Ohio Board of Regents December 2012

Note: For confidentiality purposes, results are omitted in cases where the value of the denominator is less than 6.
County High School IRN
Number of First‐Time Students at Ohio Public Colleges
% of Entering Students
Enrolling in a Public University or University
Regional Campus
% of Entering Students
Enrolling in a CommunityCollege
% of Entering Students Taking Developmental Math or English
% of Entering Students Taking Developmental
Math
% of Entering Students Taking Developmental
English
% of Entering Students Taking Developmental Math and English
Remediation of Ohio High School Graduates Going Directly to a University System of Ohio CollegeHigh School Graduates in 2011 Enrolling as First-Time College Students in Fall 2011
Results by High School of Graduation
Franklin Dublin Coffman High 064758 241 82% 18% 22% 21% 6% 4%
Franklin Dublin Jerome High 146928 141 90% 10% 16% 15% 4% 3%
Franklin Dublin Scioto High 120485 125 73% 27% 23% 22% 9% 7%
Franklin East High School 009514 21 86% 14% 62% 52% 43% 33%
Franklin Eastmoor Academy High 138198 54 74% 26% 63% 54% 43% 33%
Franklin Electronic Classrm Of Tomorrow 133413 134 59% 41% 65% 59% 29% 23%
Franklin FCI Academy High 000585 8 63% 38% 100% 75% 75% 50%
Franklin Focus Learning/Sw Columbus Hig 142927 10 0% 100% 100% 100% 60% 60%
Franklin Fort Hayes Arts and Academic H 068239 48 58% 42% 67% 54% 38% 25%
Franklin Franklin Heights High 012328 66 38% 62% 62% 53% 32% 23%
Franklin Gahanna Christian Academy High 086389 5 60% 40% ‐ ‐ ‐ ‐
Franklin Grahan School, The 133421 5 60% 40% ‐ ‐ ‐ ‐
Franklin Grandview Heights High 014100 49 76% 24% 31% 31% 14% 14%
Franklin Grove City Christian School 112227 8 75% 25% 38% 38% 0% 0%
Franklin Grove City High 061325 148 51% 49% 42% 39% 17% 14%
Franklin Groveport Madison High 014704 99 55% 45% 77% 72% 39% 34%
Franklin Hamilton Township High 014944 37 43% 57% 65% 59% 27% 22%
Franklin Harvest Preparatory School Hig 096719 16 81% 19% 75% 75% 19% 19%
Franklin Hilliard Bradley High School H 009091 86 100% 0% 10% 7% 3% 0%
Franklin Hilliard Darby High 123539 169 60% 40% 34% 33% 17% 15%
Franklin Hilliard Davidson High 016303 235 69% 31% 31% 27% 12% 7%
Franklin Horizon Science Acad Columbus 133660 19 79% 21% 58% 47% 42% 32%
Franklin Independence High 067736 36 94% 6% 56% 56% 25% 25%
Franklin Life Skills Center of Col Nort 008282 2 0% 100% ‐ ‐ ‐ ‐
Franklin Lincoln High 020883 268 78% 22% 33% 31% 13% 11%
Franklin Linden‐McKinley Stem School on 021030 28 64% 36% 75% 68% 54% 46%
Franklin Madison Christian School High 089722 14 43% 57% 36% 29% 14% 7%
Franklin Marburn Academy 088070 5 20% 80% ‐ ‐ ‐ ‐
Franklin Marion‐Franklin High 022855 62 58% 42% 81% 69% 50% 39%
Franklin Mifflin High 024661 40 53% 48% 75% 73% 55% 53%
10Ohio Board of Regents December 2012

Note: For confidentiality purposes, results are omitted in cases where the value of the denominator is less than 6.
County High School IRN
Number of First‐Time Students at Ohio Public Colleges
% of Entering Students
Enrolling in a Public University or University
Regional Campus
% of Entering Students
Enrolling in a CommunityCollege
% of Entering Students Taking Developmental Math or English
% of Entering Students Taking Developmental
Math
% of Entering Students Taking Developmental
English
% of Entering Students Taking Developmental Math and English
Remediation of Ohio High School Graduates Going Directly to a University System of Ohio CollegeHigh School Graduates in 2011 Enrolling as First-Time College Students in Fall 2011
Results by High School of Graduation
Franklin New Albany High 030155 138 88% 12% 22% 20% 7% 4%
Franklin Northland High 027680 89 66% 34% 61% 55% 43% 37%
Franklin Oakstone Academy HS High 010184 1 100% 0% ‐ ‐ ‐ ‐
Franklin Premier Academy of Ohio High 000938 1 100% 0% ‐ ‐ ‐ ‐
Franklin Reynoldsburg High 031435 158 72% 28% 41% 37% 18% 15%
Franklin South High School 035063 18 50% 50% 67% 67% 50% 50%
Franklin St Charles Preparatory High 053520 70 91% 9% 4% 4% 0% 0%
Franklin St Francis De Sales High 053587 79 80% 20% 25% 23% 10% 8%
Franklin Thomas Worthington High 042283 186 66% 34% 27% 24% 11% 8%
Franklin Tree Of Life‐Northridge Branch 088062 13 62% 38% 31% 23% 8% 0%
Franklin Upper Arlington High 037945 179 82% 18% 22% 18% 7% 3%
Franklin Virtual Community Sch Of Ohio 143537 11 64% 36% 45% 36% 27% 18%
Franklin Walnut Ridge High 039107 53 47% 53% 79% 72% 53% 45%
Franklin Wellington School High 090209 12 92% 8% 8% 0% 8% 0%
Franklin West High 040527 47 34% 66% 79% 74% 57% 53%
Franklin Westerville Central High 146183 167 73% 27% 32% 25% 14% 8%
Franklin Westerville‐North High 067959 190 66% 34% 37% 33% 14% 9%
Franklin Westerville‐South High 040675 148 66% 34% 44% 37% 21% 14%
Franklin Westland High 061333 106 46% 54% 65% 59% 28% 23%
Franklin Whetstone High 040964 66 50% 50% 50% 48% 26% 24%
Franklin Whitehall Yearling High 041020 56 63% 38% 64% 57% 21% 14%
Franklin Worthington Christian High 071001 37 51% 49% 30% 27% 5% 3%
Franklin Worthington Kilbourne High 112094 141 91% 9% 16% 11% 8% 2%
Fulton Archbold High 000935 27 70% 30% 30% 22% 22% 15%
Fulton Evergreen High 010884 35 86% 14% 26% 20% 9% 3%
Fulton Fayette Jr/Sr High 013870 12 67% 33% 33% 33% 25% 25%
Fulton Pettisville High 029793 12 33% 67% 25% 17% 8% 0%
Fulton Pike‐Delta‐York High 008342 26 46% 54% 62% 38% 42% 19%
Fulton Swanton High 036582 29 93% 7% 34% 28% 7% 0%
Fulton Wauseon High 039883 49 55% 45% 29% 22% 10% 4%
11Ohio Board of Regents December 2012
Note: For confidentiality purposes, results are omitted in cases where the value of the denominator is less than 6.
County High School IRN
Number of First‐Time Students at Ohio Public Colleges
% of Entering Students
Enrolling in a Public University or University
Regional Campus
% of Entering Students
Enrolling in a CommunityCollege
% of Entering Students Taking Developmental Math or English
% of Entering Students Taking Developmental
Math
% of Entering Students Taking Developmental
English
% of Entering Students Taking Developmental Math and English
Remediation of Ohio High School Graduates Going Directly to a University System of Ohio CollegeHigh School Graduates in 2011 Enrolling as First-Time College Students in Fall 2011
Results by High School of Graduation
Gallia Gallia Academy High 012799 57 46% 54% 49% 42% 25% 18%
Gallia Ohio Valley Christian School H 008246 4 0% 100% ‐ ‐ ‐ ‐
Gallia River Valley High 019364 43 19% 81% 63% 58% 44% 40%
Gallia South Gallia High 015099 16 6% 94% 69% 56% 56% 44%
Geauga Berkshire High 002436 45 76% 24% 56% 49% 18% 11%
Geauga Cardinal High 004853 27 81% 19% 33% 33% 4% 4%
Geauga Chardon High 005876 124 70% 30% 26% 23% 10% 6%
Geauga Hawken School High 053041 12 100% 0% 8% 8% 0% 0%
Geauga Kenston High 018770 121 88% 12% 33% 31% 9% 7%
Geauga Ledgemont High 020057 16 38% 63% 38% 38% 13% 13%
Geauga Newbury High 027052 22 73% 27% 45% 45% 14% 14%
Geauga Notre Dame‐Cathedral Latin Hig 053371 85 95% 5% 32% 31% 4% 2%
Geauga West Geauga High 038653 134 64% 36% 34% 28% 12% 6%
Greene Beavercreek High 001966 331 73% 27% 30% 20% 18% 9%
Greene Bellbrook High School High 002154 95 84% 16% 19% 15% 8% 4%
Greene Cedarville High 005173 16 81% 19% 13% 6% 6% 0%
Greene Fairborn Digital Academy High 149088 4 75% 25% ‐ ‐ ‐ ‐
Greene Fairborn High 042796 117 62% 38% 56% 44% 38% 26%
Greene Greeneview High 014498 30 60% 40% 30% 23% 20% 13%
Greene Xenia Christian High School Hi 122499 16 63% 38% 63% 63% 19% 19%
Greene Xenia High 042408 110 64% 36% 52% 41% 35% 25%
Greene Yellow Springs/McKinney High 042416 15 80% 20% 40% 27% 40% 27%
Guernsey Buckeye Trail High 042564 40 63% 38% 48% 43% 20% 15%
Guernsey Cambridge High 004622 52 65% 35% 63% 60% 17% 13%
Guernsey Rolling Hills High 023960 40 28% 73% 60% 58% 30% 28%
Hamilton Aiken College and Career High 147538 42 86% 14% 60% 43% 40% 24%
Hamilton Anderson High 000687 173 98% 2% 18% 13% 10% 5%
Hamilton Cincinnati College Prep Acad H 133512 5 100% 0% ‐ ‐ ‐ ‐
Hamilton Cincinnati Country Day High 052894 9 100% 0% 0% 0% 0% 0%
Hamilton Cincinnati Hills Christian Aca 122697 40 100% 0% 13% 13% 3% 3%
12Ohio Board of Regents December 2012
Note: For confidentiality purposes, results are omitted in cases where the value of the denominator is less than 6.
County High School IRN
Number of First‐Time Students at Ohio Public Colleges
% of Entering Students
Enrolling in a Public University or University
Regional Campus
% of Entering Students
Enrolling in a CommunityCollege
% of Entering Students Taking Developmental Math or English
% of Entering Students Taking Developmental
Math
% of Entering Students Taking Developmental
English
% of Entering Students Taking Developmental Math and English
Remediation of Ohio High School Graduates Going Directly to a University System of Ohio CollegeHigh School Graduates in 2011 Enrolling as First-Time College Students in Fall 2011
Results by High School of Graduation
Hamilton Clark Montessori High 098590 38 84% 16% 47% 39% 21% 13%
Hamilton Colerain High 006890 162 75% 25% 38% 29% 24% 15%
Hamilton Deer Park JR/SR High School 008250 35 97% 3% 29% 29% 6% 6%
Hamilton Dohn Community High 133264 2 0% 100% ‐ ‐ ‐ ‐
Hamilton Elder High 052951 110 80% 20% 20% 15% 10% 5%
Hamilton Finneytown Secondary Campus Hi 011668 55 80% 20% 40% 29% 27% 16%
Hamilton Gamble High High 009200 3 100% 0% ‐ ‐ ‐ ‐
Hamilton Gilbert A. Dater High School 008110 39 79% 21% 59% 51% 33% 26%
Hamilton Horizon Science Acad. Cincini 000804 7 100% 0% 71% 43% 43% 14%
Hamilton Hughes Center High 017111 47 94% 6% 57% 53% 34% 30%
Hamilton Indian Hill High 017301 72 99% 1% 8% 8% 3% 3%
Hamilton Lasalle High 053140 77 92% 8% 22% 18% 14% 10%
Hamilton Life Skills Ctr Of Cincinnati 133785 6 50% 50% 100% 100% 67% 67%
Hamilton Life Skills Ctr Of Hamilton Co 143164 2 50% 50% ‐ ‐ ‐ ‐
Hamilton Lockland High 021188 18 94% 6% 67% 56% 50% 39%
Hamilton Loveland High 021600 138 97% 3% 20% 17% 9% 5%
Hamilton Madeira High 021956 50 100% 0% 8% 8% 0% 0%
Hamilton Mariemont High 022772 60 98% 2% 18% 15% 7% 3%
Hamilton McAuley High School High 053272 82 95% 5% 11% 10% 4% 2%
Hamilton McNicholas High 053298 95 98% 2% 13% 12% 3% 2%
Hamilton Moeller High 053306 112 94% 6% 13% 9% 5% 1%
Hamilton Mother Of Mercy High 053314 52 88% 12% 25% 25% 8% 8%
Hamilton Mount Healthy High 025817 57 86% 14% 60% 46% 39% 25%
Hamilton Mount Notre Dame High 053322 73 97% 3% 14% 12% 3% 1%
Hamilton North College Hill High School 026120 43 88% 12% 56% 37% 28% 9%
Hamilton Northwest High 064683 87 87% 13% 34% 26% 21% 13%
Hamilton Norwood High 028100 46 89% 11% 50% 41% 26% 17%
Hamilton Oak Hills High 028217 234 73% 27% 29% 25% 18% 14%
Hamilton Ohio Connections Academy High 000236 12 75% 25% 50% 50% 17% 17%
Hamilton Oyler High 029009 4 50% 50% ‐ ‐ ‐ ‐
13Ohio Board of Regents December 2012
Note: For confidentiality purposes, results are omitted in cases where the value of the denominator is less than 6.
County High School IRN
Number of First‐Time Students at Ohio Public Colleges
% of Entering Students
Enrolling in a Public University or University
Regional Campus
% of Entering Students
Enrolling in a CommunityCollege
% of Entering Students Taking Developmental Math or English
% of Entering Students Taking Developmental
Math
% of Entering Students Taking Developmental
English
% of Entering Students Taking Developmental Math and English
Remediation of Ohio High School Graduates Going Directly to a University System of Ohio CollegeHigh School Graduates in 2011 Enrolling as First-Time College Students in Fall 2011
Results by High School of Graduation
Hamilton P.A.C.E. High School High 000481 1 100% 0% ‐ ‐ ‐ ‐
Hamilton Princeton High 030759 139 90% 10% 50% 40% 28% 18%
Hamilton Purcell‐Marian High 053454 22 68% 32% 73% 50% 41% 18%
Hamilton Reading Community High School 031187 39 87% 13% 46% 36% 21% 10%
Hamilton Riverview East Academy 145722 11 82% 18% 45% 45% 27% 27%
Hamilton Robert A. Taft Information Tec 036830 13 69% 31% 92% 62% 77% 46%
Hamilton Roger Bacon High 053488 67 82% 18% 27% 21% 15% 9%
Hamilton School For Creat & Perf Arts H 068619 35 86% 14% 60% 51% 29% 20%
Hamilton Seton High 053884 57 96% 4% 21% 14% 9% 2%
Hamilton Seven Hills School High 052902 5 100% 0% ‐ ‐ ‐ ‐
Hamilton Shroder Paideia High School 034538 26 77% 23% 62% 42% 42% 23%
Hamilton St Bernard‐Elmwood Place High 035584 12 100% 0% 25% 25% 25% 25%
Hamilton St Ursula Academy High 053835 61 100% 0% 7% 7% 0% 0%
Hamilton St Xavier High 053876 186 100% 0% 2% 1% 1% 0%
Hamilton Summit Academy Transition High 000608 1 100% 0% ‐ ‐ ‐ ‐
Hamilton Summit Country Day High 053900 17 94% 6% 6% 6% 0% 0%
Hamilton Sycamore High 036640 204 97% 3% 18% 16% 8% 6%
Hamilton Taylor High 036954 39 69% 31% 23% 21% 13% 10%
Hamilton Theodore Roosevelt High 011985 120 96% 4% 53% 52% 14% 13%
Hamilton Turpin High 068502 152 95% 5% 13% 11% 6% 4%
Hamilton Ursuline Academy High 053942 74 99% 1% 3% 3% 0% 0%
Hamilton V L T Academy High 000909 3 100% 0% ‐ ‐ ‐ ‐
Hamilton Virtual High 142398 3 100% 0% ‐ ‐ ‐ ‐
Hamilton Walnut Hills High 039073 134 96% 4% 11% 11% 1% 1%
Hamilton Western Hills Engineering High 145565 13 100% 0% 15% 15% 8% 8%
Hamilton Western Hills University High 145557 29 90% 10% 59% 45% 28% 14%
Hamilton William Henry Harrison High 041368 76 91% 9% 29% 17% 20% 8%
Hamilton Winton Woods High 064147 80 89% 11% 40% 31% 23% 14%
Hamilton Withrow International High 145573 25 72% 28% 80% 72% 40% 32%
Hamilton Withrow University High 146365 83 92% 8% 70% 63% 33% 25%
14Ohio Board of Regents December 2012

Note: For confidentiality purposes, results are omitted in cases where the value of the denominator is less than 6.
County High School IRN
Number of First‐Time Students at Ohio Public Colleges
% of Entering Students
Enrolling in a Public University or University
Regional Campus
% of Entering Students
Enrolling in a CommunityCollege
% of Entering Students Taking Developmental Math or English
% of Entering Students Taking Developmental
Math
% of Entering Students Taking Developmental
English
% of Entering Students Taking Developmental Math and English
Remediation of Ohio High School Graduates Going Directly to a University System of Ohio CollegeHigh School Graduates in 2011 Enrolling as First-Time College Students in Fall 2011
Results by High School of Graduation
Hamilton Woodward Career Technical High 147520 41 78% 22% 85% 76% 59% 49%
Hamilton Wyoming High 042382 93 99% 1% 14% 11% 5% 2%
Hancock Arcadia High 000893 18 56% 44% 44% 44% 22% 22%
Hancock Arlington Local High 000992 22 55% 45% 55% 50% 14% 9%
Hancock Cory‐Rawson High 007401 13 77% 23% 8% 8% 8% 8%
Hancock Findlay Digital Academy High 000402 5 20% 80% ‐ ‐ ‐ ‐
Hancock Findlay High 011627 157 71% 29% 36% 31% 16% 10%
Hancock Liberty‐Benton High 020446 27 56% 44% 33% 26% 15% 7%
Hancock McComb High School High 023457 14 86% 14% 14% 14% 14% 14%
Hancock St Wendelin Catholic School Hi 053868 19 63% 37% 53% 53% 21% 21%
Hancock Van Buren High 038232 35 66% 34% 29% 26% 17% 14%
Hancock Vanlue High 038299 6 83% 17% 67% 50% 33% 17%
Hardin Ada High 000067 24 71% 29% 50% 46% 8% 4%
Hardin Hardin Northern High 015172 12 67% 33% 42% 42% 17% 17%
Hardin Kenton High 018846 46 65% 35% 46% 33% 15% 2%
Hardin Ridgemont High 031716 11 64% 36% 18% 18% 0% 0%
Hardin Riverdale High 031898 21 62% 38% 48% 43% 14% 10%
Hardin Upper Scioto Valley High 037960 10 50% 50% 80% 80% 30% 30%
Harrison Conotton Valley Jr/Sr High 007245 13 77% 23% 77% 77% 31% 31%
Harrison Harrison Central High 004507 41 22% 78% 85% 85% 34% 34%
Henry Holgate High 016568 14 57% 43% 50% 43% 14% 7%
Henry Liberty Center High 020297 38 53% 47% 42% 29% 32% 18%
Henry Napoleon High 026419 67 60% 40% 31% 25% 16% 10%
Henry Patrick Henry High 008433 24 54% 46% 33% 33% 0% 0%
Highland Fairfield Local High 011056 20 25% 75% 55% 40% 30% 15%
Highland Hillsboro High 016345 81 20% 80% 28% 19% 17% 7%
Highland Lynchburg‐Clay High 021816 23 48% 52% 48% 30% 35% 17%
Highland McClain High 023424 44 66% 34% 43% 34% 20% 11%
Highland Whiteoak High 041004 22 27% 73% 32% 14% 23% 5%
Hocking Logan High High 021246 104 62% 38% 43% 30% 36% 22%
15Ohio Board of Regents December 2012
Note: For confidentiality purposes, results are omitted in cases where the value of the denominator is less than 6.
County High School IRN
Number of First‐Time Students at Ohio Public Colleges
% of Entering Students
Enrolling in a Public University or University
Regional Campus
% of Entering Students
Enrolling in a CommunityCollege
% of Entering Students Taking Developmental Math or English
% of Entering Students Taking Developmental
Math
% of Entering Students Taking Developmental
English
% of Entering Students Taking Developmental Math and English
Remediation of Ohio High School Graduates Going Directly to a University System of Ohio CollegeHigh School Graduates in 2011 Enrolling as First-Time College Students in Fall 2011
Results by High School of Graduation
Holmes Hiland High 016220 13 77% 23% 54% 54% 15% 15%
Holmes West Holmes High 038695 44 82% 18% 43% 30% 23% 9%
Huron Bellevue High 002246 54 56% 44% 70% 63% 24% 17%
Huron Monroeville High 025361 16 94% 6% 44% 44% 13% 13%
Huron New London High 026823 29 59% 41% 48% 48% 10% 10%
Huron Norwalk Catholic School High 053769 30 97% 3% 43% 40% 17% 13%
Huron Norwalk High 028068 54 72% 28% 50% 44% 13% 7%
Huron South Central High 034918 16 81% 19% 31% 25% 13% 6%
Huron Western Reserve High 042341 23 61% 39% 70% 61% 30% 22%
Huron Willard High 041319 30 63% 37% 33% 20% 27% 13%
Jackson Jackson High 017756 71 72% 28% 41% 30% 25% 14%
Jackson Oak Hill Middle/High School Hi 000119 34 47% 53% 59% 38% 47% 26%
Jackson Wellston High 040261 41 61% 39% 56% 44% 37% 24%
Jefferson Buckeye Local High 111138 52 40% 60% 63% 60% 27% 23%
Jefferson Catholic Central High 052837 14 43% 57% 43% 29% 43% 29%
Jefferson Edison High 018218 38 61% 39% 42% 39% 24% 21%
Jefferson Indian Creek High 041848 65 34% 66% 62% 57% 32% 28%
Jefferson Steubenville High 036020 46 43% 57% 63% 61% 54% 52%
Jefferson Toronto High 037390 27 26% 74% 63% 56% 48% 41%
Knox Centerburg High 005298 28 71% 29% 43% 39% 7% 4%
Knox Danville High 008086 16 50% 50% 63% 44% 38% 19%
Knox East Knox High 009043 18 72% 28% 67% 50% 22% 6%
Knox Fredericktown High 012450 41 68% 32% 37% 34% 17% 15%
Knox Mount Vernon Academy High 053330 7 43% 57% 57% 43% 57% 43%
Knox Mount Vernon High 025932 68 47% 53% 59% 43% 37% 21%
Lake Andrews Osborne Academy High 052613 2 50% 50% ‐ ‐ ‐ ‐
Lake Cornerstone Christian Academy 133140 9 100% 0% 56% 56% 0% 0%
Lake Fairport Harding High 011239 16 31% 69% 50% 44% 19% 13%
Lake Harvey High 015560 46 43% 57% 74% 57% 43% 26%
Lake Kirtland High 019216 37 54% 46% 43% 35% 11% 3%
16Ohio Board of Regents December 2012

Note: For confidentiality purposes, results are omitted in cases where the value of the denominator is less than 6.
County High School IRN
Number of First‐Time Students at Ohio Public Colleges
% of Entering Students
Enrolling in a Public University or University
Regional Campus
% of Entering Students
Enrolling in a CommunityCollege
% of Entering Students Taking Developmental Math or English
% of Entering Students Taking Developmental
Math
% of Entering Students Taking Developmental
English
% of Entering Students Taking Developmental Math and English
Remediation of Ohio High School Graduates Going Directly to a University System of Ohio CollegeHigh School Graduates in 2011 Enrolling as First-Time College Students in Fall 2011
Results by High School of Graduation
Lake Lake Catholic High 064394 125 74% 26% 34% 33% 6% 4%
Lake Madison High 022111 118 49% 51% 44% 37% 19% 12%
Lake Mentor High 024281 331 57% 43% 40% 35% 14% 9%
Lake North High 027573 131 53% 47% 55% 45% 24% 14%
Lake Perry High 029710 81 77% 23% 31% 27% 9% 5%
Lake Riverside Jr/Sr High 031989 144 56% 44% 38% 28% 17% 8%
Lake South High 035089 151 52% 48% 41% 34% 15% 9%
Lake Wickliffe High 041202 59 47% 53% 37% 27% 24% 14%
Lawrence Chesapeake High 006098 16 100% 0% 69% 56% 19% 6%
Lawrence Dawson‐Bryant High 008219 22 100% 0% 45% 23% 32% 9%
Lawrence Fairland High 011114 18 94% 6% 50% 39% 39% 28%
Lawrence Ironton High 017491 30 87% 13% 63% 50% 37% 23%
Lawrence Rock Hill Sr High 146480 37 95% 5% 62% 46% 38% 22%
Lawrence South Point High 033282 13 100% 0% 69% 46% 38% 15%
Lawrence St Joseph Central High 053728 1 100% 0% ‐ ‐ ‐ ‐
Lawrence Symmes Valley High 036749 15 60% 40% 67% 47% 40% 20%
Licking Granville Christian Academy Hi 126144 12 83% 17% 33% 33% 0% 0%
Licking Granville High 014258 85 89% 11% 12% 12% 4% 4%
Licking Heath High 015792 31 65% 35% 52% 42% 26% 16%
Licking Johnstown High 018481 45 71% 29% 42% 31% 22% 11%
Licking Lakewood High 019695 36 69% 31% 33% 28% 14% 8%
Licking Liberty Christian Academy East 000551 1 100% 0% ‐ ‐ ‐ ‐
Licking Licking Heights High 020461 55 71% 29% 60% 47% 33% 20%
Licking Licking Valley High 020487 41 66% 34% 66% 59% 22% 15%
Licking Newark Catholic High 053355 23 78% 22% 30% 26% 4% 0%
Licking Newark Digital Academy High 000162 5 0% 100% ‐ ‐ ‐ ‐
Licking Newark High 027011 105 68% 32% 39% 35% 22% 18%
Licking Northridge High 027771 31 77% 23% 48% 45% 10% 6%
Licking Utica High 038042 35 60% 40% 54% 49% 23% 17%
Licking Watkins Memorial High 039842 103 68% 32% 43% 39% 15% 11%
17Ohio Board of Regents December 2012
Note: For confidentiality purposes, results are omitted in cases where the value of the denominator is less than 6.
County High School IRN
Number of First‐Time Students at Ohio Public Colleges
% of Entering Students
Enrolling in a Public University or University
Regional Campus
% of Entering Students
Enrolling in a CommunityCollege
% of Entering Students Taking Developmental Math or English
% of Entering Students Taking Developmental
Math
% of Entering Students Taking Developmental
English
% of Entering Students Taking Developmental Math and English
Remediation of Ohio High School Graduates Going Directly to a University System of Ohio CollegeHigh School Graduates in 2011 Enrolling as First-Time College Students in Fall 2011
Results by High School of Graduation
Logan Bellefontaine High 002220 56 75% 25% 43% 36% 13% 5%
Logan Benjamin Logan High 021220 44 57% 43% 48% 36% 27% 16%
Logan Indian Lake High 017343 43 67% 33% 42% 30% 23% 12%
Logan Riverside High 031997 15 67% 33% 40% 33% 13% 7%
Lorain Avon High 001370 138 52% 48% 38% 35% 13% 10%
Lorain Avon Lake High 001388 125 62% 38% 28% 24% 9% 5%
Lorain Brookside High 003830 62 27% 73% 63% 58% 13% 8%
Lorain Clearview High 006619 69 30% 70% 61% 55% 36% 30%
Lorain Columbia High 007021 43 33% 67% 65% 60% 14% 9%
Lorain Elyria Catholic High 052969 89 57% 43% 44% 42% 10% 8%
Lorain Elyria High School 010462 227 34% 66% 62% 53% 33% 23%
Lorain FBCS High 070136 5 0% 100% ‐ ‐ ‐ ‐
Lorain Firelands High 011684 60 27% 73% 70% 67% 17% 13%
Lorain Keystone High 018960 70 36% 64% 51% 49% 23% 20%
Lorain Life Skills Center of Elyria H 142919 3 33% 67% ‐ ‐ ‐ ‐
Lorain Lorain High High 008309 197 21% 79% 62% 53% 39% 29%
Lorain Marion L Steele High 022871 167 40% 60% 45% 40% 17% 12%
Lorain Midview High 024596 137 22% 78% 57% 53% 24% 20%
Lorain North Ridgeville High 026336 129 29% 71% 55% 53% 19% 17%
Lorain Oberlin High 028399 30 43% 57% 53% 53% 33% 33%
Lorain Open Door Christian Schools Hi 090274 18 28% 72% 67% 61% 6% 0%
Lorain Summit Academy Second Lorain 000301 3 0% 100% ‐ ‐ ‐ ‐
Lorain Wellington High 061317 49 41% 59% 35% 33% 14% 12%
Lucas Achieve Career Preparatory Aca 011507 6 0% 100% 83% 83% 50% 50%
Lucas Anthony Wayne High 000810 202 82% 18% 25% 20% 12% 7%
Lucas Bowsher High 003301 109 73% 27% 51% 45% 21% 15%
Lucas Central Catholic High 052852 187 88% 12% 27% 24% 10% 7%
Lucas Clay High 006494 122 67% 33% 38% 33% 21% 16%
Lucas Emmanuel Christian High 132530 17 59% 41% 29% 29% 6% 6%
Lucas Glass City Academy High 000131 9 0% 100% 89% 78% 44% 33%
18Ohio Board of Regents December 2012
Note: For confidentiality purposes, results are omitted in cases where the value of the denominator is less than 6.
County High School IRN
Number of First‐Time Students at Ohio Public Colleges
% of Entering Students
Enrolling in a Public University or University
Regional Campus
% of Entering Students
Enrolling in a CommunityCollege
% of Entering Students Taking Developmental Math or English
% of Entering Students Taking Developmental
Math
% of Entering Students Taking Developmental
English
% of Entering Students Taking Developmental Math and English
Remediation of Ohio High School Graduates Going Directly to a University System of Ohio CollegeHigh School Graduates in 2011 Enrolling as First-Time College Students in Fall 2011
Results by High School of Graduation
Lucas Horizon Science Academy Toledo 000338 10 80% 20% 60% 50% 10% 0%
Lucas Kateri Catholic Oregon Campus 052795 43 60% 40% 49% 47% 14% 12%
Lucas Life Skills Center Of Toledo H 149302 4 0% 100% ‐ ‐ ‐ ‐
Lucas Maumee High 023242 89 71% 29% 33% 28% 19% 15%
Lucas Maumee Valley Country Day High 060806 7 100% 0% 14% 0% 14% 0%
Lucas Monclova Christian High 009485 4 50% 50% ‐ ‐ ‐ ‐
Lucas Notre Dame Academy High 053389 60 95% 5% 20% 18% 2% 0%
Lucas Ohio Virtual Academy High 142950 43 77% 23% 47% 42% 12% 7%
Lucas Ottawa Hills High 028894 45 100% 0% 7% 7% 0% 0%
Lucas Phoenix Academy CS High 000130 20 25% 75% 75% 70% 50% 45%
Lucas Rogers High 032276 68 81% 19% 46% 43% 12% 9%
Lucas Scott High School High 008262 41 73% 27% 61% 56% 27% 22%
Lucas Springfield High 035477 112 63% 38% 37% 33% 13% 9%
Lucas St Francis De Sales High 053595 81 89% 11% 16% 14% 5% 2%
Lucas St John's Jesuit High 054015 123 99% 1% 13% 11% 2% 1%
Lucas St Ursula Academy High 053843 74 91% 9% 16% 11% 12% 7%
Lucas Start High 035865 121 74% 26% 36% 34% 11% 9%
Lucas Summit Academy Toledo Learn Hi 000633 1 100% 0% ‐ ‐ ‐ ‐
Lucas Sylvania Northview High 036707 172 83% 17% 17% 13% 10% 6%
Lucas Sylvania Southview High 068551 164 93% 7% 10% 9% 2% 1%
Lucas The Maritime Academy of Toledo 000770 2 100% 0% ‐ ‐ ‐ ‐
Lucas Toledo Christian High 081851 28 86% 14% 7% 7% 4% 4%
Lucas Toledo Early College HS High 009038 2 100% 0% ‐ ‐ ‐ ‐
Lucas Toledo Islamic Academy High 134429 3 100% 0% ‐ ‐ ‐ ‐
Lucas Toledo Preparatory Academy Hi 143545 2 0% 100% ‐ ‐ ‐ ‐
Lucas Toledo School For The Arts Hig 133942 33 85% 15% 24% 24% 3% 3%
Lucas Toledo Technology Academy High 146373 19 89% 11% 11% 11% 0% 0%
Lucas Waite High 038950 60 62% 38% 58% 50% 27% 18%
Lucas Whitmer High 041046 202 73% 27% 34% 30% 17% 14%
Lucas Woodward High 042150 23 61% 39% 70% 70% 22% 22%
19Ohio Board of Regents December 2012

Note: For confidentiality purposes, results are omitted in cases where the value of the denominator is less than 6.
County High School IRN
Number of First‐Time Students at Ohio Public Colleges
% of Entering Students
Enrolling in a Public University or University
Regional Campus
% of Entering Students
Enrolling in a CommunityCollege
% of Entering Students Taking Developmental Math or English
% of Entering Students Taking Developmental
Math
% of Entering Students Taking Developmental
English
% of Entering Students Taking Developmental Math and English
Remediation of Ohio High School Graduates Going Directly to a University System of Ohio CollegeHigh School Graduates in 2011 Enrolling as First-Time College Students in Fall 2011
Results by High School of Graduation
Madison Jonathan Alder High 018507 61 62% 38% 49% 43% 15% 8%
Madison London High 021287 51 53% 47% 49% 39% 22% 12%
Madison Madison‐Plains HS High 022160 35 37% 63% 51% 40% 29% 17%
Madison West Jefferson High 038737 45 42% 58% 49% 44% 22% 18%
Mahoning Boardman High 003061 225 99% 1% 52% 44% 29% 21%
Mahoning Canfield High 004796 177 98% 2% 32% 23% 19% 10%
Mahoning Cardinal Mooney High 052787 86 100% 0% 55% 42% 35% 22%
Mahoning Chaney Campus of VPA and STEM 005850 46 89% 11% 83% 67% 65% 50%
Mahoning East High School 031138 43 91% 9% 79% 74% 67% 63%
Mahoning Fitch High 011791 192 99% 1% 48% 34% 31% 18%
Mahoning Jackson‐Milton High 017798 25 100% 0% 48% 40% 28% 20%
Mahoning Life Skills Ctr Of Youngstown 133801 4 75% 25% ‐ ‐ ‐ ‐
Mahoning Lowellville High 021683 38 100% 0% 47% 37% 26% 16%
Mahoning Mahoning Unlimited Classroom H 148999 3 100% 0% ‐ ‐ ‐ ‐
Mahoning Mahoning Valley Opportunity Hi 008251 5 100% 0% ‐ ‐ ‐ ‐
Mahoning Mckinley High 023879 14 86% 14% 79% 79% 14% 14%
Mahoning Memorial High 024190 28 96% 4% 64% 50% 43% 29%
Mahoning Poland Seminary High 030452 117 99% 1% 45% 36% 32% 22%
Mahoning South Range High 026229 54 98% 2% 48% 35% 26% 13%
Mahoning Springfield High 035469 52 96% 4% 54% 40% 42% 29%
Mahoning Struthers High 036301 78 99% 1% 54% 35% 42% 23%
Mahoning Summit Academy Sec Youngstown 000303 3 100% 0% ‐ ‐ ‐ ‐
Mahoning Ursuline High 053934 50 100% 0% 56% 50% 34% 28%
Mahoning West Branch High 038554 68 84% 16% 53% 49% 21% 16%
Mahoning Western Reserve High 042333 35 94% 6% 43% 34% 17% 9%
Mahoning Youngstown Christian High 068403 13 100% 0% 77% 77% 54% 54%
Mahoning Youngstown Early College High 000520 48 100% 0% 73% 67% 13% 6%
Marion Elgin High 010173 18 67% 33% 50% 39% 22% 11%
Marion Harding High 015214 81 72% 28% 31% 15% 25% 9%
Marion Marion Catholic Jr/Sr High 053231 5 80% 20% ‐ ‐ ‐ ‐
20Ohio Board of Regents December 2012

Note: For confidentiality purposes, results are omitted in cases where the value of the denominator is less than 6.
County High School IRN
Number of First‐Time Students at Ohio Public Colleges
% of Entering Students
Enrolling in a Public University or University
Regional Campus
% of Entering Students
Enrolling in a CommunityCollege
% of Entering Students Taking Developmental Math or English
% of Entering Students Taking Developmental
Math
% of Entering Students Taking Developmental
English
% of Entering Students Taking Developmental Math and English
Remediation of Ohio High School Graduates Going Directly to a University System of Ohio CollegeHigh School Graduates in 2011 Enrolling as First-Time College Students in Fall 2011
Results by High School of Graduation
Marion Pleasant High 030304 25 84% 16% 40% 28% 24% 12%
Marion Ridgedale Community School Hig 151167 2 100% 0% ‐ ‐ ‐ ‐
Marion Ridgedale Jr/Sr High 031666 14 64% 36% 43% 36% 21% 14%
Marion River Valley High 031872 40 60% 40% 40% 35% 25% 20%
Marion Rushmore Academy High 011444 1 0% 100% ‐ ‐ ‐ ‐
Marion Treca Digital Academy High 143305 19 37% 63% 74% 63% 32% 21%
Medina Black River High 002782 41 54% 46% 54% 49% 22% 17%
Medina Brunswick High 003970 311 59% 41% 50% 45% 22% 16%
Medina Buckeye High 004127 77 62% 38% 42% 42% 9% 9%
Medina Cloverleaf High 006759 89 81% 19% 44% 36% 12% 4%
Medina Highland High 016154 140 78% 22% 28% 24% 11% 6%
Medina Medina High 024075 262 77% 23% 33% 29% 15% 10%
Medina Wadsworth High 038935 151 91% 9% 27% 25% 6% 4%
Meigs Eastern High 009571 29 59% 41% 34% 31% 10% 7%
Meigs Meigs High 024117 69 41% 59% 54% 49% 32% 28%
Meigs Southern High 035220 15 53% 47% 53% 53% 7% 7%
Mercer Celina High 005207 88 88% 13% 32% 31% 1% 0%
Mercer Coldwater High 006858 47 83% 17% 45% 34% 13% 2%
Mercer Fort Recovery High 012674 29 76% 24% 34% 31% 7% 3%
Mercer Marion Local High 022863 38 71% 29% 39% 32% 18% 11%
Mercer Parkway High 029280 23 70% 30% 35% 30% 22% 17%
Mercer St Henry High 035659 39 79% 21% 49% 41% 13% 5%
Miami Bethel High 002576 32 59% 41% 31% 19% 25% 13%
Miami Bradford High 003376 11 55% 45% 27% 27% 27% 27%
Miami Covington High 007534 22 41% 59% 41% 32% 23% 14%
Miami Miami East High 024372 24 63% 38% 33% 29% 8% 4%
Miami Milton‐Union High 024984 40 48% 53% 45% 40% 25% 20%
Miami Newton High 027169 17 59% 41% 29% 24% 12% 6%
Miami Piqua High 030098 81 46% 54% 52% 48% 20% 16%
Miami TCHS High 125310 14 71% 29% 36% 29% 14% 7%
21Ohio Board of Regents December 2012

Note: For confidentiality purposes, results are omitted in cases where the value of the denominator is less than 6.
County High School IRN
Number of First‐Time Students at Ohio Public Colleges
% of Entering Students
Enrolling in a Public University or University
Regional Campus
% of Entering Students
Enrolling in a CommunityCollege
% of Entering Students Taking Developmental Math or English
% of Entering Students Taking Developmental
Math
% of Entering Students Taking Developmental
English
% of Entering Students Taking Developmental Math and English
Remediation of Ohio High School Graduates Going Directly to a University System of Ohio CollegeHigh School Graduates in 2011 Enrolling as First-Time College Students in Fall 2011
Results by High School of Graduation
Miami Tippecanoe High School High 037291 97 66% 34% 31% 23% 15% 7%
Miami Troy High 037598 114 60% 40% 39% 30% 23% 13%
Monroe Beallsville High 001883 17 35% 65% 71% 71% 41% 41%
Monroe Monroe Central High 042085 32 53% 47% 63% 56% 25% 19%
Monroe River High 031856 21 57% 43% 67% 62% 24% 19%
Montgomery Archbishop Alter High 052621 65 94% 6% 25% 18% 9% 3%
Montgomery Belmont High 002303 49 35% 65% 86% 76% 76% 65%
Montgomery Brookville High 003863 47 68% 32% 30% 21% 17% 9%
Montgomery Butler High 004416 137 61% 39% 31% 20% 19% 9%
Montgomery Carroll High 052803 149 79% 21% 29% 26% 11% 7%
Montgomery Centerville High 005322 315 81% 19% 21% 16% 12% 7%
Montgomery Chaminade‐Julienne High 052878 82 77% 23% 33% 23% 20% 10%
Montgomery David H. Ponitz Career Technol 066795 22 86% 14% 77% 50% 50% 23%
Montgomery Dayton Christian School High 066555 30 67% 33% 60% 50% 27% 17%
Montgomery Dayton Early College Academy H 009283 19 89% 11% 47% 47% 5% 5%
Montgomery Dayton Tech Design High Sch Hi 008283 12 58% 42% 83% 67% 58% 42%
Montgomery Dixie High 008532 31 52% 48% 39% 23% 32% 16%
Montgomery Dunbar High 008821 53 62% 38% 74% 60% 57% 43%
Montgomery Horizon Science Academy Dayton 011534 6 100% 0% 83% 67% 33% 17%
Montgomery ISUS Trade and Tech Prep 143347 3 33% 67% ‐ ‐ ‐ ‐
Montgomery Jefferson High 018150 20 50% 50% 60% 45% 50% 35%
Montgomery Kettering Fairmont High 018929 221 51% 49% 34% 25% 25% 17%
Montgomery Life Skills Center of Dayton H 000813 8 0% 100% 88% 88% 88% 88%
Montgomery Meadowdale HS High 023986 40 48% 53% 80% 63% 65% 48%
Montgomery Miami Valley High 067637 15 33% 67% 53% 40% 47% 33%
Montgomery Miamisburg High 024422 158 65% 35% 41% 34% 25% 18%
Montgomery Mound Street Health Careers Ac 143131 2 50% 50% ‐ ‐ ‐ ‐
Montgomery Mound Street IT Careers Academ 143115 2 100% 0% ‐ ‐ ‐ ‐
Montgomery New Choices Community High 133769 7 71% 29% 100% 57% 71% 29%
Montgomery Northmont High 027698 185 68% 32% 32% 25% 22% 15%
22Ohio Board of Regents December 2012

Note: For confidentiality purposes, results are omitted in cases where the value of the denominator is less than 6.
County High School IRN
Number of First‐Time Students at Ohio Public Colleges
% of Entering Students
Enrolling in a Public University or University
Regional Campus
% of Entering Students
Enrolling in a CommunityCollege
% of Entering Students Taking Developmental Math or English
% of Entering Students Taking Developmental
Math
% of Entering Students Taking Developmental
English
% of Entering Students Taking Developmental Math and English
Remediation of Ohio High School Graduates Going Directly to a University System of Ohio CollegeHigh School Graduates in 2011 Enrolling as First-Time College Students in Fall 2011
Results by High School of Graduation
Montgomery Northridge High 027763 30 47% 53% 50% 40% 37% 27%
Montgomery Oakwood High 028373 74 85% 15% 20% 19% 7% 5%
Montgomery Spring Valley Academy High 052936 6 67% 33% 50% 50% 17% 17%
Montgomery Stebbins High 035956 71 63% 37% 45% 41% 20% 15%
Montgomery Stivers School For The Arts Hi 036152 69 75% 25% 46% 39% 23% 16%
Montgomery Tech Con Institute High 000473 1 100% 0% ‐ ‐ ‐ ‐
Montgomery Thurgood Marshall HS High 006841 47 77% 23% 68% 49% 47% 28%
Montgomery Trotwood‐Madison High 022186 68 66% 34% 74% 63% 51% 41%
Montgomery Valley View High 038174 56 68% 32% 29% 23% 14% 9%
Montgomery Wayne High 040048 184 53% 47% 47% 39% 33% 24%
Montgomery West Carrollton High 038588 58 43% 57% 59% 45% 47% 33%
Morgan Morgan High 025544 51 49% 51% 47% 43% 25% 22%
Morrow Cardington‐Lincoln High 004861 28 57% 43% 46% 32% 25% 11%
Morrow Gilead Christian High 092247 4 25% 75% ‐ ‐ ‐ ‐
Morrow Highland High 016162 31 81% 19% 42% 32% 26% 16%
Morrow Mt Gilead High 025783 18 61% 39% 56% 44% 33% 22%
Morrow Northmor High 027722 14 36% 64% 21% 14% 14% 7%
Muskingum Bishop Rosecrans High 052712 8 100% 0% 25% 25% 25% 25%
Muskingum Foxfire High School High 149328 2 100% 0% ‐ ‐ ‐ ‐
Muskingum John Glenn High 013656 70 64% 36% 40% 37% 19% 16%
Muskingum Maysville High 023358 56 54% 46% 59% 45% 32% 18%
Muskingum Philo High 029843 45 69% 31% 47% 42% 27% 22%
Muskingum Tri‐Valley High 037515 87 62% 38% 36% 31% 25% 21%
Muskingum West Muskingum High 038836 44 70% 30% 32% 27% 20% 16%
Muskingum Zanesville High 042598 76 75% 25% 59% 55% 22% 18%
Noble Caldwell High 004556 24 33% 67% 71% 54% 33% 17%
Noble Shenandoah High 034314 31 42% 58% 55% 42% 29% 16%
Ottawa Danbury High 008052 11 64% 36% 45% 36% 36% 27%
Ottawa Genoa Area High 013243 62 66% 34% 37% 37% 8% 8%
Ottawa Oak Harbor High 028183 51 43% 57% 51% 39% 31% 20%
23Ohio Board of Regents December 2012

Note: For confidentiality purposes, results are omitted in cases where the value of the denominator is less than 6.
County High School IRN
Number of First‐Time Students at Ohio Public Colleges
% of Entering Students
Enrolling in a Public University or University
Regional Campus
% of Entering Students
Enrolling in a CommunityCollege
% of Entering Students Taking Developmental Math or English
% of Entering Students Taking Developmental
Math
% of Entering Students Taking Developmental
English
% of Entering Students Taking Developmental Math and English
Remediation of Ohio High School Graduates Going Directly to a University System of Ohio CollegeHigh School Graduates in 2011 Enrolling as First-Time College Students in Fall 2011
Results by High School of Graduation
Ottawa Port Clinton High 030841 41 59% 41% 44% 34% 24% 15%
Ottawa Put‐In‐Bay High 030908 6 100% 0% 17% 17% 0% 0%
Paulding Antwerp Local High 000844 13 85% 15% 23% 15% 8% 0%
Paulding Paulding High 029454 41 46% 54% 51% 46% 12% 7%
Paulding Wayne Trace High 029470 14 50% 50% 36% 29% 21% 14%
Perry Crooksville High 007823 18 56% 44% 56% 50% 33% 28%
Perry Miller High 024851 28 39% 61% 61% 50% 36% 25%
Perry New Lexington High 064865 49 67% 33% 39% 31% 27% 18%
Perry Sheridan High 034363 60 68% 32% 57% 48% 27% 18%
Pickaway Circleville High 006320 48 79% 21% 54% 38% 19% 2%
Pickaway Logan Elm High 021212 59 76% 24% 41% 32% 17% 8%
Pickaway Teays Valley High 036962 85 64% 36% 46% 33% 22% 9%
Pickaway Westfall High 040683 32 63% 38% 50% 44% 25% 19%
Pike Eastern High 009589 27 89% 11% 48% 26% 30% 7%
Pike Piketon Jr/Sr High 029991 42 86% 14% 36% 19% 24% 7%
Pike Waverly High 039909 48 96% 4% 44% 33% 23% 13%
Pike Western High 040667 8 88% 13% 38% 25% 13% 0%
Portage Aurora High 001297 110 95% 5% 32% 30% 6% 5%
Portage Crestwood High 007724 79 82% 18% 47% 46% 16% 15%
Portage Field High 011551 63 94% 6% 62% 59% 17% 14%
Portage James A Garfield High 013110 36 97% 3% 64% 61% 25% 22%
Portage Ravenna High 031104 55 96% 4% 64% 58% 25% 20%
Portage Rootstown/Ward Davis Bldg High 032607 24 83% 17% 79% 75% 17% 13%
Portage Southeast High 035170 53 94% 6% 53% 53% 13% 13%
Portage Streetsboro High 036269 59 85% 15% 63% 61% 17% 15%
Portage Theodore Roosevelt High School 032508 3 0% 100% ‐ ‐ ‐ ‐
Portage Waterloo High 039784 38 79% 21% 66% 66% 13% 13%
Portage Windham High 041723 19 100% 0% 74% 68% 21% 16%
Preble Eaton High 009803 36 69% 31% 31% 28% 17% 14%
Preble National Trail High 026468 12 75% 25% 33% 17% 25% 8%
24Ohio Board of Regents December 2012

Note: For confidentiality purposes, results are omitted in cases where the value of the denominator is less than 6.
County High School IRN
Number of First‐Time Students at Ohio Public Colleges
% of Entering Students
Enrolling in a Public University or University
Regional Campus
% of Entering Students
Enrolling in a CommunityCollege
% of Entering Students Taking Developmental Math or English
% of Entering Students Taking Developmental
Math
% of Entering Students Taking Developmental
English
% of Entering Students Taking Developmental Math and English
Remediation of Ohio High School Graduates Going Directly to a University System of Ohio CollegeHigh School Graduates in 2011 Enrolling as First-Time College Students in Fall 2011
Results by High School of Graduation
Preble Preble Shawnee High 034264 33 70% 30% 48% 42% 27% 21%
Preble Tri‐County North High 037697 18 50% 50% 56% 50% 39% 33%
Preble Twin Valley South High 037705 27 74% 26% 22% 22% 7% 7%
Putnam Columbus Grove High 007104 30 80% 20% 17% 13% 10% 7%
Putnam Continental Local High 007278 24 67% 33% 29% 21% 17% 8%
Putnam Fort Jennings High 012625 16 69% 31% 25% 13% 25% 13%
Putnam Kalida High 018606 29 66% 34% 17% 17% 14% 14%
Putnam Leipsic High 020149 31 61% 39% 42% 29% 26% 13%
Putnam Miller City High 024810 15 53% 47% 27% 13% 20% 7%
Putnam Ottawa‐Glandorf High 028910 66 67% 33% 21% 17% 11% 6%
Putnam Ottoville High 028936 22 68% 32% 45% 41% 14% 9%
Putnam Pandora‐Gilboa High 029074 9 78% 22% 33% 33% 11% 11%
Richland Alternative School High 135566 2 0% 100% ‐ ‐ ‐ ‐
Richland Clear Fork High 006551 51 73% 27% 33% 25% 14% 6%
Richland Crestview High 007674 32 63% 38% 44% 31% 25% 13%
Richland Lexington High 020255 90 78% 22% 36% 28% 17% 9%
Richland Lucas High 021717 12 67% 33% 17% 17% 8% 8%
Richland Madison High 022178 51 43% 57% 39% 27% 20% 8%
Richland Mansfield Christian High 067629 6 50% 50% 50% 33% 33% 17%
Richland Mansfield Enhancement Academy 000392 1 100% 0% ‐ ‐ ‐ ‐
Richland Mansfield Senior High School 022483 56 73% 27% 43% 34% 20% 11%
Richland Ontario High 028670 56 75% 25% 27% 20% 11% 4%
Richland Plymouth High 030429 17 47% 53% 41% 35% 24% 18%
Richland Shelby High 034306 67 73% 27% 15% 10% 9% 4%
Richland St Peter High School and Junio 053785 17 94% 6% 24% 12% 12% 0%
Ross Adena High 000208 33 94% 6% 39% 27% 18% 6%
Ross Chillicothe High 006296 75 88% 12% 44% 39% 17% 12%
Ross Huntington High 017160 35 91% 9% 74% 57% 37% 20%
Ross Paint Valley High 029025 30 80% 20% 47% 23% 37% 13%
Ross Southeastern High 035204 27 85% 15% 59% 41% 41% 22%
25Ohio Board of Regents December 2012

Note: For confidentiality purposes, results are omitted in cases where the value of the denominator is less than 6.
County High School IRN
Number of First‐Time Students at Ohio Public Colleges
% of Entering Students
Enrolling in a Public University or University
Regional Campus
% of Entering Students
Enrolling in a CommunityCollege
% of Entering Students Taking Developmental Math or English
% of Entering Students Taking Developmental
Math
% of Entering Students Taking Developmental
English
% of Entering Students Taking Developmental Math and English
Remediation of Ohio High School Graduates Going Directly to a University System of Ohio CollegeHigh School Graduates in 2011 Enrolling as First-Time College Students in Fall 2011
Results by High School of Graduation
Ross Unioto High 037861 46 83% 17% 50% 39% 26% 15%
Ross Zane Trace High 042572 38 87% 13% 53% 47% 24% 18%
Sandusky Bishop Hoffman St Joseph Cath 053686 38 79% 21% 26% 26% 0% 0%
Sandusky Clyde High 006791 73 37% 63% 51% 49% 25% 23%
Sandusky Fremont Ross High 012500 126 37% 63% 59% 54% 36% 31%
Sandusky Gibsonburg High 013433 22 32% 68% 50% 45% 36% 32%
Sandusky Lakota High 019745 23 22% 78% 65% 52% 39% 26%
Sandusky Woodmore High 042044 35 71% 29% 23% 23% 11% 11%
Scioto Clay High 006502 12 92% 8% 25% 0% 25% 0%
Scioto Glenwood High 013730 8 75% 25% 50% 25% 38% 13%
Scioto Green High 014373 11 91% 9% 36% 9% 36% 9%
Scioto Minford High 025080 47 94% 6% 47% 9% 47% 9%
Scioto Northwest High 027854 45 96% 4% 38% 7% 33% 2%
Scioto Notre Dame Jr/Sr High 053363 8 100% 0% 25% 0% 25% 0%
Scioto PJHS/PHS High 030569 66 97% 3% 55% 9% 50% 5%
Scioto Portsmouth West High 030585 39 97% 3% 33% 8% 28% 3%
Scioto Sciotoville High 143644 16 81% 19% 31% 19% 25% 13%
Scioto South Webster Jr/Sr High 002873 28 93% 7% 39% 7% 32% 0%
Scioto Valley High 038125 30 97% 3% 37% 3% 33% 0%
Scioto Wheelersburg High 040931 46 98% 2% 22% 4% 22% 4%
Seneca Bettsville High 002626 4 25% 75% ‐ ‐ ‐ ‐
Seneca Bridges Community Academy High 000311 2 100% 0% ‐ ‐ ‐ ‐
Seneca Calvert Catholic Schools High 052779 11 82% 18% 45% 36% 27% 18%
Seneca Columbian High 007054 44 41% 59% 55% 52% 23% 20%
Seneca Fostoria Junior/Senior High Sc 012039 27 56% 44% 41% 41% 33% 33%
Seneca Hopewell‐Loudon Local High 016816 19 42% 58% 47% 47% 11% 11%
Seneca New Riegel High 026955 13 62% 38% 23% 15% 23% 15%
Seneca Old Fort High 028506 16 31% 69% 63% 56% 25% 19%
Seneca Seneca East High 001198 32 78% 22% 38% 28% 9% 0%
Shelby Anna High 000752 37 73% 27% 27% 27% 5% 5%
26Ohio Board of Regents December 2012
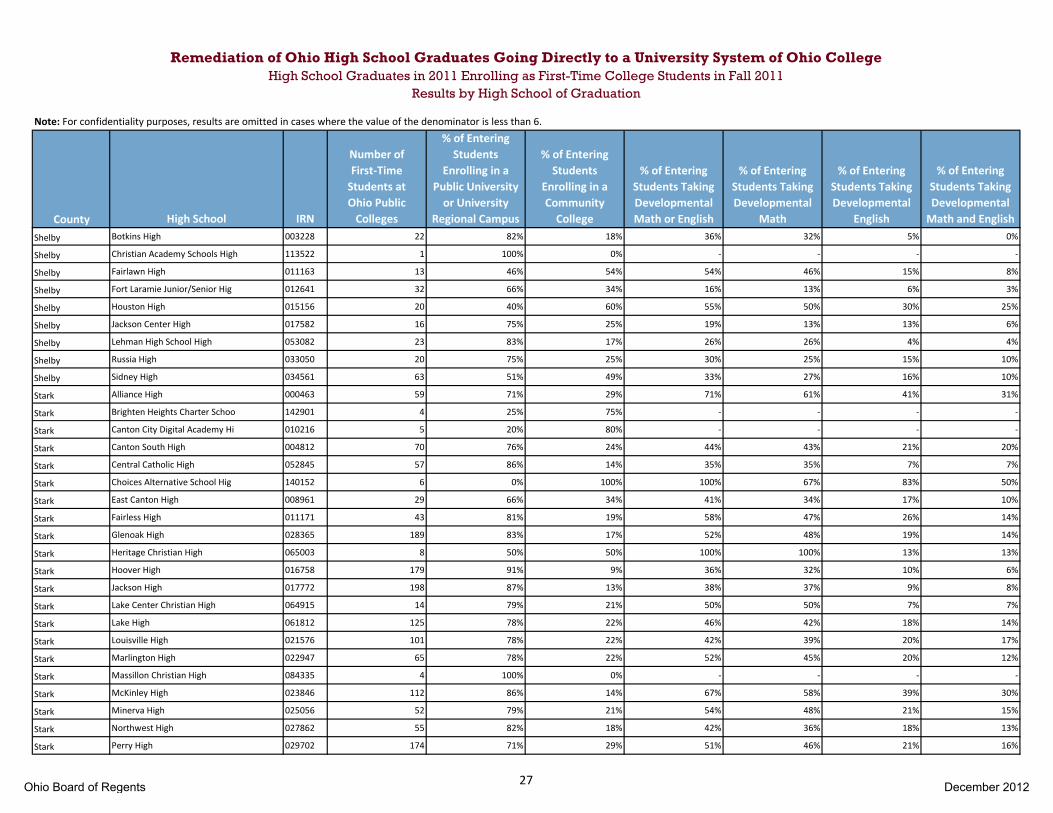
Note: For confidentiality purposes, results are omitted in cases where the value of the denominator is less than 6.
County High School IRN
Number of First‐Time Students at Ohio Public Colleges
% of Entering Students
Enrolling in a Public University or University
Regional Campus
% of Entering Students
Enrolling in a CommunityCollege
% of Entering Students Taking Developmental Math or English
% of Entering Students Taking Developmental
Math
% of Entering Students Taking Developmental
English
% of Entering Students Taking Developmental Math and English
Remediation of Ohio High School Graduates Going Directly to a University System of Ohio CollegeHigh School Graduates in 2011 Enrolling as First-Time College Students in Fall 2011
Results by High School of Graduation
Shelby Botkins High 003228 22 82% 18% 36% 32% 5% 0%
Shelby Christian Academy Schools High 113522 1 100% 0% ‐ ‐ ‐ ‐
Shelby Fairlawn High 011163 13 46% 54% 54% 46% 15% 8%
Shelby Fort Laramie Junior/Senior Hig 012641 32 66% 34% 16% 13% 6% 3%
Shelby Houston High 015156 20 40% 60% 55% 50% 30% 25%
Shelby Jackson Center High 017582 16 75% 25% 19% 13% 13% 6%
Shelby Lehman High School High 053082 23 83% 17% 26% 26% 4% 4%
Shelby Russia High 033050 20 75% 25% 30% 25% 15% 10%
Shelby Sidney High 034561 63 51% 49% 33% 27% 16% 10%
Stark Alliance High 000463 59 71% 29% 71% 61% 41% 31%
Stark Brighten Heights Charter Schoo 142901 4 25% 75% ‐ ‐ ‐ ‐
Stark Canton City Digital Academy Hi 010216 5 20% 80% ‐ ‐ ‐ ‐
Stark Canton South High 004812 70 76% 24% 44% 43% 21% 20%
Stark Central Catholic High 052845 57 86% 14% 35% 35% 7% 7%
Stark Choices Alternative School Hig 140152 6 0% 100% 100% 67% 83% 50%
Stark East Canton High 008961 29 66% 34% 41% 34% 17% 10%
Stark Fairless High 011171 43 81% 19% 58% 47% 26% 14%
Stark Glenoak High 028365 189 83% 17% 52% 48% 19% 14%
Stark Heritage Christian High 065003 8 50% 50% 100% 100% 13% 13%
Stark Hoover High 016758 179 91% 9% 36% 32% 10% 6%
Stark Jackson High 017772 198 87% 13% 38% 37% 9% 8%
Stark Lake Center Christian High 064915 14 79% 21% 50% 50% 7% 7%
Stark Lake High 061812 125 78% 22% 46% 42% 18% 14%
Stark Louisville High 021576 101 78% 22% 42% 39% 20% 17%
Stark Marlington High 022947 65 78% 22% 52% 45% 20% 12%
Stark Massillon Christian High 084335 4 100% 0% ‐ ‐ ‐ ‐
Stark McKinley High 023846 112 86% 14% 67% 58% 39% 30%
Stark Minerva High 025056 52 79% 21% 54% 48% 21% 15%
Stark Northwest High 027862 55 82% 18% 42% 36% 18% 13%
Stark Perry High 029702 174 71% 29% 51% 46% 21% 16%
27Ohio Board of Regents December 2012

Note: For confidentiality purposes, results are omitted in cases where the value of the denominator is less than 6.
County High School IRN
Number of First‐Time Students at Ohio Public Colleges
% of Entering Students
Enrolling in a Public University or University
Regional Campus
% of Entering Students
Enrolling in a CommunityCollege
% of Entering Students Taking Developmental Math or English
% of Entering Students Taking Developmental
Math
% of Entering Students Taking Developmental
English
% of Entering Students Taking Developmental Math and English
Remediation of Ohio High School Graduates Going Directly to a University System of Ohio CollegeHigh School Graduates in 2011 Enrolling as First-Time College Students in Fall 2011
Results by High School of Graduation
Stark Project Rebuild Community High 000525 5 20% 80% ‐ ‐ ‐ ‐
Stark Sandy Valley High 033563 37 73% 27% 59% 57% 24% 22%
Stark St Thomas Aquinas High 053827 41 90% 10% 41% 34% 15% 7%
Stark Timken High 037267 68 60% 40% 63% 47% 47% 31%
Stark Tuslaw High School High 037671 49 69% 31% 57% 51% 31% 24%
Stark Washington High 039602 100 73% 27% 65% 54% 34% 23%
Summit Akron Digital Academy High 149054 12 75% 25% 67% 58% 67% 58%
Summit Akron Early College H.S. High 009145 2 100% 0% ‐ ‐ ‐ ‐
Summit Archbishop Hoban College Prep 052639 102 98% 2% 22% 20% 4% 2%
Summit Barberton High 001545 75 89% 11% 61% 57% 28% 24%
Summit Buchtel High 004077 70 84% 16% 81% 76% 44% 39%
Summit Copley High 007310 123 93% 7% 21% 16% 10% 5%
Summit Coventry High 007286 70 87% 13% 51% 46% 17% 11%
Summit Cuyahoga Falls High 007930 149 93% 7% 58% 56% 13% 11%
Summit Cuyahoga Valley Christian Acad 067611 49 92% 8% 10% 10% 2% 2%
Summit East Community Learning Center 009498 50 66% 34% 84% 76% 48% 40%
Summit Ellet High 010272 66 79% 21% 50% 42% 20% 12%
Summit Firestone High 011692 141 89% 11% 48% 44% 16% 13%
Summit Garfield High 013128 79 81% 19% 63% 56% 38% 30%
Summit Green High 014365 149 89% 11% 28% 26% 9% 7%
Summit Hudson High 017095 242 98% 2% 28% 27% 4% 3%
Summit Kenmore High 018697 34 85% 15% 82% 76% 50% 44%
Summit Lawrence School High 009270 7 100% 0% 86% 57% 29% 0%
Summit Life Skills Ctr Of Akron High 133868 4 75% 25% ‐ ‐ ‐ ‐
Summit Manchester High 022418 53 79% 21% 49% 43% 15% 9%
Summit Mogadore High 025148 28 82% 18% 57% 57% 21% 21%
Summit Nordonia High 027334 203 80% 20% 51% 46% 18% 14%
Summit North High 027565 37 89% 11% 73% 46% 49% 22%
Summit Norton High 027995 84 74% 26% 37% 35% 13% 11%
Summit Our Lady Of The Elms High 053413 17 100% 0% 24% 24% 0% 0%
28Ohio Board of Regents December 2012
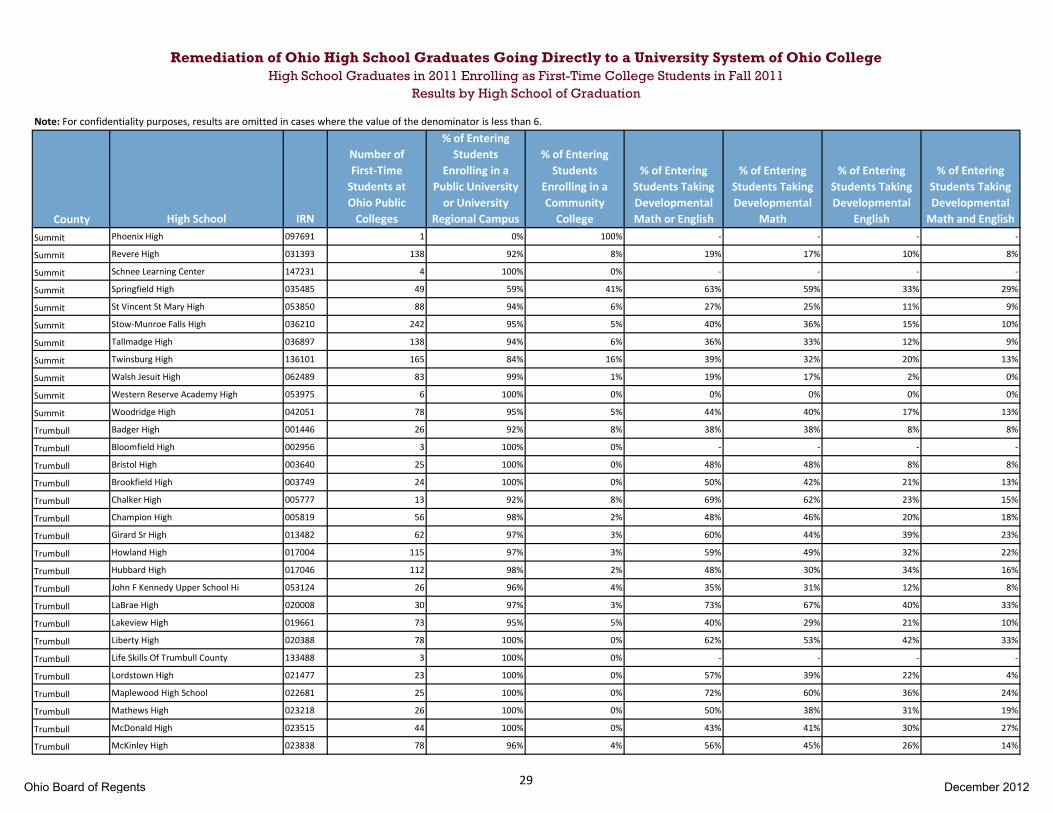
Note: For confidentiality purposes, results are omitted in cases where the value of the denominator is less than 6.
County High School IRN
Number of First‐Time Students at Ohio Public Colleges
% of Entering Students
Enrolling in a Public University or University
Regional Campus
% of Entering Students
Enrolling in a CommunityCollege
% of Entering Students Taking Developmental Math or English
% of Entering Students Taking Developmental
Math
% of Entering Students Taking Developmental
English
% of Entering Students Taking Developmental Math and English
Remediation of Ohio High School Graduates Going Directly to a University System of Ohio CollegeHigh School Graduates in 2011 Enrolling as First-Time College Students in Fall 2011
Results by High School of Graduation
Summit Phoenix High 097691 1 0% 100% ‐ ‐ ‐ ‐
Summit Revere High 031393 138 92% 8% 19% 17% 10% 8%
Summit Schnee Learning Center 147231 4 100% 0% ‐ ‐ ‐ ‐
Summit Springfield High 035485 49 59% 41% 63% 59% 33% 29%
Summit St Vincent St Mary High 053850 88 94% 6% 27% 25% 11% 9%
Summit Stow‐Munroe Falls High 036210 242 95% 5% 40% 36% 15% 10%
Summit Tallmadge High 036897 138 94% 6% 36% 33% 12% 9%
Summit Twinsburg High 136101 165 84% 16% 39% 32% 20% 13%
Summit Walsh Jesuit High 062489 83 99% 1% 19% 17% 2% 0%
Summit Western Reserve Academy High 053975 6 100% 0% 0% 0% 0% 0%
Summit Woodridge High 042051 78 95% 5% 44% 40% 17% 13%
Trumbull Badger High 001446 26 92% 8% 38% 38% 8% 8%
Trumbull Bloomfield High 002956 3 100% 0% ‐ ‐ ‐ ‐
Trumbull Bristol High 003640 25 100% 0% 48% 48% 8% 8%
Trumbull Brookfield High 003749 24 100% 0% 50% 42% 21% 13%
Trumbull Chalker High 005777 13 92% 8% 69% 62% 23% 15%
Trumbull Champion High 005819 56 98% 2% 48% 46% 20% 18%
Trumbull Girard Sr High 013482 62 97% 3% 60% 44% 39% 23%
Trumbull Howland High 017004 115 97% 3% 59% 49% 32% 22%
Trumbull Hubbard High 017046 112 98% 2% 48% 30% 34% 16%
Trumbull John F Kennedy Upper School Hi 053124 26 96% 4% 35% 31% 12% 8%
Trumbull LaBrae High 020008 30 97% 3% 73% 67% 40% 33%
Trumbull Lakeview High 019661 73 95% 5% 40% 29% 21% 10%
Trumbull Liberty High 020388 78 100% 0% 62% 53% 42% 33%
Trumbull Life Skills Of Trumbull County 133488 3 100% 0% ‐ ‐ ‐ ‐
Trumbull Lordstown High 021477 23 100% 0% 57% 39% 22% 4%
Trumbull Maplewood High School 022681 25 100% 0% 72% 60% 36% 24%
Trumbull Mathews High 023218 26 100% 0% 50% 38% 31% 19%
Trumbull McDonald High 023515 44 100% 0% 43% 41% 30% 27%
Trumbull McKinley High 023838 78 96% 4% 56% 45% 26% 14%
29Ohio Board of Regents December 2012
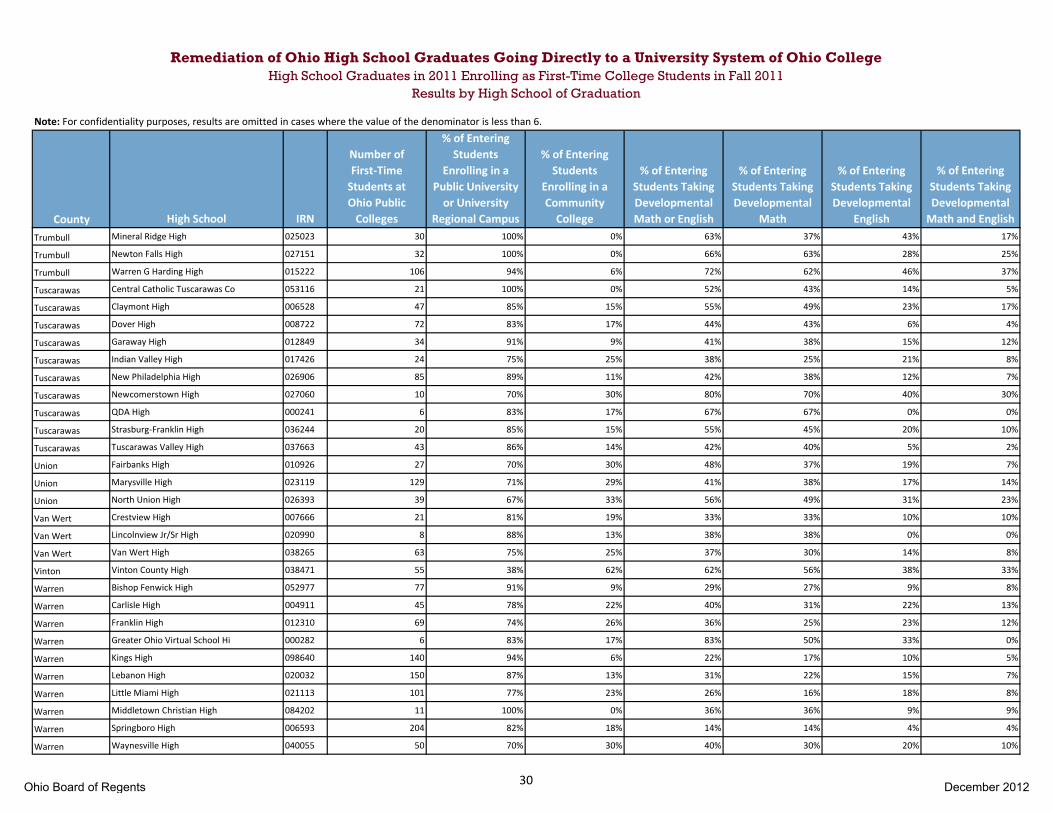
Note: For confidentiality purposes, results are omitted in cases where the value of the denominator is less than 6.
County High School IRN
Number of First‐Time Students at Ohio Public Colleges
% of Entering Students
Enrolling in a Public University or University
Regional Campus
% of Entering Students
Enrolling in a CommunityCollege
% of Entering Students Taking Developmental Math or English
% of Entering Students Taking Developmental
Math
% of Entering Students Taking Developmental
English
% of Entering Students Taking Developmental Math and English
Remediation of Ohio High School Graduates Going Directly to a University System of Ohio CollegeHigh School Graduates in 2011 Enrolling as First-Time College Students in Fall 2011
Results by High School of Graduation
Trumbull Mineral Ridge High 025023 30 100% 0% 63% 37% 43% 17%
Trumbull Newton Falls High 027151 32 100% 0% 66% 63% 28% 25%
Trumbull Warren G Harding High 015222 106 94% 6% 72% 62% 46% 37%
Tuscarawas Central Catholic Tuscarawas Co 053116 21 100% 0% 52% 43% 14% 5%
Tuscarawas Claymont High 006528 47 85% 15% 55% 49% 23% 17%
Tuscarawas Dover High 008722 72 83% 17% 44% 43% 6% 4%
Tuscarawas Garaway High 012849 34 91% 9% 41% 38% 15% 12%
Tuscarawas Indian Valley High 017426 24 75% 25% 38% 25% 21% 8%
Tuscarawas New Philadelphia High 026906 85 89% 11% 42% 38% 12% 7%
Tuscarawas Newcomerstown High 027060 10 70% 30% 80% 70% 40% 30%
Tuscarawas QDA High 000241 6 83% 17% 67% 67% 0% 0%
Tuscarawas Strasburg‐Franklin High 036244 20 85% 15% 55% 45% 20% 10%
Tuscarawas Tuscarawas Valley High 037663 43 86% 14% 42% 40% 5% 2%
Union Fairbanks High 010926 27 70% 30% 48% 37% 19% 7%
Union Marysville High 023119 129 71% 29% 41% 38% 17% 14%
Union North Union High 026393 39 67% 33% 56% 49% 31% 23%
Van Wert Crestview High 007666 21 81% 19% 33% 33% 10% 10%
Van Wert Lincolnview Jr/Sr High 020990 8 88% 13% 38% 38% 0% 0%
Van Wert Van Wert High 038265 63 75% 25% 37% 30% 14% 8%
Vinton Vinton County High 038471 55 38% 62% 62% 56% 38% 33%
Warren Bishop Fenwick High 052977 77 91% 9% 29% 27% 9% 8%
Warren Carlisle High 004911 45 78% 22% 40% 31% 22% 13%
Warren Franklin High 012310 69 74% 26% 36% 25% 23% 12%
Warren Greater Ohio Virtual School Hi 000282 6 83% 17% 83% 50% 33% 0%
Warren Kings High 098640 140 94% 6% 22% 17% 10% 5%
Warren Lebanon High 020032 150 87% 13% 31% 22% 15% 7%
Warren Little Miami High 021113 101 77% 23% 26% 16% 18% 8%
Warren Middletown Christian High 084202 11 100% 0% 36% 36% 9% 9%
Warren Springboro High 006593 204 82% 18% 14% 14% 4% 4%
Warren Waynesville High 040055 50 70% 30% 40% 30% 20% 10%
30Ohio Board of Regents December 2012
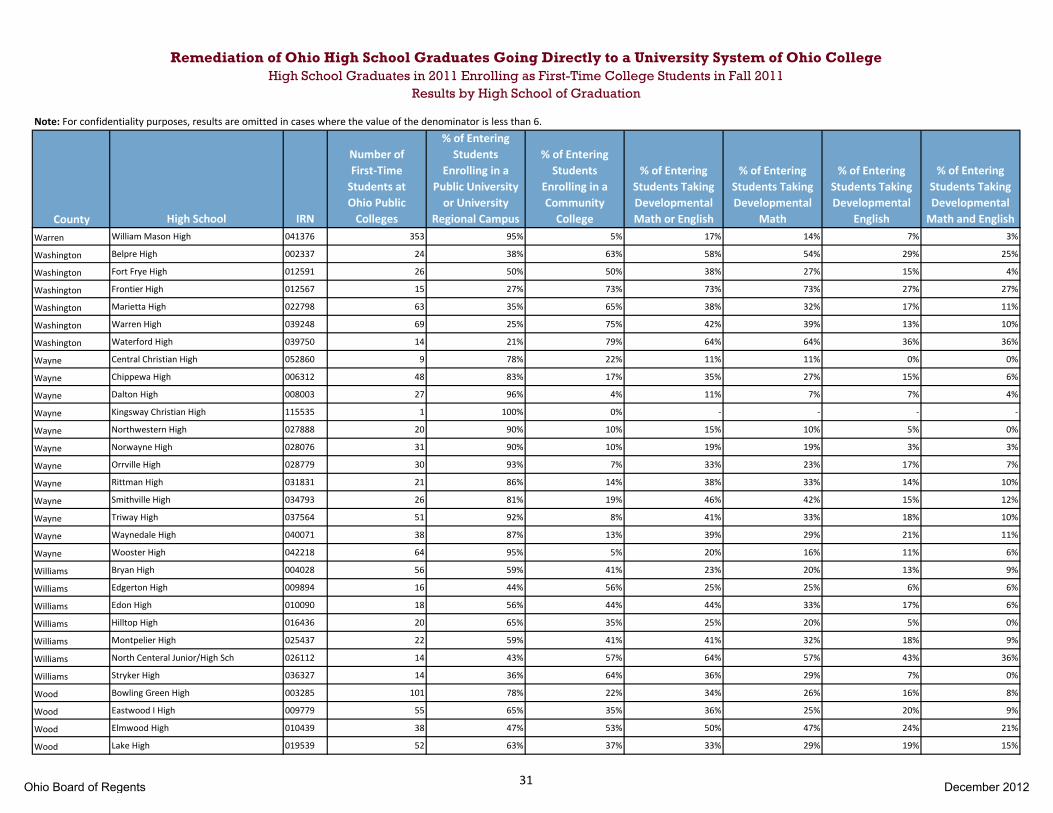
Note: For confidentiality purposes, results are omitted in cases where the value of the denominator is less than 6.
County High School IRN
Number of First‐Time Students at Ohio Public Colleges
% of Entering Students
Enrolling in a Public University or University
Regional Campus
% of Entering Students
Enrolling in a CommunityCollege
% of Entering Students Taking Developmental Math or English
% of Entering Students Taking Developmental
Math
% of Entering Students Taking Developmental
English
% of Entering Students Taking Developmental Math and English
Remediation of Ohio High School Graduates Going Directly to a University System of Ohio CollegeHigh School Graduates in 2011 Enrolling as First-Time College Students in Fall 2011
Results by High School of Graduation
Warren William Mason High 041376 353 95% 5% 17% 14% 7% 3%
Washington Belpre High 002337 24 38% 63% 58% 54% 29% 25%
Washington Fort Frye High 012591 26 50% 50% 38% 27% 15% 4%
Washington Frontier High 012567 15 27% 73% 73% 73% 27% 27%
Washington Marietta High 022798 63 35% 65% 38% 32% 17% 11%
Washington Warren High 039248 69 25% 75% 42% 39% 13% 10%
Washington Waterford High 039750 14 21% 79% 64% 64% 36% 36%
Wayne Central Christian High 052860 9 78% 22% 11% 11% 0% 0%
Wayne Chippewa High 006312 48 83% 17% 35% 27% 15% 6%
Wayne Dalton High 008003 27 96% 4% 11% 7% 7% 4%
Wayne Kingsway Christian High 115535 1 100% 0% ‐ ‐ ‐ ‐
Wayne Northwestern High 027888 20 90% 10% 15% 10% 5% 0%
Wayne Norwayne High 028076 31 90% 10% 19% 19% 3% 3%
Wayne Orrville High 028779 30 93% 7% 33% 23% 17% 7%
Wayne Rittman High 031831 21 86% 14% 38% 33% 14% 10%
Wayne Smithville High 034793 26 81% 19% 46% 42% 15% 12%
Wayne Triway High 037564 51 92% 8% 41% 33% 18% 10%
Wayne Waynedale High 040071 38 87% 13% 39% 29% 21% 11%
Wayne Wooster High 042218 64 95% 5% 20% 16% 11% 6%
Williams Bryan High 004028 56 59% 41% 23% 20% 13% 9%
Williams Edgerton High 009894 16 44% 56% 25% 25% 6% 6%
Williams Edon High 010090 18 56% 44% 44% 33% 17% 6%
Williams Hilltop High 016436 20 65% 35% 25% 20% 5% 0%
Williams Montpelier High 025437 22 59% 41% 41% 32% 18% 9%
Williams North Centeral Junior/High Sch 026112 14 43% 57% 64% 57% 43% 36%
Williams Stryker High 036327 14 36% 64% 36% 29% 7% 0%
Wood Bowling Green High 003285 101 78% 22% 34% 26% 16% 8%
Wood Eastwood I High 009779 55 65% 35% 36% 25% 20% 9%
Wood Elmwood High 010439 38 47% 53% 50% 47% 24% 21%
Wood Lake High 019539 52 63% 37% 33% 29% 19% 15%
31Ohio Board of Regents December 2012

Note: For confidentiality purposes, results are omitted in cases where the value of the denominator is less than 6.
County High School IRN
Number of First‐Time Students at Ohio Public Colleges
% of Entering Students
Enrolling in a Public University or University
Regional Campus
% of Entering Students
Enrolling in a CommunityCollege
% of Entering Students Taking Developmental Math or English
% of Entering Students Taking Developmental
Math
% of Entering Students Taking Developmental
English
% of Entering Students Taking Developmental Math and English
Remediation of Ohio High School Graduates Going Directly to a University System of Ohio CollegeHigh School Graduates in 2011 Enrolling as First-Time College Students in Fall 2011
Results by High School of Graduation
Wood North Baltimore High 026070 13 85% 15% 15% 15% 8% 8%
Wood Northwood High 027961 35 51% 49% 37% 37% 14% 14%
Wood Otsego High School 028860 43 67% 33% 30% 28% 16% 14%
Wood Perrysburg High 029744 193 80% 20% 24% 16% 14% 6%
Wood Rossford High 032763 53 62% 38% 25% 21% 17% 13%
Wyandot Carey High 004887 24 67% 33% 25% 17% 8% 0%
Wyandot Mohawk High 025155 15 40% 60% 53% 47% 20% 13%
Wyandot Upper Sandusky High 037952 48 58% 42% 35% 33% 17% 15%
32Ohio Board of Regents December 2012