fall 2017 enrollment fact book - stony brook · pdf filefact book (2017-18) note: 2017 data...
TRANSCRIPT
Fact Book(2017-18)
Note: 2017 data are preliminary until reported to IPEDS in spring 2018
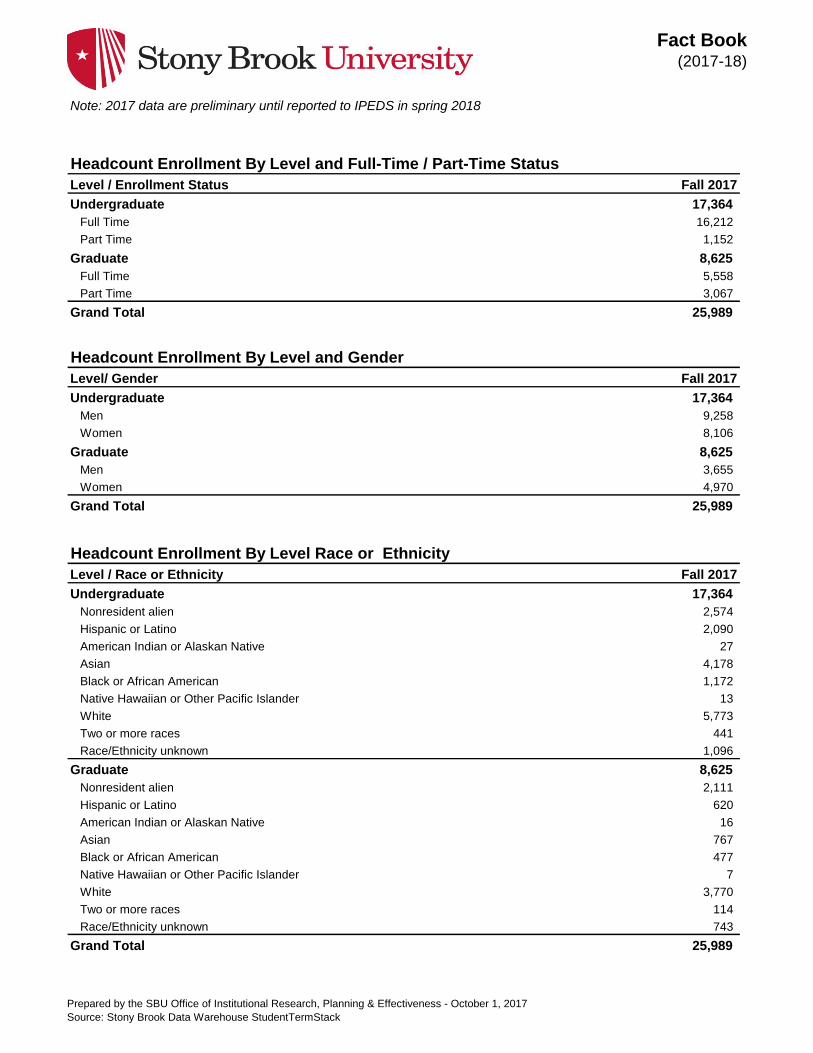
Headcount Enrollment By Level and Full-Time / Part-Time Status
Level / Enrollment Status Fall 2017
Undergraduate 17,364
Full Time 16,212
Part Time 1,152
Graduate 8,625
Full Time 5,558
Part Time 3,067
Grand Total 25,989
Headcount Enrollment By Level and Gender
Level/ Gender Fall 2017
Undergraduate 17,364
Men 9,258
Women 8,106
Graduate 8,625
Men 3,655
Women 4,970
Grand Total 25,989
Headcount Enrollment By Level Race or Ethnicity
Level / Race or Ethnicity Fall 2017
Undergraduate 17,364
Nonresident alien 2,574
Hispanic or Latino 2,090
American Indian or Alaskan Native 27
Asian 4,178
Black or African American 1,172
Native Hawaiian or Other Pacific Islander 13
White 5,773
Two or more races 441
Race/Ethnicity unknown 1,096
Graduate 8,625
Nonresident alien 2,111
Hispanic or Latino 620
American Indian or Alaskan Native 16
Asian 767
Black or African American 477
Native Hawaiian or Other Pacific Islander 7
White 3,770
Two or more races 114
Race/Ethnicity unknown 743
Grand Total 25,989
Prepared by the SBU Office of Institutional Research, Planning & Effectiveness - October 1, 2017
Source: Stony Brook Data Warehouse StudentTermStack

Fact Book(2017-18)
Note: 2017 data are preliminary until reported to IPEDS in spring 2018
Headcount Enrollment By Level, Academic Level Group and Full-Time/Part-Time Status
Note: "Professional" includes both new and continuing professional (MD, DDS) students.
Level / Enrollment Status Fall 2017
Undergraduate 17,364
New Freshman 3,167
Full Time 3,160
Part Time 7
New Transfer 1,511
Full Time 1,403
Part Time 108
Continuing Ugrad 12,686
Full Time 11,649
Part Time 1,037
Graduate 8,625
New Grad 2,123
Full Time 1,608
Part Time 515
Continuing Grad 5,791
Full Time 3,239
Part Time 2,552
Professional 711
Full Time 711
Grand Total 25,989
Prepared by the SBU Office of Institutional Research, Planning & Effectiveness - October 1, 2017
Source: Stony Brook Data Warehouse StudentTermStack

Fact Book(2017-18)
Note: 2017 data are preliminary until reported to IPEDS in spring 2018.
Campus / Location Fall 2017
West Campus 21,631
Graduate School 3,862
School of Professional Development 1,504
Undergraduate 16,265
Health Sciences Center 4,004
Graduate School 201
Health Professional Grads 2,704
Undergraduate 1,099
Southampton Location 354
Graduate School 114
Health Professional Grads 240
SH Graduate
Undergraduate
Grand Total 25,989
Stony Brook University Headcount Enrollment By Campus and Enrollment Category
Prepared by the SBU Office of Institutional Research, Planning & Effectiveness - October 1, 2017
Source: Stony Brook Data Warehouse StudentTermStack
Fact Book(2017-18)
Note: 2017 data are preliminary until reported to IPEDS in spring 2018
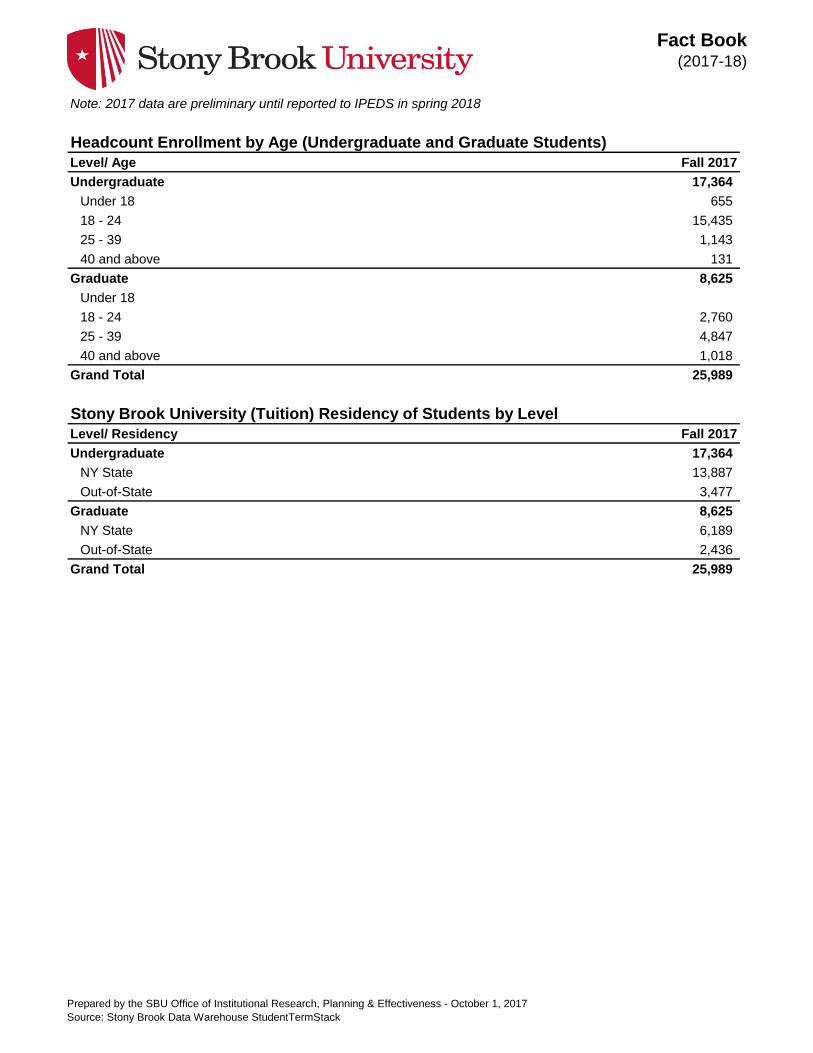
Headcount Enrollment by Age (Undergraduate and Graduate Students)
Level/ Age Fall 2017
Undergraduate 17,364
Under 18 655
18 - 24 15,435
25 - 39 1,143
40 and above 131
Graduate 8,625
Under 18
18 - 24 2,760
25 - 39 4,847
40 and above 1,018
Grand Total 25,989
Stony Brook University (Tuition) Residency of Students by Level
Level/ Residency Fall 2017
Undergraduate 17,364
NY State 13,887
Out-of-State 3,477
Graduate 8,625
NY State 6,189
Out-of-State 2,436
Grand Total 25,989
Prepared by the SBU Office of Institutional Research, Planning & Effectiveness - October 1, 2017
Source: Stony Brook Data Warehouse StudentTermStack

Fact Book(2017-18)
Note: 2017 data are preliminary until reported to IPEDS in spring 2018
Level - Resident/Commuter Fall 2017
Undergraduate 17,364
Commuter Students 8,192
Campus Residents 9,172
Graduate 8,625
Commuter Students 7,479
Campus Residents 1,146
Grand Total 25,989
Level Fall 2017
First time/full time freshmen 3,160
Commuter Students 541
Campus Residents 2,619
Stony Brook University First time/Full time Freshmen Resident and Commuter Students
Stony Brook University Resident and Commuter Students
Prepared by the SBU Office of Institutional Research, Planning & Effectiveness - October 1, 2017
Source: Stony Brook Data Warehouse StudentTermStack

Fact Book(2017-18)
Note: 2017 data are preliminary until reported to IPEDS in spring 2018.
Stony Brook University Freshmen Headcount Enrollment by Gender & Ethnicity
Gender/Ethnicity Fall 2017
Men 1,695
Nonresident alien 257
Hispanic or Latino 175
American Indian or Alaskan Native 2
Asian 508
Black or African American 98
Native Hawaiian or Other Pacific Islander
White 502
Two or more races 36
Race and Ethnicity unknown 117
Women 1,472
Nonresident alien 180
Hispanic or Latino 175
American Indian or Alaskan Native 2
Asian 441
Black or African American 129
Native Hawaiian or Other Pacific Islander
White 388
Two or more races 50
Race and Ethnicity unknown 107
Grand Total 3,167
Prepared by the SBU Office of Institutional Research, Planning & Effectiveness - October 1, 2017
Source: Stony Brook Data Warehouse StudentTermStack

Fact Book(2017-18)
Note: 2017 data are preliminary until reported to IPEDS in spring 2018.
Stony Brook University Transfer Headcount Enrollment by Gender & Ethnicity
Gender/Ethnicity Fall 2017
Men 624
Nonresident alien 66
Hispanic or Latino 103
American Indian or Alaskan Native 2
Asian 76
Black or African American 49
Native Hawaiian or Other Pacific Islander
White 277
Two or more races 21
Race and Ethnicity unknown 30
Women 887
Nonresident alien 58
Hispanic or Latino 146
American Indian or Alaskan Native 3
Asian 100
Black or African American 82
Native Hawaiian or Other Pacific Islander 2
White 424
Two or more races 28
Race and Ethnicity unknown 44
Grand Total 1,511
Prepared by the SBU Office of Institutional Research, Planning & Effectiveness - October 1, 2017
Source: Stony Brook Data Warehouse StudentTermStack
Fact Book(2017-18)
Note: 2017 data are preliminary until reported to IPEDS in spring 2018.
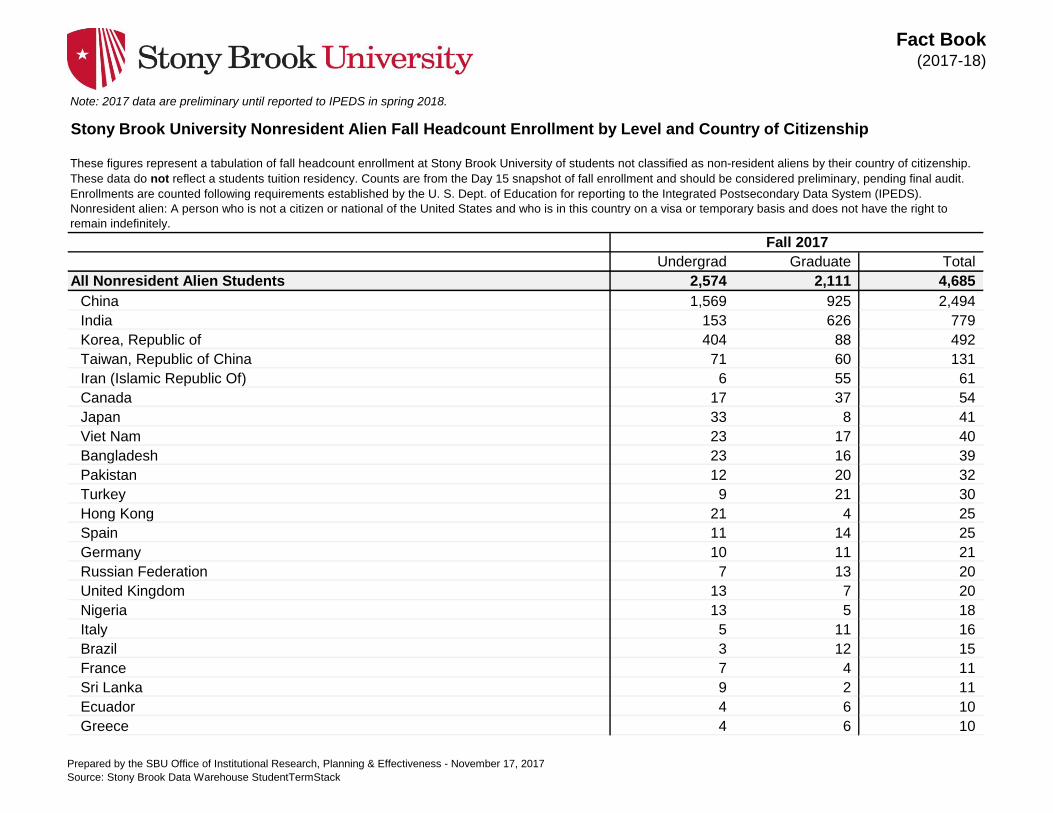
Undergrad Graduate Total
All Nonresident Alien Students 2,574 2,111 4,685
China 1,569 925 2,494
India 153 626 779
Korea, Republic of 404 88 492
Taiwan, Republic of China 71 60 131
Iran (Islamic Republic Of) 6 55 61
Canada 17 37 54
Japan 33 8 41
Viet Nam 23 17 40
Bangladesh 23 16 39
Pakistan 12 20 32
Turkey 9 21 30
Hong Kong 21 4 25
Spain 11 14 25
Germany 10 11 21
Russian Federation 7 13 20
United Kingdom 13 7 20
Nigeria 13 5 18
Italy 5 11 16
Brazil 3 12 15
France 7 4 11
Sri Lanka 9 2 11
Ecuador 4 6 10
Greece 4 6 10
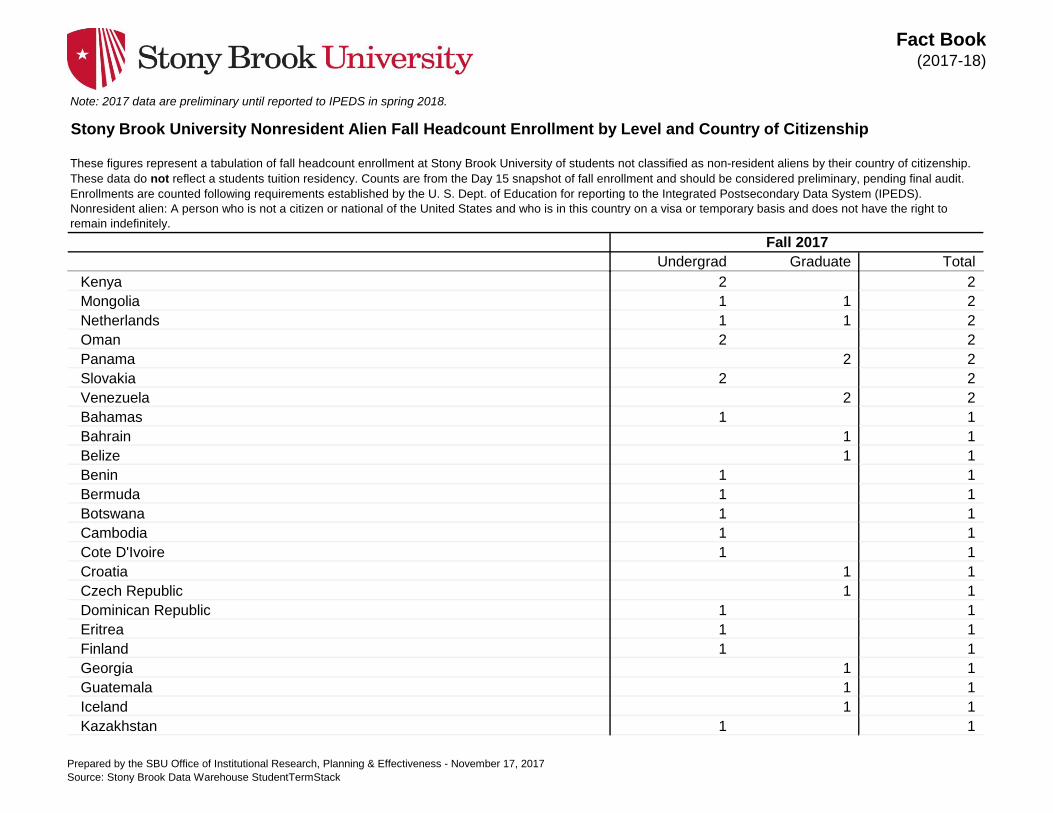
These figures represent a tabulation of fall headcount enrollment at Stony Brook University of students not classified as non-resident aliens by their country of citizenship.
These data do not reflect a students tuition residency. Counts are from the Day 15 snapshot of fall enrollment and should be considered preliminary, pending final audit.
Enrollments are counted following requirements established by the U. S. Dept. of Education for reporting to the Integrated Postsecondary Data System (IPEDS).
Nonresident alien: A person who is not a citizen or national of the United States and who is in this country on a visa or temporary basis and does not have the right to
remain indefinitely.
Fall 2017
Stony Brook University Nonresident Alien Fall Headcount Enrollment by Level and Country of Citizenship
Prepared by the SBU Office of Institutional Research, Planning & Effectiveness - November 17, 2017
Source: Stony Brook Data Warehouse StudentTermStack
Fact Book(2017-18)
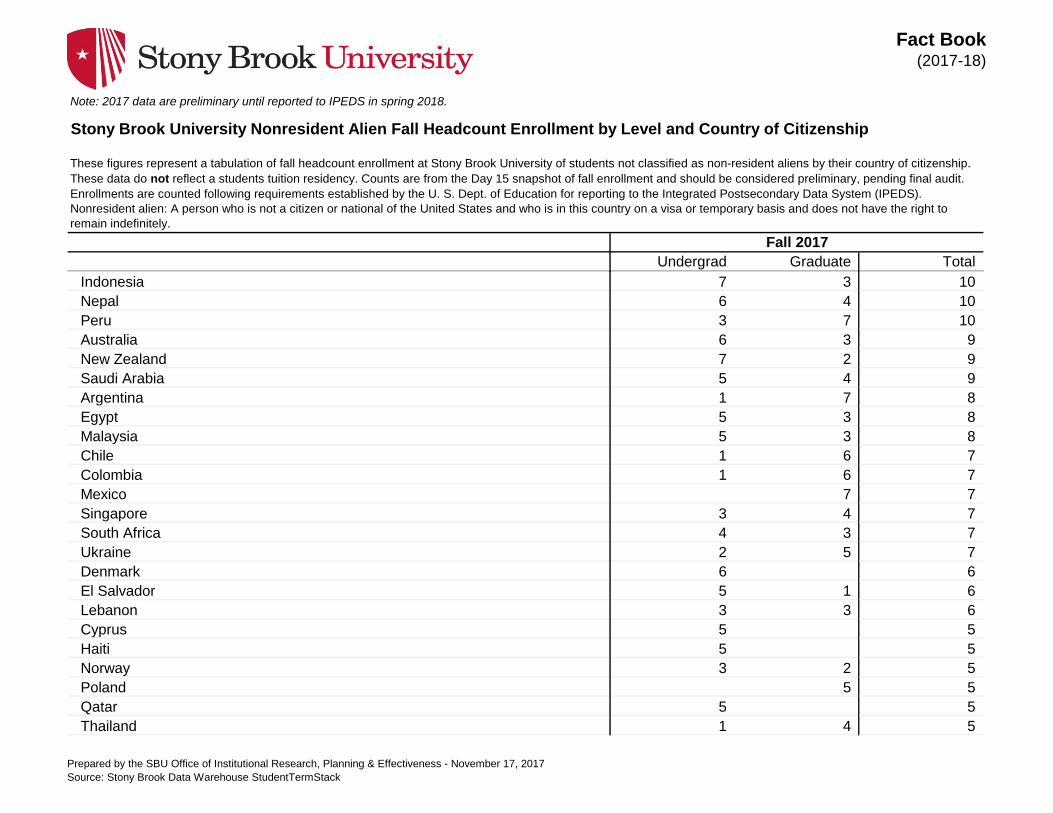
Note: 2017 data are preliminary until reported to IPEDS in spring 2018.
Undergrad Graduate Total
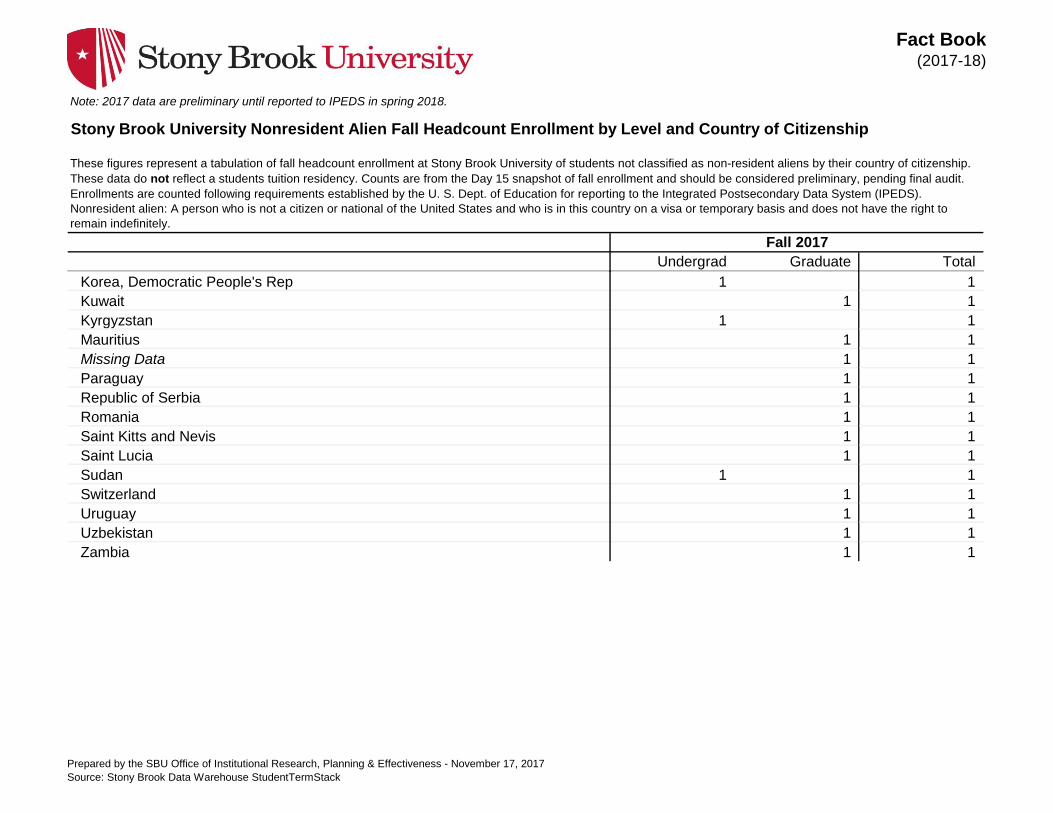
These figures represent a tabulation of fall headcount enrollment at Stony Brook University of students not classified as non-resident aliens by their country of citizenship.
These data do not reflect a students tuition residency. Counts are from the Day 15 snapshot of fall enrollment and should be considered preliminary, pending final audit.
Enrollments are counted following requirements established by the U. S. Dept. of Education for reporting to the Integrated Postsecondary Data System (IPEDS).
Nonresident alien: A person who is not a citizen or national of the United States and who is in this country on a visa or temporary basis and does not have the right to
remain indefinitely.
Fall 2017
Stony Brook University Nonresident Alien Fall Headcount Enrollment by Level and Country of Citizenship
Indonesia 7 3 10
Nepal 6 4 10
Peru 3 7 10
Australia 6 3 9
New Zealand 7 2 9
Saudi Arabia 5 4 9
Argentina 1 7 8
Egypt 5 3 8
Malaysia 5 3 8
Chile 1 6 7
Colombia 1 6 7
Mexico 7 7
Singapore 3 4 7
South Africa 4 3 7
Ukraine 2 5 7
Denmark 6 6
El Salvador 5 1 6
Lebanon 3 3 6
Cyprus 5 5
Haiti 5 5
Norway 3 2 5
Poland 5 5
Qatar 5 5
Thailand 1 4 5
Prepared by the SBU Office of Institutional Research, Planning & Effectiveness - November 17, 2017
Source: Stony Brook Data Warehouse StudentTermStack

Fact Book(2017-18)
Note: 2017 data are preliminary until reported to IPEDS in spring 2018.
Undergrad Graduate Total
These figures represent a tabulation of fall headcount enrollment at Stony Brook University of students not classified as non-resident aliens by their country of citizenship.
These data do not reflect a students tuition residency. Counts are from the Day 15 snapshot of fall enrollment and should be considered preliminary, pending final audit.
Enrollments are counted following requirements established by the U. S. Dept. of Education for reporting to the Integrated Postsecondary Data System (IPEDS).
Nonresident alien: A person who is not a citizen or national of the United States and who is in this country on a visa or temporary basis and does not have the right to
remain indefinitely.
Fall 2017
Stony Brook University Nonresident Alien Fall Headcount Enrollment by Level and Country of Citizenship
Trinidad and Tobago 3 2 5
Guyana 4 4
Honduras 2 2 4
Israel 2 2 4
Jamaica 2 2 4
Jordan 1 3 4
Myanmar 3 1 4
Portugal 1 3 4
Albania 3 3
Azerbaijan 2 1 3
Bulgaria 3 3
Costa Rica 1 2 3
Ireland 1 2 3
Morocco 3 3
Philippines 2 1 3
Sweden 1 2 3
Armenia 2 2
Austria 1 1 2
Belarus 1 1 2
Belgium 2 2
Bolivia 1 1 2
Ethiopia 2 2
Fmr Yugoslav Rep of Macedonia 1 1 2
Hungary 1 1 2
Prepared by the SBU Office of Institutional Research, Planning & Effectiveness - November 17, 2017
Source: Stony Brook Data Warehouse StudentTermStack
Fact Book(2017-18)
Note: 2017 data are preliminary until reported to IPEDS in spring 2018.
Undergrad Graduate Total
These figures represent a tabulation of fall headcount enrollment at Stony Brook University of students not classified as non-resident aliens by their country of citizenship.
These data do not reflect a students tuition residency. Counts are from the Day 15 snapshot of fall enrollment and should be considered preliminary, pending final audit.
Enrollments are counted following requirements established by the U. S. Dept. of Education for reporting to the Integrated Postsecondary Data System (IPEDS).
Nonresident alien: A person who is not a citizen or national of the United States and who is in this country on a visa or temporary basis and does not have the right to
remain indefinitely.
Fall 2017
Stony Brook University Nonresident Alien Fall Headcount Enrollment by Level and Country of Citizenship
Kenya 2 2
Mongolia 1 1 2
Netherlands 1 1 2
Oman 2 2
Panama 2 2
Slovakia 2 2
Venezuela 2 2
Bahamas 1 1
Bahrain 1 1
Belize 1 1
Benin 1 1
Bermuda 1 1
Botswana 1 1
Cambodia 1 1
Cote D'Ivoire 1 1
Croatia 1 1
Czech Republic 1 1
Dominican Republic 1 1
Eritrea 1 1
Finland 1 1
Georgia 1 1
Guatemala 1 1
Iceland 1 1
Kazakhstan 1 1
Prepared by the SBU Office of Institutional Research, Planning & Effectiveness - November 17, 2017
Source: Stony Brook Data Warehouse StudentTermStack
Fact Book(2017-18)
Note: 2017 data are preliminary until reported to IPEDS in spring 2018.
Undergrad Graduate Total
These figures represent a tabulation of fall headcount enrollment at Stony Brook University of students not classified as non-resident aliens by their country of citizenship.
These data do not reflect a students tuition residency. Counts are from the Day 15 snapshot of fall enrollment and should be considered preliminary, pending final audit.
Enrollments are counted following requirements established by the U. S. Dept. of Education for reporting to the Integrated Postsecondary Data System (IPEDS).
Nonresident alien: A person who is not a citizen or national of the United States and who is in this country on a visa or temporary basis and does not have the right to
remain indefinitely.
Fall 2017
Stony Brook University Nonresident Alien Fall Headcount Enrollment by Level and Country of Citizenship
Korea, Democratic People's Rep 1 1
Kuwait 1 1
Kyrgyzstan 1 1
Mauritius 1 1
Missing Data 1 1
Paraguay 1 1
Republic of Serbia 1 1
Romania 1 1
Saint Kitts and Nevis 1 1
Saint Lucia 1 1
Sudan 1 1
Switzerland 1 1
Uruguay 1 1
Uzbekistan 1 1
Zambia 1 1
Prepared by the SBU Office of Institutional Research, Planning & Effectiveness - November 17, 2017
Source: Stony Brook Data Warehouse StudentTermStack
Fact Book(2017-18)
Note: 2017 data are preliminary until reported to IPEDS in spring 2018.
Undergrad Graduate Total
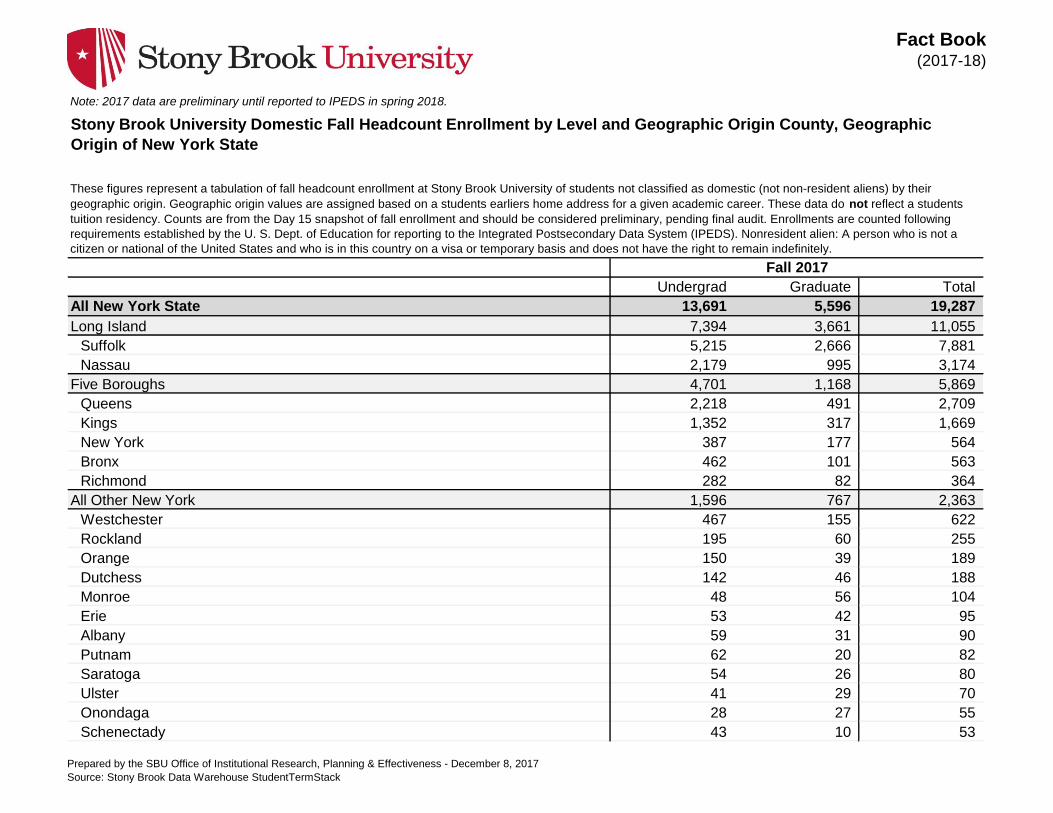
All New York State 13,691 5,596 19,287
Long Island 7,394 3,661 11,055
Suffolk 5,215 2,666 7,881
Nassau 2,179 995 3,174
Five Boroughs 4,701 1,168 5,869
Queens 2,218 491 2,709
Kings 1,352 317 1,669
New York 387 177 564
Bronx 462 101 563
Richmond 282 82 364
All Other New York 1,596 767 2,363
Westchester 467 155 622
Rockland 195 60 255
Orange 150 39 189
Dutchess 142 46 188
Monroe 48 56 104
Erie 53 42 95
Albany 59 31 90
Putnam 62 20 82
Saratoga 54 26 80
Ulster 41 29 70
Onondaga 28 27 55
Schenectady 43 10 53
Stony Brook University Domestic Fall Headcount Enrollment by Level and Geographic Origin County, Geographic
Origin of New York State
These figures represent a tabulation of fall headcount enrollment at Stony Brook University of students not classified as domestic (not non-resident aliens) by their
geographic origin. Geographic origin values are assigned based on a students earliers home address for a given academic career. These data do not reflect a students
tuition residency. Counts are from the Day 15 snapshot of fall enrollment and should be considered preliminary, pending final audit. Enrollments are counted following
requirements established by the U. S. Dept. of Education for reporting to the Integrated Postsecondary Data System (IPEDS). Nonresident alien: A person who is not a
citizen or national of the United States and who is in this country on a visa or temporary basis and does not have the right to remain indefinitely.
Fall 2017
Prepared by the SBU Office of Institutional Research, Planning & Effectiveness - December 8, 2017
Source: Stony Brook Data Warehouse StudentTermStack
Fact Book(2017-18)
Note: 2017 data are preliminary until reported to IPEDS in spring 2018.
Undergrad Graduate Total
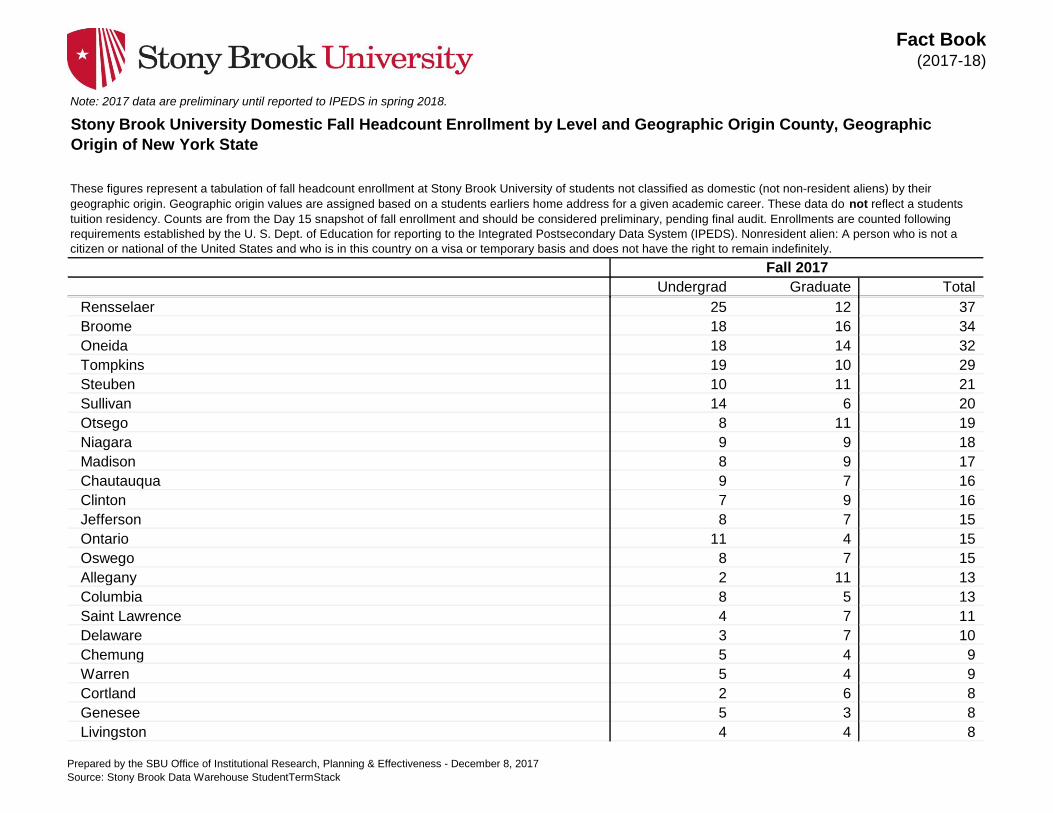
Stony Brook University Domestic Fall Headcount Enrollment by Level and Geographic Origin County, Geographic
Origin of New York State
These figures represent a tabulation of fall headcount enrollment at Stony Brook University of students not classified as domestic (not non-resident aliens) by their
geographic origin. Geographic origin values are assigned based on a students earliers home address for a given academic career. These data do not reflect a students
tuition residency. Counts are from the Day 15 snapshot of fall enrollment and should be considered preliminary, pending final audit. Enrollments are counted following
requirements established by the U. S. Dept. of Education for reporting to the Integrated Postsecondary Data System (IPEDS). Nonresident alien: A person who is not a
citizen or national of the United States and who is in this country on a visa or temporary basis and does not have the right to remain indefinitely.
Fall 2017
Rensselaer 25 12 37
Broome 18 16 34
Oneida 18 14 32
Tompkins 19 10 29
Steuben 10 11 21
Sullivan 14 6 20
Otsego 8 11 19
Niagara 9 9 18
Madison 8 9 17
Chautauqua 9 7 16
Clinton 7 9 16
Jefferson 8 7 15
Ontario 11 4 15
Oswego 8 7 15
Allegany 2 11 13
Columbia 8 5 13
Saint Lawrence 4 7 11
Delaware 3 7 10
Chemung 5 4 9
Warren 5 4 9
Cortland 2 6 8
Genesee 5 3 8
Livingston 4 4 8
Prepared by the SBU Office of Institutional Research, Planning & Effectiveness - December 8, 2017
Source: Stony Brook Data Warehouse StudentTermStack

Fact Book(2017-18)
Note: 2017 data are preliminary until reported to IPEDS in spring 2018.
Undergrad Graduate Total
Stony Brook University Domestic Fall Headcount Enrollment by Level and Geographic Origin County, Geographic
Origin of New York State
These figures represent a tabulation of fall headcount enrollment at Stony Brook University of students not classified as domestic (not non-resident aliens) by their
geographic origin. Geographic origin values are assigned based on a students earliers home address for a given academic career. These data do not reflect a students
tuition residency. Counts are from the Day 15 snapshot of fall enrollment and should be considered preliminary, pending final audit. Enrollments are counted following
requirements established by the U. S. Dept. of Education for reporting to the Integrated Postsecondary Data System (IPEDS). Nonresident alien: A person who is not a
citizen or national of the United States and who is in this country on a visa or temporary basis and does not have the right to remain indefinitely.
Fall 2017
Washington 3 5 8
Cattaraugus 3 4 7
Schoharie 2 5 7
Tioga 3 3 6
Wayne 3 3 6
Cayuga 4 1 5
Chenango 1 4 5
Franklin 4 1 5
Fulton 4 1 5
Greene 2 3 5
Seneca 2 3 5
Montgomery 2 2 4
Orleans 1 3 4
Essex 3 3
Herkimer 2 1 3
Wyoming 1 2 3
Hamilton 1 1 2
Schuyler 2 2
Yates 1 1 2
Prepared by the SBU Office of Institutional Research, Planning & Effectiveness - December 8, 2017
Source: Stony Brook Data Warehouse StudentTermStack
Fact Book(2017-18)
Note: 2017 data are preliminary until reported to IPEDS in spring 2018.
Undergrad Graduate Total
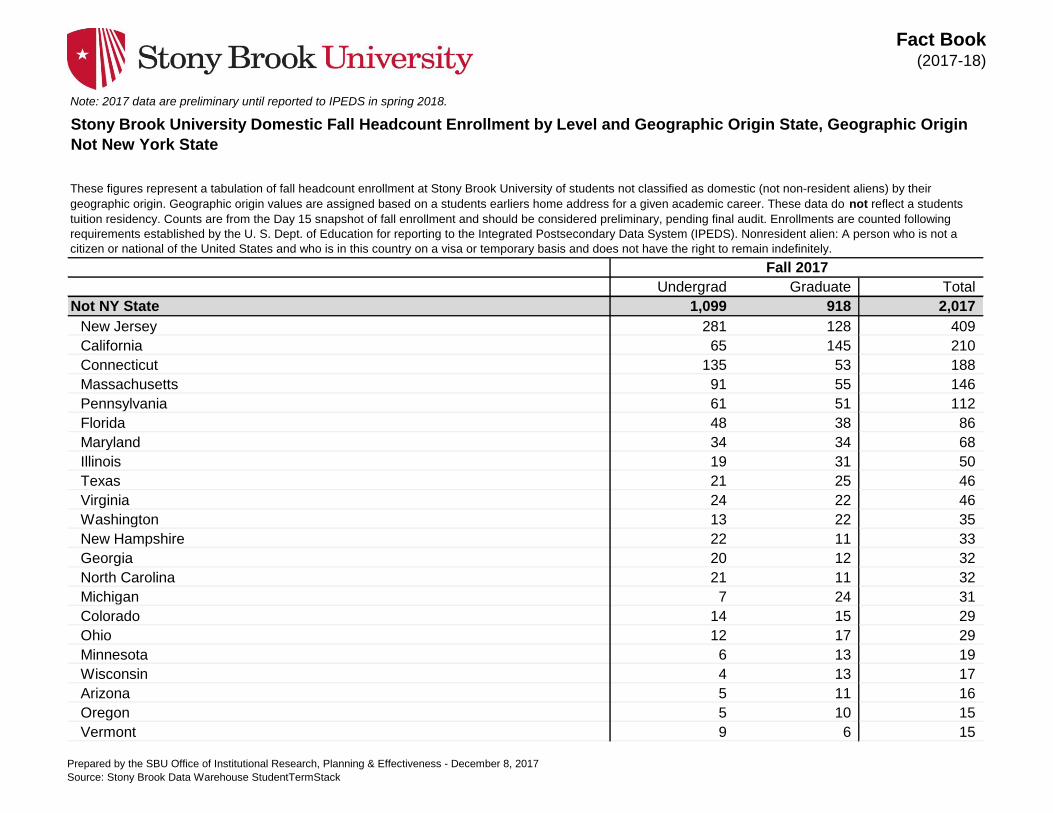
Not NY State 1,099 918 2,017
New Jersey 281 128 409
California 65 145 210
Connecticut 135 53 188
Massachusetts 91 55 146
Pennsylvania 61 51 112
Florida 48 38 86
Maryland 34 34 68
Illinois 19 31 50
Texas 21 25 46
Virginia 24 22 46
Washington 13 22 35
New Hampshire 22 11 33
Georgia 20 12 32
North Carolina 21 11 32
Michigan 7 24 31
Colorado 14 15 29
Ohio 12 17 29
Minnesota 6 13 19
Wisconsin 4 13 17
Arizona 5 11 16
Oregon 5 10 15
Vermont 9 6 15
Stony Brook University Domestic Fall Headcount Enrollment by Level and Geographic Origin State, Geographic Origin
Not New York State
These figures represent a tabulation of fall headcount enrollment at Stony Brook University of students not classified as domestic (not non-resident aliens) by their
geographic origin. Geographic origin values are assigned based on a students earliers home address for a given academic career. These data do not reflect a students
tuition residency. Counts are from the Day 15 snapshot of fall enrollment and should be considered preliminary, pending final audit. Enrollments are counted following
requirements established by the U. S. Dept. of Education for reporting to the Integrated Postsecondary Data System (IPEDS). Nonresident alien: A person who is not a
citizen or national of the United States and who is in this country on a visa or temporary basis and does not have the right to remain indefinitely.
Fall 2017
Prepared by the SBU Office of Institutional Research, Planning & Effectiveness - December 8, 2017
Source: Stony Brook Data Warehouse StudentTermStack
Fact Book(2017-18)
Note: 2017 data are preliminary until reported to IPEDS in spring 2018.
Undergrad Graduate Total
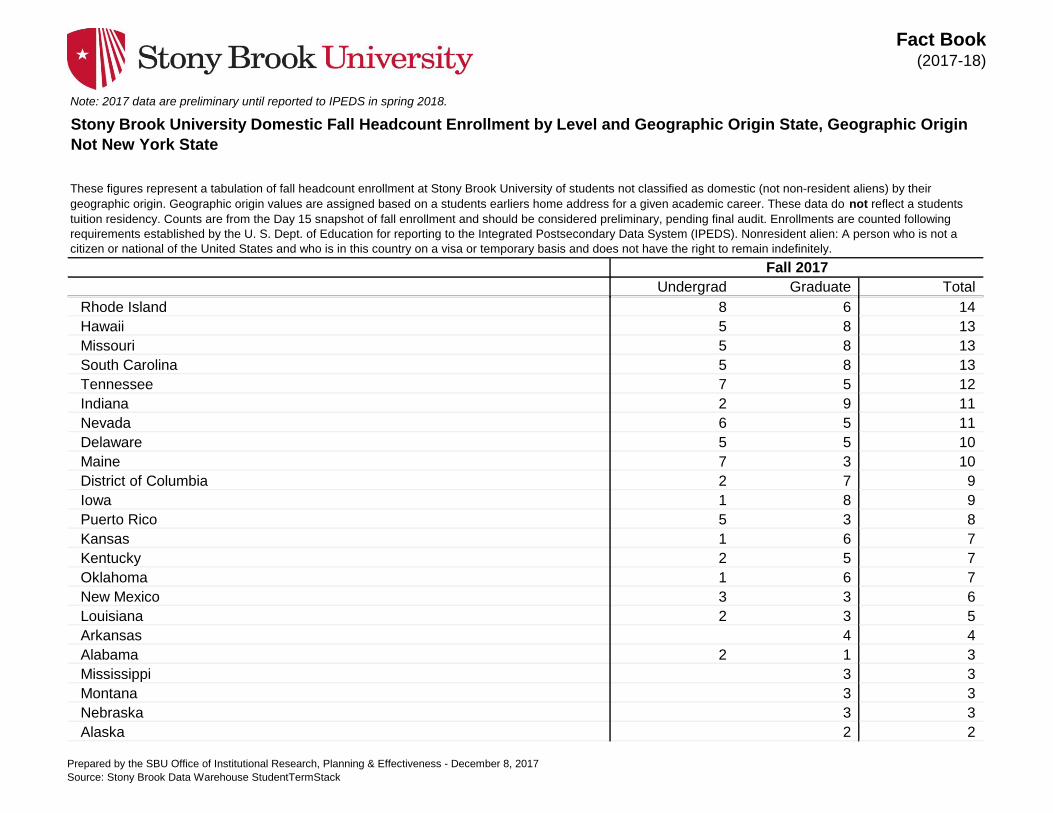
Stony Brook University Domestic Fall Headcount Enrollment by Level and Geographic Origin State, Geographic Origin
Not New York State
These figures represent a tabulation of fall headcount enrollment at Stony Brook University of students not classified as domestic (not non-resident aliens) by their
geographic origin. Geographic origin values are assigned based on a students earliers home address for a given academic career. These data do not reflect a students
tuition residency. Counts are from the Day 15 snapshot of fall enrollment and should be considered preliminary, pending final audit. Enrollments are counted following
requirements established by the U. S. Dept. of Education for reporting to the Integrated Postsecondary Data System (IPEDS). Nonresident alien: A person who is not a
citizen or national of the United States and who is in this country on a visa or temporary basis and does not have the right to remain indefinitely.
Fall 2017
Rhode Island 8 6 14
Hawaii 5 8 13
Missouri 5 8 13
South Carolina 5 8 13
Tennessee 7 5 12
Indiana 2 9 11
Nevada 6 5 11
Delaware 5 5 10
Maine 7 3 10
District of Columbia 2 7 9
Iowa 1 8 9
Puerto Rico 5 3 8
Kansas 1 6 7
Kentucky 2 5 7
Oklahoma 1 6 7
New Mexico 3 3 6
Louisiana 2 3 5
Arkansas 4 4
Alabama 2 1 3
Mississippi 3 3
Montana 3 3
Nebraska 3 3
Alaska 2 2
Prepared by the SBU Office of Institutional Research, Planning & Effectiveness - December 8, 2017
Source: Stony Brook Data Warehouse StudentTermStack
Fact Book(2017-18)
Note: 2017 data are preliminary until reported to IPEDS in spring 2018.
Undergrad Graduate Total
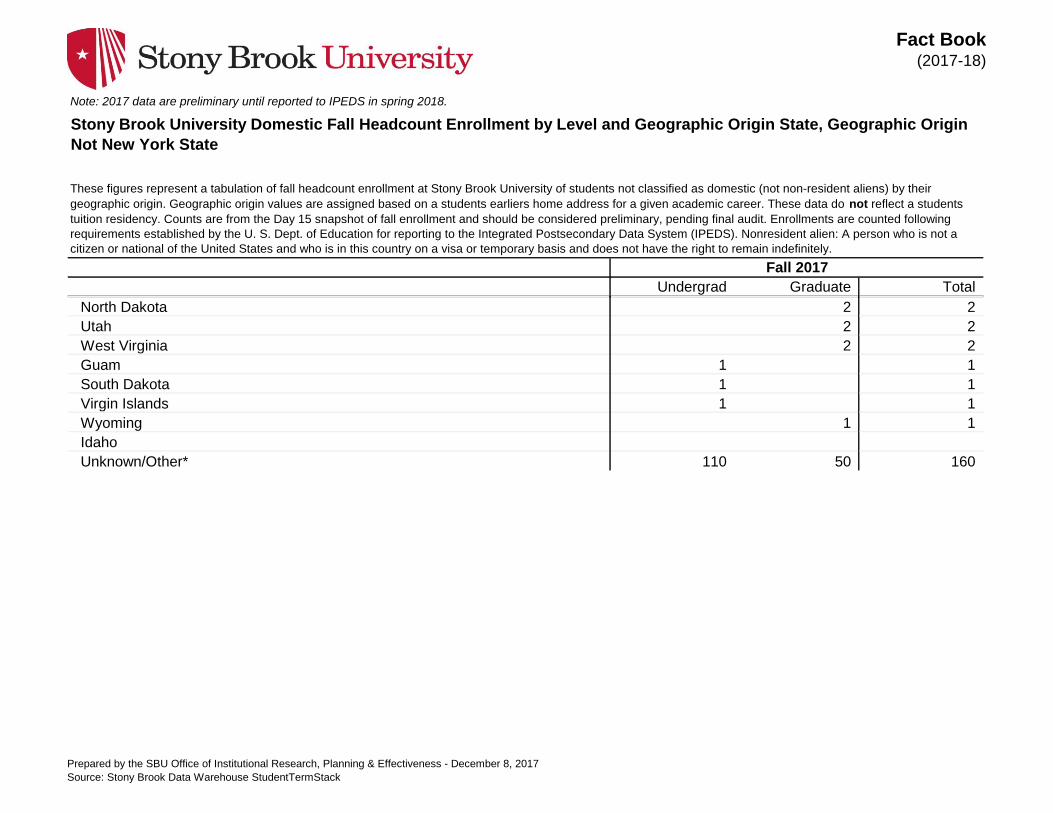
Stony Brook University Domestic Fall Headcount Enrollment by Level and Geographic Origin State, Geographic Origin
Not New York State
These figures represent a tabulation of fall headcount enrollment at Stony Brook University of students not classified as domestic (not non-resident aliens) by their
geographic origin. Geographic origin values are assigned based on a students earliers home address for a given academic career. These data do not reflect a students
tuition residency. Counts are from the Day 15 snapshot of fall enrollment and should be considered preliminary, pending final audit. Enrollments are counted following
requirements established by the U. S. Dept. of Education for reporting to the Integrated Postsecondary Data System (IPEDS). Nonresident alien: A person who is not a
citizen or national of the United States and who is in this country on a visa or temporary basis and does not have the right to remain indefinitely.
Fall 2017
North Dakota 2 2
Utah 2 2
West Virginia 2 2
Guam 1 1
South Dakota 1 1
Virgin Islands 1 1
Wyoming 1 1
Idaho
Unknown/Other* 110 50 160
Prepared by the SBU Office of Institutional Research, Planning & Effectiveness - December 8, 2017
Source: Stony Brook Data Warehouse StudentTermStack
Fact Book(2017-18)
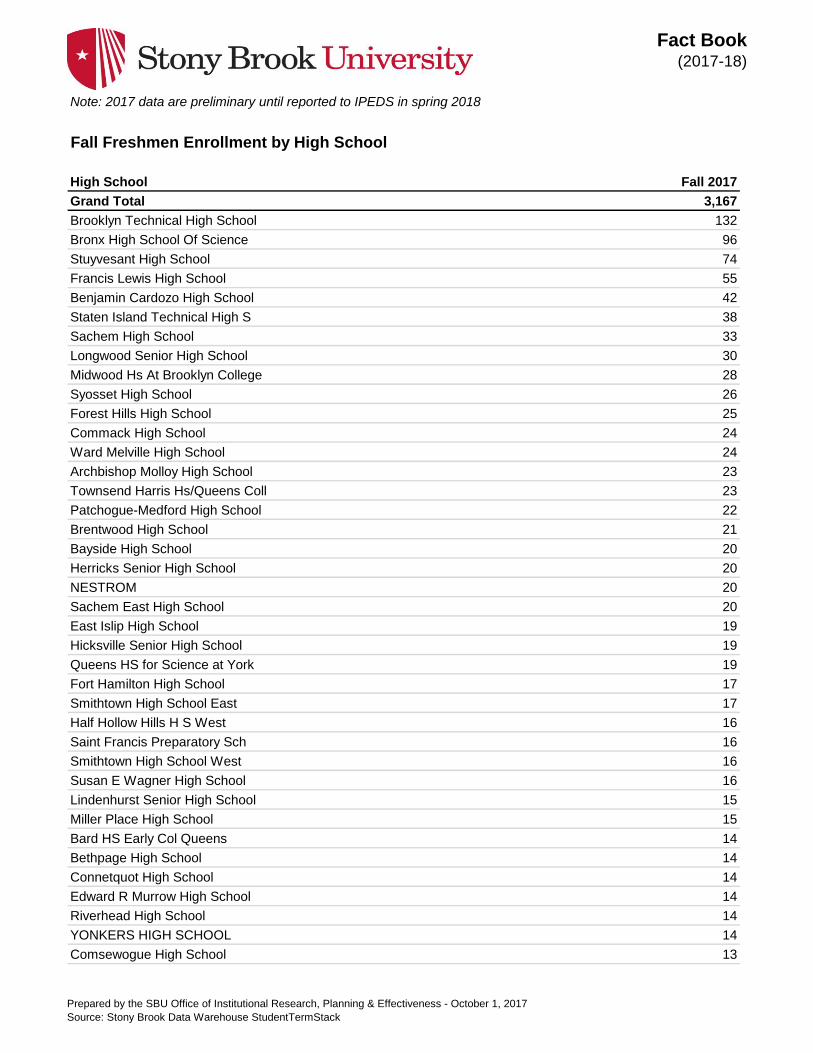
Note: 2017 data are preliminary until reported to IPEDS in spring 2018
High School Fall 2017
Grand Total 3,167
Brooklyn Technical High School 132
Bronx High School Of Science 96
Stuyvesant High School 74
Francis Lewis High School 55
Benjamin Cardozo High School 42
Staten Island Technical High S 38
Sachem High School 33
Longwood Senior High School 30
Midwood Hs At Brooklyn College 28
Syosset High School 26
Forest Hills High School 25
Commack High School 24
Ward Melville High School 24
Archbishop Molloy High School 23
Townsend Harris Hs/Queens Coll 23
Patchogue-Medford High School 22
Brentwood High School 21
Bayside High School 20
Herricks Senior High School 20
NESTROM 20
Sachem East High School 20
East Islip High School 19
Hicksville Senior High School 19
Queens HS for Science at York 19
Fort Hamilton High School 17
Smithtown High School East 17
Half Hollow Hills H S West 16
Saint Francis Preparatory Sch 16
Smithtown High School West 16
Susan E Wagner High School 16
Lindenhurst Senior High School 15
Miller Place High School 15
Bard HS Early Col Queens 14
Bethpage High School 14
Connetquot High School 14
Edward R Murrow High School 14
Riverhead High School 14
YONKERS HIGH SCHOOL 14
Comsewogue High School 13
Fall Freshmen Enrollment by High School
Prepared by the SBU Office of Institutional Research, Planning & Effectiveness - October 1, 2017
Source: Stony Brook Data Warehouse StudentTermStack

Fact Book(2017-18)
Note: 2017 data are preliminary until reported to IPEDS in spring 2018
High School Fall 2017
Grand Total 3,167
Fall Freshmen Enrollment by High School
Hauppauge High School 13
Massapequa High School 13
Shaker High School 13
The Scholars Academy 13
Manhattan Cntr For Sci & Math 12
Newfield High School 12
Rocky Point Jr-Sr High School 12
Shenendehowa High School 12
Centereach High School 11
Roslyn High School 11
Sayville High School 11
The Brooklyn Latin School 11
Walt Whitman High School 11
Earl L Vandermeulen High Sch 10
Farmingdale High School 10
Franklin D Roosevelt High Sch 10
Gen Douglas Macarthur High Sch 10
HS for Dual Language Asian St 10
Laguardia High Sch Music Art 10
Leon M Goldstein HS for Sceinces 10
Mary Louis Academy 10
Tottenville High School 10
East Meadow High School 9
Eastport/South Manor Jr/Sr HIgh School 9
Eleanor Roosevelt High School 9
Great Neck South High School 9
Half Hollow Hills Hs East 9
High School Envrnmntl Studies 9
MILLENNIUM HIGH SCHOOL 9
Mount Sinai High School 9
Plainview-Old Bethpage Jfk H S 9
Saint John Baptist Diocesan Hs 9
Valley Stream Central High Sch 9
Arlington Senior High School 8
Baldwin Senior High School 8
Bay Shore High School 8
Deer Park High School 8
Harborfields High School 8
North Babylon High School 8
Prepared by the SBU Office of Institutional Research, Planning & Effectiveness - October 1, 2017
Source: Stony Brook Data Warehouse StudentTermStack

Fact Book(2017-18)
Note: 2017 data are preliminary until reported to IPEDS in spring 2018
High School Fall 2017
Grand Total 3,167
Fall Freshmen Enrollment by High School
Paul D Schreiber Sr High Sch 8
Saint Anthony High School 8
Sewanhaka High School 8
Shoreham-Wading River High Sch 8
Valley Stream South High Sch 8
White Plains High School 8
Baruch College Campus Hs 7
Clarkstown High School South 7
Fordham Preparatory School 7
Islip High School 7
John F Kennedy High School 7
Kings Park High School 7
Queens High School Language 7
Roy C Ketcham Senior High Sch 7
Suffern High School 7
W C Mepham Senior High School 7
William Floyd High School 7
Bayport-Blue Point High School 6
Chengdu No 7 HS 6
Copiague High School 6
Division Avenue High School 6
Edgemont High School 6
H Frank Carey High School 6
High School for Construction 6
Holy Trinity High School 6
Ithaca High School 6
James Madison High School 6
John Bowne High School 6
Kellenberg Memorial High Sch 6
Long Beach Senior High School 6
Mahopac High School 6
Mineola High School 6
New Utrecht High School 6
Newburgh Free Academy 6
Niskayuna High School 6
North Shore High School 6
Northport Senior High School 6
Preston High School 6
Seaford High School 6
Prepared by the SBU Office of Institutional Research, Planning & Effectiveness - October 1, 2017
Source: Stony Brook Data Warehouse StudentTermStack

Fact Book(2017-18)
Note: 2017 data are preliminary until reported to IPEDS in spring 2018
High School Fall 2017
Grand Total 3,167
Fall Freshmen Enrollment by High School
Stony Brook School 6
Warwick Valley High School 6
Washingtonville High School 6
West Babylon Sr High School 6
Westhampton Beach High School 6
Yorktown High School 6
ACADEMY OF AMERICAN STUDIES 5
Bellport Senior High School 5
Chaminade High School 5
Curtis High School 5
Elmont Memorial Jr-Sr High Sch 5
Glen Cove High School 5
Guilderland Central High Sch 5
Hillcrest High School 5
HS for Math,Sci and Engineerin 5
Information Tech High School 5
Island Trees High School 5
Jericho Senior High School 5
KIPP NYC College Prep 5
Lakeland Senior High School 5
Maspeth High School 5
New Hyde Park Mem High School 5
New Visions-Advan Math & Sci 5
Queens Metropolitan HS 5
Queens School of Inquiry 5
Sanford H Calhoun High School 5
W Tresper Clarke High School 5
West Islip High School 5
Xavier High School 5
All Other High Schools* 1,289
*Note: All Other High Schools include schools with less than 5 students for the most recent term. High school values of
"Unknown High School" and "High School Outside the U.S." are also included, regardless of counts.
Prepared by the SBU Office of Institutional Research, Planning & Effectiveness - October 1, 2017
Source: Stony Brook Data Warehouse StudentTermStack