fall walleye index netting at lac la biche, alberta, 2014 · esrd/fall walleye index netting at lac...
TRANSCRIPT

Fall Walleye Index Netting at Lac La Biche, Alberta, 2014
Fisheries Management Waterways/Lac La Biche
May 7, 2015

ESRD/Fall Walleye Index Netting at Lac La Biche, Alberta, 2014
Fisheries Biologist: Alicia Pruden-Beniuk – Resource Management, Lac La Biche
Disclaimer
This is a summary report prepared for public distribution by Alberta Environment and Sustainable Resource Development, Resource Management Branch. This report has been peer reviewed, but may be subject to revision pending further data analysis.
Abstract
This Fall Walleye Index Netting (FWIN) survey was conducted from September 15-19, 2014. A total of 1,166 fish were caught in this survey representing 8 species. A total of 390 walleye were caught in the 32 FWIN nets set. This translates to a catch rate of 22.8 walleye/100m2/24hr (95% CI 19.4-26.3), which is just above the provincial mean of 18.6 walleye/100m2/24hr. Individual net catches varied from 3 to 25 fish per net. Walleye total lengths ranged from 131mm to 694mm with fish over 500mm representing 71% of the fish caught. There were 10 age classes present, with age classes 3, 5, 8 being dominant. The mean age of the walleye in this FWIN was 5. Two hundred and sixty of the walleye captured were mature. The mean age at maturity for female walleye was 5. Females started to mature at age 5 with all females being mature at age 6. The mean age at maturity for male walleye was 4. Males started to mature at age 3 and were all mature at age 4. Females reached 500mm TL length at approximately age 4 and their Linf was 678.8 mm TL. Males reached 500mm TL length at approximately age 5 and their Linf was 660.6 mm TL. This walleye population was classified as vulnerable.
Other species caught were lake whitefish (n=37), cisco (n=160), white sucker (n=50), longnose sucker (n=1), and spottail shiners (n=4).
May 7, 2015 Fall Walleye Index Netting at Lac La Biche, Alberta, 2003
© 2015 Government of Alberta
Page 2 of 22

ESRD/Fall Walleye Index Netting at Lac La Biche, Alberta, 2014
Introduction
The Lac La Biche Fishery Restoration Program was initiated in 2005. Part of this program included the stocking of walleye from 2006-2011. Annual FWIN Surveys have been completed since 2005 to assess this walleye population and to evaluate the effectiveness of the restoration program. AESRD uses the Fall Walleye Index Netting (FWIN) protocol to monitor walleye primarily; however we also collect data from other species such as northern pike, yellow perch, and lake whitefish. These data are essential to ensuring sustainable harvest allocations for sport fish. This FWIN survey was conducted in September 2014 to determine the abundance, structure, and reproduction (recruitment) in the walleye (Sander vitreus) population at Lac La Biche.
Methods
This FWIN survey was conducted from September 15-19, 2014. A comprehensive description of equipment and methodology can be found in the Manual of Instructions Fall Walleye Index Netting (FWIN) (Morgan 2002). The nets used were “half-FWIN” nets, consisting of eight panels, 3.81 m in length and 1.83 m in height with stretched mesh sizes of 25, 38, 51, 64, 76, 102, 127, and 152 mm. Two additional panels of 12 and 19 mm stretched mesh were attached but separated from the standard gang by ten meter leads. The lake was divided in to East and West basin which can be differentiated by the letter in the site name (E or East and W for West). Nets were set at thirty-two locations during the survey with equal numbers of nets set in the East and West basin. Sixteen of the net locations (eight in either basin) were index sites which were originally chosen in 2008 from net sites from previous years. These sites are resampled every year and are differentiated in the data by an “I” after the basin identifier in the set number. The remaining net locations were selected randomly. All sample locations are area weighted by depth stratum. Three depth strata were used, 2-5 m and 5-15 m, and over 15 m. Nets were set for 24 hrs (± 3 hours) before being cleared of fish and reset at new locations. Set and pull times were recorded. Nets were set perpendicular to depth contours, and minimum and maximum depths were recorded. Net locations were recorded in Universal Transverse Mercator (UTM) projection coordinates using the North American Datum 1983 (NAD 83) on handheld GPS units. Surface water temperature was also recorded at all net locations, and ranged between 12 and 15°C.
All fish species were kept for biological sampling. Catches were recorded by net location and mesh size. A net ID, date, mesh size, and count of each species of fish caught were recorded for each panel for catch-per-unit-effort (CPUE) calculations. All sportfish were sampled for fork length (FL), total length (TL), weight, sex, and maturity; and all data was recorded on datasheets. Fin rays were clipped from the pelvic fins of all walleye as DNA samples for future analysis. Ageing structures were removed and placed in envelopes labeled with biological information. All walleye were aged using otoliths. Otoliths were also used for yellow perch, cisco, lake whitefish, and burbot. Northern pike were aged using cleithra. Some fish species, especially yellow perch, cisco, and spottail shiners, were subsampled to save time. This subsampling consisted of recording all measurements (FL, TL, weight, sex, maturity) from 10 individuals. Of the next 20 individuals, FL, TL, and weight are recorded. On the next seventy individuals only a TL is recorded. Total lengths for the subsampled individuals were later derived using the data from the measured individuals in the panel. These derived measurements have the identifier of a “D” in the sample number.
For the analysis, relative abundance (expressed as CPUE) was calculated as number of fish caught/100 m2 net/24 hours with 95% confidence intervals empirically determined by bootstrapping catches to 10,000 replications (Haddon 2001). Growth was described using the von Bertalanffy growth model in FAMS 1.0 (Slipke 2010). The analysis for the main body of this report was calculated using 8 panel nets. For the 10 panel (8 panel including the 12 and 19mm meshes) analysis, refer to the appendix.
Interpretations of the walleye population status are based on criteria contained in the Alberta’s Walleye Management Recovery Plan (Berry 1996, Sullivan 2003) modified for FWIN (Watters and Davis 2004). May 7, 2015 Fall Walleye Index Netting at Lac La Biche,
Alberta, 2003 © 2015 Government of Alberta
Page 3 of 22

ESRD/Fall Walleye Index Netting at Lac La Biche, Alberta, 2014
The raw data is stored digitally in the Fish and Wildlife Management Information System (FWMIS), project #18871.
Results
A total of 1,166 fish were caught in this survey representing 8 species (Table 1). A total of 390 walleye were caught in the 32 FWIN nets. This translates to a catch rate of 22.8 walleye/100m2/24hr (95% CI 19.4-26.3) (Table 2), which is just above the current provincial mean of 18.6 walleye/100m2/24hr. Individual net catches varied from 3 to 25 fish per net. Walleye total lengths ranged from 131 mm to 694 mm with fish over 500 mm representing 71% of the fish caught (Figure 1). There were 10 age classes present, with age classes 3, 5, 8 being dominant (Figure 2). The mean age of the walleye in this FWIN was 5. Two hundred and sixty of the walleye captured were mature. The mean age at maturity for female walleye was 5 (Figure 3). Females started to mature at age 5 with all females being mature at age 6. The mean age at maturity for male walleye was 4. Males started to mature at age 3 and were all mature at age 4. Females reached 500mm TL length at approximately age 4 and their Linf was 678.8 mm TL (Figure 4). Males reached 500mm TL length at approximately age 5 and their Linf was 660.6 mm TL.
One hundred and four northern pike were captured. The calculated catch rate was 6.1 pike/100m2/24hr (95% CI 4.9-7.4). Northern pike total lengths ranged from 400 mm to 1005 mm with fish over 750 mm consisting of 33% of the catch (Figure 5). The majority of the fish caught were between 550 and 800 mm TL. There were very few fish caught that were less than 450 mm. There were 13 age-classes present in this catch which ranged from age 2 to 14 (Figure 6). There were no dominant age classes present. Males were fully mature at age 4 and females were fully mature at age 3. Of the 142 pike caught only 2 males and 1 female were immature. Females reached 750mm TL at age 7 and their Linf was 1251.5. Males reached 750mm at age 10 and their Linf was 857.1.
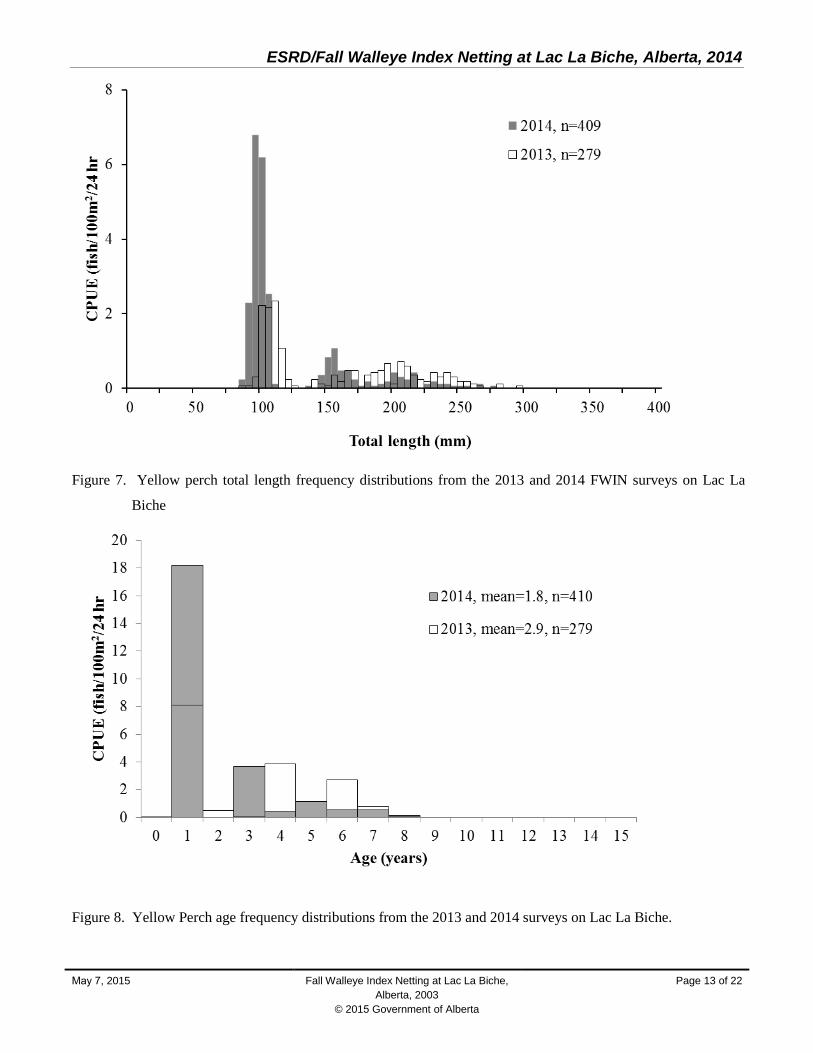
Four hundred and twenty yellow perch were captured. The calculated catch rate was 24.6 perch/100m2/24hr (95% CI 17.5-32.4). Yellow perch lengths ranged from 86 mm to 277 mm with fish between 95-115 mm consisting of 22% of the perch caught (Figure 7). There was a total of 7 age-classes present in this catch, with the one-year-olds being the most dominant (Figure 8). The mean age at maturity for males was 2 and for females it was 3. Males were fully mature at age three, but only 1 immature male was captured and no two year olds were captured. Females were fully mature at age 4.
Other species caught were lake whitefish (n=37), cisco (n=160), white sucker (n=50), longnose sucker (n=1), and spottail shiners (n=4).
Interpretation
In 2014, the five population metrics for walleye in Lac La Biche ranged from collapsed to stable (Table 3). The CPUE trend in this population has continually increased since the stocking events as part of the Lac La Biche Fishery Restoration Program were initiated in 2006, and is currently classified as vulnerable. The age-class-distribution category is classified as stable; although half of the year classes present are from stocked individuals. The few remaining individuals older than 8 are either remnants of the failed stocking efforts in the 1990’s, or are the remains of the adults stocked from Mildred Lake. The walleye stocked between 2006 and 2011 have 3 major age classes, which places them in the vulnerable category. However the growth rate is fast and age at maturity of these fish are low, both of which are indicative of collapsed populations. Based on the balance of the evidence, the walleye in Lac La Biche are classified as vulnerable.
There is evidence of natural reproduction by the stocked individuals which is a milestone in the recovery project, however it is too soon to confidently measure the success of this recruitment as small juvenile walleye behave differently than adults, or are not recruited to the FWIN gear. AESRD will continue to monitor this population May 7, 2015 Fall Walleye Index Netting at Lac La Biche,
Alberta, 2003 © 2015 Government of Alberta
Page 4 of 22

ESRD/Fall Walleye Index Netting at Lac La Biche, Alberta, 2014 closely for evidence of natural reproduction and self-sustainability. It is anticipated that there will be an increase in the CPUE in the fall of 2015 as the 2011 year class become less susceptible to the FWIN net gear selectivity as they increase in size.
May 7, 2015 Fall Walleye Index Netting at Lac La Biche, Alberta, 2003
© 2015 Government of Alberta
Page 5 of 22

ESRD/Fall Walleye Index Netting at Lac La Biche, Alberta, 2014
Table 1. Species catch summary by site, Lac La Biche, September 2014.
CISC LKWH NRPK SPSH WALL WHSC YLPR Total
LLBE-26 17-Sep 5-15 440116 6075564 22.47 1 0 4 0 16 0 18 39LLBE-27 18-Sep 5-15 437149 6084006 23.10 26 1 7 0 17 0 5 56LLBE-28 15-Sep 5-15 441540 6078282 24.12 1 1 5 0 13 2 38 60LLBE-29 17-Sep 5-15 436009 6074157 22.32 1 0 3 1 11 3 11 30LLBE-30 19-Sep 5-15 436689 6070661 22.17 3 0 4 0 10 0 3 20LLBE-31 19-Sep 5-15 436798 6083073 21.68 4 1 3 0 8 0 6 22LLBE-46 19-Sep 2-5 434165 6074367 22.10 6 1 6 0 10 4 19 46LLBE-47 17-Sep 2-5 431976 6082324 22.95 2 4 5 0 11 6 28 56LLBEI-01 16-Sep 2-5 445632 6072758 22.63 8 1 4 0 22 0 38 73LLBEI-02 15-Sep 5-15 442811 6074885 22.92 5 0 4 0 12 2 23 46LLBEI-03 16-Sep 5-15 440993 6077597 23.02 0 0 6 0 12 0 39 57LLBEI-04 18-Sep 5-15 436925 6072738 23.35 1 0 4 0 12 2 16 35LLBEI-05 18-Sep 5-15 434774 6075376 23.53 2 2 2 0 20 0 16 42LLBEI-07 18-Sep 2-5 434673 6083559 22.70 1 3 3 0 12 2 9 30LLBEI-08 19-Sep 5-15 437559 6081691 22.12 4 1 3 0 7 0 30 45LLBEI-6 15-Sep 5-15 435409 6078223 22.72 2 0 6 1 15 0 6 30LLBW-01 15-Sep 2-5 418604 6082875 22.35 1 1 8 0 5 1 1 17LLBW-02 16-Sep 2-5 431834 6078727 23.07 4 3 3 0 18 1 15 44LLBW-06 16-Sep 5-15 430747 6079056 23.13 11 0 3 0 20 1 19 54LLBW-07 16-Sep 5-15 418626 6083884 23.33 6 4 2 0 10 0 2 24LLBW-08 17-Sep 5-15 431349 6077751 23.08 21 0 2 0 17 4 15 59LLBW-09 19-Sep 5-15 421594 6086353 22.03 2 0 1 0 4 6 12 25LLBW-18 15-Sep >15 423692 6083165 22.00 2 0 2 0 8 0 3 15LLBW-19 16-Sep >15 424276 6084024 23.40 3 1 0 0 6 0 1 11LLBWI-01 15-Sep 5-15 429624 6078134 23.48 9 0 0 1 25 2 6 43LLBWI-02 18-Sep >15 426292 6078618 23.92 21 0 0 0 3 0 0 24LLBWI-03 19-Sep >15 424368 6082606 22.65 4 1 1 0 9 0 0 15LLBWI-04 17-Sep 5-15 420830 6083036 24.05 2 0 3 1 19 3 17 45LLBWI-05 17-Sep 5-15 419785 6084621 24.22 2 1 2 0 8 6 1 20LLBWI-06 18-Sep 2-5 417742 6086797 23.72 0 8 4 0 10 2 14 38LLBWI-07 18-Sep 5-15 423129 6086571 23.50 2 0 2 0 8 2 7 22LLBWI-08 19-Sep 2-5 427497 6085429 22.42 3 3 2 0 12 1 2 23
Grand Total 160 37 104 4 390 50 420 1166
a UTM 12U, NAD 83 map datum
Number of Fish CaughtSite
Lift Date(2014)
Stratum (m)
UTM Eastinga
UTM Northinga
Set Duration
May 7, 2015 Fall Walleye Index Netting at Lac La Biche, Alberta, 2003
© 2015 Government of Alberta
Page 6 of 22

ESRD/Fall Walleye Index Netting at Lac La Biche, Alberta, 2014
Table 2. Species catch rates from the 2013 and 2014 Lac La Biche FWIN surveys.
Species Year Mean CPUE 95% CI
WALL 2013 22.8 19.4 - 26.32014 14.3 11.2 17.6
NRPK 2013 6.1 4.9 - 7.42014 3.2 1.6 5.1
YLPR 2013 24.6 17.5 - 32.42014 453.5 267.8 671.3
LKWH 2013 2.2 1.2 - 3.42014 6.3 4.3 8.5
WHSC 2013 2.9 1.8 - 4.22014 4.4 2.9 6.2
CISC 2013 9.3 5.7 - 13.62014 20.8 14.2 27.9
LNSC 2013 0.1 0.0 - 0.22014 0.2 0.0 0.6
SPSH 2013 0.2 0.1 - 0.52014 29.8 15.9 46.3
May 7, 2015 Fall Walleye Index Netting at Lac La Biche, Alberta, 2003
© 2015 Government of Alberta
Page 7 of 22

ESRD/Fall Walleye Index Netting at Lac La Biche, Alberta, 2014
Figure 1. Walleye total Length frequency distributions from the 2013 and 2014 FWIN surveys on Lac La Biche
Figure 2. Walleye age frequency distributions from the 2013 and 2014 FWIN surveys on Lac La Biche
May 7, 2015 Fall Walleye Index Netting at Lac La Biche, Alberta, 2003
© 2015 Government of Alberta
Page 8 of 22

ESRD/Fall Walleye Index Netting at Lac La Biche, Alberta, 2014
a)
b)
Figure 3. Age-at-maturity distributions for a) male and b) female walleye from the 2014 survey on Lac La Biche.
May 7, 2015 Fall Walleye Index Netting at Lac La Biche, Alberta, 2003
© 2015 Government of Alberta
Page 9 of 22

ESRD/Fall Walleye Index Netting at Lac La Biche, Alberta, 2014
Figure 4. Von Bertanlanffy growth curves for female (Linf=678.8, K=0.272, to=-0.495, and R2=0.96, Prob >0.0001) and male (Linf=660.6, K=0.242, to=0.864, and R2=0.98, Prob >0.0001) walleye from the Lac La Biche FWIN survey 2014.
May 7, 2015 Fall Walleye Index Netting at Lac La Biche, Alberta, 2003
© 2015 Government of Alberta
Page 10 of 22

ESRD/Fall Walleye Index Netting at Lac La Biche, Alberta, 2014
Table 3. Walleye stock classification for Lac La Biche based on 2014 FWIN survey results.
POPULATION STATUS CLASSIFICATIONTROPHY STABLE VULNERABLE COLLAPSED
CATCH RATE (FWIN)
High - >30 walleye•100m-2•24h-1
High - >30 walleye•100m-2•24h-1
Moderate: 15-30 walleye•100m-2•24h-1
Low: <15 walleye•100m-2•24h-1
CPUE = 22.77AGE CLASS DISTRIBUTION
Wide: 8 or more age classes (n=200); mean age >9 years.
Wide: 8 or more age classes (n=200); mean age 6 to 9 years.
Narrow: 1 to 3 age classes; mean age 4 to 6 years; few old (>10 years).
Can be wide or narrow; mean age 6 to 10 years.
11 age classes present. Wide age class distribution (n=386); mean age = 5.4
AGE CLASS STABILITY
Very stable: 1 to 2 "measureable" (> 3 walleye•100m-2•24h-1) age classes out of a smooth catch curve.
Relatively stable: 2 to 3 "measureable" age classes out of a smooth catch curve.
Unstable: 1 to 3 "measureable" age classes, with gaps in age classes.
Stable or unstable: 1 or fewer "measurable" age classes.
3 strong age classes; few indivuduals >8 . All stocked age classes present. Gap at age 2
AGE AT MATURITY
Females: 10-20 years Males: 10-16 years
Females: 8-10 years Males: 7-9 years
Females: 7-8 years Males: 5-7 years
Females: 4-7 years Males:3-6 years
Females fully recruited at age 6; males fully recruited at age 4.
LENGTH AT AGE
Very Slow50 cm in 12-15 years
Slow50 cm in 9-12 years
Moderate50 cm in 7-9 years
Fast50 cm in 4-7 years
Females reach 50 cm at age 4; males reach 50 cm at age 5; pooled reach 50 cm at age 4.5.
POPULATION METRIC
May 7, 2015 Fall Walleye Index Netting at Lac La Biche, Alberta, 2003
© 2015 Government of Alberta
Page 11 of 22

ESRD/Fall Walleye Index Netting at Lac La Biche, Alberta, 2014
Figure 5. Northern pike total length frequency distributions for the 2013 and 2014 FWIN surveys on Lac La Biche
Figure 6. Northern pike age frequency distributions from the 2013 and 2014 FWIN surveys on Lac La Biche
May 7, 2015 Fall Walleye Index Netting at Lac La Biche, Alberta, 2003
© 2015 Government of Alberta
Page 12 of 22
ESRD/Fall Walleye Index Netting at Lac La Biche, Alberta, 2014
Figure 7. Yellow perch total length frequency distributions from the 2013 and 2014 FWIN surveys on Lac La
Biche
Figure 8. Yellow Perch age frequency distributions from the 2013 and 2014 surveys on Lac La Biche.
May 7, 2015 Fall Walleye Index Netting at Lac La Biche, Alberta, 2003
© 2015 Government of Alberta
Page 13 of 22

ESRD/Fall Walleye Index Netting at Lac La Biche, Alberta, 2014 Literature Cited
Berry, D.K. 1996. Alberta’s walleye management and recovery plan. Alberta Environmental Protection, Natural Resources Service. Number T/310. 32 pp.
Haddon, M. 2001. Modelling and quantitative methods in fisheries. Chapman and Hall/CRC, Boca Raton, Florida.
Walker, J. 2003. Christina Lake Fall Walleye Index Netting Survey, 2003. Alberta Sustainable Resource Development. 23 p.
Mackay, W.C., G.R. Ash, and H.J. Norris (eds.). 1990. Fish ageing methods for Alberta. R.L.& L. Environmental Services Ltd. in assoc. with Alberta Fish and Wildl. Div. and Univ. of Alberta, Edmonton. 113 p.
Morgan, G.E. 2002. Manual of instructions – fall walleye index netting (FWIN). Percid Community Synthesis, Diagnostics and Sampling Standards Working Group. Ontario Ministry of Natural Resources. 34 p.
Slipke, J. W. 2010. Fishery Analyses and Modeling Simulator (FAMS 1.0).
Sullivan, M. G. 2003. Active Management of Walleye Fisheries in Alberta: Dilemmas of Managing Recovering Fisheries. North American Journal of Fisheries Management 23:1343–1358, 2003.
Watkins, Owen B. and Stephen C. Spencer 2009. Collection, preparation and ageing of walleye otoliths. Fish and Wildlife Division, Alberta Sustainable Resource Development. 14pp.
Watters, D. and C. Davis. 2004. Calling Lake Walleye Status Assessment and Comparison of Fall Walleye Index Netting Surveys in 2001 and 2002. Fisheries Management Division Technical Report. Alberta Sustainable Resource Development. 36 pp.
May 7, 2015 Fall Walleye Index Netting at Lac La Biche, Alberta, 2003
© 2015 Government of Alberta
Page 14 of 22

ESRD/Fall Walleye Index Netting at Lac La Biche, Alberta, 2014 Appendix A. Analysis and results using 10 panel nets (includes 12 and 19 mesh
panels).
A total of 1,878 fish were caught in this survey representing 8 species (Table A1). A total of 442 walleye were caught in the 32 FWIN nets set. This translates to a catch rate of 20.7walleye/100m2/24hr (95% CI 17.8-23.7) (Table A2), which is just above the provincial mean of 18.6 walleye/100m2/24hr. Individual net catches varied from 3 to 27 fish per net. Walleye total lengths ranged from 131mm to 694mm with fish over 500mm representing 70% of the fish caught (Figure A1). There were 10 age classes present, with age classes 3, 5, 8 being dominant (Figure A2). The mean age of the walleye in this FWIN was 5. Two hundred and eighty-three of the walleye captured were mature. The mean age at maturity for female walleye was 5.5 (Figure A3). Females started to mature at age 5 with all females being mature at age 6. The mean age at maturity for male walleye was 4. Males started to mature at age 3 and were all mature at age 6. Females reached 500mm TL length atapproximately age 4 and their Linf was 698.6 mm TL (Figure A4). Males reached 500mm TL length at approximately age 5 and their Linf was 662.2 mm TL. This walleye population was classified as vulnerable.
One hundred and fifteen northern pike were captured. The calculated catch rate was 5.4 pike/100m2/24hr (95% CI 4.3-6.6). Northern pike total lengths ranged from 400 mm to 1005 mm with fish over 750 mm consisting of 30% of the catch (Figure A5). The majority of the fish caught were between the 550 and 800TL. There were very few fish caught that were less than 450 mm. There were 13 age-classes present in this catch which ranged from age 2 to 14 (Figure A6). There were no dominant age classes present. Males were fully mature at age 4 and females were fully mature at age 5. Of the 115 pike caught only 2 males and 3 females were immature. Females reached 750mm TL at age 7 and their Linf was 1214.5. Males reached 750mm at age 10 and their Linf was 854.5.
Seven hundred and fifty-four yellow perch were captured. The calculated catch rate was 35.4 perch/100m2/24hr (95% CI 26.9-44.1). Yellow perch lengths ranged from 54 mm to 277 mm with fish between 54-115mm consisting of 84% of the perch caught (figure A7). There was a total of 7 age-classes present in this catch, with the one-year-olds being most dominant (Figure A8). . The mean age at maturity for males was 2 and for females it was 3. Males were fully mature at age three, but only 1 immature male was captured. Females were fully mature at age 4.
Other species caught were lake whitefish (n=37), cisco (n=175), white sucker (n=51), longnose sucker (n=1), and spottail shiners (n=442).
May 7, 2015 Fall Walleye Index Netting at Lac La Biche, Alberta, 2003
© 2015 Government of Alberta
Page 15 of 22

ESRD/Fall Walleye Index Netting at Lac La Biche, Alberta, 2014
Table A1. Species catch summary by site, Lac La Biche, September 2014
CISC LKWH NRPK SPSH WALL WHSC YLPR Total
LLBE-26 17-Sep 5-15 440116 6075564 22.47 1 0 4 11 19 0 34 69LLBE-27 18-Sep 5-15 437149 6084006 23.10 26 1 8 0 17 0 5 57LLBE-28 15-Sep 5-15 441540 6078282 24.12 1 1 5 13 13 2 42 77LLBE-29 17-Sep 5-15 436009 6074157 22.32 3 0 3 8 13 3 15 45LLBE-30 19-Sep 5-15 436689 6070661 22.17 3 0 4 2 12 0 7 28LLBE-31 19-Sep 5-15 436798 6083073 21.68 4 1 3 0 9 0 7 24LLBE-46 19-Sep 2-5 434165 6074367 22.10 6 1 6 28 13 5 46 105LLBE-47 17-Sep 2-5 431976 6082324 22.95 3 4 7 33 13 6 51 117LLBEI-01 16-Sep 2-5 445632 6072758 22.63 15 1 4 5 23 0 60 108LLBEI-02 15-Sep 5-15 442811 6074885 22.92 5 0 5 5 13 2 37 67LLBEI-03 16-Sep 5-15 440993 6077597 23.02 0 0 7 0 12 0 43 62LLBEI-04 18-Sep 5-15 436925 6072738 23.35 2 0 4 7 17 2 23 55LLBEI-05 18-Sep 5-15 434774 6075376 23.53 3 2 2 1 22 0 18 48LLBEI-07 18-Sep 2-5 434673 6083559 22.70 1 3 3 24 13 2 16 62LLBEI-08 19-Sep 5-15 437559 6081691 22.12 4 1 3 1 7 0 39 55LLBEI-6 15-Sep 5-15 435409 6078223 22.72 2 0 7 2 17 0 7 35
LLBW-01 15-Sep 2-5 418604 6082875 22.35 1 1 8 6 6 1 14 37LLBW-02 16-Sep 2-5 431834 6078727 23.07 4 3 4 31 19 1 30 92LLBW-06 16-Sep 5-15 430747 6079056 23.13 11 0 4 33 25 1 41 115LLBW-07 16-Sep 5-15 418626 6083884 23.33 6 4 2 3 10 0 11 36LLBW-08 17-Sep 5-15 431349 6077751 23.08 24 0 2 12 18 4 20 80LLBW-09 19-Sep 5-15 421594 6086353 22.03 2 0 2 8 7 6 35 60LLBW-18 15-Sep >15 423692 6083165 22.00 2 0 2 2 8 0 6 20LLBW-19 16-Sep >15 424276 6084024 23.40 3 1 0 2 7 0 5 18LLBWI-01 15-Sep 5-15 429624 6078134 23.48 9 0 1 5 27 2 7 51LLBWI-02 18-Sep >15 426292 6078618 23.92 21 0 0 0 3 0 0 24LLBWI-03 19-Sep >15 424368 6082606 22.65 4 1 1 0 10 0 0 16LLBWI-04 17-Sep 5-15 420830 6083036 24.05 2 0 3 7 22 3 33 70LLBWI-05 17-Sep 5-15 419785 6084621 24.22 2 1 3 1 10 6 21 44LLBWI-06 18-Sep 2-5 417742 6086797 23.72 0 8 4 30 13 2 48 105LLBWI-07 18-Sep 5-15 423129 6086571 23.50 2 0 2 2 10 2 12 31LLBWI-08 19-Sep 2-5 427497 6085429 22.42 3 3 2 21 14 1 21 65
Grand Total 175 37 115 303 442 51 754 1878
a UTM 12U, NAD 83 map datum
Number of Fish Caught
SiteLift Date(2014)
Stratum (m)
UTM Eastinga
UTM Northinga
Set Duration (hours)
May 7, 2015 Fall Walleye Index Netting at Lac La Biche, Alberta, 2003
© 2015 Government of Alberta
Page 16 of 22
ESRD/Fall Walleye Index Netting at Lac La Biche, Alberta, 2014
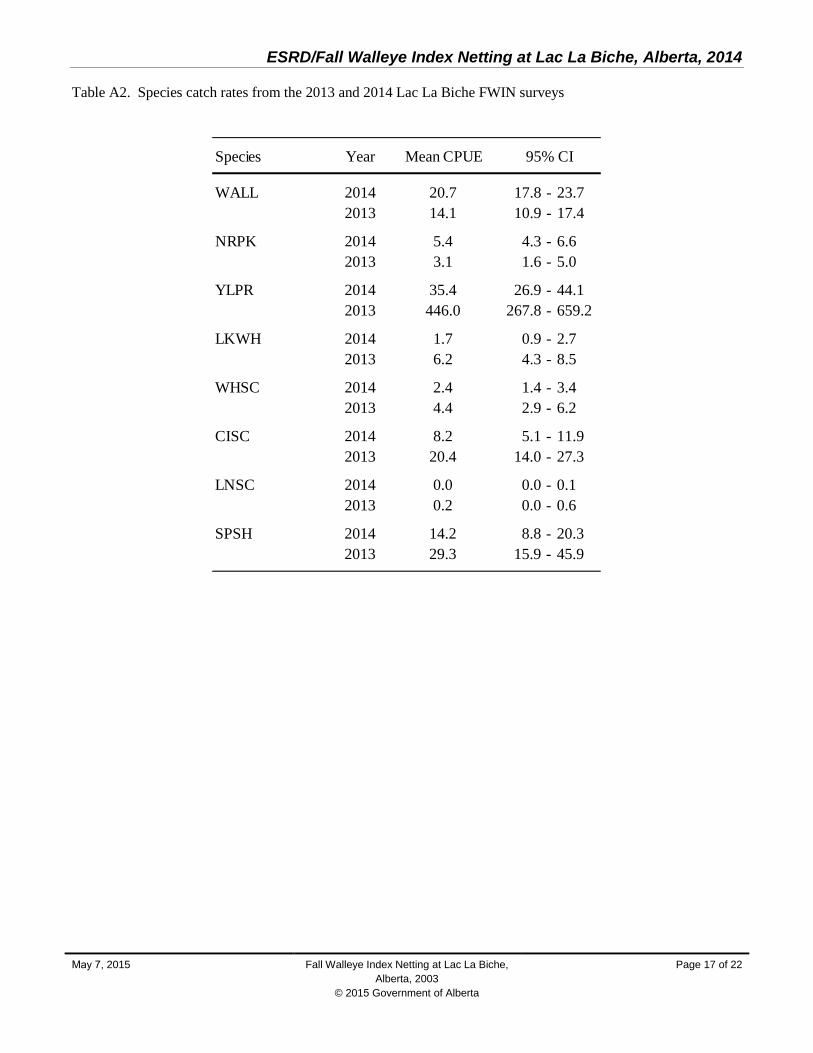
Table A2. Species catch rates from the 2013 and 2014 Lac La Biche FWIN surveys
Species Year Mean CPUE 95% CI
WALL 2014 20.7 17.8 - 23.72013 14.1 10.9 - 17.4
NRPK 2014 5.4 4.3 - 6.62013 3.1 1.6 - 5.0
YLPR 2014 35.4 26.9 - 44.12013 446.0 267.8 - 659.2
LKWH 2014 1.7 0.9 - 2.72013 6.2 4.3 - 8.5
WHSC 2014 2.4 1.4 - 3.42013 4.4 2.9 - 6.2
CISC 2014 8.2 5.1 - 11.92013 20.4 14.0 - 27.3
LNSC 2014 0.0 0.0 - 0.12013 0.2 0.0 - 0.6
SPSH 2014 14.2 8.8 - 20.32013 29.3 15.9 - 45.9
May 7, 2015 Fall Walleye Index Netting at Lac La Biche, Alberta, 2003
© 2015 Government of Alberta
Page 17 of 22

ESRD/Fall Walleye Index Netting at Lac La Biche, Alberta, 2014
Figure A1. Walleye total length frequency distributions from the 2013 and 2014 FWIN surveys on Lac La Biche
Figure A2. Walleye age frequency distributions from the 2013 and 2014 FWIN surveys on Lac La Biche
May 7, 2015 Fall Walleye Index Netting at Lac La Biche, Alberta, 2003
© 2015 Government of Alberta
Page 18 of 22
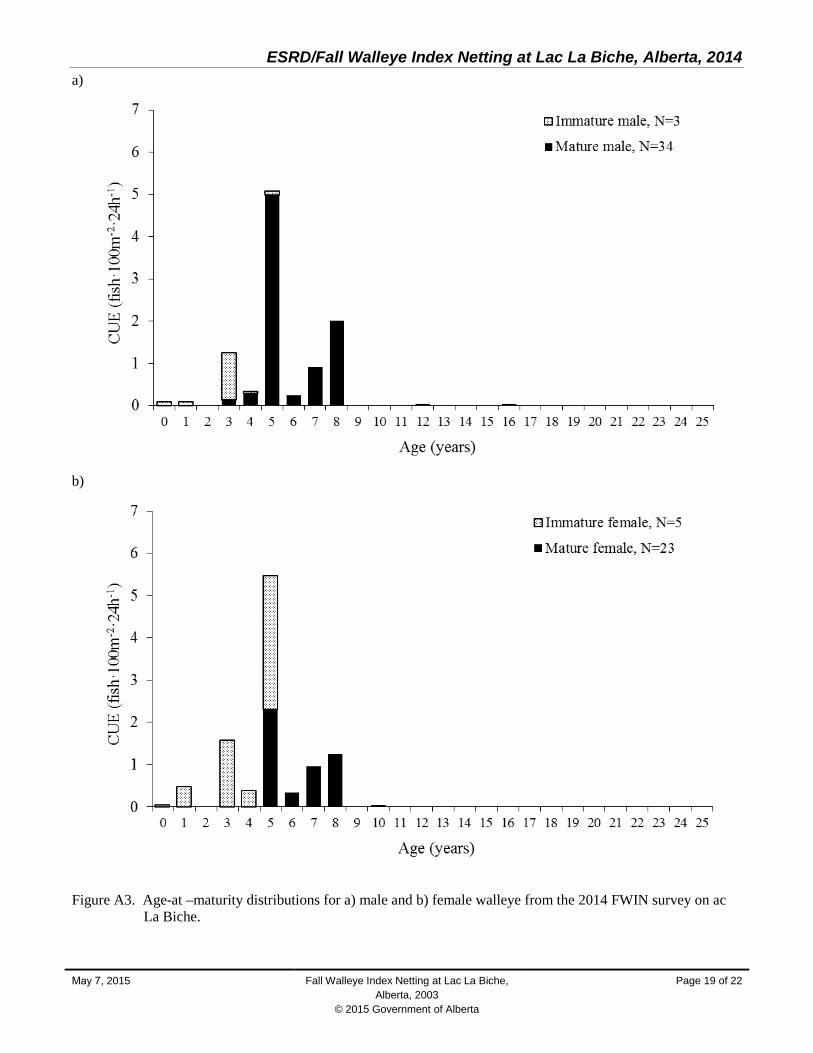
ESRD/Fall Walleye Index Netting at Lac La Biche, Alberta, 2014 a)
b)
Figure A3. Age-at –maturity distributions for a) male and b) female walleye from the 2014 FWIN survey on ac La Biche.
May 7, 2015 Fall Walleye Index Netting at Lac La Biche, Alberta, 2003
© 2015 Government of Alberta
Page 19 of 22

ESRD/Fall Walleye Index Netting at Lac La Biche, Alberta, 2014
Figure A4. Von Bertanlanffy growth curves for female (Linf=698.6, K=0.234, to=-0.859, and R2=0.97, Prob >0.0001) and male (Linf=662.2, K=0.239, to=-0.876, and R2=0.99, Prob >0.0001) walleye from the Lac La Biche FWIN survey 2014.
May 7, 2015 Fall Walleye Index Netting at Lac La Biche, Alberta, 2003
© 2015 Government of Alberta
Page 20 of 22

ESRD/Fall Walleye Index Netting at Lac La Biche, Alberta, 2014
Figure A5. Northern pike total length frequency distributions from the 2013 and 2014 FWIN surveys on Lac La Biche
Figure A6. Northern pike age frequency distributions from the 2013 and 2014 FWIN surveys on Lac La Biche
May 7, 2015 Fall Walleye Index Netting at Lac La Biche, Alberta, 2003
© 2015 Government of Alberta
Page 21 of 22

ESRD/Fall Walleye Index Netting at Lac La Biche, Alberta, 2014
Figure A7. Yellow perch total length frequency distributions from the 2013 and 2014 FWIN surveys on Lac La Biche
Figure A8. Yellow perch age frequency distributions from the 2013 and 2014 FWIN surveys on Lac La Biche
May 7, 2015 Fall Walleye Index Netting at Lac La Biche, Alberta, 2003
© 2015 Government of Alberta
Page 22 of 22