falmouth wind turbine noise assessment chris menge harris...
TRANSCRIPT

The Biggest Issue Facing Wind Projects in New England:
Noise
Falmouth Wind Turbine Noise Assessment
Chris Menge
Harris Miller Miller & Hanson Inc.

Falmouth Wind Turbine Noise Study
Falmouth, Massachusetts
Christopher Menge
Senior Vice President and Principal Consultant
Harris Miller Miller & Hanson Inc.
Burlington, MA
EBC New England Land-Based Wind Energy Conference
November 22, 2010

Existing Falmouth Wind 1 Turbine
Notus/Webb Turbine Erected May 2010
Falmouth Wind 2 Turbine
Under Construction
Study Area

History
Feasibility study conducted in 2005
No background noise measurements
Projected 42 to 44 dBA @ prop. lines from GE 1.5 or 2.5 MW
No significant noise issues expected
March 2010 Vestas V82 turbine went online and
community complaints started shortly thereafter
Types of audible sound as a source of complaints
Loud “Bong” sound from tower occasionally (later, traced by
Vestas to mis-aligned inertial damper and repaired)
“Swish-swish” sound – lower-wind conditions
“Thumping” sound – high-wind conditions

Commissioned Noise Study
Measurements of existing conditions
Community locations - before, during and after Wind 1 maintenance shut-downs
Reference locations near turbine
Modeling of noise from Wind 1 & Wind 2 operations
Determine existing and future compliance with
Falmouth wind turbine ordinance – 40 dBA limit
Massachusetts DEP noise guidelines:
– Not greater than 10 dBA increase in L90 background noise
– No “pure tone” condition
Community attitudinal survey forms distributed – concurrent with noise measurement survey

Measurement
Sites

Site LT-1, 211 Blacksmith Shop Rd.

Measurement Results at Long-term Sites
Conclusion: Compliant with both Falmouth 40 dBA and Mass DEP
10 dBA increase noise limits
Condition
Median L90 Values (in dBA)
Daytime: 7AM to 6PM Nighttime: 12Mid to 3AM
LT-1 LT-2 LT-1 LT-2
Turbine Running 43 48 37 34
Turbine Shut Down 41.5 46.5 29 30
Increase 1.5 1.5 8 4

Frequency Characteristics and Pure Tone Evaluation
Comparison of Average Octave Band L90 Levels at LT-1: Midnight to 3:00 AM
June 20 with Turbine Running and June 25 with Turbine Shut Down
10
15
20
25
30
35
40
45
50
16Hz 31.5Hz 63Hz 125Hz 250Hz 500Hz 1kHz 2kHz 4kHz 8kHz
Octave Band Center Frequency (Hz)
L9
0 O
cta
ve
Ba
nd
So
un
d
Pre
ss
ure
Le
ve
l (d
B)
Turbine Off 6/25/10 Turbine On 6/20/10

Low-frequency Sound Investigation
LT-1: 10-min L90 Octave Band values 4PM to 5PM on 6/24
Periods starting 4:00 to 4:20 - turbine on; 4:30 to 4:50 - turbine off
20
25
30
35
40
45
50
55
60
31.5Hz 63Hz 125Hz 250Hz 500Hz 1kHz 2kHz 4kHz 8kHz dBA
Octave band center frequency (Hz)
Oc
tav
e b
an
d s
ou
nd
pre
ss
ure
le
ve
l (d
B)
4:00
4:10
4:20
4:30
4:40
4:50

HMMH Reference
Sound Level
Measurements:
Ground-plane
Microphone near
the Turbine

HMMH Reference Sound Level Measurements and
Vestas Reference Data
Comparison of VestasV82 Reference Data and HMMH Measured/Estim. Sound
Power Levels, based on Ground-plane Reference Measurements 6/18 and 6/28
96
97
98
99
100
101
102
103
104
105
106
0 2 4 6 8 10 12 14
Wind Speed at Hub Height (m/s)
So
un
d P
ow
er
Le
ve
l (d
BA
)
VestasV82 Reference
HMMH msmt 30-60 sec avgs 6/18
HMMH msmt 10 min avgs 6/18
HMMH msmt 10 min avgs. 6/28

Model Results – Wind 1 Turbine:
Reference wind speed of 8 m/s at 10m (11 m/s at hub)

Model Results – Wind 1 and Wind 2 Turbines:
Reference wind speed of 8 m/s at 10m (11 m/s at hub)

Turbine Sound Levels Relative to Background at
Wind Speeds other than Reference
Background L90 and Computed Wind-1 Turbine Leq Sound Levels at LT-1
as a Function of Wind Speed
20
25
30
35
40
45
50
0 2 4 6 8 10 12 14 16 18 20
Wind speed at hub height in m/s
A-w
eig
hte
d s
ou
nd
le
ve
l (d
BA
)
Background L90
Turbine Leq

Key Findings – Presented to Falmouth Community
The Town is very concerned about effects of turbines
on neighbors, and interested in hearing ideas
Background sound levels increase with wind speed
Sound from Wind-1 does not cause violations of
MassDEP noise guidelines, but sound levels approach
the 10 dBA increase threshold on Blacksmith Shop Rd.
With both Wind-1 and Wind-2 operating, modeling
predicts no violations at any measurement positions,
but there may be slightly greater than 10 dBA increases
at two homes at the end of Ambleside Drive only:
During early morning hours when background is quietest, and
With wind speeds in the range of 5 to 6 m/s at turbine hub
Key Findings – Presented to Falmouth Community
Nighttime background sound levels with low wind
measured in June 2010 are nearly the same as those
measured in January 2008, suggesting minimal
seasonal variation
Reference measurements suggest the Wind-1 turbine is
operating at or below the manufacturer’s noise specs.

Noise Control Engineering Inc.:
“Amplitude Modulation is the Main Issue”

www.hmmh.com

The Biggest Issue Facing Wind Projects in New England:
Noise
Groton Utility Scale Wind Project
Hot from the NH SEC Hearings
Rob O’Neal Epsilon Associates

The Biggest Issue Facing Wind Projects in New England:
Noise
Lawrence Berkeley Lab’s Study Fox Island Wind Project
Dr. George Baker Island Institute

Wind Resource Characteristics
In New England – What Makes It Different?
Dr. Jim Manwell UMASS Wind Energy Center

Wind Energy Center
University of Massachusetts
23
Wind Resources in New England:
Some Observations Based on a
Review of Recent Data
James F. Manwell, Prof.
Director, Wind Energy Center
Dept. of Mechanical and Industrial Engineering
University of Massachusetts Amherst
November 22, 2010
Environmental Business Council of New England

Wind Energy Center
University of Massachusetts
Outline
• Big picture
• Wind resource in general and New England in
particular
• Sites assessed by UMass WEC
• Summary analysis of WEC sites
• Economics and incentives
• Case study
• Conclusions
24

Wind Energy Center
University of Massachusetts
Big Picture
• Increased use of wind energy is desirable:
– Clean alternative to fossil fuels
– Minimal CO2 emissions
– Opportunities for new industries
– Job creation
• But, in New England:
– Moderate wind resource inland
• Varied terrain
• Heavily forested
– Limited number high wind sites
– High population density
– Vocal opponents
25
Wind Energy Center
University of Massachusetts
Evaluation of Wind Resource
• The wind resource is the “fuel” of wind turbines
• The wind also affects the design of turbines and the
selection of turbines for a site:
– Extreme winds
– Turbulence
26

Wind Energy Center
University of Massachusetts
27
Typical Hourly Average Windspeed, 1 year
0
20
40
60
80
100
1
499
997
1495
1993
2491
2989
3487
3985
4483
4981
5479
5977
6475
6973
7471
7969
8467
Time. Hrs
Win
dsp
ee
d,
mp
h
Wind Variability
•Wind is highly
variable over many
time scales, but its
average (statistically
speaking) behavior is
fortunately much
more predictable
•Actual
measurements are
necessary to quantify
behavior accurately,
however

Wind Energy Center
University of Massachusetts
Factors Affecting Wind Speeds
• Weather patterns
• Height above ground
• Vegetation
• Buildings
• Proximity to coast
• Transition from land to sea
• Topography
28

Wind Energy Center
University of Massachusetts
Effect of Surface (Trees, Buildings, etc.)
• Wind speed is reduced
29
From Wegley et al., 1980

Wind Energy Center
University of Massachusetts
Affect of Topography
• Wind speed may be accelerated by topography
30
From Wegley et al., 1980

Wind Energy Center
University of Massachusetts
Affect of Topography (2)
• Wind shear may be exacerbated
31
From Wegley et al., 1980

Wind Energy Center
University of Massachusetts
32
New England Wind Resource Overview
• In general, wind
speeds in New
England on-shore
are moderate,
except:
– On ridge tops
– Close to coast
– High above
ground level
Source: AWS TrueWind

Wind Energy Center
University of Massachusetts
Wind Resource Monitoring at UMass
• UMass WEC has monitored approx. 100 sites in New
England over recent years:
– Meteorological towers
– Towers of opportunity
– SODAR
• Sound based remote sensing device
– LIDAR
• Laser based remote sensing device
• New techniques for resource assessment
– Statistical models
33

Wind Energy Center
University of Massachusetts
Sites Monitored by UMass WEC
34
Some Sites in N.E. Monitored by
UMass WEC (recent or ongoing)

Wind Energy Center
University of Massachusetts
Meteorological Tower
35
Vinalhaven, ME
Tower installation

Wind Energy Center
University of Massachusetts
Towers of Opportunity
36
Bishop & Clerks,
Nantucket Sound
WBZ tower, Hull

Wind Energy Center
University of Massachusetts
SODAR
37
Thompson Island, Boston Harbor

Wind Energy Center
University of Massachusetts
LIDAR
38
LIDAR at base of
FAA tower, Mt
Tom, Holyoke

Wind Energy Center
University of Massachusetts
Typical Monthly Data
39
(5 m/s reference line)

Wind Energy Center
University of Massachusetts
Analysis of Data
• 43 sites investigated
• Mostly met towers, 50 m or less; some tall towers
40
0
0.2
0.4
0.6
0.8
1
1.2
0 20 40 60 80 100 120 140
Fra
ctio
n o
f si
tes
wit
h g
reate
r d
ata
hei
gh
t
Measurement height, m
Sites Measurement Heights

Wind Energy Center
University of Massachusetts
Summary of Raw Data
41
0
5
10
15
20
25
30
35
40
45
50
0 2 4 6 8 10 12
Fra
ctio
n o
f si
tes
wit
h h
igh
er w
ind
Average wind speed, m/s
Fraction of Sites with Winds Exceeding Value
(raw data)
86% > 5.0 m/s
35% > 6.0 m/s
23% > 6.5 m/s

Wind Energy Center
University of Massachusetts
Site Data Extrapolated to 70 m AGL
42
0
0.2
0.4
0.6
0.8
1
1.2
0 2 4 6 8 10 12
Fra
ctio
n s
ites
wit
h h
gih
er w
ind
Average wind speed, m/s
Fraction of Sites with Winds Exceeding Value
(wind speeds extrapolated to 70 m AGL)
98% > 5 m/s
63% > 6 m/s
35% > 6.5 m/s

Wind Energy Center
University of Massachusetts
Energy Potential
• Estimates were made for each site, using GE 1.5 MW
turbine, extrapolated 70 m AGL wind speeds and
Rayleigh distribution.
43
Observation: minimum acceptable site wind speed
could have significant effect on number of sites
developed and total energy produced
Minimum Wind
Speed, m/s
Total Annual Energy,
MWh
Number of Sites
5.0 m/s 167,000 MWh 42
6.0 m/s 122,000 MWh 27
6.5 m/s 69,000 MWh 15

Wind Energy Center
University of Massachusetts
Wind Energy Economics 101
• Cost of energy (COE, $/kWh) from wind turbines:
• To keep COE low, we need:
– Low capital costs, low O&M, high annual energy
• High average wind speeds high annual energy
• Accessible sites lower capital and O&M costs
44
MOEnergyAnnual
FCRCostsCapitalCOE &
CapitalCost = total cost of wind turbine, $
FCR = fixed charge rate
O&M = operation & maintenance, $/kWh
Wind Energy Center
University of Massachusetts
Wind Energy Economics 101 (2)
• Projects are economic if:
– Cost of Energy < Value of Energy
• Value of energy:
– Value of displaced energy consumed or PPA
– Incentives
• In Massachusetts, the primary incentive is:
– Renewable Energy Credits
45

Wind Energy Center
University of Massachusetts
Alternative Model
• Method developed in Europe, especially Germany
• Stepped, guaranteed rates (Feed-in Tariff, or FIT)
– Simplified process
– Reduced uncertainty
– Reduced transaction costs
– Projects can be developed at lower speed sites
– Excessive profits prevented
– Reduced pressure on “best” sites
– Reduced need for detailed site monitoring
46

Wind Energy Center
University of Massachusetts
Case Study
• Assumptions:
– 43 sites considered for single turbine
– GE 1.5 MW turbine
– Capital cost: $2,000/kW installed (for any site)
– O&M: $0.01/kWh
– FCR: 0.11
– REC’s: $0.053/kWh
– PPA value of energy: $0.05/kWh
– Break-even wind speed (w/RECs) = 6 m/s
– REC’s apply to all kWh produced (6 m/s and above)
– Variable FIT rates so all sites > 5 m/s break even
47

Wind Energy Center
University of Massachusetts
Results
• RECs model:
– 40.5 MW installed (22.5 MW if 6.5 m/s limit used, due to
uncertainty)
– 122,000 MWh/yr (less if uncertainty considered)
– Required subsidy cost: $6,466,000/yr ($0.053/kWh)
• FIT model
– 63 MW installed
– 167,000 MWh/yr
– Required subsidy cost: $6,971,000/yr ($0.042/kWh)
– 37% more wind energy generation for 8% more cost
48

Wind Energy Center
University of Massachusetts
Conclusions
• Overall wind resource in NE is generally understood
• Great variability between sites
• Large effect of topography, surface conditions,
proximity to coast
• Detailed studies required to accurately assess
resource at a given site
• Measurements at hub height reduce uncertainty
• A different incentive model could simplify the siting
process and result in increased wind energy
• Continued data collection (wind data and turbine
power) and more analysis is recommended
49

Lunch Break

Wind Turbines and Public Health
Dr. Robert McCunney
Massachusetts General Hospital

Robert J. McCunney, MD November 22, 2010

Key Issue: Sound and potential health implications
Environmental health studies: evaluate links between an exposure (i.e. NOISE) and a designated health effect

RJM Background
Physician: Internist, board certified in occupational/environmental medicine
Experience with noise and health
Clinical: review audiometric tests of workers
Occupational: set up hearing conservation programs: assess noise levels, determine hearing protection devices to wear, review noise monitoring data and hearing tests
Publications: book chapters
Lecturing: Noise and health

Major exposure concern: Noise, which is
(1) mechanical-from gear box and control mechanisms and
(2) Aerodynamic operation of the blades-major source of WT sound

Loudness-measured in decibels
Pitch-frequency of a sound

Jet Engines 140 Rock Band 110 Tractor/power saw 100 Lawn mower at 3 feet 95 Vacuum cleaner at 3 feet 85 Busy restaurant 78 Speech range: 50-70 Whisper 30 Area near wind turbine (300 meters) 35-45*
Risk of hearing impairment: exposure > 80 dB (A) for many years

Speech frequency 500 Hz -20,000 Hz
Low frequency: 20-250 Hz
Infra sound < 20 Hz
Three kinds of sound emitted by wind turbines that have received some attention are:
1. Infrasound
2. Low frequency sound of approximately 10-200 Hz
3. Fluctuating aerodynamic “swish” from the turbine blades which is in the mid-frequency range, approximately 500-1000 Hz.

Freq
Hz
4 8 10 16 20
Noise
Level
(dB SPL)
107 100 97 88 79

Point: address peer reviewed studies of “wind turbines and health’ via Pub MED (National Library of Medicine) search
Wind Turbines and health:
3 Cross sectional studies of people living in vicinity of wind turbines in the Netherlands and Sweden.

Pedersen, 2009: A sample of 1948 people (among > 70,000 adults) living within 2.5 kM of a wind turbine in the Netherlands
The % of people who reported annoyance from wind turbine sound appeared to lie between aircraft noise and shunting yards
Correlation noted- as in other studies- of a link between attitude towards wind turbines and reporting annoyance

Sound level;
dB(A)
30-35 35-40 40-45 >45
Number
of people
213 159 93 65
Very annoyed 1 (0.5%) 4 (2.5%) 10 (11%) 2 (3%)
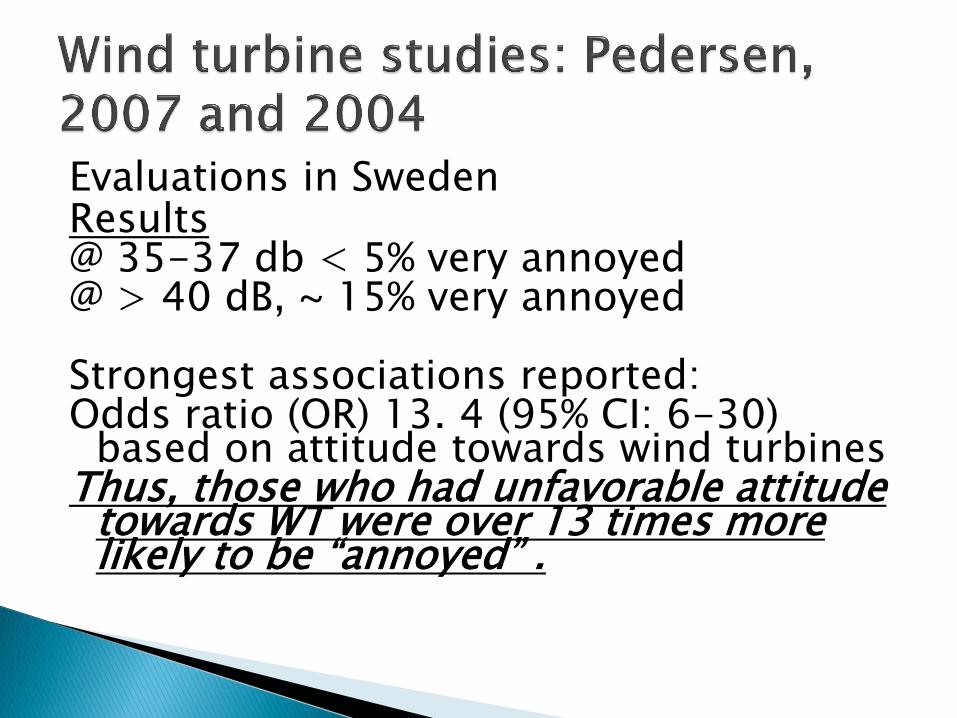
Evaluations in Sweden Results @ 35-37 db < 5% very annoyed @ > 40 dB, ~ 15% very annoyed Strongest associations reported: Odds ratio (OR) 13. 4 (95% CI: 6-30)
based on attitude towards wind turbines Thus, those who had unfavorable attitude
towards WT were over 13 times more likely to be “annoyed” .

A small percentage of people report being very annoyed by the sound from wind turbines at levels < 40 dB
As the noise levels increase, more people report being annoyed
The perception of "annoyance" from the sound of wind turbines is strongly related to attitudes toward wind turbines. The people who are most likely to be "annoyed" are those who do not like wind turbines

No link between LFN from wind turbines and health effects
FDA approves infra sound for therapeutic massage at 70 dB

Sources of infrasound include: cars, road traffic, aircraft, diesel engines, trains, shipping, factories, combustion, artillery, mining and quarrying, refrigerators, household appliances, fans, compressors, pumps, music, TVs, and air conditioning.
Infrasound is ubiquitous in the natural environment from sources like sea waves, air turbulence - even from earthquakes and storms, sometimes thousands of miles away.

Noise measurements in the vicinity of wind turbines

Danish Study 2008
Wind turbines do not emit audible infra sound.
Road traffic emits low frequencies at higher levels.
There is an approximate 5-15 dB (A) attenuation of noise from outdoors to indoors with the windows shut.
The percentage of people annoyed by wind turbine noise at < 40dB (A) is about 5%.

British Study 2006 Low frequency noise associated with road
traffic- greater than neighbouring wind farms
Measurements of infrasound of modern wind farms at distances of 200 meters were between 25 and 40 dB below hearing perception.
The authors also referred to a World Health Organization report: "There is no reliable evidence that infra sounds below the hearing threshold produce physiological or psychological effects.”

Texas Study 2010 15 wind turbines Results: infrasound is inaudible to even the most sensitive
people 305 meters (1,000 feet) from tohe wind turbines. Low frequency sound above 40 Hz may be audible depending on background sound levels
At a distance more than 305 meters (1,000 feet) from the nearest residence, wind turbines do not pose a low frequency noise or infrasound problem.
"At this distance the wind farms met ANSI/ASA S12.2 indoor levels for low frequency sound for bedrooms, classrooms and hospitals ding on background sound levels

Health effects of living in the vicinity of wind turbines and corresponding exposure to low frequency sound have been evaluated in the Netherlands (van den Berg, 2008).
No link between noise levels and risk of diabetes, hypertension, tinnitus and cardiovascular disease was noted.
Illnesses assessed were more common at the lower sound levels than higher sound levels- which indicated no link between noise and the illnesses assessed

In Apollo space program experiments, subjects were exposed to between 120 and 140 dB of LFN without harmful effects.
Modern wind turbines produce sound that is assessed as infrasound at typical levels of 50 to 70 dB, below the hearing threshold at those frequencies (Jakobsen, 2004), who concluded that infrasound from wind turbines does not present a health concern.

Heart tones: 1-2 Hz Lung sounds: 5-35 dB at 150-600 Hz “A few meters from the device, windmill
noise in the infra sound range becomes rapidly inaudible. This infrasound has no effect on human health. Fears regarding windmill-induced infra sound are thus groundless. Infrasound production by windmills has been well studied and the levels are without risk to humans."
French National Academy of Medicine, 2006

Research with low frequencies has shown that an audible low frequency sound does not normally become objectionable until it is 10 to 15 dB above hearing threshold (Inukai et al., 2000; Yamada, 1983).

“Responses of the ear to low frequency sounds, infrasound and wind turbines”
Alec N. Salt*, Timothy E. Hullar
Hearing Research 2010; 268: 12-21

Abstract Infrasonic sounds are generated internally
in the body (by respiration, heartbeat, coughing, etc) and by external sources, such as air conditioning systems, inside vehicles, some industrial processes and, now becoming increasingly prevalent, wind turbines.
It is widely assumed that infrasound presented at an amplitude below what is audible has no influence on the ear.

Conclusions
“The fact that some inner ear components (such as the OHC) may respond to infrasound at the frequencies and levels generated by wind turbines does not necessarily mean that they will be perceived or disturb function in any way. “ (Salt et al, 2010)
“We realize that some individuals (such as fighter pilots) can be exposed to far higher levels of infrasound without undue adverse effects. “ (Salt et al, 2010)

Studies based on guinea pigs
No mention of background infra sound
In all mammals, one of the limits of low-frequency hearing is the helicotrema (the gap in the basilar membrane that connects the scala tympani and scala vestibuli).
The helicotrema acts as a high-pass filter; the larger the helicotrema, the greater low-frequency sound is shunted away from hair cells.
The guinea pig has a very small helicotrema (only 7% of the area of the human helicotrema) and therefore unusually good low-frequency
Whatever Alec Salt et al find in guinea pigs may not be true for humans, and at the very least would be quantitatively less significant in humans.

Hypothesis: low frequency sound and corresponding vibration adversely affects health
As of 11/15/10 not published in peer reviewed scientific journal (PubMed search)
not a recognized diagnosis in the medical community.
no unique symptoms or combination thereof that would lead to a specific “disease”.
Symptoms in some people in the context of exposure to wind turbines are likely associated with annoyance

Low-level sounds from outside the body do not cause a high enough excitation within the body to exceed the internal body sounds
The similarity between symptoms of noise annoyance and those of the "Wind Turbine Syndrome" indicates that this "diagnosis" is not a pathophysiological effect, but an example of the well-known stress effects of exposure to noise-virtually any type- displayed by a small proportion of the population.

1. Noise from wind turbines does NOT pose a risk of hearing loss or any other direct adverse health effect.
2. Some people may become annoyed from the sound from wind turbines but this is not a disease. At times, annoyance from noise can lead to sleep disturbance.
3. The major cause of concern from wind turbines is
the fluctuating nature of the sound. Some find this noise annoying, a reaction that depends primarily on personal characteristics as opposed to the intensity of the noise level.

4. Sub audible low frequency noise and infra
sound from wind turbines do not present adverse health risks.
5. Wind Turbine Syndrome is neither a new
disease or accepted medical diagnosis. Symptoms reflect noise annoyance.
6. Noise modeling in Bourne indicates
compliance with Mass regulations and no corresponding health risk

Development in New Hampshire,
Vermont and Connecticut
Susan Geiger Orr & Reno

Wind Energy Development
in New Hampshire
Susan Geiger
Rachel Aslin Goldwasser
www.orr-reno.com One Eagle Square Concord, NH 03301 603.224.2381
November 22, 2010
Environmental Business Council New England Land-Based Wind Energy Conference

85
NH Siting: Jurisdiction
NH Site Evaluation Committee:
“One Stop” Permitting for utility scale projects (30 MW or more)
Large Scale (100 kW to 30 MW) – can petition SEC for jurisdiction over projects less than 30 MW; SEC process trumps local zoning
Local Approvals & Individual State Permits:
Large scale (100 kW to 30 MW)
Small Wind Energy Systems (up to 100 kW)
www.orr-reno.com

86
Siting: Local Approval
Met Tower Permitting
PILOT & Other Agreements (e.g.
decommissioning, fire protection, road
use, noise, setbacks, etc.)
Petitions to the Site Evaluation
Committee
Expertise and ability to address utility-
scale wind projects
www.orr-reno.com

87
Siting: SEC Process
Information required under SEC rules:
Application, prefiled testimony, expert reports & exhibits
Prehearing conference
Develop procedural schedule by consensus
Public information hearings held in community
View/Site visits
Discovery
Data requests
Technical sessions
Supplemental Filings
Adjudicative Hearings
Post-hearing briefs
www.orr-reno.com

88
Siting: SEC Findings
Applicant has adequate financial, technical, and managerial capability to assure construction and operation of the facility
Project is consistent with orderly development of the region
• Must consider views of municipal and regional planning commissions and municipal governing bodies
Project will not have an unreasonable adverse effect on:
• aesthetics,
• historic sites,
• air and water quality,
• the natural environment, and
• public health and safety
www.orr-reno.com

89
Siting: SEC Findings
Certificate can include additional terms • E.g., monitoring procedures
• Conditioned on completion of federal and state
agency studies
Appeals go directly to the New
Hampshire Supreme Court
www.orr-reno.com

90
Wind Projects in
New Hampshire
Lempster Wind
Granite Reliable Power
Groton Wind
www.orr-reno.com

91
Lempster Petitioned into SEC Process
No local zoning; citizens concerned about lack of input/process for evaluation of project
Issues Committee: stormwater runoff (25 year storm event);
noise (established more stringent requirements than agreement with Town)
Intervenors: Ice throw, shadow flicker, sufficiency of avian and bat studies (agreement reached with Public Counsel)
Interconnection line aesthetics in Town of Goshen (Settlement with Goshen to avoid Supreme Court appeal)
Support from locals continues to today
www.orr-reno.com

92
Granite Reliable Power
Major Issues Financial health of developer
• Decommissioning (County Agreement)
Wetlands (Public Counsel hired wetlands experts)
High elevation habitat (above ~2700‟) • NH Fish and Game intervened – pine marten
• Appalachian Mountain Club – birds, bats
• Settlement with Fish & Game and AMC (conservation of 1735 acres above 2700‟, $200,000 to Fish & Game for studies on American marten and Bicknell‟s thrush; $750,000 to Fish & Game for permanent conservation of comparable habitat elsewhere)
www.orr-reno.com

93
Groton Wind
Issues
Noise (Public Counsel hired noise expert)
Property Values (Intervenors hired property
value witness)
Whether additional process is needed to
deal with alternate/revised interconnection
route, lack of reports from ISO-NE on
feasibility & system impact, & very recent
correspondence from Division of Historical
Resources
www.orr-reno.com

94
QUESTIONS?
Contact info:
• Susan Geiger
• (603)223-9154
• Rachel Aslin Goldwasser
• (603)223-9163
www.orr-reno.com

Development in New Hampshire, Vermont and Connecticut
Martha Staskus Vermont Environmental
Research Associates

Environmental Business Council
New England
Land-Based Wind Energy Conference
November 22, 2010
Martha Staskus
Vermont Environmental
Research Associates, Inc.
(VERA)
Waterbury Center, VT
Where Vermont’s wind turbines stand
96

• VERA
• Projects Summary
• Vermont State Goals
• Perspective
97
Overview
Wind Systems magazine Sept 2010 cover
www.northeastwind.com

VERA (Vermont Environmental Research Associates)
Clients: Landowners New England Utilities National & Regional Developers State Agencies
Some New England Projects: Georgia Mountain Wind Kingdom Community Wind Deerfield Wind Searsburg Wind Facility Granite Reliable Power Hoosac Wind Mt. Tom
98
www.northeastwind.com

What VERA Does
Land acquisition
Project Management
Wind site selection
Wind data processing
Environmental data collection
Project designs
Financial analyses
Development / Permitting
Performance monitoring
Outreach

Where are the turbines ??
1
1. Searsburg
2 2. Sheffield
3
3. Readsboro/Searsburg
(Deerfield Wind)
4
4. Georgia/Milton
(Georgia Mountain Community Wind)
5
5. Lowell
(Kingdom Community Wind )
7
7. Manchester (Mt Equinox)
100
8
8. Rutland County (Grandpa’s Knob
9
9. Ira/Poultney/West Rutland
(Vermont Community Wind)
10
10. Northfield Ridge
6
6. East Haven
www.northeastwind.com

July, 1997 On-Line
Eleven 550 kW turbines (6 MW)
Meets the needs of ~ 1,600 average VT households
Valuable educational resource for schools and interested parties
Searsburg Wind Facility
101
www.northeastwind.com

Sheffield Wind
September 2010 - Under Construction
Sixteen 2.5 MW wind turbines (40 MW)
Meet the needs of ~ 16,000 Vermont households
The town benefits $500,000+ annually
VEC, WEC and BED customers benefit
Landworks Photosimulation 102
www.northeastwind.com

Deerfield Wind
Construction scheduled for 2011 2nd Quarter
Fifteen 2 MW wind turbines (30 MW)
Meets the needs of ~ 14,000 Vermont households
CVPS customers benefit
VERA Photosimulation
103
www.northeastwind.com

Georgia Mountain Community Wind
Construction scheduled for 2011
Four 2.75 MW wind turbines (11 MW)
Meets the needs of ~ 4,200 Vermont households
Vermont family is Landowner/Developer
VERA Photosimulation
The Harrison Family
104 www.northeastwind.com

Kingdom Community Wind
Schedule: Spring 2011 CPG; Dec. 2012 Online
Up to Twenty One 3.0 MW turbines (63 MW)
Meets the needs of ~ 20,000 Vermont households
Lowell and surrounding towns receive direct financial benefit as well as GMP & VEC customers
VERA Photosimulation
105
www.northeastwind.com

Other Wind Activities…
Eight 3MW turbines (24 MW)
~70,000 MWh
Meets the equivalent needs of
~ the Town of Manchester
Identifying local customers for
long-term, low cost power
exchange.
Grandpa’s Knob Acquired December 2009
~20 wind turbines (50 MW)
40MW = 117,000MWh per year
Vermont Community Wind Enel on board September 2009
Currently „on the list of
potential opportunities‟
Northfield Ridge Citizens Energy is reaching out
Vermonters to learn level of
interest and see if it makes
sense to consider. 106 www.northeastwind.com

‘Made in Vermont’
Lake Champlain Ferry South Hero & Burke Mountain are currently
before the Public Service Board
Bolton Ski Area Heritage Aviation
Dynapower
107 www.northeastwind.com

Policy Message
Vermont‟s renewable goals:
Utilities meet new electrical growth with new
renewable resources.
25% VT‟s energy with renewable sources by 2025
Production based taxing
Net metering up to 250 kw
20% of electric usage to be from
in-state, renewable energy by 2017
Standard offer rates of renewables
set for long term
10
8 www.northeastwind.com

Over
The 5% goal EXCEEDED with
Operating and Active Development
Wind Power is over 78 % of that goal !!
WIND makes up
13.6 MW of Standard Offer Applications
Another 7.2 MW waiting
109 www.northeastwind.com
SPEED goals
5% of Vermont's 2005 Load be
SPEED resources

20% Is Coming
0%
10%
20%
30%
40%
50%
60%
70%
80%
90%
100%
MW
????
Under Consideration
SPEED Projects
Kingdom C.W.
Georgia Mtn
Deerfield
Sheffield
Searsburg
110
83%
www.northeastwind.com

111
Thank you !
Martha Staskus
VERA
Simulated wind turbines behind
Vermont’s Statehouse
www.northeastwind.com

Development in New Hampshire, Vermont and Connecticut
Paul Corey BNE Energy

Networking Break

Developers Roundtable
Moderated by
: Ruth Silman Nixon Peabody LLP
Will Havemeyer, First Wind Randy Male, Citizens Energy Mark Lyons, Iberdrola Renewable Rod Jane, New England Expansion Strategies

EBC Site Remediation Program
Hot Topics in Environmental
Due Diligence