fame and the fortune of academic economists: …economic/seminars/ransom_fame.pdffame and the...
TRANSCRIPT

Fame and the Fortune of Academic Economists:
How the market rewards influential research in economics*
Christiana E. Hilmer
San Diego State University
Department of Economics
5500 Campanile Drive
San Diego, CA 92182
Michael J. Hilmer
San Diego State University
Department of Economics
5500 Campanile Drive
San Diego, CA 92182
Michael R Ransom
Brigham Young University
Department of Economics
130 FOB
Provo, Utah 84602
October, 2011
We thank James Wood for helpful research assistance.

2
Abstract
We analyze the pay and position of 1,009 faculty members who teach in doctoral-granting economics
departments at fifty-three large public universities in the United States. Using the Web of Science, we
have identified the journal articles published by these scholars and the number of times each of these
articles has been subsequently cited in published research articles. We find that research influence, as
measured using publication counts or the Hirsch index, is a surprisingly strong predictor of the salary
and the prestige of the department in which they are employed. The Hirsch index alone explains more
than 50 percent of the variation in log salaries across individuals in a bivariate regression. We also
examine the degree to which coauthorship is discounted by the market. For salaries, the evidence is
quite clear that the market values citations to articles with multiple coauthors the same as citations to
single-authored articles. On the other hand, the rank of the department at which one is employed is
best explained by per capita citations.

3
I. Introduction
A primary responsibility of professors at research universities is to produce new and useful
knowledge. In a world where universities compete for the best researchers, we expect that those
whose work is most important or influential will be able to command the highest salaries and that they
will find employment at the best universities, where their skills will be most valued.
Labor economists who study the academic labor market have long been interested in the
question of how to best measure the influence of an individual’s research. Most early attempts to
identify the effect of research quality measured this simply by counting the number of publications,
perhaps distinguishing by type, such as in Tuckman and Leahy (1975) or Tuckman, Gapinski and
Hagemann (1977). Later refinements examined whether publications in more prestigious journals
counted more in the academic labor market, as in Siegfried and White(1973) or Katz (1973).
The advent of citations databases, especially the Social Sciences Citation Index (SSCI) and the
Science Citation Index (SCI), has made it possible to use citation counts as a way to measure the
influence of an article or its author. Perhaps the first of these was Holtmann and Bayer (1970) who
studied young PhDs in the natural sciences, using a count of citations in the Science Citation Index as
one of several determinants of salary. An influential early paper that studied the pay of economists was
Hamermesh, Johnson and Weisbrod (1982). Others who have used citation counts to explain academic
salaries are Bratsberg, Ragan and Warren (2010), Sauer (1988), Moore, Newman and Turnbull (2001),
Diamond (1986). All of these articles find that citations substantially influence salaries.
Two recent articles have much in common with our work here. Hamermesh and Pfann (2011)
(HP) use total citation counts from the SSCI to explain a variety of outcomes for a sample of full
professors at 88 US economics departments. These outcomes include whether a professor was elected
a Fellow of the Econometric Society, the prestige of the department at which the professor works, as
well as the professor’s salary. Hamermesh and Pfann pose the question in terms of quantity and quality
4
of publications—with quantity measured by the number of articles published, and quality being
measured by the number of citations to those articles. Generally, they find that citations are an
important determinant of “reputation” while numbers of publications are not. However, salary is
apparently determined by both the quantity and quality of publications. Ellison (2010) uses citations
from Google Scholar. He analyzes a sample of “young tenured economists” at the top 25 US economics
departments, and explains the rank of an individual’s department using that individual’s Hirsch index as
an explanatory variable. (We discuss the Hirsch index in detail below.) He finds that the Hirsch index
(or some generalization of it) provides a better fit to the data than traditional citation counts.
In this paper, we undertake analyses similar to those described in HP and Ellison. That is, we
explore how an individual’s citations history affects that individual’s pay and position. Our approach
differs most markedly in that we analyze all faculty members, not just full professors or tenured
professors. We also have a somewhat larger and more consistent sample than H&P. Our sample also
better represents the spectrum of quality of economics departments in the US, ranging from rank 104 to
rank 7 according to the 1995 National Research Council rankings.
II. On Measuring “Influence”
Are citations the right way to measure the influence of someone’s research? Posner (2000)
describes a variety of reasons why an author would cite someone else’s work. He asserts that the
majority of citation in science and social science is to recognize the “priority” of the cited author’s
method, discovery, argument or way of describing something. Citations of this sort are exactly what we
mean by influence in social science. In some cases, this influence may actually be negative. We might
write an article to refute the article that we are citing, for example. Still, we have been influenced to
think about the idea. Such controversy has an important role in science.
5
On the other hand, citations may be motivated for strategic reasons that have nothing to do
with the influence of the article that is cited. An author might want to flatter a potential referee or
editor, for example. Cole (2000) discusses some other aspects of the controversy with using citations to
measure impact.
Despite potential limitations, the use of citations to measure the importance or influence of an
article is now widely accepted. Furthermore, it has been shown to be a powerful source for explaining
things like salaries.
III. Data
A. Salary and Biographical Data
Because individual salary information is rather difficult to come by, previous studies of salary
determination in the profession have relied on fairly limited samples. Among recent examples,
Bratsberg, Ragan, and Warren (2003) analyze panel data on 176 tenure-track faculty at five identified
Midwestern universities while Moore, Turnbull, and Newman (1998) analyze cross-sectional data on 142
tenure-track faculty at nine unidentified state universities. According to the authors themselves, the
universities in both of those studies could be considered mid-level and thus as noted in Moore, Turnbull,
and Newman “one should not infer that our empirical results generalize to the Top 20 programs.” This
is unfortunate, as salary determination within the profession can, and perhaps even likely, does differ
across the program quality distribution and by repeated moving/staying decisions.
Beyond the legwork involved, there is little to prevent a researcher from compiling a much more
sizable and detailed faculty salary data set that enables comparisons across the program quality
distribution while providing more extensive individual-level information. The 1966 Freedom of
Information Act (FOIA) gave citizens the power to request a substantial amount of information from
federal government files. While the law did not apply to state governments, most states have since

6
enacted their own FOIA policies that enable citizens to request state government records. As such, it
should be possible to compile faculty salary data on the vast majority of public universities in the U.S.
Because our focus is Ph.D.-granting programs, in August 2007 we began requesting salary data for
faculty members at the 68 public programs listed among the 1995 NRC Rankings of the top 106 U.S.
Ph.D.-granting economics programs. In response, we received reliable current salary information from
the 53 programs listed in table 1. As indicated there, our current sample reflects a much more complete
cross-section of the profession than those analyzed in previous studies and the current sample of 1,009
individuals (excluding those with administration appointments) for whom we can collect sufficient
individual background characteristics is a vast improvement on the samples previously studied.1
To these data we added biographical details that we collected from on-line CVs and biographies,
including their academic rank, the date of hire at their current institution, the year in which they earned
the Ph. D., and their sex.
B. Publications and Citations Data
We collected all the information on publications and their citations through the end of 2006
from the Web of Science, an online database that is owned by Thompson Reuters. We identified all the
listed publications in the Web of Science for each of the individuals in our salary sample, using the
search tools available. This is a labor-intensive undertaking, as we must separate the publications of
individuals who have similar names. For most entries in WOS, the name is listed by last name and
initials of given names. For individuals like Daniel Hamermesh, there is no confusion. On the other
hand, we had to distinguish between well known economists James C. Cox (who is in our sample) and
1 Our sample is quite comparable to that used by Hamermesh and Pfann (2011). For their salary analysis, they
collected data from 43 public institutions, mostly for the 2007-2008 academic year. However, for some of the
schools in their sample, they used data from other years, inflating or deflating by a factor of 1.04 for each year.
Furthermore, they collect information only for full professors. In the end, they have a sample of 564 professors
with salary data. Our sample contains 570 full professors.

7
John C. Cox (who is not). We did this by comparing CVs with the list of articles in our WOS search result,
and restricting search on the basis of known affiliations during the professor’s career. We also
examined our resulting list of publications on the basis of field, journal titles, and article titles. There is
the potential for errors of both inclusion and exclusion.
The Web of Science consists of three datasets --Science Citation Index-Expanded, Social Science
Citations Index, and Arts and Humanities Citation Index. These datasets contain articles published in a
large but select set of journals. Many journals indexed in EconLit, for example, are not indexed in SSCI. 2
However, all of the established economics journals are included, and it is unlikely that we have
understated the influence of an individual’s contributions by much.
Books or chapters in books are not included. However, we have included all types of entries in
WOS. While we refer to them as articles, in some cases these are items such as editorials, editorial
introductions to special issues, book reviews, or conference proceedings. We collected information
from all three of the datasets. Although the bulk of articles by economists in our sample is in journals
indexed by SSCI, some important work by economists appears in the sciences or engineering journals.
For example, the second most cited article in our sample is a paper by Hal White that appears in Neural
Networks, a journal that is indexed in SCI but not in SSCI. (The article had more than 2,500 citations
through 2006.)
Tables 2 and 3 provide summary information about the underlying articles that are used in our
sample. These tables examine only unique articles—articles may be used multiple times to compute
individual cumulative citations in our sample if more than one of the coauthors of the paper is in our
2 See Garfield (1990) for a discussion of how journals are selected for inclusion in the Web of Science databases.
Klein and Chiang (2004) argue that there is an ideological bias in the selection of journals to the SSCI.

8
sample. Publication years range from 1956 to 2006, but the vast majority of the articles were published
after 1980. There are on average 1.8 authors per article, with maximum number of 16.3
The average number of citations for these articles is 12.84, but total citations are extremely
skewed in distribution, as shown in Table 3. The median article had only 3 citations. More than 30
percent of articles are not cited at all. In part this can be explained by the fact that some of the entries
are short book reviews and introductions to special issues or the like, and the author would not have
expected them to be cited. On the other hand, a book review could be quite influential, so we have not
excluded these ex ante. Another reason that some are not cited is because they are too recently
published. Sadly, this does not make a huge difference. For articles at least six years old, more than 25
percent have not been cited. A simple linear regression with intercept yields a slope estimate of about
0.5. The median article is cited about once every four years. Relatively speaking, an article that has
been cited 10 times is very successful, and one that has been cited more than 50 times is outstanding.
(Roughly, the single most cited article has more total citations than the least cited 9,000 articles.)
The standard citations database is the Web of Science, parts of which have existed since the
1960s. However, alternatives have started to appear. One is Google Scholar, an online service created
by the web search giant. It uses robot search programs to identify scholarly work that is available on the
web and to collect citations data from it. The advantage of Google Scholar is that it defines influence
more broadly—its sources include working papers and books, as well as published articles in journals.
Potentially, it indexes more journals than Web of Science, as well. The disadvantage is that it is hard to
know exactly what its universe is. Exactly which articles are indexed? How does it treat multiple
versions of a working paper, some of which will undoubtedly have different titles? Should citations by
papers that will never be published be counted equally with those that are published after peer review?
3 While a few entries in the WOS for our professors had more than 16 authors, we determined that these were all
entries such as conference reports that listed all attendees, or letters to the editor with all signatories listed as
authors. We therefore eliminated these entries from our sample.

9
A casual comparison of several articles suggests that Google Scholar provide 2 to 10 times more
citations.
SCOPUS is another online research service operated by the publisher Elsevier that may have
citations capability. RePec (Research Papers in Economics) is set of online databases and programs that
is mostly volunteer effort. As it uses authors to identify their own paper, it has the potential to be very
accurate. It focuses on economics articles, only. At this time, its coverage is not complete enough to do
the sort of analysis presented here.
C. Aggregate Citations and the Hirsch Index
The typical way to aggregate citation counts to articles is to simply sum the citation counts of all
the articles that an individual has written. However, because this aggregate citation count is highly
skewed, and because a single article typically contributes a large part the total, it is sensible to
summarize an individual’s citation record in a way that somehow reduces the impacts of articles in the
upper tail. We have adopted two approaches. The first is the logarithm of the aggregate citations plus
one. (Adding one is necessary because a significant number of those in our sample have no citations.)
The second method we use is to compute the Hirsch index (or h-index) for each individual.
The h-index has been suggested as a “particularly simple and useful way to characterize the
scientific output of a researcher.” (Hirsch, 2005) Consider a researcher who has N publications. If h of
those publications have been cited at least h times, while the other N-h publications have been cited
less than h times, then he or she has an index value of h. An intuitive way to think of this index is that it
is a count of the number of “important” papers, where the level of importance increases with the
number of papers. Thus someone with an h value of 5 has 5 papers of relatively little impact, while
someone with an h of 30 has 30 papers of very high impact. (Recall that a paper with 30 citations is at
the 90th percentile of the papers in our sample.) Ellison (2010) has suggested a generalization of Hirsch’s

10
index, the h(a,b) index, where h(a,b) is defined as the researcher as at least h papers with ahb citations.
He suggest h(5,2) as particularly useful, although he analyzes senior researchers at only the top
programs (highly cited and many papers), using Google Scholar citation counts (which are much higher
than WOS counts). We find that the h(5,2) index does a poorer job than the h index of describing
scholarly influence of researchers across the entire spectrum of economics graduate programs.
D. Coauthorship
A frequent question that arises in this literature is how to treat coauthored papers. Two obvious
solutions are (1) to ignore coauthors completely, giving each coauthor full credit for each paper or
citation, or (2) to divide the number of citations (or the number of articles) by the number of coauthors.
(Citations needed.) An intermediate approach, suggested by Ellison (2010) and [Need reference] is to
weight each citation or publication by 1/Nc , where c is some number between 0 and 1, 0 and 1
representing the extremes just mentioned. Potentially, c is a parameter that could be estimated. We
explore this in some of our specifications below. For the h index, Ellison adopts a fractional counting
method suggested by Egghe (2008). We, too, adopt this suggestion in some of our analyses.
E. Summary Statistics
Table 4 presents summary statistics for the data we use in our analysis. Salaries range from
$60,000 to $342,000, with a mean of about $122,000. The average professor in our sample has about
20 years of experience and about 16 years of seniority at his or her current institution. He or she has
written on average about 21 paper that have 275 cumulative citations. This falls to 172 in terms of
citations per author reflecting the fact that coauthorship is common in our sample. The Hirsch index (h)
varies from 0 to 31, with a mean of 6. The average professor in our sample has published 21 articles,

11
with 2.63 in the best journals, 7.05 in the second tier, and 11.4 in lesser journals (or in our case, in
journals outside of the economics field).4
Table 5 presents more detail about the distributions of our citations variables. The median
professor has an h-index of 5. This falls to 4 when adjusted for coauthorship. An h value of 10 puts an
author in the upper quartile. A value of 20 places him or her among the elite.
The h(5,2) index suggested by Hirsch varies little in our sample—55 percent have a value of 0 or
1, so it will be difficult to explain variations in salaries in this sample using that variant of the Hirsh index.
As expected, the cumulative citations distribution is highly skewed, with a mean of 275 and a
median of 76. A professor with 300 citations is near the 75th percentile. Someone with 1000 cumulative
citations is close to the 95th percentile. The highest ranked professor has over 10,000 cumulative
citations through 2006.
IV. Results—Salaries
Table 6 summarizes results of our regression analyses of faculty salaries. A surprising result is
that the h index (and its square) alone explain more than 52 percent of the variation in log salary in our
sample, as shown in column 1. The h index increases with the length of career, both because the
number of articles cited may increase, and also because existing articles acquire more citations, too.
The marginal effect of h decreases as h increases, becoming negative for h values greater than 22 to 32,
depending on the specification.
Column 2 adds basic demographic variables to the model. These explain a small fraction of the
residual unexplained variance, but they statistically important. Salaries grow modestly with experience,
even after controlling for citations. Individuals who have not changed employers during their careers
4 We adopt the journal tiers of Scott and Mitias (1996). The elite journals are American Economic Review,
Econometrica, Journal of Political Economy, Quarterly Journal of Economics, and Review of Economics and
Statistics. Another 31 economics journals comprise the “excellent” group here.

12
have much lower salaries than those who have moved. This result was first emphasized in Ransom
(1993) and has been studied (and reconfirmed) in numerous subsequent articles, including Bratsberg,
Ragan and Warren (2010), Bratsberg, Ragan and Warren (2003), Monks and Robinson (2001), Barbezat
and Donihue (1998), and Moore, Newman and Turnbull (1998). There is no statistically significant
difference in pay between men and women in our sample after controlling for the value of h.
Column 3 includes measures of publication activity. Even after measuring the impact of
publications, the number of publications has some impact on salaries, at least when the articles are
published in the best journals. Ten “elite” publications would add about 12 percent to an individual’s
salary, on top of the rewards for the citations to those articles.
Columns 4 through 6 repeat the analysis of the first three columns, but uses log(cumulative
citations + 1) as the explanatory variable. The results are qualitatively similar. However, the h index fits
the data better.
We repeat using citation measures that have been adjusted for coauthorship. An author
receives 1/N citations for each citation to a paper with N authors. For computing the h index, this
corresponds to Egghe’s (2008) “fractional citation counts” method. Again, the results are qualitatively
similar.
For both the h index (columns 1-3) and the log citations (columns 4-6) approaches, the
unadjusted citations variables have more explanatory power. Is this difference in fit statistically
significant? One way to approach this question is to consider a more general model, where each
citation is adjusted by 1/Nc. That is, the citation to a paper with two authors would be counted as 1/2c,
where c is some number between 0 and 1. If c=0, our results are those in Table 6. If c=1, our results are
those in Table 7. We could imagine estimating c from our data. This turns out to be a very cumbersome
enterprise, especially for the h-index. However, imagine that we did such estimation using a maximum
likelihood approach. We could then test whether coauthored papers were fully discounted using a

13
likelihood ratio test, by comparing the values of the log likelihood from the results in Table 7 with the
maximized log likelihood value. A conservative version of this test, then, is to compare the log likelihood
values that we get from our estimates in Table 6, which will be less than or equal to the log likelihood for
the maximizing value of c. Table 8a presents the result of this comparison for the h index. Compared to
a chi-squared with one degree of freedom, this “test statistic” is very large, which would lead us to
reject to hypothesis of full discounting of citations to coauthored articles.
The same exercise for the log citations variable is presented in Table 8b, with a wider variety of
values for c. In this case, it is clear that the value of the likelihood function is decreasing as c increases,
and that the best estimate is a value of 0, as in the previous case. The differences in the log likelihood
function are statistically large. Our salary data are best described by the hypothesis that coauthored
papers receive the same weight as single-authored papers. We can certainly reject the hypothesis of full
discounting.
V. Results—Departmental Rank
The prestige of an economics department depends to a large extent (perhaps only) on the
reputation of its faculty members. This is apparent in Figure 1, which is a box/whisker plot showing the
distribution of log(cumulative citations+1) for faculty in each department in our sample, arrayed
according to the 1995 National Research Council rankings of the departments. (This plot shows only
faculty members whose PhD degree was earned before 1999, as most young faculty members have not
had a chance to accumulate many citations.) The distributions shown in this figure presumably reflect
the standards that each of these departments has with respect to hiring and granting tenure.
One way that publishing important articles can influence a professor’s career is by creating
opportunities for him or her to work at a more prestigious school. We explore this question by
examining the rank of hiring department for all those in our sample who were hired during the period

14
1993-2006. We restrict our analysis to those hired after 1993 because we want to avoid any influence
the professor’s own publication record may have had on the 1995 rankings. The results of this analysis
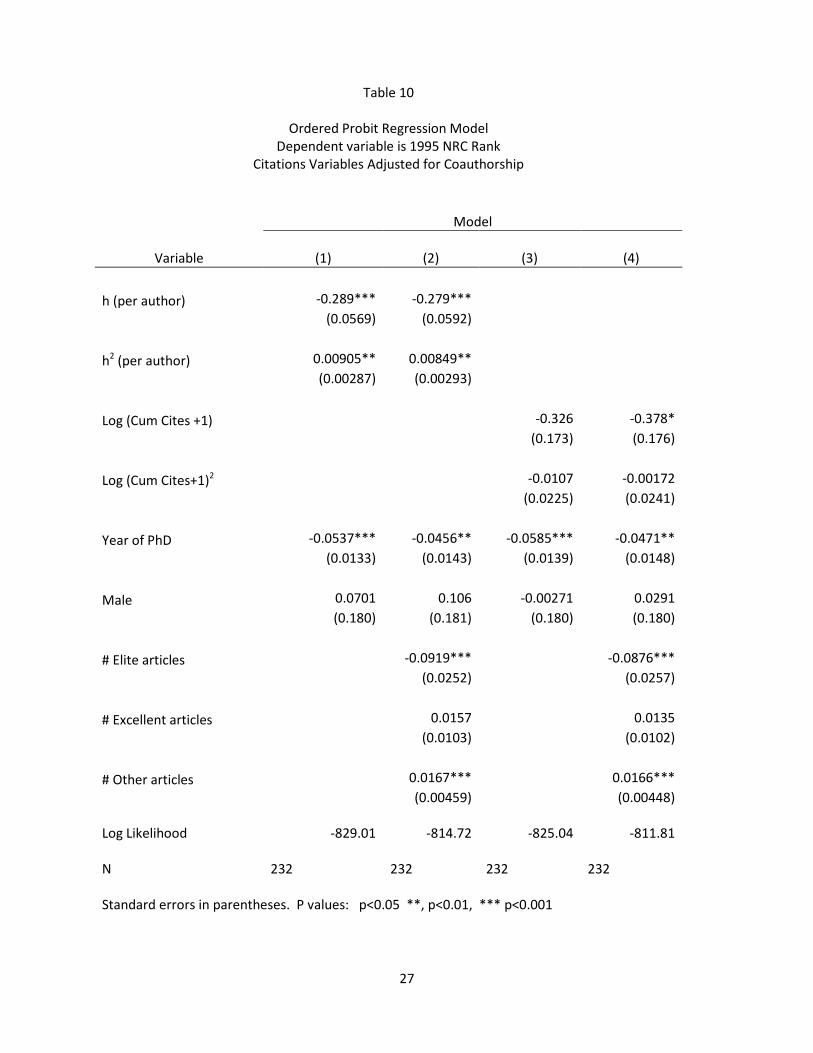
are found in Tables 9 and 10—Table 9 reports the results for citation variables that have not been
adjusted for coauthorship, while Table 10 reports results for citation variables that have been fully
adjusted for coauthorship. The results are not surprising. High h indexes are associated with
appointments at more prestigious (lower rank) departments. The marginal effect of a higher h index is
decreasing, however, as we saw in the salary regressions. We have included PhD to allow time for
mobility—it may take time for a productive researcher to move to a better department. However, the
net effect we observe is that newer PhDs are appointed to better departments, holding constant the h
index or log total citations. There is essentially no sex difference in placement after controlling for other
factors. Elite publications help, lesser publications either do not matter (in the case of “excellent
articles,” or they hurt (in the case of “other” articles.)
Our analysis of coauthorship in the case of department rank is quite different than what we
found for salaries. Using the same arguments that we used there, it is clear that per capita citations
provide a much better fit for the model, and we can clearly reject statistically coauthored are treated
the same as single-authored papers.
VI. Conclusions
Influential publications are highly rewarded in academic economics. Both in terms of where an
individual works and how much salary he or she earns, the influence of the individual’s publications (as
measured by citations) is a dominant factor. In fact, the Hirsch index alone explains more than 50
percent of the variation in log salaries for our sample. In terms of salary, publication counts help, even
after counting citations, but it is mostly only articles in the elite journals that have much impact on pay.
Surprisingly, it appears that sharing fame is costless—a model in which an author gets full credit for

15
citations to coauthored publications fits the data much better than per capita citation counts. We find
significant rewards, in terms of salary, for moving between employers during one’s career.
The rank of the department at which established researchers are appointed is also strongly
related to an individual’s citations history. Once we control for citations, additional publications actually
hurt, except for those in the elite journals. In contrast to the case of salaries, for explaining the rank of
an individual’s departmental, per capita citations are provide a much better fit. Apparently, department
chairmen and deans only know how to count. Hiring committees also know how to divide!

16
References
Barbezat, D. A. and M. R. Donihue (1998). "Do faculty salaries rise with job seniority?" Economics Letters
58(2): 239-244.
Black, D. A. and M. A. Loewenstein (1991). Self-Enforcing Labor Contracts with Costly Mobility. Research
in Labor Economics. R. G. Ehrenberg. London, JAI Press. 12.
Bratsberg, B., J. F. Ragan, et al. (2003). "Negative returns to seniority: New evidence in academic
markets." Industrial & Labor Relations Review 56(2): 306-323.
Bratsberg, B., J. F. Ragan, Jr., et al. (2010). "Does Raiding Explain the Negative Returns to Faculty
Seniority?" Economic Inquiry 48(3): 704-721.
Cole, J. (2000). A Short History of the Use of Citations as a Measure of the Impact of Scientific and
Scholarly Work. The Web of Knowledge: A Festschrift in Honor of Eugene Garfield. B. Cronin and H. B.
Atkins. Medford, NJ, Information Today, Inc.
Diamond, A. M., Jr. (1986). "What is a Citation Worth?" The Journal of Human Resources 21(2): 200-215.
Egghe, L. (2008). "Mathematical Theory of the h- and g-Index in Case of Fractional Counting of
Authorship." Journal of the American Society for Information Science and Technology 59(10): 1608-
1616.
Ellison, G. (2010). How Does the Market use Citation Data? The Hirsch Index in Economics. NBER
Working Paper #16419. Cambridge, Massachusetts, National Bureau of Economic Research.
Garfield, E. (1990). "How ISI Selectes Journals for Coverage: Quantitative and Qualitative
Considerations." Essays of an Information Scientist 13(22): 185-193.
Hamermesh, D. S., G. E. Johnson, et al. (1982). "Scholarship, Citations and Salaries: Economic Rewards
in Economics." Southern Economic Journal 49(2): 472-481.
Hamermesh, D. S. and G. A. Pfann (2011). "Reputation and Earnings: The Roles of Quality and Quantity
in Academe." Economic Inquiry.
Hilmer, M. J. and C. E. Hilmer (2011). "Negative Returns to Seniority and Job Mobility across the Program
Quality Distribution: Are Top Public PhD-Granting Programs Different?" American Economic Review
101(3): 466-470.
Hirsch, J. E. (2005). "An Index to Quantify an Individual's Scientific Research Output." Proccedings of the
National Academy of Science 102(46): 16569-16572.
Holtmann, A. G. and A. E. Bayer (1970). "Determinants of Professional Income Among Recent Recipients
of Natural Science Doctorates." Journal of Business 43(4): 410-418.
Katz, D. (1973). "Faculty Salaries, Promotions and Productivity at a Large University." The American
Economic Review 63(3): 469-477.

17
Klein, D. B. and E. Chiang (2004). "The Social Science Citation Index: A Black Box--With and Ideological
Bias?" Eon Journal Watch 1(1): 134-165.
Monks, J. and M. Robinson (2001). "The returns to seniority in academic labor markets." Journal of
Labor Research 22(2): 415-427.
Moore, W. J., R. J. Newman, et al. (1998). "Do academic salaries decline with seniority?" Journal of Labor
Economics 16(2): 352-366.
Moore, W. J., R. J. Newman, et al. (2001). "Reputational Capital and Academic Pay." Economic Inquiry
39(4): 663-671.
Posner, R. A. (2000). "An Economics Analysis of the Use of Citations in the Law." American Law and
Economics Review 2(2): 381-406.
Ransom, M. R. (1993). "Seniority and Monopsony in the Academic Labor Market." The American
Economic Review 83(1): 221-233.
Sauer, R. D. (1988). "Estimates of the Returns to Quality and Coauthorship in Economic Academia."
Journal of Political Economy 96(4): 855-866.
Scott, L. C. and P. M. Mitias (1996). "Trends in Rankings of Economics Departments in the U. S.: An
Update." Economic Inquiry 34(2): 378-400.
Siegfried, J. J. and K. J. White (1973). "Financial Reward to Research and Teaching: A Case Study of
Academic Economists." The American Economic Review 63(2): 309-315.
Tuckman, H. P., J. H. Gapinski, et al. (1977). "Faculty Skills and the Salary Structure in Academe: A
Market Perspective." The American Economic Review 67(4): 692-702.
Tuckman, H. P. and J. Leahey (1975). "What is an Article Worth?" Journal of Political Economy 83(5):
951-968.

18
Table 1 Economics PhD Programs in our Sample
Tier 1995 Program 1995 Program NRC Rank NRC Rank 2 7 UC Berkeley 13 Michigan 11 UCLA 15 Wisconsin 3 16 UCSD 26 UW Seattle 20 Maryland 27 Michigan State 24 Virginia 28 Illinois 25 UNC Chapel Hill 30 Iowa 4 31 UT Austin 42 NC State 33 Texas A&M 44 Indiana 35 Ohio State 49 UC Santa Barbara 36 Iowa State 50 Purdue 37 Arizona 51 Massachusetts 38 UC Davis 57 Houston 41 Florida 58 SUNY Buffalo 5 62 Florida State 83 Washington State 63 Georgia 84 Connecticut 64 Kentucky 86 Oklahoma State 65 South Carolina 87 Nebraska 66 SUNY Binghamton 90 Utah 67 Arizona State 92 West Virginia 69 Georgia State 93 Missouri 71 UC Riverside 97 Cincinnati 73 Kansas 98 UT Dallas 74 Auburn 100 Colorado State 75 Clemson 101 New Hampshire 76 Wyoming 103 Colorado School of Mines 77 Southern Illinois 104 Utah State 78 SUNY Albany

19
Table 2
Summary Statistics for Unique Articles
(N=19,937)
Mean
Standard
Deviation Minimum Maximum
Total Number of Citations
12.84 53.184 0 4256
Average Number of Citations per Year
0.89 2.640 0 157.63
Publication Year
1991.75 9.846 1956 2006
Number of Authors
1.80 0.975 1 16
Decade of Publication
1950s
0.002 0.041 0 1
1960s
0.017 0.128 0 1
1970s
0.107 0.309 0 1
1980s
0.260 0.439 0 1
1990s
0.347 0.476 0 1
2000s
0.267 0.443 0 1

20
Table 3
Summary Statistics for Unique Articles:
Distribution by Citation Frequency
Total Citations
Citations per Year
Date of Publication
Date of Publication
Percentiles
All Years Pre-2000
All Years
Pre-
2000
25%
0 0
0.00 0.00
50%
3 4
0.25 0.25
75%
11 14
0.90 0.88
90%
30 38
2.19 2.29
95%
52 65
3.56 3.85
99%
137 170
9.17 10.00
Maximum 4256 4256
157.63 157.63
Fraction without Citations 0.301 0.258
0.301 0.258
Number of Articles 19,937 14,629
19,937 14,629

21
Table 4
Summary Statistics for Analysis Variables
(N=1,009)
Variable
Mean Std. Dev. Min Max
Salary
121,674.90 46,132.03 60,000.00 342,141.90
Log( Salary)
11.64919 0.3339894 11.0021 12.74
Years Experience
19.95 12.17 0 58.00
Years Seniority
15.64 11.54 0 50.00
Year PhD granted
1986.91 12.08 1950 2007
Total Number of Articles
21.04 24.10 0 234
Number of Articles in Elite Journals
2.63 3.93 0 33
Number of Articles in Excellent Journals
7.05 8.75 0 99
Number of Other Articles
11.37 16.70 0 208
Cumulative Citations
274.99 581.86 0 10,943.00
Cumulative Citations Per Author
171.68 389.07 0 7,958.92
Log(Cum Citations+1)
4.00 2.23 0 9.30
Log(Cum Citations per Author +1)
3.59 2.11 0 8.98
h (Hirsch index)
6.03 5.34 0 31.00
Hp (per author adjusted)
4.73 4.29 0 25.00
Citations to most cited paper
70.34 189.25 0 4,256.00
Citations to 2nd most cited paper
38.50 108.33 0 2,785.00
Sum citations to 4 most cited papers
153.21 363.68 0 8,372.00
Citations per author (most cited)
47.57 162.87 0 4,256.00
Citations per author (2nd most cited)
23.57 50.90 0 991.00
Sum citations per author (4 most cited)
99.51 261.21 0 6,388.33

22
Table 5
Quantiles of Hirsch Related Indexes and Cumulative Citations
Percentile h
h(5,2)
h (per author)
Cumulative
Citations
Cumulative
Citations/Author
10%
0
0
0
0
0
25%
2
1
1
12
6.83
50%
5
1
4
76
50.67
75%
9
2
7
302
184.50
90%
14
3
11
749
457.92
95%
17
3
14
1179
730.50
99%
24
4
19
2321
1391
Mean
6.03
1.43
4.73
274.99
171.68
Std. Deviation
5.34
1.12
4.29
581.86
389.07
Maximum
31
6
25
10943
7958.92

23
Table 6
Regression Results—Salaries (without co-authorship adjustment)
(N=1,009)
Model
Variable (1) (2) (3) (4) (5) (6)
h 0.0628*** 0.0739*** 0.0650***
(0.00322) (0.00489) (0.00547)
h2 -0.000978*** -0.00146*** -0.00147***
(0.000176) (0.000220) (0.000234)
Log (Cum
Cites+1)
-0.0204* 0.00785 0.0168
(0.00980) (0.0124) (0.0127)
Log(Cum
Cites+1)2
0.0173*** 0.0142*** 0.0101***
(0.00150) (0.00159) (0.00195)
Experience
0.00869* 0.0107**
0.0111** 0.0123**
(0.00390) (0.00404)
(0.00414) (0.00440)
Experience2
-0.0000899 -0.000159
-0.000125 -0.000195*
(0.0000814) (0.0000870)
(0.0000853) (0.0000929)
Seniority
-0.0238*** -0.0222***
-0.0243*** -0.0229***
(0.00350) (0.00355)
(0.00336) (0.00351)
Seniority2
0.000392*** 0.000364***
0.000388*** 0.000381***
(0.0000833) (0.0000863)
(0.0000808) (0.0000853)
Male
0.0151 0.0100
0.0139 0.00966
(0.0184) (0.0179)
(0.0181) (0.0180)
# Elite
Articles
0.0116**
0.00993**
(0.00366)
(0.00355)
# Excellent
Articles
0.00169
0.00255
(0.00152)
(0.00160)
# Other
Articles
0.000725
0.00123
(0.000659)
(0.000662)
Constant
11.33*** 11.38*** 11.38*** 11.37*** 11.39*** 11.38***
(0.0104) (0.0190) (0.0194) (0.0120) (0.0189) (0.0196)
R2 0.524 0.568 0.577 0.517 0.561 0.572
Dependent variable is ln(Salary). Standard errors in parentheses. P-values* p<0.05, ** p<0.01*** p<0.001

24
Table 7
Regression Results—Salaries (with co-authorship adjustment)
(N=1,009)
Model
Variable (1) (2) (3) (4) (5) (6)
h
(per author)
0.0776*** 0.0856*** 0.0735***
(0.00441) (0.00587) (0.00734)
h2
(per author)
-0.00153*** -0.00201*** -0.00203***
(0.000274) (0.000311) (0.000415)
Log (Cum
Cites*+1)
-0.00228 0.0280 0.0356*
(0.0115) (0.0145) (0.0143)
Log(Cum
Cites*+1)2
0.0168*** 0.0133*** 0.00854***
(0.00168) (0.00182) (0.00201)
Experience
0.0122*** 0.0136***
0.0118** 0.0129***
(0.00349) (0.00401)
(0.00386) (0.00387)
Experience2
-0.000144* -0.000215*
-0.000143 -0.000214**
(0.0000690) (0.0000859)
(0.0000753) (0.0000765)
Seniority
-0.0238*** -0.0220***
-0.0243*** -0.0227***
(0.00316) (0.00361)
(0.00317) (0.00316)
Seniority2
0.000371*** 0.000350***
0.000381*** 0.000374***
(0.0000762) (0.0000880)
(0.0000767) (0.0000768)
Male
0.0145 0.00898
0.0153 0.0102
(0.0212) (0.0180)
(0.0214) (0.0211)
# Elite
Articles
0.0121**
0.0112***
(0.00375)
(0.00285)
# Excellent
Articles
0.00225
0.00272*
(0.00157)
(0.00109)
# Other
Articles
0.00109
0.00143**
(0.000650)
(0.000527)
Constant
11.34*** 11.38*** 11.37*** 11.37*** 11.38*** 11.37***
(0.0136) (0.0242) (0.0195) (0.0178) (0.0247) (0.0246)
R2 0.512 0.557 0.568 0.505 0.552 0.565
Dependent variable is ln(Salary). Standard errors in parentheses. P-values: * p<0.05, ** p<0.01***
p<0.001

25
Table 8a
Log Likelihood Values for Different
Models of Coauthorship
c Log likelihood value
0
109.1088
1 98.6715
“Conservative” LR Test Statistic = 20.87
Table 8b
Log Likelihood Values for Different
Models of Coauthorship using Log Cumulative Citations
c Log likelihood
0
102.8831511
.25 102.2588632
.5 100.6923021
.75 98.25933209
1.0 95.10564948
“Conservative” LR test Statistic = 15.555

26
Table 9
Ordered Probit Regression Model
Dependent variable is 1995 NRC Rank
Citations Variables Not Adjusted for Coauthorship
Model
Variable
(1) (2) (3) (4)
h
-0.232*** -0.213***
(0.0432) (0.0450)
h2
0.00646*** 0.00528**
(0.00168) (0.00178)
Log (Cum Cites +1)
-0.246 -0.302
(0.170) (0.176)
Log (Cum Cites+1)2
-0.0149 -0.00594
(0.0206) (0.0225)
Year of PhD
-0.0475*** -0.0442** -0.0555*** -0.0442**
(0.0136) (0.0143) (0.0140) (0.0148)
Male
0.0372 0.0795 0.00628 0.0385
(0.180) (0.181) (0.180) (0.180)
# Elite articles
-0.0972***
-0.0878***
(0.0253)
(0.0260)
# Excellent articles
0.0157
0.0122
(0.0104)
(0.0102)
# Other articles
0.0170***
0.0169***
(0.00501)
(0.00451)
Log Likelihood -830.99 -816.06 -827.04 -813.73
N 232 232 232 232
Standard errors in parentheses. P values: p<0.05 **, p<0.01, *** p<0.001
27
Table 10
Ordered Probit Regression Model
Dependent variable is 1995 NRC Rank
Citations Variables Adjusted for Coauthorship
Model
Variable
(1) (2) (3) (4)
h (per author)
-0.289*** -0.279***
(0.0569) (0.0592)
h2 (per author)
0.00905** 0.00849**
(0.00287) (0.00293)
Log (Cum Cites +1)
-0.326 -0.378*
(0.173) (0.176)
Log (Cum Cites+1)2
-0.0107 -0.00172
(0.0225) (0.0241)
Year of PhD
-0.0537*** -0.0456** -0.0585*** -0.0471**
(0.0133) (0.0143) (0.0139) (0.0148)
Male
0.0701 0.106 -0.00271 0.0291
(0.180) (0.181) (0.180) (0.180)
# Elite articles
-0.0919***
-0.0876***
(0.0252)
(0.0257)
# Excellent articles
0.0157
0.0135
(0.0103)
(0.0102)
# Other articles
0.0167***
0.0166***
(0.00459)
(0.00448)
Log Likelihood -829.01 -814.72 -825.04 -811.81
N 232 232 232 232
Standard errors in parentheses. P values: p<0.05 **, p<0.01, *** p<0.001

28

29
02
46
81
0L
og
(Cu
mula
tive
Citation
s+
1)
711
1315
1620
2425
2627
2830
3133
3536
3738
4142
4449
5051
5758
6263
6465
6667
6971
7374
7576
7778
8384
8687
9092
9397
98100
101103
104
Figure 1: Distribution of log citations by "mature" faculty over NRC Rank

30
11
11.5
12
12.5
13
Log
Sa
lary
711
1315
1620
2425
2627
2830
3133
3536
3738
4142
4449
5051
5758
6263
6465
6667
6971
7374
7576
7778
8384
8687
9092
9397
98100
101103
104
Figure 2: Distribution of Salaries for "mature" faculty, over NRC Rank