family firms and expropriation annual meetings...how do family ownership and control affect board...
TRANSCRIPT
How Do Family Ownership and Control Affect Board Structure, Dividends and Debt?
Australian Evidence
Lukas Setia-Atmaja§∗, George A. Tanewski and Michael Skully Department of Accounting and Finance
Monash University PO Box 197
Caulfield East, VIC, 3145 Australia
ABSTRACT
This paper investigates whether family controlled firms use dividends, debt and board structure to exacerbate or mitigate agency problems between controlling and minority shareholders. We find that family firms pay higher dividends and employ higher debt levels compared to non-family firms. Family firm boards also have significantly lower levels of independence. The relationships between family ownership and dividends, debt and board independence appear to be non-linear. The overall findings suggest that, in terms of governance, families use dividends or debt as substitutes for independent directors. Consistent with these results, we also find that the impact of dividends, debt and board size on performance is stronger for family firms than non-family firms, but the impact of board independence is weaker for family firms than non-family firms. This evidence implies that dividends and debt are viewed as more effective mechanisms to mitigate the expropriation of minority shareholders’ wealth by families, whereas independent directors are considered as more effective devices to control the classic owner-manager conflict in non-family firms. EFM Classification: 150, 170, 140 Keywords: Family control, agency problems, governance mechanisms, simultaneity, performance effect §The first author would like to acknowledge support from AUSAID. The authors also would like to thank Dr Nicholas
A. Mroczkowski’s invaluable assistance in making available a list of family and non-family controlled firms on the Australian Stock Exchange.
∗ Lukas Setia-Atmaja is corresponding author and can be contacted at: 61-3-99032531; fax: 61-3-9903-2838; email address: [email protected] authors: [email protected] [email protected]
1

1. Introduction
Agency theory provides a mixed perspective on moral hazard problems in family firms.
On the one hand, families are assumed to be better monitors of managers than other types
of large shareholders, suggesting that agency problems between managers and owners
(referred to as Agency Problem I) are fewer in family than in non-family firms (e.g.,
Anderson and Reeb, 2003a). On the other hand, there is also an argument that controlling
families may extract private benefits at the expense of minority shareholders (referred to
as Agency Problem II) (e.g., Fama and Jensen, 1983; Shleifer and Vishny, 1997). Indeed,
Villalonga and Amit (2006) suggest that controlling families have greater incentives for
both monitoring and expropriation, and so Agency Problem II may overshadow Agency
Problem I.
Prior research on family ownership and agency problems (generally measured by firm
value or performance) has also provided mixed findings. For example, Anderson and
Reeb (2003a, 2003b) find a positive relationship between family control and firm
performance, while Holderness and Sheehan (1988) find a negative relationship.
Claessens et al. (2002) find that private benefits of control are a source of negative impact
on family control in East Asia. Recently, Villalonga and Amit (2006) find that among
large U.S. firms, family ownership creates value only when the founder serves as the
CEO or acts as its chairman with a hired CEO.
2

The prevalence of family controlled firms in most countries (La Porta et al., 1999) and
the family’s incentive to extract private benefits raises the question of how to control
Agency Problem II. Prior research (e.g., Gomez-Mejia et al., 2003; Shivdasana, 1993;
Kole, 1997) indicates that several conventional governance tools for controlling Agency
Problem I (e.g., takeover market, institutional investors and incentive compensation) are
less effective in dealing with Agency Problem II. This implicitly suggests that other
internally determined governance mechanisms (e.g., dividends, debt and board structure)
may play a more significant role in controlling Agency Problem II. That is, dividends and
debt may serve to reduce free cash flows that might otherwise be expropriated, while
boards of directors can monitor and restrict controlling families’ opportunism (La Porta et
al., 2000; Faccio et al., 2001a, 2001b; Anderson and Reeb, 2004).
This paper aims to provide new evidence on the relationship between family control and
agency problems by addressing two research questions. The first research question is
whether family firms use dividends, debt and board structure (i.e., board composition and
size) to mitigate or exacerbate Agency Problem II. The normative literature suggests that
if controlling families exacerbate Agency Problem II (referred to as the expropriation
argument), family firms should demonstrate lower dividends and debt, and assemble
boards which are less effective monitors (i.e., large boards with a lower proportion of
independent directors).1 The second research question is whether the effectiveness of
dividends, debt and boards in controlling agency problems differ between family and
1 Faccio et al. (2001b) suggest that if capital market institutions are effective, higher debt adopted by closely-held firms may serve to mitigate agency problems between controlling and minority shareholders.
3
non-family firms. Specifically, we attempt to examine whether the impact of dividend,
debt and board structure on firm performance is moderated by family control.
This paper makes several important contributions to the literature. The first contribution
relates to ownership structure and corporate governance, which are at the heart of agency
problems in the firm. Through the examination of the interacting roles that both
ownership structure and specific corporate governance mechanisms play in mitigating or
exacerbating agency issues, the study extends the existing ownership structure literature
by providing robust empirical evidence which enable explanations of the context in
which either agency problems I and II arise, particularly among public firms which have
high investor protection and high private benefits of control. Prior research on this issue
has focused on countries that have high private benefits of control but weak investor
protection (e.g., Gugler, 2003) or on countries that have strong legal protection, but low
private benefits of control (e.g., Anderson and Reeb, 2004). A focus on Australian firms
provides a unique opportunity to examine whether stronger legal shareholder protection
helps to mitigate moral hazard problems in family firms, or whether higher levels of
private benefits of control induce families to exacerbate these moral hazard problems (La
Porta et al., 1999; Nenova, 2003) 2, thus providing an important perspective on agency
theory.
2 Nenova (2003) finds that the control premium in Australia is relatively high. This phenomenon is unique as generally the control premium is negatively related to the quality of investor protection (Bebchuk, 1999). Indeed, Lamba and Stapledon (2001) document that, despite having strong investor protection, corporate ownership is relatively concentrated in Australia. This is consistent with Bebchuk’s argument that ownership concentration is positively related to the level of private benefits of control.
4

The second contribution relates to the corporate governance system in Australia. Unlike
corporate governance in the U.S. which is largely enshrined in a mandatory legislative
framework, this study examines data in the context where there is no mandate for
Australian publicly listed firms to have a minimum number of independent directors on
the board. Moreover the market for corporate control, institutional investors and
compensation also play a less significant role in controlling agency problems in Australia
compared to the U.S. (Suchard et al., 2001; Craswell et al., 1997). The corporate
governance of Australia’s listed market can be considered as an insider system
converging to an outsider system (Dignam and Galanis, 2004). 3 As such, this study
provides unique insights on the effectiveness of dividends, debt and boards to control
Agency Problem II in such an environment.
The third contribution relates to the examination of the impact of family control and
ownership on dividend, debt and board structure decisions in a simultaneous framework.
Prior research has examined the relationship between family firms and these governance-
type variables separately (e.g., Gugler, 2003; Anderson and Reeb, 2003b, 2004). The
literature, however, suggests that firms use more than one of these governance
mechanisms simultaneously (e.g., Hermalin and Weisbach, 2003). Agrawal and Knoeber
(1996) argue that if these mechanisms are jointly determined, treating them as exogenous
variables might lead to biased and inconsistent parameter estimates. To avoid these
3 Insider system is characterised by the relative unimportance of the securities market as a source of finance. The main sources of finance are banks, families, non-financial corporations and states. Shareholdings are more concentrated, and shareholders and creditors are more actively involved in the control of the companies (e.g., Japan and Germany). Outsider system is characterised by a securities market with dispersed shareholdings, where shareholders and companies interact on arm’s-length basis, largely determined by market forces (e.g., U.S. and U.K.) (Dignam and Galanis, 2004, p. 623).
5
conceptual and econometric problems, this study examines dividend and board structure
decisions by using a simultaneous equations procedure.
Using panel data on a sample of Australian publicly listed firms over the period 2000-
2005, we find that family firms utilise a different combination of governance tools from
their non-family counterparts. On the one hand, family firms seem to mitigate Agency
Problem II by paying higher dividends and by using more debt in their capital structure.
On the other hand, family firms have significantly lower levels of board independence,
which is consistent with the expropriation argument. Our analysis also reveals that the
relationships between family ownership and dividends, debt and board independence are
non-linear. From an agency theory perspective, the overall findings suggest that, in terms
of governance, families use dividends or debt as a substitute for independent directors
(Easterbrook, 1984). That is, families prefer to employ fewer independent directors on
their boards (which can exacerbate Agency Problem II), and they compensate for this
lack of independence through other governance mechanisms such as paying higher
dividends and employing higher debt levels. Consistent with this evidence, we also find
that the effectiveness of dividends, debt and boards in controlling agency problems differ
between family and non-family firms. Specifically, our analyses indicate that dividends,
board independence and size are positively associated with performance of family firms;
whereas performance of non-family firms is positively related to board independence but
not to dividends and board size. Furthermore, the impact of dividends, debt and board
size on performance appear to be stronger for family firms than non-family firms, but the
impact of board independence is weaker for family firms than non-family firms. This
6
sheds light on why Australian families rely more on dividends or debt than independent
directors in controlling agency problems.
The remainder of this paper is organized as follows: Section 2 provides a literature
review. Section 3 describes the sample and methodology. Section 4 discusses the
empirical results; Section 5 provides the conclusion.
2. Literature Review and Hypotheses Development
Agency theory suggests that family firms may either mitigate or exacerbate agency
problems. Some have argued that family firms are one of the most efficient forms of
organisational governance and are even used as the zero agency cost base by finance
researchers (e.g., Ang et al., 2000). Families are widely believed to have greater
incentives to monitor managers than other large shareholders or widely held corporations
(Anderson and Reeb, 2003a, 2003b, 2003c). Indeed, La Porta et al. (1999) indicate that
families are almost always involved in the management of the firm, which might result in
a greater alignment between the interests of shareholders and managers.
Others, however, argue that families also have a powerful incentive to expropriate wealth
from minority shareholders. For example, Faccio et al. (2001a) suggest that families tend
to do so when their control is greater than their cash flow rights. Amit and Villalonga
(2006) indicate that as their private benefits of control are undiluted among several
independent owners, families may have a greater incentive to expropriate wealth from
7

minority shareholders than other blockholders. These arguments imply that Agency
Problem II might be more prevalent in family firms.
Agency theory suggests that dividends help control Agency Problem I by reducing free
cash flows and hence forcing managers to raise capital market funding more frequently
and so subject insiders to outside scrutiny (Jensen, 1986; Easterbrook, 1984; Rozeff,
1982). As families potentially reduce Agency Problem I through better monitoring of
managers or direct involvement in management, they make less use of dividends to
address agency costs. La Porta et al. (2000), however, indicate that dividends can reduce
Agency Problem II as it guarantees a pro-rata payout to all shareholders and removes
corporate wealth from controlling blockholders. Their dividend outcome model predicts
that under a stronger legal protection system, minority shareholders will use their legal
power to force controlling blockholders to distribute more cash. The system also makes
rent extraction such as asset diversion legally riskier and more expensive for insiders,
thus making dividends relatively more attractive. As such, dividends can play a
significant role in controlling Agency Problem II among family firms.
The expropriation argument, accordingly, suggests that families prefer lower dividends,
in order to preserve cash flows that they can potentially expropriate. As this study aims to
test whether higher levels of private benefits of control in Australia induce families to
expropriate minority shareholders wealth via retaining the cash flow within the firm, we
propose the following hypothesis:
8
H1: The dividend payout ratio is significantly lower in family firms than in
non-family firms.
In widely-held firms, debt can serve as a disciplining mechanism to contain agency
problems between managers and dispersed shareholders by imposing fixed obligations on
firm cash flow or reducing free cash flows (Jensen and Meckling, 1976; Jensen 1986). In
contrast, in closely-held firms such as family firms, debt could facilitate minority
shareholders expropriation by allowing controlling insiders to control more resources
without diluting their voting rights (Faccio et al., 2001b).
The governance role of debt in family firms, therefore, depends upon the effectiveness of
capital market institutions in containing the abuse of debt. Where capital market
institutions are effective (i.e., corporate accounts are transparent and shareholders and
creditor rights are well protected), then higher debt levels in family firms may serve to
mitigate agency problems between controlling and outside minority shareholders. Since
Australia has a strong system of legal shareholder protection, the expropriation argument
predicts that family firms prefer lower levels of debt to minimize its monitoring role. In
addition, the literature indicates that families are generally not diversified investors and
thus they tend to use more equity than debt in their capital structure (i.e., tend to be
under-leveraged). This risk reduction strategy can impose costs on diversified, minority
shareholders (Anderson and Reeb, 2003b). To test whether debt facilitates minority
shareholders’ wealth expropriation in family firms, we propose the following hypothesis:
9
H2: The debt levels of family firms are significantly lower than those of non-family firms.
Boards of directors can play a significant role in controlling agency problems,
particularly in monitoring executive management (Fama and Jensen 1983). The
normative literature suggests that a board can monitor the firm more closely and take
appropriate governance actions if it has a large enough number of independent directors
from outside the company and when it is small (Jensen, 1993). Indeed, Westphal (1998)
suggests that since governance mechanisms in family firms are limited, minority
shareholders potentially rely on their boards to monitor and control the families’
opportunism. Meanwhile, Anderson and Reeb (2004) find that interests of minority
shareholders are best protected when independent directors have greater power relative to
family blockholders.
The expropriation argument thereby suggests that families, seeking to exploit the firm’s
assets for their private benefits, are unlikely to have boards that can limit their control of
their firm’s resources or assemble smaller boards with a more effective monitoring. This
leads to the following two hypotheses.
H3: The proportion of independent directors on the board of family firms is significantly
lower than that of non-family firms.
H4: Board size of family firms is significantly larger than that of non-family firms.
10
The notion that dividends, debt and boards of directors are jointly determined is derived
from agency theory. That is, firms can use dividends, debt and boards to control agency
problems. Each mechanism, however, has costs and benefits. For example, higher
dividends serve to reduce agency problems, but they also increase transaction costs
(Rozeff, 1982). Similarly, higher debt may discipline managers or reduce free cash flows,
but higher debt also leads to higher default risk or agency costs of debt (Jensen et al.,
1992). A higher proportion of independent directors on the board may enhance
monitoring, but it can increase communication and coordination costs among
independent directors (Raheja, 2005). Smaller boards can be more effective monitors but
benefit less from the expertise and advice provided by additional directors (Coles et al.,
2004). Easterbrook (1984) suggests that as all mechanisms to control agency problems
are costly, substitution among them should be expected, while Agrawal and Knoeber
(1996) suggest that complementary monitoring mechanisms can also exist.
3. Data, Variable and Methodology 3.1 Sample
The study examines annual panel data over a six-year period from 2000 to 2005. The
sample consists of those family and non-family controlled firms that were listed on the
Australian Stock Exchange (ASX) on 30 June 1998 (see Mroczkowski and Tanewski,
2007). Financial firms (218 firms) are excluded because their dividend policies are
influenced by government regulations (e.g., La Porta et al., 2000). The sample is further
restricted to firms with annual reports for 2000 - 2005 (i.e., 140 firms were excluded) and
11
those firms that are eligible to pay dividends (i.e., 540 firms were excluded)4 . This
removes the possibility that zero dividends are simply a result of a firm’s inability to pay
dividends. The final sample comprises 316 firms or 1,530 firm-year observations over a
six-year period. Family firms constitute around 25 percent (78 firms or 375 firm-year
observations) of the total sample.
3.2 Primary Variable Measures
This study defines family firms as “those in which the founding family or family member
or private individual controlled 20 per cent or more equity, and was involved in the top
management of the firm” (Mrockowski and Tanewski, 2007).5 We use two variables to
estimate the impact of family firms: a binary variable that equals one for family firms and
zero otherwise (denoted as family control) and the percentage of shares held by the
family as a group (denoted as family ownership). Family control captures the impact of
the presence of family control (i.e., 20 per cent or more), while family ownership helps
examine the actual impact of different levels of family holdings.
Board composition is measured by the proportion of independent directors on the board
(denoted as board independence), whereas board size is defined as the number of
4 These were eliminated because when a firm makes losses and has negative retained profits in a given year, they are legally unable to pay dividends (Section 254T of the Australian Corporations Act 2001). 5 Twenty per cent threshold is also used by La Porta et al. (1999) and Faccio et al. (2001a) to define closely-held firms. As Mroczkowski and Tanewski’s (2007) list of family and non-family firms covered only up to the period ending 30 June 1998, it was necessary to validate the family control status of companies for the entire period of sample (i.e., 30 June 2000 to 31 July 2005). The 1998 list, therefore, was corroborated by referring to data on substantial shareholders (to assess voting rights) and director’s interests (to assess involvement in management).
12

directors on the board. We define independent directors as “individuals whose only
business relationship to the firm is their directorship” (Anderson and Reeb, 2004).
Independent directors are identified through the corporate governance and directors’
statements in annual reports obtained from Connect – 4 and DatAnalysis databases, and
then individually analyzed. In March 2003, the Australian Stock Exchange’s (ASX) The
Principles of Good Corporate Governance and Best Practice Recommendations provided
10 corporate governance principles (ASX, 2003). It includes the following
recommendations: “A majority of the board should be independent directors” and “the
chairperson should be an independent director” (Recommendations 2.1 and 2.2,
respectively). The ASX Listing Rule 4.10 requires company annual reports disclosing the
extent to which they have followed these best practice recommendations in that reporting
period as well as their reasons for not complying. These reports provided additional
information for classifying independent directors.
Consistent with prior research (e.g., Rozeff, 1982; La Porta et al., 2000; Faccio et al.,
2001a), the dividend payout ratio is measured as total ordinary dividends divided
by net income before extraordinary items (denoted as dividend).6 Debt is defined as book
value of total debt scaled by book value of total assets (Anderson and Reeb, 2003b). This
study uses the natural logarithm of Tobin’s Q to measure firm performance. The actual
definition of Tobin’s Q is market value of the firm divided by replacement cost of assets.
However, since information on replacement cost of assets (the denominator) is not
6 This study excludes observations with negative earnings to avoid negative dividend payout ratios. If net earnings are negative, the dividend payout ratio can be negative, which implies incorrectly that these firms’ payout ratio is low. This treatment is actually insignificant as it only affects less than 1 percent of the total number of observations.
13

available in Australia, this study defines Tobin’s Q as the market value of equity plus the
book value of all liabilities and preference shares scaled by total assets.7 This proxy is
highly correlated with the actual definition of Tobin’s Q and has been widely used in US
studies (e.g., Holderness et al., 1999; Demsetz and Villalonga, 2001).
3.3 Model
Prior studies have been concerned with endogeneity problems among governance
mechanisms and thus analyse their use in a simultaneous equations framework. As this
paper focuses on the governance role of dividends, debt and boards, we develop a system
of four equations addressing dividend, debt, board composition and board size, and then
estimate these equations using a three-stage least squares (3SLS) regression.
The first equation relates to dividends and it includes three other endogenous variables
(i.e., debt, board independence and board size). We control for firm characteristic
variables such as non-family blockholdings, firm size, growth opportunity, business risk
and investment (Rozeff, 1982; Jensen et al., 1992). As we examine firms in an imputation
environment8, it incorporates tax paid (i.e., Australian tax paid scaled by assets) and
dividend reinvestment plan (a binary variable which equals one if the firm has a DRP,
zero otherwise) variables to control for the firm’s motivation to distribute franking credits
7 This proxy is highly correlated with the actual definition of Tobin’s Q and has been widely used in U.S. studies (e.g., Demsetz and Villalonga, 2001). In Australia, Craswell et al. (1997) also use the market-to-book (equity) ratio as a proxy for Tobin’s Q. 8 The Australian imputation tax system was introduced on 1 July 1987, with the aim of removing the double taxation of dividends. The system allows companies to pay dividends that carry imputation credits for income tax paid by the company (known as franked dividends). Imputation credits can be used to reduce income tax paid by resident shareholders.
14

via dividends. Both variables are expected to be positively related to dividends.9 In
addition, a two-way fixed effects model is included in the model. The first fixed effect
(industry dummy variables based on two digit GICS codes) considers any variation in the
dependent variable due to industry differences, while the second fixed effect (i.e., year
dummy) removes any secular effects among the independent variables.
Dividend = f (debt, board independence, board size, family control,
non-family blockholders, firm size, growth opportunity,
business risk, investment, DRP, tax paid, industry, year) (1)
The second equation examines debt. In addition to incorporating three endogenous
variables, we control for non-family blockholdings, firm size, business risk, investment,
profitability, asset tangibility, industry and year dummies.
Debt = f (dividend, board independence, board size, family control,
non-family blockholders, firm size, business risk, investment,
profitability, asset tangibility, industry, year) (2)
The third equation observes board independence. To be consistent with prior research
(e.g., Boone et al., 2007; Coles et al., 2004), we include non-family blockholdings, firm
9 Credits to a company’s franking account arise mainly from payment of company income tax, whereas a dividend reinvestment plan allows firms to pay out a greater proportion of their earnings in dividends while simultaneously maintaining their investment policy as a portion of these funds will be returned via the issue of new shares to participants.
15

size, CEO (a binary which equals one if CEO is also the chairman of board, zero
otherwise), firm age, free cash flows, growth opportunity, industry and year dummies.
Board independence = f (dividend, debt, board size, family control,
non-family blockholders, firm size, CEO, firm age,
free cash flows, growth opportunity, industry, year) (3)
The third endogeneous variable concerns board size. The same set of exogenous variables
which are used in Equation (2) are also included. In addition, lag (profitability) variable is
incorporated to control for the possibility that firms appoint more directors following
poor profitability.
Board size = f (dividend, debt, board independence, family control,
non-family blockholders, firm size, CEO, firm age, free cash flows,
growth opportunity, lag-profitability, industry, year) (4)
To examine the potential for a nonlinear impact of family ownership on dividends, debt
and board structure, we replace family control in Equations (1) – (4) with family
ownership and the square of family ownership.10 We also employ pooled (OLS) and
random effects regressions to estimate Equations (1) – (4) separately to compare the
results to previous studies which used standard regression analyses. A random effects
technique is employed to address the possibility of a spurious relationship between the
10 This specification was used by McConnell and Servaes (1990) and Anderson and Reeb (2003a, 2003b).
16

dependent and independent variables. This may be due to the exclusion of unmeasured
explanatory variables that nevertheless still affect firm behaviour. Definitions for all
variables used in the model are specified and explained in Tables 2 and family control, 3.
We also develop a system of five equations that address Tobin’s Q, dividend, debt, board
composition and board size to examine whether the impact of dividends, debt and board
structure on performance is moderated by family control in a simultaneous equations
model. That is, we add equation (5) into equations (1) – (4), and including Tobin’s Q as
additional endogenous variable. In equation (5), we incorporate four interaction variables
to measure the differential impact of dividends, debt, board independence and board size
on Tobin’s Q for family and non-family firms. 11 In addition to incorporating four
endogenous variables which represent corporate governance mechanisms, we control for
non-family blockholdings, firm size, investment, profitability and firm age (Mehran,
1995).
Tobin’s Q = f (dividend, debt, board independence, board size, dividend*family control,
debt*family control, board independence*family control,
board size*family control, family control, non-family blockholders,
firm size, investment, profitability, firm age, industry, year) (5)
11 The inclusion of interaction variables in a simultaneous equations model has been adopted by, for example, Boone et al. (2007).
17
4. Results
4.1 Descriptive Statistics and Univariate Test
Panel A of Table 1 presents the descriptive statistics (i.e., means, medians, standard
deviations, maximum and minimum values, skewness and kurtosis) for the full sample.
On average, firms report a dividend-to-earnings ratio of 47.3 per cent and a debt-to-assets
ratio of 22.7 per cent. The average number of directors is around 6; of these, 43.2 per cent
are independent directors (mean of 2.8 independent directors). With regard to ownership
structure, non-family blockholders hold an average of 34.4 per cent of voting rights in all
firms. The mean for substantial shareholdings (i.e., shareholders with at least five per
cent equity stake) is 44.6 per cent, suggesting that Australian firms have relatively
concentrated ownership. Among family firms, controlling families hold an average of
40.7 per cent of equity.
Panel B of Table 1 reports differences in dividends, debt, board composition and board
size between family and non-family firms. Family firms, on average, pay around 48.3 per
cent of their net earnings in dividends versus 46.9 per cent for non-family firms. The
difference, however, is statistically insignificant at conventional levels. With respect to
debt, family firms employ significantly higher debt in their capital structure than non-
family firms (25 per cent versus 22 per cent). Family firms also have a significantly lower
proportion of independent directors (30.9 per cent versus 47.2 per cent) and smaller
boards (5.6 versus 6.2 directors) than their non-family counterparts. Overall, only the
18
board independence result provides preliminary support for the expropriation argument.
The univariate analyses also indicate that several variables differ significantly between
family and non-family firms. That is, outside or non-family blockholdings, growth of
revenue, firm size, business risk, investments and asset tangibility are significantly lower
(or smaller) in family than in non-family firms.
___________________________
Insert Table 1 ___________________________
4.2 Family Firms and Dividend Policy
The first column in Table 2 presents the estimation of Equation (1) using random effects
regressions with family control (Panel A) and family ownership and the square of family
ownership (Panel B).12 Contrary to the expropriation argument, we find that family firms
have a higher dividend payout ratio. Debt appears to be negatively associated with
dividends, suggesting that both are substitute monitoring mechanisms. Dividends are also
found to be positively associated with board independence, which supports the
complementary nature of the relationship between dividends and independent directors.
Board size, however, has no significant impact on dividends. Consistent with the tax
theory (i.e., motivation to distribute franking credits) and agency theory (i.e., Rozeff’s,
1982, agency costs-transaction costs model), the dividend payout ratio of Australian
12 We also estimate Equation (1) using the pooled OLS regression. The results are not reported, but are available from the corresponding author. Results are similar to the random effects regressions.
19

firms is negatively related to business risk and investment but positively related to firm
size, the adoption of DRP and the amount of Australian tax paid.
The family ownership and the square of family ownership results in Panel B (column 1)
indicate that the relationship between family ownership and the dividend payout ratio is
nonlinear (i.e., inverse-U shaped). The dividend payout ratio initially increases as family
ownership increases. However, after reaching a maximum when families hold around 39
per cent of voting rights, any further increase in family’s holding causes the dividend
payout ratio to decrease. While not reported, we repeat the analysis following Anderson
and Reeb’s (2003a) procedure with two dummy variables to delineate firms into family
firms with less than and greater than 39 per cent holdings and non-family firms. We find
that both family groups are associated with higher dividend payout ratios compared to
non-family firms, which is consistent with earlier analyses. In summary, regardless of the
specification, we find strong evidence that family firms adopt higher dividend payout
ratios than non-family firms. This is counter-intuitive to Hypothesis 1 and is inconsistent
with the expropriation argument.
___________________________
Insert Table 2 ___________________________
4.3 Family Firms and Debt Policy
Table 2 (column 2) provides the estimation of Equation (2) using random effects
regressions with debt as the dependent variable. Consistent with the univariate analysis
20
(see Table 1, Panel B), Panel A indicates that family firms use higher debt levels in their
capital structure than their non-family counterparts. We also find that dividends have a
negative impact on debt, providing additional support for the substitution relationship
between debt and dividends. Board independence and board size, however, seem to have
an insignificant impact on debt. Panel B of Table 2 (column 2) shows that the relationship
between family holdings and debt is not uniform over the entire range of family
ownership. That is, the relationship between family ownership and debt takes an inverse-
U shape with the maximum point being around 30 per cent family voting rights. While
not presented, we repeat the analysis using two dummy variables to delineate firms into
family firms with less than and greater than 30 per cent holdings and non-family firms.
We find that family groups use more debt in their capital structure than non-family firms,
which is consistent with earlier analyses. Overall, the results are counter-intuitive to
Hypothesis 2 and suggest that family firms do not expropriate minority shareholders’
wealth by adopting lower debt levels. Instead, they seem to adopt higher debt levels,
which enhance monitoring.
4.4 Family Firms and Board Structure
The third column in Table 2 provides the estimation of Equation (3) using random effects
regressions with board independence as the dependent variable. Panel A indicates that
family firms are associated with a lower proportion of independent directors on the board,
which is consistent with the univariate analysis (see Table 1, Panel B). Dividends have a
positive impact on board independence, which provides additional support for the
21
complementary nature of the relationship between dividends and independent directors.
Consistent with prior studies, board independence is found positively related to firm size,
but is negatively related to ownership concentration and the presence of CEO as board
chairman.
Panel B of Table 2 (column 3) indicates a nonlinear (i.e., U-shaped) relationship between
family ownership and board independence. That is, the proportion of independent
directors decreases with increasing family holdings. However, after reaching a minimum
when families hold around 64 per cent of voting rights, however, the proportion of
independent directors begins to increase. The analyses is repeated using dummy variables
to delineate firms into family firms with less than and greater than 64 per cent holdings
and non-family firms. While not presented, we find that both family groups are
associated with less independent boards compared to non-family firms, which is
consistent with earlier analyses. Overall, we find robust evidence that family firms adopt
a lower proportion of independent directors on the board than non-family firms, which is
consistent with the expropriation argument, and provides support to Hypothesis 3. The
fourth column in Table 2 provides the estimation of Equation (4) using random effects
regressions with board size as the dependent variable. Both Panels A and B indicate that
family control does not have an impact on board size, which is inconsistent with the
expropriation argument, and therefore does not provide support to Hypothesis 4.
22
4.5 Family Firms and the Simultaneity of Dividends, Debt and Board Structure.
In this section, the potential simultaneity among dividend, debt and board structure
decisions is addressed by examining the impact of family ownership on these decisions in
a simultaneous equations framework. Table 3 reports the estimations of Equations (1) –
(4) using the three-stage least square (3SLS) regression.13 Panel A in Table 3 (fifth row)
presents coefficients on family control for each equation. In the dividend and debt
equations, family control has a positive impact on dividend and debt, respectively. This is
consistent with the random effects regression, and is thus counter-intuitive to Hypotheses
1 and 2. In the board independence equation, the coefficient on family control is
significantly negative, which is consistent with our earlier analyses and provides support
to Hypothesis 3. In the board size equation, we find that family firms do not have a
significant impact on board size which provides no support to Hypothesis 4 and is
consistent with the random effects results.
___________________________
Insert Table 3 ___________________________
Panel B of Table 3 examines the possibility of a nonlinear impact of family ownership on
dividends, debt and board structure in a simultaneous equations framework.14 The fifth
13 The model has adequate goodness of fit. Except for Chi-square value (i.e., 48.59), the goodness of fit measures such as GFI (i.e., 0.99), RMSEA (i.e., 0.032), Adjusted GFI (i.e., 0.92) and NFI (i.e., 0.99) are acceptable (see Hair et al., 1998). 14 The model has adequate goodness of fit. Except for Chi-square value (i.e., 34.03), other measures such as GFI (i.e., 0.99), RMSEA (i.e., 0.037), Adjusted GFI (i.e., 0.93) and NFI (i.e., 0.99) are acceptable.
23

and sixth rows indicate that coefficients on family firm and the square of family
ownership are all significant in each equation, except in the board size equation.
Consistent with the random effects regression results, we find that the relationship
between dividend and family ownership as well as between debt and family ownership
reflect an inverse U-shape. In contrast, the association between board independence and
family ownership appears to be U-shaped. With regard to relationships among the
endogenous variables, Table 3 indicates that dividends, debt and board structure are
jointly determined, which justifies the use of the 3SLS regression in this study. That is, a
bi-directional relationship exists between dividend and board independence, between
dividend and debt as well as between board size and debt. As such, the significant impact
of family control and ownership on dividends, debt and board independence found in the
random effects regression remains robust even after controlling for simultaneity among
dividends, debt and board structure. Meanwhile, a non-significant association between
family firms and board size persists. As such, consistent with the random effects
regression, the 3SLS results provide support to Hypothesis 3, are counter-intuitive to
Hypotheses 1 and 2, and provide no support to Hypothesis 4.
4.6 Family Control and the Performance Effects of Dividends, Debt and Board
Structure
Table 4 presents the 3SLS estimations of the relationship between Tobin’s Q and
dividends, debt and board structure.15 The results suggest that the impact of dividends on
performance is stronger for family than non-family firms. That is, the coefficient on the
15 The model has adequate goodness of fit. Except for Chi-square value (i.e., 95.17), other measures such as GFI (i.e., 0.98), RMSEA (i.e., 0.057), Adjusted GFI (i.e., 0.88) and NFI (i.e., 0.97) are acceptable.
24
interaction term between family control and dividend (β15, which measures the
differential impact of dividends on Tobin’s Q for family and non-family firms) is positive
(i.e., β15 = 0.72, t = 2.17, p < 0.05), implying that investors view dividends as a more
effective tool to control Agency Problem II among family firms than to control Agency
Problem I among non-family firms. Consistently, the results suggest that dividends have
a positive impact on performance for family firms. Specifically, an examination of the
sum of the coefficient on dividend (β11, which measures the impact of dividends on
Tobin’s Q for non-family firms) and the coefficient on the interaction term of family
control and dividend (β15) is positive (i.e., β15 + β15 = 0.48, χ2 = 61.92, p < 0.01). In
contrast, the coefficient on dividend (β11 which measures the impact of dividend on
performance for non-family firms) is statistically insignificant at the conventional level
(i.e., β11 = -0.24, t = -0.70, p > 0.05).
___________________________
Insert Table 4 ___________________________
Results in Table 4 also indicate that the impact of debt on firm performance is greater for
family firms than non-family firms. That is, the coefficient on the interaction term
between family control and debt (β16, which measures the differential impact of debt on
Tobin’s Q for family and non-family firms) is positive (i.e., β16 = 3.458, t = 5.14, p <
0.01). The results also suggest that debt has little impact on family firm performance (i.e.,
β12+β16 = 0.178, χ2 = 1.06, p > 0.05), but it has a negative impact on performance for
non-family firms (i.e., β12 = -3.28, t = -4.62, p < 0.01).
25

With regard to board structure, the 3SLS regression indicates that board independence
has a positive impact on performance of family firms (i.e., β13+β17 = 0.617, χ2 = 13.11, p
< 0.01) and performance of non-family firms (β13 = 2.825, t = 2.61, p < 0.01). The impact
of board independence on performance, however, is weaker for family than non-family
firms. That is, the coefficient on the interaction term between family control and board
independence (β17, which measures the differential impact of board independence on
Tobin’s Q for family and non-family firms) is negative (i.e., β17 = -2.208, t = -1.96, p <
0.05).
Furthermore, board size appears to have a positive impact on performance of family firms
(β14+β18 = 0.104, χ2 = 8.69, p < 0.01), but it has insignificant impact on performance of
non-family firms (β14 = -0.122, t = -1.11, p > 0.05). This result suggests that family firms
could improve their performance by having larger boards (average board size of family
and non-family firms are 5.6 and 6.2 directors, respectively; the mean difference is
significant at 1% level (see Table 1, Panel B)). Consistently, the impact of board size on
performance appears to be greater for family than non-family firms. That is, the
coefficient on the interaction term between family control and board size (β18, which
measures the differential impact of board size on Tobin’s Q for family and non-family
firms) is positive (i.e., β18 = 0.226, t = 2.72, p < 0.01). Taken together, the evidence on
board size indicates that family firms benefit more by having a greater number of
directors (i.e., inside, affiliated and independent) on the board who could provide counsel
and advice than among their non-family counterparts. Finally, the aggregate impact of
family control on performance is positive and marginally significant (i.e.,
26
β15+β16+β17+β18+β19= 0.912, χ2 = 3.34, p < 0.10). Thus, the expropriation argument is
not supported.
In summary, dividends, board independence and board size are positively associated with
performance of family firms; while performance of non-family firms is positively related
to board independence, but it is not related to dividends and board size. The results also
indicate that the impact of dividends and board size on performance is stronger for family
firms than non-family firms, but the impact of board independence is weaker for family
firms than non-family firms. This partly explains why Australian families rely more on
dividends than independent directors in controlling agency problems.
4.7 Additional Robustness Checks
Several additional analyses were conducted to test the robustness of the results. First, our
analysis potentially suffers from a reverse-causality problem. On the one hand, it is
possible that family ownership leads to higher dividends and debt as well as lower board
independence, while on the other hand it is also possible that higher dividends and debt
and lower board independence induce families to maintain their holdings. To address this
potential problem, we use the instrumental-variable (IV) procedure to estimate Equations
(1) – (4). Following Hermalin and Weisbach (1991), we create a lagged family ownership
variable (lagged by one year) and use it as an instrument for measuring family ownership.
While not reported, estimates from the random effects regressions which include this
27
instrumental variable are consistent with the random effects and 3SLS results presented
in Tables 2 (Panel B) and 3, respectively.
Second, to examine whether the results in prior sections are sensitive to alternate
measurements, we re-estimate Equations (1) and (2) using alternate proxies for dividends
and debt. Specifically, we calculate the dividend payout ratio using ordinary dividends
scaled by operating cash flows (La Porta et al., 2000; Faccio et al., 2001a) and ordinary
dividends scaled by operating income (Jensen et al., 1992), and define debt as the ratio of
total liabilities to total liabilities plus market value of equity, and the ratio of long-term
debt to total assets (Anderson and Reeb, 2003b). While not presented, the random effects
and 3SLS regressions provide similar results to the earlier analyses and indicate that
family firms pay higher dividends, employ higher debt levels and have a lower proportion
of independent directors on the board.
Third, to remove the possibility that firms with positive retained earnings but negative net
earnings were unable to pay dividends due to cash shortages, the analysis was repeated
using a subset of firms with only non-negative net earnings (consequently, the sample
size was reduced to 1,355 observations). The results are consistent with earlier analysis.
Finally, we test the sensitivity of the findings in the presence of outliers and influential
observations by truncating the largest one to five percent probability levels for each tail
of the distribution for the model variables. In general, the results are not substantially
different from earlier analyses
28

5. Conclusion
This paper investigates the impact of family ownership and control on the firm’s dividend,
debt and board structure decisions. Specifically, we test the argument that families tend
to increase the moral hazard conflict between controlling and minority shareholders (i.e.,
Agency Problem II) by paying lower dividends, employing higher debt levels, and
assembling boards that are less effective monitors (i.e., boards with a lower proportion of
independent directors and boards that are large). In addition, to shed light on whether the
effectiveness of dividends, debt and board structure in controlling agency problems
depend on the types of agency problems (i.e., the large-minority shareholder conflict
versus the classic owner-manager conflict), we test the impact of these mechanisms on
the performance of family and non-family firms. This study examines panel data on a
sample of Australian publicly traded firms over the period 2000-2005. We employ a
random effects regression to minimise spurious relationships between dependent and
independent variables, and, more importantly, use the 3SLS regression to address the
endogeneity problem among dividends, debt and board structure.
Our analysis indicates that family firm governance mechanisms differ from their non-
family counterparts. That is, family firms pay higher dividends and employ higher debt
levels than their non-family counterparts, which suggests that they do not expropriate
minority shareholders via dividends and debt. Families, however, prefer fewer
independent directors on their boards, which is consistent with the expropriation
argument. The relationships between family ownership and dividends, debt and board
29
independence appear to be non-linear. Overall, the results suggest that, in terms of
governance, families use dividends or debt as substitutes for independent directors. The
findings are consistent with the notion that some governance mechanisms (e.g., the
market for corporate control, institutional investors and compensation) play a less
important role in controlling agency problems in Australia, making the governance role
of dividends and debt in family firms more significant. Consistent with this evidence, we
also find that the effectiveness of dividends, debt and boards in controlling agency
problems are moderated by family control. Specifically, our analysis indicates that
dividends, board independence and size are positively related to performance of family
firms; whereas performance of non-family firms is positively associated with board
independence but not to dividends and board size. More importantly, the impact of
dividends, debt and board size on performance appears to be stronger for family firms
than non-family firms, but the impact of board independence is weaker for family firms
than non-family firms. The 3SLS result also suggests that dividends, debt and board
structure are interdependent, which justifies the use of a simultaneous equations model.
This paper provides several important contributions to the literature. As researchers
continue to explore the severity of agency problems in family firms by focusing on
performance, our findings shed further light on this issue by examining the interacting
roles that both ownership structure and specific corporate governance mechanisms play
in mitigating or exacerbating agency issues, particularly among public firms which have
high investor protection and high private benefits of control. This research is also
conducted on firm data from a country that has relatively flexible corporate governance
30
regulation, where there is no mandate for publicly listed firms to have a minimum
number of independent directors on the board. Indeed, the Australian market for
corporate control, institutional investors and compensation play a less significant role in
controlling agency problems compared to other developed economies, such as the U.S.
Australian system of corporate governance is also considered as in transition from an
insider system, such as Japan and Germany, to an outsider system, such the U.S. and U.K.
Our findings, thereby, provide insights on the effectiveness of the corporate governance
role of dividends, debt and boards in such an environment. In addition, this paper
examines the governance role of dividends, debt and board structure in the context of
family and non-family firms in a simultaneous equations framework. Our analysis,
therefore, minimises simultaneous bias and inconsistent parameter estimates.
The practical implications of the study’s findings indicate that in order to improve firm
performance, family controlled firms need to adopt larger and more independent boards
as well as pay higher dividends. The study’s results also imply that family firms
operating on the capital market should be aware of investors’ need for higher dividends
as investors consider dividends a more effective governance device in controlling Agency
Problem II. Meanwhile, non-family firms should be sensitive to investors’ aspiration for
more independent boards as investors view independent directors as a more effective
governance mechanism in controlling Agency Problem I. Finally, the findings on the
positive impact of board independence on dividends and performance could serve to
justify initiative policies to encourage firms to increase the proportion of independent
directors on the board.
31

References
Agrawal, A., Knoeber, C., 1996. Firm performance and mechanisms to control agency problems between managers and shareholders. Journal of Financial and Quantitative Analysis 31, 377-397.
Anderson, R.C., Reeb, D.M., 2004. Board composition: Balancing family influence in S&P 500 firms. Administrative Science Quarterly 49, 209-237.
Anderson, R.C., Reeb, D.M., 2003a. Founding family ownership and firm performance: Evidence from the S&P 500. Journal of Finance 58, 1301-1328.
Anderson, R.C. and D.M. Reeb. 2003b. Founding family ownership, corporate diversification and firm leverage. Journal of Law and Economics, October, 653-84.
Anderson, R.C., S.A. Mansi, and D.M. Reeb. 2003c. Founding family ownership and the agency cost of debt. Journal of Financial Economics 68, 263-85.
Ang, J.S., Coles, R.A., Wuh-Lin, J., 2000. Agency costs and ownership structure. Journal of Finance 55, 81-107.
Bebchuk, L., 1999. A rent protection theory of corporate ownership and control. Working Paper, Harvard University.
Boone, A.L., Fields, L.C., Karpoff, J.M., Raheja, C.G., 2007. The determinants of corporate board size and composition: An empirical analysis. Journal of Financial Economics, (forthcoming).
Claessens, S., Djankov, S., Fan, J.P.H., Lang, L.H.P., 2002. Disentangling the incentive and entrenchment effects of large shareholdings. Journal of Finance 57, 2741-2771.
Coles, J.L., Daniel, N.D., Naveen, L., 2007. Boards: Does one size fit all? Journal of Financial Economics, (forthcoming).
Craswell, A.T., Taylor, S.L., Saywell, R.A., 1997. Ownership structure and corporate performance: Australian evidence. Pacific-Basin Finance Journal 5, 301-323.
Demsetz, H. and B. Villalonga. 2001. Ownership structure and corporate performance. Journal of Corporate Finance 7, 209-233.
Dignam, A. and M. Galanis. 2004. Australia inside-out: The corporate governance system of the Australian listed market. Melbourne University Law Review 28, 623-653.
Easterbrook, F.H., 1984. Two agency-cost explanations of dividends. American Economic Review 74, 650-659.
Faccio, M., Lang, L.H.P., Young, L., 2001a. Dividends and expropriation. American Economic Review 91, 54-78.
Faccio, M., Lang, H.P.L., Young, L., 2001b. Debt and corporate governance. Working Paper.
Fama, E., Jensen, M., 1983. Separation of ownership and control. Journal of Law and Economics 26, 301-325.
Gomez-Mejia, L.R., Larraza-Kintana., M., 2003. The determinants of executive compensation in family controlled public corporation. Academy of Management Journal 46, 226-237.
Gugler, K., 2003. Corporate governance, dividend payout policy, and the interrelation between dividends, R&D, and capital investment. Journal of Banking and Finance 27, 1297-1321.
Hair, J.H., Anderson, R.E., Tatham, R.L., Black, W.C., 1998. Multivariate Data Analysis. Prentice-Hall International, Inc, New Jersey, USA.
32

Hermalin, B., and Weisbach, M., 1991. The Effect of Board Composition and Direct Incentives on Firm Performance. Financial Management 20, 101-112.
Hermalin, B., and Weisbach, M., 2003. Boards of Directors as an Endogenously Determined Institution: A Survey of the Economic Literature. Economic Policy Review 9, 7-26.
Jensen, G.R., Solberg, D.P., Zorn, T.S., 1992. Simultaneous determination of insider ownership, debt, and dividend. Journal of Financial Quantitative Analysis 27, 247-263.
Jensen, M., 1993. The modern industrial revolution, exit and failure of internal control systems. Journal of Finance 48, 831-880.
Jensen, M., Meckling, W., 1976. Theory of the firm: Managerial behaviour, agency costs, and ownership structure. Journal of Financial Economics 3, 305-360.
Jensen, M.C., 1986. Agency costs of free cash flow, corporate finance and takeover. American Economic Review 76, 323-329.
Kole, S., 1997. The complexity of compensation contracts. Journal of Financial Economics 43, 79-104.
La Porta, R., Lopez-de-Silanes, F., Shleifer, A., 1999. Corporate ownership around the world. Journal of Finance 54, 471-517.
La Porta, R., Lopez-de-Silanes, F., Shleifer, A., Vishny, R.W., 2000. Agency problems and dividend policies around the world. Journal of Finance 55, 1-33.
Lamba, A., Stapledon, G., 2001. The determinants of corporate ownership structure: Australian evidence. Working Paper 20, Faculty of Law, University of Melbourne.
McConnell, J.J., Servaes, H., 1990. Additional evidence on equity ownership and corporate value. Journal of Financial Economics 27, 595-612.
Mehran, H. 1995. Executive compensation structure, ownership and firm performance. Journal of Financial Economics 38, 163-84.
Mroczkowski, N., Tanewski, G.A., 2007. Delineating publicly listed family and non-family controlled firms: An approach for capital markets research in Australia. Journal of Small Business Management (forthcoming).
Nenova, T., 2003. The value of corporate voting rights and control: A cross-country analysis. Journal of Financial Economics 68, 325-351.
Raheja, C.G., 2005. Determinants of board size and composition: A theory of corporate boards. Journal of Financial and Quantitative Analysis 40, 283-306.
Rozeff, M.S., 1982. Growth, beta, and agency costs as determinants of dividend payout ratios. Journal of Financial Research 5, 249-259.
Shivdasani, A., 1993. Board composition, ownership structure and hostile takeovers. Journal of Accounting and Economics 16, 167-198.
Shleifer, A., Vishny, R., 1997. A survey of corporate governance. Journal of Finance 52, 737-783.
Suchard, J.A., Singh, M., Barr, M., 2001. The market effects of CEO turnover in Australian firms. Pacific-Basin Finance Journal 9, 1-27.
Villalonga, B., Amit, R., 2006. How do family ownership, control, and management, affect firm value? Journal of Financial Economics 80, 385-417.
Westphal, J.D., 1998. Board games: How CEOs adapt to increases structural board independence from management. Administrative Science Quarterly 43, 511-538.
33

Table 1
Descriptive Statistics and Univariate Analyses Panel A. Descriptive Statistics
Variable Mean Median Std. Dev.
Min. Max. Skew-ness
Kur- tosis
Primary Variable Dividend / Net earnings 0.473 0.489 0.462 0 5.411 3.14 24.25 Number of directors 6.08 6.00 2.10 3 15 0.83 0.83 % of independent directors 0.432 0.428 0.245 0 1 -0.15 -0.74 Total debt / Assets 0.227 0.222 0.171 0 1.448 1.10 3.54 Ownership Structure Family ownership † 0.407 0.378 0.162 0.200 1 1.82 2.41 Non-family blockholdings 0.344 0.304 0.239 0 1 0.59 -0.38 % of substantial holdings 0.446 0.441 0.237 0 1 0.15 -0.76 Firm Characteristics Growth of revenue 0.447 0.143 1.100 -0.86 8.61 4.51 22.51 Net income/ Assets 0.055 0.053 0.103 -1.36 0.840 -2.04 38.86 Total assets (A$ million) 1100 150 3591 0.933 55000 0.26 -0.44 Business risk (A$ million) 22.03 4.55 62.99 0.043 1636 13.05 290.6 Capital expenditure / Assets 0.063 0.039 0.074 0 0.587 2.89 11.68 % DRP firms* 0.240 - - - - - - Tax paid / Assets 0.022 0.018 0.023 0 0.182 0.01 6.94 Net PPE/ Assets 0.317 0.293 0.227 0 0.97 0.50 -0.53 Firm age 34.02 21.00 28.24 3 168 1.53 2.17 * This indicates proportion of firms, rather than the mean proportion for associated variable. † Based on family firms (381 observations). Panel B. Comparison of Family and Non-family Firms
Measure Family Firm Non-Family Firms Difference t-statistic
Dividend/ Net earnings 0.4829 0.4692 0.0137 0.62 Proportion of independent directors 0.3095 0.4722 -0.1627 -11.70***
Board size 5.6010 6.2428 -0.6417 -5.190***
Debt / Assets 0.2495 0.2202 0.0293 2.89***
Non-family blockholders 0.1713 0.4008 0.2296 -17.78***
Net income/ Assets 0.0507 0.0569 -0.0062 -1.014
Growth of revenue 0.2139 0.5256 -0.3117 -4.83***
Total assets (in A$ m) 440 1400 -960 -4.47***
Business risk 8.4149 26.5519 -18.1370 -4.90***
Capital-exp. / Assets 0.0440 0.0699 -0.0259 -5.99***
Net PPE / Assets 0.2732 0.3318 -0.0586 -4.39***
Firm age 33.37 34.23 -0.86 0.60 Number of observation 381 1149
†Chi Square test *** Significant at the 0.01 level ** Significant at the 0.05 level * Significant at the 0.10 level
34
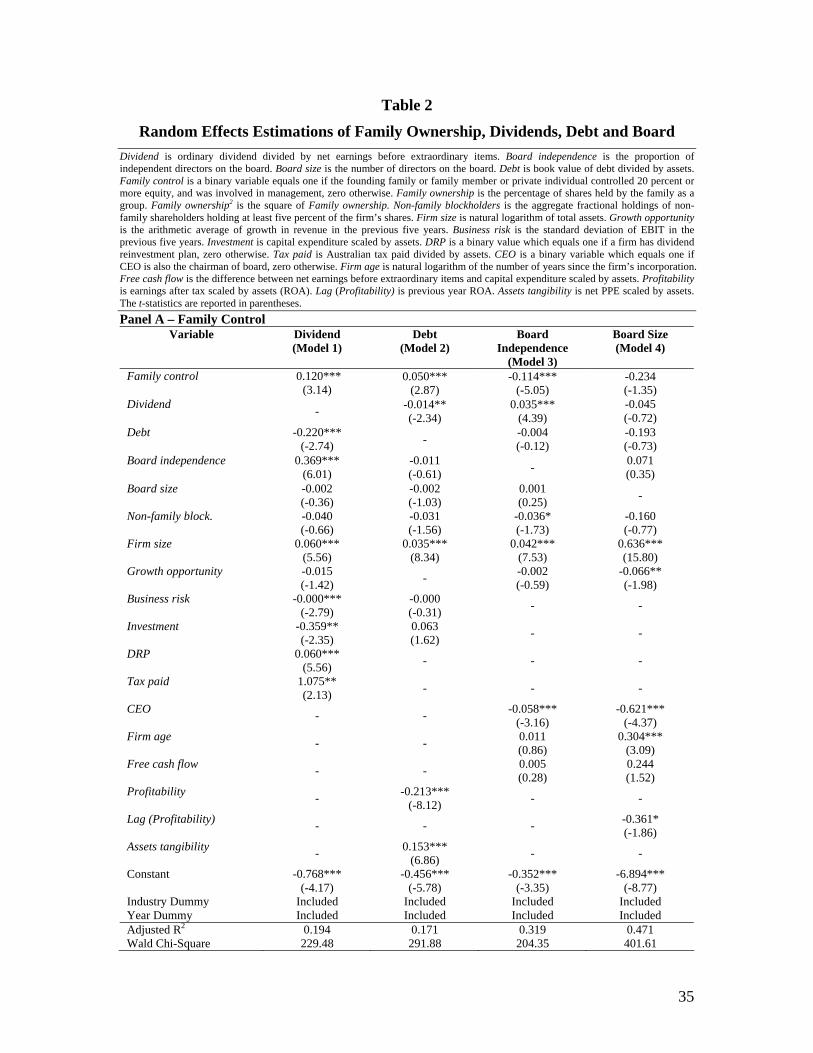
Table 2
Random Effects Estimations of Family Ownership, Dividends, Debt and Board Dividend is ordinary dividend divided by net earnings before extraordinary items. Board independence is the proportion of independent directors on the board. Board size is the number of directors on the board. Debt is book value of debt divided by assets. Family control is a binary variable equals one if the founding family or family member or private individual controlled 20 percent or more equity, and was involved in management, zero otherwise. Family ownership is the percentage of shares held by the family as a group. Family ownership2 is the square of Family ownership. Non-family blockholders is the aggregate fractional holdings of non-family shareholders holding at least five percent of the firm’s shares. Firm size is natural logarithm of total assets. Growth opportunity is the arithmetic average of growth in revenue in the previous five years. Business risk is the standard deviation of EBIT in the previous five years. Investment is capital expenditure scaled by assets. DRP is a binary value which equals one if a firm has dividend reinvestment plan, zero otherwise. Tax paid is Australian tax paid divided by assets. CEO is a binary variable which equals one if CEO is also the chairman of board, zero otherwise. Firm age is natural logarithm of the number of years since the firm’s incorporation. Free cash flow is the difference between net earnings before extraordinary items and capital expenditure scaled by assets. Profitability is earnings after tax scaled by assets (ROA). Lag (Profitability) is previous year ROA. Assets tangibility is net PPE scaled by assets. The t-statistics are reported in parentheses. Panel A – Family Control
Variable Dividend (Model 1)
Debt (Model 2)
Board Independence
(Model 3)
Board Size (Model 4)
Family control 0.120*** (3.14)
0.050*** (2.87)
-0.114*** (-5.05)
-0.234 (-1.35)
Dividend - -0.014** (-2.34)
0.035*** (4.39)
-0.045 (-0.72)
Debt
-0.220*** (-2.74) - -0.004
(-0.12) -0.193 (-0.73)
Board independence 0.369*** (6.01)
-0.011 (-0.61) - 0.071
(0.35) Board size -0.002
(-0.36) -0.002 (-1.03)
0.001 (0.25) -
Non-family block.
-0.040 (-0.66)
-0.031 (-1.56)
-0.036* (-1.73)
-0.160 (-0.77)
Firm size
0.060*** (5.56)
0.035*** (8.34)
0.042*** (7.53)
0.636*** (15.80)
Growth opportunity
-0.015 (-1.42) - -0.002
(-0.59) -0.066** (-1.98)
Business risk
-0.000*** (-2.79)
-0.000 (-0.31) - -
Investment
-0.359** (-2.35)
0.063 (1.62) - -
DRP
0.060*** (5.56) - - -
Tax paid
1.075** (2.13) - - -
CEO - - -0.058***
(-3.16) -0.621***
(-4.37) Firm age - - 0.011
(0.86) 0.304***
(3.09) Free cash flow - - 0.005
(0.28) 0.244 (1.52)
Profitability - -0.213***
(-8.12) - -
Lag (Profitability) - - - -0.361*
(-1.86) Assets tangibility - 0.153***
(6.86) - -
Constant -0.768*** (-4.17)
-0.456*** (-5.78)
-0.352*** (-3.35)
-6.894*** (-8.77)
Industry Dummy Included Included Included Included Year Dummy Included Included Included Included Adjusted R2 0.194 0.171 0.319 0.471 Wald Chi-Square 229.48 291.88 204.35 401.61
35
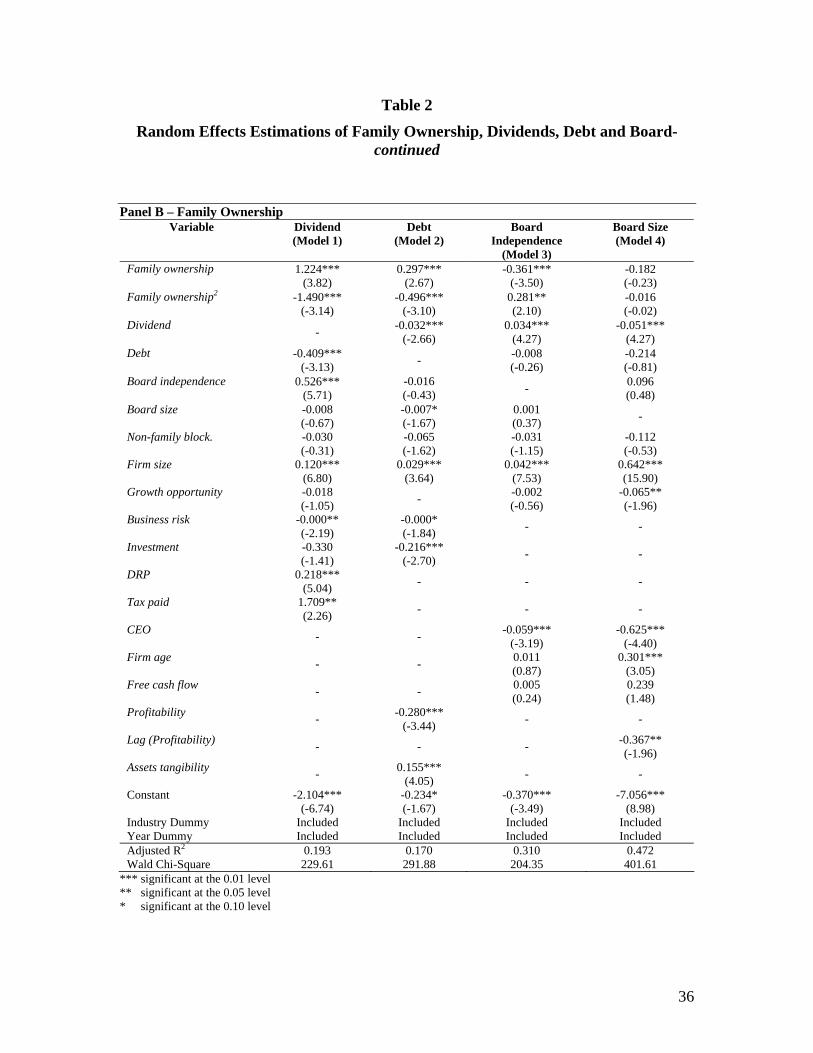
Table 2
Random Effects Estimations of Family Ownership, Dividends, Debt and Board- continued
Panel B – Family Ownership
Variable Dividend (Model 1)
Debt (Model 2)
Board Independence
(Model 3)
Board Size (Model 4)
Family ownership 1.224*** (3.82)
0.297*** (2.67)
-0.361*** (-3.50)
-0.182 (-0.23)
Family ownership2 -1.490*** (-3.14)
-0.496*** (-3.10)
0.281** (2.10)
-0.016 (-0.02)
Dividend - -0.032*** (-2.66)
0.034*** (4.27)
-0.051*** (4.27)
Debt
-0.409*** (-3.13) - -0.008
(-0.26) -0.214 (-0.81)
Board independence 0.526*** (5.71)
-0.016 (-0.43) - 0.096
(0.48) Board size -0.008
(-0.67) -0.007* (-1.67)
0.001 (0.37) -
Non-family block.
-0.030 (-0.31)
-0.065 (-1.62)
-0.031 (-1.15)
-0.112 (-0.53)
Firm size
0.120*** (6.80)
0.029*** (3.64)
0.042*** (7.53)
0.642*** (15.90)
Growth opportunity
-0.018 (-1.05) - -0.002
(-0.56) -0.065** (-1.96)
Business risk
-0.000** (-2.19)
-0.000* (-1.84) - -
Investment
-0.330 (-1.41)
-0.216*** (-2.70) - -
DRP
0.218*** (5.04) - - -
Tax paid
1.709** (2.26) - - -
CEO - - -0.059***
(-3.19) -0.625***
(-4.40) Firm age - - 0.011
(0.87) 0.301***
(3.05) Free cash flow - - 0.005
(0.24) 0.239 (1.48)
Profitability - -0.280***
(-3.44) - -
Lag (Profitability) - - - -0.367**
(-1.96) Assets tangibility - 0.155***
(4.05) - -
Constant -2.104*** (-6.74)
-0.234* (-1.67)
-0.370*** (-3.49)
-7.056*** (8.98)
Industry Dummy Included Included Included Included Year Dummy Included Included Included Included Adjusted R2 0.193 0.170 0.310 0.472 Wald Chi-Square 229.61 291.88 204.35 401.61
*** significant at the 0.01 level ** significant at the 0.05 level * significant at the 0.10 level
36

Table 3
3SLS Estimations of Family Ownership, Dividends, Debt and Board Dividend is ordinary dividend divided by net earnings before extraordinary items. Board independence is the proportion of independent directors on the board. Board size is the number of directors on the board. Debt is book value of debt divided by assets. Family control is a binary variable equals one if the founding family or family member or private individual controlled 20 percent or more equity, and was involved in management, zero otherwise. Family ownership is the percentage of shares held by the family as a group. Family ownership2 is the square of Family ownership. Non-family blockholders is the aggregate fractional holdings of non-family shareholders holding at least five percent of the firm’s shares. Firm size is natural logarithm of total assets. Growth opportunity is the arithmetic average of growth in revenue in the previous five years. Business risk is the standard deviation of EBIT in the previous five years. Investment is capital expenditure scaled by assets. DRP is a binary value which equals one if a firm has dividend reinvestment plan, zero otherwise. Tax paid is Australian tax paid divided by assets. CEO is a binary variable which equals one if CEO is also the chairman of board, zero otherwise. Firm age is natural logarithm of the number of years since the firm’s incorporation. Free cash flow is the difference between net earnings before extraordinary items and capital expenditure scaled by assets. Profitability is earnings after tax scaled by assets (ROA). Lag (Profitability) is previous year ROA. Assets tangibility is net PPE scaled by assets. The t-statistics are reported in parentheses. Panel A – Family Control
Variable Dividend Debt Board Independence
Board Size
Dividend - -0.688***
(-6.85) 0.189***
(4.33) 0.053 (1.10)
Debt
-0.846*** (-3.28) - -0.017
(-0.15) -2.178** (-2.47)
Board independence
1.878*** (4.19)
1.771*** (4.74) - -5.338***
(-2.65) Board size
-0.151*** (-3.49)
-0.160*** (-4.55)
-0.004 (-0.16) -
Family control
0.349*** (4.55)
0.324*** (5.03)
-0.160*** (-10.44)
-0.665 (-1.58)
Non-family blockholders
0.182* (1.88)
0.189*** (2.64)
-0.130*** (-4.61)
-0.405 (-1.17)
Firm size 0.112*** (4.01)
0.105*** (5.40)
0.038* (1.74)
0.981*** (10.82)
Growth opportunity
-0.008 (-0.96) - -0.002
(-0.35) 0.009 (0.26)
Business risk -0.000*** (-3.80)
-0.000*** (-4.33) - -
Investment
-0.644*** (-4.35)
-0.519*** (-4.87) - -
DRP
0.046* (1.69) - - -
Tax paid
0.859** (1.98) - -
CEO - - -0.074***
(-3.01) -1.216***
(-6.32) Firm age - - 0.015
(1.58) 0.268***
(4.84) Free cash flow - - -0.042
(-1.38) 0.112 (0.48)
Profitability - -0.149**
(-2.18) - -
Lag (Profitability) - - - -0.595**
(-2.15) Assets tangibility - 0.036
(1.13) - -
Constant
-1.458*** (-4.42)
-1.346*** (-5.26)
-0.310 (-1.16)
-10.486*** (-12.73)
Industry Dummy Included Included Included Included Year Dummy Included Included Included Included
37
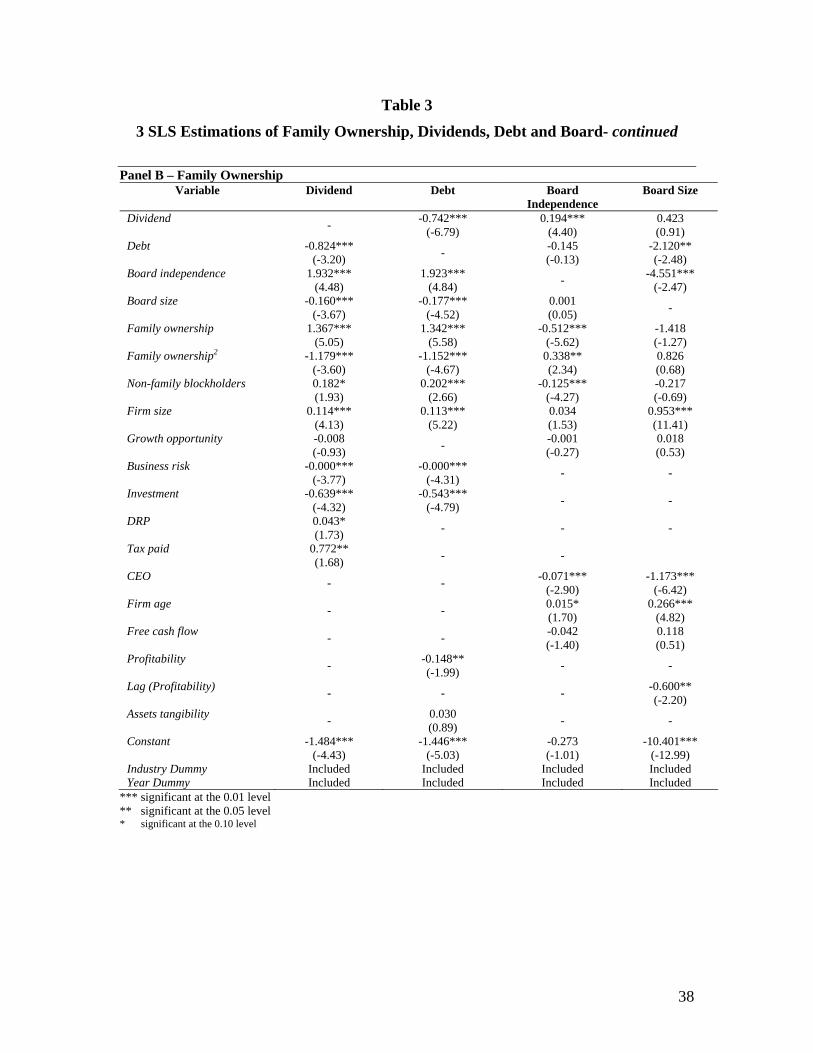
Table 3
3 SLS Estimations of Family Ownership, Dividends, Debt and Board- continued Panel B – Family Ownership
Variable Dividend Debt Board Independence
Board Size
Dividend - -0.742***
(-6.79) 0.194***
(4.40) 0.423 (0.91)
Debt
-0.824*** (-3.20) - -0.145
(-0.13) -2.120** (-2.48)
Board independence
1.932*** (4.48)
1.923*** (4.84) - -4.551***
(-2.47) Board size
-0.160*** (-3.67)
-0.177*** (-4.52)
0.001 (0.05) -
Family ownership
1.367*** (5.05)
1.342*** (5.58)
-0.512*** (-5.62)
-1.418 (-1.27)
Family ownership2
-1.179***
(-3.60) -1.152***
(-4.67) 0.338** (2.34)
0.826 (0.68)
Non-family blockholders
0.182* (1.93)
0.202*** (2.66)
-0.125*** (-4.27)
-0.217 (-0.69)
Firm size 0.114*** (4.13)
0.113*** (5.22)
0.034 (1.53)
0.953*** (11.41)
Growth opportunity
-0.008 (-0.93) - -0.001
(-0.27) 0.018 (0.53)
Business risk -0.000*** (-3.77)
-0.000*** (-4.31) - -
Investment
-0.639*** (-4.32)
-0.543*** (-4.79) - -
DRP
0.043* (1.73) - - -
Tax paid
0.772** (1.68) - -
CEO - - -0.071***
(-2.90) -1.173***
(-6.42) Firm age - - 0.015*
(1.70) 0.266***
(4.82) Free cash flow - - -0.042
(-1.40) 0.118 (0.51)
Profitability - -0.148**
(-1.99) - -
Lag (Profitability) - - - -0.600**
(-2.20) Assets tangibility - 0.030
(0.89) - -
Constant
-1.484*** (-4.43)
-1.446*** (-5.03)
-0.273 (-1.01)
-10.401*** (-12.99)
Industry Dummy Included Included Included Included Year Dummy Included Included Included Included
*** significant at the 0.01 level ** significant at the 0.05 level * significant at the 0.10 level
38
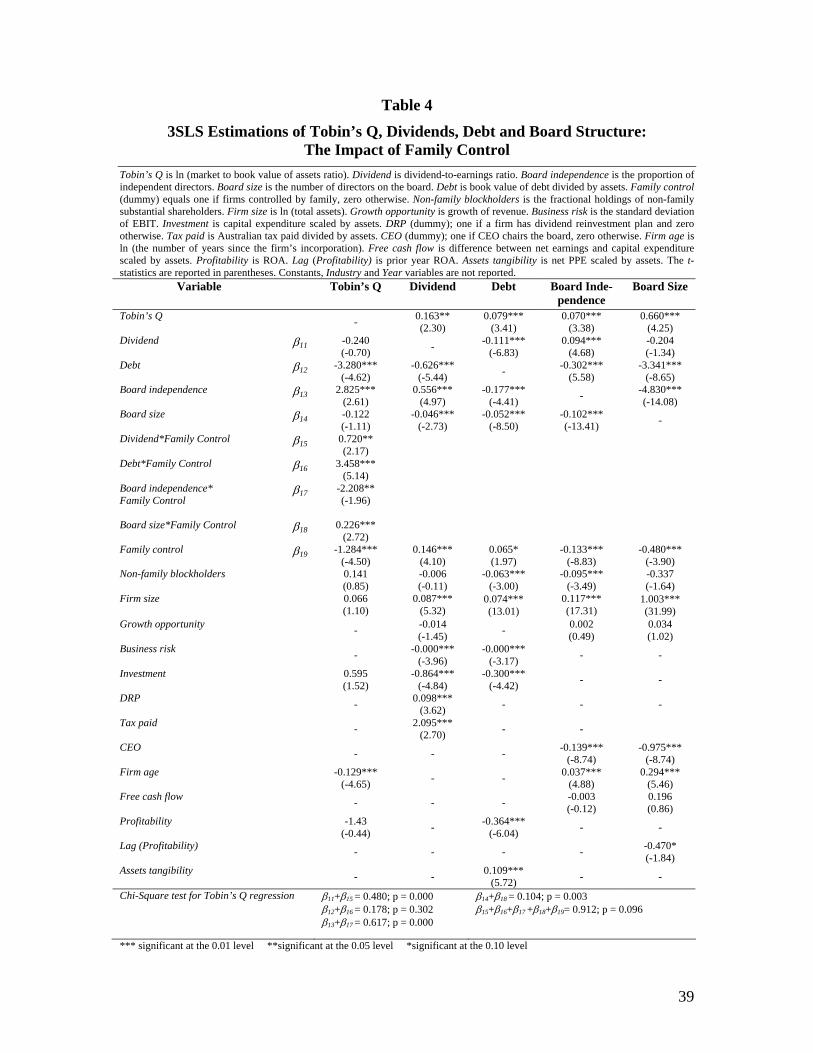
Table 4
3SLS Estimations of Tobin’s Q, Dividends, Debt and Board Structure: The Impact of Family Control
Tobin’s Q is ln (market to book value of assets ratio). Dividend is dividend-to-earnings ratio. Board independence is the proportion of independent directors. Board size is the number of directors on the board. Debt is book value of debt divided by assets. Family control (dummy) equals one if firms controlled by family, zero otherwise. Non-family blockholders is the fractional holdings of non-family substantial shareholders. Firm size is ln (total assets). Growth opportunity is growth of revenue. Business risk is the standard deviation of EBIT. Investment is capital expenditure scaled by assets. DRP (dummy); one if a firm has dividend reinvestment plan and zero otherwise. Tax paid is Australian tax paid divided by assets. CEO (dummy); one if CEO chairs the board, zero otherwise. Firm age is ln (the number of years since the firm’s incorporation). Free cash flow is difference between net earnings and capital expenditure scaled by assets. Profitability is ROA. Lag (Profitability) is prior year ROA. Assets tangibility is net PPE scaled by assets. The t-statistics are reported in parentheses. Constants, Industry and Year variables are not reported.
Variable Tobin’s Q Dividend Debt Board Inde- pendence
Board Size
Tobin’s Q
- 0.163** (2.30)
0.079*** (3.41)
0.070*** (3.38)
0.660*** (4.25)
Dividend
β11 -0.240 (-0.70) - -0.111***
(-6.83) 0.094***
(4.68) -0.204 (-1.34)
Debt
β12 -3.280*** (-4.62)
-0.626*** (-5.44) - -0.302***
(5.58) -3.341***
(-8.65) Board independence
β13 2.825*** (2.61)
0.556*** (4.97)
-0.177*** (-4.41) - -4.830***
(-14.08) Board size
β14 -0.122 (-1.11)
-0.046*** (-2.73)
-0.052*** (-8.50)
-0.102*** (-13.41) -
Dividend*Family Control
β15 0.720** (2.17)
Debt*Family Control
β16 3.458*** (5.14)
Board independence* Family Control
β17 -2.208** (-1.96)
Board size*Family Control
β18 0.226*** (2.72)
Family control
β19 -1.284*** (-4.50)
0.146*** (4.10)
0.065* (1.97)
-0.133*** (-8.83)
-0.480*** (-3.90)
Non-family blockholders 0.141 (0.85)
-0.006 (-0.11)
-0.063*** (-3.00)
-0.095*** (-3.49)
-0.337 (-1.64)
Firm size 0.066 (1.10)
0.087*** (5.32)
0.074*** (13.01)
0.117*** (17.31)
1.003*** (31.99)
Growth opportunity
- -0.014 (-1.45) - 0.002
(0.49) 0.034 (1.02)
Business risk - -0.000*** (-3.96)
-0.000*** (-3.17) - -
Investment
0.595 (1.52)
-0.864*** (-4.84)
-0.300*** (-4.42) - -
DRP
- 0.098*** (3.62) - - -
Tax paid
- 2.095*** (2.70) - -
CEO
- - - -0.139*** (-8.74)
-0.975*** (-8.74)
Firm age
-0.129*** (-4.65) - - 0.037***
(4.88) 0.294***
(5.46) Free cash flow
- - - -0.003 (-0.12)
0.196 (0.86)
Profitability
-1.43 (-0.44) - -0.364***
(-6.04) - -
Lag (Profitability)
- - - - -0.470* (-1.84)
Assets tangibility
- - 0.109*** (5.72) - -
Chi-Square test for Tobin’s Q regression
β11+β15 = 0.480; p = 0.000 β12+β16 = 0.178; p = 0.302 β13+β17 = 0.617; p = 0.000
β14+β18 = 0.104; p = 0.003 β15+β16+β17 +β18+β19= 0.912; p = 0.096
*** significant at the 0.01 level **significant at the 0.05 level *significant at the 0.10 level
39