family planning kap survey
TRANSCRIPT

FAMILY PLANNING KAP SURVEYIN MANIPUR STATE- INDIA
Serena Donati MD*, SharmaNabakanta MD?, Emanuela Medda Bsc* and Michele Grandolfo Bsc*.
* Department ofEpidemiology and Biostatistics, Istituto Superiore di Sanit?, Viale ReginaElena 299, 00161 Rome, Italy
?
Correspondingauthor
Serena Donati
Department ofEpidemiology and Bistatistics, Istituto Superiore di Sanit?

Viale Regina Elena 299, 00161 Rome, Italy
e-mail [email protected]
tel.: + 39 649902116
fax: + 39 649387069
ABSTRACT
Objective: to provideinformation of knowledge, attitude and practice in family planning, to estimateunmet need for contraception and to investigate accessibility and the qualityof the health services of a representative sample of the female population ofreproductive age resident in ManipurState, India.
Methods: Three probabilisticsamples of women of reproductive age (n=407) randomly selected from theelectoral rolls of one Hindu town, one Hindu village and one Muslim villagewere interviewed in their homes. Univariate and multivariate statisticalanalyses were performed using STATA software.
Findings: the prevalence ofcurrent use of high efficacy methods among currently married women is 50% withwide variations between the three study areas: 17% in the Muslim village, 61%in the Hindu village and 64% in the Hindu town. Total unmet need for familyplanning is 25.6%. Women?s and husband?s low educational level, being Muslimand living in a rural area are positively associated with contraceptive unmetneed. Most important sources of family planning are: media (43%), healthproviders (32%) and friends (16%). The main contraceptives provider is theKakching Post Partum Centre (66%), followed by the pharmacy (15%) and private medicaldoctors (10%).
Conclusion: despite theimportant reduction of the total fertility rate (from 5.2 in 1970-72 to 2.9 in1996-98) and the favourable attitudesregarding family planning, there is a gap between fertility preference andachievement, and the prevalence of contraception use is still low especiallyamong Muslim women.
INTRODUCTION
The new NationalPopulation Policy adopted by the Indian Government in 2000 has set as itsimmediate objective the task of addressing unmet need for contraception, inorder to achieve the medium term objective, of bringing the total fertilityrate down to replacement level by the year 2010. One of the goals identifiedfor this purpose, is to achieve universal access to information - counselling

and services for fertility regulation and contraception with a wide range ofchoice (1).
State level andnational-level information on fertility and family planning trends have beenprovided by India?sfirst and second National Family Health Survey (NFHS) conducted in 1992-93 and1998-99. The total fertility rate in India has declined from 5.2children per woman in the years 1970-72 to 3.4 in 1992-93 and 2.9 in 96-98.Contraceptive prevalence was, on average, 41% in 1992-93 and 48% in 1998-99,with huge variations among states that are still in different stages ofdemographic transition and among communities according to religion, literacyand utilisation of health facilities (2,3).
The State of Manipur is one of the smallest in India (22,327-squared km) with atotal population of over 1,800,000. The annual per capita income is around$400. According to NFHS-2 in Manipur (4), the percentage of women who areilliterate is 41% and the percentage of illiterate men is 20%. The study areais Kakching, a subdivision of Thoubal district, with a resident population ofaround 100,000 people. 85% of the resident population is Hindu and 15% isMuslim.
A CommunityHealth Centre with an attached Post Partum Centre that offers EssentialObstetric Care, family planning and medical termination of pregnancy servesKakching. It is also served by a good number of private practitioners, bothmedical doctors and paramedical staff.
In spite of thegovernmental effort, contraceptive prevalence among women in Kakching is low and there is an urgent need tounderstand better the discrepancy between reproductive preferences and familyplanning practices.
The objectives of this study are toprovide information of knowledge, attitude and practice in family planning, to

estimate unmet need for contraception and to investigate accessibility and thequality of the health services providing contraceptives among threerepresentative samples of women in reproductive age living in an urban and in arural Hindu setting and in a Muslim village of Kakching district.
METHODS
Threeprobabilistic samples of women of reproductive age were randomly selected fromthe electoral rolls in the three areas under study. 197 women weresystematically selected from the Hindu Kakching town, 102 from Irengband Hinduvillage and 108 from Sora Muslim village.
A questionnairewas designed according to KAP methodology. It was discussed in Kakching withlocal experts and community members and was pre-tested in the field.
Questions wereclosed and precoded and average time for administration was 20-30 minutes.
The DistrictAuthority issued a formal authorisation for fieldwork and data collection. Afieldwork plan was prepared with the collaboration of the Department of FamilyWelfare of the Government of Manipur, the Medical Officer of Post PartumKakching Centre (PPKC) and the local MedicalCollege. Maps of thestudy areas allowed a segmentation procedure in assigning selected areas toeach interviewer.

A total of 8field workers (Anganwadi workers) and 2 supervisors were locally appointed.They attended a two days training course on home visits and questionnaireadministration procedures and received a written interviewer?s manual. Afterthe administration of the questionnaire the field workers informed the womenabout family planning methods and about available health facilities in thedistrict.
Data collectionwas performed during the month of February 2001.
Questionnaireswere locally coded and data were entered using EPI INFO 6.0.
Data analysis wasperformed in the Epidemiological Unit of the National Health Institute in Rome Italyusing STATA software.
The definition ofunmet need adopted in this study is the same as that introduced by Westoff andOchoa in 1993 (5) with the exception of the ?mistimed and/or unwanted lastbirths among currently amenorrhoic women?, because our survey did notinvestigate this issue.

RESULTS
Of the 407 women ofreproductive age selected for the survey 406 (99.8%) were interviewed.
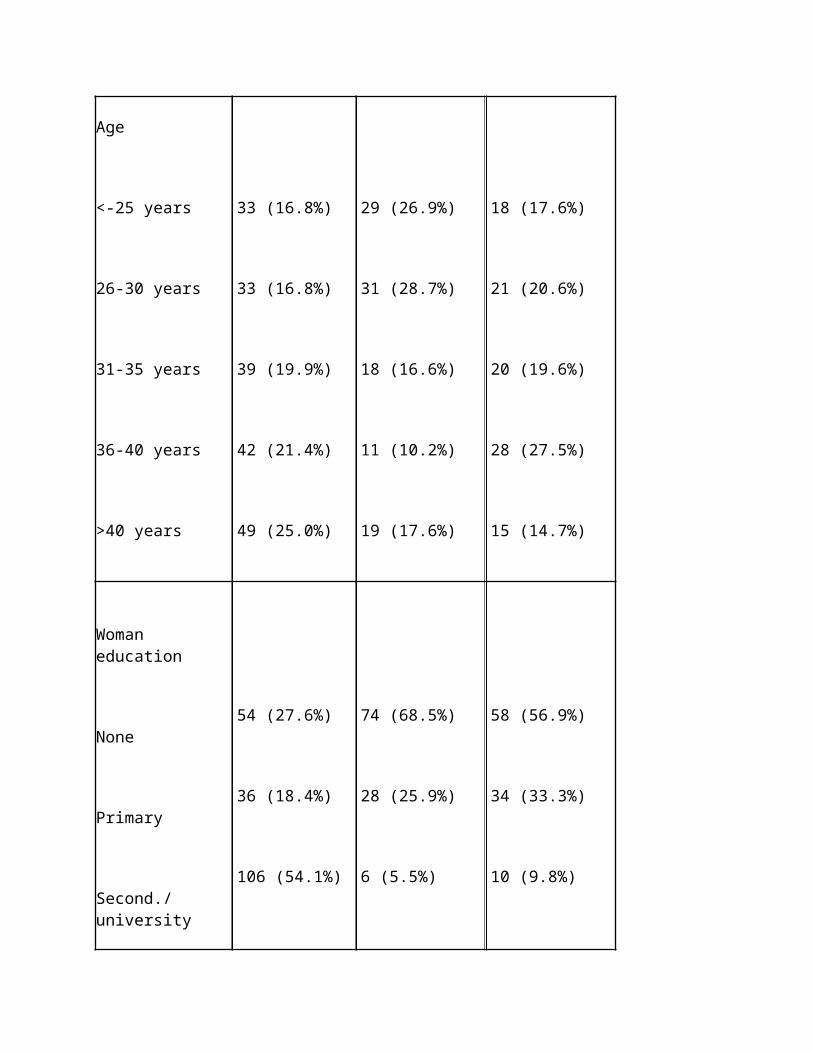
Table 1 shows thesocio-demographic characteristics of the sample according to the three areasunder study. 196 women (48.3%) wereinterviewed in Kakching town, 108 (26.6%) in Sora village and 102 (25.1%) inIrengband village.
73% of the entire sample isHindu and lives in Kakching town and in Irengband village. Sora village isinhabited only by Muslims and represents 27% of the total sample.
The mean age for the totalsample is 33.6 years and 36.8 years for the husbands. In the three areas understudy, mean age is respectively 34.7 years in Kakching, 31.6 years in Sora and33.4 years in Irengband. The mean age value of husbands living in Sora villageis 41 years compared to 35 years in Kakching and Irengband.
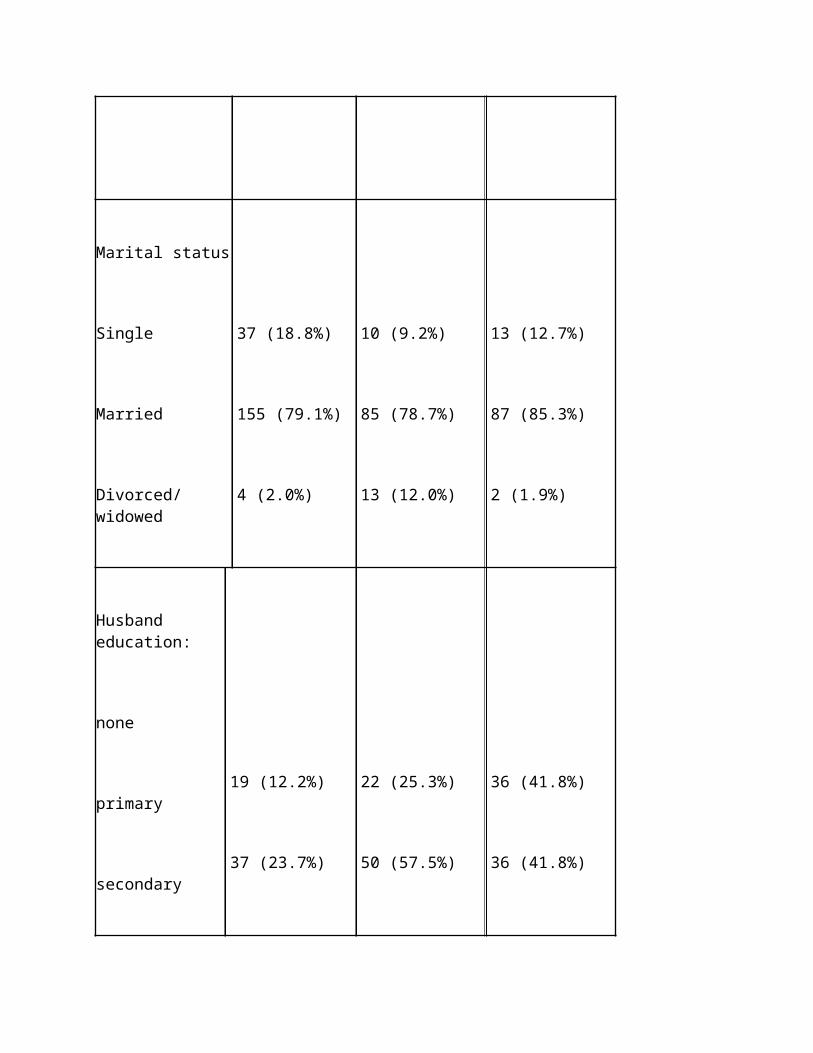
The achieved educationallevel was lower among women (45.8% is illiterate) compared to husbands (23.3%),and among Muslims (68.5% is illiterate) compared to Hindus both living inrural (56.9%) and urban areas (27.6%).
Eighty-one percent of thewomen are married and 15% single. More than 80 per cent of the women reported

that they are housewives. Among Muslim women the percentage of housewives risesto 92%.
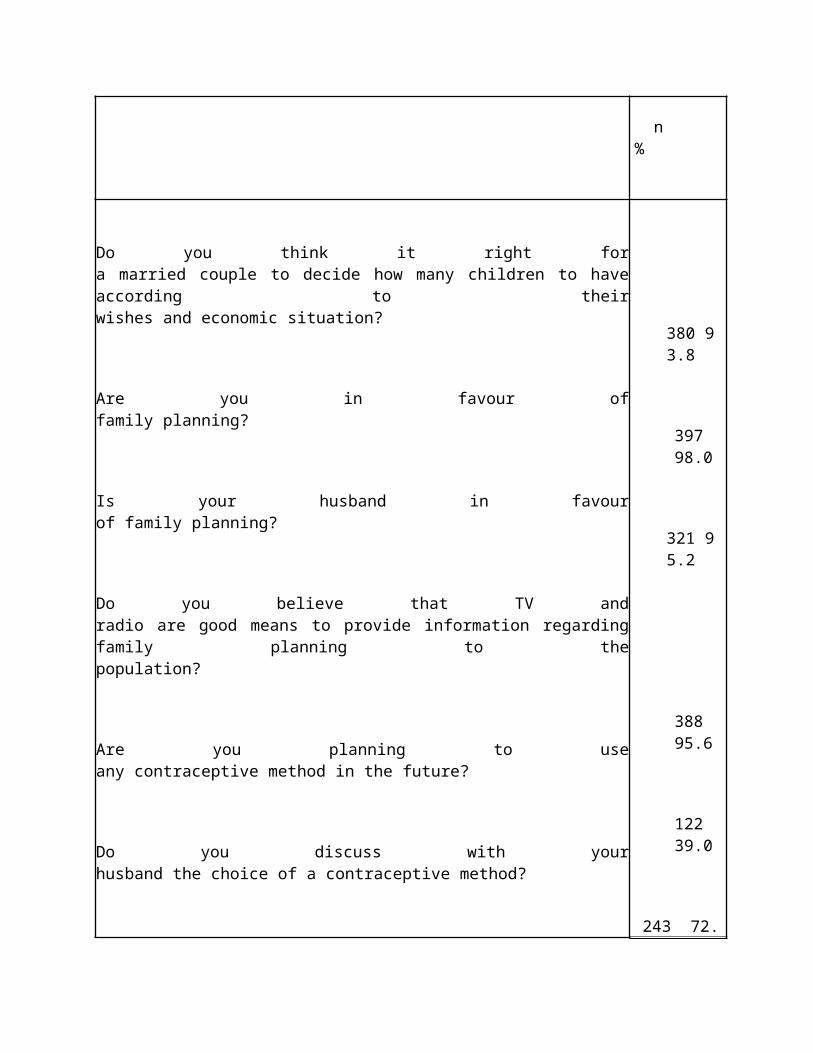
Attitude to family planningwas very positive (tab. 2). Almost 90% of the women believed that there is aneed for more information about family planning and 83% were in favour of sexeducation in school.
Ninety-three percent ofHindu women living in Kakching, 79% of those living in Irengband village, and32% of the Muslim women, reported that they discuss the choice of acontraceptive method with their husbands.
Asked about their intentionof using family planning methods in the future, 44% in Kakching, 49% in Irengband and 26% in Sora answeredaffirmatively, 22, 15 and 28% negatively and 34, 36 and 47% reported they don?tknow if they will use a contraceptive in the future. The highest percentage ofwomen intending to use family planning methods in the future are the 31-40years age group, the women with primary or higher educational level and Hinduscompared to Muslims.
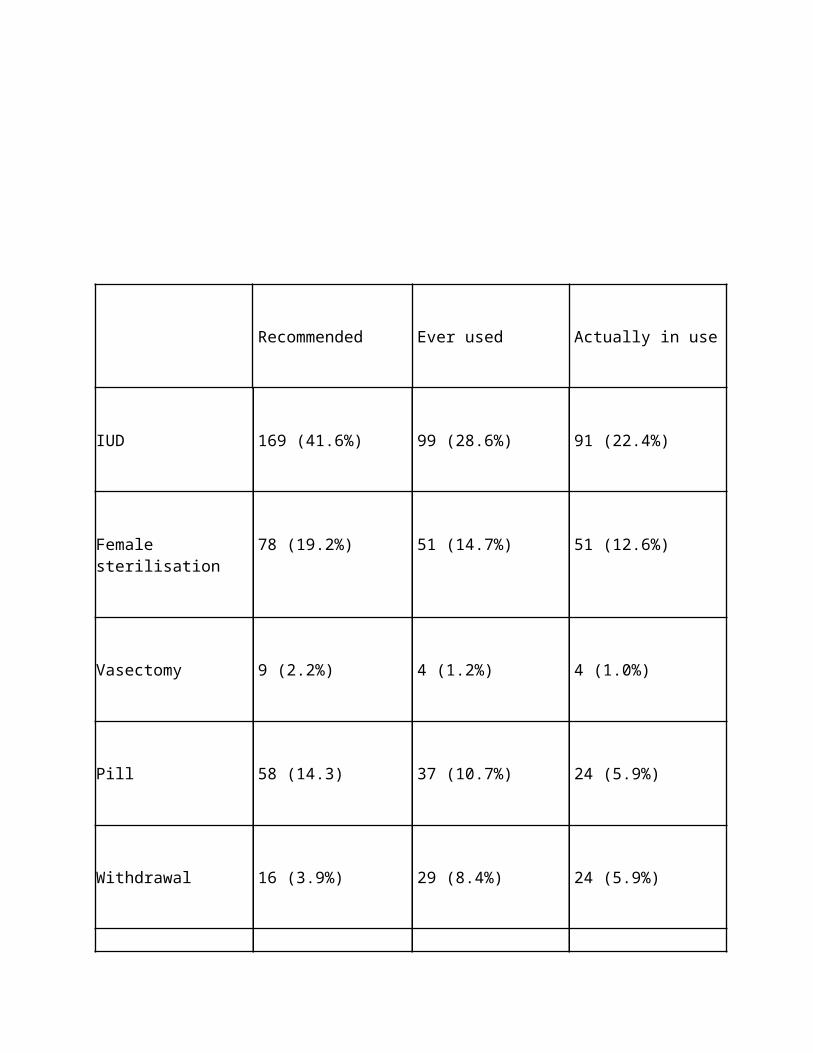
Asked to actively rememberthe known contraceptive methods, 72% of the sample mentioned IUD, 59% sterilisation,44% the pill, 20% the condom, 15% withdrawal, 12% breast-feeding, 11% naturalmethods and 1% injections.
Table 3 shows thecontraceptive methods that would be recommended to a friend, ever used andactually in use. 42% of the sample would recommend a friend to use IUD, 19% female sterilisationand 14% the pill. Among methods ever used and actually in use: IUD, femalesterilisation, oral pill and withdrawal are the most frequent reportedcontraceptives.

Theprevalence of current use of high efficacy methods among currently marriedwomen is 50% with wide variations between the three study areas: 17% in Soravillage, 64% in Kakching and 61% in Irengband.
Use of pill and IUD washigher among women with secondary or university degree while female sterilisationwas more frequent among the illiterate, and among women with primary degree.Female sterilisation prevalence increases with age and reaches 23% among womenolder than 40 years.
The overwhelming majority(95%) of current users reported they are satisfied with their choice. Among the78 women who ever changed contraceptive method, the most important reasons areside effects (45%) and husband?s opposition (30%) especially among Muslims(48%) and illiterate (44%) women.
Table 4 shows a logistic regressionmodel of the risk of not having used any contraceptive method.
Primary, secondary or highereducational levels, as well as having two or three or more children increase the prevalence of contraceptiveusage. The model shows an increased risk for the women living in the SoraMuslim village.
Figure 1 refers to thecomponent of unmet need for family planning computed among currently marriedwomen of reproductive age who were not using any contraceptive method at timeof the interview. Total unmet need was 25.6%: 22.2% concerned limiters and 3.4%spacers.
Risk factors forcontraception total unmet need are: woman?s low educational level (OR=2.96,
C.I. 95%=1.39-6.41) and husband?s low educational level (OR= 2.15, C.I. 95% =1.19-3.91), living in the Sora Muslim village (OR=7.86, C.I. 95% = 3.51-17.81)and in the Hindu Irengband village (OR=1.79, C.I. 95%= 0.91-3.51) compared to the Hindu Kakching town, notdiscussing the choice of a contraceptive method with the husband (OR= 7.36,C.I. 95%= 3.52-15.52) and, although not statistically significant, being olderthan 40 years, having had 4 or more children and not knowing the fertile period of the cycle.
Most important sources ofinformation on family planning were: media (43%), health providers (32%) and friends(16%).
The main provider of familyplanning (66%) was the Kakching Post Partum Centre (KPPC) especially among lesseducated women and among women living in Irengband. About 15% of women saidthey get their contraceptives from the pharmacy (25% in Kakching, and 30%among the highly educated) and 10% fromprivate medical doctors.
Knowledge and trust in thehealth staff are the most frequent reasons behind provider?s choice. Over 75%of the sample judged positively the following aspects: availability ofcontraceptive methods, experienced reception and respect of their privacy andchoices, and technical and relational ability of the staff. Cleanness of thehealth centres is the only aspect that rated a very low score (51% of thesample reported it as bad).
17% of the sample ignoresthe available health services offered in the KPPC. Women younger than 25 yearsand those older than 40 years, as well as Muslims were at higher risk ofignoring the available services.
Table 5 shows the availablehealth services in KPPC known. Immunisation, family planning and antenatal careare the most frequently mentioned services.

99.8% of the sample reportedthey never received a home visit relatedto reproductive health from the KPPC in the previous two years.
DISCUSSION
Socio-demographiccharacteristics of the entire sample reflect those reported in the preliminaryreport for ManipurState of the NFHS-2conducted in 1998-99 (4). The similarity of the two samples in terms ofsocio-demographic characteristics supports the validity of the samplingprocedures of this study.
Lack of knowledge ofcontraceptive methods can be a major obstacle to their use. In this survey thepercentage of contraceptive methods known by the women was lower compared tothe NFHS ?2 report, probably because women were asked to actively rememberwhich family planning methods they knew (active memory) while in the NFSH-2survey they were asked whether they had heard of each of the mentioned methods(recall memory). In both surveys IUD was the most widely known and ever usedmethod, followed by female sterilisation which is the most frequent methodamong current users.
According to the NFHS?2 survey in Manipur State(4), among currently married women, 57% had ever used and 39% were currentlyusing a method of contraception. IUD was the most popular among ever users(23%), and female sterilisation among current users (14%).

In our sample, theprevalence of ever use of contraceptives was 60% and the prevalence who actualuse was 50%, with percentages of IUD (22%) and female sterilisation (14%)similar to NFHS-2. On the contrary, NFHS?1 estimates were 47% for ever usersand 35% for current users, thus there has been an increase in current use among the three surveys.
The largest differentials incurrent use, as shown in the logistic regression model reported in tab.5, aredue to woman?s age with a peak for the age class 36-40 years, to woman?seducational level, and to the number of living children (current use increaseswith the increase of family size).
As reported by other studies(6,7) in this survey education is a key factor influencing contraceptive use.Ever use of contraceptives among currently married women increases witheducation, from 49% among illiterate to 65% among women with primary degree andto 79% among women with secondary or higher degree. While use of modern methodstends to increase with education, female sterilisation declines sharply witheducational level.
As found in the NFHS-2survey (3) and other studies (8,9,10) Muslims have lower use rates (17%) thanHindus (62%) even after controlling foreducation.
Unmet need for familyplanning is a common phenomenon in developing countries. 25.6% of theinterviewed women in Manipur have an unmet need for family planning, 22.2% forlimiting and 3.4% for spacing. According to the same definitions, NFHS-2reported a 16 percent of currently married women in India having an unmet need forfamily planning. Yet, unmet need varies ranging from 7 percent in Punjab to 36 percent in the small north-eastern state ofMeghalaya (3). The findings on unmet need for family planning in Manipur fromNFSH-2 (4) are similar (23.6%) to those computed in this study (25.6%). Our

findings could be a slightly underestimate due to the lack of information on ?mistimedor unwanted pregnancies among the 39-amenorrhoic women of the sample?.
The public medical sectorwas the source of contraception for 79% of current users of modern methods inNFHS-1 (3), for 76% in NFHS-2 (4) and for 66% in this study. The role of theprivate sector has consequently increased and reliance on private services isexpected to expand in the future. The international agencies favouredprivatisation and fees for those able to pay. Increasing the role of theprivate sector has been part of the explicit policies of many funding agenciessuch as the World Bank and USAID (11). Obviously the privatisation of familyplanning services will restrict the access of the poor people (12). While theseparation of services according to ability to pay may also pose a challengefor the quality of services for the poor, even when access is secured.Moreover, regulation of private services is virtually non-existent and theirinterest is determined more by profits than by the desire to fill a need (12).The enormous increase in the use of sex determination tests in order to abortfemale foetuses in India(13) is an example of the problems associated with the increasing role of theprivate sector in service provision.
One of the most importantfactors that influence family planning use, is the quality of the healthservices, which has been receiving increasing emphasis in the government?sreproductive and child health care efforts. Quality of care within the FamilyWelfare Program was addressed by Koening et al (14). They recommend client oriented delivery system in the fieldof Family Planning and they denounce that auxiliary nurse midwifes, who shouldvisit every household within their vicinity to provide family planning servicesonce every two months, spend limited time with inadequate provision of servicesto the population.
An important quality-of-careindicator that rated very poor was the home visits related to reproductivehealth performed by a health practitioner of the KPPC. Out of the total sample,only one woman received a home visit in the previous two years, although theywere recommended (15). Pro-active offer of health measures through home visitsis one of the best options to reach the resident population, to promote healthand to accredit local health services. It is difficult to create awarenessamong people regarding health related issues and door by door visits is one of

the best strategies. That only one household was visited could partly explainthe high percentage of respondents that are not aware of the available servicesin KPPC.
In India the family planning programmehas been using mass media for many years to promote contraceptive use. Studieshave confirmed that exposure to mass media messages had a substantial effect oncontraceptive use and on women?s motivation to prevent unwanted fertility (15).
NFHS-2 results indicate thatfamily planning messages disseminated through the mass media reached 60% ofever married women in India;forty-four percent reported having seen a family planning message ontelevision, and 38% having followed it by radio (3).
In this survey 96% of theinterviewed women reported that TV and radio are good means of providinginformation regarding family planning to the population.
CONCLUSIONS
Although this paper shows animportant reduction of the total fertility rate from 5.2 in 1970-72 to 2.9 in1996-98, it also exposes the failure of health services to meet women?sreproductive health needs. It indicates a need for effective interventionstrategies, both at the community and the clinical level, backed with efficientcounselling, motivation and provision of services in rural and remote areas.

Although India?s familyplanning program is one of the earliest among developing countries, seriousshortcomings in quality of care such as absence of outreach programs andproactive offer of family planning, restricted choice of methods, limitedinformation provided to clients, poor technical standards and low levels offollow-up as well as continuity of care seem to characterise the Indianpractice.
Contraceptive prevalence isa function of both family planning programmes and socio-economic conditions. Webelieve that women?s empowerment policies should guide a gender-aware approachin national development. The expansion of women?s empowerment, through suchfactors as women?s education and economic independence, is central to aneffective resolution of the so-called population problem.
The relation between highfertility rates and the low decisional power of women has been extensivelydiscussed in recent decades (16-18). In terms of policy analysis, inter-countrycomparisons as well as inter-regional contrasts within a large country like Indiashowed that women?s empowerment can have a very strong effect in reducingfertility rate (19,20). Variations within India also show that even culturalor religious influences on fertility can themselves be swayed. For example, Kerala, the most successfulstate in Indiain reducing fertility has a higher proportion of Muslims compared to the Indianaverage. Although cultural and religious influences on the fertility rate, asfound in this survey, cannot be ignored, they are not independent of social andeconomic factors and therefore not immutable (9,10,17-20). Although manyreligious doctrines have been used to legitimate conflicting opinions on genderand reproduction, we believe that a population policy taking account of gendertogether with better infrastructure and adequate access to high quality healthservices could be successful in addressing the causes of persistent poorreproductive health and the gap between stated fertility preferences andachieved fertility levels in India as well as in many other developingcountries.

REFERENCES
1.
Ministry of Health and Family Welfare (MOHFW). 2000.National Population Policy, 2000. NewDelhi: Department of Family Welfare, MOHFW.
2.
National Family Health Survey. A Final Report of theNational Family Health Survey, 1992-93 Bombay,India:International Institute for Population Sciences, 1995.

3.
National Family Health Survey. A Final Report of theNational Family Health Survey, 1998-99 Bombay,India:International Institute for Population Sciences, 2000. www.nfhsindia.org
4.
National Family Health Survey, 1998-99. ManipurPreliminary Report TNS MODE Private Limited, New Delhi and International Institute forPopulation Sciences, Mumbai June 2000. www.nfhsindia.org
5.
Westoff F.C. and Ochoa L.H., 1993, Unmet need andthe demand for contraception and family planning, Readings in Population Research Methodology,Vol. VII (Chicago:Social Development Center,UNFPA).
6.
Retherford, R.D. and B.M. Ramesh.1996. Fertility andcontraceptive use in Tamil Nadu, Andra Pradesh and Uttar Pradesh, NationalFamily Health Survey Bulletin No 3. Mumbay: International Institute forPopulation Sciences; and Honolulu:East-West Center.
7.
Pattanaik BK and Kaur K 1999. A correlative study offactors associated with contraceptive prevalence differentials in rural UttarPradesh; Journal of Family Welfare: 45(1); 53-7.
8.
Moulasha K. and Rama Rao. 1999. Religion-specific

differentials in fertility and family planning. Economic and Political Weekly34 (42&43): 3047-3051.
9.
Donati S., Hamam R., Medda E. Family planning KAPsurvey in Gaza Social Science and Medicine 50 (2000) 841-849
10. MakhloufObermeyer, C. 1992. Islam, women and politics. Population and DevelopmentReview 18 (1), 33-57.
11. Koivusalo M. andOllila E. Making a Health World: Agencies, Actors & Policies in InternationalHealth. Zed Books, London,1997
12. Baru R.V.Reproductive technologies and the private sector: implications for women?shealth Health for the Millions 1(1): 6-8, 1993.
13. Booth B.E., VarmaM., and Beri R.S. Fetal sex determination in infants in Punjab, India:Correlation and implications BMJ 309: 1259-1261, 1994.
14. Koenig MA, FooGH, Joshi K. 2000. Quality of care within the Family Welfare Program; a reviewof recent evidence. Stud Fam Plann. 31 (1): 1-18.
15. Ramesh, B.M.,S.C. Gulati, and Robert D. Retherford. 1996. Contraceptive use in India. NationalFamily Health Survey Bulletin No 2. Mumbay: International Institute for
Population Sciences; and Honolulu:East-West Center
16. Sen A. 2001.Gender equity and the population problem. International Journal of HealthServices, Vol. 31 (3); 469-474.
17. Hartmann, B.Reproductive Rights and Wrongs: The Global Politics of Population Control andContraceptive Choice. Perennial Library, Harper and Row, New York, 1987
18. Garcia-Moreno, C.and Claro A, Challenges from women?s health movement: Women?s rights versuspopulation control. In Population Policies Reconsidered: Health, Empowermentand Rights edited by G.Sen, A. Germain, and L.C. Chen, pp. 47-61. HarvardSeries on Population and International Health. Harvard UniversityPress, Boston,1994.
19. Doyal L. Thepolitics of women?s health: Setting a global agenda. Int. J. Health Serv.26:47-65, 1996.
20. Ollila E.,Koivusalo M., and Hemminki E. International actors and population policies in India, withspecial reference to contraceptive policies. Int. J. Health Serv. 30 (1);87-110, 2000.

Table 1 ? Socio-demographiccharacteristics by study area
KAKCHING SORA IRENGBAND
N. of interviews 196 (48.3%) 108 (26.6%) 102 (25.1%)
Religion Hindu Muslim Hindu

Age
<-25 years
26-30 years
31-35 years
36-40 years
>40 years
33 (16.8%)
33 (16.8%)
39 (19.9%)
42 (21.4%)
49 (25.0%)
29 (26.9%)
31 (28.7%)
18 (16.6%)
11 (10.2%)
19 (17.6%)
18 (17.6%)
21 (20.6%)
20 (19.6%)
28 (27.5%)
15 (14.7%)
Woman education
None
Primary
Second./university
54 (27.6%)
36 (18.4%)
106 (54.1%)
74 (68.5%)
28 (25.9%)
6 (5.5%)
58 (56.9%)
34 (33.3%)
10 (9.8%)

Marital status
Single
Married
Divorced/widowed
37 (18.8%)
155 (79.1%)
4 (2.0%)
10 (9.2%)
85 (78.7%)
13 (12.0%)
13 (12.7%)
87 (85.3%)
2 (1.9%)
Husband education:
none
primary
secondary
university
19 (12.2%)
37 (23.7%)
50 (32.0%)
50 (32.0%)
22 (25.3%)
50 (57.5%)
9 (10.3%)
8 (9.1%)
36 (41.8%)
36 (41.8%)
9 (10.5%)
5 (5.8%)
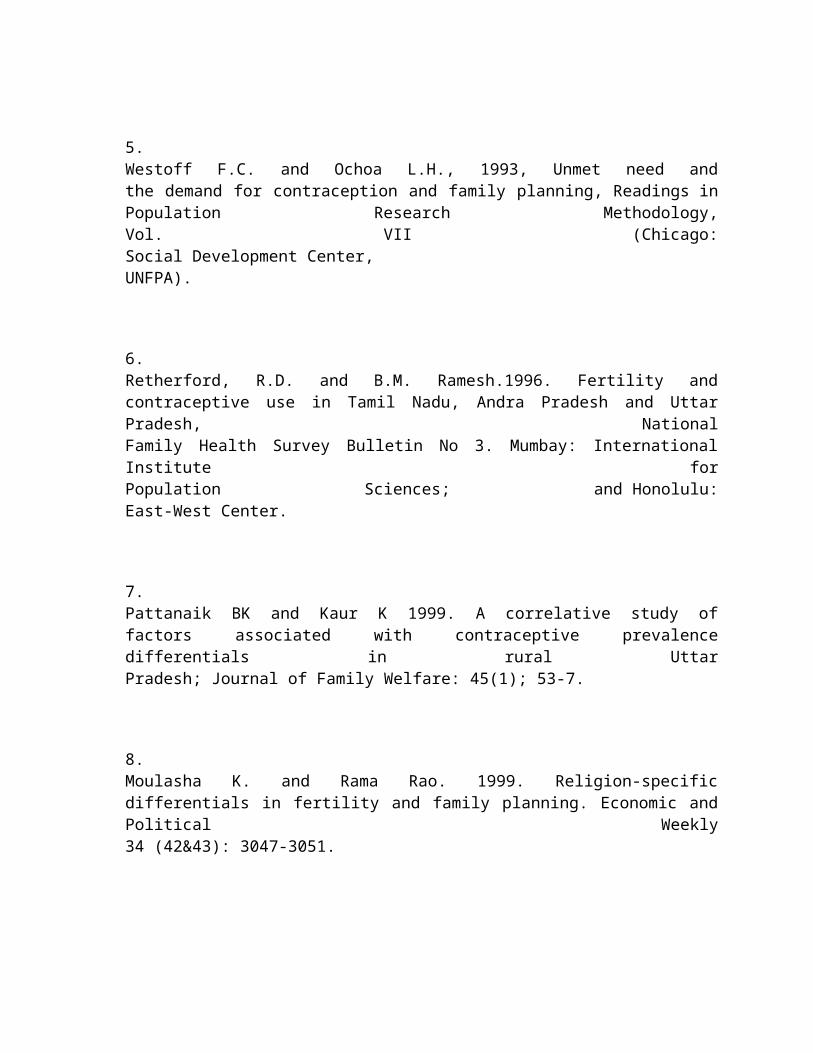
Table 2 ? Attitude to familyplanning
Variables Yes
n %
Do you think it right fora married couple to decide how many children to have according to theirwishes and economic situation?
Are you in favour offamily planning?
380 93.8
397

Is your husband in favourof family planning?
Do you believe that TV andradio are good means to provide information regarding family planning to thepopulation?
Are you planning to useany contraceptive method in the future?
Do you discuss with yourhusband the choice of a contraceptive method?
98.0
321 95.2
388
95.6
122
39.0
243 72.5

Table 3 ? Contraceptivemethods recommended to a friend, ever used and actually in use


Recommended Ever used Actually in use
IUD 169 (41.6%) 99 (28.6%) 91 (22.4%)
Female sterilisation 78 (19.2%) 51 (14.7%) 51 (12.6%)
Vasectomy 9 (2.2%) 4 (1.2%) 4 (1.0%)
Pill 58 (14.3) 37 (10.7%) 24 (5.9%)
Withdrawal 16 (3.9%) 29 (8.4%) 24 (5.9%)

Condom 7 (1.7%) 16 (4.6%) 3 (0.7%)
Breast feeding 4 (1.0%) 3 (0.9%) 4 (1.0)
Calendar method 2 (0.5%) 10 (2.9%) 3 (0.7%)
Don?t know 63 (15.5%)
None 138 (39.9%) 202(49.8)
Table 4. Risk of not havingused any contraceptive method (logistic regression)

Variables n OR CI 95%
Woman?sage
1 29 1
26-30 64 0.70 0.23-2.16
31-35 74 0.41 0.13-1.32
36-40 79 0.32 0.10-1.08
>40 80 0.49 0.14-1.64
Woman?seducational level
None 167 1
Primary 80 0.44 0.22-0.88
Secondary or more 79 0.40 0.17-0.93
Numberof children suggested to a friend
1-3 171 1
>3 155 0.51 0.26-1.01
Residence
Kakching 155 1
Sora 85 12.27 5.58-28.96
Irengband 86 1.40 0.67-2.92
Numberof children
0-1 35 1
2-3 149 0.10 0.04-0.28
>3 142 0.16 0.05-0.50
Figure 1 ? Unmet need forfamily planning

Currently married women ofreproductive age
Who are not usingcontraceptives
N=144
Pregnant women Amenorrhoicwomen Fecundwomen
N=16 N=39 N=89
Wanted pregnancy Mistimed pregnancy unwanted pregnancy
N=2 N=10 N=4
Desire otherchildren immediately Spacers Limiters
N=20 N=1 N=68
Unmetneed population Unmet needpopulation Totalunmet need
forspacing forlimiting population

N=11 N=72 N=83
Table 5. According to yourknowledge which are the available services in KPPC?

You don?t know 17.2%
Ante-natal care 42.9%
Post-natal care 15.3%
Family planning 44.6%
Immunisation 49.0%
Other 2.0%

My Folder: Health and DiseaseTags: Health and Disease
1.0 rating from 1 Votes. 76 Views.
Add Comments | Contact To Author | Send To Friends | Report Abuse
Disclaimer
Search a doctor
Search a hospital & diagnostic center
Search content
More From JivishaArticlesVideos

PhotosAudios
Know what food and when & how should you give to your growing baby?by Dr. Amit Agrawal
www.kumawatneurologist.blogspot.comby Dr. BL Kumawat
read articles on following linkby Dr. BL Kumawat
OSTEONECROSIS Life Time Morbidity for youngsters?�by Dr. GOVIND PUROHIT
Breast Feeding - Frequently Asked Questions?by Dr. Amit Agrawal
Vaccination Schedule - recent guidelines 2009by Dr. Amit Agrawal
FAQ on Dengue feverby Dr. Ashish Jain