fan webinar slides on equity comp 1 15-14
TRANSCRIPT

A Webinar for the
Financial Advisor Network (FAN)
By
Bill DillhoeferVP Net Worth Strategies, Inc.
What Advisors Need to Know
About Equity Compensation
to Generate Business
Copyright Net Worth Strategies, Inc. 2014
Section Topics
• Equity Compensation Industry Overview
• Definitions, Taxation and Key Concepts
• Case Study: Framework for Providing E/C
Guidance
• Programs and Services for Assisting
Executives
• Equity Comp. Resources & Summary

Copyright Net Worth Strategies, Inc. 2014
EQUITY COMPENSATION
INDUSTRY OVERVIEW

Copyright Net Worth Strategies, Inc. 2014
Equity Compensation
• Aligns the Interests of Shareholders with the Interests of Plan Participants (Employees) by:
– Building wealth
– Motivating and retaining key employees
• Statistics:
– 11k+ public companies offer equity compensation
– 10+ million recipients of stock options, restricted stock & performance shares
– 500,000+ top executives get company stock & options accounting for 80% of their compensation
– Given stock price increases over the last few years, many options are deep in-the-money!

Copyright Net Worth Strategies, Inc. 2014
Large Current Opportunity
Currently
Diversifiable
In-the-Money
Stock Options
Copyright Net Worth Strategies, Inc. 2014
Recipient Misconceptions
• Getting assistance or creating an equity comp.
strategy is unnecessary
• One should exercise / sell when:
– At option expiration or when employment is terminated
– Money is needed
– Stock price target is met
• Taxation can be avoided
• If one receives Restricted Stock Shares/Units
they don’t need to worry about their Options

Copyright Net Worth Strategies, Inc. 2014
Equity Comp. Truths
• Careful planning and professional assistance
facilitates better decisions & reduces costly
mistakes
• Exercise / sell decisions should be based on:
– Remaining time value / leverage not stock price alone
– Financial goals not cash flow requirements
– Level of concentration in company stock and options
• Taxes are unavoidable but they can be managed
• Outstanding Stock Option Grants still require timely
action

Copyright Net Worth Strategies, Inc. 2014
DEFINITIONS, TAXATION
AND KEY CONCEPTS

Copyright Net Worth Strategies, Inc. 2014
Stock Options 101
• Definition:
– A grant of the right to purchase company stock in the future at a fixed (grant) price
• Grant Price: (aka – exercise, strike or option price)
– It is the price at which an employee can exercise the stock option, once vested
• Vesting Date:
– The date when a traunch of options can be exercised

Copyright Net Worth Strategies, Inc. 2014
Stock Options 101
• Bargain Element: (aka: Spread)
– The difference between the option exercise
price & the market price of the stock at exercise
• Exercise:
– The process of purchasing the option shares
at the grant price
• Selling:
– Selling the purchased stock shares of an
exercised option (the option itself is not sold)
Copyright Net Worth Strategies, Inc. 2014
Restricted Stock 101
• Restricted Stock Shares/Units
– A Grant of employer stock at no cost that is
subject to restrictions
– The terms for RSAs and RSUs differ slightly
• Types of Restrictions
– Time Vesting (i.e. Future Date)
– Performance Vesting (i.e. Revenue Target)
• Restricted Stock Valuation = Shares*Price
Copyright Net Worth Strategies, Inc. 2014
Taxation
• Unavoidable! Even gifting retains tax liability.
• Occurs when the client takes ownership by exercising stock options or when RSAs vest
• Incentive Stock Options (ISOs):
– ISO’s trigger Alternative Minimum Tax (AMT)
• Non Qualified Stock Options (NQSOs), Stock Appreciation Rights (SARs), & RSAs:
– Value taxed at ordinary income rates (compensation)
– Additional increases taxed at cap gains rate at sale
• Sale proceeds generally used to pay exercise price and/or withheld for taxes

Copyright Net Worth Strategies, Inc. 2014
Stock Option Valuation
• In-the-Money Value (ITMV):
– Fair Market Value (FMV) – Grant Price x Shares
– Under Water: stock price is below grant price
• Option Value (aka: Full / Black-Scholes Value [BSV]):
– Made up of two components:
• In-the-Money Value + Time Value (TV)
– Time Value is estimated using the Black-Scholes
methodology
– BSV = TV + ITMV

Copyright Net Worth Strategies, Inc. 2014
Estimating Time Value
The Black Scholes formula calculates the
Time Value of a stock option using the
following assumptions:
1. Time until expiration
2. Volatility of the stock price
3. The In-the-money value / Leverage
4. Risk free rate of return (RFR)
5. Per share dividend
Copyright Net Worth Strategies, Inc. 2014
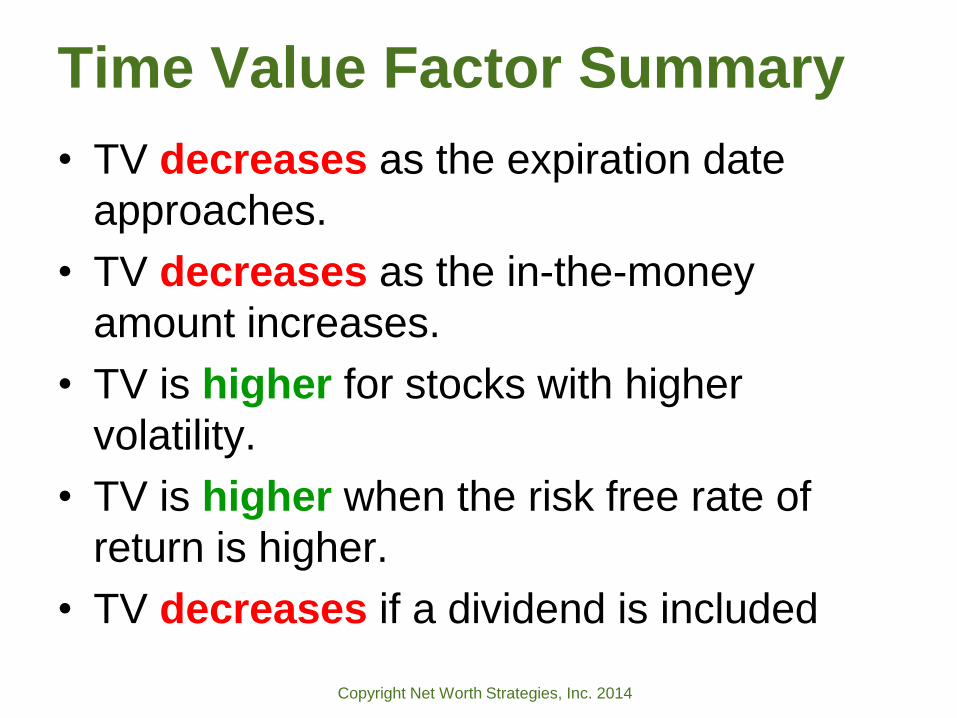
Time Value Factor Summary
• TV decreases as the expiration date
approaches.
• TV decreases as the in-the-money
amount increases.
• TV is higher for stocks with higher
volatility.
• TV is higher when the risk free rate of
return is higher.
• TV decreases if a dividend is included
Copyright Net Worth Strategies, Inc. 2014
CASE STUDY: FRAMEWORK
FOR EQUITY COMP. GUIDANCE

Copyright Net Worth Strategies, Inc. 2014
James Deere (case data)
• Financial Goal: $4,000,000
• Other Investment Value (VDP): $500,000
• Company: DE (Deere & Company, Inc.)
• Assumed Stock Price: $91.00
• Stock Volatility: 33.6% Risk Free Rate: 2.0%
• Income Tax Rate: 40% Cap Gains: 20% (Fed+State)
• Stock Options:
– 8 NQSOs: 24,500 vested & 18,000 unvested
• Shares:
– 5,000 shares owned (cost basis: $300,000)
– 4,600 RSUs (cost basis: $0)

Copyright Net Worth Strategies, Inc. 2014
Grant ID Grant Type
Expire Date
Exercise Price
Vested Options
Vested ITMV $
Unvested Options
Unvested ITMV $
Total Options
Total ITMV $
NQ2005 NQSO 12/7/2015 $34.4400 4,000 226,240 0 0 4,000 226,240
NQ2006 NQSO 12/6/2016 $48.3750 5,000 213,125 0 0 5,000 213,125
NQ2007 NQSO 12/5/2017 $88.8200 4,000 8,720 0 0 4,000 8,720
NQ2008 NQSO 12/17/2018 $39.6650 7,000 359,345 0 0 7,000 359,345
NQ2009 NQSO 12/9/2019 $52.2500 3,000 116,250 1,500 58,125 4,500 174,375
NQ2010 NQSO 12/8/2020 $80.6100 1,500 15,585 3,000 31,170 4,500 46,755
NQ2011 NQSO 12/14/2021 $74.2400 0 0 6,000 100,560 6,000 100,560
NQ2012 NQSO 12/12/2022 $85.5000 0 0 7,500 41,250 7,500 41,250
Total 24,500 939,265 18,000 231,105 42,500 1,170,370
In-the-Money Valuation
ITM Value = Current Value ($91) – Exercise Price x Shares

Copyright Net Worth Strategies, Inc. 2014
Grant ID Grant Type
Expire Date
Exercise Price
Vested Options
Vested ITMV $
Potential Tax $
After Tax Value $
NQ2005 NQSO 12/7/2015 $34.4400 4,000 226,240 90,496 135,744
NQ2006 NQSO 12/6/2016 $48.3750 5,000 213,125 85,250 127,875
NQ2007 NQSO 12/5/2017 $88.8200 4,000 8,720 3,488 5,232
NQ2008 NQSO 12/17/2018 $39.6650 7,000 359,345 143,738 215,607
NQ2009 NQSO 12/9/2019 $52.2500 3,000 116,250 46,500 69,750
NQ2010 NQSO 12/8/2020 $80.6100 1,500 15,585 6,234 9,351
NQ2011 NQSO 12/14/2021 $74.2400 0 0 0 0
NQ2012 NQSO 12/12/2022 $85.5000 0 0 0 0
Total 24,500 939,265 375,706 563,559
After Tax Valuation
Cash Out Value = ITM Value – Potential Tax (calculated by applying a 40% income tax rate)
Copyright Net Worth Strategies, Inc. 2014
Grant ID Grant Type
Expire Date
Exercise Price
Vested TV $
Vested BSV $
Unvested TV $
Unvested BSV $ Total TV $
Total BSV $
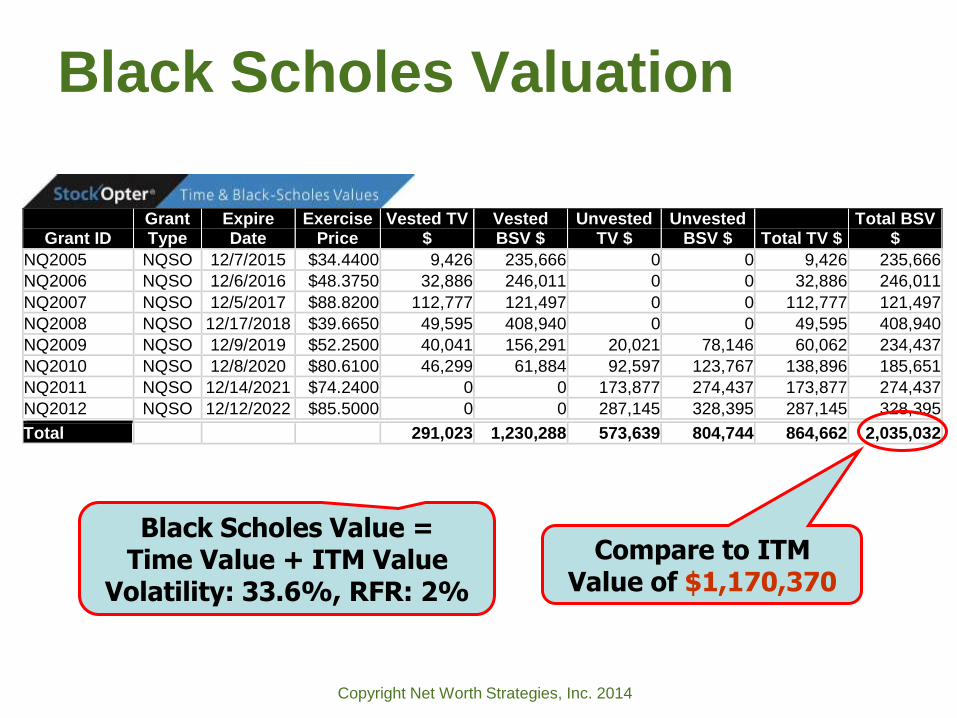
NQ2005 NQSO 12/7/2015 $34.4400 9,426 235,666 0 0 9,426 235,666
NQ2006 NQSO 12/6/2016 $48.3750 32,886 246,011 0 0 32,886 246,011
NQ2007 NQSO 12/5/2017 $88.8200 112,777 121,497 0 0 112,777 121,497
NQ2008 NQSO 12/17/2018 $39.6650 49,595 408,940 0 0 49,595 408,940
NQ2009 NQSO 12/9/2019 $52.2500 40,041 156,291 20,021 78,146 60,062 234,437
NQ2010 NQSO 12/8/2020 $80.6100 46,299 61,884 92,597 123,767 138,896 185,651
NQ2011 NQSO 12/14/2021 $74.2400 0 0 173,877 274,437 173,877 274,437
NQ2012 NQSO 12/12/2022 $85.5000 0 0 287,145 328,395 287,145 328,395
Total 291,023 1,230,288 573,639 804,744 864,662 2,035,032
Black Scholes Valuation
Compare to ITM Value of $1,170,370
Black Scholes Value = Time Value + ITM Value
Volatility: 33.6%, RFR: 2%

Copyright Net Worth Strategies, Inc. 2014
Option Forfeit Valuation
Forfeit Value®
$1,095,767
Vs. ITM Value of
Unvested: $231,105
Forfeit Value = Time Value of
Vested + BSV of Unvested
Copyright Net Worth Strategies, Inc. 2014
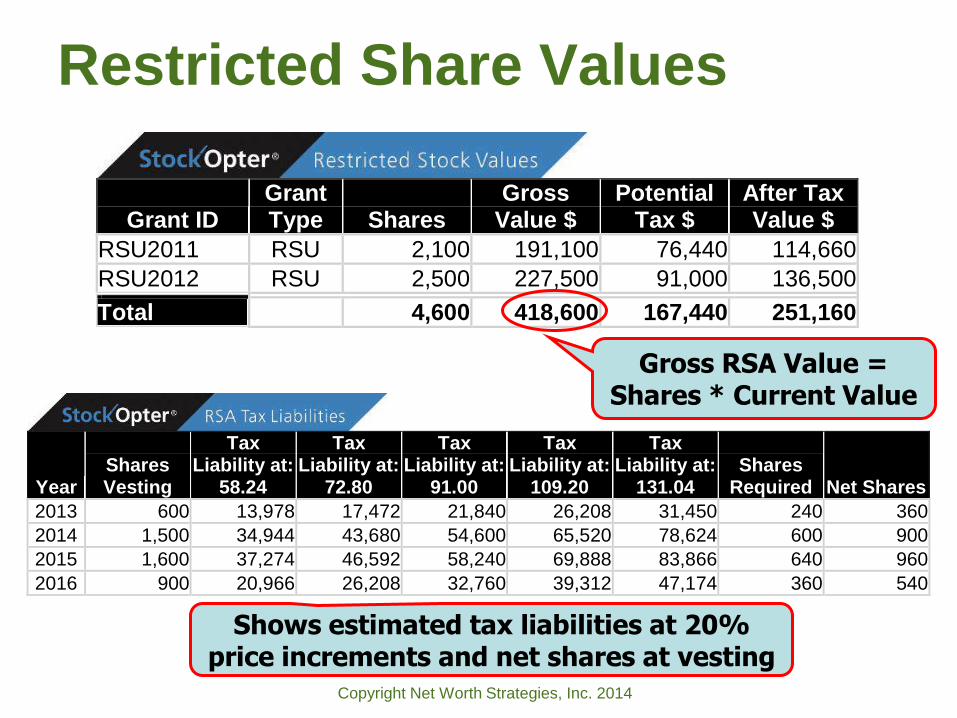
Year Shares Vesting
Tax Liability at:
58.24
Tax Liability at:
72.80
Tax Liability at:
91.00
Tax Liability at:
109.20
Tax Liability at:
131.04 Shares
Required Net Shares
2013 600 13,978 17,472 21,840 26,208 31,450 240 360
2014 1,500 34,944 43,680 54,600 65,520 78,624 600 900
2015 1,600 37,274 46,592 58,240 69,888 83,866 640 960
2016 900 20,966 26,208 32,760 39,312 47,174 360 540
Grant ID Grant Type Shares
Gross Value $
Potential Tax $
After Tax Value $
RSU2011 RSU 2,100 191,100 76,440 114,660
RSU2012 RSU 2,500 227,500 91,000 136,500
Total 4,600 418,600 167,440 251,160
Restricted Share Values
Shows estimated tax liabilities at 20% price increments and net shares at vesting
Gross RSA Value = Shares * Current Value
Copyright Net Worth Strategies, Inc. 2014
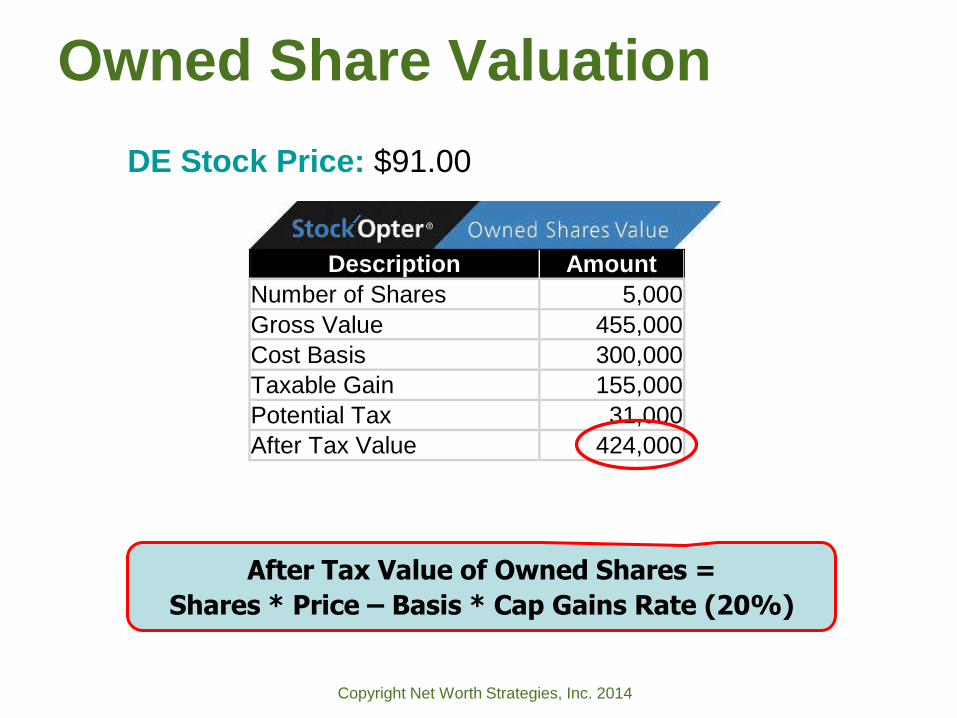
Description Amount
Number of Shares 5,000
Gross Value 455,000
Cost Basis 300,000
Taxable Gain 155,000
Potential Tax 31,000
After Tax Value 424,000
Owned Share Valuation
DE Stock Price: $91.00
After Tax Value of Owned Shares =
Shares * Price – Basis * Cap Gains Rate (20%)

Copyright Net Worth Strategies, Inc. 2014
Potential Stock Price
Increment Change
Option Value $
Option Value
Change
RSA & Owned
Shares $
RSA & Owned Change
Option, RSA & Owned $
Option, RSA & Owned
$37.27 -20.00 % 11,320 -88.34 % 357,792 -20.00 % 369,112 -32.19 %
$46.59 -20.00 % 97,075 -67.80 % 447,264 -20.00 % 544,339 -36.75 %
$58.24 -20.00 % 301,505 -49.75 % 559,104 -20.00 % 860,609 -33.74 %
$72.80 -20.00 % 599,985 -48.74 % 698,880 -20.00 % 1,298,865 -36.45 %
$91.00 0.00 % 1,170,370 0.00 % 873,600 0.00 % 2,043,970 0.00 %
$109.20 20.00 % 1,943,870 66.09 % 1,048,320 20.00 % 2,992,190 46.39 %
$131.04 20.00 % 2,872,070 47.75 % 1,257,984 20.00 % 4,130,054 38.03 %
$157.25 20.00 % 3,985,995 38.78 % 1,509,600 20.00 % 5,495,595 33.06 %
$188.70 20.00 % 5,322,620 33.53 % 1,811,520 20.00 % 7,134,140 29.82 %
$226.44 20.00 % 6,926,570 30.13 % 2,173,824 20.00 % 9,100,394 27.56 %
Leverage
A 20% increase in stock price yields a 66.09% increase in
ITM value
A 20% decrease in stock price yields a 48.74% decrease in
ITM value

Copyright Net Worth Strategies, Inc. 2014
Goal Attainment
Financial Goal
Value of Diversified Portfolio (VDP)
Total Shares Goal Status at Various Prices
Current Attainment is 49.59% of Goal

Copyright Net Worth Strategies, Inc. 2014
Concentration
80% of Portfolio is in Company
Stock or Options
Pre-Tax
Values
Copyright Net Worth Strategies, Inc. 2014
Option Exercise Ratio
• The Insight Ratio is TV divided by BSV
– Represents the remaining theoretical potential
– 10% means 90% of the grant’s value is In-the-
money value and at risk
• Provides a framework for exercising based
on risk v. reward
• Planning horizon and risk profile are key
considerations
Copyright Net Worth Strategies, Inc. 2014
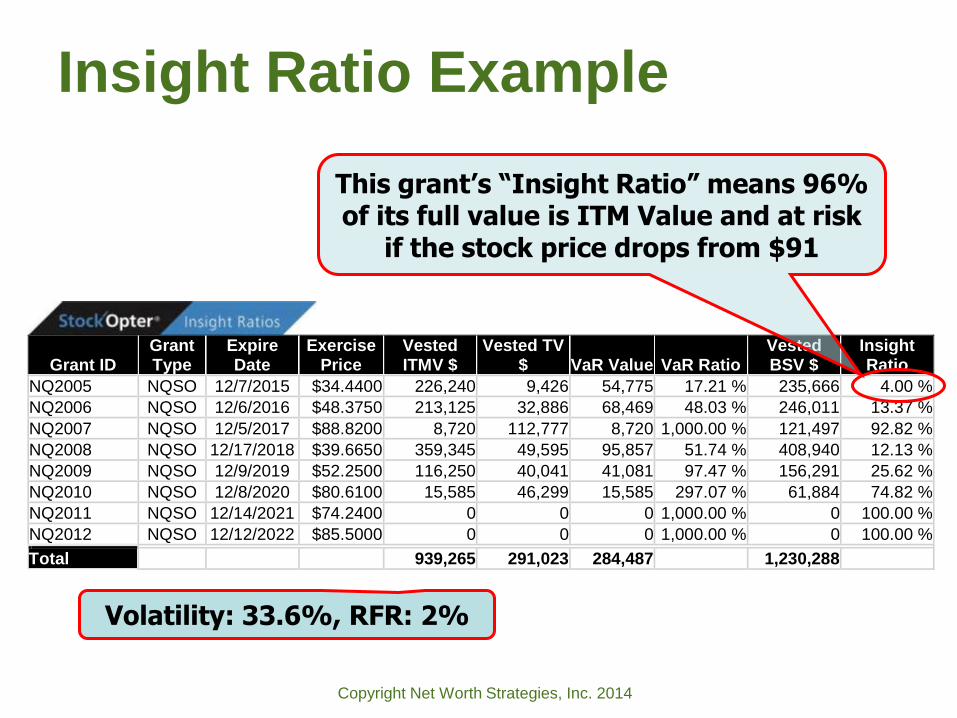
Grant ID Grant Type
Expire Date
Exercise Price
Vested ITMV $
Vested TV $ VaR Value VaR Ratio
Vested BSV $
Insight Ratio
NQ2005 NQSO 12/7/2015 $34.4400 226,240 9,426 54,775 17.21 % 235,666 4.00 %
NQ2006 NQSO 12/6/2016 $48.3750 213,125 32,886 68,469 48.03 % 246,011 13.37 %
NQ2007 NQSO 12/5/2017 $88.8200 8,720 112,777 8,720 1,000.00 % 121,497 92.82 %
NQ2008 NQSO 12/17/2018 $39.6650 359,345 49,595 95,857 51.74 % 408,940 12.13 %
NQ2009 NQSO 12/9/2019 $52.2500 116,250 40,041 41,081 97.47 % 156,291 25.62 %
NQ2010 NQSO 12/8/2020 $80.6100 15,585 46,299 15,585 297.07 % 61,884 74.82 %
NQ2011 NQSO 12/14/2021 $74.2400 0 0 0 1,000.00 % 0 100.00 %
NQ2012 NQSO 12/12/2022 $85.5000 0 0 0 1,000.00 % 0 100.00 %
Total 939,265 291,023 284,487 1,230,288
Insight Ratio Example
This grant’s “Insight Ratio” means 96% of its full value is ITM Value and at risk
if the stock price drops from $91
Volatility: 33.6%, RFR: 2%
Copyright Net Worth Strategies, Inc. 2014
Insight Ratio Factors
• Proximity to retirement?
• Bullish on company growth prospects?
• Concerned with negative leverage?
• Close to achieving a financial goal?
• Concentrated position?
• Upcoming cash-flow requirements?
Copyright Net Worth Strategies, Inc. 2014
PROGRAMS & SERVICES FOR
ASSISTING EXECUTIVES
Copyright Net Worth Strategies, Inc. 2014
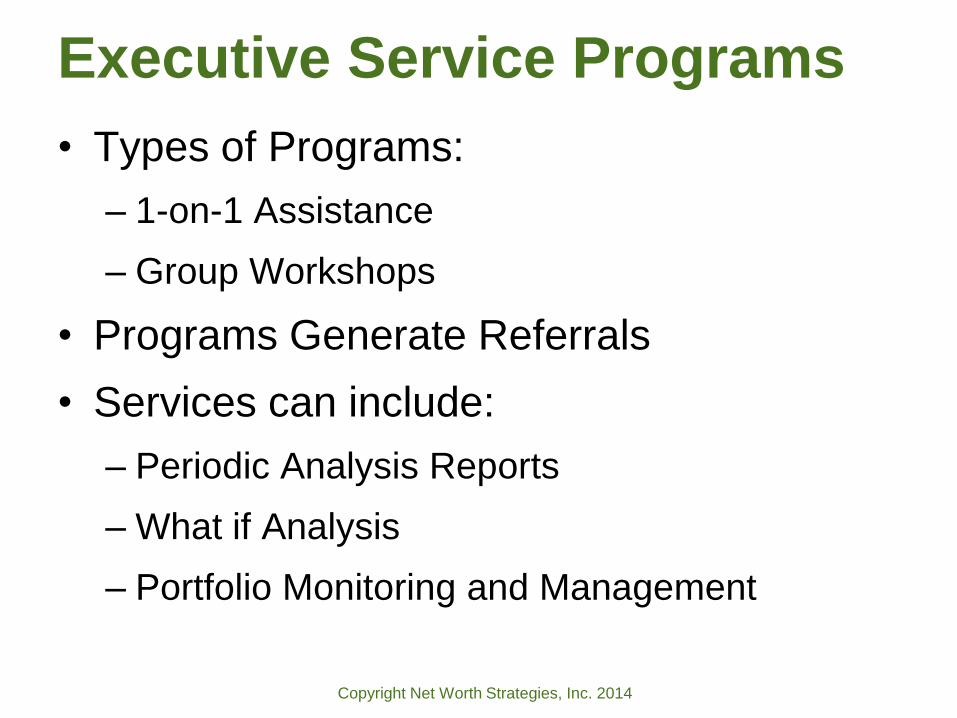
Executive Service Programs
• Types of Programs:
– 1-on-1 Assistance
– Group Workshops
• Programs Generate Referrals
• Services can include:
– Periodic Analysis Reports
– What if Analysis
– Portfolio Monitoring and Management

Copyright Net Worth Strategies, Inc. 2014
RESOURCES & SUMMARY

Copyright Net Worth Strategies, Inc. 2014
Equity Comp. Resources
• Decision Support & Practice Building Videos, Resource
Links and Articles:
– http://blog.stockopter.com (Free)
• Equity Compensation Education & Content:
– www.myStockOptions.com (Fee Subscription)
• Application for Creating Reports, Monitoring Positions &
Conducting Workshops:
– www.stockopter.com (Fee Subscription)
• LinkedIn Groups:
– Equity Comp. Recipient Decision Support
– The Stock Option Connection
Copyright Net Worth Strategies, Inc. 2014
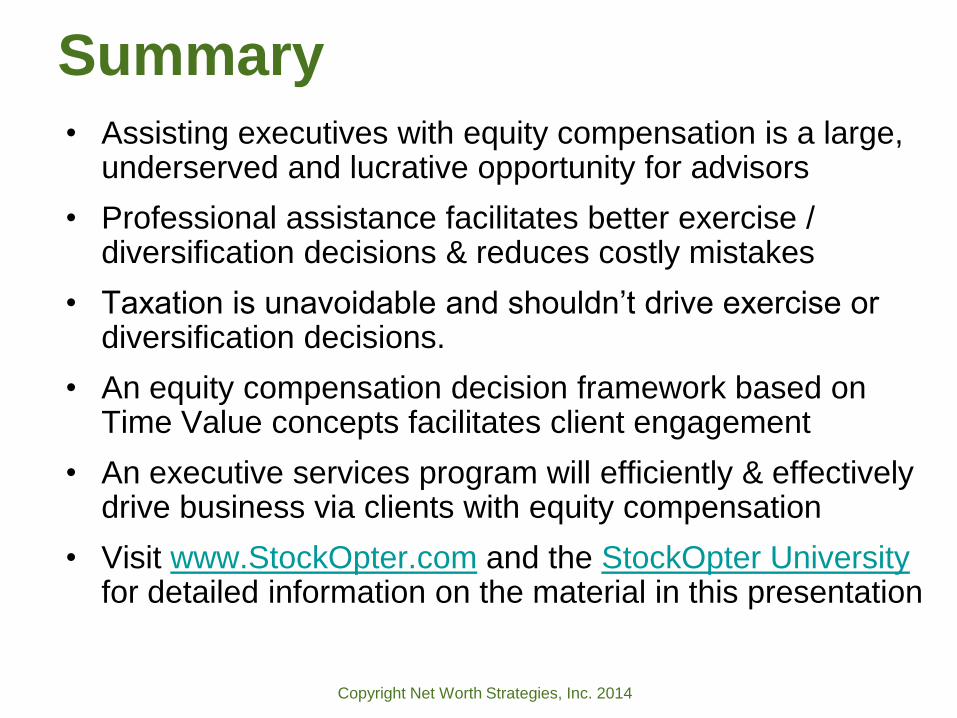
Summary• Assisting executives with equity compensation is a large,
underserved and lucrative opportunity for advisors
• Professional assistance facilitates better exercise / diversification decisions & reduces costly mistakes
• Taxation is unavoidable and shouldn’t drive exercise or diversification decisions.
• An equity compensation decision framework based on Time Value concepts facilitates client engagement
• An executive services program will efficiently & effectively drive business via clients with equity compensation
• Visit www.StockOpter.com and the StockOpter Universityfor detailed information on the material in this presentation