fanvertize: the problem with traditional marketing
TRANSCRIPT

Fanvertize is a
mobile application
centered around Fan driven events,
connecting brands with Fans
and their social networks.
We deliver
unique user generated content,
through social networks
insuring a more efficient,
targeted,
quantifiable
marketing message
for our brand partners.

The Problem of
Traditional Marketing

Traditional Marketing is a
best summed up as a “Shotgun Approach.”
Television, billboards, and radio are used to
blast messages
at the masses with the hopes that a
percentage of them respond
and become buyers.
They spend BILLIONS of Dollars every year to
interrupt people during the Super Bowl,
while driving to work,
or while enjoying a ball game.
Granted some people become engaged and buy their product.
The holy grail for them is social media.

With the big advertising dollars, spent on
Stadium Naming Rights,
Home Plate Rotational and Jersey Sponsorships
the results in terms of
Return on Investment
are neither
track able nor
quantifiable.
And there is no
Social Media
component.

The POWER of
Social Media Why it Matters

Word of Mouth is Key. Why?
People are 92% more likely to take a recommendation
from a friend, according to Nielsen.
There are 500 billion Word of Mouth
impressions on the social web
each year in the US.
The average number of Facebook friends,
according to Pew Research is 229.
The average number of
Twitter followers is 208.

The Fanvertize
Difference

One MLB Game
229 x 4 posts = 916 unique FB Views
208 x 4 tweets = 832 unique TW Views
916 x 10 Fans = 9160 Unique FB Views
832 x 10 Fans = 8320 Unique TW Views

4 tweets
4 posts
4 pictures
4 videos
Fans are required
to take pictures
using Instagram,
post on Facebook,
upload video to
YouTube, and tweet
on twitter,
we are simultaneously
driving online traffic for
our individual brand
promotion and our
brand partners.
4 posts x 4 social networks
16 Unique Posts per Fan per Game
Unique User
Generated
Content

One MLB Day
229 x 4 posts = 916 unique FB Views
208 x 4 tweets = 832 unique TW Views
916 x 10 Fans = 9160 Unique FB Views
832 x 10 Fans = 8320 Unique TW Views
9160 x 8 games = 73,280 Unique FB Views
8320 x 8 games = 66,560 Unique TW Views

Boston Red Sox Vs.
New York Yankees Fenway Park, Boston, MA
Tuesday September 11, 2012

One MLB Week
229 x 4 posts = 916 unique FB Views
208 x 4 tweets = 832 unique TW Views
916 x 10 Fans = 9160 Unique FB Views
832 x 10 Fans = 8320 Unique TW Views
9160 x 8 games = 73,280 Unique FB Views
8320 x 8 games = 66,560 Unique TW Views
73,280 x 7 days = 512,960 Unique FB Views
66,560 x 7 days = 465,920 Unique TW Views

Full MLB Season
10 Tickets per Game x $100/ticket = $1000/game
2,430 Total Regular Season Games x $1000 =
$2,430,000 for the Season
20,217,600 Unique Twitter Views
22,258,800 Unique Facebook Views
And that is just
MAJOR LEAGUE BASEBALL…
add Professional BASKETBALL,
The National Hockey League, and
Major League Soccer,
and we are looking at
Transformative
Exposure.

great time with my
boyfriend@frankjones. Shout out
to @fanvertize @redbull
#texasrangers #newyorkyankees
#theballpark
I Love FREE Red
Bull. Get Yours
Here
This becomes a banner ad on the
individual Fan’s Facebook and twitter
pages.
Social Media Focused

I Love FREE Red
Bull. Get Yours
Here
Yours
-Multiple Posts from Friends (90% conversion)
-Prime News Feed Real Estate
-Never Expires
-Sponsored Ad (24% conversion)
-Expiration date

Dollar for Dollar
Comparison
The Most Efficient Deployment of your Marketing Dollar

Cost Comparison1

$61,728
Exposure
2,500,000 TV Viewers
Social
Quantifiable ROI
Track able results
Exposure*
617 Fans in the seats
141,293 Facebook friends
128,336 Twitter followers
565,176 unique FB Views
513,344 unique twitter views
Social
Quantifiable ROI
Track able Results
Traditional
*based on MLB regular season ticket price of $100

Cost Comparison2
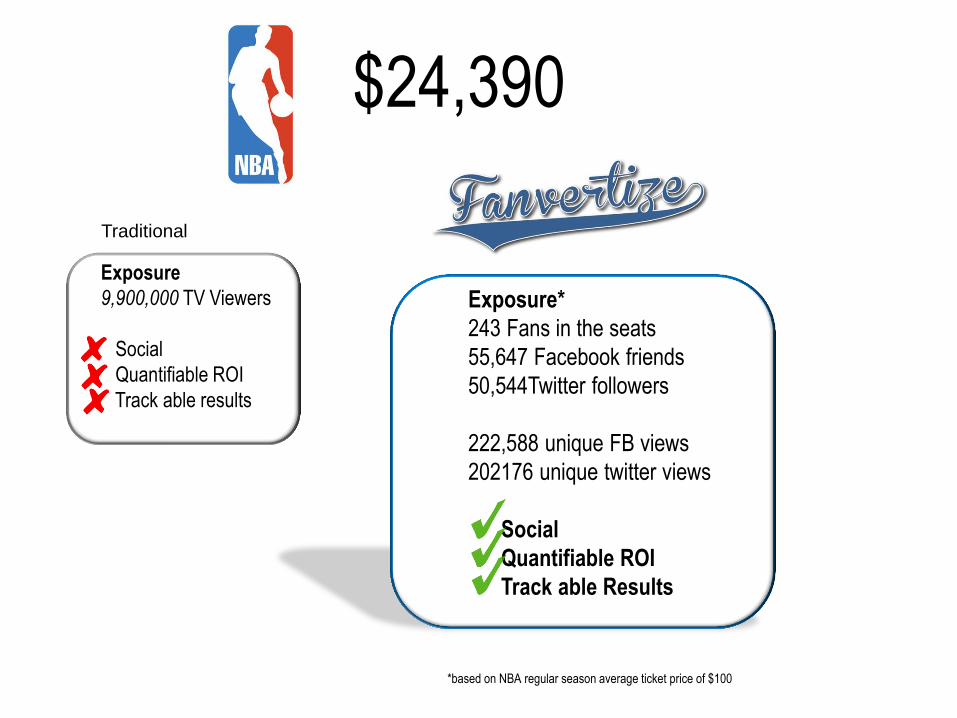
Exposure
9,900,000 TV Viewers
Social
Quantifiable ROI
Track able results
Exposure*
243 Fans in the seats
55,647 Facebook friends
50,544Twitter followers
222,588 unique FB views
202176 unique twitter views
Social
Quantifiable ROI
Track able Results
Traditional
$24,390
*based on NBA regular season average ticket price of $100

NHL Dasher Board
$6,000 per game
NHL Seats
$50 per game
Cost Comparison3

$6,000
Exposure
2,000,000 TV Viewers
Social
Quantifiable ROI
Track able results
Exposure*
120 Fans in the seats
34,680 Facebook friends
24,960 Twitter followers
138,720 unique FB Views
98,760 unique twitter views
Social
Quantifiable ROI
Track able Results
Traditional
*based on NHL regular season average ticket price of $50

Cost Comparison4
MLS Jersey Sponsor
$30,000 per game
MLS Seats
$50 per game

$30,000
Exposure
350,000 TV Viewers
Social
Quantifiable ROI
Track able results
Exposure*
600 Fans in the seats
137,400 Facebook friends
124,800 Twitter followers
549,600 unique FB views
499,200 unique Twitter views
Social
Quantifiable ROI
Track able Results
Traditional
*based on MLS regular season average ticket price of $50

Wrigley Home Plate Rotational Cost Breakdown
Wrigley Field Article
$5 Million / 81 Home Games = $61,728 per game
Orioles Camden Yards Home Plate Rotational Cost Breakdown
Camden Yards Maryland Settlement Agreement
$7.3 Million / 81 Home Games = $90,123 per game
NBA Digital Courtside Rotational Display Deal
9 Teams Add Digital Signage to their Arenas, worth $1 Million.
$1 Million / 41 Home Games = $24,390 per game
NHL Dasher Boards Advertising
Franchises get between $200,000 and 300,000 for Dasher Board Advertising Revenue
$250,000 / 41 Home Games = $6,097 per game
Major League Soccer Jersey Sponsorship
Revenue generated by Jersey Sponsorship is upwards of $1 Million per Season
RSL –Xango Deal $1Million / 34 Regular Season Games = $29,411 per game
“Average Number of Facebook Friends” Pew Research
Friend Recommendations Most Powerful according to Nielsen
Word of mouth Marketing
Sources
1
2
3
4