fao global land cover share database, - home | food … · 2014 global land cover share global land...
TRANSCRIPT

2014
Global Land Cover SHARE
Global Land Cover SHARE (GLC-SHARE)database Beta-Release Version 1.0 - 2014John Latham, Renato Cumani, Ilaria Rosati and Mario Bloise

The designations employed and the presentation of material in this information product do not imply the expression of any opinion whatsoever on the part of the Food and Agriculture Organization of the United Nations (FAO) concerning the legal or development status of any country, territory, city or area or of its authorities, or concerning the delimitation of its frontiers or boundaries. The mention of specific companies or products of manufacturers, whether or not these have been patented, does not imply that these have been endorsed or recommended by FAO in preference to others of a similar nature that are not mentioned. The views expressed in this information product are those of the author(s) and do not necessarily reflect the views of FAO.
The designations employed and the presentation of material in the map(s) do not imply the expression of any opinion whatsoever on the part of FAO concerning the legal or constitutional status of any country, territory or sea area, or concerning the delimitation of frontiers.
The Global Administrative Unit Layers (GAUL) provides the most reliable spatial information on administrative units for all countries in the world. The GAUL dataset is for the benefit of the United Nations and other authorized international and national institutions/agencies. Food and Agriculture Organization of the United Nations (FAO) hereby grant you a license to use, download and print the materials contained in the GAUL dataset solely for your own non-commercial purposes and in accordance with the conditions listed below. Copyrighted data made available to you through the GAUL dataset is subject to the conditions specified in the metadata. Except as may otherwise be expressly permitted by applicable law, all redistribution to non-authorized users or commercial exploitation of any material contained in the GAUL dataset is strictly prohibited without the prior written permission of FAO. Any request for permission to reproduce or otherwise use any material contained in or otherwise made available to you through the GAUL dataset other than as provided for herein, should be directed to FAO.
Reproduction and dissemination of material contained in GLC-SHARE Beta-Release v1.0 or educational, research, personal or other noncommercial purposes are authorized without any prior written permission from the copyright holders, provided FAO are fully acknowledged. No part of GLC-SHARE Beta-Release v1.0 data may be downloaded, stored in a retrieval system or transmitted by any means for resale or other commercial purposes without written permission of the copyright holders. If any information or resources on this site are attributed to a site or source external to FAO permission to use must be sought with FAO.
GLC-SHARE Beta-Release v1.0 Is provided “as is” without any warranties of any kind, either express or implied, including but not limited to warranties of title or implied warranties of merchantability or fitness for a particular purpose. Furthermore, FAO may change the content of GLC-SHARE v1.0 without prior notification.
Full acknowledgement and citation in any materials or publications derived in part or in whole from GLC-SHARE Beta-Release Version 1.0 database is required. Full acknowledgement and referencing of all sources must be included in any documentation using any of the material contained in the GLC-SHARE Beta-Release v1.0 as follows: “FAO Global Land Cover (GLC-SHARE) Beta-Release 1.0 Database, Land and Water Division, John Latham, Renato Cumani, Ilaria Rosati and Mario Bloise, 2014”.
CONTACT INFORMATIONFor any questions please contact us at: John S. Latham | Senior Land & Water OfficerFAO, Viale delle Terme di Caracalla, 00100, Rome, Italy E-mail: [email protected]
Renato Cumani | Land & Water OfficerFAO, Viale delle Terme di Caracalla, 00100, Rome, Italy E-mail: [email protected]


4
List of AcronymsCBD Convention on Biological DiversityCCD Convention to Combat Desertification
CNRS Conseil National de la Recherche Scientifique au LibanEC European Community
ESA European Space AgencyETM Enhanced Thematic MapperFAO Food and Agriculture Organization of the United Nations
FCCC Framework Convention on Climate ChangeFRA Forest Resources Assessment
GAEZ Global Agro-Ecological ZoneGAUL Global Administrative Unit Layers
GLC 2000 Global Land Cover of year 2000GLCN Global Land Cover Network
GLC Global Land Cover GLCNMO Global Land Cover by National Mapping OrganizationsIGBP-DIS The International Geosphere-Biosphere Programme Data and
Information SystemIIASA International Institute for Applied Systems AnalysisICCC International Conventions on Climate Change
ISCGM International Steering Committee for Global MappingISO International Standards OrganizationJRC Joint Research Center
LCCS Land Cover Classification SystemLCML Land Cover Meta-Language
MERIS MEdium Resolution Imaging SpectrometerMODIS Moderate Resolution Imaging Spectroradiometer
NASA National Aeronautics and Space AdministrationNREL National Renewable Energy Laboratory
NRL Natural Resources Land and Water DivisionRHAP Regional Harmonization ProgrammeSADC Southern African Development Community
SUPARCO Space and Upper Atmosphere Research CommissionSPOT Satellite Pour l’ Observation de la TerreUML Unified Modified Language
UN United NationsUNCED United Nations Conference on Environment and Development
UNESCO United Nations Educational, Scientific and Cultural OrganizationUNFF United Nations Forest ForumUNEP United Nations Environmental Programme
UN-REDD United Nations - Reducing Emissions from Deforestation and Forest Degradation in Developing Countries
UTM Universal Transverse of MercatorUSGS United States Geological SurveyWSSD World Summit on Sustainable Development
5
Table of ContentsList of Acronyms 4
Abstract 6
Preface 7
Executive Summary 8
Introduction 10
1. Why GLC-SHARE? 12
2. Methodology 13
3. Standards and Definitions 14
4. Data collection 16
5. Data translation and harmonization criterion 16
5.1 Data fusion 17
5.2 Processing chain 17
6. Outputs 18
6.1 Quality assessment 21
6.2 Compatibility Analysis 22
7. Conclusions 22
Acknowledgments 24
References 25
Annex I - GLC-SHARE Legend 28
Annex II - Full list of national, regional and global datasets 30
Annex III - Dataset matrix 32
Annex IV - GLC-SHARE SEEA LCML Legend 34
Tables and Figures
Figure 1– Reference Grid and dataset distribution 14
Table 1 – GLC-SHARE land cover legend 15
Figure 3 – Distribution of dominant GLC-SHARE Land Cover Database. 20
Table 2 – Quality Assessment of dominant land cover class occurence 21
Figure 4 – Distribution of sample sites 21
Table 3 – Comparative values between GLC-SHARE and GLC 2000 23
Figure 5 – GLC-SHARE distribution of land cover types 23

6
Abstract
Quantification of land cover and vegetation state and its changes over time is of primary importance in satisfying the ever-increasing demand for reliable data and information to support studies, research and sustainable development policy at various scales. The availability of adequate information on land cover assessment and monitoring of its dynamics are essential requirements in understating and analyzing natural phenomena, such as climate change and variability and their predicted impacts on land and water resources and productivity, vegetation cover and biomass growth; as well as providing means to assess carbon stock accountability. Moreover, it helps monitor sustainable agriculture and rural development and supports the formulation of evidence based sound sustainable land development and land use policy addressing issues of food security and environmental sustainability. Land cover information is therefore fundamental in fulfilling the mandates of many United Nations, international and national institutions and programmes.
Assessing land cover of our world’s natural resources contributes to promoting sustainable land resources management that increases production, makes efficient use of resources and sustains ecosystem services addressing food security and agro-environmental threats. FAO supports national, regional and global land resources assessments and databases, so that policies and decisions can be based on better understanding of land status, potential and trends, constrains and opportunities.
Despite the recognition of such importance, current users of land cover information still lack access to sufficient reliable or comparable baseline data. In addition, due to the fact that geospatial information on land cover is primarily derived as an interpretation of the reality, and it is possible for multiple interpretations to co-exist, as well as the increased number of users of such information at an unprecedented scale, issues of information meaning and conceptualization and proper use become more extremely important. In such situation, it is easy to understand the importance of a more (as much as possible) accurate global product that reproduces a reliable model of the main land cover types using all available and adequate land cover databases harmonized using standard definitions and land cover classifiers based on the Land Cover Meta-Language (LCML) elements which are currently part of the international standard on land cover classification.
The overall objective of the “Best available Global Land Cover Share” (GLC-SHARE) Beta-Release 1.0 database of year 2014 project is to improve the land cover baseline data using the best-available land cover datasets, chosen among several national, regional and global databases with a high and medium resolution that match the spatio-temporal and thematic criteria.
Global Land Cover-SHARE (GLC-SHARE) database assists in global assessments by creating the best available data and information through harmonization-data fusion and standardization of various products in-line with System of Environmental Economic Accounts (SEEA) and FAO land cover classification standard increasing compatibility and interoperability of the geospatial products, fostering community of practice and collaborations by the land cover mapping community.
7
Preface
Particularly, continuous increase of world’s population and demand for food and staple production poses a major challenge for agriculture in the short and medium period. It requires an integrated and systemic approach to face food insecurity and natural resources loss threats. To address sustainable use and management of natural resources toward development and adoption of farming technology and management practices capable to ensure food availability and agricultural livelihoods, meaningful comparison of potentially arable land with presently cultivated land requires that, within the potential arable land, non agricultural land uses are accounted for. Land cover and land cover change is recognized as the precursor of land use and land use change.
FAO, as many other international organizations and scientific institutions, needs timely and reliable information on land cover and its changes at global, regional and country levels to support implementation of the UN Millennium Development Goals, UNCED Agenda 21, WSSD Plan of Implementation, Rio+20 Declaration, international environmental conventions on climate change, biodiversity, and desertification, and its programmes, projects, other activities, including the following UN-coordinated environmental initiatives:
© The Sustainable Development Goals (SDG)s.
© The Framework Convention on Climate Change (FCCC);
© The Convention on Biological Diversity (CBD);
© The Convention to Combat Desertification (CCD);
© The Kyoto Protocol;
© The Millennium Development Goals (MDG)s;
© The United Nations Forest Forum (UNFF);
To address the global challenges in the short and medium period, much basic and consistent information is necessary. The global land cover database is one of the crucial inputs for many applications, projections and models. Until now several global databases are available however they have issues on the definitions, legends and accuracy.
The goal of creating a global “best available” land cover database is a significant step in improving the information accuracy of global land cover database. This effort is essential to provide a common reference baseline for the scientific and decision support products community dealing with analysis and modelling of land cover data at the global level (e.g. the International Conventions on Climate Change, the Convention to Combat Desertification, the RAMSAR Convention and the Kyoto Protocol, UN-REDD, FRA and many others).

8
Executive Summary
The Global Land Cover-SHARE (GLC-SHARE) is a new land cover database at the global level created by FAO, Land and Water Division in partnership and with contribution from various partners and institutions. It provides a set of eleven major thematic land cover layers resulting by a combination of “best available” high resolution national, regional and/or sub-national land cover databases. The database is produced with a resolution of 30 arc-second2 (~1sqkm) . The GLC-SHARE 2012 Beta-Release 1.0 is published by FAO in 2014. Complete free and open access to the data and metadata products are available at FAO GeoNetwork www.fao.org/geonetwork
It is created to respond at the increasing need for reliable information on the global extent and distribution of the major land cover types at the global level.
The major benefit of the GLC-SHARE product is its capacity to preserve the available land cover information at the country level obtained by spatial and multi-temporal source data, integrating them with the best synthesis of global datasets.
Many efforts have been carried out to describe the cover data at the global level. Some of them utilize Medium Resolution Satellite products (e.g. MERIS, MODIS) with a pixel resolution of 250-300 m. The results are widely applied in many environmental applications worldwide. While there have been many attempts to describe land cover data at the global level, a few of them offer a highly variable level of accuracy; in particular, low approximation exists, for example, in the definition of cropland and tree extension, especially in specific areas of the world. On the other hand, the mapping efforts at national level have been executed by local mapping agencies and/or national projects at a more detailed scale, with legends and land cover mapping methodologies differing widely. GLC-SHARE makes a huge effort to bring together these valuable datasets available worldwide, offering multiple benefits and aiming at enabling a platform for partnerships and contributions by all.
The approach implemented is based on the utilization of the Land Cover Classification System (LCCS) for harmonization of the various available land cover databases. Available land cover legends are translated using the land cover classifier elements to assign the most adequate classifier values and ranges at an intermediate step, followed by a second iteration where they are converted into the major land cover classes by assigning the class, class unit, minimum, maximum, range and best estimate values to each land cover class. The results are reported at 30 arc-second grid cell as a percentage land cover class at a successive step. The outputs make use of thematic and spatial high resolution land cover databases for various areas globally (up to 66 % of the total surface area) is covered by high resolution datasets. Where national or sub-national land cover data are not available, the information refers to the global datasets. The preliminary results are validated and calibrated. The product is by definition available at various accuracy levels related by the original data.
The validation phase enriches the reliability of the final product. It can be considered a crucial and essential phase obtainable using the high resolution images available and the effort of experts, even if is the most time-consuming part the production chain.
2 A minute of arc, arcminute, or minute arc (MOA), is a unit of angular measurement equal to one sixtieth (1⁄60) of one degree (circle⁄21,600), or (π⁄10,800) radians. In turn, a second of arc or arcsecond is one sixtieth (1⁄60) of one minute of arc. Since one degree is defined as one three hundred and sixtieth (1⁄360) of a rotation, one minute of arc is 1⁄21,600 of a rotation.
9
The procedure steps can be cyclically repeated to include any new available databases in the near future. It is desirable that the plethora of high resolution databases is constantly increased to ensure better information and fill the current gaps.
GLC-SHARE is developed using active and passive participatory approach of the main stakeholders. It makes use of available land cover databases prepared by national and regional experts using standards and classification systems. GLC-SHARE fosters active involvement of the main stakeholders in the process and enables application of crowd sourcing in obtaining collaborations from the national and international experts. It is compliant with major international forum recommendations that the data is compiled by countries using their own requirements which are translated and harmonized using standard definitions.
Applications of the database include assessment, monitoring and reporting of the distribution of the major land cover classes, land suitability evaluation, land accounting, environmental accounting, climate change impact assessments in productivity and yields, land use planning and sustainable development addressing food security and environmental threats.
The GLC-SHARE has been initially prepared to improve the GAEZ land cover layer information; however, the multi-benefit effects for the global scientific community can be recognized. The product improves the information needed for assessment of natural resources, land and water global data, but also for food security purposes, agricultural production and land management. It can be considered the baseline for global climate models, land use and land cover change analysis, as well as forestry analysis and assessment.
By improving the accuracy of the land cover baseline the quality and reliability of outputs will be propagated into the direct and indirect outputs.
10
Introduction
The first attempt to describe the global land cover was the map DISCover1 started in 1992 and completed in 1997. It was produced at 1km resolution with a legend of 17 classes (Belware, A. S., 2008). Many other cartographic land cover efforts to describe and model global land cover have been followed (e.g. IGBP-DIS, GLC 2000, GLOBCOVER, GLCNMO, MODIS types, etc). They were carried out because of the increasing availability of data from several satellites and capability tools ever more sophisticated and accurate to process and store data. With none of these results is the scientific community satisfied so far. The challenge to produce a high-quality global product continues.
However, this usually requires a long time and many efforts, both methodological and conceptual. Mainly this task has been executed by several academic institutions and scientific teams in the last decade. The accessible and handy land cover is, conversely, difficult to represent at the global level. Describing (modelling) reality in all its facets and complexity is mostly impossible. Furthermore, large gaps still exist, for example, in our knowledge of the current geographic distribution and spatial pattern of crop performance (Liangzhi et alii, 2009). Besides, many regional and national high resolution databases were produced and many of them are available to the scientific community. They are prepared with different methodological approaches; thus, the data are hard to directly compare. On the other hand, the global layers produced suffer either an excessive simplification, or they do not assure the same level of accuracy all over and for the all classes of the land cover types. An assessment on cropland extension using several global databases, for example, reports a difference of more that 20% in the total extension (Fritz et alii, 2014).
Despite the quality and the accuracy of the databases available, the number of specialist and non-specialist users of land cover information increases and the spatial data is used to answer more questions about the environment. The “North America Land Cover Summit” emphasized the importance of land cover and other biophysical data in environmental assessment pointing out the importance of spatially explicit integration of these data to address critical environmental issues, as well as the increasingly availability via websites and data portals of spatially continuous data base on land cover and other attributes (Bruce Jones, K., 2007).
On the other hand, the net result of reducing the effort required to obtain the data, also reduces the incentive for users to understand the data in the wider sense. Very often the users do not distinguish between data and information and they assume that “what is downloadable” is adequate and satisfy their needs despite the meaning and semantic of the data as well its acquisition and survey methods (Comber, A. et alii, 2005).
Now-a-days, there is an increasing concern of the scientific community and policy makers about the effects and consequences of climate change, generating scientific research and studies at the global level. There is also an increasing requirement for global land cover information with high accuracy and reliability. With the increase of the non-specialist users of the Geographic Information and spatial data usage to answer more questions about the state of land cover and the environment, the need for users to understand the wider meaning of the data concepts becomes more urgent (Comber, A. et alii, 2005).
1 The International Geosphere-Biosphere Programme Data and Information System (IGBP-DIS) is co-ordinating the development of global land data sets from Advanced Very High Resolution Radiometer (AVHRR) data. The first is a 1 km spatial resolution land cover product ‘DISCover’, based on monthly Normalized Difference Vegetation Index composites from 1992 and 1993. DISCover is a 17 class land cover dataset based on the science requirements of IGBP elements. Mapping uses unsupervised classification with post-classification refinement using ancillary data.

11
Increased public access to spatial information aiming at informing decision-making, increased use of digital map only shifting away from extensive reports and metadata records, various data with limited quality accessible through the internet, and limited requirements by current metadata standards on the organizational context which was used to create the data in the first place have resulted on the reduced effort required to obtain the data which also reduces the incentive for the users to understand the data in a wider sense. One of the consequences of this whole situation is that extensively manipulated information is treated as data by users who do not fully understand what it represents: its meaning or semantics (Comber, A. et alii, 2005).
In such context, GLC-SHARE is designed as reconciliation and reliable synthesis of land cover concern for the scientific community; the effort is directed to:
© Synthesize the existing global information sources into a single database;
© Incorporate the best-available national and sub-national land cover information;
© Produce a harmonized global land cover product using land cover classifiers and standards;
© Create an easy understandable, relatively simple and fully documented product which contributes to reduce the risk of information misuse;
© Provide quantifiable baseline information on the distribution of the major land cover types.
The GLC-SHARE database is created based on the following criteria:
© Use existing available land cover databases at national, regional and global level;
© Use the best available spatio-temporal land cover databases;
© Use the land cover legend prepared by SEEA and FAO based on the Land Cover Meta-Language;
© Make use of the harmonization of the land cover elements addressing semantic requirements;
© Use data fusion technology;
© Progressively update the database getting input from the community of users and include additional datasets as they become available.
The new product offers several positive feedbacks:
© First, it provides a global harmonized land cover database;
© Second, it is in line with the international standards. It is based on an aggregated legend developed within the System of Environmental Economic Accounts (SEEA) framework carried out by UNCEEA (Weber, J.L., 2010) and on the Land Cover Meta-Language (LCML) elements (ISO TC-211 19144-2:212 LCML);
© Third, the level of accuracy in the different regions is well known; it depends on the data sources and directly to the data provided by the countries. The accuracy of the global product can be improved accordingly with the national mapping effort and availability to share the data;
© Finally, thanks to the flexible and open ended conceptual approach implemented to create the products, it is relatively simple to update the product without need to re-process the entire database.

12
1. Why GLC-SHARE?
The idea to reconsider the production of a global land cover layer is linked to the forthcoming update of Global Agro-Ecological Zones (GAEZ) database, the innovative FAO methodology for land suitability. To answer to the main questions about the land use policy, FAO started nearly more than 30 years ago to develop new methods and approaches.
The new powerful web application GAEZ Data Portal www.fao.org/nr/gaez, developed by FAO in partnership with the Institute for Applied System Analysis (IIASA), for assessing agricultural resources and potential is in place and fully operational. The GAEZ database provides the backbone for many applications including the quantification of land productivity (FAO, 2012). Results are commonly aggregated for current major land use/cover patterns and by administrative units, land protections status or broader classes.
GAEZ is be amongst the first applications to benefit from the creation of the “best available” land cover database.
In this context, it is clear that land cover and, in particular the cropland extension, is a critical key parameter from which the other GAEZ estimations derive.
The accuracy of cropland has been revised by Geo-Wiki initiative www.geowiki.org (Fritz S. et alii, 2014). FAO and authors of this paper contributed actively to the initiative. The methodology used a comparative analysis of the values derived from the existing high-resolution datasets.
Many environmental issues linked with the increasing pressure of population and urban expansion, land cover/land use change and environmental preservation have supported the initiative to develop a global model capable of describing the most relevant land cover types.
FAO (NRL Geospatial Unit) has a long relevant mapping experience in many areas around the world acquired in more than 20 years (AFRICOVER, GLCN, NRL projects). Activities have been conducted at the sub-national, national and regional level creating many high-resolution databases using FAO methodology, tools, standards and various data sources.
GLC-SHARE Beta-Release 1.0 2014 is not considered a final static product; at the moment, the output is created using the best available databases. However, it is designed to be an evolving product in a wider global participation and collaboration strategy projected in the future.
The basic concept of the product enables the following:
© At the present date, all the data coming from the “best available databases” have been included;
© The member countries can compile (with or without the FAO-NRL support) their own land cover databases according to their national mapping activities. Should they choose to collaborate with GLC-SHARE it will be possible to make available their contributions;
© The member countries can join the FAO global land cover project including the national database. The methodology allows the maintain the sometimes sensitive full resolution cartographic information requirements with the custodian (country/region) and also contribute to increase the accuracy and quality of the global land cover database. This approach includes a great potential in providing good results for national and global analysis and does not tamper with the policy of the national cartographic agencies (often considered a sensitive matter);
© Ingesting high-resolution data, the members will have multi-benefits, first of which is a more accurate assessment when the GAEZ applications and tools are applied, as well as applications of standards which improve the baselines and assist to properly monitor the trends on the availability and use of land and water resources.

13
Many efforts are expected from the stakeholders to promote the utilization of GLC-SHARE. Increased active and passive participation and collaboration contributes to improve the database adding new detailed datasets, which in turn increases the accuracy of the product itself.
2. Methodology
The basic concept adopted to develop the global land cover share database is effective: integrate the best land cover data available (at sub-national, national, and regional and global level) into one single harmonized database using international standards. This task requires an effort of harmonization among different layers and legends to create a consistent product.
Therefore, the following methodology was applied to:
© absorb, overcome and minimize the thematic and spatio-temporal differences between individual databases;
© create an efficient and practical mechanism to harmonize various datasets using the land cover elements;
© use data fusion techniques to overcome some of the harmonization issues;
© identify agreement/disagreement between a limited number of global dataset at pixel level;
© create land cover database;
© validate land cover database;
© develop a fully automated “procedure” to update the database when new datasets may become available.
The harmonization criteria adopted for data capture is essential to re-absorb and minimize the differences inheriting amongst various datasets. The GLC-SHARE legend adopted provides eleven aggregated core land cover class elements,
which enable to harmonize the data originating from various land cover classification schemas. However, these class elements are somewhat too general to be able to capture adequate level of detail. It is found that some detail is lost in the data translation and harmonization process due to certain limitations of the definitions adopted.
The procedure initially adapts the land cover legend based on land cover elements, then it gives higher priority to the most detailed and accurate data at thematic, semantic and spatio-temporal domains. The pixel value(s) of the final database are calculated using the best available datasets, which are carefully, analyzed prior to their use. The value is calculated as percentage share of all eleven-land cover classes as explained in the Box 1. When some values are missing, they are extracted from the global database. It should be noted that mainly Globcover 2009, MODIS VCF 2010 and Cropland database 2012 are used in areas where no national or regional data is available.
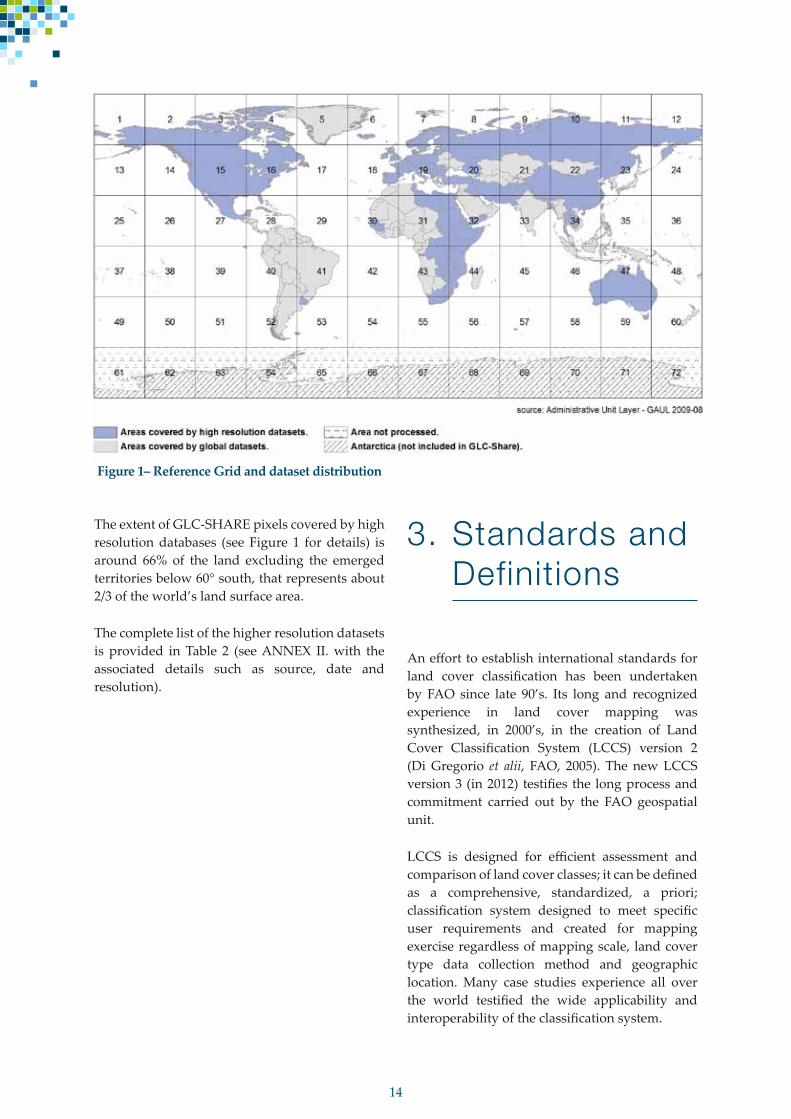
To optimize the calculation time and procedures, a reference grid is created (figure 1). The globe is divided into 72 tiles with a regular frame of 30 degree and pixel resolution of 30 arc-second (~1 sqkm). The southern strip, falling in the Antarctica below latitude -60°, is not considered in the calculation in view of the poor presence of emerged land and vegetation cover.
For the rest of the global land surface, the percentage of occurrence of land cover class present in each grid cell is extracted from the country datasets if available or from global datasets otherwise. The output includes 11 layers each representing the 11 major land cover classes defined by the FAO and SEEA legend (Weber, J.L. 2010). The land cover legend is shown in Table 1 while the complete land cover class definition is provided in ANNEX I.
14
The extent of GLC-SHARE pixels covered by high resolution databases (see Figure 1 for details) is around 66% of the land excluding the emerged territories below 60° south, that represents about 2/3 of the world’s land surface area.
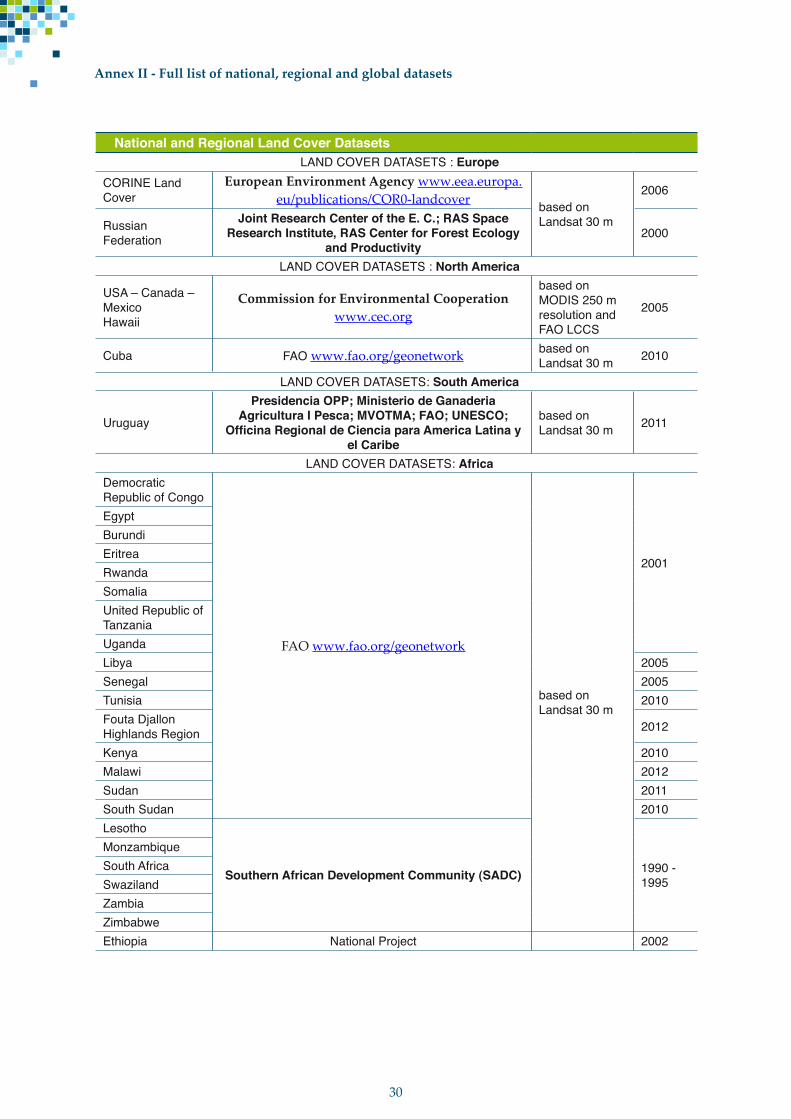
The complete list of the higher resolution datasets is provided in Table 2 (see ANNEX II. with the associated details such as source, date and resolution).
3. Standards and Definitions
An effort to establish international standards for land cover classification has been undertaken by FAO since late 90’s. Its long and recognized experience in land cover mapping was synthesized, in 2000’s, in the creation of Land Cover Classification System (LCCS) version 2 (Di Gregorio et alii, FAO, 2005). The new LCCS version 3 (in 2012) testifies the long process and commitment carried out by the FAO geospatial unit.
LCCS is designed for efficient assessment and comparison of land cover classes; it can be defined as a comprehensive, standardized, a priori; classification system designed to meet specific user requirements and created for mapping exercise regardless of mapping scale, land cover type data collection method and geographic location. Many case studies experience all over the world testified the wide applicability and interoperability of the classification system.
Figure 1– Reference Grid and dataset distribution

15
The standardization process, endorsed by ISO, gave the opportunity to improve the structure of the classification system. The new version in UML format provides the user with a powerful tool to classify and manage the land cover information.
The recent improved version the new, LCCS version 3 software, is directly derived from the Land Cover Meta Language (LCML). Using LCCS version 3, any land cover feature can be described using a set of attributes (Elements) directly derived through the LCML, which is a language able to describe any type of land cover worldwide at the required scale or level of detail. “Land cover can be represented using simple atomic elements rather than categories”.
The UN Land Cover Classification System seems to provide a valuable universal land cover language for building land cover legends and comparing existing legends (Herold M. et alii, 2011). Adopting the common standard criteria, the ability to interpret and exchange information among users can be achieved. In fact, if a legend is created using standards it is compatible and interoperable with other products that meet the same standards. Furthermore, the content of the information exchanged will be unambiguous and fully understood. The different elements (and/or classifiers) provide a clear simplified characterization of the situation in the ground presenting useful results. In addition, it simplifies the process of harmonization in which the similarities between existing definitions of different datasets are emphasized and inconsistencies reduced.
The general approach proposed by FAO with LCCS is the possibility to create a set of consistent rules and in a variety of different conditions. The System of Environmental-Economic Accounting (SEEA) Central Framework panel created the global legend limiting to a set of circa 15 core land cover classes. This solution meets the requirements of international comparability and allows straightforward translation into the main land cover nomenclatures currently used. It allows also further coherent developments of disaggregated nomenclature classes, fit for particular conditions (SEEA, 2012).
The potentiality of the classification systems was exploited during the translation phase. Many databases are created using LCCS both at the global and national level; the specific parameters used in the process of class creation of the original legends are very useful for the correct identification of units and their systematic comparison with the similar classes present from other legends. Many other used their own classes and often no specific methodology has been followed to the generation of the legend; however, using the SEEA legend it is possible to translate all the categories present in the original legends representing different ontology to create a consistent and comprehensive land cover layer. However, the GLC-SHARE Beta-Release 1.0 2014 legend adopts only 11 land cover classes, which are created using LCML (see ANNEX IV). The cropland class is aggregated as indicated in ANNEX I as it was found difficult to map all the different cropland classes individually due to limitations in the current datasets.
The legend adopted for translation is shown in Table 1.
Land Cover types LabelArtificial Surfaces 01
Cropland 02
Grassland 03
Tree Covered Areas 04
Shrubs Covered Areas 05
Herbaceous vegetation, aquatic or regularly flooded
06
Mangroves 07
Sparse vegetation 08
Baresoil 09
Snow and glaciers 10
Water bodies 11
Table 1 – GLC-SHARE land cover legend

16
4. Data collection
Data are collected worldwide based on the data availability, accessibility and data quality criteria.
Many databases are available in FAO as final products of several years of mapping activities in different areas of the world. Many others come from collaboration between FAO and national mapping projects. Therefore, they are already structured using the LCCS schema. The interest of some of these contributing partners from our member countries to join the GLC-SHARE project and to share and distribute their land cover database was immediate. Also supported by their interest to benefit from the potential impacts of consistent assessment of land and water resources, land accounts and AEZ applications.
Some of the global layers are downloaded from websites, others are acquired successively from different sources generally following an official request. Some of the datasets are available only as aggregated versions. However, they provide an important contribution in improving the available data. The datasets collected are available in raster at various resolutions or in vector formats. The complete list of the datasets used in the creation of the GLC-SHARE Beta-Release 1.0 2014 is provided in ANNEX II. Figure 1 shows the distribution of the high resolution datasets used in the creation of the current product.
Due to the nature and content of the information coming from different sources it is not a straight foreword process as explained above. A lot of effort went into the translation and harmonization process as explained below.
5. Data translation and harmonization criterion
The legend is the key for reading and interpret any database. It also offers a model to synthesize the real world. The information is presented using different arrangements of class types following the specific approaches adopted. The translation of different legends using a general schema is a very sensitive process. It implies a correct categorization of the original class into different more generic definitions. Therefore, the purpose of aggregated legend is to classify every land cover type avoiding overlapping and ambiguity. Generalization has to preserve as much as possible the consistency among different databases.
The GLC-SHARE legend adopted contains 11 aggregated land cover classes (Table 1). In order to facilitate the processing, each class is labeled using a 2 digit string code from 01 to 11.
The available databases are successfully translated using GLC-SHARE class elements. The classes present in the legend are consistent enough to keep much of semantic and thematic information. The main global land cover types “cartographically mappable” at resolution of 30 arc-seconds can be considered fully represented.
The description of the single classes is fully comprehensive and well balanced both in natural and agricultural components: the natural coverage e.g. grasslands, trees and shrubs, as well sparse vegetation in terrestrial and aquatic environment includes a reference percentage of coverage (< 10% and 2-10% coverage for sparse) that is found very useful during the translation phase. In fact, the single basic classifiers (the so-called in LCCS version 3 atomic elements such as trees, herbs, shrubs and so on) described in the original LCCS legends, are perfectly indentified and re-assigned in the correct category taking into account also their percentage share values.

17
For bare soil, for example, the description gives a clear indication of the adequate coverage of vegetation that is the border line between bare and sparse vegetation. When in the original classes all these elements are included, the translation is performed with high accuracy. Yet, the descriptions of the other abiotic surfaces, snow and water bodies, there is an indication of persistence or recurrence time, important and useful characteristics for a better identification of the class.
Clearly, the most sensitive part is the translation of classes from agricultural area. Originally, the idea was to include a distinction among different types of crops (herbaceous, shrub crops and trees-multiple layer crops). Hardly was it possible to distinguish between 3 levels of cropland classes as originally tested. The information was rarely present in the original databases and therefore difficult to be implemented on regular basis in all the data.
5.1 Data fusion
The integration of multiple data into a consistent accurate and useful representation is the so-called process of ‘data fusion’ well known to the geospatial community. In the geospatial domain, the fusion is synonymous of data integration that can be considered the process that combines diverse data sets in to a fused data output to produce a more informative and synthetic product in respect of the inputs.
The approach adapted here is a way of active and passive platform for contributors and various experts, which makes the product a great candidate for online services to obtain collaborations. The translation and harmonization through the utilization of standard definitions and use of the Land Cover Classification System (LCCS), and the Land Cover Meta Language (LCML) elements makes it possible to undertake such assessment including contribution from a number of national, regional and global datasets. The approach proves that through the utilization of standards
it is possible to fully or partially translate and harmonize various datasets, and implement the data fusion and data interoperability principles “leave the data where it is and re-use them in many ways (applications)”.
The type of fusion applied for GLC-SHARE can be categorized as a high process stage. The output, in fact, incorporates all the attributes and characteristics of the original data and it is a de-facto new product with its own characteristics. It preserves the spatial consistency and semantic information maintaining all the attributes present in the original databases. In addition, the temporal differences and resolution are re-absorbed. All the characteristics and semantics of each location are maintained in the final product.
5.2 Processing chain
Initially the data is organized to a structured database. The legend for each data layer is reviewed and translated to the GLC-SHARE legend assigning a priority level, which is used during the data fusion process. The criteria used to assign the priority rank is based on the data quality dimension. The following rules are applied during the priority ranking:
© Thematic and semantic consistency and/or spatio-temporal adequacy based on accuracy, completeness, timeliness, consistency and auditability dimensions have the highest priority;
© Legend translation adequacy based on land cover class elements;
© Priority ranks assigned to each datasets and each class.
The more detailed thematic databases as Global Mangroves layer is considered at the highest level, followed by national databases, commonly generated at high resolution (30 meters or less) and the legend translation is performed adequately based on the land cover class elements, which

18
GLC2009
Croplands Extent
MODIS VCF2010
Mangroves
% share per class (01-11)
Class value assigned based on
maximum % share
Source date and resolution per pixel
Reference grid
GAUL
are considered the basic components for the data extraction. For the remaining pixels, the land cover values are derived from the global datasets.
After the generation of the grid at 30 arc-seconds, country masks of the available databases are generated and filled with the values from the best available country datasets. In the next step, if some layers do not exist in the original database, the pixel values are replaced using the GlobCover 2009 (see ANNEX III for the complete list). At a successive step, a number of validation and calibration procedures are implemented. The first check is that the sum of values at each pixel should not be higher than 100. The procedure applies algorithms that adjust the pixel values to equal 100. This is an interactive process that is used to flag any issues in the datasets, as well as in the data processing chain. The detail of the processing chain is shown in Box 1.
6. Outputs
The GLC-SHARE Beta-Release version 1.0 2014 database includes 11 layers in raster format (one layer of each GLC-SHARE legend class 01 – 11). For each pixel, the accuracy and associated information as source, date and resolution are indicated in the associated data quality indicator layer.
Figure 2 shows the land cover share for all 11 classes. In addition the dominant land cover database is created. The database is creating assigning the class with the highest value to each pixel. Figure 3 shows the distribution of major land cover types.
100%0%
DAT
A IN
PUT
PRO
CES
SIN
GVA
LID
ATIO
N
OU
TPU
TS
11 Land cover
datasets
Preliminary database
YES: process the final database
1 Major land cover
dataset
1 Quality
indicator dataset
Metadata report
Metadata report
Technical paper
Box 1
Preliminary adjustment using sum of values = 100 criteria and decision tree algorithm
Assign the rest using global datasets as per ranged criteria
Assign values to pixels using highest ranked dataset
Calculate pixel values as % area covered by each class inside the pixel
Generate reference raster layer for each class 01 – 11
NO:go back to processing
Metadata report
Artificial Surfaces
Does the quality
criteria met?
Global Other datasets
Africover
Corine LC
North America
...
National/Regional

19
100%0%
100%0%
100%0%
100%0%
100%0%
100%0%
100%0%
100%0%
100%0%
100%0%
Cropland
Grassland
Tree Covered Area
Shrubs Covered Area
Herbaceous Vegetation
Mangroves
Sparse Vegetation
Baresoil
Snow and Glaciers
Water bodies

20
Figu
re 3
– D
istr
ibut
ion
of d
omin
ant G
LC-S
HA
RE
Land
Cov
er D
atab
ase.
01
Artifi
cial
Sur
face
s 0
4Tr
ee C
over
ed A
rea
07
Man
grov
es 1
0Sn
ow a
nd G
laci
ers
+ An
tarc
tica
02
Cro
plan
d 0
5Sh
rubs
Cov
ered
Are
a 0
8Sp
arse
Veg
etat
ion
11
Wat
er b
obie
s 0
3G
rass
land
06
Her
bace
ous
Vege
tatio
n 0
9Ba
reso
ilAn
tarti
ca

21
6.1 Quality assessment
The validation of the database consisted at the selection of validation samples using stratified random sampling sites. It is estimated that around 1000 samples would be necessary to conduct the quality assessment. The validation procedure is implemented using the custom application developed for GIS software with a direct link to high resolution imagery. The distribution of the samples location is shown in Figure 4.
Data analysis for the accuracy assessment consisted of creation of the error matrix (confusion matrix). The error matrix compares, on a class-by-class basis, the relationship between known reference data (ground truth) and the corresponding results of the dominant land cover class. It is calculated by the sum of misclassified rates for each class type, calculation of user’s and producer’s accuracy for each class, and evaluation of the overall accuracy of the map using the kappa statistic.
Overall accuracy is computed by dividing the total number of correctly classified points (the sum of the elements along the major diagonal) by the total number of points. The Omission error (Producer’s accuracy) and the Commission Errors (User’s Accuracy) are also calculated.
Table 2 shows the results of the analysis. The overall dominant class accuracy is around 80% which appears to be quite promising.
In the long run, the reliability of the dataset is also expected to increase. The next steps will be concentrated on improving the quality of the database. FAO mapping activities are ongoing operatively; therefore, it is expected to have new national high-resolution datasets available in the near future. Moreover, it will be possible to obtain data from different national and international partners and other institutions to fill the gaps.
Figure 4 – Distribution of sample sites
GLC-SHARE-2014
Validated Classes
01 02 03 04 05 06 07 08 09 10 11 Total Users
User's accuracy
Inte
rpre
ted
Cla
sses
01 7 0 0 1 0 0 0 0 1 0 1 10 70.0%02 0 150 4 2 1 0 0 0 1 0 0 158 94.9%03 0 6 126 8 9 4 0 3 5 5 1 167 75.4%04 0 3 3 356 1 3 0 6 2 1 0 375 94.9%05 0 5 12 13 38 2 0 6 0 0 0 76 50.0%06 0 1 6 2 0 14 0 0 0 2 0 25 56.0%07 0 0 0 1 1 0 8 0 0 0 0 10 80.0%08 0 3 16 5 2 0 0 27 0 1 0 54 50.0%09 0 1 25 0 4 3 0 18 86 11 2 150 57.3%10 0 0 0 0 0 0 0 1 1 52 0 54 96.3%11 0 0 0 0 0 0 0 0 0 0 8 8 100.0%
Total Producers 7 169 192 388 56 26 8 61 96 72 12 1087
Producer's accuracy
percentage100.0 % 88.8% 65.6% 91.8% 67.9% 53.8% 100.0 % 44.3% 89.6% 72.2% 66.7% 80.2%
Table 2 – Quality Assessment of dominant land cover class occurence
22
7. Conclusions
The GLC-SHARE Beta-Release 1.0 2014 database is released to public by FAO in 2014. Hardly, any other global products available so far will exhibit such level of completeness and the accuracy. Previous similar databases had limitations in the number of classes, definitions, standards and precision.
The approach adapted can be considered a step forward because it proposes a comprehensive land cover legend improving the level of accuracy in more than two-thirds of the global land surface. As result, the product offers many advantages to the international users and scientific community, first of which is a high quality input for many land and environmental studies and assessments.
In the present project, the main efforts were directed to design a complete and correct methodology to synthesize in one database all the best available national and regional products. The actual results are fully effective and compelling; even though, on this preliminary version, a strong phase of validation has to be carry out.
The land cover mapping activity is carried out in full agreement and collaboration with the national technical institutions and authorities. The product and methodology are designed to enable collaboration by the community of practice and make use of the web services technology.
A comparison analysis is also performed using another global dataset, GLC 2000 in which, a similar or almost similar survey method can be recognized. A similar aggregation of classes is attempted in GLC-SHARE to match the ones of GLC 2000. There are some differences on some classes which are explained by differences on the definitions, method of data capture, estimate and differences in aggregation rules and data quality. Particularly, GLC 2000 includes the mixed cropland inside the equivalent GLC-SHARE 02-Cropland. Details are provided in Table 3 below.
6.2 Compatibility Analysis
A first attempt to compare GLC-SHARE with FAOSTAT data is considered in order to highlight advantages and limitations of these two important datasets. However, it must be considered a very sensitive process due to undeniably and intrinsic factors linked with the different criteria used to generate them.
Several points have to be considered when the results of the direct comparison is interpreted. The first one concerns the country area extensions. FAOSTAT report values significantly different from GAUL taken as reference line for country boundaries; evident discrepancies exist in many countries.
Another important concern relates the land cover class definition. The characterization of a land cover class as well as the related percentages of coverage may not match at all times; as a result, significant differences in land cover types extension exist in some countries when they are compared with the statistical values.
Intrinsic dissimilarities are implicit considering the definitions adapted, standards and methodology for data acquisition. Georeferenced databases based on remote sensing products, usually tend to over-estimate the extension of some classes especially the cropland; on the other hand, the accuracy in country reporting and accounting method included in the statistical database is often unknown and hardly comparable even between each other in some cases.
These evident dissimilarities have contributed to the definition of new important subject matters to be considered, in the next stages, for improving and developing the product.
The systematic revision of the differences is programmed; the analysis will give further indications where the efforts have to be focused for harmonizing and minimizing the discrepancies.

23
Figure 5 shows the land cover percentages derived from GLC-SHARE database. Table 3 shows comparative values between GLC-SHARE and GLC 2000.
Tree covered areas represent around one quarter of the total global land surface. The other most represented cover classes are cropland and bare soil. Considering differences in accuracy and dates, of the values show comparable ranges.
The validation procedure has also shown the high level of accuracy of the product; the overall dominant class accuracy > 80% is quite satisfactory, making GLC-SHARE Beta-Release 1.0 2014 database one of the most accurate global land cover products up-to-now.
However, gaps have to be filled in many areas of the world; these parts should be covered with new high resolution databases in order to have rapidly a complete result worldwide. This product also contributes to targeting geographic regions for investments and development.
Distribution of Land Cover classes globallySource: GLC-SHARE Source: GLC 2000Class Percentage Class PercentageArtificial Surfaces 0.6 Urban 0.2Cropland 12.6 Cropland 15.7Grassland/Shrubs/Herbaceous/Sparse vegetation
31.5 Grassland/Shrubland 30.0
Tree Covered Area 27.7 Forest 29.4Baresoil 15.2 Bare areas 13.3Snow and Glaciers + Antarctica 9.7 Snow and Ice 9.7Water bodies/Mangroves 2.7 Wetlands 1.7TOTAL 100 100
Table 3 – Comparative values between GLC-SHARE and GLC 2000
27.7%
13.0%
12.6%
0.6%2.6%
9.7%
15.2%
7.7%
0.1%
1.3%
9.5%
Figure 5 – GLC-SHARE distribution of land cover types
24
Acknowledgments
The authors thank all the contributors and the institutions, and technical experts that have provided public and free access to available land cover dataset and all that authorized the use of their datasets. The full list of (authors, institutions and websites) is presented in the table of ANNEX II.
The authors would like also to thank Maria Helena Semedo, Moujahed Achouri, Alexander Mueller and Parviz Kohafkhan for their continuous support to the project, Antonio DiGregorio and Ugo Leonardi for their contribution during the development and design of the processes, Lorenzo Vita for his contribution to the translation of the a number of national databases, Emanuela Deleo for her contribution in processing some of the datasets, Edi Kollozaj for her contribution in quality assessment of the database. Special thanks go to Robert Mayo and Valentina Ramaschiello for support with the GLC-SHARE SEEA legend, Patrizia Monteduro for the creation of metadata for FAO GeoNetwork data repository, Ane Gaudert for her contribution to graphic design of the technical paper, Nancy Gallagher and Catherine Gaury for their administrative support.

25
References
Arino, O., Bicheron, P., Achard F., Latham, J., witt R. And Weber J.L.2008. “GLOBCOVER the Most Detailed Portrait of the Earth”. ESA Bulletin-European Space Agency 136:24-31.
Belward, A.S. 2008. Developments in global land cover mapping. Geoinformatics,Vol II – Development in Global Land cover mapping.
Bruce Jones, K. 2007. Importance of Land Cover and Biophysical Data in Landscape-Based Environmental Assessments North America Land Cover Summit, Washington, D. C., USA, 20-22 Septber 2006 Association of American Geographers, Special Vol., 215-250.
Comber, A., Fisher, P. & Wadsworth, R. 2005. What is land cover? Environment and Planning B Planning and Design, 32, 2, 199-209.
European Commission. Food and Agriculture Organization. International Monetary Fund Organization for Economic Cooperation and Development. United Nations. World Bank. 2012. System of Environmental-Economic Accounting (SEEA) Central Framework
FAO 2012, GAEZ User’s Guide, GAEZ Data Portal, May 2012, www.fao.org/fileadmin/user_upload/gaez/docs/UserGuide_EN.pdf
Steffen Fritz, Linda See, Liangzhi You, Chris Justice, Inbal Becker-Reshef, Lieven Bydekerke, Renato Cumani, Pierre Defourny, Karlheinz Erb, Jon Foley, Sven Gilliams, Peng Gong, Matt Hansen, Thomas Hertel, Martin Herold, Mario Herrero, Francois Kayitakire, John Latham, Olivier Leo, Ian McCallum, Michael Obersteiner, Navin Ramankutty, Jansle Rocha, Huajun Tang, Philip Thornton, Christelle Vancutsem, Marijn van der Velde, Stan Wood and Curtis Woodcock 2012. Global Cropland Distribution: The Need for Improved Data and Availability. Eos, Transactions American Geophysical Union, Volume 94, Issue 3, Pages 29–40, January 2013
Herold, M., Latham, J. S., Di Gregorio, Antonio. & Schmullius, C. C. 2006. Activities for evolving standards in land cover characterization. Journal of Land Use Science, 1, 2-4, 157-168.
Land Cover Meta Language (LCML). Geographic Information - Classification System - Part 2. ISO 2012. Reference number ISO 19144-2:2012(E) First edition 2012-07-01. http://www.iso.org/iso/iso_catalogue/catalogue_tc/catalogue_detail.htm?csnumber=44342
Liangzhi, Y. Stanley, W., Ulrike, W. 2009. Generating plausible crop distribution maps for Sub-Saharan Africa using a spatially disaggregated data fusion and optimization approach. Agricultural Systems vol. 99 issue 2-3 February, 2009. p. 126-140
Lillesand, T. M., Kiefer, R. W., Chipman J. W. 2009. Remote Sensing and Image Interpretation. Wiley Press. 5th Edition.
MODIS VCF 2010 MODIS Vegetation Continuous Fields. www.landcover.org/data/vcf/

26
FAO. 2005. UN Land Cover Classification System (LCCS) – Classification concepts and user manual for Software version 2 Prepared by Di Gregorio, A. & Jansen, L. J.M. Environmental and Natural Resources Series, 8.
FAO. 1990. Remote sensing applications to land resources. Report of the 14th UN/FAO International training course in cooperation with the Government of Italy (GCP/INT/411/ITA). Rome, Italy, 6-24 November 1989.
System of Environmental-Economic Accounting Central Framework (SEEA), 2012, White cover publication, pre-edited text subject to official editing, European Commission, Food and Agriculture Organization, International Monetary Fund, Organisation for Economic Co-operation and Development, United Nations, World Bank, 2012
Vancutsem, C., Marinho, E., Kayitakire, F., See, L., Fritz, S. 2012. Harmonizing and combining existing land cover/land use datasets for cropland area monitoring at the African continental scale. Remote Sens. Special Issue: Advances in Remote Sensing of Agriculture. www.mdpi.com/journal/remotesensing
Weber, J.L. 2010. Land cover classification in the revised SEEA. Land Cover Classification for Land Cover Accounting, LG/15/9, position paper drafted by Jean-Louis Weber (EEA), 15th Meeting of the London Group on Environmental Accounting, Copenhagen, 4 October2010.

27

28
Land Cover types Label Description
Artificial Surfaces 01
The class is composed of any type of areas with a predominant artificial surface. Any urban or related feature is included in this class, for example urban parks (parks,parkland, sport facilities).The class also includes industrial areas,waste dump deposit and extraction sites.
Cropland 02
Herbaceous Crops: The class is composed of a main layer of cultivated herbaceous plants (graminoids or forbs). It includes herbaceous crops used for hay. All the non-perennial crops that donot last for more than two growing seasons and crops like sugar cane where the upper part of the plant is regularly harvested while the root system can remain for more than one year in the field are included in this class.
Woody Crops: The class is composed of a main layer of permanent crops (trees and/or shrub crops) and includes all types of orchards and plantations (fruit trees, coffee and tea plantation, oil palms, rubber plantation, Christmas trees etc.).
Multiple or Layered crops: This class combine different land cover situations: © Two layers of different crops (woody + herbaceous): A
common case is the presence of one layer of woody crops (trees or shrubs) and another layer of herbaceous crop, such as for wheat fields with olive trees in the Mediterranean area and intense horticulture, oasis or typical coastal African agriculture were herbaceous fields are covered by palm trees, etc.
© Presence of one important layer of natural vegetation (mainly trees) that cover one layer of cultivated crops: A typical example are coffee plantations shadowed by natural trees in the equatorial area of Africa.
Grassland 03
This class includes any geographic area dominated by natural herbaceous plants (grasslands, prairies, steppes and savannahs) with a cover of 10% or more, irrespective of different human and/or animal activities, such as: grazing, selective fire management etc. Woody plants (trees and/or shrubs) can be present assuming their cover is less that 10%.
Tree Covered Areas 04
This class includes any geographic area dominated by natural tree plants with a cover of 10% or more. Other types of plants (shrubs and/or herbs) can be present, even with a density higher than trees. Areas planted with trees for afforestation purposes and forest plantations are included in this class. This class includes areas seasonally or permanently flooded with fresh water. It excludes coastal mangroves (>07).
Annex I - GLC-SHARE Legend

29
Land Cover types Label Description
Shrubs Covered Areas 05
This class includes any geographical area dominated by natural shrubs having a cover of 10% or more. Trees can be present in scattered form if their cover is less than 10%. Herbaceous plants can also be present at any density. The class includes shrub covered areas permanently or regularly flooded by inland fresh water. It excludes shrubs flooded by salt or brackish water in coastal areas (>07).
Herbaceous vegetation, aquatic or regularly flooded
06
This class includes any geographic area dominated by natural herbaceous vegetation (cover of 10% or more) that is permanently or regularly flooded by fresh or brackish water (swamps, marsh areas etc.). Flooding must persist for at least 2 months per year to be considered regular. Woody vegetation (trees and/or shrubs) can be present if their cover is less than 10%
Mangroves 07
This class includes any geographical area dominated by woody vegetation (trees and/or shrubs) with a cover of 10% or more that is permanently or regularly flooded by salt and/or brackish water located in the coastal areas or in the deltas of rivers.
Sparse vegetation 08This class includes any geographic areas were the cover of natural vegetation is between 2% and 10%. This includes permanently or regularly flooded areas.
Baresoil 09
This class includes any geographic area dominated by natural abiotic surfaces (bare soil, sand, rocks, etc.) where the natural vegetation is absent or almost absent (covers less than 2%). The class includes areas regularly flooded by inland water (lake shores, river banks, salt flats etc.). It excludes coastal areas affected by the tidal movement of salt water.
Snow and glaciers 10 This class includes any geographic area covered by snow or glaciers persistently for 10 months or more.
Water bodies 11
This class includes any geographic area covered for most of the year by inland water bodies. In some cases the water can be frozen for part of the year (less than 10 months). Because the geographic extent of water bodies can change, boundaries must be set consistently with class 11 according to the dominant situation during the year and/or across multiple years.
30
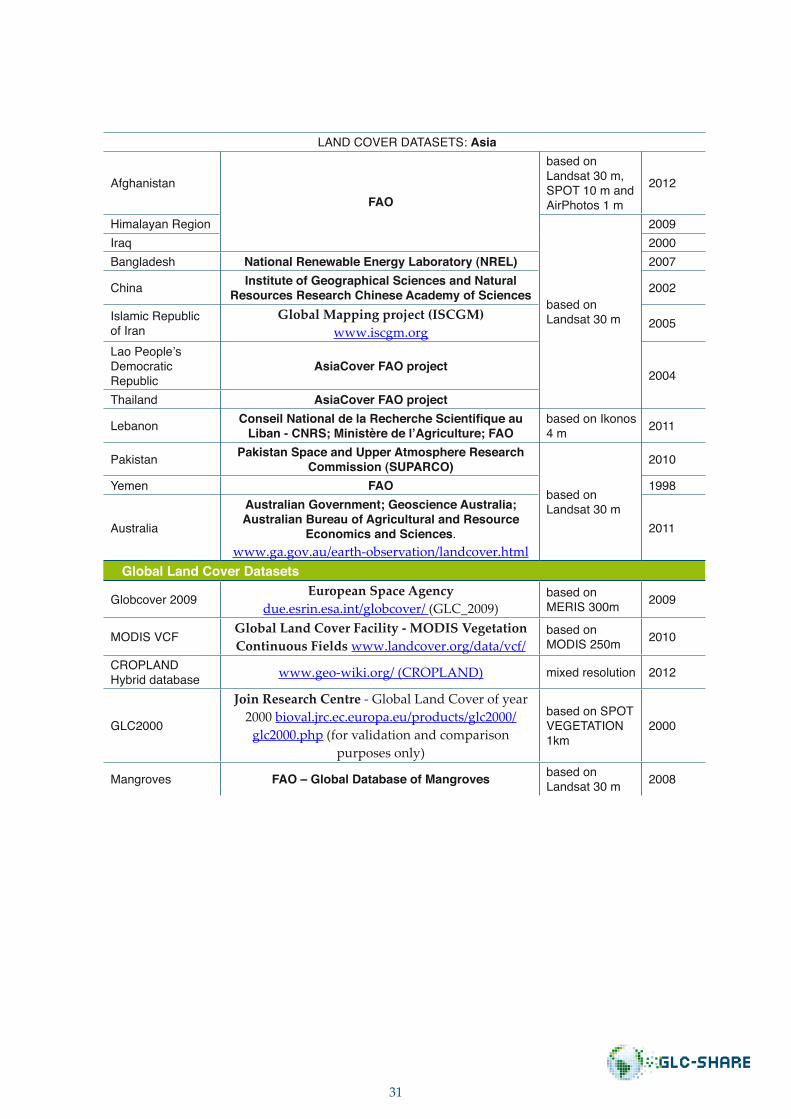
Annex II - Full list of national, regional and global datasets
National and Regional Land Cover Datasets LAND COVER DATASETS : Europe
CORINE Land Cover
European Environment Agency www.eea.europa.eu/publications/COR0-landcover based on
Landsat 30 m
2006
Russian Federation
Joint Research Center of the E. C.; RAS Space Research Institute, RAS Center for Forest Ecology
and Productivity 2000
LAND COVER DATASETS : North America
USA – Canada – Mexico Hawaii
Commission for Environmental Cooperation www.cec.org
based on MODIS 250 m resolution and FAO LCCS
2005
Cuba FAO www.fao.org/geonetwork based on Landsat 30 m 2010
LAND COVER DATASETS: South America
Uruguay
Presidencia OPP; Ministerio de Ganaderia Agricultura I Pesca; MVOTMA; FAO; UNESCO;
Officina Regional de Ciencia para America Latina y el Caribe
based on Landsat 30 m 2011
LAND COVER DATASETS: AfricaDemocratic Republic of Congo
FAO www.fao.org/geonetwork
based on Landsat 30 m
2001
EgyptBurundiEritreaRwandaSomaliaUnited Republic of TanzaniaUgandaLibya 2005Senegal 2005Tunisia 2010Fouta Djallon Highlands Region 2012
Kenya 2010Malawi 2012Sudan 2011South Sudan 2010Lesotho
Southern African Development Community (SADC) 1990 - 1995
MonzambiqueSouth AfricaSwazilandZambiaZimbabweEthiopia National Project 2002
31
LAND COVER DATASETS: Asia
AfghanistanFAO
based on Landsat 30 m, SPOT 10 m and AirPhotos 1 m
2012
Himalayan Region
based on Landsat 30 m
2009Iraq 2000Bangladesh National Renewable Energy Laboratory (NREL) 2007
China Institute of Geographical Sciences and Natural Resources Research Chinese Academy of Sciences 2002
Islamic Republic of Iran
Global Mapping project (ISCGM) www.iscgm.org
2005
Lao People’s Democratic Republic
AsiaCover FAO project2004
Thailand AsiaCover FAO project
Lebanon Conseil National de la Recherche Scientifique au Liban - CNRS; Ministère de l’Agriculture; FAO
based on Ikonos 4 m 2011
Pakistan Pakistan Space and Upper Atmosphere Research Commission (SUPARCO)
based on Landsat 30 m
2010
Yemen FAO 1998
Australia
Australian Government; Geoscience Australia; Australian Bureau of Agricultural and Resource
Economics and Sciences.www.ga.gov.au/earth-observation/landcover.html
2011
Global Land Cover Datasets
Globcover 2009 European Space Agency due.esrin.esa.int/globcover/ (GLC_2009)
based on MERIS 300m 2009
MODIS VCF Global Land Cover Facility - MODIS Vegetation Continuous Fields www.landcover.org/data/vcf/
based on MODIS 250m 2010
CROPLAND Hybrid database www.geo-wiki.org/ (CROPLAND) mixed resolution 2012
GLC2000
Join Research Centre - Global Land Cover of year 2000 bioval.jrc.ec.europa.eu/products/glc2000/
glc2000.php (for validation and comparison purposes only)
based on SPOT VEGETATION 1km
2000
Mangroves FAO – Global Database of Mangroves based on Landsat 30 m 2008
32
Cod
e
Datasets
(Arti
ficia
l Su
rface
s)
(Cro
pLan
d)
(Gra
ssla
nd)
(Tre
e C
over
ed
Area
s)
(Shr
ubs
Cov
ered
Are
a)
(Her
bace
ous
Vege
tatio
n.
etc)
(from
Glo
bal
Man
grov
e da
tase
t)
(Spa
rse
Vege
tatio
n)
(Bar
eSoi
l)
(Sno
w a
nd
Gla
cier
s)
(Wat
er
Bodi
es)
01
02 03 04 05 06 07 08 09 10 11
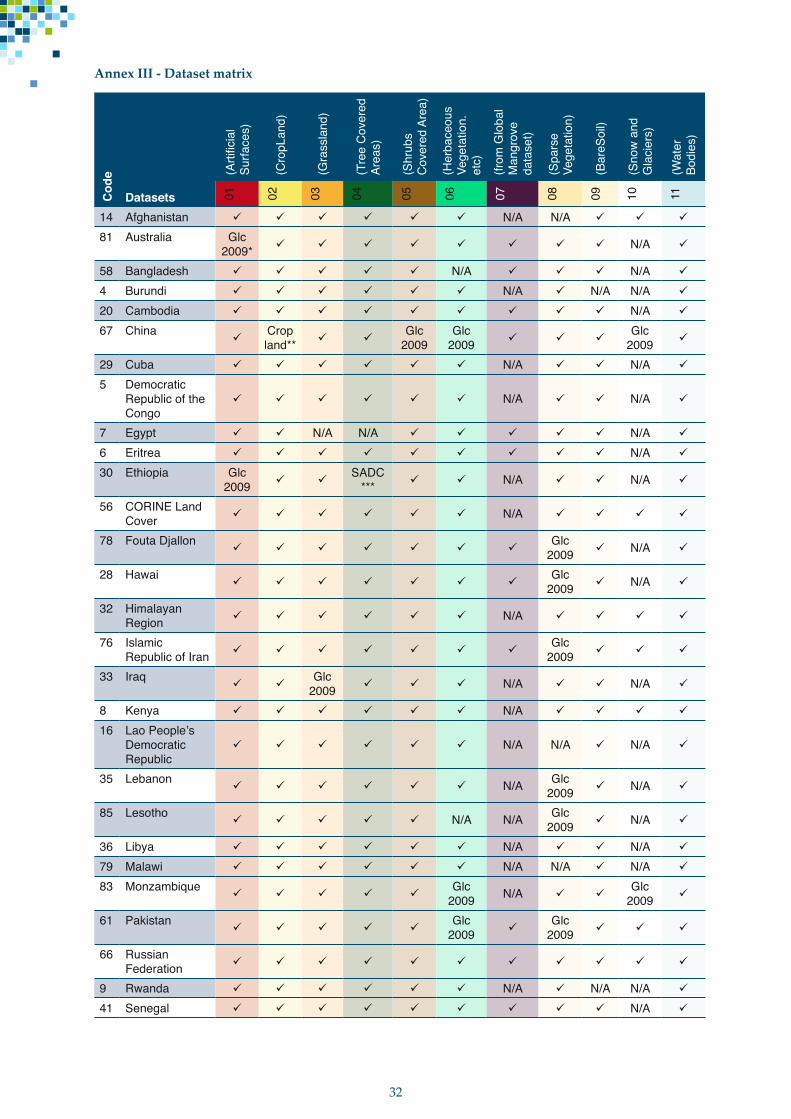
14 Afghanistan N/A N/A
81 Australia Glc 2009* N/A
58 Bangladesh N/A N/A
4 Burundi N/A N/A N/A
20 Cambodia N/A
67 China
Cropland**
Glc 2009
Glc 2009
Glc 2009
29 Cuba N/A N/A
5 Democratic Republic of the Congo
N/A N/A
7 Egypt N/A N/A N/A
6 Eritrea N/A
30 Ethiopia Glc 2009
SADC*** N/A N/A
56 CORINE Land Cover N/A
78 Fouta Djallon
Glc 2009 N/A
28 Hawai
Glc 2009 N/A
32 Himalayan Region N/A
76 Islamic Republic of Iran
Glc 2009
33 Iraq
Glc 2009 N/A N/A
8 Kenya N/A
16 Lao People’s Democratic Republic
N/A N/A N/A
35 Lebanon N/A Glc
2009 N/A
85 Lesotho N/A N/A Glc
2009 N/A
36 Libya N/A N/A
79 Malawi N/A N/A N/A
83 Monzambique
Glc 2009 N/A
Glc 2009
61 Pakistan
Glc 2009
Glc 2009
66 Russian Federation
9 Rwanda N/A N/A N/A
41 Senegal N/A
Annex III - Dataset matrix

33
Cod
e
Datasets
(Arti
ficia
l Su
rface
s)
(Cro
pLan
d)
(Gra
ssla
nd)
(Tre
e C
over
ed
Area
s)
(Shr
ubs
Cov
ered
Are
a)
(Her
bace
ous
Vege
tatio
n.
etc)
(from
Glo
bal
Man
grov
e da
tase
t)
(Spa
rse
Vege
tatio
n)
(Bar
eSoi
l)
(Sno
w a
nd
Gla
cier
s)
(Wat
er
Bodi
es)
01
02 03 04 05 06 07 08 09 10 11
10 Somalia N/A
84 South Africa N/A N/A N/A
89 Sudan
Glc 2009 N/A
90 South Sudan
Glc 2009 N/A N/A
87 Swaziland N/A N/A N/A N/A
12 United Republic of Tanzania N/A N/A
17 Thailand N/A N/A
43 Tunisia N/A N/A
13 Uganda N/A N/A N/A
62 Uruguay N/A N/A N/A Glc
2009 N/A
27 USA-Canada-Mexico
Glc 2009
44 Yemen N/A
82 Zambia N/A
86 Zimbabwe N/A N/A N/A
NOTE:* Globcover 2009 database** CROPLAND Hybrid database*** Southern African Development Community databaseClass 07 derived from Global Database of MangrovesN/A: not applicable

34
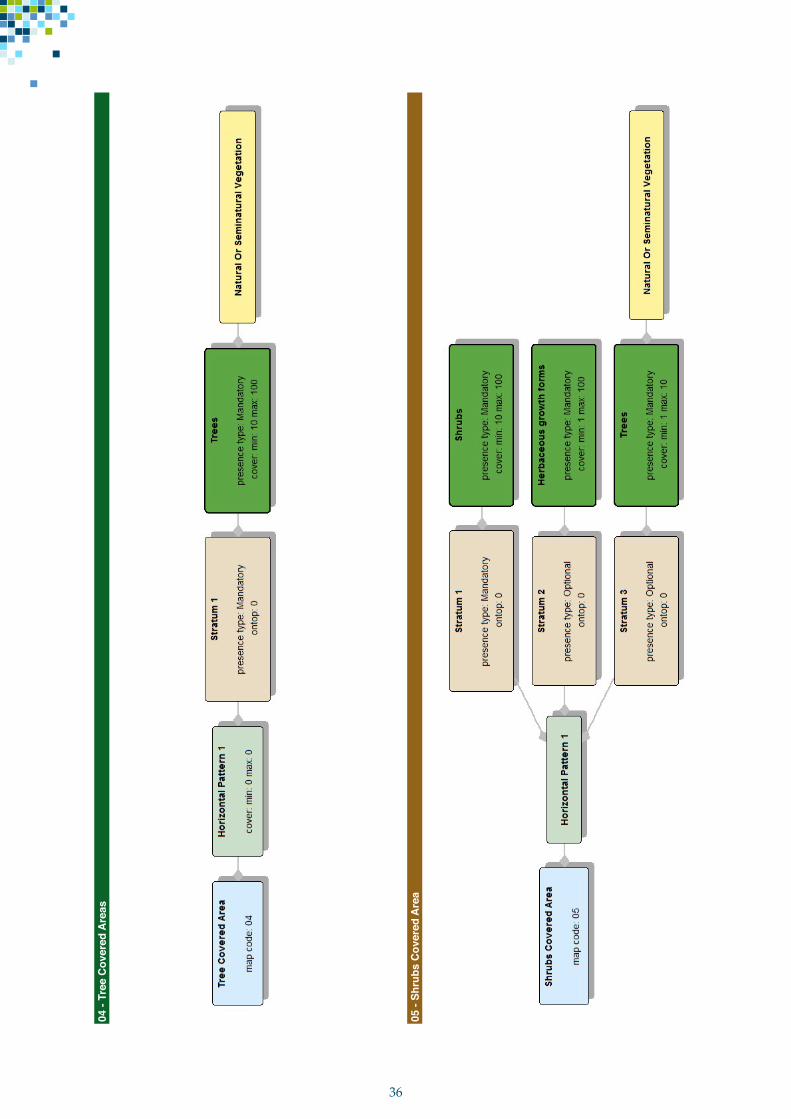
Annex IV - GLC-SHARE SEEA LCML Legend
01 -
Art
ifici
al S
urfa
ces

35
02 -
Cro
pLan
d
03 -
Gra
ssla
nd
36
04 -
Tree
Cov
ered
Are
as
05 -
Shru
bs C
over
ed A
rea

37
06 -
Her
bace
ous
Vege
tatio
n
07 -
Man
grov
es

38
08 -
Spar
se V
eget
atio
n
09 -
Bar
eSoi
l

39
10 -
Snow
and
Gla
cier
s
11 -
Wat
er b
odie
s
