fao investment centre · source of raw material for sugar production in ukraine – declined ... of...
TRANSCRIPT

Please address questions and comments to:Investment Centre DivisionFood and Agriculture Organization of the United Nations (FAO)Viale delle Terme di Caracalla – 00153 Rome, Italy [email protected]://www.fao.org/investment/en
Ukraine: Sugar sector reviewReport No. 9 - October 2013 I3
472E
/1/0
9.13
FAO Investment CentreCOUNTRy HIGHLIGHTS
Ukraine
Sugar sector review
Ukrain
e – Su
gar sector review
Rep
ort N
o. 9

FAO Investment Centre

Ukraine
Sugar sector review
Food and agricUltUre organization oF the United nationsrome, 2013
country highlightsprepared under the Fao/eBrd cooperation
Andriy Yarmak economist, investment centre division, Fao
Dmitry Prikhodko economist, investment centre division, Fao

The designations employed and the presentation of material in this information product do not imply the expression of any opinion whatsoever on the part of the Food and Agriculture Organization of the United Nations (FAO) or the European Bank for Reconstruction and Development (EBRD) concerning the legal or development status of any country, territory, city or area or of its author ties, or concerning the delimitation of ts frontiers or boundaries. The mention of specific companies or products of manufacturers, whether or not these have been patented, does not imply that these have been endorsed or recommended by FAO or the EBRD in preference to others of a similar nature that are not mentioned. The views expressed in this information product are those of the author(s) and do not necessarily reflect the views or policies of FAO or the EBRD.
© FAO 2013
FAO encourages the use, reproduction and dissemination of material in this information product. Except where otherwise indicated, material may be copied, downloaded and printed for private study, research and teaching purposes, or for use in non-commercial products or services, provided that appropriate acknowledgement of FAO as the source and copyright holder is given and that FAO’s endorsement of users’ views, products or services is not implied in any way.
All requests for translation and adaptation rights, and for resale and other commercial use rights should be made via www.fao.org/contact-us/licencerequest or addressed to [email protected].
FAO information products are available on the FAO website (www.fao org/publications) and can be purchased through [email protected]
For more information on this publication, please contact:DirectorInvestment Centre DivisionFood and Agriculture Organization of the United Nations (FAO)Viale delle Terme di Caracalla, 00153 Rome, Italy
Cover photo: © FAO/Dreamstime

TABLE OF CONTENTS
Foreword v
acknowledgements vii
acronyms and abbreviations viii
executive summary ix
1 introduction 1
2 sugar beet production 3
3 supply and demand balance of sugar 29
4 sugar beet processing 31
5 sugar consumption 46
6 exports and imports 50
7 sugar prices 54
8 Policy 61
annex 1 annual rankings of top sugar producers in Ukraine 68
annex 2 sugar factories by leading producers and geographical regions of Ukraine 73
annex 3 cost and revenues in sugar production from own, purchased,tollingbeetsandcanesugarrefining 87


v
FOREWORD
Despite a significant decrease in sugar production since Soviet times, Ukraine was still ranked the second largest sugar producer in Eastern Europe in 2011 after the Russian Federation, and ahead of Poland, the Czech Republic and Hungary. Ukraine is also a net exporter of sugar and sugar-containing confectionary products. The domestic sugar industry provides an important contribution to employment and value added in the agrifood sector.
Joint FAO and European Bank for Reconstruction and Development (EBRD) sector reviews help policy-makers and investors make informed decisions for more efficient and inclusive agrifood systems. This sugar sector review provides background information on sugar production, consumption and trade in Ukraine. It also discusses the competition between sugar beet and other crops and the profitability of sugar production. It provides a comparison of domestic and international sugar prices at various parity levels, identifies main producers and types of consumers, and discusses support and trade measures to inform interested policy-makers and investors.
It is the second report in a series of three sugar sector reviews carried out by FAO’s Investment Centre Division with the support of FAO’s Trade and Markets Division under the FAO/EBRD Cooperation. The two other studies, covering Serbia and the Russian Federation, are available in the Country Highlights Report Series area of the Investment Centre Division website.1
Readers interested in mid-term prospects for the world sugar market are invited to consult the latest Agricultural Outlook jointly produced by FAO and the Organisation for Economic Co-operation
1 For more information, see: www.fao.org/investment/tci-publications/country-highlights/en/.

vi
and Development (OECD)2 The Serbia sugar sector review3 also provides useful insights into the development of the world and European Union sugar markets and prices.
2 For more information, see: www.oecd.org/site/oecd-faoagriculturaloutlook/.3 For more information, see: www.fao.org/docrep/017/i3203e/i3203e.pdf.
David Hallam DirectorTrade and Markets Division, FAO
Gustavo MerinoDirectorInvestment Centre Division, FAO
Gilles MettetalDirectorAgribusiness, EBRD
vii
ACKNOWLEDGEMENTS
This study was co-financed by FAO and EBRD’s Shareholder Special Fund. The team of authors worked under the overall guidance of Miljan Zdrale, Senior Banker, Agribusiness Team, EBRD, and Dmitry Prikhodko, Economist, Investment Centre Division, FAO.
The main author of the report is Andriy Yarmak, Economist, Investment Centre Division, FAO. He conducted his research in close coordination with the Agriculture Analytic Agency (AAA), Ukraine. LMC International, United Kingdom, provided useful benchmarking of Ukraine’s sugar beet field and factory performance as compared with that of Central Europe, the Great Lakes region of the United States and the Russian Federation. Dmitry Prikhodko contributed to the Executive Summary, as well as sections on the importance of the sugar industry in Ukraine, sugar consumption and policy. He also led the peer review process prior to publication of the study.
The report benefited from useful comments and suggestions from Suhrid Patel, Research Economist, and Martin Todd, Managing Director, both from LMC International; Lesya Kuzmenko, Senior Banker, Agribusiness, EBRD; and El Mamoun Amrouk, Economist, Trade and Markets Division, FAO.
The authors would like to thank Claudio Gregorio, Chief, Europe, Central Asia, Near East, North Africa, Latin America and Caribbean Service, Investment Centre Division, FAO, and Emmanuel Hidier, Senior Economist, Investment Centre Division, FAO for their overall support and guidance.
viii
ACRONYMS AND ABBREVIATIONS
AAA Agriculture Analytic AgencyCIS Commonwealth of Independent StatesCMU Cabinet of Ministers of UkraineEBITDA Earnings Before Interest, Taxes, Depreciation and AmortizationEBRD European Bank for Reconstruction and DevelopmentEU European UnionFAO Food and Agriculture Organization of the United NationsFSU Former Soviet UnionGDP Gross domestic productGDR Global depository receiptIPO Initial public offeringNPC Nominal protection coefficientOECD Organisation for Economic Co-operation and DevelopmentPP Private placementSCT Specific commodity transfersTRQ Tariff-rate quotaUAH Ukrainian hryvnia VAT Value added taxVHP Very high polarizationWHO World Health OrganizationWSE Warsaw Stock ExchangeWTO World Trade Organization

Ukraine - Sugar sector review
ix
EXECUTIVE SUMMARY
Production
The Ukrainian sugar industry contributes about 1.2 percent to national Gross Domestic Product (GDP) with 2010 revenues estimated at about USD 1.67 billion. While the area under sugar beets – the main source of raw material for sugar production in Ukraine – declined from 1.6 million hectares in the 1990s to about 600 000 hectares in 2010, sugar beet yields have been increasing since 1999 thanks to improved access to capital, the introduction of hybrid seeds, improved application of fertilizer and crop protection chemicals. Ukrainian farmers obtain higher sugar beet yields today than during the Soviet era.
Sugar beet production has also been consolidating and the average size of sugar beet-growing farms has increased. The share of rural households4 in total sugar beet production has declined dramatically – from 15 percent in 2006 to 8 percent in 2010.
After a sharp drop in the early 1990s, average sugar production in Ukraine stabilized at about 1.8 million tonnes per year in recent years and equaled estimated domestic demand. The process of vertical integration, which began in the Ukrainian sugar industry in 2002–2004, has enabled improvement in sugar beet supply for processing and increased profitability with sugar production as the principal profit centre. As the sector continued its transition following the loss of its traditional export market, the Former Soviet Union (FSU), the number of sugar factories decreased from 192 in 1990 to 73 in 2010. The owners of sugar factories now placed more emphasis on increasing existing capacity utilization and improving efficiency rather than maintaining all factories in operation.
While industry consolidation is ongoing, it is very likely that new players will enter the market. In 2011, the Ukrlandfarming company, a new entrant to the sugar business, bought two large sugar holdings (Rise and Dakor), and became one of the top sugar
4 The term “households” in this report refers to a small plot of land (typically fewer than 0.5 hectares) attached to a rural residence in Ukraine.

x
market players in Ukraine. Other market leaders also continued to expand their land banks to grow sugar beets and other crops, and upgrade their sugar plants.
Consumption
Sugar plays an important role as a source of food calories in Ukraine. Average per capita consumption of sugar and sweeteners was about 48 kilograms per year, of which 41 kilograms were sugar, compared to 46 kilograms in Germany and 67 kilograms in the United States (FAOStat, 2009). After a sharp decrease in sugar consumption in the early 1990s, it bottomed out in 1999 at about 37 kilograms per capita per year and then began to increase once more. The contribution of sugar to Ukraine’s total estimated food calorie supply of 3 200 Kcal per day per person was 13 percent in 2009. Sugar can therefore be considered the second most important source of calories after wheat (26 percent) for an average Ukrainian. It outpaces the supply of calories from vegetable oils (11 percent), potatoes (8 percent) and many other products. This largely explains why sugar receives such attention from policy-makers. At the same time, the 2002 Joint World Health Organization (WHO)/FAO Expert Consultation recommendations suggested that the consumption target of free sugars (all monosaccharides and disaccharides added to foods by the manufacturer, cook or consumer, plus sugars naturally present in honey, syrups and fruit juices) should amount to less than 10 percent of the population’s total energy intake.5 While the production of sugar and sugar beets has been a profitable business in recent years, high sugar prices and changing consumer preferences will affect domestic sugar demand in the future. The food processing industry (mostly soft drinks and confectionary producers) is expected to use more sugar, while direct human consumption of sugar will likely decrease, reflecting changing lifestyles.
Trade
In the mid-1990s, Ukraine was still exporting about 1.5 million tonnes of refined beet sugar to neighbouring countries. However, the exclusion of sugar from the free trade agreement with the Russian Federation and import protectionism in other traditional trading partner countries have negatively affected Ukraine’s sugar
5 The Joint WHO/FAO Expert Consultation on diet, nutr tion and the prevention of chronic diseases: process, product and policy implications (www.who.int/nutrition/publications/public_health_nut9.pdf).

Ukraine - Sugar sector review
xi
exports. Ukraine may still act as an occasional exporter depending on its domestic supply and export market demand in a given year. For instance, Ukraine turned into a net white sugar exporter in the 2011/12 marketing year (September 2011–August 2012), with a net trade balance of 150 000 tonnes, while the country was a net importer of sugar for the previous three marketing years.
Ukraine remains by far a net exporter of sugar, if sugar confectionary is taken into account. Its positive trade balance in the category of sugar and sugar-containing products, including cocoa-based products, averaged USD 400 million in 2006–2010 and reached USD 460 million during the 2010/11 season. Therefore, demand for sugar in Ukraine will largely depend on whether the Ukrainian sugar industry will be able to maintain and expand these export markets.
Policy and implications
As is the case with many countries in the world, Ukraine’s sugar sector is heavily protected and regulated. There is a domestic sugar production quota of 1.7–1.8 million tonnes per year in place to balance supply and demand. However, this quota does not seem to be strongly enforced in a good sugar beet harvest and sugar production year. Ukraine does not limit sugar exports, although the Cabinet of Ministers of Ukraine (CMU) has the authority to limit sugar exports in the event of domestic food security concerns.
Imports of white sugar are subject to a 50 percent import duty and imports of raw cane sugar are regulated through a tariff-rate quota (TRQ) system negotiated at the time of Ukraine’s accession to the World Trade Organization (WTO). Imports of raw cane sugar within the TRQ are subject to a 2 percent import duty. In 2010, the quota was set at 267 800 tonnes; however, only about 80 percent of the quota was actually utilized.
As a result of the TRQ and other policy measures, such as minimum administered wholesale prices, sugar producers in Ukraine have received considerable market price support. The annual monetary value of transfers from Ukrainian consumers and taxpayers to sugar producers (due to the combination of all policies creating a gap between domestic producer prices and reference prices) totalled Ukrainian hryvnia (UAH) 4 billion in 2010 (approximately USD 500 million).

xii
Sugar prices paid to domestic producers have been about 30 percent higher than international reference prices, reflecting parity at the farm level according to OECD data. Domestic producers would find it extremely difficult to compete with imported raw cane sugar without the TRQ and high import tariffs. However, as indicated in Chapter 7, import parity prices may fluctuate considerably from one marketing year to another. Therefore, the efforts of policy-makers to secure the already significantly diminished domestic sugar production are understandable, considering the importance of sugar in Ukraine.
Main industry risks
Ukraine’s sugar industry is subject to various risks, including policy changes, international price fluctuations, competition risks related to the development of sugar substitutes, loss of markets for sugar confectionary and so forth. As Ukrainian sugar factories are dependent on the price of imported gas, a sharp price increase or interruption of gas supply also represents a major production risk.
Policy changes in Ukraine represent a broad risk category, although these risks are substantially lower now compared to what they were prior to Ukraine’s accession to the WTO in 2008. However, investors should still be aware of frequent regulatory changes, such as those related to domestic sugar prices, since sugar remains a “sensitive” food product, especially for local authorities.
Another risk is the lack of enforcement of regulations in the domestic market. Most countries to which Ukraine can potentially export sugar also apply a number of tariff and non-tariff barriers to trade. Therefore, the possible overproduction of sugar in a good year can result in lower prices and margins to producers, as the mechanisms of domestic sugar production quota allocation and the administration of minimum prices are not enforced. The Ukrainian government also often lacks funding to conduct sizable intervention purchases.
International sugar prices represent a major uncertainty and recently have been very volatile. If the global trend for greater bio-energy use changes or global mineral oil prices decline, international sugar prices could decrease to a level that would make imports of raw cane sugar possible, even with the 50 percent ad valorem import tariff outside of the TRQ. However, this scenario is very unlikely.

Ukraine - Sugar sector review
xiii
As the size of the domestic market is limited, there may be increased competition arising from sweeteners produced from maize, as these might substitute for sugar in the confectionary and food processing industries in Ukraine over the long term.
Opportunities
Major investment opportunities exist in the improvement of sugar beet production efficiency, as the benchmarking of sugar beet production and processing performance conducted in this review clearly shows. First of all, opportunities exist in increasing sugar beet yields and sucrose content. Average sugar beet yields in Ukraine from 2009–2011 were only 32 tonnes per hectare as compared with 53 tonnes per hectare in Poland, 57 in Hungary and 65 in Germany.
Further opportunities exist in improving sugar recovery rates, increasing the duration of factory operation per year and improving energy efficiency. As already seen with some EBRD clients, the introduction of improved boilers for steam generation at an average factory in Ukraine (2 500-4 000 tonnes of sugar beet per day) requires investment of about EUR 10 million. Such investment can be expected to pay for itself in only two to three years due to lower energy cost and higher efficiency and results in a circa 25 percent reduction in CO2 emission (equivalent to about 50 000 tonnes/year).


Ukraine - Sugar sector review
1
Chapter 1 - Introduction
The importance of the sugar industry in Ukraine
Sugar is seen as a “strategic” agrifood product in Ukraine owing to its importance in local diets and the historical importance of the sugar industry. The sugar industry of Ukraine comprises more than 150 sugar plants of which 70–80 produce sugar every year. In 2010, the industry generated total revenues of about USD 1.67 billion, equivalent to 1.2 percent of the country’s total gross domestic product (GDP) and about 6.8 percent of the overall food industry’s gross value added.
The sugar industry is also critically important for Ukraine’s developed confectionary industry, which is a major net exporter of value added products. The output of the Ukrainian confectionary industry in 2010 totalled USD 4.1 billion, equal to about 17 percent of the food industry’s gross value added or 3 percent of the national GDP.
The sugar industry mostly processes locally grown sugar beets, which provide revenues of about USD 0.8 billion to approximately 2 000 agricultural producers (i.e. about USD 400 000 per farm). This is equivalent to about 7 percent of Ukraine’s total agricultural value added.
Finally, the sugar industry of Ukraine is also an important employer, providing income to around 300 000 people (about 40 000–50 000 jobs in sugar production and 250 000 in primary production of sugar beets). An estimated 16 000–20 000 rural households also obtain additional income from growing sugar beets.
Despite the importance of the industry for the overall economy, the importance of sugar beet production for farmers has decreased, as they have begun to switch to other more profitable crops, such as maize, sunflower seeds, soybeans and rapeseeds. The share of sugar beets in total area planted in Ukraine therefore declined from 5 percent in 1990 to 2 percent in 2010 (see Figure 1).

Figure 1: Area planted in Ukraine by crop in 1990, 2000 and 2010, %
Source: State Statistics Service of Ukraine.
2
Globally, Ukraine accounts for about 5 percent of sugar production from sugar beets and about 0.9 percent of the global production of sugar, which is predominantly based on sugar cane. Ukraine is not a very significant participant in the global sugar trade market compared to its former position immediately following the break up of the Soviet Union, when it was still supplying sugar to the Russian Federation. In 2010, Ukraine ranked 61st in terms of global white sugar exports, 48th in terms of white sugar imports, and 22nd in raw cane sugar imports.
0%
10%
20%
30%
40%
50%
60%
70%
80%
90%
100%
1990 2000 2010
Other crops Area of pure fallow Potatoes Rape seed Soya
Sunflower Sugar beet (factory) Maize for grain Winter wheat
23% 20% 23%
4%5%
10%5%3%
2%5% 11%
17%
0%0%
4%
0%1%
3%
4%6%
5%
4%
12%
5%
53%43%
30%

Ukraine - Sugar sector review
3
Chapter 2 - Sugar beet production
Climate and field performance of the Ukrainian sugar industry
To provide a context for the evolution of the Ukrainian sugar industry, notably the recent improvements in the farming sector, this section benchmarks the industry’s technical performance against a number of other beet sugar industries.
Russian Federation
Ukraine borders the Russian Federation’s central beet-growing region. Apart from the industries’ shared history as part of the Former Soviet Union (FSU), the Russian Federation’s largest beet-growing region provides a useful comparison, as its geographical proximity means that agro-climatic conditions are broadly similar. However, it is important to note that temperatures during the beet-growing season are hotter in Ukraine, while rainfall is similarly low.
European Union
As home to one of the world’s leading beet industries, the European Union (EU) constitutes an important benchmark against which Ukrainian performance can be judged. As well as presenting the performance of the EU-27 as a whole, this section highlights the performance of the Central European industries, namely Slovakia and Poland, as these countries share agro-climatic conditions closer to that of Ukraine than the leading EU industries of northwest Europe.
Great Lakes
The Great Lakes region of the United States is also a useful benchmark. Although rainfall is significantly higher, temperatures are similar to those in Ukraine. This is especially important for the winter period, as the sugar industry in Michigan makes good use of local conditions by operating longer processing seasons.
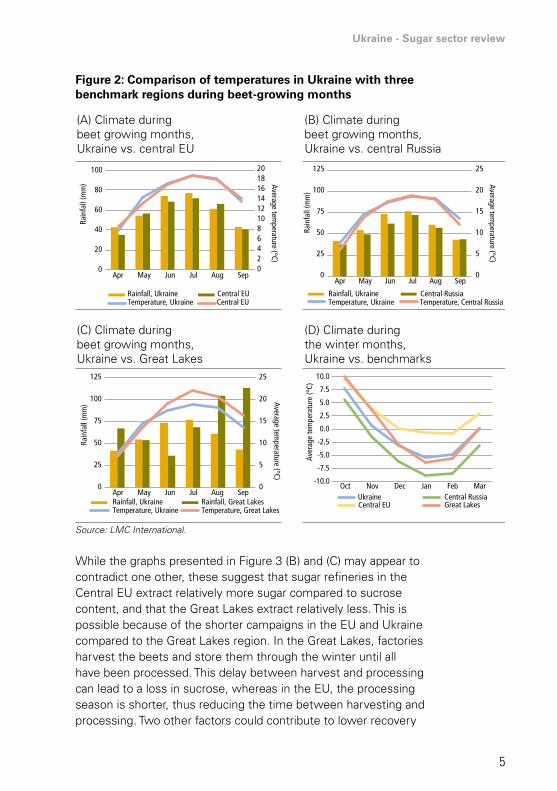
Figure 2 (A–C) presents comparisons between the climate in Ukraine and these benchmark production regions, in particular the average temperature and rainfall during the growing season in Ukraine and each benchmark. Figure 2 (D) compares winter temperatures in Ukraine with the three benchmark regions.
The actual performance of the Ukrainian sugar beet industry can be compared with other producers in terms of sugar beet
4
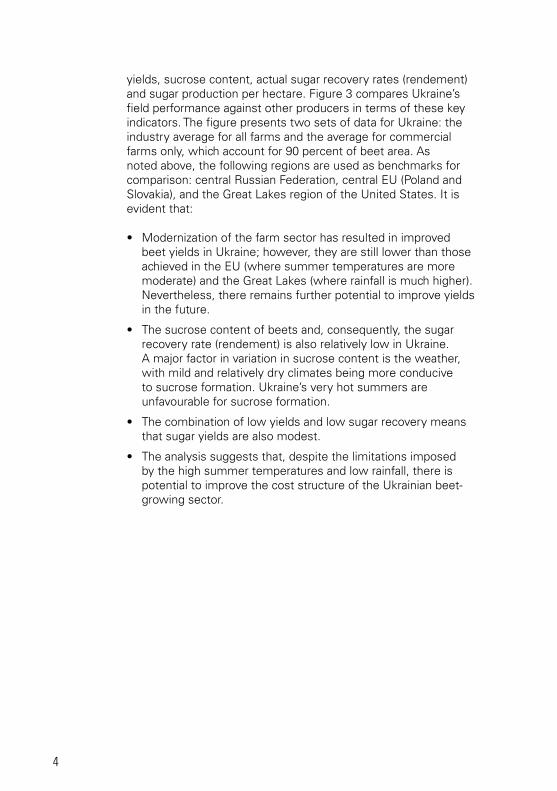
yields, sucrose content, actual sugar recovery rates (rendement) and sugar production per hectare. Figure 3 compares Ukraine’s field performance against other producers in terms of these key indicators. The figure presents two sets of data for Ukraine: the industry average for all farms and the average for commercial farms only, which account for 90 percent of beet area. As noted above, the following regions are used as benchmarks for comparison: central Russian Federation, central EU (Poland and Slovakia), and the Great Lakes region of the United States. It is evident that:
• Modernization of the farm sector has resulted in improved beet yields in Ukraine; however, they are still lower than those achieved in the EU (where summer temperatures are more moderate) and the Great Lakes (where rainfall is much higher). Nevertheless, there remains further potential to improve yields in the future.
• The sucrose content of beets and, consequently, the sugar recovery rate (rendement) is also relatively low in Ukraine. A major factor in variation in sucrose content is the weather, with mild and relatively dry climates being more conducive to sucrose formation. Ukraine’s very hot summers are unfavourable for sucrose formation.
• The combination of low yields and low sugar recovery means that sugar yields are also modest.
• The analysis suggests that, despite the limitations imposed by the high summer temperatures and low rainfall, there is potential to improve the cost structure of the Ukrainian beet-growing sector.
Ukraine - Sugar sector review
5
Figure 2: Comparison of temperatures in Ukraine with three benchmark regions during beet-growing months
Source: LMC International.
While the graphs presented in Figure 3 (B) and (C) may appear to contradict one other, these suggest that sugar refineries in the Central EU extract relatively more sugar compared to sucrose content, and that the Great Lakes extract relatively less. This is possible because of the shorter campaigns in the EU and Ukraine compared to the Great Lakes region. In the Great Lakes, factories harvest the beets and store them through the winter until all have been processed. This delay between harvest and processing can lead to a loss in sucrose, whereas in the EU, the processing season is shorter, thus reducing the time between harvesting and processing. Two other factors could contribute to lower recovery
Rainfall, Ukraine
25
20
15
10
5
0
125
10.0
7.5
5.0
2.5
0.0
-2.5
-5.0
-7.5
-10.0
20181614121086420
100
100
80
60
40
20
0
75
50
25
0
Rain
fall
(mm
)Ra
infa
ll (m
m)
Rain
fall
(mm
)
Average temperature (°C)
Average temperature (°C)
Aver
age
tem
pera
ture
(°C)
Average temperature (°C)
Central Russia
Central Russia
Temperature, Ukraine Temperature, Central Russia Rainfall, Ukraine Central EU
Central EU
Temperature, Ukraine Central EU
Rainfall, UkraineUkraine
Temperature, UkraineRainfall, Great Lakes Great LakesTemperature, Great Lakes
Apr May Jun Jul Aug SepApr May Jun Jul Aug Sep
AprOct Nov Dec Jan Feb Mar
May Jun Jul Aug Sep
(A) Climate during beet growing months, Ukraine vs. central EU
(B) Climate during beet growing months, Ukraine vs. central Russia
(C) Climate during beet growing months, Ukraine vs. Great Lakes
(D) Climate during the winter months, Ukraine vs. benchmarks
25
20
15
10
5
0
125
100
75
50
25
0
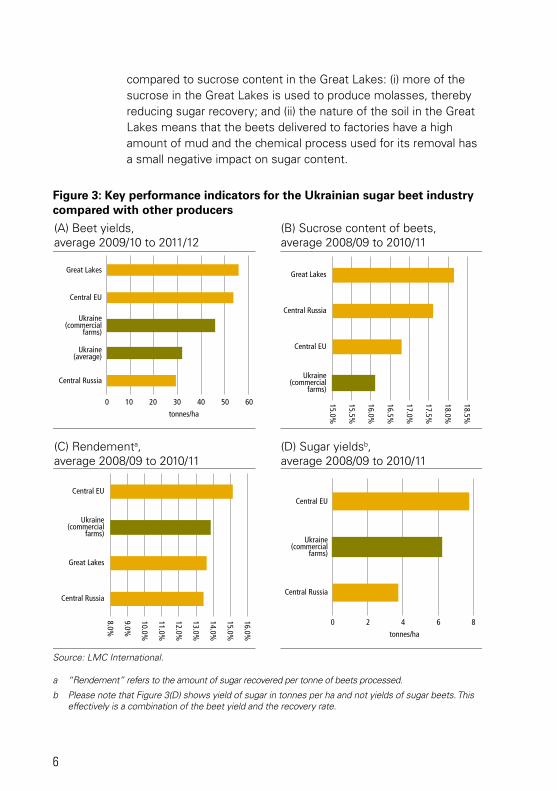
Figure 3: Key performance indicators for the Ukrainian sugar beet industry compared with other producers
Source: LMC International.
a “Rendement” refers to the amount of sugar recovered per tonne of beets processed.
b Please note that Figure 3(D) shows yield of sugar in tonnes per ha and not yields of sugar beets. This effectively is a combination of the beet yield and the recovery rate.
6
compared to sucrose content in the Great Lakes: (i) more of the sucrose in the Great Lakes is used to produce molasses, thereby reducing sugar recovery; and (ii) the nature of the soil in the Great Lakes means that the beets delivered to factories have a high amount of mud and the chemical process used for its removal has a small negative impact on sugar content.
0 10 20 30 40 50 60
Central Russia
Ukraine(average)
Ukraine(commercial
farms)
Central EU
Great Lakes
tonnes/ha
tonnes/ha
15.0%
15.5%
16.0%
16.5%
17.0%
17.5%
18.0%
18.5%
Ukraine(commercial
farms)
Central EU
Central Russia
Great Lakes
8.0%
9.0%
10.0%
11.0%
12.0%
13.0%
14.0%
15.0%
16.0%
Central Russia
Great Lakes
Ukraine(commercial
farms)
Central EU
0 2 4 6 8
Central Russia
Ukraine(commercial
farms)
Central EU
(A) Beet yields, average 2009/10 to 2011/12
(B) Sucrose content of beets,average 2008/09 to 2010/11
(C) Rendementa, average 2008/09 to 2010/11
(D) Sugar yieldsb, average 2008/09 to 2010/11

Ukraine - Sugar sector review
7
Sugar beet production
Sugar beet production in Ukraine decreased by about 70 percent after 1990 with the loss of markets in FSU countries. After the breakup of the Soviet Union, and until 1995–1996, Ukraine continued to export large volumes of white sugar to countries that formed part of the Commonwealth of Independent States (CIS) (Armenia, Azerbaijan, Georgia, Kazakhstan, Moldova), and even to Afghanistan, Slovakia and Turkey; however, farmer (still de-facto kolkhozes6 at that time) incomes from sugar beets were lower compared with other alternative crops. At the same time, capital demands to produce sugar beets were significantly higher compared with cereals and oilseeds. At the time of transition from the centrally planned economy, rapid liberalization of fuel, fertilizer and other agricultural inputs prices, as well as decreasing state support, meant that farmers often did not have sufficient capital to invest in sugar beet production.
With the break up of kolkhozes in 1995–1997, farms started paying particular attention to their costs and revenues, and moved away from sugar beet production. Massive imports of cane sugar at reduced import duty rates, which followed the sugar market transition, also affected the industry and domestic sugar beet production continued its downward trend. In 2000, production was less than 30 percent of that achieved in 1990, although the planted area declined by only 47 percent. Thus, productivity was also extremely low as farms made little use of fertilizers and crop protection means. Most farmers at the time also tried to sell sugar beets via tolling dealings to sugar factories and then sell the sugar for cash through unorganized open-air markets.
In 2002–2004, the situation started to improve gradually thanks to the unified agricultural tax. Agroholdings and vertically integrated companies also started developing business models for sugar. Farmers were once again able to buy good quality seeds, fertilizers
6 Kolkhozes were a form of collective farm in the Soviet Union. As a collective farm, a kolkhoz was legally organized as a production cooperative. The Standard Charter of a kolkhoz, which since the early 1930s had the force of law in the USSR, is a model of cooperative principles in print. It speaks of the kolkhoz as a “form of agricultural production cooperative of peasants that voluntarily unite for the purpose of joint agricultural production based on ... collective labour.” In reality the efficiency of kolkhozes was very low.
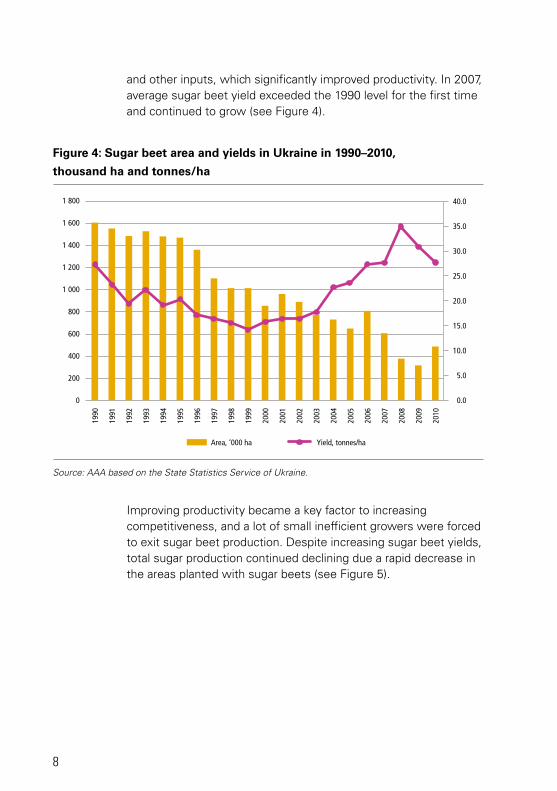
Figure 4: Sugar beet area and yields in Ukraine in 1990–2010,
thousand ha and tonnes/ha
Source: AAA based on the State Statistics Service of Ukraine.
8
and other inputs, which significantly improved productivity. In 2007, average sugar beet yield exceeded the 1990 level for the first time and continued to grow (see Figure 4).
Improving productivity became a key factor to increasing competitiveness, and a lot of small inefficient growers were forced to exit sugar beet production. Despite increasing sugar beet yields, total sugar production continued declining due a rapid decrease in the areas planted with sugar beets (see Figure 5).
1 800
1 600
1 400
1 200
1 000
800
600
400
200
0
40.0
35.0
30.0
25.0
20.0
15.0
10.0
5.0
0.0
1990
1991
1992
1993
1994
1995
1996
1997
1998
1999
2000
2001
2002
2003
2004
2005
2006
2007
2008
2009
2010
Area, ‘000 ha Yield, tonnes/ha

Ukraine - Sugar sector review
9
Figure 5: Sugar beet production and yields in Ukraine in 1990–2010, thousand ha ha and tonnes/ha
Source: AAA based on the State Statistics Service of Ukraine.
The increase in global sugar prices, which bottomed out in January 2004 at about USD 140 per tonne and then began to rise, reaching USD 650 per tonne in January 2011, provided renewed support to the sugar industry in Ukraine. As a result, the area planted with sugar beets in 2010 increased for the first time in many years. However, due to harsh weather conditions in the same year, productivity was much lower than initially expected and increases in sugar production were insignificant.
Despite the difficult climatic conditions, the average yields of sugar beets in 2010 were higher than in 1990.7 This suggests a significant and rapid improvement in production technologies within the previous five years.
7 According to the Hydometeriological Centre of Ukraine, 2010 was unmatchable in terms of climatic extremes. Many regions of Ukraine were flooded due to abundant rains in May–June and then temperatures rose sharply to record high levels and stayed there for nearly two months w thout any prec p tation.
50 000
45 000
40 000
35 000
30 000
25 000
20 000
15 000
10 000
5 000
0
40.0
35.0
30.0
25.0
20.0
15.0
10.0
5.0
0.0
1990
1991
1992
1993
1994
1995
1996
1997
1998
1999
2000
2001
2002
2003
2004
2005
2006
2007
2008
2009
2010
Production, ‘000 tonnes Yield, tonnes/ha

10
Figure 6: Map of regional concentration of sugar beet production in Ukraine
Source: AAA.
Analysis of sugar beet yields in 2006–2010 compared with previous years shows an impressive increase of 56 percent compared to the 2001–2005 average, and an increase of 88 percent compared to the 1996–2000 average (see Table 1).
Regional concentration of sugar beet productionProduction of sugar beets is concentrated in the central part of Ukraine in regions where soil, moisture and temperature are well balanced to achieve optimal yields and sucrose content. It is also driven by the concentration of sugar beet-processing factories in the same region.
Table 1: Average sugar beet yield evolution in Ukraine in the past 20 years, tonnes/ha
1991-1995 1991-1995 1991-1995 1991-1995
20.7 15.6 18.8 29.3
change -25% 20% 56%
Source: AAA based on the State Statistics Service of Ukraine.
BLACK SEA
SEA OF AZOV
MOLDAVIA
RUSSIA
BELARUS
POLAND
ROMANIA
> 2 mn t
1 - 2 mn t
0,4 - 1 mn t
Less than 0,4 mn t
No production
HU
NG
ARY
SLO
VAKI
A

Ukraine - Sugar sector review
11
Two leading sugar beet-producing regions (Vinnytska and Poltavska oblasts) account for about one-third of total production and produce more than two million tonnes of sugar beets per year on average. The top five producers (Vinnytska, Poltavska, Kyivska, Khmelnytska and Ternopilska oblasts, each producing more than one million tonnes of sugar beets per year on average), account for 61 percent of the total sugar beet output in Ukraine (see Figure 7).
Figure 7: Regional sugar beet production in Ukraine, %
Lvivska 4%
Others 13%
Rivneska 7%
Vinnytska 17%
Poltavska 16%
Khmelnytska 9%Kyivska 8%
Cherkaska 7%
Ternopilska 11%
Kirovohradska 3%
Kharkivska 5%
Source: AAA based on the State Statistics Service of Ukraine.
The southern and eastern regions of Ukraine grow no or very gew sugar beets. Production is also relatively low in the northern regions of the country. It is notable that the regions where sugar industry of Ukraine originated (Sumska and Chernihivska oblasts) rank only 13th and 14th today among the producing regions accounting jointly for only 5 percent of total production (see Figure 8).

12
It is also interesting to note that while, according to official statistics, highest yields are obtained in the western regions of Ukraine (Lvivska, Rivnenska, Ternopilska and Khmelnitska oblsts), these account for a relatively small share of sugar beet production in the country. This can be explained by the fact that agricultural holdings, which control most of the sugar beet-processing factories, have historically acquired land of higher value while land in the northern and western regions of the country has always been viewed as least productive (due to relatively poor soils and smaller size of fields as compared with central, eastern and southern Ukraine).
The average yield of sugar beets in the Vinnytsyka region (leading beet producer) is only 6 percent lower than in the regions with the highest average yield in Ukraine, and is 7 percent higher than the country average yield (see Figure 8). While agriholdings involved in sugar production built their land areas (or so-called “land banks”) around the existing relatively efficient sugar factories, it is doubtful that large-scale beet production will move towards the regions of Ukraine that have higher yields in the foreseeable future.
Figure 8: Ukrainian regions with highest sugar beet yields and their total sugar beet production, tonnes/ha and thousand tonnes
2 500
2 000
1 500
1 000
500
−
38.0
36.0
34.0
32.0
30.0
28.0
26.0
24.0
Lvivsk
a
Rivnesk
a
Cherni
hivska
Vinnyts
ka
Polta
vska
Khmeln
ytska
Kyivska
Zhyto
myrska
Sumska
Volymska
Cherka
ska
Terno
pilska
Kirovo
hrads
ka
Kharki
vska
Country average yield, tonnes/ha
Production Yield
Source: AAA based on the State Statistics Service of Ukraine.
Ukraine - Sugar sector review
13
Sucrose content
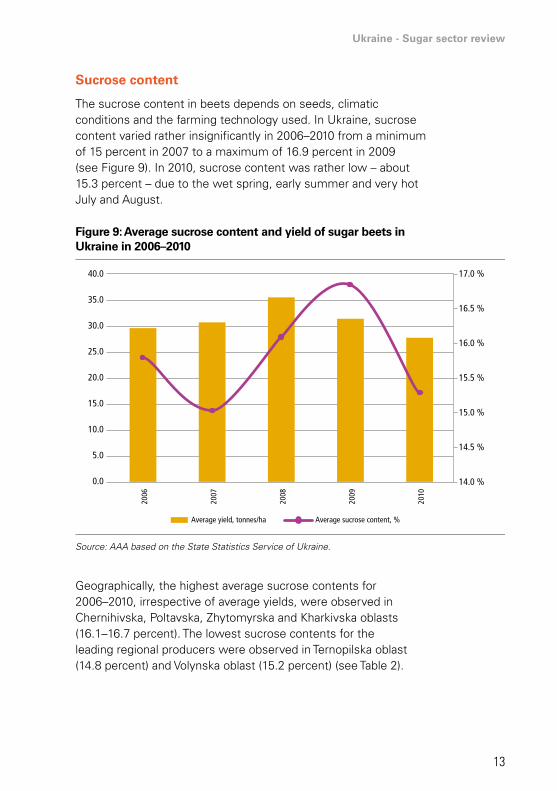
The sucrose content in beets depends on seeds, climatic conditions and the farming technology used. In Ukraine, sucrose content varied rather insignificantly in 2006–2010 from a minimum of 15 percent in 2007 to a maximum of 16.9 percent in 2009 (see Figure 9). In 2010, sucrose content was rather low – about 15.3 percent – due to the wet spring, early summer and very hot July and August.
Figure 9: Average sucrose content and yield of sugar beets in Ukraine in 2006–2010
2006
2007
2008
2009
2010
Average yield, tonnes/ha Average sucrose content, %
17.0 %40.0
35.0
30.0
25.0
20.0
15.0
10.0
5.0
0.0
16.5 %
16.0 %
15.5 %
15.0 %
14.5 %
14.0 %
Source: AAA based on the State Statistics Service of Ukraine.
Geographically, the highest average sucrose contents for 2006–2010, irrespective of average yields, were observed in Chernihivska, Poltavska, Zhytomyrska and Kharkivska oblasts (16.1–16.7 percent). The lowest sucrose contents for the leading regional producers were observed in Ternopilska oblast (14.8 percent) and Volynska oblast (15.2 percent) (see Table 2).

14
Sucrose content also tends to be higher at farms that invest in modern growing technologies. Therefore, larger farms controlled by agricultural holdings, as well as mid-size specialized farms (200�400 ha under sugar beets) usually have the best results in terms of sucrose content and sucrose yield per hectare.
Characteristics of sugar beet producers in Ukraine
Agricultural enterprises (commercial farms) of various legal forms account for 90–92 percent of sugar beet production in Ukraine. The remaining 8–10 percent of sugar beets are grown by so-called household farmers,8 or rural households, which produce
8 This figure includes peasants, who grow beets on their household plots or on land received during the collective farm privatization process. The average size of an agricultural land plot in Ukraine received during privatization is about 3.4 ha and varies greatly, depending on the region. Members of a family could combine their land plots and farm together without the need to register as a legal entity.
Table 2: Sucrose content and yield per ha by leading regional producers of sugar beets in Ukraine
regions sucrose,% Yield, tonnes/ha sucrose Yield, tonnes/ha
Ukraine 15.7 32.3 5.06
Chernihivska 16.7 34.9 5.83
Lvivska 15.5 36.6 5.83
Rivnenska 15.5 35.5 5.51
Poltavska 16.5 33.2 5.49
Vinnytska 15.5 34.5 5.33
Zhytomyrska 16.2 32.0 5.19
Khmelnytska 15.8 32.8 5.18
Kyivska 15.8 32.6 5.17
Volynska 15.2 31.5 4.78
Cherkaska 15.3 30.9 4.72
Ternopilska 14.8 30.9 4.56
Kirovohradska 15.9 28.4 4.53
Kharkivska 16.1 25.2 4.05
Source: AAA based on industry data.
Ukraine - Sugar sector review
15
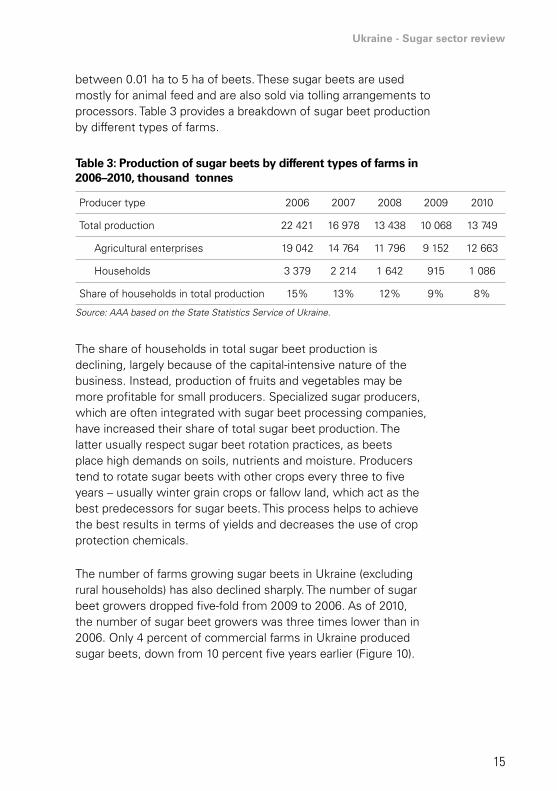
between 0.01 ha to 5 ha of beets. These sugar beets are used mostly for animal feed and are also sold via tolling arrangements to processors. Table 3 provides a breakdown of sugar beet production by different types of farms.
Table 3: Production of sugar beets by different types of farms in 2006–2010, thousand tonnes
Producer type 2006 2007 2008 2009 2010
Total production 22 421 16 978 13 438 10 068 13 749
Agricultural enterprises 19 042 14 764 11 796 9 152 12 663
Households 3 379 2 214 1 642 915 1 086
Share of households in total production 15% 13% 12% 9% 8%
Source: AAA based on the State Statistics Service of Ukraine.
The share of households in total sugar beet production is declining, largely because of the capital-intensive nature of the business. Instead, production of fruits and vegetables may be more profitable for small producers. Specialized sugar producers, which are often integrated with sugar beet processing companies, have increased their share of total sugar beet production. The latter usually respect sugar beet rotation practices, as beets place high demands on soils, nutrients and moisture. Producers tend to rotate sugar beets with other crops every three to five years – usually winter grain crops or fallow land, which act as the best predecessors for sugar beets. This process helps to achieve the best results in terms of yields and decreases the use of crop protection chemicals.
The number of farms growing sugar beets in Ukraine (excluding rural households) has also declined sharply. The number of sugar beet growers dropped five-fold from 2009 to 2006. As of 2010, the number of sugar beet growers was three times lower than in 2006. Only 4 percent of commercial farms in Ukraine produced sugar beets, down from 10 percent five years earlier (Figure 10).

16
The average size of commercial sugar beet growers has increased resulting in higher efficiency. According to industry sources, while many agricultural holdings improved their positions on the sugar market by integrating production with processing, many small beet growers did not have the necessary equipment and machinery to compete and opted to grow other crops. As a consequence, the average size of beet-producing farms increased considerable as indicated in Figure 11. The average size of the sugar beet grower in terms of area devoted to sugar beets nearly doubled between 2006–2010, reaching 225 ha in 2010.
Figure 10: Number of commercial farms involved in production of sugar beets in Ukraine
Source: AAA based on State Statistics Service of Ukraine.
12%7 000
6 000
5 000
4 000
3 000
2 000
1 000
0
10%
8%
6%
4%
2%
0%2006 2007 2008 2009 2010
Number of growers As percentage of total farms

Ukraine - Sugar sector review
17
Figure 11: Average size of commercial sugar beet grower in Ukraine and area devoted to sugar beets in 2006–2010
Output, tonnes Area, ha
9 000300
250
200
150
100
50
0
8 000
7 000
6 000
5 000
4 000
3 000
2 000
1 000
02006 2007 2008 2009 2010
Source: AAA based on State Statistics Service of Ukraine.
The process of sugar beet production consolidation is far from over, as about 50 percent of farms grow sugar beets on an area of less than 50 ha, according to the State Statistics Service of Ukraine. It is therefore doubtful that these farms would be able to invest in specialized machinery and equipment for sugar beet production at competitive levels. The share of small commercial farmers as a proportion of total farms growing sugar beets is therefore likely to decrease further in the near future.
Commercial farms producing sugar beets can be divided into three major categories:
• growers that form part of vertically integrated agricultural holdings with sugar beet processing capacities (23 percent of sugar beets supplied);
• independent growers oriented towards tolling deals (35 percent of sugar beets supplied); and
• independent growers that sell beets for cash (42 percent of sugar beets supplied).
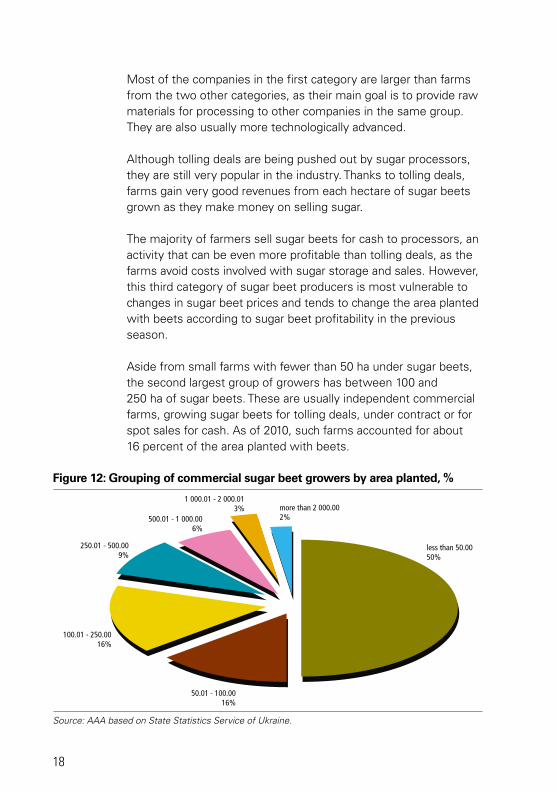
18
Most of the companies in the first category are larger than farms from the two other categories, as their main goal is to provide raw materials for processing to other companies in the same group. They are also usually more technologically advanced.
Although tolling deals are being pushed out by sugar processors, they are still very popular in the industry. Thanks to tolling deals, farms gain very good revenues from each hectare of sugar beets grown as they make money on selling sugar.
The majority of farmers sell sugar beets for cash to processors, an activity that can be even more profitable than tolling deals, as the farms avoid costs involved with sugar storage and sales. However, this third category of sugar beet producers is most vulnerable to changes in sugar beet prices and tends to change the area planted with beets according to sugar beet profitability in the previous season.
Aside from small farms with fewer than 50 ha under sugar beets, the second largest group of growers has between 100 and 250 ha of sugar beets. These are usually independent commercial farms, growing sugar beets for tolling deals, under contract or for spot sales for cash. As of 2010, such farms accounted for about 16 percent of the area planted with beets.
Figure 12: Grouping of commercial sugar beet growers by area planted, %
less than 50.0050%
more than 2 000.002%
1 000.01 - 2 000.013%
500.01 - 1 000.006%
250.01 - 500.009%
100.01 - 250.0016%
50.01 - 100.0016%
Chart. Gr up g of commerc a sugar beet g owe s by area unde the c op,
Source: AAA based on State Statistics Service of Ukraine.

Ukraine - Sugar sector review
19
Large sugar beet farms with areas of 250 ha and more account for 20 percent of all growers. Usually, these farms belong to vertically integrated agricultural holding. It is noteworthy that 5 percent of all sugar beet growers in Ukraine, or 94 farms, have more than 1 000 ha under sugar beets each, and 2 percent, or 38 farms, have more than 2 000 ha each. This will be the fastest growing category of commercial farms producing beets in the nearest future.
Sugar beet crop budgets and production cost analyses9
Most farms in Ukraine use traditional sugar beet production technology in combination with deep ploughing of land, high application of mineral fertilizers and no irrigation. The main technological differences relate to seeds, inputs and equipment used, as well as the size of land devoted to beets.
Only Astarta Holding is trying to vary the technology used for sugar beet production, based on the US experience. The key difference lies in the use of US-made harvesters (Amity Technology), which require wider rows according to the farmers who were interviewed. However, production costs with this technology are similar to those registered for traditional technology in Ukraine. While wider rows do not impact the yield of sugar beets, they help to decrease the time required for all field operations by about 24 percent, and the same cultivators and planters can be used not only for sugar beets, but also for maize, soybeans and sunflower seeds.
An attempt was made to grow sugar beets using irrigation in the south of Ukraine (Mykolaivska oblast) by “ED & F Man” (Ukrainian Sugar Company). Results in terms of yields were good: 50–52 tonnes of sugar beets were harvested from each hectare; however, such beets proved more costly per tonne than those produced without irrigation.
There are no major differences in sugar beet production costs between the different regions of Ukraine. The level of farming technologies used, however, has a greater impact on production costs than geographical location.
9 The data is this chapter have been provided by a Ukrainian consulting company, AAA, which polled all key agricultural holdings involved in the production and processing of sugar beets.

20
The direct variable costs per hectare10 for sugar beets increased dynamically in 2006–2010. Total per hectare costs in UAH increased 150 percent during this period, while the same measured in USD � only by 60 percent. The costs measured per tonne of sugar beets produced have also increased, but this increase was partially compensated by growing yields (see Figure 13).
The analysis of sugar beet production costs in USD per hectare shows that leading agricultural holdings have had relatively stable production costs for the same amount of money per hectare of sugar beets produced in the past three years. Most of the costs of sugar beet growers are closely linked to the USD/UAH exchange rate, as farmers mainly use imported seeds and crop protection means, while fuel and fertilizer prices in Ukraine closely correlate with international ones. Therefore, the costs per tonne of sugar beets produced measured in USD increased only by 25 percent in 2006–2010.
10 These include seeds, fertilizers, crop protection means, labour, fuel and lubricants, equ pment maintenance and other costs, directly linked w th production of the crops, which vary depending on the area under the crop.
Figure 13: Costs of sugar beet production per hectare and per tonne in major agricultural holdings of Ukraine, UAH and USD
Source: AAA.
UAH USD
Costs per ha, UAH (left axis)
Costs per tonne, UAH (right axis)
Costs per ha, USD (left axis)
Costs per tonne, USD (right axis)
10 000
9 000
8 000
7 000
6 000
5 000
4 000
3 000
2 000
1 000
−
250
−
5
10
15
20
25
30
35
401 200
−
200
400
600
800
1 000200
150
100
50
−2006 2007 2008 2009 2010 2006 2007 2008 2009 2010

Ukraine - Sugar sector review
21
An examination of the costs and related dynamics shows that growers began using more services provided by third parties (e.g. customs machinery services, etc.) as well as increased application of mineral fertilizers. The share of salaries as a proportion of total production costs has also increased (Figure 14).
The two most important cost elements – fertilizers and crop protection – accounted for 51 percent of all costs in 2010, while their combined share back in 2006 was 47 percent. The combined share of fuel, fertilizers and seeds totaled 67 percent in 2010. Table 4 provides a breakdown of sugar beet production costs.
Figure 14: Sugar beet production cost structures in 2006 and 2010 in Ukraine, %
Source: AAA.
Fertilizers20%
Salaries2%
Land lease7%
Fuel and lubricants11%
Fertilizers27%Services
1%
Salaries7%
Fuel and lubricants7%
Land lease4%
Seeds32%
Crop protection27%
Crop protection24% Seeds
16%
Services15%
Table 4: Evolution of sugar beet production costs in Ukraine in 2006–2010, UAH per ha
cost elements 2006 2007 2008 2009 2010change, 2010
vs. 2006, %
Fuel and lubricants 367 321 548 551 606 65
Salaries 59 65 400 400 600 917
Services 50 200 1 200 1 200 1 300 2 500
Seeds 1 113 972 1 310 1 491 1 401 26
Crop protection 955 1 543 1 196 1 956 2 129 123
Fertilizers 714 1 069 1 249 2 054 2 362 231
Land lease 250 275 330 330 340 36
Costs per ha 3 457 4 329 6 233 7 982 8 738 153
Average yield, tonnes/ha 36 25 52 40 43 19
Costs per tonne 97 170 121 198 203 109
Source: AAA.
22
As access to capital, knowledge and modern technologies improves, it will lead to a gradual improvement in sugar beet production profitability. In the upcoming years it is expected that the share of chemicals in total costs may decrease, while the share of salaries and land lease costs would increase.
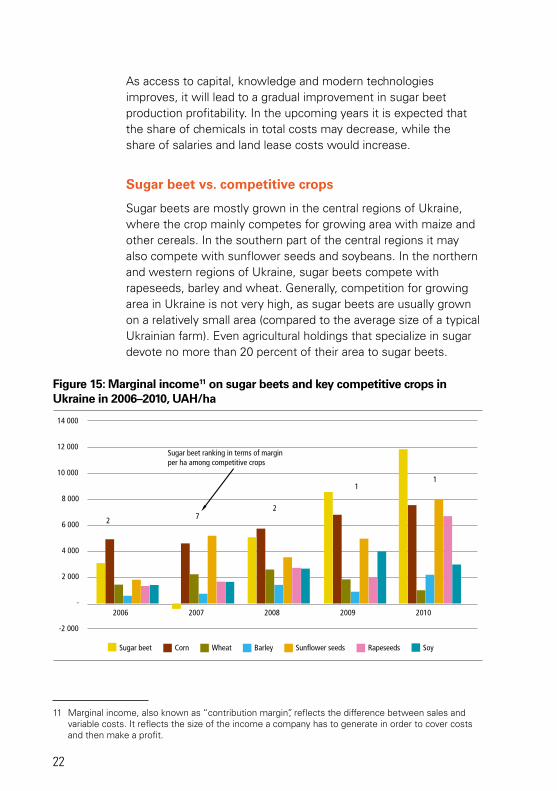
Sugar beet vs. competitive crops
Sugar beets are mostly grown in the central regions of Ukraine, where the crop mainly competes for growing area with maize and other cereals. In the southern part of the central regions it may also compete with sunflower seeds and soybeans. In the northern and western regions of Ukraine, sugar beets compete with rapeseeds, barley and wheat. Generally, competition for growing area in Ukraine is not very high, as sugar beets are usually grown on a relatively small area (compared to the average size of a typical Ukrainian farm). Even agricultural holdings that specialize in sugar devote no more than 20 percent of their area to sugar beets.
Figure 15: Marginal income11 on sugar beets and key competitive crops in Ukraine in 2006–2010, UAH/ha
11 Marginal income, also known as “contribution margin”, reflects the difference between sales and variable costs. It reflects the size of the income a company has to generate in order to cover costs and then make a profit.
7
11
2
2
-2 000
-
2 000
4 000
6 000
8 000
10 000
12 000
14 000
2006 2007 2008 2009 2010
SoyRapeseedsSunflower seedsBarleyWheatCornSugar beet
Sugar beet ranking in terms of marginper ha among competitive crops

Ukraine - Sugar sector review
23
From 2006–2010, sugar beets were the most profitable crop for two seasons, the second most profitable crop twice, and the least profitable crop once (Figure 15). Sugar beets are also the only crop among those analyzed to cause losses to growers during the period reviewed, although this occurred only once (2007).
Over a period of five years (2006–2010), sugar beets ranked second to maize in cumulative marginal income. Maize provided growers with 5 percent higher combined five-year marginal incomes than sugar beets. All other crops were much less profitable for producers.12
Figure 16: Cumulative marginal income for sugar beets and key competitive crops in Ukraine in 2006–2010, UAH/ha
-2 000
-
2 000
4 000
6 000
8 000
10 000
12 000
14 000 35 000
30 000
25 000
20 000
15 000
10 000
5 000
2006 2007 2008 2009 2010
Soy
total
RapeseedsSunflowerseeds
BarleyWheatCornSugar beet
-
Source: AAA.
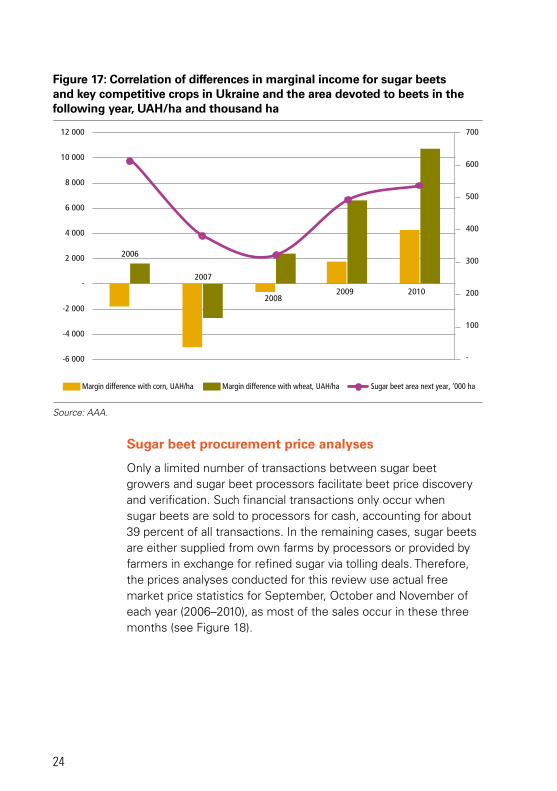
A comparison of marginal incomes from sugar beets with those from maize and wheat reveals a relationship between margin differences and changes in planting decisions by farmers the following season. In fact, increased difference between sugar beet, maize and wheat margins caused overproduction of sugar beets in 2011 (see Figure 17).
12 These numbers are only true for the regions of sugar beet production where data were collected, namely: Cherkaska, Dn propetrovska, Kharkivska, Kirovohradska, Poltavska and Ternopilska oblasts. In the southern regions where sunflower seed, soybean and wheat production are concentrated, the margins of these crops would be much higher; however, these are not the major sugar beet-producing regions.
24
Sugar beet procurement price analyses
Only a limited number of transactions between sugar beet growers and sugar beet processors facilitate beet price discovery and verification. Such financial transactions only occur when sugar beets are sold to processors for cash, accounting for about 39 percent of all transactions. In the remaining cases, sugar beets are either supplied from own farms by processors or provided by farmers in exchange for refined sugar via tolling deals. Therefore, the prices analyses conducted for this review use actual free market price statistics for September, October and November of each year (2006–2010), as most of the sales occur in these three months (see Figure 18).
Figure 17: Correlation of differences in marginal income for sugar beets and key competitive crops in Ukraine and the area devoted to beets in the following year, UAH/ha and thousand ha
Source: AAA.
Margin difference with wheat, UAH/haMargin difference with corn, UAH/ha Sugar beet area next year, ‘000 ha
2006
2007
20082009 2010
-6 000
-4 000
-2 000
-
2 000
4 000
6 000
8 000
10 000
12 000
-
100
200
300
400
500
600
700
Ukraine - Sugar sector review
25
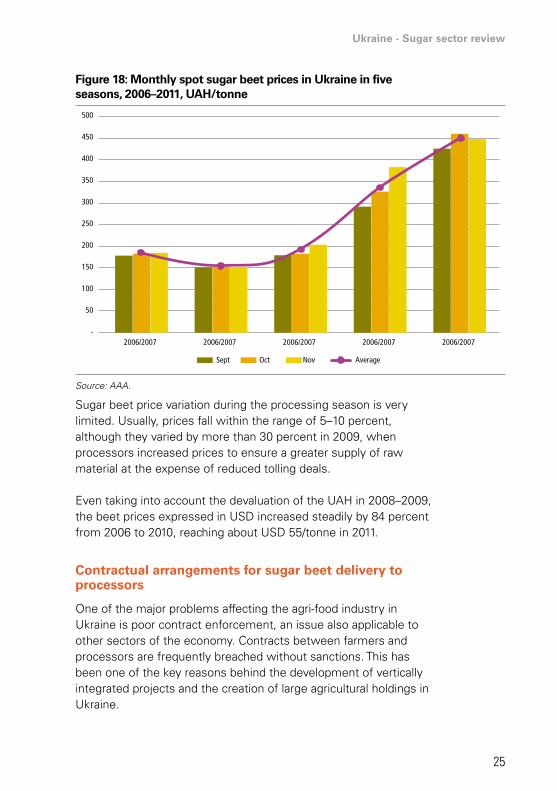
Figure 18: Monthly spot sugar beet prices in Ukraine in five seasons, 2006–2011, UAH/tonne
Source: AAA.
Sugar beet price variation during the processing season is very limited. Usually, prices fall within the range of 5–10 percent, although they varied by more than 30 percent in 2009, when processors increased prices to ensure a greater supply of raw material at the expense of reduced tolling deals.
Even taking into account the devaluation of the UAH in 2008–2009, the beet prices expressed in USD increased steadily by 84 percent from 2006 to 2010, reaching about USD 55/tonne in 2011.
Contractual arrangements for sugar beet delivery to processors
One of the major problems affecting the agri-food industry in Ukraine is poor contract enforcement, an issue also applicable to other sectors of the economy. Contracts between farmers and processors are frequently breached without sanctions. This has been one of the key reasons behind the development of vertically integrated projects and the creation of large agricultural holdings in Ukraine.
Sou ce
2006/20072006/20072006/20072006/20072006/2007-
50
100
150
200
250
300
350
400
450
500
AverageNovOctSept
Chart onth sp t s gar beet pr

26
The sugar industry is not different in this respect. As can be seen from Table 5, the share of sugar beets supplied from own farms increased nearly threefold from 8 percent in 2006/07 to 23 percent in 2010/11. The share of tolling deals declined from 34 percent to 27 percent during the same period as vertically integrated facilities aimed to reduce their dependence on unreliable farmers who, in turn, would dump the sugar received after tolling from processors onto the same local markets. The share of independent suppliers also declined from 42 percent to 39 percent; however, this category of farmers remains the main supplier of sugar beets for processing.
The three main types of contractual arrangements for beet supply are as follows:
(i) about 23 percent of all beets in 2010 were delivered from own farms integrated into holdings with sugar factories;
(ii) forward delivery contracts (on a tolling or cash against delivery basis) accounted for about 41 percent of all beets supplied in 2010;
(iii) spot supply contracts (both tolling or cash payment) accounted for the remaining 34 percent of all beets supplied for processing.
Table 5: Different types of sugar beet suppliers to processing in Ukraine, 2006–2011
2006/2007 2007/2008 2008/2009 2009/2010 2010/2011
‘000tonnes % ‘000
tonnes % ‘000 tonnes % ‘000
tonnes % ‘000 tonnes %
Agricultural holdings 1 770.4 8 1 800.3 11 1 329.1 10 2 611.6 28 2 988.6 23
Tolling suppliers 7 594.8 34 5 563.6 34 4 321.0 32 2 504.1 27 3 586.5 27
Including households 3 249.1 15 2 128.7 13 1 506.6 11 833.3 9 1 005.4 8
Independent suppliers 9 294.8 42 6 873.9 42 6 210.0 46 3 449.7 37 5 104.7 39
Total major suppliers 21 909.1 99 16 366.5 100 13 366.7 100 9 398.7 100 12 685.2 96
Other suppliers 221.3 1 0.0 0 0.0 0 0.0 0 569.3 4
Total sugar beets 22 130.4 100 16 366.5 100 13 366.7 100 9 398.7 100 13 254.5 100
Source: AAA based on the State Statistics Service of Ukraine.

Ukraine - Sugar sector review
27
In the first case, the supply is guaranteed as the same company grows and processes sugar beets. No de facto contractual arrangements are needed. In some cases, formal contracts are made if banks require this for providing financing. The disadvantage of this arrangement is that the agricultural holding takes all risks, including unmanageable agricultural risks such as weather impact. Furthermore, the processors often have to invest in agricultural production, in addition to their investments in beet processing, with sales of sugar being the main (and often) only profit centre.
Another important risk factor is poor farm management. In some cases, own sugar beets may cost agricultural holdings more than they would pay at the free market. Almost all of the agricultural holdings involved in sugar beet processing and production have experienced such situations in the past. Nonetheless, in most cases these vertically integrated facilities do manage to develop efficient agricultural production of beets to ensure a stable supply for processing.
The forward contract used in Ukraine resembles more a memorandum of understanding than an obligation to deliver beets in the future at a certain price. These contracts are usually non-binding and basically confirm that a certain producer is planning to supply a certain amount of sugar beets to a certain processor at a price to be determined at the time of delivery. In rare cases, contracts can include provisions or reference formula to calculate the price. A specific price is almost never included in the contract. In most cases, the two parties to this type of contract agree based on long-term relations, taking into account the fact that the farmer must still sell their beets after harvesting.
Spot contracts are usually concluded shortly before (rarely after) harvesting of sugar beets, when sugar market price perspectives are clearer. Nonetheless, farmers usually contact one or two processors before growing “untied” sugar beets and, thus, both sides are aware of the potential contract even before it takes place.
Forward and spot contracts can be concluded for cash or as tolling deals. In the case of a tolling contract, farmers are paid in sugar for the sugar beets supplied. The processor keeps a certain

28
percentage of the sugar produced from the supplier’s beets as the payment for services provided (usually 38–40 percent).
Sugar factories are trying to avoid these deals, as farmers in such cases become their competitors on the sugar market. Frequently, producers sell sugar beets at reduced prices in local markets. Nonetheless, tolling remains popular, although the share of such contracts is declining. Processors also continue to accept sugar beets from rural households through tolling arrangements as these are usually for family consumption.

Ukraine - Sugar sector review
29
Chapter 3 - Supply and demand balance of sugar
Ukraine’s demand for sugar declined by an estimated 15 percent from 2006 to 2010 (see Table 6) according to the AAA agency in Kiev, Ukraine. This was largely due to a decrease in demand from consumers (see below). In the meantime, demand for confectionery and other industrial uses increased by 9 percent.
Ukraine can import or export sugar depending on domestic production. Sugar trade trends are covered later in this report.
Average annual domestic consumption in Ukraine is close to 1.8–1.9 million tonnes of refined sugar per year. However, domestic consumption is believed to have decreased to about 1.76 million tonnes in 2008–2010, due to lower utilization of sugar for home canning (preparation of jams, etc.). Along with this decrease in consumption, the most notable change is a significant reduction in ending stocks of sugar. The latter is a reflection of improved consumer confidence in stable sugar availability, as compared with the early to mid-1990s when sugar shortages were possible. The confectionary and soft beverage
Table 6: Supply and demand balance of sugar in Ukraine, 2006–2011, refined basis, tonnes
items 2006/07 2007/08 2008/09 2009/10 2010/11
Starting stocks 125 000 585 000 495 500 231 000 50 000
Sugar production 2 591 679 1 867 027 1 571 226 1 274 811 1 804 652
Sugar imports 8 851 44 566 78 728 87 027 49 284
total supply 2 725 530 2 496 593 2 144 954 1 592 838 1 903 936
Industrial consumption 585 000 600 000 585 000 610 000 635 000
Human consumption 1 547 748 1 400 837 1 294713 931 678 1 188 348
Exports 7 782 756 34 241 1 160 588
total demand 2 140 530 2 001 593 1 913 954 1 542 838 1 823 936
Ending stocks 585 000 495 000 231 000 50 000 80 000
Source: AAA.

industries have also ceased stockpiling sugar (and maintain related inventory), as was the case 5–10 years ago, in response to the improved reliability of contractual relations with sugar producers.
Ukraine - Sugar sector review
31
Chapter 4 - Sugar beet processing
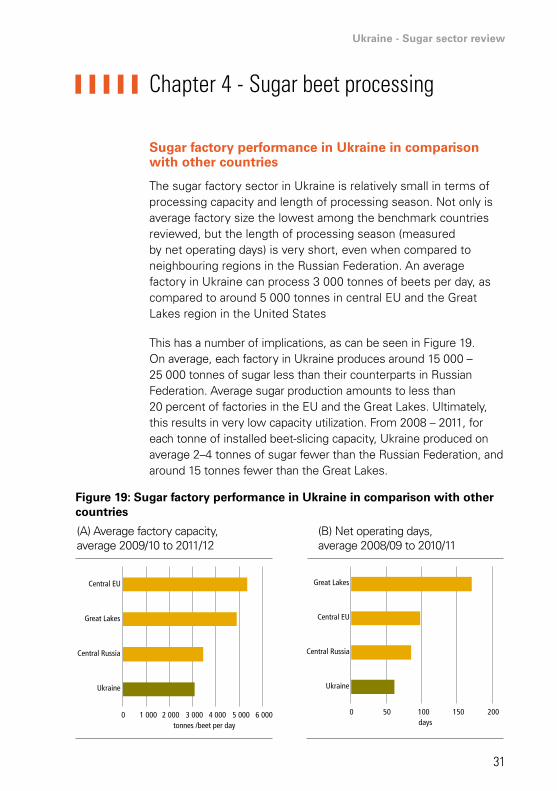
Sugar factory performance in Ukraine in comparison with other countries
The sugar factory sector in Ukraine is relatively small in terms of processing capacity and length of processing season. Not only is average factory size the lowest among the benchmark countries reviewed, but the length of processing season (measured by net operating days) is very short, even when compared to neighbouring regions in the Russian Federation. An average factory in Ukraine can process 3 000 tonnes of beets per day, as compared to around 5 000 tonnes in central EU and the Great Lakes region in the United States
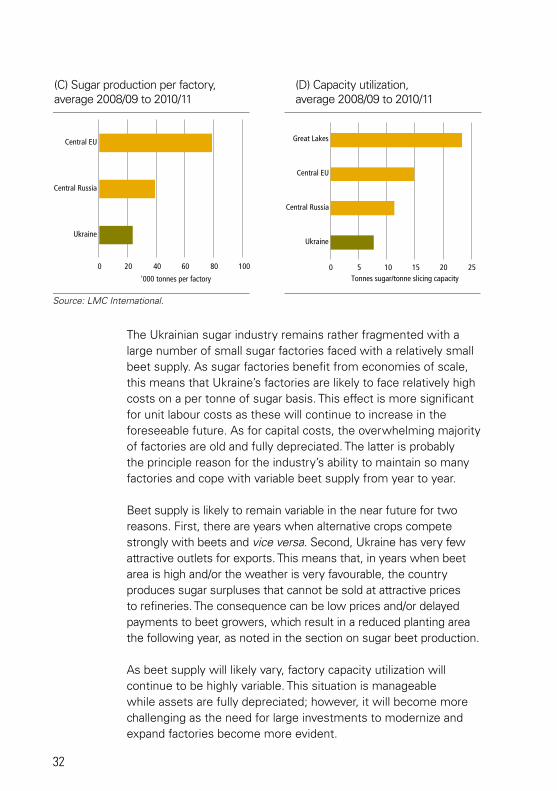
This has a number of implications, as can be seen in Figure 19. On average, each factory in Ukraine produces around 15 000 – 25 000 tonnes of sugar less than their counterparts in Russian Federation. Average sugar production amounts to less than 20 percent of factories in the EU and the Great Lakes. Ultimately, this results in very low capacity utilization. From 2008 – 2011, for each tonne of installed beet-slicing capacity, Ukraine produced on average 2–4 tonnes of sugar fewer than the Russian Federation, and around 15 tonnes fewer than the Great Lakes.
0 1 000 2 000 3 000 4 000 5 000 6 000
Ukraine
Central Russia
Great Lakes
Central EU
tonnes /beet per day
0 50 100 150 200
Ukraine
Central Russia
Central EU
Great Lakes
days
(A) Average factory capacity,average 2009/10 to 2011/12
(B) Net operating days,average 2008/09 to 2010/11
Figure 19: Sugar factory performance in Ukraine in comparison with other countries
32
The Ukrainian sugar industry remains rather fragmented with a large number of small sugar factories faced with a relatively small beet supply. As sugar factories benefit from economies of scale, this means that Ukraine’s factories are likely to face relatively high costs on a per tonne of sugar basis. This effect is more significant for unit labour costs as these will continue to increase in the foreseeable future. As for capital costs, the overwhelming majority of factories are old and fully depreciated. The latter is probably the principle reason for the industry’s ability to maintain so many factories and cope with variable beet supply from year to year.
Beet supply is likely to remain variable in the near future for two reasons. First, there are years when alternative crops compete strongly with beets and vice versa. Second, Ukraine has very few attractive outlets for exports. This means that, in years when beet area is high and/or the weather is very favourable, the country produces sugar surpluses that cannot be sold at attractive prices to refineries. The consequence can be low prices and/or delayed payments to beet growers, which result in a reduced planting area the following year, as noted in the section on sugar beet production.
As beet supply will likely vary, factory capacity utilization will continue to be highly variable. This situation is manageable while assets are fully depreciated; however, it will become more challenging as the need for large investments to modernize and expand factories become more evident.
0 20 40 60 80 100
Ukraine
Central Russia
Central EU
'000 tonnes per factory0 5 10 15 20 25
Ukraine
Central Russia
Central EU
Great Lakes
Tonnes sugar/tonne slicing capacity
(C) Sugar production per factory,average 2008/09 to 2010/11
(D) Capacity utilization,average 2008/09 to 2010/11
Source: LMC International.

Ukraine - Sugar sector review
33
Sugar production trends
Average sugar production in Ukraine in 2006–2010 comprised 1.82 million tonnes per year, which was close to estimated domestic market demand. However, in two out of five years domestic production was significantly lower than domestic requirements, while in 2006 it was much higher than the demand (see Figure 20).
Figure 20: Sugar production in Ukraine by type of raw material used in the past seven years, thousand tonnes
-
500
1 000
1 500
2 000
2 500
3 000
2006 2006 2006 2007 2008 2009 2010
Beet sugar Cane sugar Domestic demand
Source: AAA based on the State Statistics Service of Ukraine.
During 2006–2010, only 3 percent of all sugar produced in Ukraine was derived from raw cane sugar; the remaining 97 percent came from sugar beets. Significant imports of cane sugar during the five-year period were noted only once, in 2010. Therefore, in 2009 and 2010 Ukraine was a net importer of white sugar.
Regional concentration of sugar production and number of operating factories
Essentially the same regional concentration characterizes sugar production as defines production of sugar beets. There are only two exceptions related to cane sugar refining: both Volynska and

34
Mykolaivska oblasts have cane sugar refining in addition to own beet sugar production (2010); however, the former produced significant volumes of sugar, while the latter produced smaller volumes.
Out of 25 regions, 19 produced sugar for at least one year during 2006–2010. In 2010, factories in 17 regions produced sugar, a slight increase from 13 regions in 2009. In 2010, three oblasts produced more than 200 000 tonnes of white sugar each: Poltavska Vinnytska and Volynska. These three leaders account for 42 percent of total sugar production in Ukraine. Cherkaska, Khmelnytska, Kyivska and Ternopilska oblasts produced from 100 000 to 200 000 tonnes of white sugar each, together accounting for another 34 percent of total sugar production in Ukraine.
Thus, seven leading regions accounted for 76 percent of Ukraine’s sugar production in 2010 (see Figure 21).
Two oblasts, Dnipropetrovska and Odeska, ceased sugar production during 2006–2010. Chernivetska, Ivano-Frankivska, Mykolaivska and Sumska oblasts produced sugar irregularly – none of the sugar factories in these regions were operational in 2009, although some re-started operations in 2010.
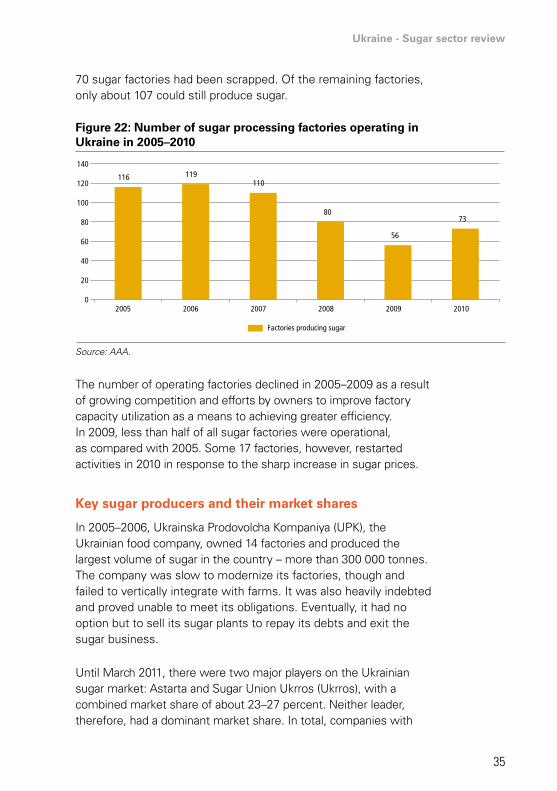
There were 192 operating sugar factories in Ukraine at the time of the break up of the Soviet Union in 1991. As of the end of 2010,
Figure 21: Regional white sugar production in 2010, %
Kyivska9%
Khmelnytska9%
Volynska12%
Poltavska13%
Vinnytska17%Others
24%
Ternopilska8%
Cherkaska8%
Source: AAA based on the State Statistics Service of Ukraine.
Ukraine - Sugar sector review
35
70 sugar factories had been scrapped. Of the remaining factories, only about 107 could still produce sugar.
Figure 22: Number of sugar processing factories operating in Ukraine in 2005–2010
116 119 110
80
56
73
0
20
40
60
80
100
120
140
2005 2006 2007 2008 2009 2010
Factories producing sugar
Source: AAA.
The number of operating factories declined in 2005–2009 as a result of growing competition and efforts by owners to improve factory capacity utilization as a means to achieving greater efficiency. In 2009, less than half of all sugar factories were operational, as compared with 2005. Some 17 factories, however, restarted activities in 2010 in response to the sharp increase in sugar prices.
Key sugar producers and their market shares
In 2005–2006, Ukrainska Prodovolcha Kompaniya (UPK), the Ukrainian food company, owned 14 factories and produced the largest volume of sugar in the country – more than 300 000 tonnes. The company was slow to modernize its factories, though and failed to vertically integrate with farms. It was also heavily indebted and proved unable to meet its obligations. Eventually, it had no option but to sell its sugar plants to repay its debts and exit the sugar business.
Until March 2011, there were two major players on the Ukrainian sugar market: Astarta and Sugar Union Ukrros (Ukrros), with a combined market share of about 23–27 percent. Neither leader, therefore, had a dominant market share. In total, companies with
36
more than 3 percent of total sugar production in Ukraine accounted for more than half of all sugar produced. In March 2011, Ukrros was acquired by the Kernel Group, which then decided to restructure and sell some of its sugar factories. For the purposes of this review, which covers the period 2006–2010, Ukrros is considered as an independent market player, operating as a separate legal entity.
Two Astarta plants in Kobelyatsky (capacity of about 6 500 tonnes) and Yareskovsky (about 5 000 tonnes) can be considered large. Four other Astarta plants are capable of processing only 3 000 tonnes of beets per day, which limits the company’s ability to boost production. Average daily sugar beet processing at Astarta’s plants amounts to 4 500 tonnes. Astarta’s sugar market share was estimated at about 14 percent in 2008–2010, and the company was a top sugar beet processor in Ukraine.
Ukrros owned six sugar factories; however, only four operated in 2010. Out of the four factories in operation, three processed about 6 000 tonnes per day. Ukrros had only one small factory with a capacity of 3 000 tonnes per day, in Tsukrove. The average daily processing capacity of each sugar plant of Ukrros was about 5 750 tonnes. The share of Ukrros in Ukrainian sugar production in 2006–2010 was about 11 percent and increased to 12 percent in 2008–2010 at the expense of smaller independent producers.
Analysts from the AAA Consulting Company in Ukraine believe that Astarta is only slightly less efficient than Ukrros as the sugar factories of the former company are smaller. The average production of sugar per factory in 2010 was 43 800 tonnes at Ukrros and 40 200 at Astarta.
Astarta, which started as a sugar producer, has also diversified into milk, meat, grains and oilseeds production, and related storage infrastructure. Ukrros, prior to its sale to Kernel, remained focused predominantly on sugar. Ukrros’s land bank was only half that of Astarta, while its sugar production in 2008–2010 was only 16 percent smaller than that of its main competitor.
The Agroprodinvest company is another important player, owning three factories of which only two were functioning. However, both operational factories were large. The company’s market share was about 7 percent in 2006–2010, making it the third largest market player in Ukraine. Agroprodinvest has the
Ukraine - Sugar sector review
37
largest per factory capacity with more than 50 000 tonnes per year. It farms more than 80 000 ha of land, and its land and factories are all concentrated in one region. What makes this company unique is that it forms part of the Ukrprominvest Group, the leading confectionary company in Ukraine and one of the leaders in the CIS. Therefore, sugar can be considered as an intermediate product for the group as it continues to add value in its confectionary business.
The Ukrlandfarming company bought two mid-sized sugar market players in 2011: Dakor and Rise. Rise owned the largest sugar factory in Ukraine, capable of processing up to 9 500 tonnes of sugar beets per day. In 2008–2010, this factory produced 92 000 tonnes of sugar per year on average and its historical output exceeded 100 000 tonnes. It also had a large land bank with quite efficient sugar beet production. Rise’s recent market share over three years was close to 6 percent, making it the fifth largest market player after the Volynska Group.
Dakor owned four factories, of which only one was functioning prior to acquisition by Ukrlandfarming. Dakor’s market share in 2008–2010 was close to 4 percent.
Agricultural holding Mriya does not officially own its sugar factories, but these are believed to constitute a de facto part of its business operations. This holding manages six relatively small sugar factories. Its market share in 2010 was estimated at 5 percent, making it the fifth largest producer.
Until 2010, foreign capital was represented by only one factory in Ukraine in Mykolaivska oblast. The factory was fully bought out by international food company “ED & F Man”. The Ukrainian Sugar Company, which is specialized in cane sugar refining, represents this holding.
In 2010, German company Pfeifer & Langen bought one of the largest sugar factories in Ukraine: Radekhivsky Sugar Plant in Lviv oblast. The company has cooperated with Pfeifer & Langen for the past few years, and is one of the key suppliers of sugar to one of the leading confectionery companies in Ukraine, Svitoch, which is owned by Nestle. In 2010/11, the plant produced about 4 percent of all Ukrainian sugar or about 79 000 tonnes. This was the largest quantity produced
38
by any sugar plant in that season, placing Pfeifer & Langen in sixth position among the leading sugar producers of Ukraine.
Financing
Many Ukrainian sugar producers have been able to attract investments via initial public offering (IPO) and private placement (PP) mechanisms. These include Astarta (IPO 2001, WSE), Ukrros (PP 2007, GDR) and Mriya (PP 2008, GDR). However, Mriya is positioning itself as a purely agricultural holding, which only manages six sugar factories; therefore, its sales are not reflected in Mriya’s official balance sheets.
These three holdings, which used IPO or PP financing mechanisms, have very good credit histories. While Astarta and Mriya mainly receive financing from European banks, Ukrros obtained the majority of its financing from Ukreksimbank.
Detailed rankings of sugar companies and maps with factory locations are provided in the Annexes.
Sugar production technologies and modernization
The Ukrainian companies all use traditional sugar beet processing technology, which employs natural gas as a key energy source; although, technological processes may differ in efficiency and equipment used. The typical technology envisages analysis of sucrose content in beets, dirt admixture and other quality parameters. Price of sugar beets received by suppliers will be linked to sucrose content as well as net weight and other quality indicators. For more information on sugar beet processing, please refer to the FAO-EBRD White Sugar Agribusiness Handbook.13
Most sugar holdings have been actively upgrading sugar plants in Ukraine, which are among the oldest in the world. Key areas of modernization include improvements in energy efficiency, increased capacity, and installation of cane sugar processing lines. Plans also include active improvements to waste management. Since the late 1990s, sugar factories have also actively invested in automation of key processes to decrease labour requirements.
13 For more information, please see: www fao.org/fileadmin/user_upload/tci/docs/AH1-(eng)Sugar%20beet%20wh te%20sugar.pdf.

Ukraine - Sugar sector review
39
Ukrros
All Ukrros factories are equipped with new presses for beet pulp. Major improvements were made, in particular, at the Chertkivsky sugar plant. Capacity has been increased from 6 000 to 7 000 tonnes of sugar beets per day. Energy efficiency has also been improved to a level comparable to European factories.
Astarta
In 2009, the company conducted an energy efficiency audit of its sugar factories. In 2009–2010, the factories were modernized in line with the findings obtained, which allowed the company to significantly decrease energy consumption. A major modernization of factories was then undertaken to boost capacity. The Yareskivsky sugar factory increased to 4 500 tonnes per day and Kobyliatsky increased to 7 000 tonnes per day. Capacity has also been increased at the Zhdanivsky and Narkevychsky factories. Plans were underway to increase the capacity of the Globynsky sugar factory from 5 500 to 8 000 tonnes. Reportedly, the company also plans to double the capacity of its Savynsky sugar plant (from 3 000 to 6 000 tonnes), which would make it more competitive. Astarta has been also actively working on a project to produce biogas from beet pulp.
Agroprodinvest
In 2009, the company increased capacity of its Kryzhopilsky sugar plant. It also boosted the capacity of its Gaysynsky sugar plant from 2 500 tonnes to 6 100 tonnes, with a further increase to 8 000 tonnes planned for 2012.
Ukrainian Sugar Company
The Ukraine Sugar Company is the only factory to have undergone serious modernization, which would allow it to process about 5 000 tonnes of sugar beets and 1 000 tonnes of raw cane sugar per day. The company reports that it has invested about USD 20 million in modernization of its production facilities.
Sugar production costs
Production costs of sugar in Ukraine more than doubled from 2006 to 2010 when measured in UAH, while production costs in USD increased by 32 percent during the same period (see Figure 23). Moreover, production costs in 2009 and 2010 were actually lower than in 2008 when expressed in USD, due to the devaluation of Ukrainian currency.

40
Analysis of cost structure dynamics shows that salaries were the major growing cost item in recent years (if expressed in USD), while the costs of sugar beets have actually decreased.
Figure 23: Production costs of sugar in Ukraine in 2006–2010, UAH and USD per tonne
201020092008200720060
500
1 000
1 500
2 000
2 500
3 000
3 500
4 000
4 500
5 000
0
100
200
300
400
500
600
700
Sugar productions costs in UAH (left axis) Sugar productions costs in USD (right axis)
Source: AAA.
Figure 24: Production cost structure of Ukrainian sugar in 2006–2010, USD per tonne
Sugar beetsLime filters and other materialsEnergySalariesOther direct costs
0
100
200
300
400
500
600
700
20102009200820072006
Source: AAA.
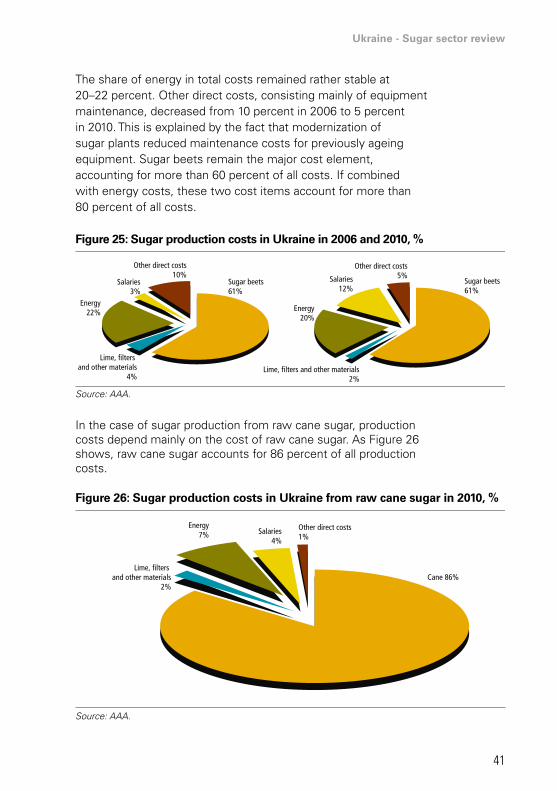
Ukraine - Sugar sector review
41
The share of energy in total costs remained rather stable at 20–22 percent. Other direct costs, consisting mainly of equipment maintenance, decreased from 10 percent in 2006 to 5 percent in 2010. This is explained by the fact that modernization of sugar plants reduced maintenance costs for previously ageing equipment. Sugar beets remain the major cost element, accounting for more than 60 percent of all costs. If combined with energy costs, these two cost items account for more than 80 percent of all costs.
Figure 25: Sugar production costs in Ukraine in 2006 and 2010, %
Lime, filters and other materials2%
Lime, filters and other materials
4%
Energy20%
Energy22%
Salaries12%
Salaries3%
Other direct costs5%
Other direct costs10%
Sugar beets61%
Sugar beets61%
Chart St uc ure sugar production c sts in Ukra ne in 2006 and 20
Source: AAA.
In the case of sugar production from raw cane sugar, production costs depend mainly on the cost of raw cane sugar. As Figure 26 shows, raw cane sugar accounts for 86 percent of all production costs.
Figure 26: Sugar production costs in Ukraine from raw cane sugar in 2010, %
Other direct costs1%
Cane 86%Lime, filters
and other materials2%
Energy7% Salaries
4%
C . tr c u e o suga p od ct o o t i ne r m w cane sug r 01 ,
Source: AAA.

42
Indirect costs of beet sugar production, which comprise mostly administrative and marketing costs, account for 5–9 percent of all costs for major Ukrainian sugar producers. In recent years, these costs experienced an upward trend due to increased competition, higher marketing and management personnel costs.
Sugar industry profitability
It is necessary to distinguish between the profitability of integrated and independent sugar producers. For integrated producers, sugar beets costs would often be equal to the production costs of own farms plus transportation expenses. Others producers would need to buy beets at market prices (despite the fact that many provide pre-financing to beet growers). Tolling deals represent the third type of cost and revenue streams for sugar factories. Refining imported raw cane sugar is the fourth business model, which is applicable to only a few sugar producers.
As mentioned previously, vertical integration of beet production and processing has developed rapidly in Ukraine. Calculations for this review show that this has been the most profitable of the four sugar production models cited here (see Figure 28).
Figure 27: Share of indirect costs in sugar production in Ukraine in 2006–2010, % (costs in UAH)
9%
5%
6%7%
7%
Direct costs Indirect costs
2006 2007 2008 2009 20100
500
1 000
1 500
2 000
2 500
3 000
3 500
4 000
4 500
5 000
Source: AAA.
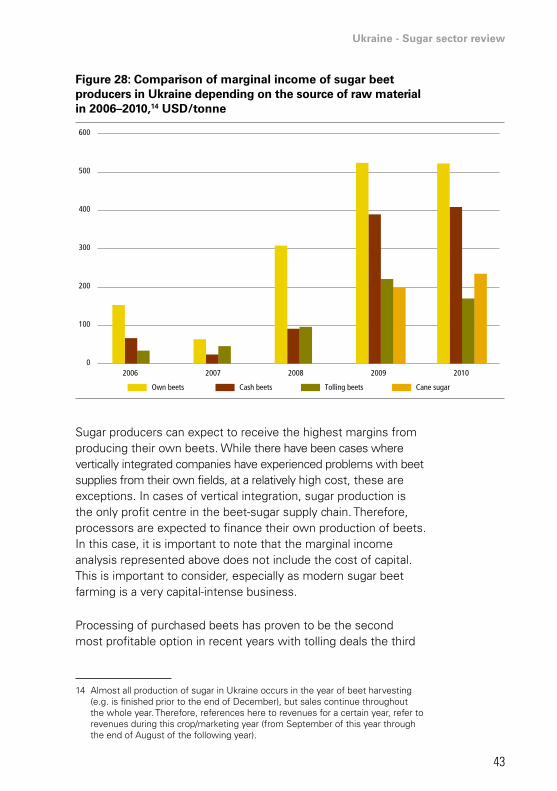
Ukraine - Sugar sector review
43
Figure 28: Comparison of marginal income of sugar beet producers in Ukraine depending on the source of raw material in 2006–2010,14 USD/tonne
0
100
200
300
400
500
600
Cane sugarOwn beets Tolling beetsCash beets
2006 2007 2008 2009 2010
Sugar producers can expect to receive the highest margins from producing their own beets. While there have been cases where vertically integrated companies have experienced problems with beet supplies from their own fields, at a relatively high cost, these are exceptions. In cases of vertical integration, sugar production is the only profit centre in the beet-sugar supply chain. Therefore, processors are expected to finance their own production of beets. In this case, it is important to note that the marginal income analysis represented above does not include the cost of capital. This is important to consider, especially as modern sugar beet farming is a very capital-intense business.
Processing of purchased beets has proven to be the second most profitable option in recent years with tolling deals the third
14 Almost all production of sugar in Ukraine occurs in the year of beet harvesting (e.g. is finished prior to the end of December), but sales continue throughout the whole year. Therefore, references here to revenues for a certain year, refer to revenues during this crop/marketing year (from September of this year through the end of August of the following year).
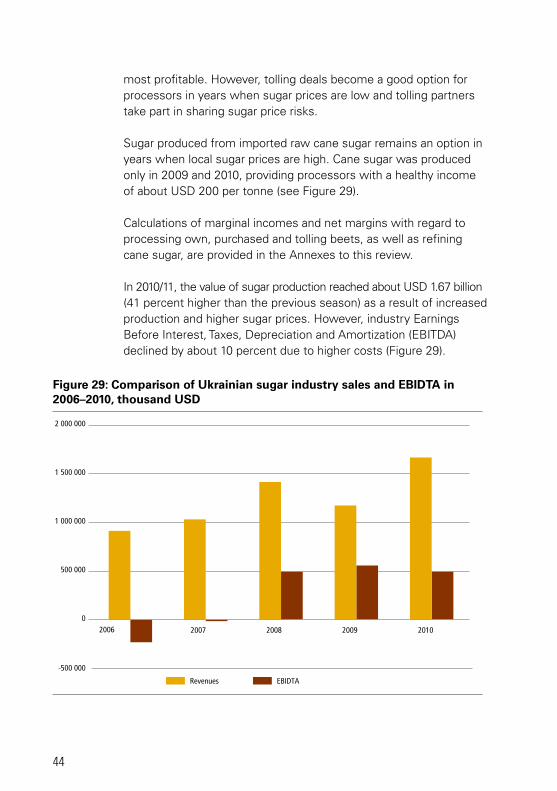
44
most profitable. However, tolling deals become a good option for processors in years when sugar prices are low and tolling partners take part in sharing sugar price risks.
Sugar produced from imported raw cane sugar remains an option in years when local sugar prices are high. Cane sugar was produced only in 2009 and 2010, providing processors with a healthy income of about USD 200 per tonne (see Figure 29).
Calculations of marginal incomes and net margins with regard to processing own, purchased and tolling beets, as well as refining cane sugar, are provided in the Annexes to this review.
In 2010/11, the value of sugar production reached about USD 1.67 billion (41 percent higher than the previous season) as a result of increased production and higher sugar prices. However, industry Earnings Before Interest, Taxes, Depreciation and Amortization (EBITDA)declined by about 10 percent due to higher costs (Figure 29).
Figure 29: Comparison of Ukrainian sugar industry sales and EBIDTA in 2006–2010, thousand USD
EBIDTARevenues
0
-500 000
500 000
1 000 000
1 500 000
2 000 000
2006 2007 2008 2009 2010
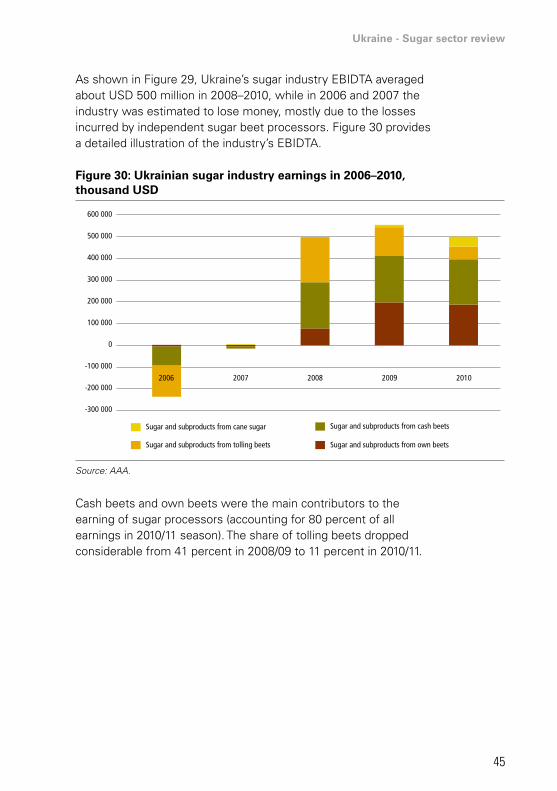
Ukraine - Sugar sector review
45
As shown in Figure 29, Ukraine’s sugar industry EBIDTA averaged about USD 500 million in 2008–2010, while in 2006 and 2007 the industry was estimated to lose money, mostly due to the losses incurred by independent sugar beet processors. Figure 30 provides a detailed illustration of the industry’s EBIDTA.
Figure 30: Ukrainian sugar industry earnings in 2006–2010, thousand USD
-300 000
-200 000
-100 000
0
100 000
200 000
300 000
400 000
500 000
600 000
2006 2007 2008 2009 2010
Sugar and subproducts from own beets
Sugar and subproducts from cash beets
Sugar and subproducts from tolling beets
Sugar and subproducts from cane sugar
Source: AAA.
Cash beets and own beets were the main contributors to the earning of sugar processors (accounting for 80 percent of all earnings in 2010/11 season). The share of tolling beets dropped considerable from 41 percent in 2008/09 to 11 percent in 2010/11.

46
Chapter 5 - Sugar consumption
Sugar plays an important role as a source of food calories in Ukraine, and its consumption is linked to long-standing traditions. Average per capita consumption come from sugar and sweeteners is about 48 kilograms per year, of which 41 kilograms of sugar (FAOStat, 2009). After a sharp decrease in sugar consumption in early 1990s, sugar consumption bottomed out in 1999 at about 37 kilograms per capita per year, but has subsequently increased. In 2009, sugar accounted for 14 percent of the total estimated food calorie supply of 3 200 Kcal/day per person. Sugar was the second most important source of calories after wheat (26 percent) outpacing vegetable oils, potatoes, dairy products, meat and other products.
The 2002 Joint WHO/FAO Expert Consultation recommendations stated that the consumption target of free sugars (all monosaccharides and disaccharides added to foods by the manufacturer, cook or consumer, plus sugars naturally present in honey, syrups and fruit juices) should be less than 10 percent of
Figure 31: Food calorie supply in Ukraine in 2009
Wheat, 26%
Sugar (Raw equivalent), 13%
Vegetable oils, 11%
Milk excluding butter, 8%
Potatoes, 8%
Meat, 7%
Alcoholic beverages, 5%
Vegetables, 4%
Animal fats, 3%
Beverages, alcoholic, 3%
Fruits excluding wine, 2%Other products, 11%
Source: FAO Stat.
Note: 3 200 Kcal/day/cap =100%

Ukraine - Sugar sector review
47
the population’s total energy intake.15 In 2010–2011, the Government of Ukraine assessed actual sugar consumption as “sufficient” at 38.5 kilograms per capita per year, as compared with the so-called rational norm of 38 kilograms per capita per year.16 Therefore, it is very likely that the country’s nutrition and food policy will be aimed at facilitating the consumption of meat, fish, fruits and other products not considered sufficient by the government.
The direct human consumption of sugar in Ukraine accounts for 60–65 percent of total sugar consumption (with the latter including use in the food processing industry). The confectionary industry accounts for 24 percent of sugar use, while non-alcoholic beverage producers use about 4 percent. Other food products contribute to the remaining demand for sugar (Figure 32).
Figure 32: Consumption of sugar in Ukraine in 2009–2010, %
Population 63%
Other 4% Bread and bakery products 1%
Alcoholic drinks 1%
Dairy products 3%
Non alcoholic drinks 4%
Confectionary 24%
Sugar consumption by the food processing and beverage industry is more stable than direct human consumption. However, the former also declined during the 2008/09 marketing year when demand decreased both locally and internationally.
15 The Joint WHO/FAO Expert Consultation on diet, nutrition and the prevention of chronic diseases: Process, product and policy implications (www.who.int/nutrition/publications/public_health_nut9.pdf).
16 ЗВІТ про стан продовольчої безпеки України у 2011 році [Report on the state of food security in Ukraine in 2011] published by the Ministry of Economic Development and Trade of Ukraine (in Ukrainian).

48
Sugar consumption seasonality
The high seasonality of sugar consumption in Ukraine, which runs counter to the sugar production season, is yet another challenge for the industry, as it must maintain significant inventories until June–September (e.g. the end of the sugar marketing year). Sugar supply on the market is highest in October–January while consumption is highest in June–September, when sugar stocks are lowest. Therefore, many consumers buy sugar in the autumn to use the following summer.
As can be seen from Figure 33, monthly sugar consumption varies from 60 000 tonnes in February to 400 000 tonnes in September. In 2009/10 and 2010/11, the seasonality of sugar consumption was lower than usually due to decreased consumption for home canning. Sugar consumption by the food processing industry does not have a distinct seasonal pattern.
Consumption of by-products
Beet pulp and molasses are two key sub-products of sugar production in Ukraine. Table 7 provides an estimated output for both products in 2006–2010.
Figure 33: Monthly sugar consumption in Ukraine in 2006–2011, tonnes
AugJulyJuneMayAprMarFebJanDecNovOctSept0
50 000
100 000
150 000
200 000
250 000
300 000
350 000
400 000
450 000
2010/112009/102008/92007/82006/7
Source: AAA based on State Statistics Service of Ukraine.

Ukraine - Sugar sector review
49
Table 7: Production of beet pulp and molasses in Ukraine in 2006–2010
2006/2007 2007/2008 2008/2009 2009/2010 2010/2011
Beet pulp 16 639.5 12 658.2 9 691.6 7 319.3 10 359.0
Molasses 879.1 668.7 512.0 386.7 547.3
Source: AAA based on industry sources.
Beet pulp is used as a feed component. Key consumers of beet pulp are feed mills, cattle and dairy farms, and, more rarely, pig farms. The demand for beet pulp in Ukraine is unstable and depends on the region. In some regions, sugar plants simply dump the pulp, as the costs of drying, granulating and transportation are not cost-effective in the feed market. Therefore, about 40–50 percent of beet pulp in estimated to be wasted, causing damage to the environment. Its utilization for biogas and ethanol production largely depends on energy prices, which have not yet facilitated rapid development of energy generation from beet pulp in Ukraine (Table 8).
Molasses is also used as a feed component, but in addition is used by the confectionary, alcohol and distillery industries (Table 9).
Table 8: Beet pulp consumption in Ukraine in 2006–2010
consumers %
Feed mills 55.0
Livestock farms 45.0
Source: AAA based on industry sources.
Table 9. Molasses consumption in Ukraine in 2006–2010
consumers %
Confectionary 35.0
Alcohol producers 30.0
Feed mills 20.0
Livestock farms 15.0
Source: AAA based on industry sources.

50
Chapter 6 - Exports and imports
Ukraine has been largely a net importer of sugar in recent years. However, the country remains a net exporter of sugar once sugar-containing products are accounted for in trade flow analysis. Its positive trade balance in the category of sugar and sugar-containing products, including those with cocoa, averaged USD 400 million in 2006–2010, and reached USD 460 million in 2010/11 (see Figure 34).
As Figure 34 shows, the value of trade has grown rapidly. In 2006–2010, imports increased 3.5 times and exports grew by 92 percent. Both declined in 2008/09 in response to decreased demand, as a result of the financial crisis, but then quickly rebounded the following marketing year. Although imports grew faster than exports in percentage terms, the total trade balance in sugar and sugar-containing products continued to improve.
Brazil is the largest exporter of sugar to Ukraine, thanks to its supplies of raw cane sugar. Belarus was the second largest due to
Figure 34: Imports, exports and trade balance of sugar and sugar-containing products, including these with cocoa in 2006–2010, thousand USD
Trade balanceImports
0
100 000
200 000
300 000
400 000
500 000
600 000
700 000
800 000
900 000
1 000 000
2010/112009/102008/92007/82006/7
Exports
Source: Based on Ukraine’s customs data.
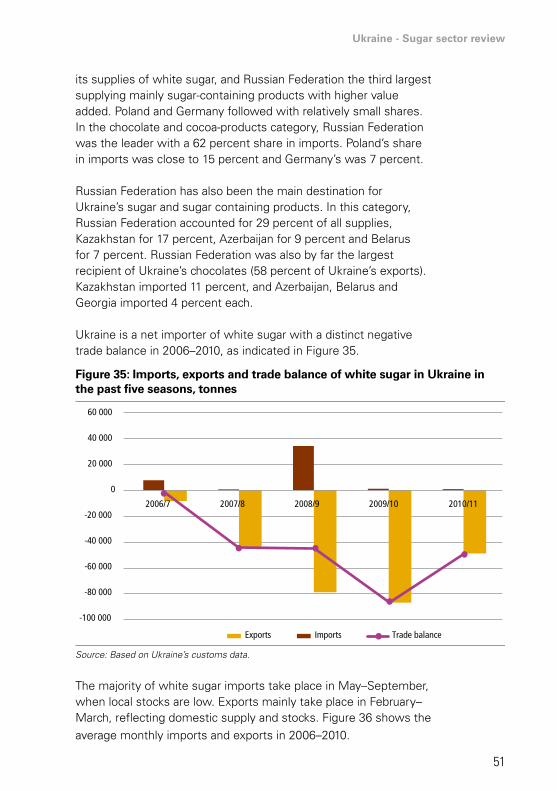
Ukraine - Sugar sector review
51
its supplies of white sugar, and Russian Federation the third largest supplying mainly sugar-containing products with higher value added. Poland and Germany followed with relatively small shares. In the chocolate and cocoa-products category, Russian Federation was the leader with a 62 percent share in imports. Poland’s share in imports was close to 15 percent and Germany’s was 7 percent.
Russian Federation has also been the main destination for Ukraine’s sugar and sugar containing products. In this category, Russian Federation accounted for 29 percent of all supplies, Kazakhstan for 17 percent, Azerbaijan for 9 percent and Belarus for 7 percent. Russian Federation was also by far the largest recipient of Ukraine’s chocolates (58 percent of Ukraine’s exports). Kazakhstan imported 11 percent, and Azerbaijan, Belarus and Georgia imported 4 percent each.
Ukraine is a net importer of white sugar with a distinct negative trade balance in 2006–2010, as indicated in Figure 35.
The majority of white sugar imports take place in May–September, when local stocks are low. Exports mainly take place in February–March, reflecting domestic supply and stocks. Figure 36 shows the average monthly imports and exports in 2006–2010.
Figure 35: Imports, exports and trade balance of white sugar in Ukraine in the past five seasons, tonnes
Trade balanceImportsExports
-100 000
-80 000
-60 000
-40 000
-20 000
0
20 000
40 000
60 000
2010/112009/102008/92007/82006/7
Source: Based on Ukraine’s customs data.

52
About 97 percent of all white sugar in 2006–2010 was imported from Belarus and 2 percent from Kazakhstan. White sugar was exported mainly to Kyrgyzstan (52 percent), Moldova (11 percent) and Uzbekistan (9 percent). Other importers included Georgia, Kazakhstan, Russian Federation and Tajikistan.
There were no significant imports of raw cane sugar to Ukraine in 2006/07–2008/09. Only in 2009/10 and 2010/11 did imports increase sharply, reflecting demand and import TRQ utilization.
Figure 36: Average monthly imports, exports and trade balance of white sugar in Ukraine in 2006–2010, tonnes
-10 000
-8 000
-6 000
-4 000
-2 000
0
2 000
4 000
AugJulyJuneMayAprMarFebJanDecNovOctSept
Average trade balanceAverage importsAverage exports
Source: Based on Ukraine’s customs data.
Figure 37: Monthly imports of raw cane sugar to Ukraine in 2006–2011, tonnes
0
20 000
40 000
60 000
80 000
100 000
120 000
180 000
160 000
180 000
AugJulyJuneMayAprMarFebJanDecNovOctSept
2010/112009/102008/92007/82006/7
Source: Based on Ukraine’s customs data.

Ukraine - Sugar sector review
53
Most of the raw cane raw sugar was supplied from Brazil with much smaller quantities imported from Argentina, Cuba and Guatemala.
Ukraine is a large net exporter of sugar-containing confectionary products, despite frequent import trader barriers in the Russian Federation, the main destination country. Figure 38 shows the trade balance for sugar-containing confectionary.
For the most part, exports and imports of these products are not linked to specific seasons. However, the long holiday period in January causes declines in both imports and exports.
Figure 38: Imports, exports and trade balance of sugar-containing confectionary products in Ukraine in 2006–2010, tonnes
Trade balanceImportsExports
2010/112009/102008/92007/82006/7
-40 000
-20 000
0
20 000
40 000
60 000
80 000
100 000
120 000
Source: Based on Ukraine’s customs data.
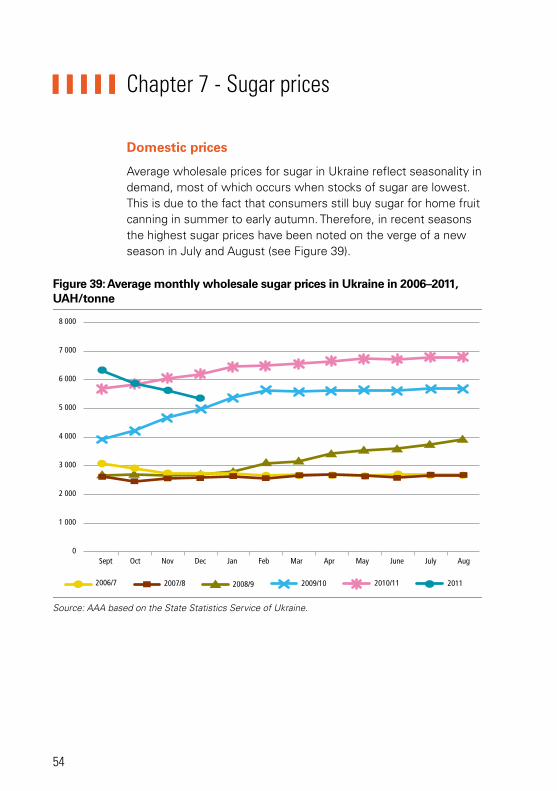
54
Chapter 7 - Sugar prices
Domestic prices
Average wholesale prices for sugar in Ukraine reflect seasonality in demand, most of which occurs when stocks of sugar are lowest. This is due to the fact that consumers still buy sugar for home fruit canning in summer to early autumn. Therefore, in recent seasons the highest sugar prices have been noted on the verge of a new season in July and August (see Figure 39).
Figure 39: Average monthly wholesale sugar prices in Ukraine in 2006–2011, UAH/tonne
0
1 000
2 000
3 000
4 000
5 000
6 000
7 000
8 000
AugJulyJuneMayAprMarFebJanDecNovOctSept
20112010/112009/102008/92007/82006/7
Source: AAA based on the State Statistics Service of Ukraine.
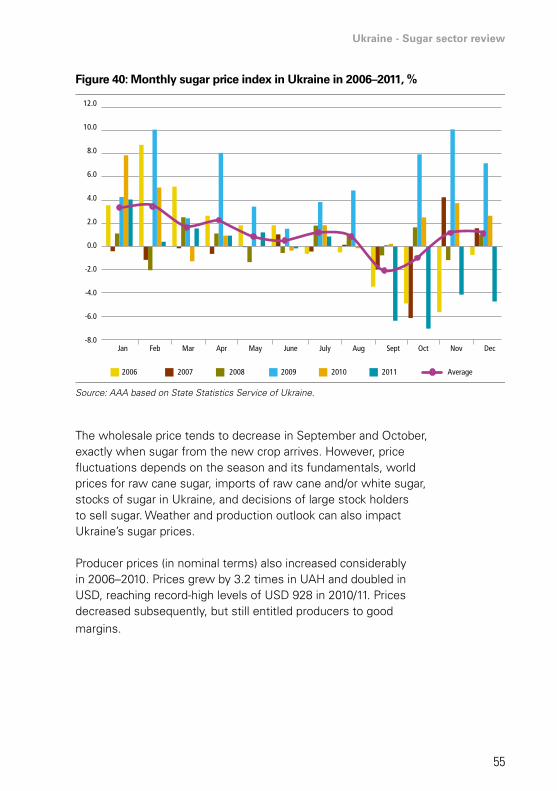
Ukraine - Sugar sector review
55
The wholesale price tends to decrease in September and October, exactly when sugar from the new crop arrives. However, price fluctuations depends on the season and its fundamentals, world prices for raw cane sugar, imports of raw cane and/or white sugar, stocks of sugar in Ukraine, and decisions of large stock holders to sell sugar. Weather and production outlook can also impact Ukraine’s sugar prices.
Producer prices (in nominal terms) also increased considerably in 2006–2010. Prices grew by 3.2 times in UAH and doubled in USD, reaching record-high levels of USD 928 in 2010/11. Prices decreased subsequently, but still entitled producers to good margins.
Figure 40: Monthly sugar price index in Ukraine in 2006–2011, %
-8.0
-6.0
-4.0
-2.0
0.0
2.0
4.0
6.0
8.0
10.0
12.0
AugJulyJuneMayAprMarFebJan DecNovOctSept
2006 2007 2008 2009 Average20112010
Source: AAA based on State Statistics Service of Ukraine.
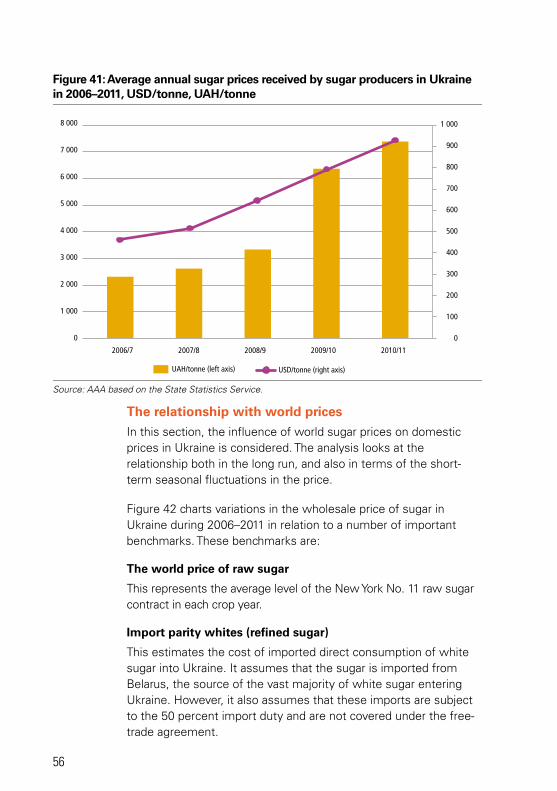
56
The relationship with world pricesIn this section, the influence of world sugar prices on domestic prices in Ukraine is considered. The analysis looks at the relationship both in the long run, and also in terms of the short-term seasonal fluctuations in the price.
Figure 42 charts variations in the wholesale price of sugar in Ukraine during 2006–2011 in relation to a number of important benchmarks. These benchmarks are:
The world price of raw sugar
This represents the average level of the New York No. 11 raw sugar contract in each crop year.
Import parity whites (refined sugar)
This estimates the cost of imported direct consumption of white sugar into Ukraine. It assumes that the sugar is imported from Belarus, the source of the vast majority of white sugar entering Ukraine. However, it also assumes that these imports are subject to the 50 percent import duty and are not covered under the free-trade agreement.
Figure 41: Average annual sugar prices received by sugar producers in Ukraine in 2006–2011, USD/tonne, UAH/tonne
0
1 000
2 000
3 000
4 000
5 000
6 000
7 000
8 000
UAH/tonne (left axis) USD/tonne (right axis)
0
100
200
300
400
500
600
700
800
900
1 000
2010/112009/102008/92007/82006/7
Source: AAA based on the State Statistics Service.

Ukraine - Sugar sector review
57
Import parity raw sugar (TRQ)
As Ukraine permits imports of 267 800 tonnes of raw sugar from WTO members, this benchmark estimates the cost of importing and refining raw sugar from Brazil for the Ukrainian market. It allows for a quality premium of 4.5 percent over the No. 11 contract that Brazilian very high polarization (VHP) sugar, as well as for polarization losses during the refining process. The duty of sugar imported under this quota is just 2 percent.
Import parity raw sugar
Imports of raw sugar outside the quota are subject to the 50 percent duty. This benchmark presents the cost of importing and refining raw sugar outside the quota.
Figure 42: Ukrainian and world sugar prices
0
200
400
600
800
1 000
1 200
2006/07 2007/08 2008/09 2009/10 2010/11
USD
/ton
ne
World No.11 Ukraine wholesale Import parity whitesImport parity raws- TRQ Import parity raws - 50% duty
Source: LMC International.
The following conclusions are evident from the analysis:
• The price of sugar in Ukraine closely follows its import parity equivalent. However, as Figure 42 shows, the basis of this support has switched in recent years from white sugar imports to raw sugar imports under the tariff quota.
• As already outlined earlier, Ukraine did not import raw sugar in 2006/07 and 2007/08, therefore, the domestic price was closely related to the cost of directly importing white sugar.
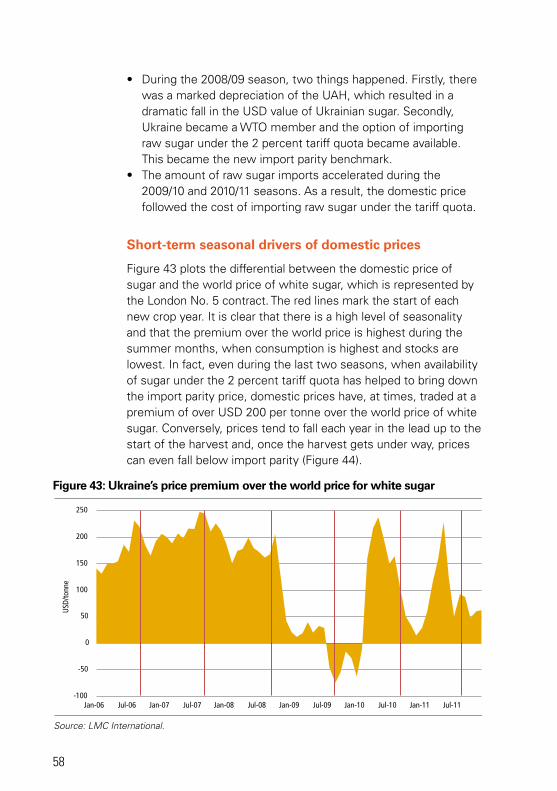
58
• During the 2008/09 season, two things happened. Firstly, there was a marked depreciation of the UAH, which resulted in a dramatic fall in the USD value of Ukrainian sugar. Secondly, Ukraine became a WTO member and the option of importing raw sugar under the 2 percent tariff quota became available. This became the new import parity benchmark.
• The amount of raw sugar imports accelerated during the 2009/10 and 2010/11 seasons. As a result, the domestic price followed the cost of importing raw sugar under the tariff quota.
Short-term seasonal drivers of domestic prices
Figure 43 plots the differential between the domestic price of sugar and the world price of white sugar, which is represented by the London No. 5 contract. The red lines mark the start of each new crop year. It is clear that there is a high level of seasonality and that the premium over the world price is highest during the summer months, when consumption is highest and stocks are lowest. In fact, even during the last two seasons, when availability of sugar under the 2 percent tariff quota has helped to bring down the import parity price, domestic prices have, at times, traded at a premium of over USD 200 per tonne over the world price of white sugar. Conversely, prices tend to fall each year in the lead up to the start of the harvest and, once the harvest gets under way, prices can even fall below import parity (Figure 44).
Figure 43: Ukraine’s price premium over the world price for white sugar
-100
-50
0
50
100
150
200
250
Jan-06 Jul-06 Jan-07 Jul-07 Jan-08 Jul-08 Jan-09 Jul-09 Jan-10 Jul-10 Jan-11 Jul-11
USD
/tonn
e
Source: LMC International.
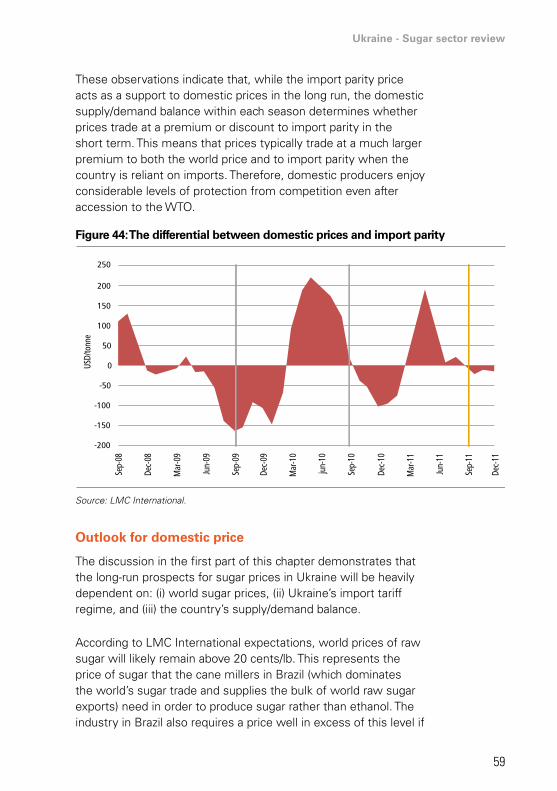
Ukraine - Sugar sector review
59
These observations indicate that, while the import parity price acts as a support to domestic prices in the long run, the domestic supply/demand balance within each season determines whether prices trade at a premium or discount to import parity in the short term. This means that prices typically trade at a much larger premium to both the world price and to import parity when the country is reliant on imports. Therefore, domestic producers enjoy considerable levels of protection from competition even after accession to the WTO.
Outlook for domestic price
The discussion in the first part of this chapter demonstrates that the long-run prospects for sugar prices in Ukraine will be heavily dependent on: (i) world sugar prices, (ii) Ukraine’s import tariff regime, and (iii) the country’s supply/demand balance.
According to LMC International expectations, world prices of raw sugar will likely remain above 20 cents/lb. This represents the price of sugar that the cane millers in Brazil (which dominates the world’s sugar trade and supplies the bulk of world raw sugar exports) need in order to produce sugar rather than ethanol. The industry in Brazil also requires a price well in excess of this level if
Figure 44: The differential between domestic prices and import parity
USD/
tonn
e
Diagram : diffe ent a b tween domestic ices nd import pa ity
-200
-150
-100
-50
0
50
100
150
200
250
Sep-
11
Jun-
11
Mar
-11
Dec-
11
Dec-
10
Sep-
10
jun-
10
Mar
-10
Dec-
09
Sep-
09
Jun-
09
Mar
-09
Dec-
08
Sep-
08
Source: LMC International.

60
it is to expand cane area and milling capacity in its frontier regions to meet future growth in world sugar and ethanol demand. There are, of course, risks that prices could fall below this level. This may happen in the short term in the event of substantial over-supply in the world sugar market. However, it could also occur in the long run if local ethanol prices in Brazil were to fall, which could occur as a result of a substantial and sustained fall in world oil prices or a government subsidy to lower ethanol prices.
Assuming that the 2 percent duty on the tariff quota remains in place and that Ukraine meets the bulk of its import demands through this quota, three world raw sugar price scenarios can be considered: a baseline projection of 21 cents/ b, and a high and low price scenario of 17 cents/lb and 25 cents/ b, respectively. Figure 45 presents the import parity prices associated with each of these world prices.
This analysis suggests that average wholesale prices in Ukraine can be expected to range between around USD 550 and USD 750 per tonne as long as the world price averages between 17–25 cents/ b, as long as local prices trade at import parity level. In the base-case scenario of a world raw sugar price of 21 cents/lb, the import parity price in Ukraine will be around USD 630 per tonne. As previously mentioned, in the short term, there may be times within a year when prices fluctuate around the import parity-level depending on the prevailing domestic supply-demand situation.
Figure 45: Derivation of import parity wholesale price of sugar at three world sugar prices
0
100
200
300
400
500
600
700
800
17 21 25cents/lb cents/lb cents/lb
USD
/tonn
e
Raw sugar price Raw sugar logistics Import tariff Transport costs Refining costs
Source: LMC International.

Ukraine - Sugar sector review
61
Chapter 8 - Policy
Overall policy context
The strategic goals of agricultural policy in Ukraine, as defined in the Law of Ukraine on the Basic Principles of the State Agrarian Policy up to 2015, adopted in 2006,17 are: (i) to ensure the country’s food security, (ii) transform agriculture into a highly efficient and competitive sector of the economy; (iii) protect the Ukrainian peasants as carriers of national identify, culture and spirit; and (iv) to provide for the complex development of areas of rural territory.
The State Result-based Programme for Rural Development until 201518 (adopted in 2007) is rather declarative and focuses on assuring production targets as opposed to market-based development goals. For instance, the programme envisages production of 25 million tonnes of sugar beets by 2015. However, it does not provide information on how the current demand of 1.75 million tonnes would absorb 2.75 million tonnes of sugar production under conditions of limited export market access.
The main agricultural policy measures in Ukraine comprise tax concession (including the unified agricultural tax vs. company profit tax, value-added tax (VAT) retaining by farmers, waiver on social payments, etc.), interest rate subsidies for farmers, input subsidies, per head payments (in the livestock sector) or per hectare payments for crops.
In 2010, agricultural enterprises received subsidies of UAH 1.3 billion (an increase of about 80 percent compared to 2009) in the form of budget expenditures and support, and UAH 3.3 billion (about 30 percent more than in 2009) through tax concessions. The major part of this support was dedicated to support crop production (UAH 2.3 billion) and the development of animal production (UAH 1.8 billion).19
17 http://zakon4.rada.gov.ua/laws/show/2982-15 (in Ukrainian). 18 http://zakon4.rada.gov.ua/laws/show/1158-2007-%D0%BF (in Ukrainian). 19 The agri-food sector in Ukraine: Current situation and market outlook until 2025,
available at: http://ftp.jrc.es/EURdoc/JRC71776 pdf.

62
The majority of support for plant production, including sugar beets, is provided through the unified agricultural tax, which allows agricultural producers to pay only one agricultural tax. This is paid once per year and amounts to 0.5 percent of the nominal value of agricultural land used. To qualify for this simplified taxation system, agricultural produces should receive more than 75 percent of revenue from agricultural production. This tax concession has enabled producers to attract capital from other sectors of the economy and has facilitated the formation of agricultural holdings.
Another major tax concession is the VAT refund. The VAT payable by agricultural producers is accumulated at special accounts and can be used by them to purchase agricultural inputs. This also facilitates the development of a legal inputs and services market, as these accounts are monitored by banks and tax authorities.
Agricultural producers may also receive part of the interest (in some cases up to 50 percent of interest due) paid to commercial banks compensated from the State Budget. Prior to the financial crisis in 2008/2009 this was a widely used subsidy programme. However, the government subsequently imposed new qualification requirements and limited the availability of funding for this programme.
The combined agricultural policies, inclusive budgetary support programmes, foregone tax revenues/concessions, government services (education, research, etc.), tariff and non-tariff barriers (as described below) can be described from a producer’s perspective by a set of policy indicators. The common element to all these policies is that they generate transfers to farmers.20 One of these indicators, which can be used measure the level of transfers to producers, is the Producer Single Commodity Transfers (SCT).21
Ukrainian consumers and taxpayers have provided generous, increasing support to sugar producers as compared with producers of grain, oilseeds, milk and beef. Only pork producers received more transfers from consumers and governments in Ukraine
20 For a more detailed explanation of agricultural policies and support, please refer to: www oecd.org/tad/agriculturalpoliciesandsupport/psemanual.htm.
21 Producer Single Commodity Transfers (producer SCT): the annual monetary value of gross transfers from consumers and taxpayers to agricultural producers, measured at the farm gate level, arising from policies linked to the production of a single commodity (OECD, PSE Manual 2010).
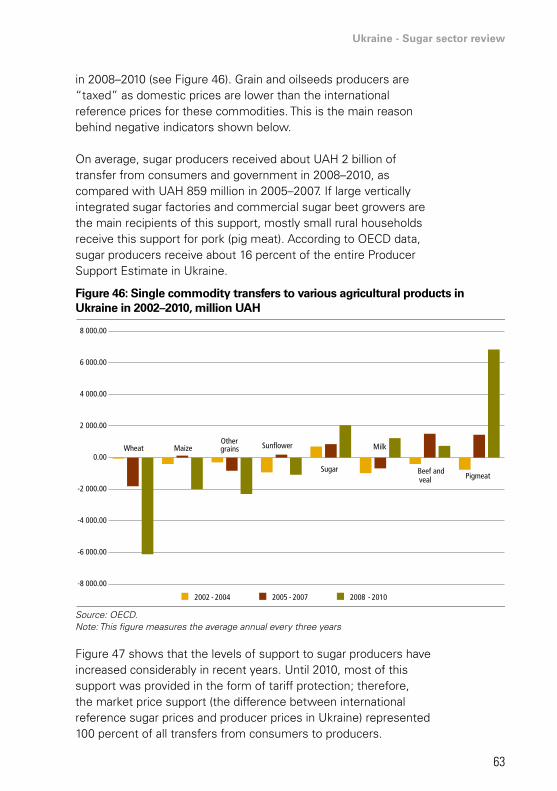
Ukraine - Sugar sector review
63
in 2008–2010 (see Figure 46). Grain and oilseeds producers are “taxed” as domestic prices are lower than the international reference prices for these commodities. This is the main reason behind negative indicators shown below.
On average, sugar producers received about UAH 2 billion of transfer from consumers and government in 2008–2010, as compared with UAH 859 million in 2005–2007. If large vertically integrated sugar factories and commercial sugar beet growers are the main recipients of this support, mostly small rural households receive this support for pork (pig meat). According to OECD data, sugar producers receive about 16 percent of the entire Producer Support Estimate in Ukraine.
Figure 47 shows that the levels of support to sugar producers have increased considerably in recent years. Until 2010, most of this support was provided in the form of tariff protection; therefore, the market price support (the difference between international reference sugar prices and producer prices in Ukraine) represented 100 percent of all transfers from consumers to producers.
Figure 46: Single commodity transfers to various agricultural products in Ukraine in 2002–2010, million UAH
8 000.00
6 000.00
4 000.00
2 000.00
0.00
-2 000.00
-4 000.00
-6 000.00
-8 000.00
Wheat
Maize
Other grains Sunflower
Sugar
Milk
Beef and veal Pigmeat
2002 - 2004 2005 - 2007 2008 - 2010
Source: OECD.Note: This figure measures the average annual every three years
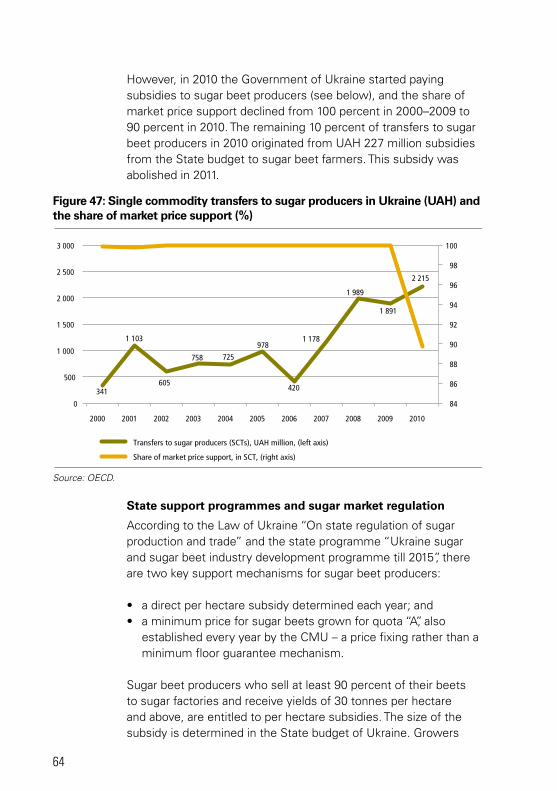
64
However, in 2010 the Government of Ukraine started paying subsidies to sugar beet producers (see below), and the share of market price support declined from 100 percent in 2000–2009 to 90 percent in 2010. The remaining 10 percent of transfers to sugar beet producers in 2010 originated from UAH 227 million subsidies from the State budget to sugar beet farmers. This subsidy was abolished in 2011.
State support programmes and sugar market regulation
According to the Law of Ukraine “On state regulation of sugar production and trade” and the state programme “Ukraine sugar and sugar beet industry development programme till 2015”, there are two key support mechanisms for sugar beet producers:
• a direct per hectare subsidy determined each year; and• a minimum price for sugar beets grown for quota “A”, also
established every year by the CMU – a price fixing rather than a minimum floor guarantee mechanism.
Sugar beet producers who sell at least 90 percent of their beets to sugar factories and receive yields of 30 tonnes per hectare and above, are entitled to per hectare subsidies. The size of the subsidy is determined in the State budget of Ukraine. Growers
Figure 47: Single commodity transfers to sugar producers in Ukraine (UAH) and the share of market price support (%)
341
1 103
605
758
725
978
420
1 178
1 989
1 891
2 215
84
86
88
90
92
94
96
98
100
0
500
1 000
1 500
2 000
2 500
3 000
2000 2001 2002 2003 2004 2005 2006 2007 2008 2009 2010
Transfers to sugar producers (SCTs), UAH million, (left axis)
Share of market price support, in SCT, (right axis)
Source: OECD.

Ukraine - Sugar sector review
65
who obtain beet yields of 35–40 tonnes per hectare are entitled to a 10 percent premium to the subsidy; more than 40 tonnes/ha yields are subject to a 20 percent premium. In recent years these nominal subsidies averaged UAH 500–1 000 per hectare, although they have not always been paid in full due to the deficit of the State budget. In 2011, the government abolished these subsidies.
Quota “A” is the maximum quantity of sugar to be supplied to the local market from 1 September through 31 August of the following year. Quota “A” is established every year by the CMU and is allocated among producers through a competitive process no later than 1 January of the current year. All trade operations with quota “A” sugar must be registered.
The minimum sugar beet price is the lowest limit of price sugar producers are allowed to pay per tonne of sugar beets to their suppliers. The minimum prices for beets and for quota “A” sugar are determined by CMU every year based on the suggestions of the Ministry of Agricultural Policy and Food of Ukraine. The official monthly inflation index is applied to the minimum sugar price. If the market situation changes during the marketing year, the CMU is allowed to make modifications to the established minimum sugar price during the year.
For the 2011/12 marketing year, the minimum price of sugar was established at UAH 4 925 per tonne, which was 16 percent higher than in 2010/11. Actual market prices can be lower as there is no effective enforcement mechanism. The same is true for the minimum price of sugar beets, which was established at UAH 339 per tonne in the same year. Quota “A” was established at 1.86 million tonnes in 2011/12 as compared with 1.82 million tonnes in the previous season.
According to the Sugar Industry Development Programme until 2015, the State Agricultural Fund must procure 10 percent of quota “A” sugar for intervention reserves in order to support prices above the declared minimum level. However, the funds procure about 100 000 tonnes per year.
Only legally registered entrepreneurs and legal entities can operate in the retail trade of sugar. The CMU determines quarterly and monthly sales volumes of sugar to prevent significant

66
price fluctuations. All legal entities involved in the production, distribution, wholesale or retail sugar trade must report stocks to the government on a monthly basis.
Tariff and non-tariff barriers to trade
Ukraine limits imports of white sugar through prohibitively high import duties of 50 percent ad valorem and imports of raw cane sugar through the TRQ system. Imports of raw cane sugar outside of TRQ are also subject to 50 percent import duty. Law No. 404�V “On the Establishment of the Tariff Quota for Importation into Ukraine of Raw Cane Sugar” of 30 November 2006 established an annual TRQ for raw cane sugar of 260 000 tonnes from the date of WTO accession within 2 percent of the TRQ tariff. The total annual quota volume of 260 000 tonnes was allocated exclusively among WTO Members. Two years after WTO accession, the tariff-rate quota increased by 3 900 tonnes annually, up to 267 800 tonnes. Companies interested in importing raw cane sugar need to apply for an import license. In practice, provision of such licenses can be a very bureaucratic process, taking too much time and limiting the processing season for sugar production.
Ukraine has a free trade agreement with CIS countries; however, sugar is largely excluded from these agreements. The section on price analysis above aims to provide a good understanding of market price gaps between Ukraine and international reference prices.
In order to illustrate the level of protection in different sugar producing countries, the review used the Producer Nominal Protection Coefficient (NPC).22 This indicator, as reported by OECD for the EU, Brazil, Russian Federation, Ukraine and the United States, is illustrated in Figure 48.
22 The Producer NPC is the ratio between the average price received by producers at the farm gate (including payments per tonne) and the border price, measured at the farm gate. NPC shows the level of domestic market protection. A producer NPC of 1.2 for a country indicates that domestic producer prices are on average 20 percent above border prices for the same commodity. A producer NPC of 1 indicates that prices received by producers are on average the same as border prices.
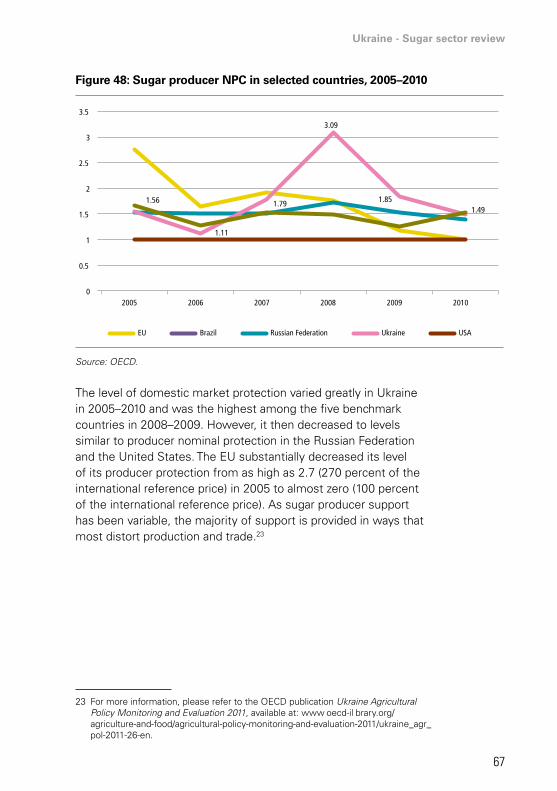
Ukraine - Sugar sector review
67
Figure 48: Sugar producer NPC in selected countries, 2005–2010
1.56
1.11
1.79
3.09
1.85
1.49
0
0.5
1
1.5
2
2.5
3
3.5
2005 2006 2007 2008 2009 2010
EU Brazil Russian Federation Ukraine USA
Source: OECD.
The level of domestic market protection varied greatly in Ukraine in 2005–2010 and was the highest among the five benchmark countries in 2008–2009. However, it then decreased to levels similar to producer nominal protection in the Russian Federation and the United States. The EU substantially decreased its level of its producer protection from as high as 2.7 (270 percent of the international reference price) in 2005 to almost zero (100 percent of the international reference price). As sugar producer support has been variable, the majority of support is provided in ways that most distort production and trade.23
23 For more information, please refer to the OECD publication Ukraine Agricultural Policy Monitoring and Evaluation 2011, available at: www oecd-il brary.org/agriculture-and-food/agricultural-policy-monitoring-and-evaluation-2011/ukraine_agr_pol-2011-26-en.
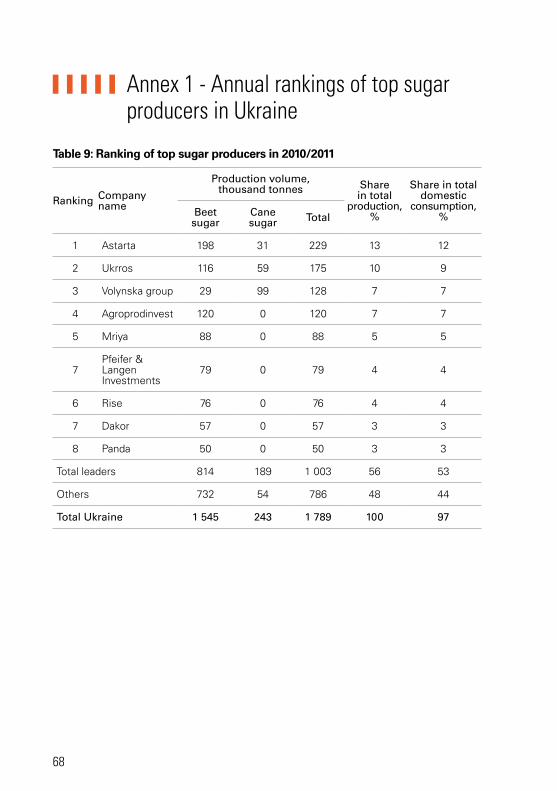
68
Annex 1 - Annual rankings of top sugar producers in Ukraine
Table 9: Ranking of top sugar producers in 2010/2011
ranking companyname
Production volume, thousand tonnes share
in total production,
%
share in total domestic
consumption, %Beet
sugarcanesugar total
1 Astarta 198 31 229 13 12
2 Ukrros 116 59 175 10 9
3 Volynska group 29 99 128 7 7
4 Agroprodinvest 120 0 120 7 7
5 Mriya 88 0 88 5 5
7Pfeifer & Langen Investments
79 0 79 4 4
6 Rise 76 0 76 4 4
7 Dakor 57 0 57 3 3
8 Panda 50 0 50 3 3
Total leaders 814 189 1 003 56 53
Others 732 54 786 48 44
total Ukraine 1 545 243 1 789 100 97

Ukraine - Sugar sector review
69
Table 10: Ranking of top sugar producers in 2009/2010
ranking company name
Production volume, thousand tonnes share
in total production,
%
share in total domestic
consumption, %Beet
sugarcanesugar total
1 Astarta 225 0 225 15 12
2 Ukrros 130 62 192 13 10
3 Volynska group 4 130 134 9 7
4 Agroprodinvest 103 0 103 7 5
5 Rise 101 0 101 7 5
6 Mriya 75 0 75 5 4
7 Dakor 47 0 47 3 2
Total leaders 686 192 878 60 45
Others 587 0 587 40 30
total Ukraine 1 269 192 1 461 100 75

70
Table 11: Ranking of top sugar producers in 2008/2009
ranking company nameBeet sugar production,
thousand tonnes
share in total production, %
share in total domestic
consumption, %
1 Astarta 217 14 12
2 Ukrros 199 13 11
3 Agroprodinvest 111 7 6
4 Rise 101 6 5
5 Dakor 88 6 5
6 Mriya 63 4 3
7 Volynska group 44 3 2
Total leaders 823 53 44
Others 745 47 40
total Ukraine 1568 100 85

Ukraine - Sugar sector review
71
Table 12: Ranking of top sugar producers in 2007/2008
ranking company nameBeet sugar production,
thousand tonnes
share in total production, %
share in total domestic
consumption, %
1 Ukrros 173 9 9
2 UPK 159 9 9
3 Astarta 155 8 8
4 Investagroproduct (Agroprodinvest) 135 7 7
5 Euroservice-Ukraine 123 7 7
6 Dakor 108 6 6
7 Rise 69 4 4
8 Volynska group 61 3 3
Total leaders 983 53 53
Others 878 47 47
total Ukraine 1 860 100 101

72
Table 13: Ranking of top sugar producers in 2006/2007
ranking company nameBeet sugar production,
thousand tonnes
share in total production, %
share in total domestic
consumption, %
1 UPK 302 12 13
2 Ukrros 250 10 11
3 Astarta 157 6 7
4 Euroservice-Ukraine 138 5 6
5 Dakor 103 4 4
6 Insakharprom-K 74 3 3
7 Investagroproduct (Agroprodinvest) 63 2 3
Total leaders 1 088 43 47
Others 1 467 57 64
total Ukraine 2 555 100 111
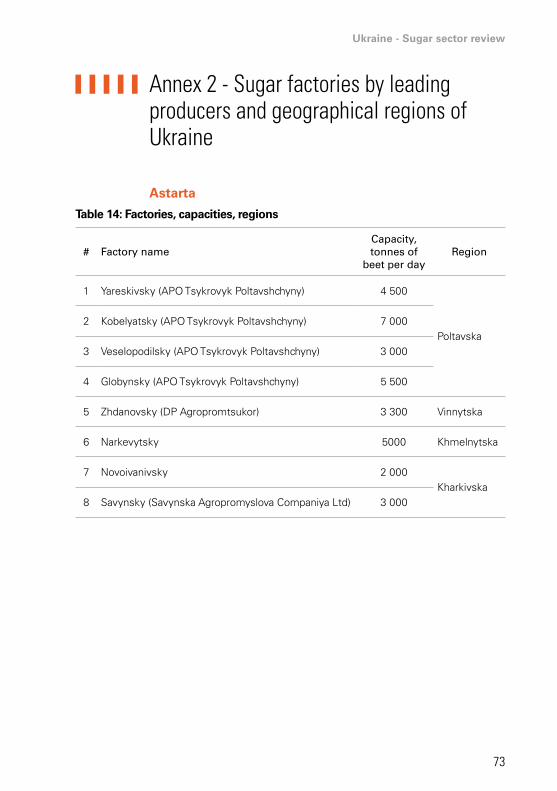
Ukraine - Sugar sector review
73
Annex 2 - Sugar factories by leading producers and geographical regions of Ukraine
Astarta
Table 14: Factories, capacities, regions
# Factory namecapacity, tonnes of
beet per dayregion
1 Yareskivsky (APO Tsykrovyk Poltavshchyny) 4 500
Poltavska2 Kobelyatsky (APO Tsykrovyk Poltavshchyny) 7 000
3 Veselopodilsky (APO Tsykrovyk Poltavshchyny) 3 000
4 Globynsky (APO Tsykrovyk Poltavshchyny) 5 500
5 Zhdanovsky (DP Agropromtsukor) 3 300 Vinnytska
6 Narkevytsky 5000 Khmelnytska
7 Novoivanivsky 2 000Kharkivska
8 Savynsky (Savynska Agropromyslova Companiya Ltd) 3 000

74
Table 15: Sugar production by Astarta’s factories in 2006–2010, thousand tonnes
# Factory name
2006
/200
7
2007
/200
8
2008
/200
9
2009
/201
0
2010
/201
1
1aYareskivsky (APO Tsykrovyk Poltavshchyny) production from raw cane sugar
0 0 0 0 31
1b Yareskivsky (APO Tsykrovyk Poltavshchyny) 44 48 52 60 38
2 Kobelyatsky (APO Tsykrovyk Poltavshchyny) 49 37 53 51 46
3 Veselopodilsky (“APO Tsykrovyk Poltavshchyny) 25 28 35 0 0
4 Globynsky (APO Tsykrovyk Poltavshchyny) 18 21 37 51 42
5 Zhdanovsky (DP Agropromtsukor) 21 22 23 28 38
6 Narkevytsky * * 17 35 34
7 Novoivanivsky * * * * *
8 Savynsky (Savynska Agropromyslova Companiya Ltd) * * * * *
Beet sugar 157 155 217 225 198
Cane sugar 0 0 0 0 31
Total 157 155 217 225 229
share of cane sugar 0 0 0 0 15
*During this period the factory was not part of the holding.

Ukraine - Sugar sector review
75
Figure 49: Map of Astarta’s sugar plants
Ex-Ukrros
Table 16: Factories, capacities, regions
# Factory name capacity, tonnes of beet per day region
1 Palmyrsky 6 000 Cherkaska
2 Chortkivsky 7 800 Ternopilska
3 Gubynykhsky 6 000 Dnipropetrovska
4 Kupyansky 4 000
Kharkivska5 Savynsky* 2 900
7 SHP Tsykrove 3 000
6. Orzhytsky 5 000 Poltavska
*Was part of the holding until 2010/2011.
BLACK SEA
SEA OF AZOV
Yaresky sugar plant
Savynci sugar plant
Veselopodilsky sugar plant
Globino sugar plant
Novoivanivci sugar plant
Kobelyaki sugar plant
Zhdanivsky sugar plant
Narkevichi sugar plant
MOLDAVIA
RUSSIA
BELORUS
POLAND
ROMANIA
HU
NG
ARY
SLO
VAKI
A
SP
SP
SP
SP
SPSP
SP
SP
kharkivPoltava
Vinnytsia
Kyiv
Khmelnytsky

76
Table 17: Sugar production by Ukrros’s factories in 2006–2010, thousand tonnes
# Factory name
2006
/200
7
2007
/200
8
2008
/200
9
2009
/201
0
2010
/201
1
1.a Palmyrsky, production from raw cane sugar 0 0 0 62 59
1.b Palmyrsky 47 36 38 0 0
2 Chortkivsky 65 68 62 59 60
3 Gubynykhsky 55 13 0 0 0
4 Kupyansky 35 23 13 0 0
5 Savynsky 19 12 14 0 0
6 Orzhytsky * * 42 44 22
7 SHP Tsykrove 29 20 31 27 20
Beet sugar 250 173 199 130 102
Cane sugar 0 0 0 62 59
Total 250 173 199 192 161
share of cane sugar 0 0 0 47 58
Figure 50: Map of Ukrros’s sugar plants
BLACK SEA
SEA OF AZOV
Palmira sugar plant
Savyntsi sugar plant
Tsukrove sugar plant
Hubinikha sugar plant
Kupiansk sugar plant
Orzhitsa sugar plant
Chortkiv sugar plant
MOLDAVIA
RUSSIA
BELORUS
POLAND
ROMANIA
HU
NG
ARY
SLO
VAKI
A
SP
SPSP
SP
SP
SPSP
kharkiv
Dnipropetrovsk
Poltava
Cherkasy
Kyiv
Ternopil
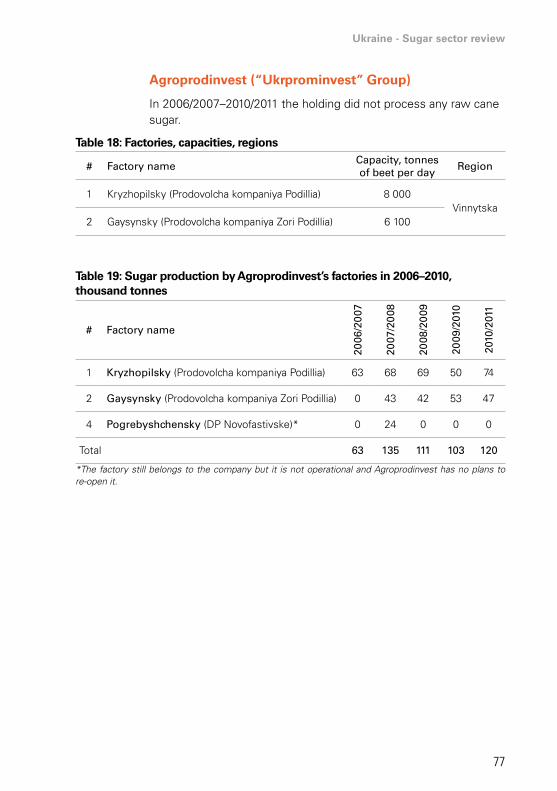
Ukraine - Sugar sector review
77
Agroprodinvest (“Ukrprominvest” Group)
In 2006/2007–2010/2011 the holding did not process any raw cane sugar.
Table 18: Factories, capacities, regions
# Factory namecapacity, tonnes of beet per day
region
1 Kryzhopilsky (Prodovolcha kompaniya Podillia) 8 000Vinnytska
2 Gaysynsky (Prodovolcha kompaniya Zori Podillia) 6 100
Table 19: Sugar production by Agroprodinvest’s factories in 2006–2010, thousand tonnes
# Factory name
2006
/200
7
2007
/200
8
2008
/200
9
2009
/201
0
2010
/201
1
1 Kryzhopilsky (Prodovolcha kompaniya Podillia) 63 68 69 50 74
2 gaysynsky (Prodovolcha kompaniya Zori Podillia) 0 43 42 53 47
4 Pogrebyshchensky (DP Novofastivske)* 0 24 0 0 0
Total 63 135 111 103 120
*The factory still belongs to the company but it is not operational and Agroprodinvest has no plans to re-open it.
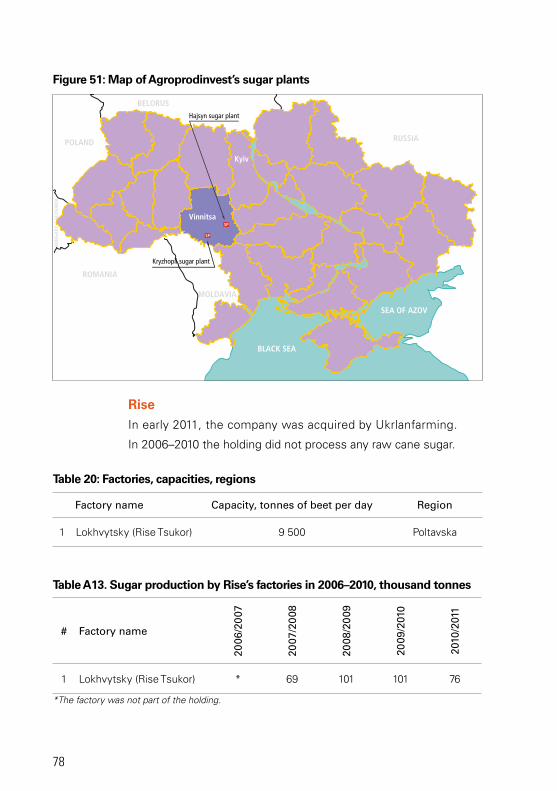
78
Figure 51: Map of Agroprodinvest’s sugar plants
RiseIn early 2011, the company was acquired by Ukrlanfarming.
In 2006–2010 the holding did not process any raw cane sugar.
Table 20: Factories, capacities, regions
Factory name capacity, tonnes of beet per day region
1 Lokhvytsky (Rise Tsukor) 9 500 Poltavska
Table A13. Sugar production by Rise’s factories in 2006–2010, thousand tonnes
# Factory name
2006
/200
7
2007
/200
8
2008
/200
9
2009
/201
0
2010
/201
1
1 Lokhvytsky (Rise Tsukor) * 69 101 101 76
*The factory was not part of the holding.
BLACK SEA
SEA OF AZOV
Hajsyn sugar plant
MOLDAVIA
RUSSIA
BELORUS
POLAND
ROMANIA
HU
NG
ARY
SLO
VAKI
A
SP
SP
Kyiv
Vinnitsa
Kryzhopil sugar plant

Ukraine - Sugar sector review
79
Figure 52: Map of Rise’s sugar plants
MriyaIn 2006–2010 the holding did not process any raw cane sugar.
Table 21: Factories, capacities, regions
# Factory namecapacity,
tonnes of beet per dayregion
1 Borshchovsky (Borshchyv-tsukor) 1 500
Ternopil
2 Khorostkivsky (Khorostkiv-tsukor) 6 000
3 Zbarazhsky (Zbarazh-tsukor) 3 000
4 Lanivetsky (Lanivtsi-tsukor) 3 000
5 Buchachtsky (Buchach-tsukor) 3 000
6 Kozovsky (Kozova-tsukor) 3 000
BLACK SEA
SEA OF AZOV
Lokhvytsia sugar plant
MOLDAVIA
RUSSIA
BELORUS
POLAND
ROMANIA
HU
NG
ARY
SLO
VAKI
A
SP
Kyiv
Poltava
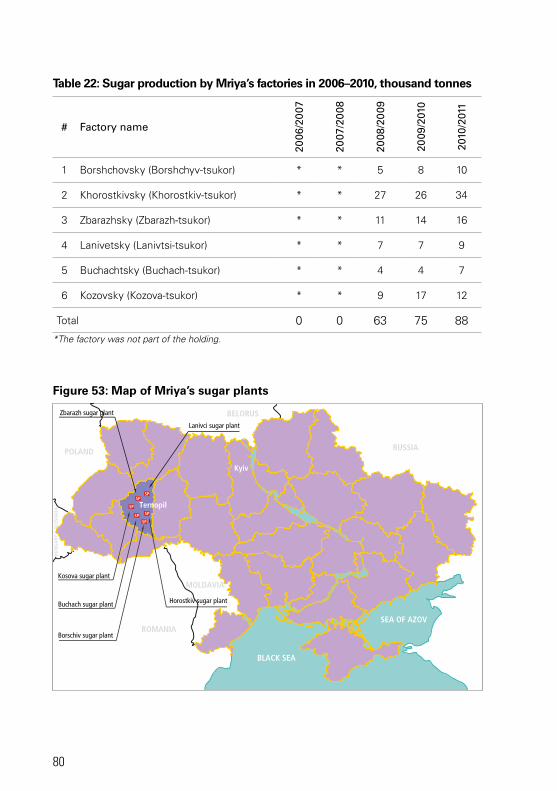
80
Table 22: Sugar production by Mriya’s factories in 2006–2010, thousand tonnes
# Factory name
2006
/200
7
2007
/200
8
2008
/200
9
2009
/201
0
2010
/201
1
1 Borshchovsky (Borshchyv-tsukor) * * 5 8 10
2 Khorostkivsky (Khorostkiv-tsukor) * * 27 26 34
3 Zbarazhsky (Zbarazh-tsukor) * * 11 14 16
4 Lanivetsky (Lanivtsi-tsukor) * * 7 7 9
5 Buchachtsky (Buchach-tsukor) * * 4 4 7
6 Kozovsky (Kozova-tsukor) * * 9 17 12
Total 0 0 63 75 88*The factory was not part of the holding.
Figure 53: Map of Mriya’s sugar plants
BLACK SEA
SEA OF AZOV
Kosova sugar plant
Zbarazh sugar plant
Lanivci sugar plant
Buchach sugar plant
Borschiv sugar plant
Horostkiv sugar plant
MOLDAVIA
RUSSIA
BELORUS
POLAND
ROMANIA
HU
NG
ARY
SLO
VAKI
A
SPSP
SP
SPSP
SP
Kyiv
Ternopil

Ukraine - Sugar sector review
81
DakorIn early 2011 was acquired by Ukrlanfarming.
In 2006–2010 the holding did not process any raw cane sugar.
Table 23: Factories, capacities, regions
# Factory namecapacity, tonnes of
beet per dayregion
1 Du billionensky (Nyva) 4 500Rivnenska
2 Ostrozhsky (NVP Zakhidtsukor) 3 000
3 Kremenetsky (Kremen-tsukor) 3 000 Ternopilska
4 Zolochivsky (Zolochivagro) 3 000 Lvivska
Table 24: Sugar production by Dakor’s factories in 2006–2010, tthousand tonnes
# Factory name
2006
/200
7
2007
/200
8
2008
/200
9
2009
/201
0
2010
/201
1
1 Du billionensky (Nyva) 41 46 46 47 57
2 Ostrozhsky (NVP Zakhidtsukor) 13 16 0 0 0
3 Kremenetsky (Kremen-tsukor) 28 28 24 0 0
4 Zolochivsky (Zolochivagro) 21 17 18 0 0
Total 103 91 70 47 57

82
Figure 54: Map of Dakor’s sugar plants
BLACK SEA
SEA OF AZOV
Zolochiv sugar plant
Ostrozkyi sugar plant
Dubno sugar plant
Kremenets sugar plant
MOLDAVIA
RUSSIA
BELORUS
POLAND
ROMANIA
HU
NG
ARY
SLO
VAKI
A
SP
SP
SP
SP Kyiv
Tern
opil
Lviv
Rivne
Ukrainian Sugar Company
Table 25: Factories, capacities, regions
# Factory namecapacity,
tonnes of beet per dayregion
1 Zasilsky (Ukrainian Sugar Company) 5 000 Mykolaivska
Table 26: Sugar production by USC’s factories in 2006–2010, thousand tonnes
# Factory name
2006
/200
7
2007
/200
8
2008
/200
9
2009
/201
0
2010
/201
1
1 Zasilsky (Ukrainian Sugar Company), production from raw cane sugar * * * 54 16
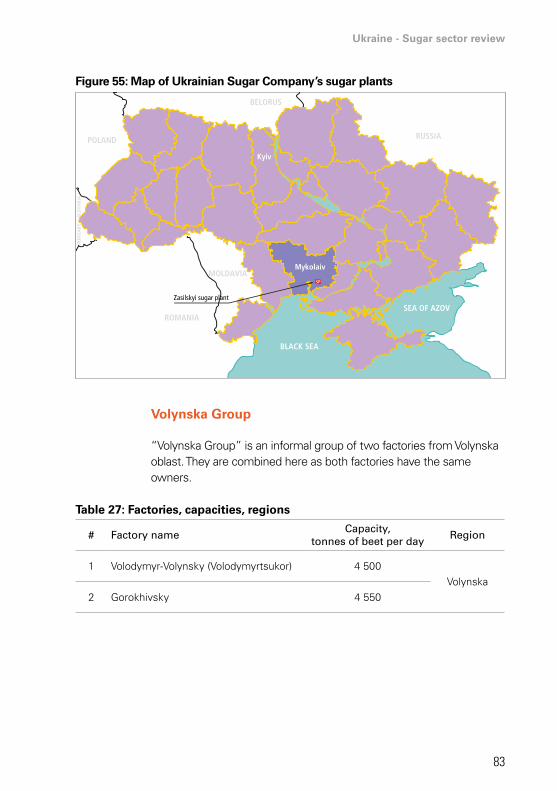
Ukraine - Sugar sector review
83
Figure 55: Map of Ukrainian Sugar Company’s sugar plants
BLACK SEA
SEA OF AZOVZasilskyi sugar plant
MOLDAVIA
RUSSIA
BELORUS
POLAND
ROMANIA
HU
NG
ARY
SLO
VAKI
A
SP
Kyiv
Mykolaiv
Volynska Group
“Volynska Group” is an informal group of two factories from Volynska oblast. They are combined here as both factories have the same owners.
Table 27: Factories, capacities, regions
# Factory namecapacity,
tonnes of beet per dayregion
1 Volodymyr-Volynsky (Volodymyrtsukor) 4 500Volynska
2 Gorokhivsky 4 550

84
Table 28: Sugar production by Volynska group’s factories in 2006–2010, thousand tonnes
# Factory name
2006
/200
7
2007
/200
8
2008
/200
9
2009
/201
0
2010
/201
1
1a Volodymyr-Volynsky (Volodymyrtsukor), production from raw cane sugar 0 0 0 101 31
1b Volodymyr-Volynsky (Volodymyrtsukor) 22 31 15 0 0
1a Gorokhivsky, production from raw cane sugar 0 0 0 29 69
1b Gorokhivsky 28 29 29 4 29
Beet sugar 51 61 44 4 29
Cane sugar 0 0 0 130 99
Total 51 61 44 134 128
Share of cane sugar (%) 0 0 0 97 78
Figure 56: Map of Volyn Group’s sugar plants
BLACK SEA
SEA OF AZOV
Volodymyr-Volynskyi sugar plant
Horokhivskyi sugar plant MOLDAVIA
RUSSIA
BELORUS
POLAND
ROMANIA
HU
NG
ARY
SLO
VAKI
A
SP
SP
Kyiv
Volynska

Ukraine - Sugar sector review
85
Table 30 provides information about the top plants in terms of sugar production during 2006–2010.
Table 29: Top plants in terms of sugar production, 2006–2008
# Plant nametotal production, thousand tonnes
# Plant nametotal production, thousand tonnes
2006/2007 2007/2008
1 Chortkivsky 65 1 Lokhvytsky 69
2 Kryzhopilsky 63 2 Chortkivsky 68
3 Orzhytsky 59 3 Kryzhopilsky 68
4 Lokhvytsky 57 4 Teofipolsky 59
5 Gubynykhsky 55 5 Yareskivsky 48
6 Teofipolsky 54 6 Gnydavsky 47
7 Kobeliatsky 49 7 Dubillionensky 46
8 Palmyrsky 47 8 Gaysynsky 43
9 Radekhivsky 45 9 Radekhivsky 39
10 Yareskivsky 44 10 Kobeliatsky 37
Table 30: Top plants in terms of sugar production, 2008–2010
# Plant nametotal production, thousand tonnes
# Plant nametotal production, thousand tonnes
2008/2009 2009/2010
1 lokhvytsky 101 1 lokhvytsky 101
2 Kryzhopilsky 69 2 radekhivsky 62
3 chortkivsky 62 3 Yareskivsky 60
4 radekhivsky 54 4 chortkivsky 59
5 Kobeliatsky 53 5 gaysynsky 53
6 Yareskivsky 52 6 Kobeliatsky 51
7 du billionensky 46 7 globynsky 51
8 orzhytsky 42 8 Kryzhopilsky 50
9 gaysynsky 42 9 du billionensky 47
10 Palmyrsky 38 10 orzhytsky 44
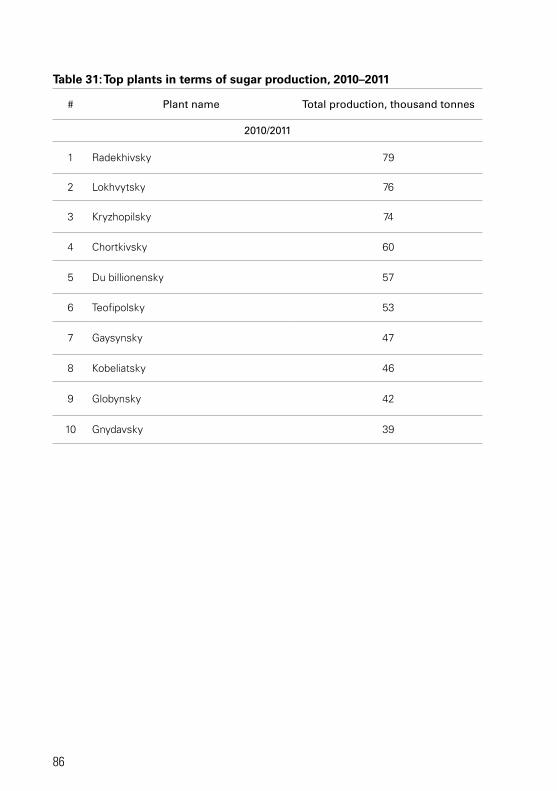
86
Table 31: Top plants in terms of sugar production, 2010–2011
# Plant name total production, thousand tonnes
2010/2011
1 Radekhivsky 79
2 Lokhvytsky 76
3 Kryzhopilsky 74
4 Chortkivsky 60
5 Du billionensky 57
6 Teofipolsky 53
7 Gaysynsky 47
8 Kobeliatsky 46
9 Globynsky 42
10 Gnydavsky 39

Ukraine - Sugar sector review
87
Ukraine - Sugar sector review
87
Annex 3 - Cost and revenues in sugar production from own, purchased, tolling beets and cane sugar refining
Table 32: Costs and revenues of sugar production from the own sugar beets in 2006–2010, UAH/tonne
costs and revenues 2006 2007 2008 2009 2010
Directs costs 1 608 2 484 1 854 2 452 3 401
Indirect cost (fixed) 141 189 179 174 383
Total costs 1 749 2 673 2 033 2 626 3 784
Total costs, USD 346 529 391 328 473
Revenues from sugar 2 323 2 607 3 345 6 327 7 423
Revenues from sub-products 64 199 109 316 153
Total revenues 2 387 2 807 3 454 6 642 7 576
Total revenues, USD 473 556 664 830 947
Marginal incone 780 323 1 600 4 191 4 175
Gross margin, USD 154 64 308 524 522
Net margin 639 134 1 421 4 017 3 792
Net margin, USD 126 26 273 502 474
Marginal income rate, % 48 13 86 171 123
Net margin rate, % 37 5 70 153 100
Source: AAA.

88
Table 33: Costs and revenues of sugar production from the sugar beets bought on the free market in 2006–2010, UAH/tonne
costs and revenues 2006 2007 2008 2009 2010
Directs costs 2 056 2 687 2 984 3 522 4 307
Indirect cost (fixed) 141 189 179 174 383
Total costs 2 197 2 876 31 163 3 696 4 690
Total costs, USD 435 569 608 462 586
Revenues from sugar 2 323 2 607 3 345 6 327 7 423
Revenues from sub-products 64 199 109 316 153
Total revenues 2 387 2 807 3 454 6 642 7 576
Total revenues, USD 473 556 664 830 947
Marginal income 331 20 470 3 120 3 269
Gross margin, USD 66 24 90 390 409
Net margin 190 -69 291 2 946 2 886
Net margin, USD 38 -14 56 368 361
Marginal income rate, % 16 4 16 89 76
Net margin rate, % 9 -2 9 80 62
Source: AAA.
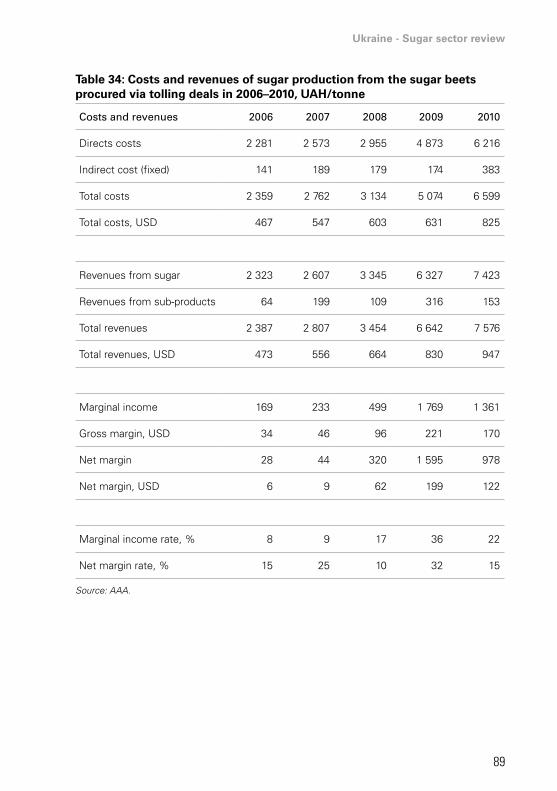
Ukraine - Sugar sector review
89
Table 34: Costs and revenues of sugar production from the sugar beets procured via tolling deals in 2006–2010, UAH/tonne
costs and revenues 2006 2007 2008 2009 2010
Directs costs 2 281 2 573 2 955 4 873 6 216
Indirect cost (fixed) 141 189 179 174 383
Total costs 2 359 2 762 3 134 5 074 6 599
Total costs, USD 467 547 603 631 825
Revenues from sugar 2 323 2 607 3 345 6 327 7 423
Revenues from sub-products 64 199 109 316 153
Total revenues 2 387 2 807 3 454 6 642 7 576
Total revenues, USD 473 556 664 830 947
Marginal income 169 233 499 1 769 1 361
Gross margin, USD 34 46 96 221 170
Net margin 28 44 320 1 595 978
Net margin, USD 6 9 62 199 122
Marginal income rate, % 8 9 17 36 22
Net margin rate, % 15 25 10 32 15
Source: AAA.

90
Table 35: Costs and revenues of sugar production from raw cane sugar in 2006–2010, UAH/tonne
costs and revenues 2006 2007 2008 2009 2010
Directs costs 4 746 5 564
Indirect cost (fixed) 185 220
Total costs 4 949 5 784
Total costs, USD 619 723
Revenues from sugar 6 327 7 423
Revenues from sub-products 18 20
Total revenues 6 345 7 443
Total revenues, USD 793 930
Marginal incone 1 581 1 879
Gross margin, USD 198 235
Net margin 1 581 1 659
Net margin, USD 174 207
Marginal income rate, % 33 34
Net margin rate, % 28 29
Source: AAA.


Please address questions and comments to:Investment Centre DivisionFood and Agriculture Organization of the United Nations (FAO)Viale delle Terme di Caracalla – 00153 Rome, Italy [email protected]://www.fao.org/investment/en
Ukraine: Sugar sector reviewReport No. 11 - October 2013 I347
2E/1
/09.
13
FAO Investment CentreCOUNTRy HIGHLIGHTS
Ukraine
Sugar sector review
Ukrain
e – Su
gar sector review
Rep
ort N
o. 11
imp_cover_UkraineSugar1.indd 1 13/12/13 10.35