faqr, required for the biosynthesis of the …faqr, required for the biosynthesis of the strawberry...
TRANSCRIPT
FaQR, Required for the Biosynthesis of the Strawberry FlavorCompound 4-Hydroxy-2,5-Dimethyl-3(2H)-Furanone, Encodesan Enone Oxidoreductase
Thomas Raab,a,1 Juan Antonio Lopez-Raez,b,1 Dorothee Klein,c,1 Jose Luis Caballero,b Enriqueta Moyano,b
Wilfried Schwab,c,2 and Juan Munoz-Blancob
a Institute of Pharmacy and Food Chemistry, University of Wurzburg, 97074 Wurzburg, Germanyb Departamento de Bioquımica y Biologıa Molecular, Universidad de Cordoba, 14071 Cordoba, Spainc Biomolecular Food Technology, Technical University Munich, 85354 Freising, Germany
The flavor of strawberry (Fragaria 3 ananassa) fruit is dominated by an uncommon group of aroma compounds with a
2,5-dimethyl-3(H)-furanone structure. We report the characterization of an enzyme involved in the biosynthesis of
4-hydroxy-2,5-dimethyl-3(2H)-furanone (HDMF; Furaneol), the key flavor compound in strawberries. Protein extracts were
partially purified, and the observed distribution of enzymatic activity correlated with the presence of a single polypeptide of
;37 kD. Sequence analysis of two peptide fragments showed total identity with the protein sequence of a strongly ripening-
induced, auxin-dependent putative quinone oxidoreductase, Fragaria 3 ananassa quinone oxidoreductase (FaQR). The
open reading frame of the FaQR cDNA consists of 969 bp encoding a 322–amino acid protein with a calculated molecular
mass of 34.3 kD. Laser capture microdissection followed by RNA extraction and amplification demonstrated the presence of
FaQR mRNA in parenchyma tissue of the strawberry fruit. The FaQR protein was functionally expressed in Escherichia coli,
and the monomer catalyzed the formation of HDMF. After chemical synthesis and liquid chromatography–tandem mass
spectrometry analysis, 4-hydroxy-5-methyl-2-methylene-3(2H)-furanone was confirmed as a substrate of FaQR and the
natural precursor of HDMF. This study demonstrates the function of the FaQR enzyme in the biosynthesis of HDMF as enone
oxidoreductase and provides a foundation for the improvement of strawberry flavor and the biotechnological production of
HDMF.
INTRODUCTION
Strawberry (Fragaria 3 ananassa) constitutes a high-value food
crop that is cultivated almost worldwide. The fruit, an aggregate
of numerous ovaries, is composed of the seeds (achenes)
embedded in the epidermis of the swollen receptacle tissue.
Strawberries do not develop properly if seeds have not been
formed (Perkins-Veazie, 1995). The phytohormone auxin is
regarded as the main signal molecule coordinating the growth
and initiation of ripening in strawberry fruit (Perkins-Veazie,
1995). During the early stages of fruit development, the auxins
synthesized in the achenes promote fruit growth, but actual
strawberry ripening is triggered by the decline in the levels of
auxin in the receptacle caused by the cessation of auxin syn-
thesis and transport from the maturing achenes (Perkins-Veazie,
1995). Many metabolic changes take place throughout straw-
berry fruit growth and ripening, such as the degradation of
chlorophyll, the accumulation of anthocyanin, softening, the
metabolism of organic acid and sugars, and the production of
flavor compounds.
Along these lines, several recent studies of the molecular
aspects of strawberry fruit ripening have been performed, deter-
mining the expression patterns of genes encoding already known
enzymes involved in cell wall hydrolysis and softening, including
pectate lyases (Benıtez-Burraco et al., 2003), polygalacturo-
nases (Redondo-Nevado et al., 2001; Aharoni and O’Connell,
2002), pectin methyl esterases (Aharoni and O’Connell, 2002),
cellulases (Harpster et al., 1998; Manning, 1998; Trainotti et al.,
1999), b-galactosidases (Trainotti et al., 2001), and expansins
(Civello et al., 1999; Harrison et al., 2001). In addition, genes
corresponding to flavonoid biosynthesis enzymes that catalyze
steps in the production of anthocyanins in strawberry have been
isolated (Manning, 1998; Moyano et al., 1998; Aharoni et al.,
2002), and the genes encoding enzymes of the lignification path-
way have been cloned and their expression patterns character-
ized throughout fruit development and ripening (Aharoni and
O’Connell, 2002; Blanco-Portales et al., 2002).
Strawberry fruits are consumed for their pleasant flavor as well
as their nutrient content (Hancock, 1999). Strawberry flavor is
extremely popular as part of the fruit or as an added flavoring in
many manufactured foodstuffs (Hancock, 1999). The volatile com-
ponents of strawberry fruit formed during ripening have been
intensively studied, and >360 volatiles have been identified
(Honkanen and Hirvi, 1990; Latrasse, 1991). The relative abundance
1 These authors contributed equally to this work.2 To whom correspondence should be addressed. E-mail [email protected]; fax 49-8161-548-595.The authors responsible for distribution of materials integral to thefindings presented in this article in accordance with the policy describedin the Instructions for Authors (www.plantcell.org) are: Wilfried Schwab([email protected]) and Juan Munoz-Blanco ([email protected]).Article, publication date, and citation information can be found atwww.plantcell.org/cgi/doi/10.1105/tpc.105.039784.
The Plant Cell, Vol. 18, 1023–1037, April 2006, www.plantcell.org ª 2006 American Society of Plant Biologists

of individual volatiles is a fingerprint of a particular cultivar and
species. The relationship between the aroma impact volatiles
and strawberry varieties has been the subject of numerous
investigations (Douillard and Guichard, 1989, 1990; Larsen and
Poll, 1992; Larsen et al., 1992). Because volatiles differ in their
organoleptic properties, relatively few of these are likely to con-
tribute significantly to flavor. By application of the aroma value
concept (i.e., the ratio of concentration to odor threshold), it was
shown that only ;15 odor-active compounds make an impor-
tant contribution to strawberry flavor (Schieberle and Hofmann,
1997). Studies have demonstrated that strawberry aroma is the
result of the combined perception of fruity (ethyl butanoate, ethyl
hexanoate, and methyl 2-methylbutanoat), green (Z-3-hexenal),
sweaty (butanoic acid and 2-methylbutanoic acid), peach-like
(g-decalactone), and caramel-like [4-hydroxy-2,5-dimethyl-
3(2H)-furanone (HDMF; Furaneol) and 2,5-dimethyl-4-methoxy-
3(2H)-furanone (DMMF)] flavor notes (Pyysalo et al., 1979; Larsen
et al., 1992). Among these volatiles, HDMF (Figure 1) is the most
important because of its high concentration (up to 55 mg/kg
strawberry fruit fresh weight) (Larsen et al., 1992) and low
odor threshold (10 ppb) (Schwab and Roscher, 1997).
HDMF was first reported as a product of the Maillard reaction
(Hodge et al., 1963), and it was then isolated from pineapple
(Ananas comosus) (Rodin et al., 1965), strawberry (Ohloff, 1969),
and a number of different fruits (Schwab and Roscher, 1997). The
methyl ether DMMF, first detected in pineapple (Willhalm et al.,
1965), was also identified as an aroma component of a multitude
of fruits, such as overripe strawberry, mango (Mangifera indica),
and arctic bramble (Rubus arcticus) (Roscher et al., 1997;
Schwab and Roscher, 1997). To date, both furanones have
been found only in fruits, being either not present or not detect-
able in roots, stems, leaves, flowers, or other plant parts (Schwab
and Roscher, 1997). In strawberry fruit, HDMF is further metab-
olized to its b-D-glucopyranoside and subsequently to the
malonylated derivative of HDMF glucoside (Figure 1) (Roscher
et al., 1996). Enantiomeric analyses have shown that HDMF and
DMMF occur as racemates in different fruits (Bruche et al., 1991),
and studies of the keto-enol-tautomerism of HDMF have dem-
onstrated its rapid racemization at pH 7.0 (Raab et al., 2003a).
Although exhaustive information regarding strawberry volatile
composition is available, few detailed biochemical and genetic
studies have been done in relation to aroma biosynthesis. Only
recently, it was shown that theSAAT (for strawberry alcohol acyl-
CoA transferase) and FaNES (for Fragaria 3 ananassa nerolidol
synthase) genes are involved in strawberry fruit ester and terpene
formation, respectively (Aharoni et al., 2000, 2004) and that
FaOMT (for Fragaria 3 ananassa O-methyltransferase) encodes
anO-methyltransferase responsible for DMMF biosynthesis (Lavid
et al., 2002; Wein et al., 2002). The first indications for the enzy-
matic formation of HDMF in strawberry fruit were provided by
studies demonstrating the correlation of fruit ripening stage and
HDMF concentration (Sanz et al., 1995). Incorporation experiments
showed that, after the application of 15 different water-soluble,
radioactively labeled substances, D-[U-14C]fructose-1,6-diphos-
phate had the highest incorporation rate into the furanone
structures (Roscher et al., 1998), followed by D-[U-14C]fructose,
D-[U-14C]glucose-6-phosphate, D-[U-14C]glucose, and [2-14C]di-
hydroxyacetone, in decreasing order. Further incorporation ex-
periments with D-[U-13C]fructose proved the transformation of
the complete carbon chain of D-fructose into HDMF (Schwab,
1998), and studies with D-[2-2H]glucose demonstrated the in-
volvement of phosphohexose isomerase in the conversion of
D-glucose to the furanones, thus confirming the proposal that
D-fructose-6-phosphate is a natural precursor of HDMF and
DMMF (Wein et al., 2001). Even though the detailed biogenetic
pathway from D-fructose-1,6-diphosphate to HDMF remained
unknown, all studies have indicated that HDMF is derived from
carbohydrate metabolism.
In this study, we report the isolation and characterization of an
enzyme involved in the transformation of D-fructose-1,6-diphos-
phate to HDMF, one of the key aroma compounds in strawberry
fruit. Sequence homology of the isolated enzyme with the protein
sequence of a recently sequenced cDNA led to the cloning and
characterization of the fruit ripening–induced Fragaria3 ananassa
quinone oxidoreductase gene (FaQR). On the basis of the ob-
served reaction catalyzed by the heterologously expressed
FaQR protein, an unknown intermediate of the HDMF biosyn-
thetic pathway was identified as a natural substrate for the new
enzyme. Gene sequence analyses and determination of expres-
sion patterns, as well as laser capture microdissection (LCM) fol-
lowed by RNA extraction and amplification, prompt us to suggest
that FaQR is the last enzyme in the biosynthetic pathway leading to
HDMF.
Figure 1. Reactions Catalyzed by FaQR and the Metabolism of HDMF in
Strawberry Fruit.
Enzymatic conversion of 4-hydroxy-5-methyl-2-methylene-3(2H)-fura-
none (HMMF) to 4-hydroxy-2,5-dimethyl-3(2H)-furanone (HDMF) and of
(2E)-2-ethylidene-4-hydroxy-5-methyl-3(2H)-furanone (EDHMF) to 2-ethyl-
4-hydroxy-5-methyl-3(2H)-furanone (EHMF).
1024 The Plant Cell
RESULTS
Development of an Assay for the Determination of
HDMF-Forming Activity
A crude protein extract was obtained by homogenizing ripe
strawberry fruit with water after the addition of polyvinylpolypyr-
rolidone in a mixer followed by pH adjustment to 7.0 and two
centrifugation steps. Naturally occurring HDMF was removed by
dialysis (exclusion limit, 10 kD) against a phosphate buffer solu-
tion, pH 7.0. Standard activity assays consisted of the dialyzed
crude strawberry protein extract, D-fructose-1,6-diphosphate,
as HDMF precursor (Roscher et al., 1998) and the reducing agent
NADH, because the conversion involves a reduction step. After
24 h of incubation, a solid-phase extraction was performed and
the products eluted by diethyl ether were analyzed by HPLC-UV
(285 nm), HPLC–diode array detection (DAD), and HPLC–mass
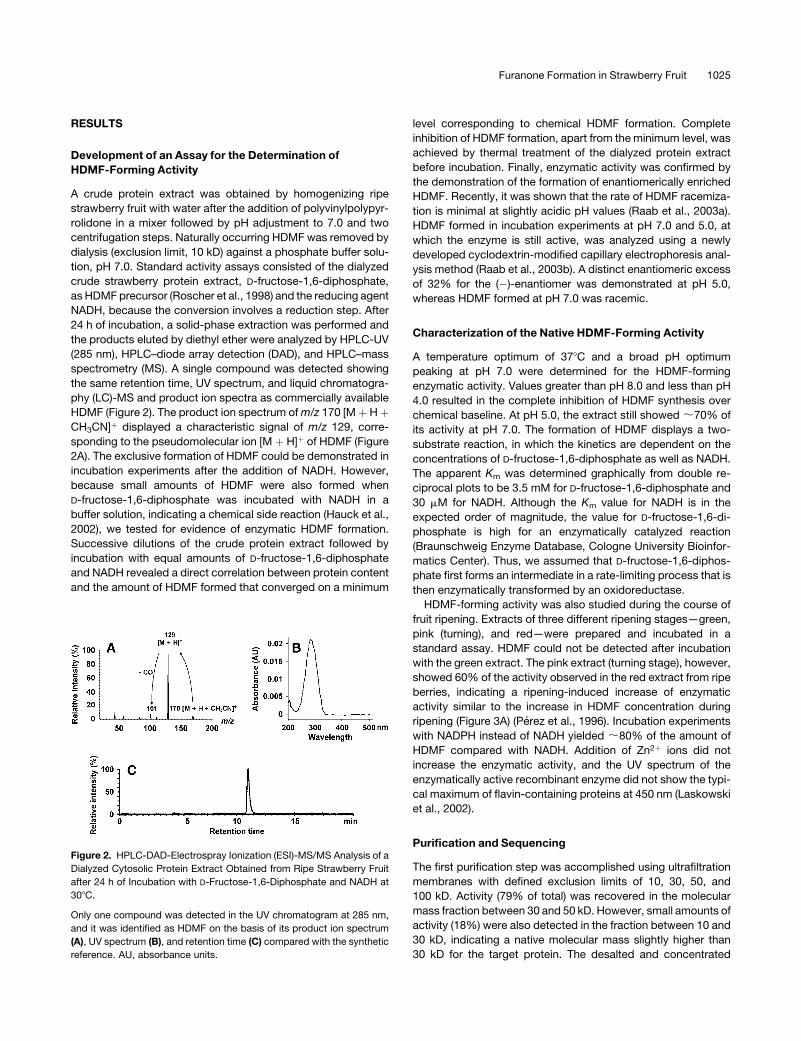
spectrometry (MS). A single compound was detected showing
the same retention time, UV spectrum, and liquid chromatogra-
phy (LC)-MS and product ion spectra as commercially available
HDMF (Figure 2). The product ion spectrum of m/z 170 [M þ H þCH3CN]þ displayed a characteristic signal of m/z 129, corre-
sponding to the pseudomolecular ion [M þ H]þ of HDMF (Figure
2A). The exclusive formation of HDMF could be demonstrated in
incubation experiments after the addition of NADH. However,
because small amounts of HDMF were also formed when
D-fructose-1,6-diphosphate was incubated with NADH in a
buffer solution, indicating a chemical side reaction (Hauck et al.,
2002), we tested for evidence of enzymatic HDMF formation.
Successive dilutions of the crude protein extract followed by
incubation with equal amounts of D-fructose-1,6-diphosphate
and NADH revealed a direct correlation between protein content
and the amount of HDMF formed that converged on a minimum
level corresponding to chemical HDMF formation. Complete
inhibition of HDMF formation, apart from the minimum level, was
achieved by thermal treatment of the dialyzed protein extract
before incubation. Finally, enzymatic activity was confirmed by
the demonstration of the formation of enantiomerically enriched
HDMF. Recently, it was shown that the rate of HDMF racemiza-
tion is minimal at slightly acidic pH values (Raab et al., 2003a).
HDMF formed in incubation experiments at pH 7.0 and 5.0, at
which the enzyme is still active, was analyzed using a newly
developed cyclodextrin-modified capillary electrophoresis anal-
ysis method (Raab et al., 2003b). A distinct enantiomeric excess
of 32% for the (�)-enantiomer was demonstrated at pH 5.0,
whereas HDMF formed at pH 7.0 was racemic.
Characterization of the Native HDMF-Forming Activity
A temperature optimum of 378C and a broad pH optimum
peaking at pH 7.0 were determined for the HDMF-forming
enzymatic activity. Values greater than pH 8.0 and less than pH
4.0 resulted in the complete inhibition of HDMF synthesis over
chemical baseline. At pH 5.0, the extract still showed ;70% of
its activity at pH 7.0. The formation of HDMF displays a two-
substrate reaction, in which the kinetics are dependent on the
concentrations of D-fructose-1,6-diphosphate as well as NADH.
The apparent Km was determined graphically from double re-
ciprocal plots to be 3.5 mM for D-fructose-1,6-diphosphate and
30 mM for NADH. Although the Km value for NADH is in the
expected order of magnitude, the value for D-fructose-1,6-di-
phosphate is high for an enzymatically catalyzed reaction
(Braunschweig Enzyme Database, Cologne University Bioinfor-
matics Center). Thus, we assumed that D-fructose-1,6-diphos-
phate first forms an intermediate in a rate-limiting process that is
then enzymatically transformed by an oxidoreductase.
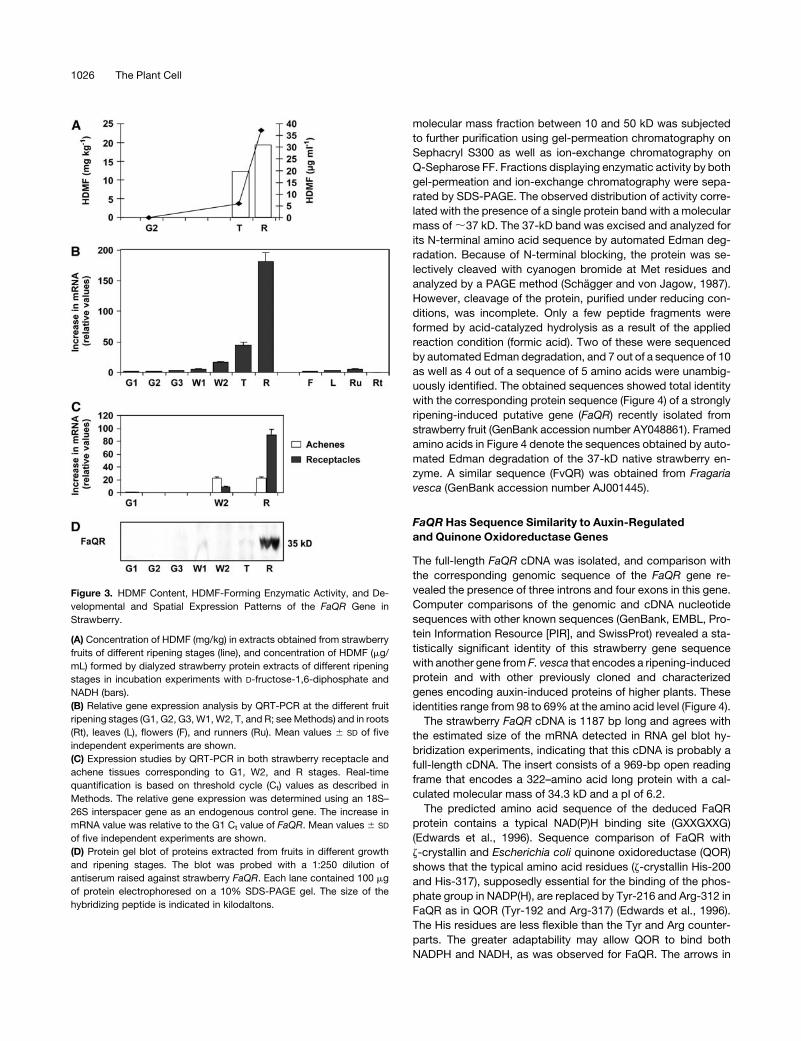
HDMF-forming activity was also studied during the course of
fruit ripening. Extracts of three different ripening stages—green,
pink (turning), and red—were prepared and incubated in a
standard assay. HDMF could not be detected after incubation
with the green extract. The pink extract (turning stage), however,
showed 60% of the activity observed in the red extract from ripe
berries, indicating a ripening-induced increase of enzymatic
activity similar to the increase in HDMF concentration during
ripening (Figure 3A) (Perez et al., 1996). Incubation experiments
with NADPH instead of NADH yielded ;80% of the amount of
HDMF compared with NADH. Addition of Zn2þ ions did not
increase the enzymatic activity, and the UV spectrum of the
enzymatically active recombinant enzyme did not show the typi-
cal maximum of flavin-containing proteins at 450 nm (Laskowski
et al., 2002).
Purification and Sequencing
The first purification step was accomplished using ultrafiltration
membranes with defined exclusion limits of 10, 30, 50, and
100 kD. Activity (79% of total) was recovered in the molecular
mass fraction between 30 and 50 kD. However, small amounts of
activity (18%) were also detected in the fraction between 10 and
30 kD, indicating a native molecular mass slightly higher than
30 kD for the target protein. The desalted and concentrated
Figure 2. HPLC-DAD-Electrospray Ionization (ESI)-MS/MS Analysis of a
Dialyzed Cytosolic Protein Extract Obtained from Ripe Strawberry Fruit
after 24 h of Incubation with D-Fructose-1,6-Diphosphate and NADH at
308C.
Only one compound was detected in the UV chromatogram at 285 nm,
and it was identified as HDMF on the basis of its product ion spectrum
(A), UV spectrum (B), and retention time (C) compared with the synthetic
reference. AU, absorbance units.
Furanone Formation in Strawberry Fruit 1025
molecular mass fraction between 10 and 50 kD was subjected
to further purification using gel-permeation chromatography on
Sephacryl S300 as well as ion-exchange chromatography on
Q-Sepharose FF. Fractions displaying enzymatic activity by both
gel-permeation and ion-exchange chromatography were sepa-
rated by SDS-PAGE. The observed distribution of activity corre-
lated with the presence of a single protein band with a molecular
mass of ;37 kD. The 37-kD band was excised and analyzed for
its N-terminal amino acid sequence by automated Edman deg-
radation. Because of N-terminal blocking, the protein was se-
lectively cleaved with cyanogen bromide at Met residues and
analyzed by a PAGE method (Schagger and von Jagow, 1987).
However, cleavage of the protein, purified under reducing con-
ditions, was incomplete. Only a few peptide fragments were
formed by acid-catalyzed hydrolysis as a result of the applied
reaction condition (formic acid). Two of these were sequenced
by automated Edman degradation, and 7 out of a sequence of 10
as well as 4 out of a sequence of 5 amino acids were unambig-
uously identified. The obtained sequences showed total identity
with the corresponding protein sequence (Figure 4) of a strongly
ripening-induced putative gene (FaQR) recently isolated from
strawberry fruit (GenBank accession number AY048861). Framed
amino acids in Figure 4 denote the sequences obtained by auto-
mated Edman degradation of the 37-kD native strawberry en-
zyme. A similar sequence (FvQR) was obtained from Fragaria
vesca (GenBank accession number AJ001445).
FaQR Has Sequence Similarity to Auxin-Regulated
and Quinone Oxidoreductase Genes
The full-length FaQR cDNA was isolated, and comparison with
the corresponding genomic sequence of the FaQR gene re-
vealed the presence of three introns and four exons in this gene.
Computer comparisons of the genomic and cDNA nucleotide
sequences with other known sequences (GenBank, EMBL, Pro-
tein Information Resource [PIR], and SwissProt) revealed a sta-
tistically significant identity of this strawberry gene sequence
with another gene from F. vesca that encodes a ripening-induced
protein and with other previously cloned and characterized
genes encoding auxin-induced proteins of higher plants. These
identities range from 98 to 69% at the amino acid level (Figure 4).
The strawberry FaQR cDNA is 1187 bp long and agrees with
the estimated size of the mRNA detected in RNA gel blot hy-
bridization experiments, indicating that this cDNA is probably a
full-length cDNA. The insert consists of a 969-bp open reading
frame that encodes a 322–amino acid long protein with a cal-
culated molecular mass of 34.3 kD and a pI of 6.2.
The predicted amino acid sequence of the deduced FaQR
protein contains a typical NAD(P)H binding site (GXXGXXG)
(Edwards et al., 1996). Sequence comparison of FaQR with
z-crystallin and Escherichia coli quinone oxidoreductase (QOR)
shows that the typical amino acid residues (z-crystallin His-200
and His-317), supposedly essential for the binding of the phos-
phate group in NADP(H), are replaced by Tyr-216 and Arg-312 in
FaQR as in QOR (Tyr-192 and Arg-317) (Edwards et al., 1996).
The His residues are less flexible than the Tyr and Arg counter-
parts. The greater adaptability may allow QOR to bind both
NADPH and NADH, as was observed for FaQR. The arrows in
Figure 3. HDMF Content, HDMF-Forming Enzymatic Activity, and De-
velopmental and Spatial Expression Patterns of the FaQR Gene in
Strawberry.
(A) Concentration of HDMF (mg/kg) in extracts obtained from strawberry
fruits of different ripening stages (line), and concentration of HDMF (mg/
mL) formed by dialyzed strawberry protein extracts of different ripening
stages in incubation experiments with D-fructose-1,6-diphosphate and
NADH (bars).
(B) Relative gene expression analysis by QRT-PCR at the different fruit
ripening stages (G1, G2, G3, W1, W2, T, and R; see Methods) and in roots
(Rt), leaves (L), flowers (F), and runners (Ru). Mean values 6 SD of five
independent experiments are shown.
(C) Expression studies by QRT-PCR in both strawberry receptacle and
achene tissues corresponding to G1, W2, and R stages. Real-time
quantification is based on threshold cycle (Ct) values as described in
Methods. The relative gene expression was determined using an 18S–
26S interspacer gene as an endogenous control gene. The increase in
mRNA value was relative to the G1 Ct value of FaQR. Mean values 6 SD
of five independent experiments are shown.
(D) Protein gel blot of proteins extracted from fruits in different growth
and ripening stages. The blot was probed with a 1:250 dilution of
antiserum raised against strawberry FaQR. Each lane contained 100 mg
of protein electrophoresed on a 10% SDS-PAGE gel. The size of the
hybridizing peptide is indicated in kilodaltons.
1026 The Plant Cell

Figure 4 show Tyr-216 and Arg-312, which probably allow the
binding of both NADPH and NADH. Although the active-site motif
of Zn-containing alcohol dehydrogenases (Edwards et al., 1996)
is also partially conserved in the FaQR gene, a key His residue
located at the active site of all alcohol dehydrogenases is absent,
and the sequence contains no Cys residues for the binding of
catalytic Zn. These features have also been observed in lens
z-crystallin and E. coli QOR-related reductases that lack a Zn
binding site and do not have alcohol dehydrogenase activity
(Edwards et al., 1996), and similar motifs were found in the amino
acid sequence of the 2.3R1 polypeptide of F. vesca (Nam et al.,
1999). The FaQR protein is probably not a flavodoxin quinone
reductase, because the 17–amino acid flavodoxin signature se-
quence [LIV]-[LIVFY]-[FY]-x-[ST]-x-x-[AGC]-x-T-x-x-x-A-x-x-[LIV]
Figure 4. Amino Acid Sequence Comparison of the Predicted Strawberry FaQR Protein and Putative Quinone Oxidoreductases from Higher Plants.
The sequences were aligned using the ClustalW program. Consensus amino acids are shaded. The NAD(P)H binding motif GXXGXXG is marked.
Furanone Formation in Strawberry Fruit 1027

(Laskowski et al., 2002) does not match the protein deduced
sequence from the FaQR cDNA. Finally, using the National Center
for Biotechnology Information Conserved Domain Search pro-
gram, we compared the deduced FaQR protein with domains
included in the database. We found significant sequence similar-
ities with domains corresponding to the NAD(P)H quinone oxido-
reductase motif (COG0604) and the Zn binding dehydrogenase
motif (pfam 00107). Together, these results strongly suggest that
FaQR encodes a putative NADH-dependent quinone oxidoreduc-
tase.
FaQR Is a Fruit Ripening–Related Gene
The spatial and temporal expression patterns of the FaQR gene
were studied using quantitative real time (QRT)-PCR. Transcript
amount increased throughout ripening, peaking in totally mature,
red fruit receptacles (with achenes; R stage) (Figure 3B). FaQR is
expressed in the late stages of fruit growth and ripening, both in
achene and receptacle tissues, with a reduced expression level
but similar expression pattern observed in achenes (Figure 3C). A
protein gel blot of proteins extracted from different stages of fruit
growth and ripening was probed using an antiserum raised
against the FaQR protein. A major 35-kD cross-reacting polypep-
tide present only in red fruit was observed that coincides with the
expected size range of the deduced FaQR protein (Figure 3D).
FaQR Expression Correlates Inversely with Auxin Levels
Because some strawberry fruit-specific genes have been shown
to be expressed under the control of auxins (Medina-Escobar
et al., 1997; Manning, 1998; Moyano et al., 1998; Trainotti et al.,
1999; Aharoni et al., 2002; Blanco-Portales et al., 2002), we
performed gene expression analysis on deachened green fruit
(G2 stage) to determine whether the expression of FaQR was
also under this hormonal control. QRT-PCR analyses were per-
formed with mRNA isolated from deachened fruits and from
deachened fruits treated with the auxin naphthalene acetic acid
(NAA). The clear increase in FaQR gene expression detected in
fruits at 4 d after removing the achenes (65-fold compared with
untreated control fruits) was partially reversed by treatment with
NAA (11-fold), implying that auxin levels correlate inversely
with FaQR gene expression.
Identification of FaQR Expression in Parenchyma Tissues
of Red Fruit
RNA was extracted from parenchyma and from vascular cells
individually collected via LCM (Figures 5A to 5E). RNA from the
second round of T7-based RNA amplification was analyzed by
RT-PCR using specific primers corresponding to the FaQR gene.
We found that FaQR mRNA was amplified exclusively from RNA
obtained from the red fruit parenchyma. No amplification from
vascular RNA was observed. However, the control interspacer
RNA was amplified in RNA from both parenchyma and vascular
tissues (Figure 5F). The primers used to amplify the FaQR
transcript produced the expected 294-bp product from RNA
isolated from parenchyma cells. The fact that the primer set used
for FaQR RT-PCR spans an intron region of the FaQR gene,
generating a product of 544 bp using genomic DNA as a
template, allowed us to confirm that the RT-PCR product
obtained in the amplification reaction derived from parenchyma
cell RNA transcripts rather than from contaminating strawberry
genomic DNA.
FaQR Protein Shows o-Quinone Oxidoreductase Activity
and Forms HDMF
FaQR protein was heterologously expressed in E. coli as a His-
tagged fusion protein. As a result of the results of the similarity
search, quinone oxidoreductase activity of the recombinant
protein was first determined spectrophotometrically after the
addition of 1,2- or 1,4-quinones and NADH. HDMF-forming
activity was confirmed with the addition of D-fructose-1,6-di-
phosphate and NADH. Increases in FaQR level correlate with
increases in the specific activity of the preparation. Quinone
oxidoreductase activity was also observed in the extracts
obtained from E. coli containing the empty vector, revealing
that native E. coli QOR activity was probably not completely
separated by His tag affinity chromatography with the Co2þ-
containing column. Thus, ultrafiltration was applied as an addi-
tional purification step to isolate proteins of the molecular mass
range from 30 to 50 kD (Figure 6). Because E. coli QOR is a
dimeric protein with 35-kD subunits, it was completely excluded
by the ultrafiltration step, as confirmed by activity assays (Thorn
et al., 1995). Although FaQR from strawberry fruit reduced only
the artificial substrate 9,10-phenanthrene quinone (Km ¼ 35 mM)
out of a number of 1,2- and 1,4-quinones tested, and formed
HDMF, the E. coli QOR preparation showed a completely differ-
ent spectrum of enzymatic activity, accepting many 1,2- and
1,4-quinones and not producing HDMF. This observation also
confirms the result obtained using the native strawberry enzyme
preparation that the monomeric FaQR is catalytically active.
Natural Precursor of HDMF
The observation that HDMF formation from D-fructose-1,6-di-
phosphate proceeds very slowly, as 1.5mg of HDMF is produced
from 40 mg of D-fructose-1,6-diphosphate within 6 h by 7.5mg/mL
FaQR solution, and the fact that 9,10-phenanthrene quinone,
which has not been described as a strawberry fruit constituent,
represents a substrate for FaQR, led us to conclude that
D-fructose-1,6-diphosphate is not the actual substrate for FaQR.
On the basis of structural similarity to 1,2-quinones and alkenals,
we hypothesized that HMMF is the natural precursor of HDMF
and is converted by the enzyme (Figure 1). To test this notion, we
performed the synthesis of this fairly unstable, a,b-unsaturated
compound and confirmed its structure after derivatization with
3-mercaptobenzoic acid by LC-MS and 1H- and 13C-NMR (our
unpublished data). The in vitro enzymatic transformation of HMMF
to HDMF by FaQR within 30 min was observed using liquid
chromatography–tandem mass spectrometry (LC-MS/MS) (Fig-
ure 7). Similarly, HMMF was detected by LC-MS/MS in incuba-
tion solutions containing D-fructose-1,6-diphosphate and in
strawberry fruit, but only after derivatization with 3-mercapto-
benzoic acid to a stable thioether product (Figure 8). Because of
the instability of HMMF in aqueous solution, proper Vmax and Km
1028 The Plant Cell

values could not be obtained. However, EDHMF (Figure 1), a
substrate analogue, was stable enough, and a Km of 2.1 6
0.1 mM and a Vmax of 56 6 3.6 nkat/mg could be determined for
this compound. These values are similar to those obtained for
substrates of other oxidoreductases (Mano et al., 2000, 2002).
Finally, we incubated samples containing FaQR, reducing agent,
and D-fructose-1,6-diphosphate in the presence of the trapping
reagent 3-mercaptobenzoic acid and without the thiol (Figure 9).
As a control, 3-mercaptobenzoic acid was added to a buffered
solution containing D-fructose-1,6-diphosphate. In the pres-
ence of the thiol, the thioether adduct of HMMF was formed,
but addition of FaQR led to significantly reduced levels of the
thioether (Figure 9A). By contrast, the highest amounts of
HDMF were produced in thiol-free medium, whereas addition of
3-mercaptobenzoic acid reduced the levels of HDMF (Figure 9B).
The enzyme is not affected by the applied thiol concentration, as
shown by control experiments with 9,10-phenanthrene quinone
as substrate. It appears that FaQR shows a higher affinity for
HMMF than 3-mercaptobenzoic acid, because the level of the
thioether in the sample containing D-fructose-1,6-diphosphate,
3-mercaptobenzoic acid, FaQR, and NADH remained almost
constant after 300 min of incubation, whereas the concentration
of HDMF still increased.
DISCUSSION
The physiological function of plant quinone oxidoreductases in
developmental processes has been little studied, and to date no
specific function for this class of proteins has been discovered
except for an alkenal/one oxidoreductase (Mano et al., 2002;
Dick and Kensler, 2004). Here, we present the isolation and bio-
chemical and molecular characterization of a strawberry fruit
ripening–related protein and its corresponding gene, exhibiting
identity with plant quinone oxidoreductase enzymes and genes,
respectively. Our results suggest the involvement of the enzyme
in the biosynthesis of the important strawberry flavor compound
HDMF. On the basis of the catalyzed reaction, an intermediate of
the biosynthetic pathway was postulated and confirmed by chem-
ical synthesis and detection in strawberry fruit.
It has been proposed that the auxins are the primary hormones
controlling strawberry fruit ripening (Perkins-Veazie, 1995). A
gradual decline in the supply of auxin from achenes in the later
stages of fruit growth (the transition between green and white
fruits) has been associated with strawberry fruit ripening (Perkins-
Veazie, 1995). Indeed, a direct correlation has been shown
between an increase in the expression of strawberry ripening–
related genes and a decrease in auxin (Trainotti et al., 1999;
Figure 5. Laser Capture of Parenchyma Cells and Vascular Tissues from Red-Stage Strawberry Fruit.
(A) Tissue section (10 mm) of a red fruit showing vascular tissues (V) and parenchyma cells (P).
(B) and (C) Parenchyma cells before laser capture (B) and after laser capture (C).
(D) and (E) Vascular tissue before laser capture (D) and after laser capture (E).
(F) Transcripts of FaQR detected by specific RT-PCR analysis from RNA recovered from vascular and parenchyma cells individually isolated by LCM.
RT-PCR was performed using specific primers as described in Methods. FaQR is a 294-bp specific amplified fragment corresponding to the FaQR
gene; 18S–26S RNA is a 150-bp specific fragment of an interspacer control RNA. 1kb, 1-kb DNA ladder; C�, negative control for PCR; 1aa and 2aa,
RT-PCR analysis of aRNA from parenchyma cells after the first and second rounds of amplification, respectively (see Methods). RT-PCR analysis of
aRNA (two rounds of amplification) was from vascular tissue (V) and parenchyma cells (P).
Furanone Formation in Strawberry Fruit 1029

Aharoni et al., 2002; Blanco-Portales et al., 2002; Benıtez-
Burraco et al., 2003). Similarly, strawberry FaQR expression
correlates inversely with auxin levels. Thus, the high gene ex-
pression levels found during strawberry ripening stages and the
fact that FaQR expression increases in correlation with decreas-
ing auxin levels show clearly that FaQR is included in the fruit
ripening expression pattern of strawberry.
At the growth stages of fruit development, the expression of
the strawberry FaQR gene is low, but it increases continuously
throughout the fruit ripening stages. The maximum amount of
transcript and the maximum enzymatic activity of the native
enzyme were found in full-ripe red fruits. Accordingly, the con-
centrations of HDMF and its derivatives DMMF and HDMF
glucoside constantly increase during strawberry ripening (Perez
et al., 1996; Wein et al., 2002). Maximum amounts of furanones
are formed at the overripe stage. FaQR is expressed in the pa-
renchyma of the fruit and correlates with the detection of high
HDMF levels in the fleshy dark-red cortex (Sen et al., 1991).
Similarly, in pineapple, a fruit also producing HDMF (Schwab and
Roscher, 1997), normal ripening and senescence were charac-
terized by an increase in NADH quinone reductase activity (Soler
et al., 1993). FaQR mRNA was also detected in the achenes, but
its function there remains unknown.
Quinone reductases catalyze the univalent or divalent reduc-
tion of quinones (Q) primarily to produce semiquinone radicals or
quinols, respectively (Thorn et al., 1995; Ross, 1997; Matvienko
et al., 2001). Plant NAD(P)H quinone reductase [NAD(P)H-QR]
uses either NADH or NADPH as the electron donor and a
hydrophilic quinone as the electron acceptor. NAD(P)H-QRs
constitute one of eight families belonging to the superfamily
of medium-chain dehydrogenases/reductases (Nordling et al.,
2002). The family containing NAD(P)H-QRs is variable, implying
diverse functions in metabolic conversions. NAD(P)H-QR ap-
pears to be the only soluble plant cell enzyme that produces fully
reduced quinols (Trost et al., 1995). However, a dual mode of
reaction, univalent reduction of quinones and divalent reduction
of azodicarbonyls, has been shown for the enzyme P1-ZCR, a
z-crystallin quinone oxidoreductase from Arabidopsis thaliana
(Mano et al., 2000, 2002). This enzyme (NADPH:2-alkenal
a,b-hydrogenase) also catalyzes the reduction of highly reactive
alkenals [e.g., (2E)-hexenal] to less reactive n-alkanals (e.g.,
hexanal) (Mano et al., 2002) and thus resembles FaQR. Both
enzymes reduce 9,10-phenanthrene quinone (quinone oxidoreduc-
tase) and hydrogenate a,b-unsaturated carbonyl compounds
(enone oxidoreductase) to their corresponding saturated deri-
vatives. Although not proven, we assume that the reaction of the
two enzymes with the o-quinone constitutes a promiscuous
activity and is similar to the activities of the ancestor proteins
(Aharoni et al., 2005). In both cases, the reduction of the acrolein
derivatives leads to the formation of aroma-active volatiles. This
reaction is reminiscent of the enoyl reductases, which are
capable of catalyzing the reduction of the C¼C double bond in
the enoyl-ACP. a,b-Unsaturated aldehydes and ketones are
electrophilic and capable of reacting, via the Michael addition
mechanism, with important cellular nucleophiles, which, in turn,
leads to macromolecular (protein, DNA) dysfunction and cell
death. Because saturated carbonyls lack this reactive moiety,
they are often far less toxic. Because of its reactivity, accurate
determination of the kinetic data for HMMF could not be per-
formed, but the corresponding data for the substrate analogue
Figure 6. SDS-PAGE Analysis of Recombinant FaQR.
FaQR purified by His tag affinity chromatography (lane 1) and subse-
quent ultrafiltration to isolate the proteins of the molecular mass range
from 30 to 50 kD (lane 2), as described in Methods. M, molecular mass
markers in kD. Proteins obtained from E. coli cells transformed with the
empty vector were also subjected to His tag affinity chromatography
(lane 4) and subsequent ultrafiltration (lane 3), which completely removed
native E. coli quinone oxidoreductase still present in the eluate obtained
by His tag affinity chromatography.
Figure 7. Demonstration of the Formation of HDMF from HMMF by
HPLC-ESI-MS/MS.
Chemically synthesized HMMF ([M þ H]þ; m/z 127) (A) was transformed
by FaQR in the presence of NADH to HDMF ([M þ H]þ; m/z 129) (B).
Shown are the ion traces m/z 127 to 129 in the positive mode.
1030 The Plant Cell

EDHMF were obtained, indicating that these structures are suit-
able substrates for FaQR. In addition, we clearly demonstrated
the competition of 3-mercaptobenzoic acid and FaQR for the
reactive HMMF. The final evidence for the in vivo function of
FaQR was provided by the detection of the as yet unknown
precursor HMMF (as its thioether derivative) in red ripe straw-
berry fruit.
In summary, we have isolated and characterized an important
protein involved in the biosynthesis of HDMF. Protein sequence
analysis allowed the cloning and characterization of the corre-
sponding strawberry gene. An intermediate of the HDMF bio-
synthetic pathway was deduced from the catalyzed reactions,
and the structure of the HDMF precursor was confirmed by
chemical synthesis, finally leading to its detection in strawberry
fruit. The cDNA corresponds to an mRNA encoding a protein with
quinone and enone oxidoreductase enzymatic activities. The
gene expression analyses and LCM studies suggest that the
strawberry FaQR gene is related to the fruit ripening process and
HDMF production. The enone oxidoreductase protein catalyzes
the last step in the formation of the important strawberry flavor
compound HDMF but acts also on an o-quinone. It is assumed
but not yet proven that the enzyme’s promiscuous activity is
similar to the activity of an evolutionarily related enzyme, as has
been shown for other proteins (Aharoni et al., 2005).
Figure 8. HPLC-ESI-MS/MS Analysis of the Thioether Product Formed
from HMMF and 3-Mercaptobenzoic Acid.
(A) and (B) Ion traces at m/z 303 of the reference (A) and of a diethyl ether
extract obtained from strawberry after application of 3-mercaptobenzoic
acid (incubation, 72 h at room temperature) followed by solid-phase
extraction on XAD-2 (B).
(C) and (D) Mass spectra of the reference (C) and the compound formed
in strawberry eluting at 19 min (D).
(E) and (F) Product ion spectra (MS/MS; m/z 281) of the reference (E) and
the compound formed in strawberry (F).
Figure 9. Competition of 3-Mercaptobenzoic Acid and FaQR for HMMF
Formed from D-Fructose-1,6-Diphosphate.
(A) A time course experiment showed increasing levels of the thioether
when 3-mercaptobenzoic acid was added to D-fructose-1,6-diphos-
phate (closed circles), whereas the concurrent addition of FaQR and
NADH (open circles) led to reduced concentrations. Thioether was not
detected when D-fructose-1,6-diphosphate was incubated with only
FaQR and NADH (closed triangles).
(B) High concentrations of HDMF were produced when D-fructose-1,6-
diphosphate was converted by FaQR in the presence of NADH (closed
triangles), whereas concurrent addition of 3-mercaptobenzoic acid (open
circles) reduced the concentration of the furanone. FaQR was essential
for the formation of significant levels of HDMF (closed circles).
Furanone Formation in Strawberry Fruit 1031
METHODS
Plant Material
Strawberry (Fragaria 3 ananassa cv Chandler and Elsanta, octaploid
cultivars) fruits were harvested at the following developmental stages:
small-sized green fruits (G1), middle-sized green fruits (G2), full-sized
green fruits (G3), white fruits with green achenes (W1), white fruits with red
achenes (W2), turning stage fruits (T), and full-ripe red fruits (R), imme-
diately frozen in liquid nitrogen, and stored at �808C.
Preparation of the Clarified Extract
Two hundred grams of red ripe strawberry fruit was homogenized with
20 g of polyvinylpolypyrrolidone and 200 mL of water in a mixer. The pH
was adjusted to 7.0 with 1 N NaOH, and the mixture was centrifuged for
30 min at 5000g. The pellet was discarded, and the supernatant was
centrifuged a second time for 30 min at 40,000g. The clear solution was
dialyzed against a Tris-HCl buffer or a phosphate buffer, pH 7.0 (100 mM)
to remove naturally occurring HDMF.
Standard Incubation Assay
One hundred milligrams of D-fructose-1,6-diphosphate and 1 mg of
NADH were added to 20 mL of dialyzed cytosolic protein extract. After the
addition of 2 mL of 1 M phosphate buffer, pH 7, the solution was adjusted
to pH 7.0 using 1 N NaOH or 1 N HCl. The solution was then incubated for
;24 h at 308C in a shaker. Depending on the experiment, different kinds
and amounts of substrates and reduction equivalents were used.
Extraction for HPLC Analysis and HDMF Quantification
The samples were centrifuged and subjected to solid-phase extraction
over RP18 cartridges (Supelco; 500 mg/3 mL). After application, the
cartridges were rinsed with 2 mL of water and eluted with 3 mL of diethyl
ether. Remaining water was removed by freezing the samples to �188C.
The (liquid) diethyl ether was pipetted into a conical 1-mL HPLC vial
containing 200 mL of water. The organic solvent was removed under a
stream of nitrogen, and HDMF was quantified with an HPLC system
equipped with a Basic marathon autosampler (Spark Holland) connected
to a Maxistar pump and a variable-wavelength monitor set to 285 nm
(both from Knauer). Knauer Eurochrom 2000 software was used for data
acquisition and evaluation. The HDMF yields were quantified using a
standard curve of commercial HDMF. A Eurospher 100-C18 column
(250 mm long3 4 mm i.d.; particle size, 5mm) (Knauer) was used. A binary
gradient starting from 95% A (0.05% formic acid in water) and 5% B
(acetonitrile) to 80% A within 10 min, then to 0% A in 30 min, was used at a
flow rate of 1.0 mL/min. Injection volume was 20 mL.
Ultrafiltration
The dialyzed extract was separated into fractions containing proteins of
different molecular masses (<10 kD, 10 to 30 kD, 30 to 50 kD, 50 to 100 kD,
>100 kD) by means of consecutive ultrafiltration with Centricon polycar-
bonate membranes with exclusion limits of 10, 30, 50, and 100 kD
(Amicon). Fractions were analyzed for their HDMF-forming activity using
the standard incubation assay.
Chromatography on Q-Sepharose Fast Flow
A Q-Sepharose Fast Flow column (2.6 3 20 cm) was equilibrated with
20 mM phosphate buffer, pH 7.0. After removing naturally occurring
HDMF, strawberry extract was applied to the ion-exchange resin and
eluted with a linear gradient of 400 mL of 0 to 0.5 M NaCl in 20 mM
phosphate buffer, pH 7.0, at a flow rate of 1.0 mL/min. Fractions (10 mL)
were collected and analyzed for HDMF-forming activity.
Size-Exclusion Chromatography on Sephacryl S-300 for
Determination of Native Molecular Mass
A Sephacryl S-300 HR fast protein liquid chromatography column (1.6 3
60 cm; Pharmacia) was equilibrated with 20 M phosphate buffer, pH 7.0.
Desalted and concentrated protein solutions were applied to the column.
Proteins were eluted with 20 mM phosphate buffer, pH 7.0, at a flow rate
of 0.2 mL/min. Fractions (2 mL) were collected and tested for activity.
Retention times were compared with those of the following gel filtration
markers (Amersham Pharmacia Biotech): thyroglobulin (669 kD), ferritin
(440 kD), catalase (232 kD), aldolase (158 kD), BSA (67 kD), ovalbumin
(43 kD), chymotrypsinogen (25 kD), and ribonuclease A (14 kD). Elution
was monitored at 280 nm.
SDS-PAGE
A Bio-Rad Mini-Protean II device was used. Desalted and lyophilized
samples were dissolved in 20 mL of sample buffer (Bio-Rad) and 0.4 mL of
mercaptoethanol, heated in a boiling-water bath for 3 min, cooled, and
applied to Ready Tris-Glycine gels (16.5%; Bio-Rad). Electrode buffer con-
centrate was purchased from Bio-Rad and diluted before use. Electropho-
resis was performed with a voltage of 100 V. Once completed, separation
gels were stained in a solution of Coomassie Brilliant Blue R 250 (0.1%).
Internal Sequencing
Desalted and concentrated protein fractions exhibiting activity were
resolved on an 8% (w/v) SDS-PAGE gel of 0.75 mm thickness under
reducing conditions. The molecular mass of the protein band of interest
was determined to be 37 kD. The band was excised from the gel and
treated with formic acid and 5% (w/v) cyanogen bromide overnight at
room temperature. The eluted peptides were resolved on a gel according
to the method of Schagger and von Jagow (1987). After electrotransfer on a
polyvinylidene difluoride membrane and staining with Coomassie Brilliant
Blue R 250, bands were excised and sequence analysis was performed by
automated Edman degradation with a 476A pulsed-liquid-phase protein
sequencer (Applied Biosystems). The phenylthiohydantoin derivatives of
amino acids were separated and identified with an online phenylthio-
hydantoin analyzer on a phenylhydantoin-C18 column. The peptide se-
quences obtained were subjected to homology searches using the public
protein sequence databases (SwissProt, PIR, Protein Research Founda-
tion, Nonredundant Protein Sequence Database, GenBank, and EMBL).
Capillary Electrophoresis
Electrophoresis was performed according to Raab et al. (2003b) with a
Beckman P/ACE system for methods development and quality control
applications equipped with a multiwavelength-variable UV detector. A
fused silica capillary with a total length of 40.2 cm, a detection length of
30 cm, and an i.d. of 50 mm was used. Samples were pressure-injected
into the anodic end of the capillary for 10 s and separated at 258C using a
constant voltage of 10 kV. The detection wavelength was 280 nm.
Ammonium acetate (50 mM), pH 4.0, containing 20 mM heptakis-(2,3-
diacetyl-6-sulfato)-b-cyclodextrin was used as a running buffer. The
capillary was washed between runs with 0.1 M NaOH (2 min) and running
buffer (2 min).
HPLC-ESI-MS/MS Analysis
HPLC-ESI-MS/MS was performed using a TSQ 7000 tandem mass
spectrometer system equipped with an ESI interface (Finnigan MAT) and
an Applied Biosystems 140b pump. Data acquisition and evaluation were
1032 The Plant Cell

conducted on a DEC 5000/33 (Digital Equipment) using Finnigan MAT
ICIS 8.1 software. HPLC separation with mass spectrometry detection
was performed on a Knauer Eurospher-100 C18 column (100 mm long 3
2 mm i.d.; particle size, 5 mm) using a binary gradient starting from 95% A
(0.05% trifluoroacetic acid in water) and 5% B (acetonitrile) to 80% A
within 10 min, then to 0% A in 30 min, at a flow rate of 0.2 mL/min. Mass
spectra were acquired in the positive ion mode. For pneumatic assisted
ESI, the spray voltage was set to 3.5 kV and the temperature of the heated
capillary was 2108C. Nitrogen served both as sheath (70 p.s.i.) and
auxiliary gas (10 units). Product ion scanning was performed at a collision
gas pressure of 2.0 millitorr and a collision energy of 25 eV, with a total
scan duration of 1.0 s for a single spectrum.
HPLC-DAD
For HPLC analysis with DAD, a Hewlett-Packard 1100 HPLC gradient
pump and a Hewlett-Packard 1100 photodiode array detector were used,
including Hewlett-Packard chemstation software for data acquisition and
evaluation. A Eurospher 100-C18 column (250 mm long 3 4 mm i.d.;
particle size, 5 mm) (Knauer) was used.
Strawberry Quinone Oxidoreductase cDNA and Gene Cloning
The cloning and isolation of the full-length strawberry cDNA quinone
oxidoreductase (FaQR) was performed by differential screening of a
cDNA subtractive library (red stage versus green stage) according to
Medina-Escobar et al. (1997). The isolation of the strawberry quinone
oxidoreductase genomic clones was performed by plaque hybridization
screening of ;1.5 3 105 plaque-forming units of a strawberry genomic
library (Fragaria 3 ananassa cv Chandler) in the phage l-FIX II (Strata-
gene), using the 32P-labeled FaQR cDNA previously isolated from straw-
berry as a probe. Filters were prehybridized and hybridized at 658C in the
following hybridization solution: 53 SSC (13 SSC is 0.15 M NaCl and
0.015 M sodium citrate), 53 Denhardt’s solution (13 Denhardt’s solution
is 0.02% Ficoll, 0.02% polyvinylpyrrolidone, and 0.02% BSA), 200 mg/mL
salmon sperm, and 0.5% SDS. After hybridization, filters were washed
twice for 15 min at room temperature in a 0.23 SSC, 0.5% SDS solution.
Afterwards, the filters were washed for 15 min at 658C in a 0.23 SSC, 0.1%
SDS solution. Seventeen positive clones ranging between 12 and 17 kb
were isolated, and their inserts were analyzed by restriction mapping and
DNA gel blot hybridization using theFaQR cDNA as a probe. Suitable clones
for DNA sequencing were obtained by subcloning into pBluescript SK–
vector, and their DNA inserts were completely sequenced in both strands.
Bioinformatic Analysis of Sequences
Sequences were compared with the GenBank and EMBL nucleic acid
databases and the PIR and SwissProt databases using the BESTFIT,
DOTPLOT, and PRETTYBOX programs. Additionally, the DNA sequences
were analyzed for open reading frames using the GENEBUILDER pro-
gram (Milanesi et al., 1999). The amino acid sequence was analyzed using
programs from the University of Wisconsin Genetic Computer Group
package (Devereux et al., 1984). PLACE (Higo et al., 1999) and MATINS-
PECTOR (Quandt et al., 1995) databases were used as a tool for
homology searches of nucleotide sequence motifs.
Auxin Treatments
Achenes of two sets of G2-stage strawberry fruits were carefully removed
from the developing fruit using the tip of a scalpel blade. One set of
deachened fruits was treated with the synthetic auxin NAA as a lanoline
paste, with 1 mM NAA in 1% (v/v) DMSO. The other set of deachened
fruits was treated with the same paste but without NAA. Fruit samples
were harvested at 0, 24, 48, 72, and 96 h after treatment, immediately frozen
in liquid nitrogen, and stored at �808C. Untreated fruits served as controls.
RNA Isolation and Gene Expression Analysis
Total RNA from a pool of six to seven strawberry fruits at different devel-
opmental and ripening stages, subjected to different treatments, and from
flowers, runners, leaves, and roots was isolated according to Manning
(1991). To investigate the differential expression of FaQR during the
strawberry ripening process, both RNA gel blot and QRT-PCR analyses
were performed.
RNA Gel Blot Analysis
The insert from the FaQR cDNA clone (;1.2 kb) was used as a template
for generating a radioactive probe. The 26S rRNA was used as a control
for uniform RNA loading. The probe was labeled to a specific activity of
;108 cpm/mg using a commercial random priming kit (Amersham
Pharmacia Biotech). Twenty micrograms of total RNA per sample was
routinely used for RNA gel blot analysis. Filters (Hybond Nþ; Amersham
Pharmacia Biotech) were prehybridized at 658C for 1 h in 15 mL of
hybridization solution (0.25 M NaH2PO4, 7% SDS, and 0.1 mM Na2EDTA).
Denatured probes were added to the same hybridization solution, and
hybridization was performed at 658C for 14 to 16 h. Filters were washed
(twice) at 658C for 15 min in 100 mL of 0.23 SSC, 0.1% SDS and then
exposed to x-ray film at �808C for 24 to 48 h.
QRT-PCR Analysis
For QRT-PCR measures of gene expression, the iCycler system (Bio-Rad)
was used, using the specific primers 59-CCAAGGAGAACTTCGAGGA-
CCTGC-39 and 59-CGGTAGCTCTGGAACTCTCAAGG-39. The RT reac-
tions contained 13RT buffer, 10 mM DTT, 1 mM of each deoxynucleotide
triphosphate (dNTP), specific 39 primer (0.2 mM), 1 mg of DNase I–treated
RNA, and 40 units of Moloney murine leukemia virus RT. The reaction
mixtures were heated at 708C for 5 min and cooled to room temperature.
Afterwards, they were incubated for 5 min at 428C, for 50 min at 508C, and
then for 15 min at 708C. The resulting single-stranded cDNAs were
amplified by PCR all at once. PCRs consisted of 25 mL of a mixture
containing, in 13 PCR buffer, 1.5 mM MgCl2, 0.2 mM dNTPs, 0.2 mM of
each primer, 3mL of SYBR Green I (diluted 1:150,000), 3mL of transcribed
cDNA, and 0.5 units of Taq polymerase. The thermal cycling conditions
were as follows: 948C for 2 min, followed by 40 cycles of 948C for 15 s,
558C for 30 s, and 728C for 1 min. A final extension step at 728C for 5 min
was also included. In QRT-PCR analysis, quantification is based on Ct
values. The Ct is a measurement taken during the exponential phase of
amplification, when limiting reagents and small differences in starting
amount have not yet influenced the PCR efficiency. Ct is defined as the
cycle at which fluorescence is first detectable above background and is
inversely proportional to the log of the initial copy number. In our system,
each 10-fold difference in initial copy number produced a 3.2-cycle
difference in Ct. Each reaction was done in triplicate, and the corre-
sponding Ct values were determined. These values were then normalized
using the Ct value corresponding to a strawberry (housekeeping) inter-
spacer gene. In addition, the efficiency of each QRT-PCR was also
calculated. All of these values were used to determine the increases in
gene expression according to the following expressions: fold change ¼2D(DCt), where DCt ¼ Ct (target) � Ct (housekeeping gene) and D(DCt) ¼DCt (problem) � DCt (control).
Expression in Escherichia coli and Antibody Production
To obtain the construct producing the strawberry protein corresponding
to the full-length FaQR, two oligonucleotides with the sequence
59-CTAACCATGGCTGCAGCTCCAAG-39, containing the start sequence
of the FaQR cDNA coding region and carrying a NotI site, and the
sequence 59-CAACCTCGAGGATGGGATACAC-39, containing an XhoI
Furanone Formation in Strawberry Fruit 1033
site, were used to amplify the entire FaQR coding sequence by PCR. The
PCR product was digested with NotI and XhoI restriction enzymes and
cloned in-frame into the corresponding sites of the pET29(þ) (Novagen)
vector, generating the pET29-QR plasmid, which was then introduced
into E. coli host strain Bl21(DE3). The transformed bacterial cells were
grown at 378C in Luria-Bertani broth containing 50mg/mL kanamycin until
they reached an A600 of 0.8 to 1.0. The cells were cooled to 158C, and
1 mM isopropyl b-D-thiogalactoside was added to induce FaQR synthe-
sis. The bacteria were grown for another 6 h at 378C and harvested by
centrifugation. A pET29(þ) plasmid without a DNA insert was used as a
parallel control and treated similarly. Preparation of crude extracts from
E. coli transformants was performed as follows. The cells were resus-
pended in lysis buffer (20 mM Tris-HCl, pH 7.5, 10% glycerol, 5 mM DTT,
1 mM phenylmethylsulfonyl fluoride, and 1 mM EDTA), lysozyme was
added to a final concentration of 2 mg/mL, and the cells were incubated at
48C for ;1 h. Cells were disrupted in a French press (1200 p.s.i.) twice.
Cell debris were pelleted by centrifugation, and the supernatant was
tested for protein induction. For the analysis of total bacterial proteins,
aliquots were pelleted in a microcentrifuge, boiled in SDS-lysis buffer (0.1
M Tris-HCl, pH 6.8, 1.6% glycerol, 0.008% bromphenol blue, 4 mM
EDTA, 10 mM DTT, and 3% SDS) for 3 min at 958C, and loaded on a 12%
SDS-polyacrylamide gel. Proteins were visualized by Coomassie Brilliant
Blue R 250 staining, and their concentrations were determined spectro-
photometrically by the Bradford assay (Bradford, 1976). The recombinant
protein contained in the supernatant was purified by gel electrophoresis
on a 12% SDS-polyacrylamide gel. The band containing the recombinant
FaQR protein was carefully excised, and the gel slice was used directly as
the antigen source for polyclonal antibody production in white rabbits.
Protein Gel Blot
Proteins were extracted from strawberry fruits at different developmental
and ripening stages (Harpster et al., 1998) and were used to test the spec-
ificity of theanti-quinone oxidoreductaseantibodiesand to study the expres-
sion pattern of the FaQR protein. A specific band of 35 kD, corresponding to
the deduced size of FaQR, was found. Specific detection of FaQR poly-
peptide was performed with the enhanced chemiluminescence protein gel-
blotting kit (Amersham), according to the manufacturer’s protocol.
Fixation for LCM
Red strawberry fruits were trimmed to ;2 mm in thickness. Sections
were fixed for 24 h at 48C in a freshly prepared fixative solution containing
75% (v/v) ethanol and 25% (v/v) acetic acid. The fixative solution was
vacuum-infiltrated into the sections for 10 min while they were kept on ice.
Fixed tissue was dehydrated at 48C in a graded series of ethanol (3 h each
in 75, 85, and 100% and overnight in 100% [v/v]) and followed by an
ethanol:xylene series at room temperature (1 h each at 75:25%, 50:50%,
25:75%, 0:100%, and 0:100% [v/v]). Flakes of Paraplast were added to
the tissue-embedding medium (100% xylene) at the final step and
dissolved until Paraplast saturation. The pieces of tissue were included
in liquified Paraplast and kept at 588C. Samples were positioned in a
mold, and sections were cut using a rotary microtome. To stretch the
ribbons, sections were floated in water on membrane slides (Molecular
Machines and Industries) at 428C, air-dried, and stored at 48C under
dehydrating conditions. For LCM, slides were deparaffined in xylene for
two changes of 5 min and air-dried.
LCM
LCM was performed using a mCut Laser microdissection system (SL
Microtest) and reaction tubes with an adhesive lid for single-step collec-
tion. Briefly, the slide was placed into position on the LCM microscope
stage. The lid of the reaction tube was placed over the tissue during all
operations of mCut Laser microdissection (the lid contains a diffusor to
improve the image quality). Cells of interest were located, and LCM was
performed with the laser beam set to 15 to 20mm and focused. The power
of the laser beam was;80 to 85 mW. Dissected cells were then removed
by lifting the LCM cap using the placement arm.
RNA Extraction and RNA Amplification
RNA from cells was extracted using the Absolutely RNA Nanoprep kit
(Stratagene) according to the manufacturer’s instructions. Briefly, 100 mL
of lysis buffer was applied to the special adherent lid containing laser-
captured cells of the LCM microcentrifuge tube. After inverting and
vortexing the tube, the lysis buffer was collected and mixed with an equal
volume of 70% ethanol. This mixture was transferred to the RNA binding
column, and DNase treatment and washings were performed. RNA was
eluted in 2 3 10 mL of elution buffer warmed to 608C and vacuum-
concentrated to a volume of 11mL. cDNA synthesis and RNA amplification
were performed using the MessageAmp aRNA kit (Ambion) according to
the manufacturer’s instructions. Briefly, first-round cDNA synthesis was
performed with a T7 oligo(dT) primer. One microliter of T7 oligo(dT) primer
was added to 11 mL of RNA and heated to 708C for 10 min, and after
cooling to 428C, 2 mL of 103 first-strand buffer, 1 mL of ribonuclease
inhibitor, 4 mL of dNTP mix, and 1 mL of RT were added. After a 2-h
incubation, second-strand synthesis was performed by the addition of
63 mL of nuclease-free water, 10 mL of 103 second-strand buffer, 4 mL of
dNTP mix, 2mL of DNA polymerase, and 1mL of RNase H. Reactions were
incubated for 2 h at 168C. The cDNA was purified according to the
manufacturer’s instructions and eluted with 2 3 10 mL of nuclease-free
water. For in vitro transcription, 16 mL of double-stranded cDNA was
mixed with 4mL of each dNTP, 4mL of 103 reaction buffer, and 4mL of T7
enzyme mix. Reactions were incubated at 378C for 14 h and then digested
with DNase. The aRNA was purified and vacuum-concentrated to 10 mL.
To increase the amount of aRNA, a second round of amplification was
performed. This procedure is similar to the first round of amplification, but
different primers are used. To analyze FaQR gene expression, aRNA was
reverse-transcribed using the iScript cDNA synthesis kit (Bio-Rad), and
PCR was performed using the same conditions described above (see
QRT-PCR Analysis) except that SYBR Green was omitted.
Expression of FaQR for Enzyme Activity Assays
The pET29-QR plasmid was introduced into E. coli host strain Bl21(DE3)-
plys. The transformed bacterial cells were grown at 378C in Luria-Bertani
broth containing 50 mg/mL kanamycin until they reached an OD600 of 0.4
to 0.6. The cells were cooled to 168C, and isopropyl b-D-thiogalactoside
was added to a concentration of 1 mM. The bacteria were grown for
another 16 h at 168C and harvested by centrifugation at 4000 rpm. An
empty pET29(þ) plasmid was used as a parallel control and treated in the
same way. The cells were solubilized by grinding in a chilled mortar with
2.5 parts glass beads (106 mm; Sigma-Aldrich). The soluble fraction was
extracted with an extraction/wash buffer containing 50 mM sodium
phosphate and 300 mM sodium chloride, pH 7.0. The suspension was
centrifuged, and the resulting supernatant, called the clarified sample,
was loaded onto a Co-chelating Sepharose gel (Talon; BD Biosciences).
After several wash steps, the poly-His-tagged protein was eluted by an
elution buffer containing 50 mM sodium phosphate, 300 mM sodium
chloride, and 150 mM imidazol on a gravity flow column (BD Biosciences).
For the analysis of total bacterial proteins, aliquots were pelleted in a
microcentrifuge, boiled in SDS-lysis buffer (0.1 M Tris-HCl, pH 6.8, 1.6%
glycerol, 0.008% bromphenol blue, 4 mM EDTA, 10 mM DTT, and 3%
SDS) for 3 min at 958C, and loaded on a 12% SDS-polyacrylamide gel.
Proteins were visualized by Coomassie Brilliant Blue R 250 staining, and
their concentrations were determined spectrophotometrically by the
Bradford assay (Bradford, 1976). Before enzymatic activity assays,
an additional purification step was performed because FaQR extracts
1034 The Plant Cell

purified by His tag affinity chromatography still contained native quinone
oxidoreductase activities of E. coli cells. The protein extract eluted from
Talon was transferred to an ultrafiltration tube (Amicon Ultra 4 centrifugal
filter device) with a nominal molecular mass limit of 50 kD. The flow-
through, containing proteins of <50 kD, was transferred to another
ultrafiltration tube with a nominal molecular mass limit of 30 kD. The
supernatant of the second ultrafiltration step, containing proteins of the
molecular mass range from 30 to 50 kD, was devoid of native E. coli
quinone oxidoreductase activity but still contained recombinant FaQR
and was used for enzymatic activity assays.
Determination of HDMF-Forming and Quinone-Reducing
Enzymatic Activity
Forty milligrams (98 mmol) of D-fructose-1,6-diphosphate and 2 mg
(2.8 mmol) of NADH were added to 15 mg of purified FaQR in 1 mL of
phosphate buffer, pH 7.0 (0.1 M). The solution was incubated for 24 h at
308C in a shaker. Products were analyzed by HPLC-MS/MS. Quinone
reductase activity was determined after the addition of different 1,2- and
1,4-quinones (20 nmol) and 90 nmol of NADH to 10 mL of a purified FaQR
protein extract (10 mg of protein) dissolved in 1 mL of phosphate buffer,
pH 7.0 (0.1 M). Decreasing NADH absorption was determined spectro-
photometrically (Safire) at 340 nm for 30 min at 308C. In addition,
synthesized HMMF or EDHMF was incubated under the same conditions
(30 min, 308C) with FaQR protein. Products were analyzed by HPLC-
MS/MS. Km and Vmax values were determined by fitting the data to
the Michaelis-Menten equation with a nonlinear regression program
(Hyper32, version 1.00; http://homepage.ntlworld.com/john.easterby/
hyper32.html). For the time course experiment showing the competition
of FaQR and 3-mercaptobenzoic acid for HMMF, the acid (0.04 mg,
259 nmol) was added to a preincubated (10 min) 1-mL assay solution (4 mg
[5.6 mmol] of NADH and 40 mg [98 mmol] of D-fructose-1,6-diphosphate)
or to a phosphate-buffered solution, pH 7.0 (1 mL, 0.1 M), containing
40 mg (98 mmol) of D-fructose-1,6-diphosphate, and the mixture was
incubated under standard conditions.
Detection of HMMF in Strawberry Fruits
Fifty microliters of a 0.6 M 3-mercaptobenzoic acid solution (70% ethanol)
was injected daily into strawberry fruits of the pink ripening stage for a
period of 3 d. After storage at room temperature, the fruits were subjected
to XAD-2 solid-phase extraction (Roscher et al., 1997), and the diethyl
ether and methanol extracts were analyzed for the presence of trapped
HMMF using HPLC-MS/MS.
Accession Numbers
Sequence data from this article have been deposited with the GenBank/
EMBL data libraries under the accession numbers AY158836, AY048861,
AJ001445, AF193789, and AF220491. The accession numbers for the
sequence alignment shown in Figure 4 are AY048861 for Fragaria 3
ananassa (F. ananassa), AJ001445 for Fragaria vesca, U20808 for Vigna
radiata, AF451799 for Arabidopsis thaliana, AF384244 for Helianthus
annuus, and NM188914 for Oryza sativa.
ACKNOWLEDGMENTS
We thank Asaph Aharoni, Stefan Lunkenbein, Fredi Bruehlmann, and
Tobias Hauck for helpful discussions, Walli Seefelder and Steffi Diehm
for HPLC-MS/MS determinations, Ulrike Holzgrabe and Ulrich Schmitt
for capillary zone electrophoresis measurements, and Heather Coiner for
correction of the manuscript.
Received November 25, 2005; revised January 11, 2006; accepted
February 1, 2006; published March 3, 2006.
REFERENCES
Aharoni, A., Gaidukov, L., Khersonsky, O., McQ Gould, S., Roodveldt,
C., and Tawfik, D.S. (2005). The ‘evolvability’ of promiscuous protein
functions. Nat. Genet. 37, 73–76.
Aharoni, A., Giri, A.P., Verstappen, F.W.A., Bertea, C.M., Sevenier,
R., Sun, Z., Jongsma, M.A., Schwab, W., and Bouwmeester, H.J.
(2004). Gain and loss of fruit flavor compounds produced by wild and
cultivated strawberry species. Plant Cell 16, 3110–3131.
Aharoni, A., et al. (2000). Identification of the SAAT gene involved in
strawberry flavor biogenesis by use of DNA microarrays. Plant Cell 12,
647–661.
Aharoni, A., Keizer, L.C.P., Van Den Broeck, H.C., Blanco-Portales,
R., Munoz-Blanco, J., Bois, G., Smit, P., De Vos, R.C.H., and
O’Connell, A.P. (2002). Novel insight into vascular, stress, and auxin-
dependent and -independent gene expression programs in straw-
berry, a non-climacteric fruit. Plant Physiol. 129, 1019–1031.
Aharoni, A., and O’Connell, A.P. (2002). Gene expression analysis of
strawberry achene and receptacle maturation using DNA microarrays.
J. Exp. Bot. 53, 2073–2087.
Benıtez-Burraco, A., Blanco-Portales, R., Redondo-Nevado, J.,
Bellido, M.L., Moyano, E., Caballero, J.L., and Munoz-Blanco, J.
(2003). Cloning and characterization of two ripening-related straw-
berry (Fragaria 3 ananassa cv. Chandler) pectate lyase genes. J. Exp.
Bot. 54, 633–645.
Blanco-Portales, R., Medina-Escobar, N., Lopez-Raez, J.A., Gonzalez-
Reyes, J.A., Villalba, J.M., Moyano, E., Caballero, J.L., and
Munoz-Blanco, J. (2002). Cloning, expression and immunolocaliza-
tion pattern of a cinnamyl alcohol dehydrogenase gene from
strawberry (Fragaria 3 ananassa cv. Chandler). J. Exp. Bot. 53,
1723–1734.
Bradford, M. (1976). A rapid and sensitive method for the quantification
of microgram quantities of protein utilizing the principle of protein-dye
binding. Anal. Biochem. 72, 248–254.
Bruche, G., Schmarr, H.-G., Bauer, A., Mosandl, A., Rapp, A., and
Engel, L. (1991). Stereoisomere Aromastoffe. LI: Stereodifferenzierung
chiraler Furanone. Moglichkeiten und Grenzen der herkunftsspe-
zifischen Aromastoff-Analyse. Z. Lebensm. Unters. Forsch. 193,
115–118.
Civello, P.M., Powell, A.L.T., Sabehat, A., and Bennett, A.B. (1999).
An expansin gene expressed in ripening strawberry fruit. Plant
Physiol. 121, 1273–1279.
Devereux, J., Haeberli, P., and Smithies, O. (1984). A comprehensive
set of sequence analysis programs for the VAX. Nucleic Acids Res.
12, 387–395.
Dick, R.A., and Kensler, T. (2004). The catalytic and kinetic mechanism
of NADH-dependent alkenal/one oxidoreductase. J. Biol. Chem. 279,
17269–17277.
Douillard, C., and Guichard, E. (1989). Comparison by multidimen-
sional analysis of concentrations of volatile compounds in fourteen
frozen strawberry varieties. Sci. Aliments 9, 53–76.
Douillard, C., and Guichard, E. (1990). The aroma of strawberry
(Fragaria ananassa): Characterisation of some cultivars and influence
of freezing. J. Sci. Food Agric. 50, 517–531.
Edwards, K.J., Barton, J.D., Rossjohn, J., Thorn, J.M., Taylor, G.L.,
and Ollis, D.L. (1996). Structural and sequence comparisons of
quinone oxidoreductase, z-crystallin, and glucose and alcohol dehy-
drogenases. Arch. Biochem. Biophys. 328, 173–183.
Hancock, J.F. (1999). Strawberries. (Wallingford, UK: CABI Publishing).
Furanone Formation in Strawberry Fruit 1035
Harpster, M.H., Brummell, D.A., and Dunsmuir, P. (1998). Expression
analysis of a ripening-specific auxin-repressed endo-1,4-glucanase
gene in strawberry. Plant Physiol. 118, 1307–1316.
Harrison, E.P., McQueen-Mason, S.J., and Manning, K. (2001).
Expression of six expansin genes in relation to extension activity in
developing strawberry fruit. J. Exp. Bot. 52, 1437–1446.
Hauck, T., Landmann, C., Raab, T., Bruhlmann, F., and Schwab, W.
(2002). Chemical formation of 4-hydroxy-2,5-dimethyl-3[2H]-furanone
from D-fructose 1,6-diphosphate. Carbohydr. Res. 337, 1185–1191.
Higo, K., Ugawa, Y., Iwamoto, M., and Korenaga, T. (1999). Plant cis-
acting regulatory DNA elements (PLACE) database: 1999. Nucleic
Acids Res. 27, 297–300.
Hodge, J.E., Fisher, B.E., and Nelson, H.A. (1963). Dicarbonyls,
reductones, and heterocyclics produced by reaction of reducing
sugars with secondary amine salts. Am. Soc. Brew. Chem. Proc.
83, 84–92.
Honkanen, E., and Hirvi, T. (1990). The flavour of berries. In Food
Flavours, I.D. Morton and A.J. MacLeod, eds (Amsterdam: Elsevier
Scientific Publications), pp. 125–193.
Larsen, M., and Poll, L. (1992). Odor thresholds of some important
aroma compounds in strawberries. Z. Lebensm. Unters. Forsch. 195,
120–123.
Larsen, M., Poll, L., and Olsen, C.E. (1992). Evaluation of the aroma
composition of some strawberry (Fragaria ananassa Duch) cultivars
by use of odour threshold values. Z. Lebensm. Unters. Forsch. 195,
536–539.
Laskowski, M.J., Dreher, K.A., Gehring, M.A., Abel, S., Gensler, A.L.,
and Sussex, I.M. (2002). FQR1, a novel primary auxin-response gene,
encodes a flavin mononucleotide-binding quinone reductase. Plant
Physiol. 128, 578–590.
Latrasse, A. (1991). Fruits III. In Volatile Compounds in Foods and
Beverages, H. Maarse, ed (New York: Dekker), pp. 329–387.
Lavid, N., Schwab, W., Kafkas, E., Koch-Dean, M., Bar, E., Larkov,
O., Ravid, U., and Lewinsohn, E. (2002). Aroma biosynthesis in
strawberry: S-Adenosylmethionine:furaneol O-methyltransferase ac-
tivity in ripening fruits. J. Agric. Food Chem. 50, 4025–4030.
Manning, K. (1991). Isolation of nucleic acids from plants by differential
solvent precipitation. Anal. Biochem. 195, 45–50.
Manning, K. (1998). Isolation of a set of ripening-related genes from
strawberry: Their identification and possible relationship to fruit quality
traits. Planta 205, 622–631.
Mano, J., Torii, Y., Hayashi, S., Takimoto, K., Matsui, K., Nakamura,
K., Inze, D., Babiychuk, E., Kuhnir, S., and Asada, K. (2002). The
NADPH:quinone oxidoreductase P1-z-crystallin in Arabidopsis cata-
lyzes the a,b-hydrogenation of 2-alkenals: Detoxication of the lipid
peroxide-derived reactive aldehydes. Plant Cell Physiol. 43, 1445–1455.
Mano, J.I., Babiychuk, E., Belles-Boix, E., Hiratake, J., Kimura, A.,
Inze, D., Kushnir, S., and Asada, K. (2000). A novel NADPH:diamide
oxidoreductase activity in Arabidopsis thaliana P1 zeta-crystallin. Eur.
J. Biochem. 267, 3661–3671.
Matvienko, M., Wojtowicz, A., Wrobel, R., Jamison, D., Goldwasser,
Y., and Yoder, J.I. (2001). Quinone oxidoreductase message levels
are differentially regulated in parasitic and non-parasitic plants ex-
posed to allelopathic quinones. Plant J. 25, 375–387.
Medina-Escobar, N., Cardenas, J., Valpuesta, V., Munoz-Blanco, J.,
and Caballero, J.L. (1997). Cloning and characterization of cDNAs
from genes differentially expressed during the strawberry fruit ripen-
ing process by a MAST-PCR-SBDS method. Anal. Biochem. 248,
288–296.
Milanesi, L., D’Angelo, D., and Rogozin, I.B. (1999). GeneBuilder:
Interactive in silico prediction of gene structure. Bioinformatics 15,
612–621.
Moyano, E., Portero-Robles, I., Medina-Escobar, N., Valpuesta, V.,
Munoz-Blanco, J., and Caballero, J.L. (1998). A fruit-specific puta-
tive dihydroflavonol 4-reductase gene is differentially expressed in
strawberry during the ripening process. Plant Physiol. 117, 711–716.
Nam, Y.W., Tichit, L., Leperlier, M., Cuerq, B., Marty, I., and Lelievre,
J.M. (1999). Isolation and characterization of mRNAs differentially
expressed during ripening of wild strawberry (Fragaria vesca L.) fruits.
Plant Mol. Biol. 39, 629–636.
Nordling, E., Jornvall, H., and Persson, B. (2002). Medium-chain
dehydrogenases/reductases (MDR): Family characterizations includ-
ing genome comparisons and active site modelling. Eur. J. Biochem.
269, 4267–4276.
Ohloff, G. (1969). Chemie der Geruchs- und Geschmacksstoffe.
Fortschr. Chem. Forsch. 12, 185–253.
Perez, A.G., Olıas, R., Sanz, C., and Olıas, J.M. (1996). Furanones in
strawberries: Evolution during ripening and postharvest shelf life.
J. Agric. Food Chem. 44, 3620–3624.
Perkins-Veazie, P. (1995). Growth and ripening of strawberry fruit.
Hortic. Rev. 17, 267–297.
Pyysalo, T., Honkanen, E., and Hirvi, T. (1979). Volatiles of wild
strawberries, Fragaria vesca L. compared to those of cultivated
berries, Fragaria 3 ananassa cv. Senga Sengana. J. Agric. Food
Chem. 27, 19–22.
Quandt, K., Frechm, K., Karasm, H., Wingender, E., and Werner, T.
(1995). MatInd and MatInspector: New fast and versatile tools for
detection of consensus matches in nucleotide sequence data. Nucleic
Acids Res. 11, 4878–4884.
Raab, T., Hauck, T., Knecht, A., Schmitt, U., Holzgrabe, U., and
Schwab, W. (2003a). Tautomerism of 4-hydroxy-2,5-dimethyl-3(2H)-
furanone: Evidence for its enantioselective biosynthesis. Chirality 15,
573–578.
Raab, T., Schmitt, U., Hauck, T., Knecht, A., Holzgrabe, U., and
Schwab, W. (2003b). Capillary electrophoretic resolution of the en-
antiomers of 2,5-dimethyl-4-hydroxy-3(2H)-furanone, the key flavor
compounds in strawberry fruit. Chromatographia 57, 501–504.
Redondo-Nevado, J., Moyano, E., Medina-Escobar, N., Caballero,
J.L., and Munoz-Blanco, J. (2001). A fruit specific and developmen-
tally regulated endopolygalacturonase gene from strawberry (Fragaria3
ananassa cv. Chandler). J. Exp. Bot. 52, 1941–1945.
Rodin, J.O., Himel, C.M., Silverstein, R.M., Leeper, R.W., and
Gortner, W.A. (1965). Volatile flavor and aroma components of
pineapple. Isolation and tentative identification of 2,5-dimethyl-4-
hydroxy-3(2H)-furanone. J. Food Sci. 30, 280–285.
Roscher, R., Bringmann, G., Schreier, P., and Schwab, W. (1998).
Radiotracer studies on the formation of 2,5-dimethyl-4-hydroxy-
3(2H)-furanone in detached ripening strawberry fruits. J. Agric. Food
Chem. 46, 1488–1493.
Roscher, R., Herderich, M., Steffen, J.-P., Schreier, P., and Schwab,
W. (1996). 2,5-Dimethyl-4-hydroxy-3(2H)-furanone 69-O-malonyl-b-D-
glucopyranoside in strawberry fruits. Phytochemistry 43, 155–159.
Roscher, R., Schreier, P., and Schwab, W. (1997). Metabolism of 2,5-
dimethyl-4-hydroxy-3(2H)-furanone in detached ripening strawberry
fruits. J. Agric. Food Chem. 45, 3202–3205.
Ross, D. (1997). Quinone reductases. In Comprehensive Toxicology,
Vol. 3, F.P. Guengrich, ed. (New York: Pergamon Press), pp.
1779–197.
Sanz, C., Richardson, D.G., and Perez, A.G. (1995). 2,5-Dimethyl-4-
hydroxy-3(2H)-furanone and derivatives in strawberries during ripen-
ing. In Fruit Flavors: Biogenesis, Characterization, and Authentication,
ACS Symposium Series No. 596, R.L. Rouseff and M.M. Leahy, eds
(Washington, DC: American Chemical Society), pp. 268–275.
Schagger, H., and von Jagow, G. (1987). Tricine-sodium dodecyl
sulfate-polyacrylamide gel electrophoresis for the separation of pro-
teins in the range from 1 to 100 kDa. Anal. Biochem. 166, 368–379.
1036 The Plant Cell

Schieberle, P., and Hofmann, T. (1997). Evaluation of the character
impact odorants in fresh strawberry juice by quantitative measure-
ments and sensory studies on model mixtures. J. Agric. Food Chem.
45, 227–232.
Schwab, W. (1998). Application of stable isotope ratio analysis explain-
ing the bioformation of 2,5-dimethyl-4-hydroxy-3(2H)-furanone in
plants by a biological Maillard reaction. J. Agric. Food Chem. 46,
2266–2269.
Schwab, W., and Roscher, R. (1997). 4-Hydroxy-3(2H)-furanones:
Natural and Maillard products. Recent Res. Dev. Phytochem. 1,
643–673.
Sen, A., Schieberle, P., and Grosch, W. (1991). Quantitative determi-
nation of 2,5-dimethyl-4-hydroxy-3(2H)-furanone and its methyl ether
using a stable isotope dilution assay. Lebensm. Wiss. Technol. 24,
364–369.
Soler, A., Bartholomew, D.P., and Rohrbach, K.G. (1993). Enzymatic
characterization of stress induced translucence of pineapple flesh in
the Ivory Coast. Acta Hortic. 334, 295–304.
Thorn, J.M., Barton, J.D., Dixon, N.E., Ollis, D.L., and Edwards, K.J.
(1995). Crystal structure of Escherichia coli QOR quinone oxidore-
ductase complexed with NADH. J. Mol. Biol. 249, 785–799.
Trainotti, L., Spinello, R., Piovan, A., Spolaore, S., and Casadoro, G.
(2001). b-Galactosidases with a lectin-like domain are expressed in
strawberry. J. Exp. Bot. 52, 1635–1645.
Trainotti, L., Spolaore, S., Pavanello, A., Baldan, B., and Casadoro,
G. (1999). A novel E-type endo b-1,4-glucanase with a putative
cellulose-binding domain is highly expressed in ripening strawberry
fruits. Plant Mol. Biol. 40, 323–332.
Trost, P., Bonora, P., Scagliarini, S., and Pupillo, P. (1995). Purifica-
tion and properties of NAD(P)H:(quinone-acceptor) oxidoreductase of
sugarbeet cells. Eur. J. Biochem. 234, 452–458.
Wein, M., Lavid, N., Lunkenbein, S., Lewinsohn, E., Schwab, W., and
Kaldenhoff, R. (2002). Isolation, cloning and expression of a multi-
functional O-methyltransferase capable of forming 2,5-dimethyl-
4-methoxy-3(2H)-furanone, one of the key aroma compounds in
strawberry fruits. Plant J. 6, 755–765.
Wein, M., Lewinson, E., and Schwab, W. (2001). Metabolic fate
of isotopes during the biological transformation of carbohydrates to
2,5-dimethyl-4-hydroxy-3(2H)-furanone in strawberry fruits. J. Agric.
Food Chem. 49, 2427–2432.
Willhalm, B., Stoll, M., and Thomas, A.F. (1965). 2,5-Dimethyl-4-
hydroxy-2,3-dihydrofuran-3-one. Chem. Ind. 18, 1629–1630.
Furanone Formation in Strawberry Fruit 1037

DOI 10.1105/tpc.105.039784; originally published online March 3, 2006; 2006;18;1023-1037Plant Cell
Wilfried Schwab and Juan Muñoz-BlancoThomas Raab, Juan Antonio López-Ráez, Dorothée Klein, Jose Luis Caballero, Enriqueta Moyano,
4-Hydroxy-2,5-Dimethyl-3(2H)-Furanone, Encodes an Enone Oxidoreductase, Required for the Biosynthesis of the Strawberry Flavor CompoundFaQR
This information is current as of February 25, 2020
References /content/18/4/1023.full.html#ref-list-1
This article cites 59 articles, 8 of which can be accessed free at:
Permissions https://www.copyright.com/ccc/openurl.do?sid=pd_hw1532298X&issn=1532298X&WT.mc_id=pd_hw1532298X
eTOCs http://www.plantcell.org/cgi/alerts/ctmain
Sign up for eTOCs at:
CiteTrack Alerts http://www.plantcell.org/cgi/alerts/ctmain
Sign up for CiteTrack Alerts at:
Subscription Information http://www.aspb.org/publications/subscriptions.cfm
is available at:Plant Physiology and The Plant CellSubscription Information for
ADVANCING THE SCIENCE OF PLANT BIOLOGY © American Society of Plant Biologists