fare evasion study - metrolibraryarchives.metro.net/.../2002_horizon_fare_evasion_study.pdf · fare...
TRANSCRIPT
Metropolitan Transit Authority
Fare Evasion Study
February 2002
HORIZON RESEARCH CORPORATION

----~--------------Background
• The Metropolitan Transportation Authority (MT A) is the primary provider of transit-related services for the Southern California region and. is dedicated to providing Southern California residents and visitors transportation alternatives and solutions.
• The MTA's Metro Rail system operates approximately 60 miles of rail service accommodating an estimated 5 million passenger boardings each month. Metro Rail consists of three lines: Red, Blue, and Green.
• Currently, the Metro Rail operates on a barrier-free system, which requires passengers to purchase a valid ticket or pass prior to boarding a train. The primary means of ensuring that riders have valid tickets is via random inspections (by LAPD/LASD) that carry the threat of a $250 fine. In contrast to traditional barrier systems, there are no turnstiles or station attendants.
• The viability of a barrier-free system depends on the extent of fare evasion by the ridership.
2 HORIZON RESEARCH CORPORATION
.......
----~----~---------
Objectives
.. Objectives -+- The primary objective of this study was to provide MT A with an accurate
estimate of the fare evasion rate on the Metro Rail System.
-+- The secondary objective was to assess the key factors that impact the fare evasion rate and make recommendations on how to decrease it.
3 HORIZON RESEARCH CORPORATION
- - - - .. _. - _. - .. - ... _.- -- - - - .. Methodology
... Sampling ... To meet the primary objective of estimating the evasion rate, we inspected
the fares of 4928 Metro Rail system riders. -+- Fare Checks started on January 7th, 2002 and continued through to January 18th,
2002.
-+- We resumed the Fare Check February 19th through 28th, 2002, to survey ridership in the period from 9pm to 11 pm, after a pilot test suggested that the evasion rate was extraordinarily higher after 9pm .
... To meet the secondary objective of assessing the factors impacting evasion rate, we interviewed 485 riders; 173 fare evaders and 312 validfare commuters.
,'',.\ \{". -----.~ '~---- ... ,.
-+- In addition to the fare check, the interview for this phase included a Diagnostic section for assessing the factors impacting the evasion.
-+- 120 of these 485 interviews were conducted as part of the Fare Check phase described above.
-+- The 312 valid-fare commuter interviews and 53 of the fare evader interviews were conducted by a separate team from that conducting the fare checks described above. These interviews started on January 7th, 2002 and continued through to January 14th, 2002.
4 HORIZON RESEARCH CORPORATION

.. - - .. --.. -"-- - - .. - .. - -- -~ - .. - ... Methodology
... Sampling (Cont.) -+- The following table contains a breakdown of our samples in terms of the a)
time of day, b) day-type, and c) Metro Line at which the interviews were conducted.
-+- This data is presented alongside the data collected as part of the MTA Ridership Survey (through December, 2001), which measures the actual ridership patterns throughout the Metro Rail system.
-+- Our estimates of the Fare Evasion rates were weighted to control for minor discrepancies that emerged between our Fare Check sample and the MT A Ridership data.
-+- See Appendix E for details of this weighting procedure.
~\A/&
./------- ~. HORIZON RESEARCH CORPORATION
5

- - - - ~ .. ' - - - ... - - - "- -- - .. - .. Methodology
... Sampling (Cant.)
SAMPLE BREAKDOWN TABLE
Fare-Check Diagnostic Ridership Sample Sample Data
Base: 4928 485 -
Time of Day
6am-9am 21% 19% 16%
9am-3pm 31% 43% 43%
3pm-7pm 31% 17% 32%
7pm-11pm 17% 21% 8%
Day-Type
Weekdays 82% 81% 83%
Weekends 18% 19% 17%
Metro Line
Blue 28% 38% 36%
Green 21% 29% 13%
Red 51% 31% 51%
6 HORIZON RESEARCH CORPORATION

- - - --- '.' - - - - - - _. - - - .. - -Methodology
+ Sampling (Cont.) -+- Two independent samples were drawn, one for fare checks and one for
Diagnostic Interviews (see Interviewing Procedure on slide 10). Each sample consisted of riders waiting for trains at a specified sequence of stations.
-+- A probability sampling method was used to select the sequence of stations for each sample.
-+- Interviewers were instructed to spend 15 minutes at each station, do as many interviews as possible, then move on to the next station in the sequence. Interviewers worked on each sequence for 2-2.5 hours.
-+- The assessment period modeled one complete week of operation, from Monday to Sunday, on all three Metro Lines.
-+- See Appendix A for a complete description of how the sample was selected.
7 HORIZON RESEARCH CORPORATION
- - - - .. _. - -~ - - - - - .. - - - ... - .. Methodology
.. Questionnaire -+- In conjunction with the MTA, we developed a questionnaire consisting of a
Fare Check and a Diagnostic Interview. + The Fare Check Interview identified whether a rider was an evader or not
based on fare medium used.
+ Interviewers asked riders for their fare media and evaluated whether or not it was valid.
+ The Diagnostic Interview contained these sections:
+ Fare Check
+ The second section consisted of a battery of questions aimed at measuring riders knowledge of and attitudes towards the Metro system.
+ The third section consisted of questions related to commuter characteristics, such as demographics and travel patterns.
-+- To accommodate riders who are primary Spanish speakers, our questionnaire was translated into Spanish.
+ See Appendix D for English and Spanish versions of the questionnaire.
8 HORIZON RESEARCH CORPORATION
- - - - -- _ •. - - - .. - - - - -- - .. - .. Methodology
.. Interviewer Training ... All interviewing candidates were trained to recognize valid fare media. All
candidates were tested for their knowledge of valid fare media, and only those scoring at least 800/0 on the test were permitted to conduct the interviews.
+ See Appendix C for this test, as well as the scores obtained by the interviewers.
... Interviewers were trained in the use of both English and Spanish versions of the questionnaire, and in the operation of the hand-held units used in data collection.
+ Only one of our interviewers did not speak Spanish.
9 HORIZON RESEARCH CORPORATION

____ -___ c _ _ _ _ _ _ _ _ _'-- _ iii _ ..
Methodology
... Interviewing Procedure -+- We used two interviewing teams, one for the Fare Check phase and one
for Diagnostic Interviewing phase. -+ Fare-checkers checked fares and conducted Diagnostic interviews with Fare Evaders.
-+ Diagnostic interviewers conducted Diagnostic Interviews with everyone.
-+ Valid Fare riders were asked to participate in the Diagnostic Interview while Fare Evaders were interviewed without an explicit agreement.
-+- Both teams used the following procedures: -+ Each team would start its task at an assigned station at a given day and time.
-+ Two interviewers would either start at opposite ends of the platform and work their way towards each other or they would start in the middle and work towards the opposite ends of the platform, away from each other. This platform sweep strategy was systematically altered from station to station.
-+ This alternating sweep strategy was implemented because in the pilot test we noticed a potential trend: Fare evaders appeared to hide at specific out of sight location on the platform (usually at the ends, behind stairwells) to minimize their visibility and likelihood of getting caught.
-+ The interviewers would continue fare checking or interviewing for as long as there were any riders at the platform or for maximum duration of 15 minutes.
10 HORIZON RESEARCH CORPORATION
----~--~-----~--~--
Methodology
.. Interviewing Procedure (Cant.)
... Both teams used the following procedures (Cont.): .. After the allocated time at a specific station expired, the interviewers would ride to the next
(consecutive) station in the assigned direction and repeat the process above.
.. The interviewers would continue this process of checking for up to 15 minutes at a station and then move to the next consecutive station for a fixed duration of time, generally 2-2.5 hours during weekdays and 1-1.5 hours during the weekend .
.. Then they would go to next assigned station (assignment).
.. For more details, see Appendix A
11 HORIZON RESEARCH CORPORATION

Methodology
.. Interviewing Procedure (Cant.)
.. To minimize the refusal rate, the following procedures were adopted:
+ Every interviewing team consisted of two interviewers and two undercover police officers.
+ In the event that a commuter selected by an interviewer refused to cooperate, police assistance was used to persuade the commuter to comply.
+ A $5 voucher was offered to Valid Fare riders as an incentive to complete the Diagnostic Interview.
+ These procedures resulted in a refusal rate of only .30/0 of all contacts (refusals/(completes+refusals)) for both Fare Checks and Diagnostic Interviews.
.. Fare Evasion + Evaders were classified as riders who did not have a ticket/pass, claimed
to have lost it, had an invalid ticket/pass or refused to show a ticket/pass.
12 HORIZON RESEARCH CORPORATION
----~--~-~---~--~--
Overall Fare Evasion Rate
HORIZON RESEARCH CORPORATION
--- - - - .. _ .. - _. - - - - - .- - - - - .. Overall Fare Evasion Rate
.. All the estimates in this section are based on sampling Metro operations from 6am to 11 pm. We estimate that this represents over 950/0 of the total rider population.
14 HORIZON RESEARCH CORPORATION
----~--~-----~--~--
Overall Fare Evasion Rate
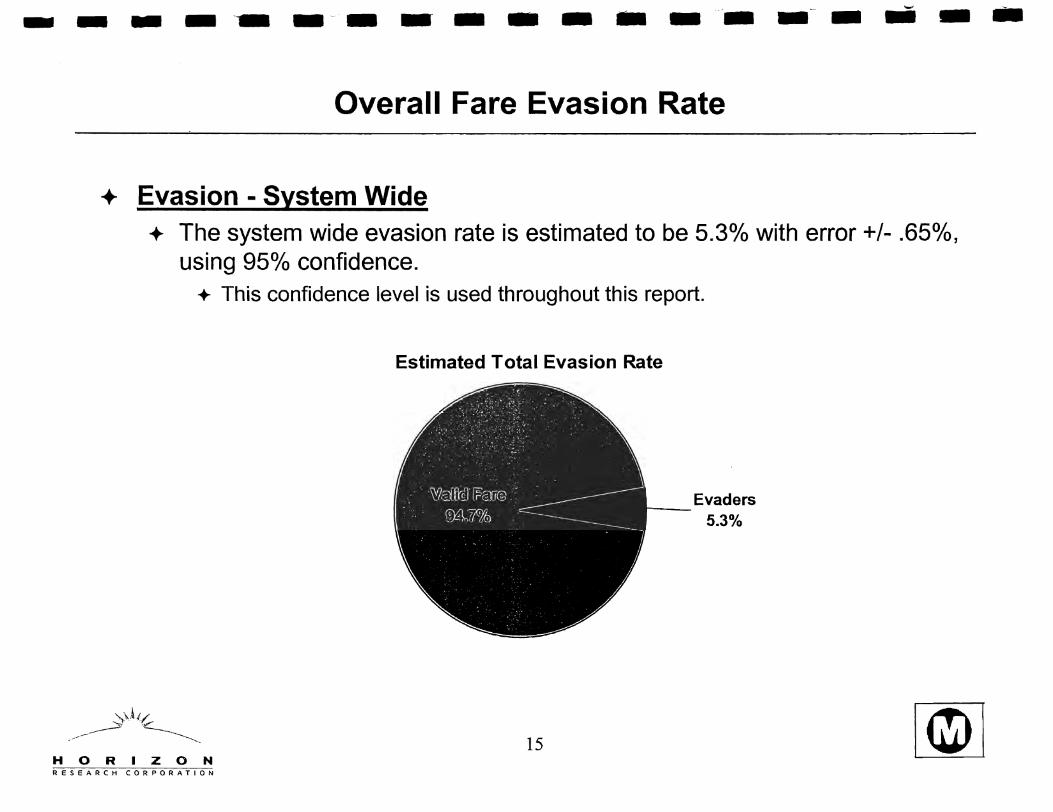
... Evasion - System Wide ... The system wide evasion rate is estimated to be 5.3% with error +/- .65%,
using 950/0 confidence. -+- This confidence level is used throughout this report.
.\",tl/ " '~ ~--- ~
HORIZON RESEARCH CORPORATION
Estimated Total Evasion Rate
Evaders r---
5.3%
15

- - - --- - - - - - - - - -- -~ - .. - -Overall Fare Evasion Rate
... Evasion by Day-Type + The evasion rate is significantly higher on weekdays (5.5%, +/-.71 0/0),
compared to weekends (4.30/0, +/-1.36%).
Estimated Evasion Rate by Day-Type 10.0%
8.0%
6.0% 5.5%
4.3%
4.0%
2.0%
0.0% -+-----~
Weekday Weekend
16 HORIZON RESEARCH CORPORATION
- - - - __ _. _ .. _ _ _ _ _ -_ _ _ IIIi _ -
Overall Fare Evasion Rate
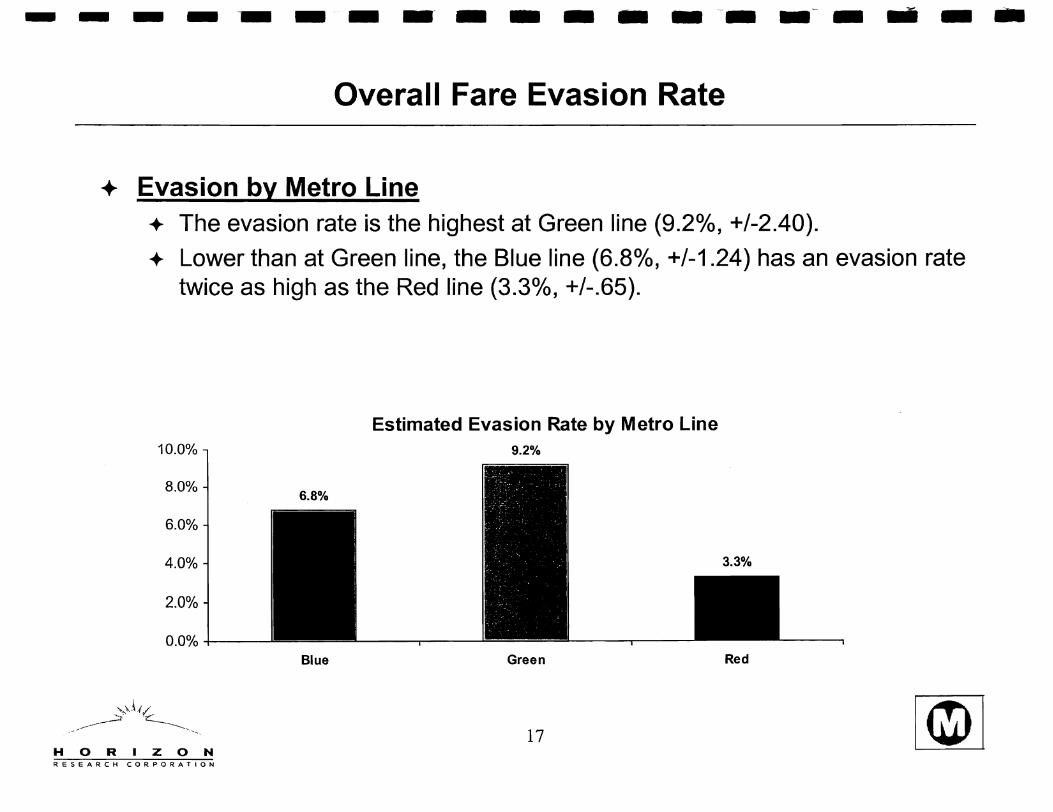
.. Evasion by Metro Line ... The evasion rate is the highest at Green line (9.20/0, +/-2.40).
... Lower than at Green line, the Blue line (6.80/0, +/-1.24) has an evasion rate twice as high as the Red line (3.3%, +/-.65).
Estimated Evasion Rate by Metro Line 10.0% 9.2%
8.0% 6.8%
6.0%
4.0% 3.3%
2.0%
0.0% Blue Green Red
17 HORIZON RESEARCH CORPORATION
----~-.------'-' --------
Overall Fare Evasion Rate
.. Evasion by Time of Day
15.0%
13.0%
11.0%
9.0%
7.0%
5.0%
3.0%
1.0%
-1.0%
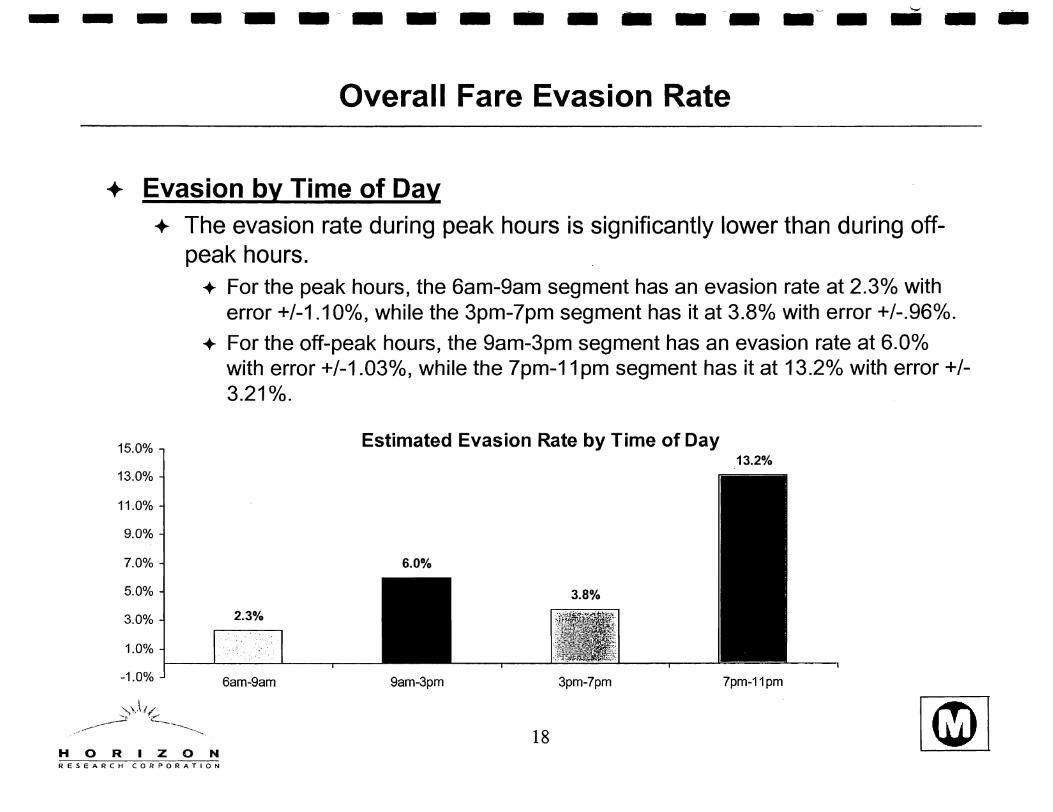
.. The evasion rate during peak hours is significantly lower than during offpeak hours.
-+- For the peak hours, the 6am-9am segment has an evasion rate at 2.3% with error +/-1.100/0, while the 3pm-7pm segment has it at 3.8% with error +/-.96%.
-+- For the off-peak hours, the 9am-3pm segment has an evasion rate at 6.0% with error +/-1.03%, while the 7pm-11 pm segment has it at 13.2% with error +/-3.21 % •
Estimated Evasion Rate by Time of Day 13.2%
6.0%
3.8%
2.3%
6am-9am 9am-3pm 3pm-7pm 7pm-11pm
18 HORIZON RESEARCH CORPORATION
- - - - -- - - _. - - - - - -- - - ... - .. Overall Fare Evasion Rate
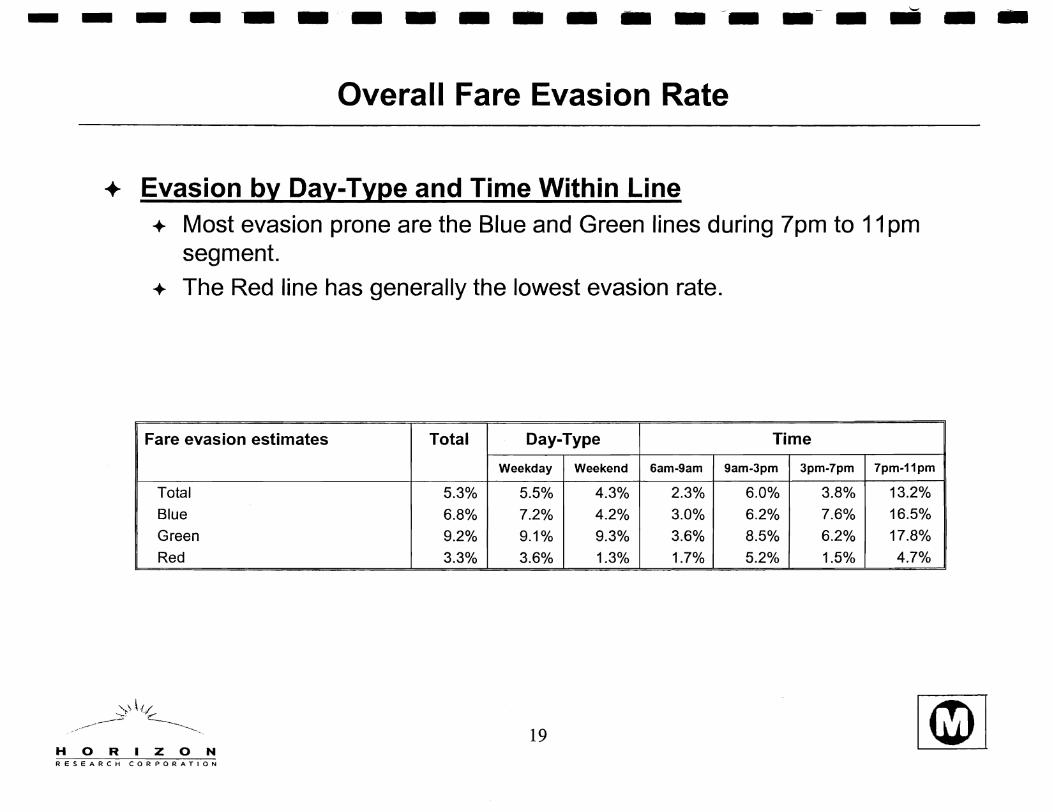
... Evasion by Day-Type and Time Within Line .. Most evasion prone are the Blue and Green lines during 7pm to 11 pm
segment. .. The Red line has generally the lowest evasion rate.
Fare evasion estimates Total Day-Type Time
Weekday Weekend 6am-9am 9am-3pm 3pm-7pm 7pm-11pm
Total 5.3% 5.5% 4.3% 2.3% 6.0% 3.8% 13.2%
Blue 6.8% 7.2% 4.2% 3.0% 6.2% 7.6% 16.5%
Green 9.2% 9.1% 9.3% 3.6% 8.5% 6.2% 17.8%
Red 3.3% 3.6% 1.3% 1.7% 5.2% 1.5% 4.7%
19 HORIZON RESEARCH CORPORATION

- - - - - _.- _. - - -'. --- --_ ... --
Typical Rider Patterns
HORIZON RESEARCH CORPORATION
- - - - -- - - - ..-. - - - - - .~- - - .. - .. Typical Rider Patterns
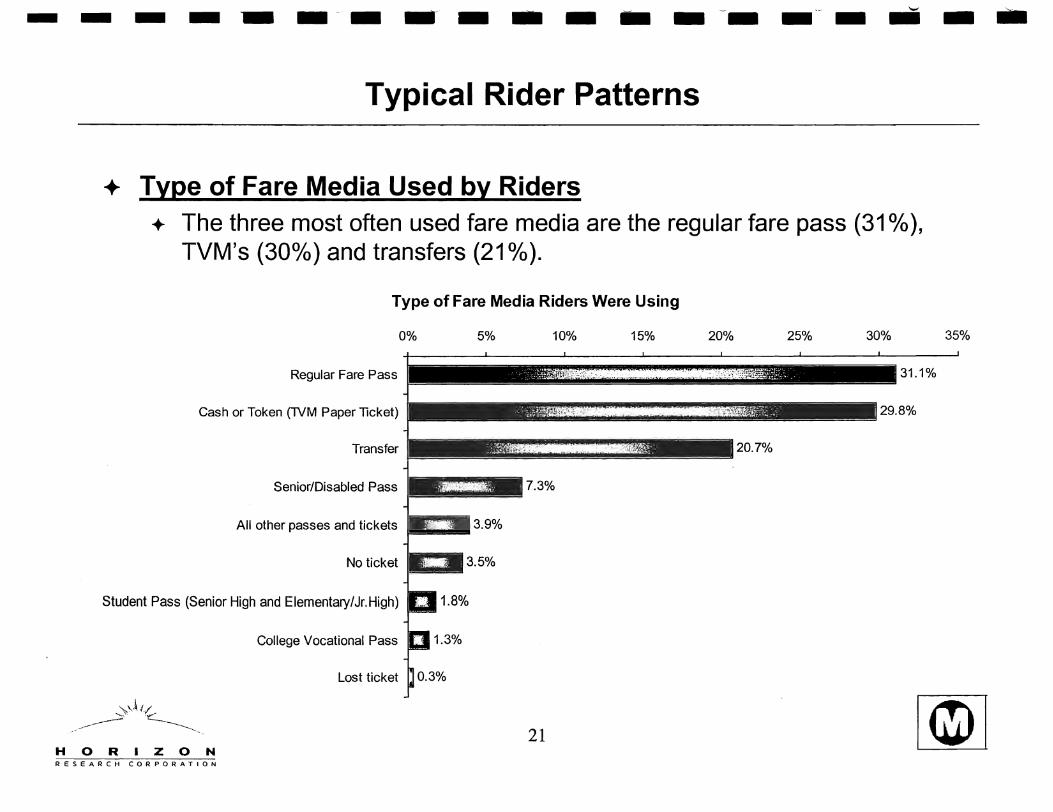
... Type of Fare Media Used by Riders ... The three most often used fare media are the regular fare pass (31 %),
TVM's (300/0) and transfers (21 %).
Type of Fare Media Riders Were Using
0% 5% 10% 15% 20% 25% 30%
Regular Fare Pass 31.1%
- ----~~-~
Cash or Token (lVM Paper llcket) '., -" .. tt;;:2-.-· I 29.8%
----, Transfer t I 20.7%
Senior/Disabled Pass
All other passes and tickets
No ticket
Student Pass (Senior High and Elementary/Jr.High)
College Vocational Pass
Lost ticket
21 HORIZON RESEARCH CORPORATION
35%

- - - --- -- - -- - - - - -~-'-' -
Typical Rider Patterns
... Fare Evaders - Fare Media Used ... 73% of Fare Evaders did not have any ticket or claimed to have lost it, while
... 230/0 had an invalid ticket. -+- The most frequent reason for an invalid fare was that the rider failed to pay the correct
price for their journey (51.3%), such as didn't get transfer, returning on a one-way ticket, etc.
Type of Fare Evaders Fare Evaders Using Invalid Fare
- ...
Refused 4% 0% 10% 20% 30% 40% 50% 60%
Wrong price 51.3%
Wrong time 22.4%
Wrong day
Wrong line
Wrong sticker
No valid 10
22 HORIZON RESEARCH CORPORATION

- - - - -- - - - - - - - - -- -~ - .... - -Typical Rider Patterns
... Reasons Fare Evaders Gave for Not Having Valid Fare + The most frequently given reason was that fare evaders did not have enough
money (230/0).
+ Also significant from the point of view of taking remedial action is that 180/0 of riders were not aware that their ticket was invalid.
Eight Most Frequent Reasons Why Fare Evaders Did Not Have Valid Fare 0% 5% 10% 15% 20% 25%
----~~~~~-
Don't ha-.e enough money to pay for fare ~~~::~,~ v i 23%
Wasn't aware that ticket was invalid 18%
Lost ticket 10%
Waiting for someone 10%
I don't ha-.e a ticket (forgot, didn't buy one, threw it away, etc.)
Ticket machine is not working
Genuinely can not find ticket
Don't ha-.e enough knowledge of the MTA system
23 HORIZON RESEARCH CORPORATION

- - - - -- - - - - - - - - -- -- - .. - -Typical Rider Patterns
.. Frequency of Metro System Usage
80%
70%
60%
50%
40%
30%
20%
10%
0%
.. More than two thirds of riders use the system 5 days or more per week .
.. Only 80/0 use the system 1 day a week or less often.
Frequency of Usage
68%
14%
7% 4% 2%
5 or more days per 3-4 days per week 1-2 days per week Less than once per Less than once per week week month
24 HORIZON RESEARCH CORPORATION
4%
First time

- - - - -- - - - - - - - - -- -~ - .. - -Typical Rider Patterns
... Age of Riders + Median age of riders is 35.9 years.
-+- 1/4 of riders are younger than 25 years.
Age of Riders 30%
23% 21% 21%
20% 17%
10%
4%
0% -1---=
Less than 18 18 to less than 25 25 to less than 35 35 to less than 45 45 to less than 55 55 or older
25 HORIZON RESEARCH CORPORATION
- - - -- - - - - - - - - -- -~ - ... - -Typical Rider Patterns
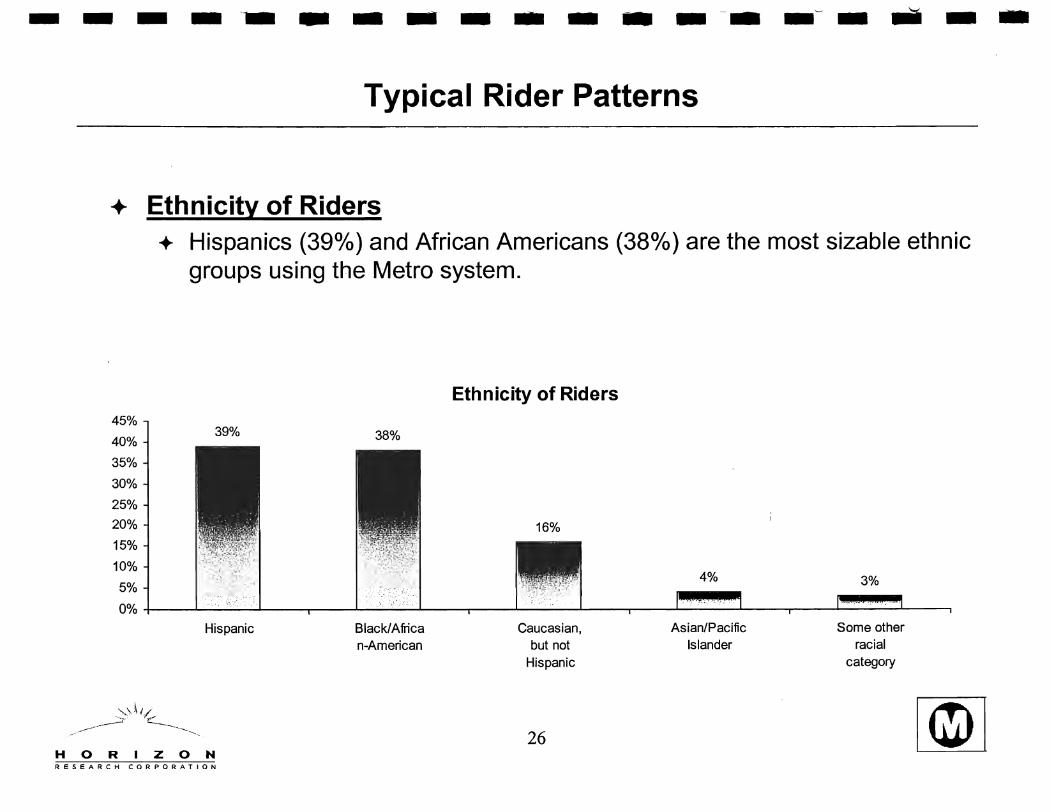
.. Ethnicity of Riders ... Hispanics (390/0) and African Americans (380/0) are the most sizable ethnic
groups using the Metro system.
45%
40% 39%
35%
30%
25%
20%
15%
10%
5%
0%
Hispanic
HORIZON RESEARCH CORPORATION
38%
Black/Africa n-American
Ethnicity of Riders
16%
Caucasian, but not
Hispanic
26
4%
Asian/Pacific Islander
3%
Some other racial
category

- - - - -- - - - - - - - - ~- -~ - .. - .. Typical Rider Patterns
+ Income or Riders
20% 18% 16%
14% 12%
10%
8%
6%
4%
2% 0%
• Riders' median household income is $16,100 .
• Almost a half (470/0) has their household income under $15,000 a year.
Gross Household Income
19%
Less than $5,000 to $10,000 to $15,000 to $25,000 to $35,000 to $50,000 to $75,000 to $100,000 to $150,000 or $5,000 $9,999 $14,999 $24,999 $34,999 $49,999 $74,999 $99,999 $149,989 more
27 HORIZON RESEARCH CORPORATION
- - - - ~ _. - - - - - - - ..• -~ - .. - -
Factors Impacting Fare Evasion
HORIZON RESEARCH CORPORATION
- - - - ~ - - .. - ... - - - .-. -'- - ... - -Factors Impacting Fare Evasion
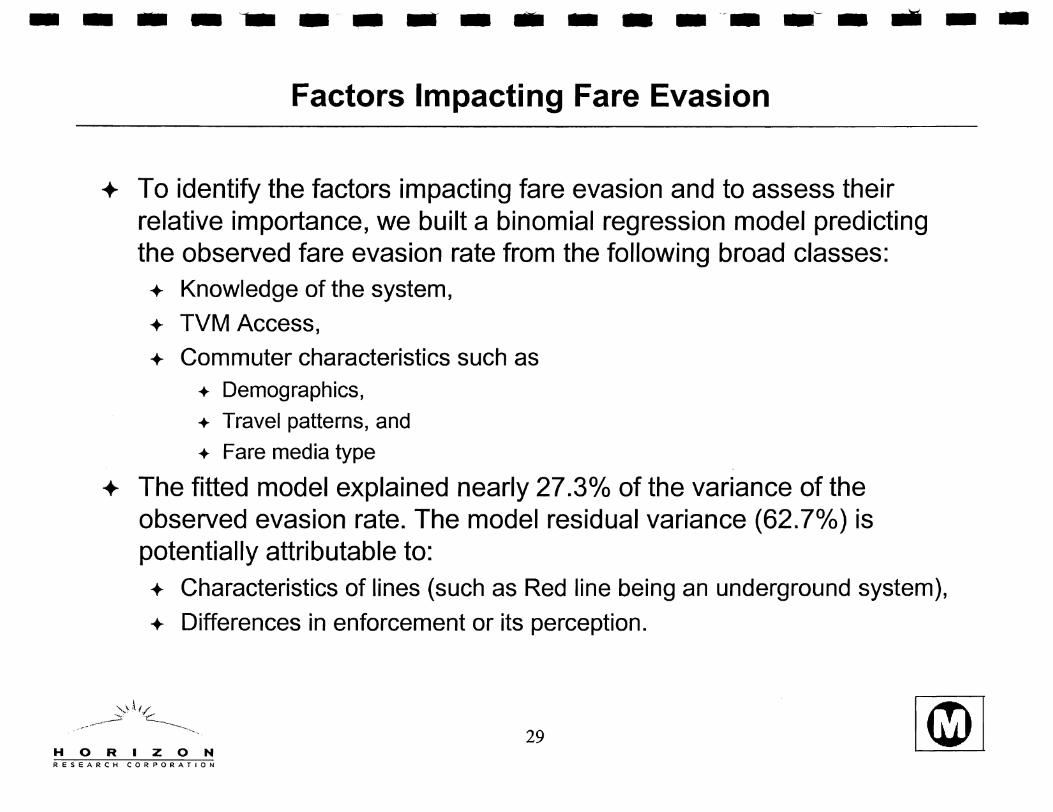
... To identify the factors impacting fare evasion and to assess their relative importance, we built a binomial regression model predicting the observed fare evasion rate from the following broad classes: + Knowledge of the system,
+ TVM Access,
+ Commuter characteristics such as .. Demographics,
.. Travel patterns, and
.. Fare media type
... The fitted model explained nearly 27.30/0 of the variance of the observed evasion rate. The model residual variance (62.70/0) is potentially attributable to: + Characteristics of lines (such as Red line being an underground system),
+ Differences in enforcement or its perception.
29 HORIZON RESEARCH CORPORATION
- - - - -- _. - - - - - - --- -~- - .. - -Factors Impacting Fare Evasion
.. Knowledge of the System + We measured knowledge of the system by asking riders to judge eight
statements about the Metro system as either true or false. -+- (1) I n order to change from one line to another you need a transfer ticket.
-+- (2) If the ticket machines are not working it is OK to get on the train without a ticket.
-+- (3) A round trip ticket can be used as often as needed until the time expires.
-+- (4) You can buy a ticket on the train if you don't have one before you get on.
-+- (5) You can be fined up to $250 for traveling without a valid ticket.
-+- (6) Listening to the radio is permitted on Metro Rail.
-+- (7) If you are traveling between two stations, you still need a ticket.
-+- (8) It is OK to eat on the Metro Rail, if you are on your way to work.
+ A Knowledge Composite Score was calculated by scoring 1 point for each of statements 1, 5, and 7 answered 'true' and 1 point for each of statements 2, 3, 4, 6, and 8 answered 'false'.
30 HORIZON RESEARCH CORPORATION
- - - - ~ --- - - - - - - -- -~ - ... - -Factors Impacting Fare Evasion
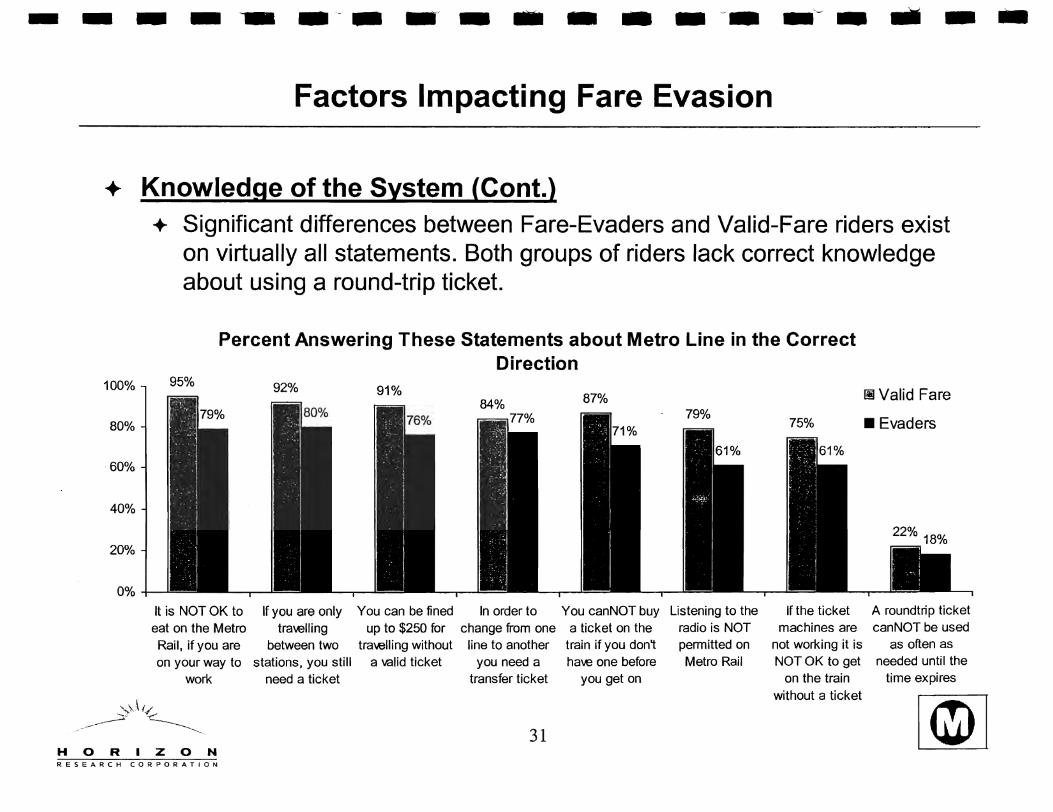
+ Knowledge of the System (Cont.) ... Significant differences between Fare-Evaders and Valid-Fare riders exist
on virtually all statements. Both groups of riders lack correct knowledge about using a round-trip ticket.
Percent Answering These Statements about Metro Line in the Correct Direction
100% 95% 92%
80%
60%
40%
20%
0%
It is NOT OK to If you are only You can be fined In order to You canNOT buy eat on the Metro tra-.elling up to $250 for change from one a ticket on the Rail, if you are between two tra-.elling without line to another train if you don't on your way to stations, you still a valid ticket you need a ha-.e one before
work need a ticket transfer ticket you get on
',,), \ (/ ~~~ ~-
31 HORIZON RESEARCH CORPORATION
Listening to the radio is NOT permitted on Metro Rail
If the ticket machines are
not working it is NOT OK to get
on the train without a ticket
~Valid Fare
• Evaders
A roundtrip ticket canNOT be used
as often as needed until the
time expires
- - - - -- _._. - .. - - - - - ..• - -'-~ - .. - -Factors Impacting Fare Evasion
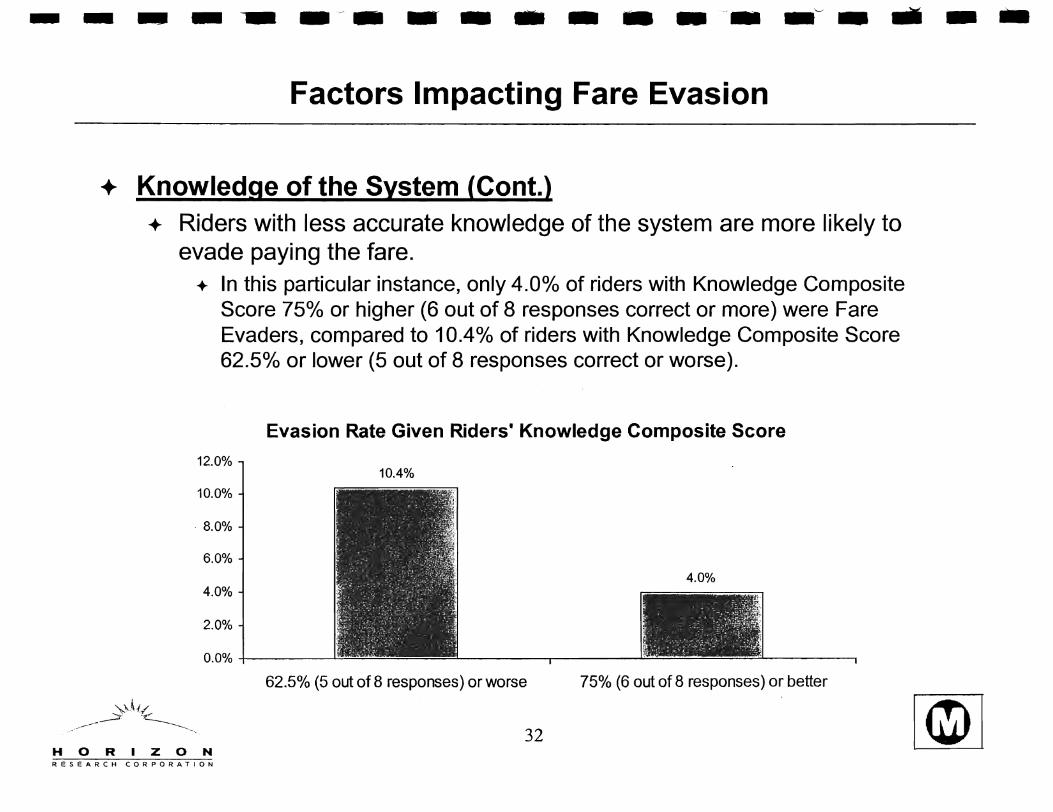
... Knowledge of the System (Cont.) .. Riders with less accurate knowledge of the system are more likely to
evade paying the fare. -+- In this particular instance, only 4.0% of riders with Knowledge Composite
Score 75%) or higher (6 out of 8 responses correct or more) were Fare Evaders, compared to 10.40/0 of riders with Knowledge Composite Score 62.5% or lower (5 out of 8 responses correct or worse).
Evasion Rate Given Riders' Knowledge Composite Score
12.0% 10.4%
10.0%
·8.0%
6.0% 4.0%
4.0%
2.0%
0.0% -t-------'-'
62.5% (5 out of 8 responses) or worse 75% (6 out of 8 responses) or better
32 HORIZON RESEARCH CORPORATION
- - - - -- - - .. - ... - - - ....• -'- - .. - .. Factors Impacting Fare Evasion
.. Knowledge of the System (Cont.) ... Improving the knowledge that riders have of the system could substantially
improve the fare evasion rate.
... We estimate that 10% improvement in the accuracy of knowledge riders have would result in a 24% reduction of the fare evasion rate from 5.3% to 4.00/0.
... The specific aspects of knowledge that would lead to improvement in fare evasion rate are:
+ Ensuring that riders know that a round trip ticket can only be used for one round trip and that a transfer ticket is needed when changing from one line to another.
+ Riders should also be aware that they cannot be on the train/platform without a ticket, notwithstanding reasons such as broken TVM's, waiting for someone, or traveling between two consecutive stations.
33 HORIZON RESEARCH CORPORATION

----~--~-*----~-~--
Factors Impacting Fare Evasion
.. TVM Access ... Another predictor of evasion identified by our model is how easy it is to
obtain tickets. • This score is composed of following three statements:
• (1) Ticket machines are often out of order.
• (2) It is easy to find places to buy a ticket.
• (3) Figuring out what ticket you need to buy is difficult.
• Interviewed riders scored each statement as either agree, disagree or don't know. We coded agree=O, disagree=1 and don't know=.S for statements (1) and (3). For statement (2), we coded agree=1 , disagree=O and don't know=.S.
• This composite score was computed by averaging these three statements and multiplied by 100.
HORIZON RESEARCH CORPORATION
• The composite score could be interpreted as indicating how easy riders perceive it to be to obtain fare media - the higher the score, the easier they perceive it to be.
34
- - - --- _ ..... - .. - - - - - .. - -"~ - .. - -Factors Impacting Fare Evasion
... TVM Access (Cent.)
100%
80%
60%
40%
20%
0%
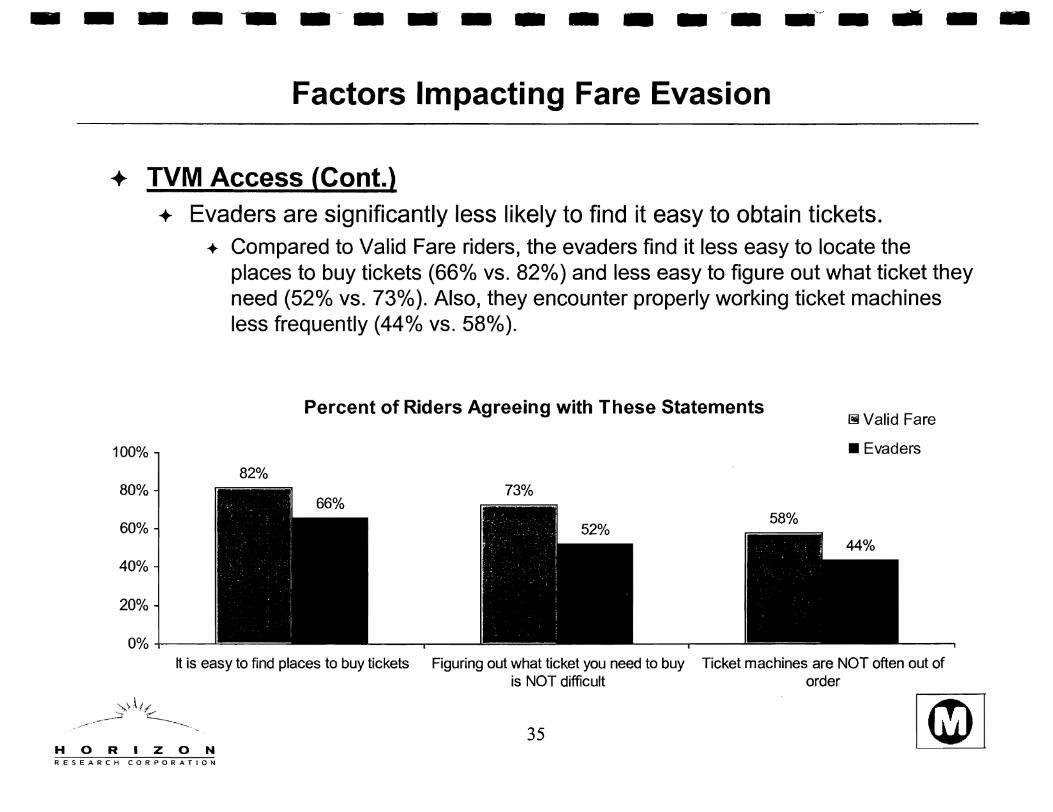
... Evaders are significantly less likely to find it easy to obtain tickets. .. Compared to Valid Fare riders, the evaders find it less easy to locate the
places to buy tickets (660/0 vs. 820/0) and less easy to figure out what ticket they need (52% vs. 73%). Also, they encounter properly working ticket machines less frequently (44% vs. 58%).
Percent of Riders Agreeing with These Statements
82% 73%
58%
~ Valid Fare
• Evaders
It is easy to find places to buy tickets Figuring out what ticket you need to buy Ticket machines are NOT often out of is NOT difficult order
35 HORIZON RESEARCH CORPORATION

- - - _ .. -_.- .. - - - - - - -'- - ... - -Factors Impacting Fare Evasion
... TVM Access (Cant.)
12%
10%
8%
6%
4%
2%
0%
... Riders finding it more difficult to obtain tickets are more likely to evade paying a fare .
.. In this particular instance, only 2.70/0 of riders who found obtaining tickets easy (1000/0 score) were fare evaders, compared to 10.1% of riders who found it difficult (500/0 score).
Evasion Rate Relative to Ease of Obtaining Ticket
10.1%
5.3%
2.7%
Difficult (50% or less) Moderately Easy (66%-83%) Easy (100%)
36 HORIZON RESEARCH CORPORATION

----~---------~-~--
Factors Impacting Fare Evasion
... TVM Access (Cont.) .. Improving the ease with which tickets can be obtained also has the
potential to reduce the fare evasion rate.
.. Our model predicts that a 10% improvement in the ease of obtaining tickets would result in a 7.2% reduction of evasion rate, or a change from 5.30/0 to 4.90/0.
.. Specifically, MT A could post signage explaining ... ... what to do when TVM's are not functional (such as alternative location for
purchase of TVM's or other fare media), and
... improve their existing instructions as to what ticket to buy.
.. If MT A were able to BOTH improve the ease of obtaining tickets by 10%
and improve riders' knowledge (as discussed in the previous section), our model predicts a 300/0 reduction in evasion rate, or a change from 5.30/0 to 3.7% •
37 HORIZON RESEARCH CORPORATION

- - - - -- _ .. - - - - - - - - -'- - ... - -Factors Impacting Fare Evasion
... Commuter Characteristics ... There are five rider-characteristics that we found to significantly improve
our prediction of the fare evasion rate. These are ... ... Type of fare media typically used, specifically the percent of riders typically
using TVMs .
... Use of TVMs increases the likelihood of evasion. Virtually no one who typically uses a pass was an evader .
... Frequency with which riders use the Metro Rail system (number of days per week)
... Daily riders (5 days a week) are less likely to evade .
... Age and
... Older riders are less likely to evade .
... Income
... People with higher incomes are less likely to evade paying fare .
... Ethnicity
HORIZON RESEARCH CORPORATION
... African Americans contain a disproportionately higher number of fare evaders compared to other ethnic groups, even controlling for age and income effects.
38

- - - - .. --- .. - - - - - -- -~. - .. - -Factors Impacting Fare Evasion
... Commuter Characteristics (Cont.) ... Riders who typically use TVMs are significantly more likely to evade
paying fare than riders typically using other fare media.
12.0%
10.0%
8.0%
6.0%
4.0%
2.0%
0.0%
HORIZON
+ Only 2.840/0 of riders with fare media other than TVM are fare evaders.
+ However, 10.80/0 of riders who typically use TVMs are fare evaders.
Evasion Rate Among Those That Typically ...
10.8%
2.8%
UseTVM Does not use TVM
39 RESEARCH CORPORATION

- - - - -- --- .. - - - - --- -~ - ... - -Factors Impacting Fare Evasion
... Commuter Characteristics (Cont.)
20.0%
16.0%
12.0%
8.0%
4.0%
0.0%
.. There is a negative relationship between the fare evasion rate and the weekly frequency of Metro use.
-+- Riders that commute every day (5 days +) are less likely (3.40/0) to avoid paying the fare than riders commuting 2 days per week or less frequently ( 13.1 % to 15. 1 0/0).
Evasion Rate Based on Weekly Frequency of Metro Usage
15.1% 13.1%
3.7% 3.4%
1 day or less 1-2 days 3-4 days 5 or more days
40 HORIZON RESEARCH CORPORATION
- - - - -- - ~ - .. - - - - - - -~. - ... - -Factors Impacting Fare Evasion
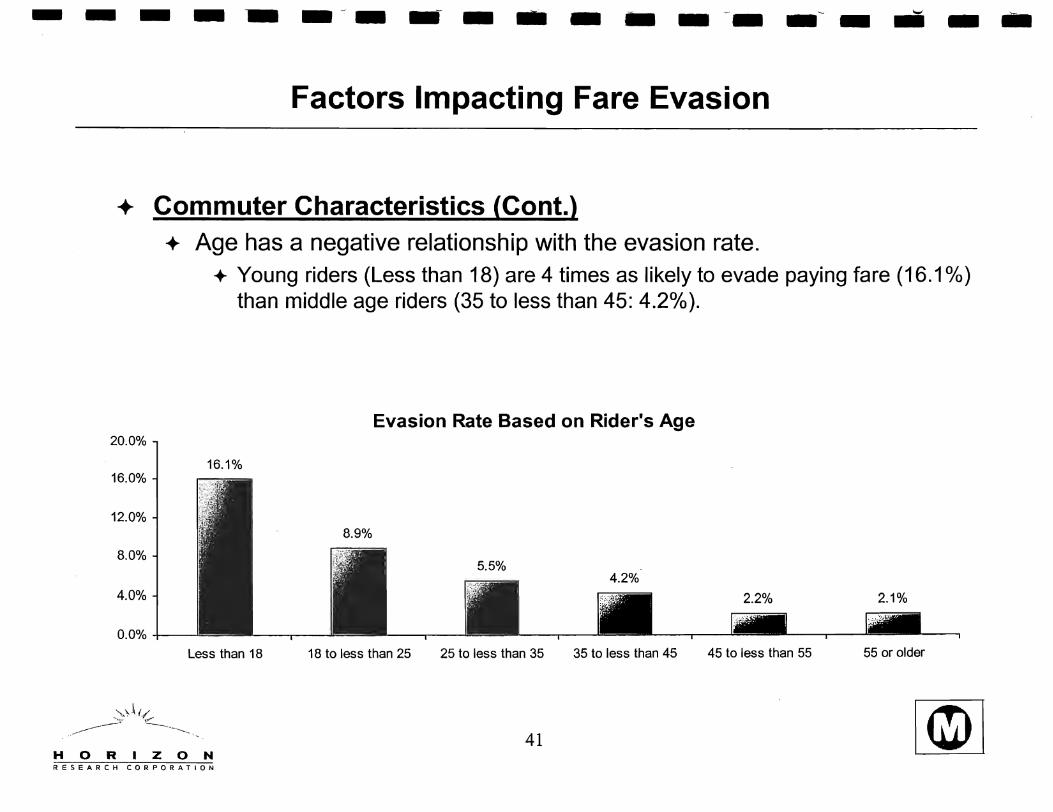
... Commuter Characteristics (Cont.) .. Age has a negative relationship with the evasion rate.
+ Young riders (Less than 18) are 4 times as likely to evade paying fare (16.1%) than middle age riders (35 to less than 45: 4.2%).
Evasion Rate Based on Rider's Age 20.0%
16.1% 16.0%
12.0% 8.9%
8.0% 5.5%
4.2% 4.0% 2.2% 2.1%
0.0%
Less than 18 18 to less than 25 25 to less than 35 35 to less than 45 45 to less than 55 55 or older
41 HORIZON RESEARCH CORPORATION
- - - - --- - ,- - .. - - - - - -- -~ - .. - -Factors Impacting Fare Evasion
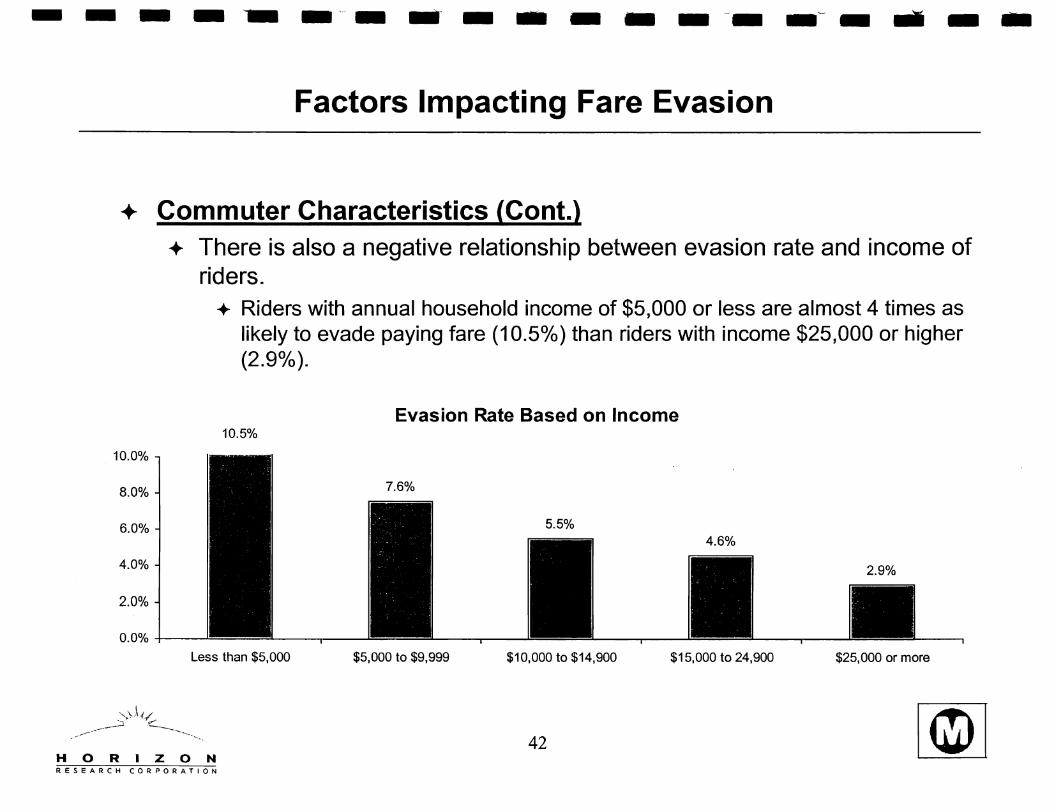
... Commuter Characteristics (Cont.) ... There is also a negative relationship between evasion rate and income of
riders.
10.0%
8.0%
6.0%
4.0%
2.0%
0.0%+--
-+- Riders with annual household income of $5,000 or less are almost 4 times as likely to evade paying fare (10.50/0) than riders with income $25,000 or higher (2.9%).
Evasion Rate Based on Income 10.5%
7.6%
5.5% 4.6%
2.9%
Less than $5,000 $5,000 to $9,999 $10,000 to $14,900 $15,000 to 24,900 $25,000 or more
42 HORIZON RESEARCH CORPORATION

- - - - - _. - - - - - - - -- -'"' - .. - -Factors Impacting Fare Evasion
.. Commuter Characteristics (Cont.)
10.0%
8.0%
6.0%
4.0%
2.0%
... There is a disproportionately higher number of evaders among African Americans (7.3%) compared to other ethnic groups (4.10/0) .
.. This variable has a significant impact on the evasion rate even after income and age are accounted for, although it is the least important variable.
-+- Specifically, the model with this ethnic variable accounts for 27.30/0 of variance in evasion, while the model without it accounts for 25.8% of variance. This means that ethnicity accounts for 5.8% of explained variance .
.. It is likely that factors other than age and income may be a cause of this apparent relationship.
Fare Evasion Rate by Ethnicity 7.3%
4.1%
0.0%~----
African Americans Other Ethnicities
43 HORIZON RESEARCH CORPORATION
- - - - - _ .. - -~ - - - - - .. - --- - ... - -
Enforcement
HORIZON RESEARCH CORPORATION

- - - - -- - - - - ... - - - -- -~ - ... - -Enforcement
-+- A number of variables related to law enforcement were included in the survey: ... Perceived likelihood of getting caught if riding regularly without a ticket,
... Number of times having a ticket inspected in the past year,
... Number of times evading paying fare in the past year,
... Number of times getting caught in the past year, and
... Punishment received for evading in the past year.
-+- None of these self reported variables were related to evasion. One might conclude, therefore, that enforcement is not important to the evasion rate. However, it seems inconceivable that the evasion rate is so low without the threat of being caught and punished factoring into a rider's consideration of whether or not to evade.
-+- In this section, we demonstrate that current law enforcement system works for the majority of riders, but not for a small minority.
... The reason that self reports about law enforcement do not relate to evasion is that riders do not provide accurate recollections.
45 HORIZON RESEARCH CORPORATION
- - - - --- - - - - - - - - ._- -'~ - .. - -Enforcement
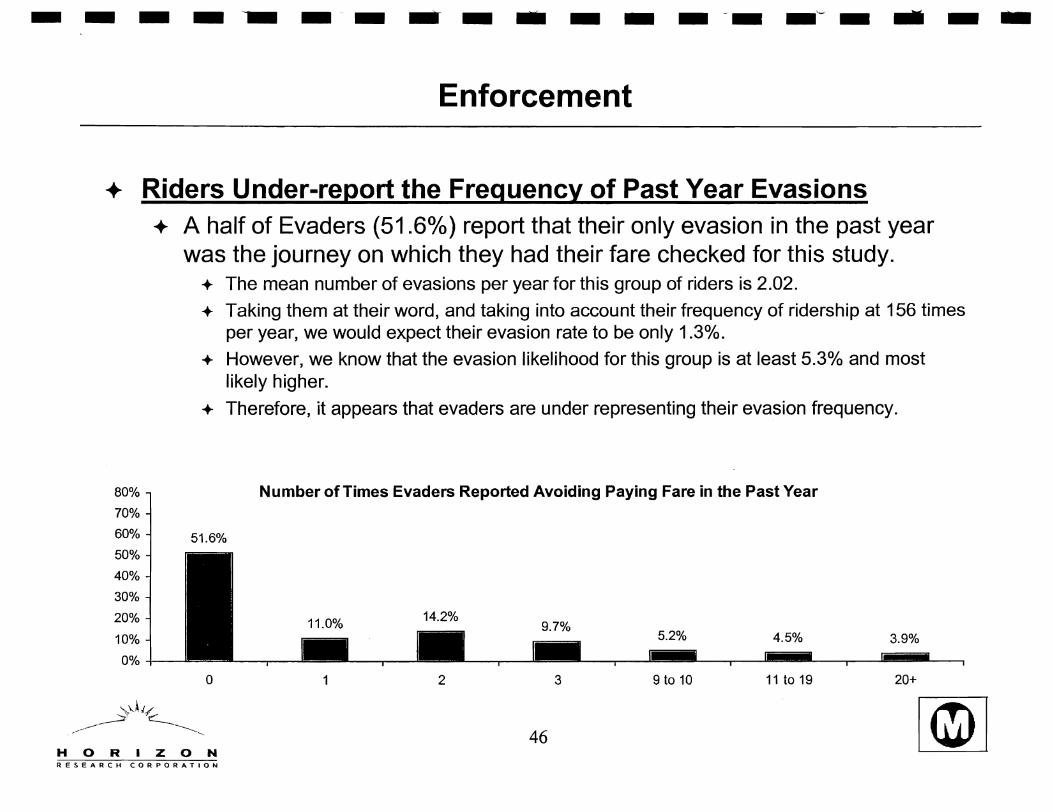
.. Riders Under-report the Frequency of Past Year Evasions
80%
70%
60%
50%
40%
30%
20%
10%
0%
... A half of Evaders (51.6%) report that their only evasion in the past year was the journey on which they had their fare checked for this study .
.. The mean number of evasions per year for this group of riders is 2.02.
.. Taking them at their word, and taking into account their frequency of ridership at 156 times per year, we would expect their evasion rate to be only 1.3%.
.. However, we know that the evasion likelihood for this group is at least 5.3% and most likely higher .
.. Therefore, it appears that evaders are under representing their evasion frequency.
Number of Times Evaders Reported Avoiding Paying Fare in the Past Year
51.6%
5.2% 4.5% 3.9%
o 1 2 3 9 to 10 11 to 19 20+
46 HORIZON RESEARCH CORPORATION
- - - - ~ -- - .. - ... - - - -- -~ - .. - -Enforcement
.. Estimated Evasion Likelihood -+- Knowing that we cannot rely on the reported evasion frequency, we used
our binomial model to predict this frequency indirectly, by calculating the evasion likelihood based on our predictive model.
-+- Each commuter characteristic is associated with a certain observed evasion rate. For example, we can group riders into those who typically use TVM's and those who do not. We observed that 10.8% of TVM users are evaders while only 2.8% of other fare media users are evaders. We can produce these types of estimates for an commuter characteristics. Finally, the model combines all these group estimates via regression weights and produces an evasion likelihood estimate for every individual whom we observed. Thus, in essence, the individual evasion likelihood is a function of likelihood of specific commuter characteristics that this individual possesses.
47 HORIZON RESEARCH CORPORATION
- - - - -- - - - - ... - - - -- -~ - .. - -Enforcement
.. Estimated Evasion Likelihood (Cont.) ... Example
... For example, an African American who does not use TVM's, has the Knowledge Composite score of 62.50/0, has the TVM Access score of 83.30/0, is 25 to 35 years old, with income $35,000 to $50,000, riding metro 3 to 4 times a week is estimated to have an evasion likelihood of 3.2% .
... On the other hand, an African American who uses TVM's, has higher Knowledge Composite score (93.750/0), has low TVM Access score (0%), is younger (18 to 25), makes less money (under $5,000), and also rides metro 3 to 4 times a week is estimated to have an evasion likelihood of 29.30/0 .
... Both of these individuals had a valid ticket when inspected.
48 HORIZON RESEARCH CORPORATION
- - - - -- - - - .. - ... - - - -- .'--' - .... - .. Enforcement
... Estimated Evasion Likelihood (Cont.) .. For convenience, we categorized riders based on their estimated evasion
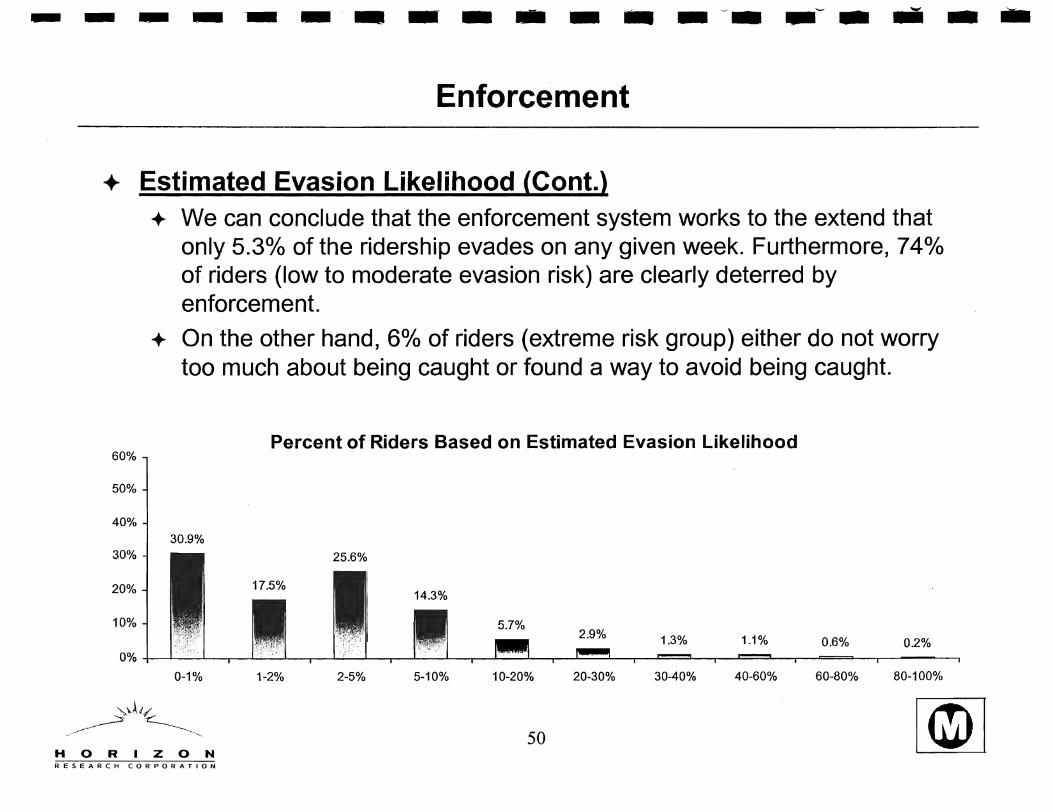
likelihood into 4 groups: + Low risk - 30.90/0 of riders who evade less than 1 time per 100 rides.
+ Moderate risk - 43.1 % of riders who evade 1 to 5 times per 100 rides.
+ High risk - 20%) of riders who evade 5 to 20 times per 100 rides.
+ Extreme risk - 60/0 of riders who evade 20 or more times per 100 rides.
49 HORIZON RESEARCH CORPORATION
_ - _ _ -- _ _ _ _ _ _ _ _ ~_ _'-' _ IIIi _ ...
Enforcement
... Estimated Evasion Likelihood (Cont.)
60%
50%
40%
30%
20%
10%
+ We can conclude that the enforcement system works to the extend that only 5.3% of the ridership evades on any given week. Furthermore, 74% of riders (low to moderate evasion risk) are clearly deterred by enforcement.
+ On the other hand, 6% of riders (extreme risk group) either do not worry too much about being caught or found a way to avoid being caught.
Percent of Riders Based on Estimated Evasion Likelihood
30.9%
0-1% 1-2% 2-5% 5-10% 10-20% 20-30% 30-40% 40-60% 60-80% 80-100%
50 HORIZON RESEARCH CORPORATION

- - - - -- -- - - - - - - .. ~.- -- - .. - ... Enforcement
.. Evasion Rate: Contribution by Risk Groups .. 60/0 of riders (the Extreme risk group) accounts for 400/0 of all evasions.
-+- While 740/0 of riders (the Low to Moderate risk group) account for 19.40/0 of evasion.
100%
90%
80%
70%
60%
50%
40%
30%
20%
10%
Proportion of Ridership By Risk Group in Relation to Evasion
20..0%
O%+-------~------~--------~------~--~~--~----~
Proportion of Ridership Evasion Rate (5.3%)
51 HORIZON RESEARCH CORPORATION
• Extreme Risk
o High Risk
!ill Moderate Risk
o Low Risk
- - - - ~ -.~ - - - - - - --- .--- - .. - -Enforcement
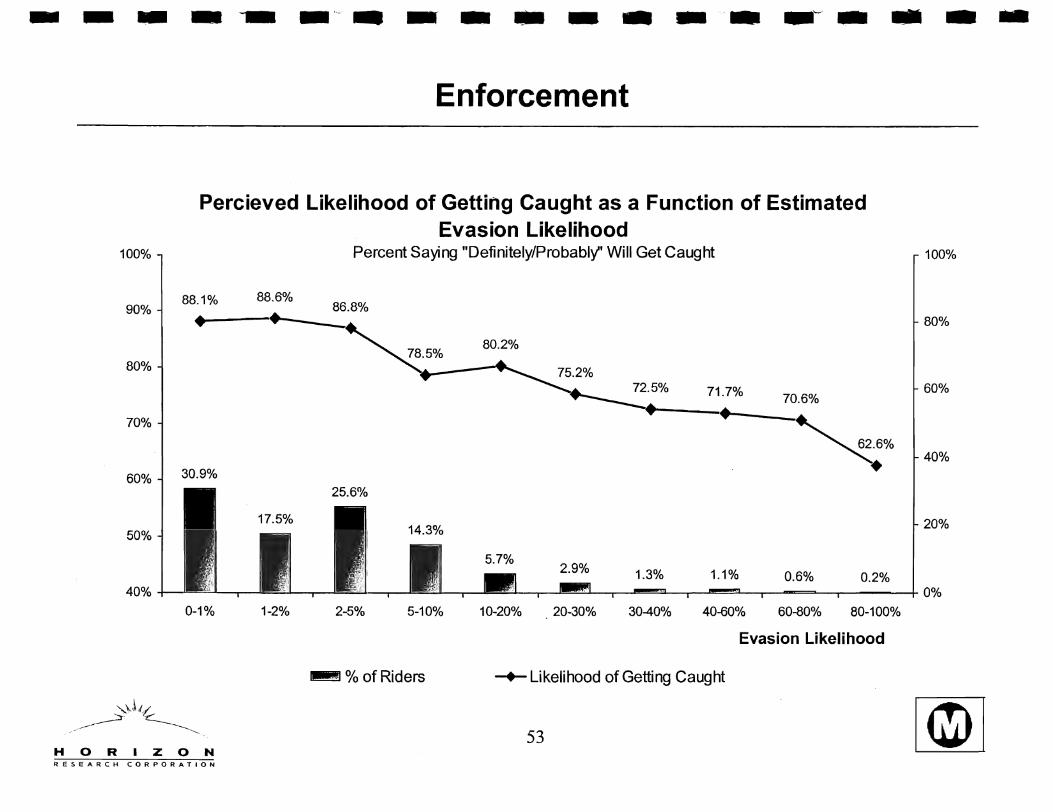
.. Likelihood of Getting Caught + The chart on the next slide shows a "smoothed*" relationship between
perceived likelihood of getting caught and the estimated likelihood to evade.
-+- The perceived likelihood of getting caught is expressed as the percent of riders who believe that they are definitely/probably going to get caught if riding regularly without a ticket.
+ Clearly, the less likely riders believe that they will get caught, the more likely they will evade.
-+- This result supports the conclusion that riders with high evasion likelihood must have found ways to evade being captured by law enforcement officials.
-+- Based on discussions with our interviewers, we suspect that the indicated evasion strategies might include:
-+- Waiting outside a station and catch a train at the last moment, or
-+- Using stations with multiple exits and high visibility.
* This refers to the Loess Smoother, a part of Splus 6 statistics library
52 HORIZON RESEARCH CORPORATION
- - - - --- -- - - - - - - - .. - .'- - - - -Enforcement
Percieved Likelihood of Getting Caught as a Function of Estimated Evasion Likelihood
100% Percent Saying "Definitely/Probably" Will Get Caught
90% 88.6% 88.1% 86.8%
• 80.2%
80%
70%
71.7% 70.6% • • ~6%
• 60% 30.9%
50%
40%
0-1% 1-2% 2-5% 5-10% 10-20% . 20-30% 30-40% 40-60% 60-80% 80-100%
Evasion Likelihood
II!!!!!lII % of Riders -+- Likelihood of Getting Caught
53 HORIZON RESEARCH CORPORATION
100%
80%
60%
40%
--------------~----Enforcement
... Likelihood of Getting Caught (Cont.) + Blue and Green lines have two to three times higher evasion rates than
the Red line. Our model attributes some of this to differences in commuter characteristics, such as higher TVM use, slightly younger age, lower income and ethnicity of Blue and Green line riders.
+ We believe that a part of this unexplained difference is due to Red line being an underground system where it is more difficult for evaders to avoid the police simply by not being able to see them in time.
+ If this is so, we would expect that Red line evaders are more likely to believe that they would get caught if riding regularly without a ticket. That is what we observe.
-+- 81 % of Red line evaders believe that they will definitely be caught, while only
-+- 59% of Blue/Green line evaders believe that will definitely be caught.
54 HORIZON RESEARCH CORPORATION

- - - - __ - -'. - - - - - - ~_ _v _ .. _ _
100%
81% 80%
60%
40%
20%
0%
Definitely
HORIZON RESEARCH CORPORATION
Enforcement
Evaders' Perceived Likelihood of Getting Caught
6% 6%
Probably Might or might not Probably not
55
EI Blue/Green
• Red
2% 0%
Definitely not
- - - -~ _ ..• -- - - - - _.- -~- .. _ .. Enforcement
.. Penalties for Getting Caught (Based on Self Report) .. The self reports of evaders who admitted to being caught in the past year
indicate that a large portion of them (37.30/0) get off with a warning or no consequence (4.1 0/0) .
.. Young offenders are more likely to get away without consequences .
.. 58.60/0 of riders 24 years old or younger receive only warning.
.. Since younger offenders are more likely to evade paying fare, it is imperative that they are punished. It is here where the law enforcement is failing.
56 HORIZON RESEARCH CORPORATION

- - - - -- -.~ - - - - - - _. - ->.~ - .. - -
HORIZON RESEARCH CORPORATION
Recommendations for Decreasing Fare Evasion Rate

- - - - -- _ ... - - - - - - - ..• -~ - .. - -Recommendations for Decreasing Fare Evasion Rate
.. Enforcement Issues + We recommend that MTA examines enforcement issues, specifically as
they relate to young offenders, such as insuring that there is a punishment for evading.
+ As suggested in the enforcement section, one likely reason that Red line has lower evasion rates is that police are less visible (that is, Red line riders are substantially less successful than Blue or Green line riders in spotting police officers with enough time to evade them).
+ To solve this "visibility" problem on Blue and Green lines, we suggest MTA examine the efficacy of the following:
HORIZON RESEARCH CORPORATION
+ Restructuring stations to limit access points;
+ Have more random checks at problem areas, including on train inspections;
+ Use a contingent of undercover officers to compliment the uniformed police, at least for the problem areas;
+ Consider increasing the number of officers inspecting fares at a given time so that a better coverage of the entrances and exits is achieved.
58
- - - - -- -.. ~ - - - - - - - - ."" - - - -Recommendations for Decreasing Fare Evasion Rate
.. Education, Accessibility and System Simplification + The data clearly suggest that riders do not understand the system as well as they
could. It is also clear that this lack of knowledge substantially contributes to fare evasIon.
+ Furthermore, TVM access has also been shown to contribute to the evasion rate. This includes an apparent complexity of figuring out what ticket to buy, TVM machines being out of order, or simply riders not being able to find a place to buy a ticket.
+ We recommend that the least expensive way of reducing the fare evasion rate is to have well informed riders and to improve the accessibility of fare media. Specifically, MTA should consider issues such as:
-+- Have better, simpler and more abundant signs regarding the Metro rules and fares.
-+- Improve accessibility to fare media - this could be done in a form of sings explaining what to do when TVM's are not working and/or where alternative media could be obtained.
+ Alternatively or concurrently with educational campaign, MTA could consider simplifying its fare system.
-+- One consideration would be reducing the gamut of available media to only a few types. This would also simplify rules for fare usage and fare checking.
59 HORIZON RESEARCH CORPORATION
- - - - -.. _. - - - - - - - -- --- - .. - -Recommendations for Decreasing Fare Evasion Rate
... Education, Accessibility and System Simplification (Cont.) . ... If MT A were able to BOTH improve the ease of obtaining tickets by 100/0
and improve riders' knowledge (as discussed in the previous section), our model predicts a 30% reduction in evasion rate, or a change from 5.30/0 to 3.7%.
... Commuter Characteristics ... Since TVM users are more likely to evade, encouraging them to buy
passes through education and advertisement or creating special "By a Pass" programs targeting specific subgroups of riders could decrease the evasion rate.
... The evasion rate is disproportionately higher among young and lowincome riders. Therefore, targeting schools for an educational and or advertising campaign explaining MT A passes could have a positive effect . on evasion.
60 HORIZON RESEARCH CORPORATION
- - - - -- -"- - - - - - - ..• -~ - .. - -
Metropolitan Transit Authority
Fare Evasion Study
Appendix E
HORIZON RESEARCH CORPORATION
- - - - -- -~ - - - - - - - ~ .. - -~ - ... - -
Estimating Evasion Rate
Using All Three Weighting Methods
~~= -:=H O====R=:===I ZO===N::::::::=R:::=:::ES~EAR C H CO R P 0 RATION

- - - - -- --- -- - - - - - ~.- -- - .. - -Estimating Evasion Rate
... Sample Characteristics ... The objective of the sampling method was to produce a sample that
approximates the Rider-ship distribution on day-type, time of day and metro line.
+ The sample matches the Rider-ship distribution very well on proportion of daytype riders (weekday vs. weekend)
Fare-Evasion Sample
Ridership Distribution
~ =HO===R==IZ=ON=RE=S~EARC~H =CO==R=PO=R=AT=IO=N
0%
Day-Type: Weekday Vs. Weekend
20% 40% 60% 80% 100%
I!I Weekday 0 Weekend
3

_____________ ~ _ _ v ___ _
Estimating Evasion Rate
.. Sample Characteristics (Cont.)
Fare-Evasion Sample
Ridership Distribution
+ The sample matches the Rider-ship Distribution less well on proportion of Metro Line riders, being heavier on Green Line while lighter on Blue Line riders.
+ Also, the Fare-Evasion sample contains proportionately more off peak riders, specifically 6am-9am and 7pm-12am segments.
Metro Lines
0% 20% 40% 60% 80% 100%
[----r -E
{ "(
-------
III Blue III Green • Red
Fare-Evasion Sample
Ridership Distribution
Time
0% 20% 40% 60% 80% 100%
21% 17%
16%
o 6am-9am _ 9am-3pm ~ 3pm-7pm 0 7pm-9pm
~~~= 4 HORIZON RESEARCH CORPORATION
- - - - .. - ... - - - - - - - .. ~.- -- - .. - -Estimating Evasion Rate
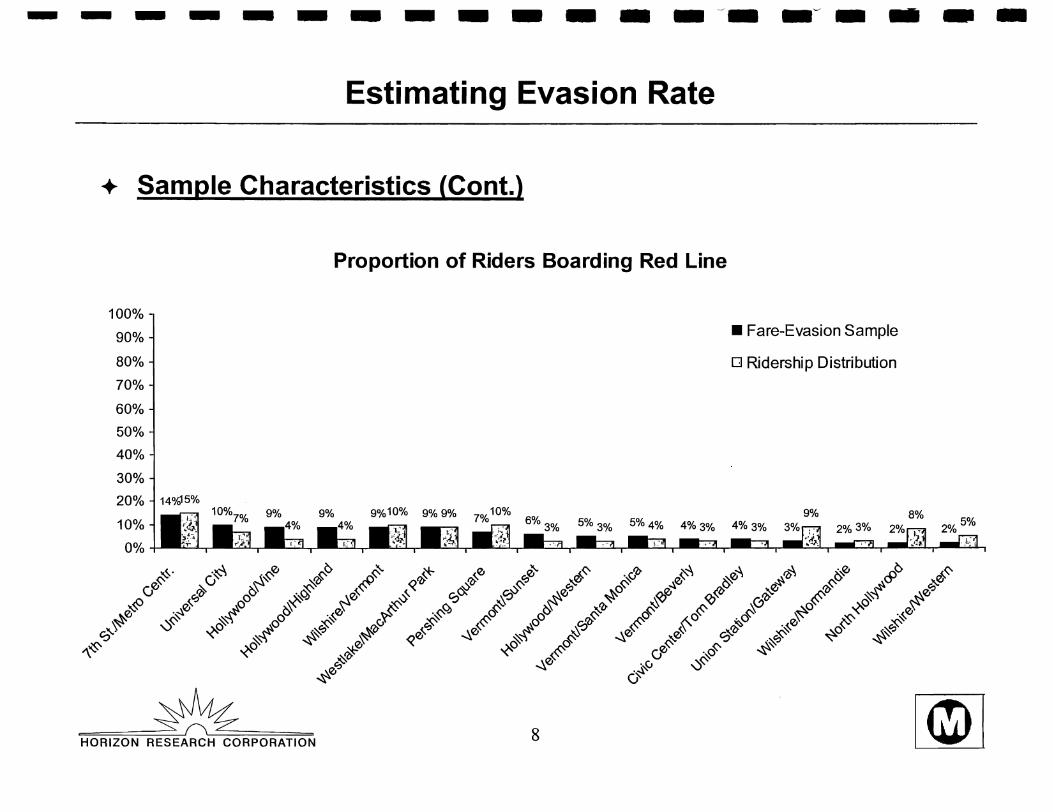
.. Sample Characteristics (Cont.) + The sampling method was not designed to match the proportion of riders
boarding trains at various stations. However for completeness and potential influence of such disparities on the estimate of fare-evasion rate, we present these proportions for each of the three lines.
-+- Clearly, some stations have much higher representation in our sample, while other much lower.
~~"--===== HORIZON RESEARCH CORPORATION 5

- - - - ... -~. - - - - - - - - -- - ... - -Estimating Evasion Rate
... Sample Characteristics (Cant.)
Proportion of Riders Boarding Blue Line
100%
90%
80% • Fare-Evasion Sample
70% o Ridership Distribution
60%
50%
40%
30%
20% 18%
10% 1%1% 1%1%
0%
6 ~~~= HORIZON RESEARCH CORPORATION

- - - - --- _ .. - - - - - - - -- -- - ... - -Estimating Evasion Rate
... Sample Characteristics (Cant.)
100%
90%
80%
70%
60%
50%
40%
30%
20%
10%
0%
26%
~ ~H70~RI~ZO~N~R~ES~E~ARC~H~C~O~R~PO~R~A~T~IO~N
Proportion of Riders Boarding Green Line
rn Fare-Evasion Sample
o Ridership Distribution
2% 2% 2% 3% 1%
- - - - - - - - - - - - - -- -~. - - - -Estimating Evasion Rate
... Sample Characteristics (Cont.)
Proportion of Riders Boarding Red Line
100%
90%
80%
70%
60%
50%
40%
30%
20% 14%15%
10%
0%
=====----.~'---===== HORIZON RESEARCH CORPORATION 8
• Fare-Evasion Sample
o Ridership Distribution

- - - - - - - - - - - - - --- -- - .. - -Estimating Evasion Rate
... Evasion Rate Estimate
... The evaders were classified as riders who did not have a ticket, claimed to had lost it, had an invalid ticket or refused to show the ticket (the refusals accounted for .3% of evaders) .
... Given this definition, the evasion rate is 5.1 % to 5.70/0, depending on the weighting method used.
10.0%
8.0%
6.0%
4.0%
2.0%
0.0%
=====-.,~~= HORIZON RESEARCH CORPORATION
Estimated Total Evasion Rate
5.7%
Not Weighted
5.1%
Weighted by Day-Type, lime, Line
9
5.3%
Weighted by Day-Type, lime, Line, Station
- - - - -- ---- -- - .. - - --- -~ - .. - ... Estimating Evasion Rate
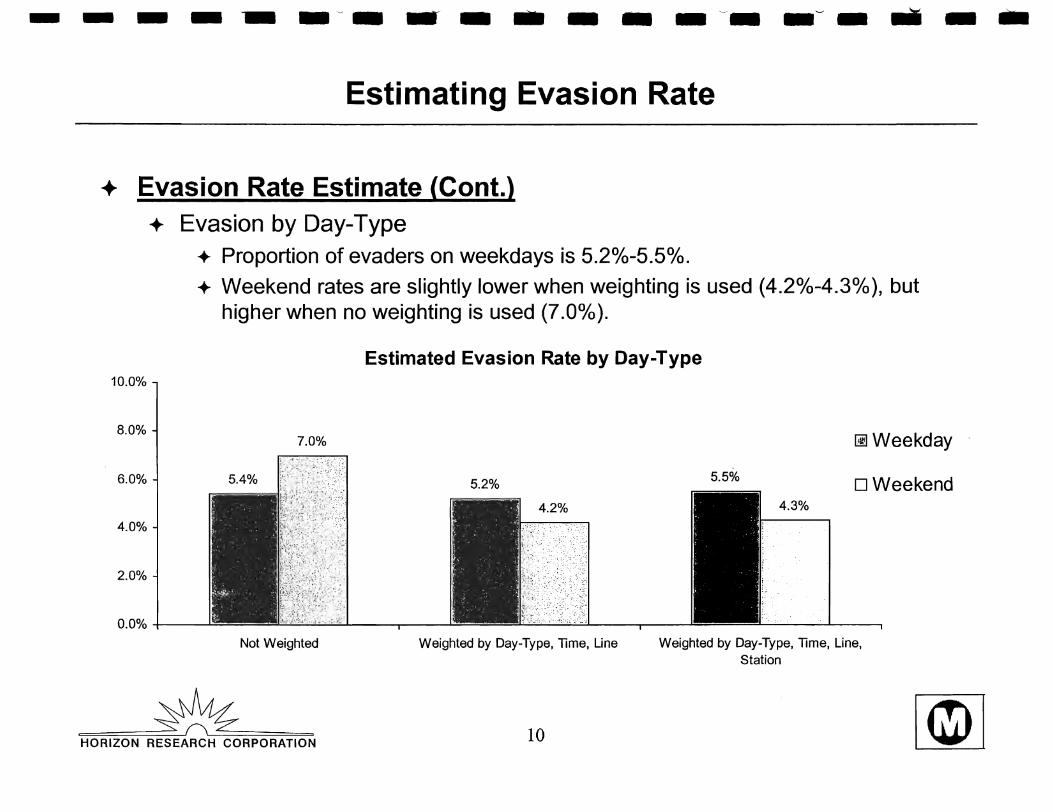
.. Evasion Rate Estimate (Cont.) ... Evasion by Oay-Type
... Proportion of evaders on weekdays is 5.20/0-5.5% .
... Weekend rates are slightly lower when weighting is used (4.2%-4.3%), but higher when no weighting is used (7.0%).
10.0%
8.0% 7.0%
6.0%
4.0%
2.0%
O.O%+--~
Not Weighted
~~~= HORIZON RESEARCH CORPORATION
Estimated Evasion Rate by Day-Type
5.2%
Weighted by Day-Type, Time, Line
10
~Weekday
5.5% o Weekend 4.3%
Weighted by Day-Type, Time, Line, Station

- - - - - - - - -- - - - - - ~- -~ - .. - ... Estimating Evasion Rate
... Evasion Rate Estimate (Cont.)
... Evasion by Metro Line + The highest proportion of evaders is amongst the Green (9.20/0-10.80/0) and
Blue (6.30/0-6.90/0) line riders.
+ While the lowest proportion of evaders is amongst the Red Line riders (3.0%-3.30/0 ).
12.0% 10.8%
10.0%
8.0%
6.0%
4.0%
2.0%
0.0% Not Weighted
~~L:::::=== HORIZON RESEARCH CORPORATION
Estimated Evasion Rage per Metro Line
Weighted by Day-Type, Time, Line
11
Weighted by Day-Type, Time, Line, Station
III Blue
IjI Green
- - - - .. - - - ~ - - - - --- -'-' - .. - ... Estimating Evasion Rate
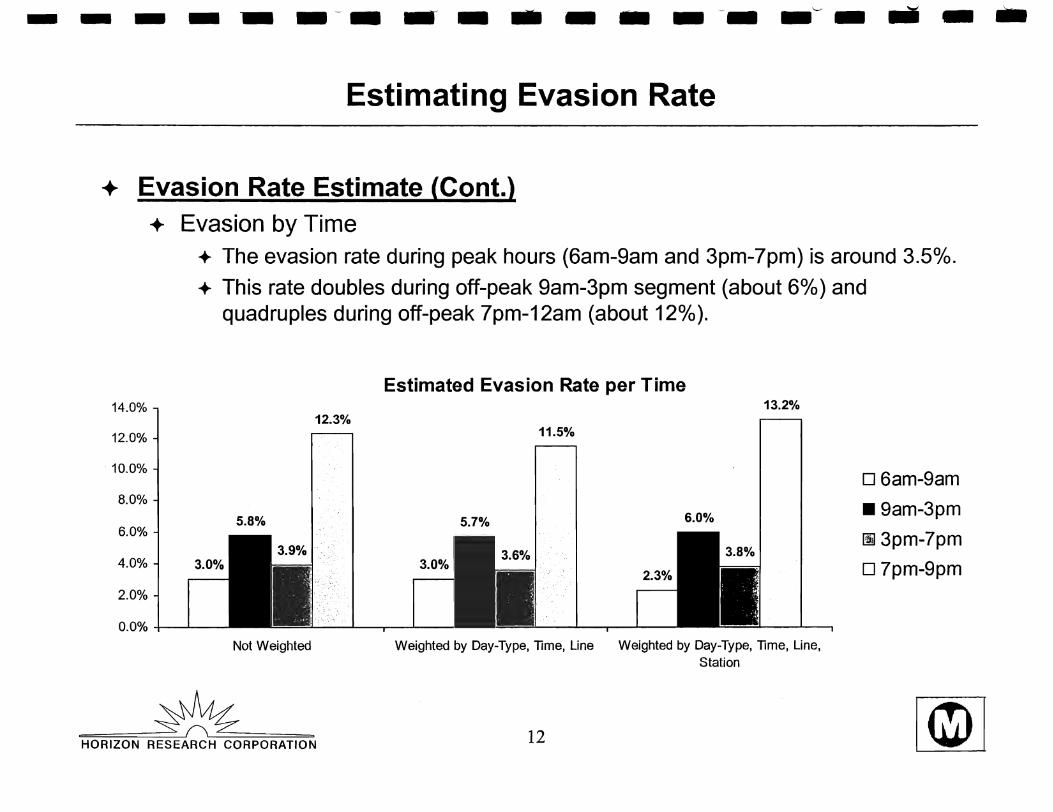
... Evasion Rate Estimate (Cont.) ... Evasion by Time
... The evasion rate during peak hours (6am-9am and 3pm-7pm) is around 3.5%) .
... This rate doubles during off-peak 9am-3pm segment (about 60/0) and quadruples during off-peak 7pm-12am (about 120/0).
14.0% 12.3%
12.0%
10.0%
8.0%
5.8% 6.0%
4.0% 3.0%
2.0%
0.0% +---'---Not Weighted
~~~= HORIZON RESEARCH CORPORATION
Estimated Evasion Rate per Time 13.2%
11.5%
5.7% 6.0%
. , 3.0% , D: • .~:j
Weighted by Day-Type, lime, Line Weighted by Day-Type, lime, Line, Station
12
o 6am-9am
.9am-3pm
!jj) 3pm-7pm
o 7pm-9pm