farm & business: volume no. 8, no. 1, july 2016…ageconsearch.umn.edu/bitstream/246081/2/farm...
TRANSCRIPT


Developing Food Value Chains to meet Tourism Demand in the Caribbean: Case Studies of St. Kitts Nevis and St. Lucia 31
Farm & Business: Volume No. 8, No. 1, July 2016…
Developing Food Value Chains to meet Tourism Demand in the Caribbean: Case Studies of St. Kitts Nevis and St.
Lucia JR Deep Ford1, and Ekaterina Dorodnykh2
1FAO Coordinator, Caribbean Subregion, and 2Agricultural Economist, Food and Agricultural Organizations of the United Nations
Abstract
Tourism plays a vital role in the Caribbean region and it is one of the fastest growing industries globally.
According to the World Travel and Tourism Council Report (2014), tourism's contribution to regional GDP
of Caribbean is estimated at 14.2% in 2014 and it accounts for 11.4% of regional employment. As the two
most common pillars of the region’s economy, sugar and bananas industries, have declined, tourism has
increasingly become a major source of income for many of the Caribbean countries. For some countries
tourism accounts for more than half of their GDP for example in the Bahamas and Antigua and Barbuda.
With an increasing number of tourist arrivals and cruise ship visits per year, tourism continues to be an
important opportunity for further promoting economic development in the Caribbean.
Caribbean small island developing states (SIDS) are very vulnerable open economies. This paper
investigates how the tourism industry can contribute in a much greater manner to regional development
through the development of competitive food value chains for all aspects of tourism food demand. The
tourism industry mainly relies on food imports as opposed to accessing the local market. Despite
numerous efforts over many years there has been little success in sustainably supplying tourism demand
from domestic production and value-chains. This paper evaluates tourism, food and agricultural linkages
and presents an approach to increase these linkages for greater economic and social impact.
The main challenges for Caribbean farmers in meeting supply requirements have been related to their
inability to compete (Beckford and Campbell, 2013; FAO, 2011, 2012; IICA, 2014). This inability results
not only from low productivity but has also been related to quality and reliability of supply. The weak
public policy and governmental support framework as well as private sector structural weaknesses have
also contributed to the lack of inclusion of Caribbean farmers in tourism food markets.
Based on a survey of tourism sector agricultural product buyers, the analysis of main food trade actors
and requirements of the tourism industry carried out for two case studies countries – St. Kitts and Nevis
and St. Lucia. With this information and the experience of domestic producers, production and marketing
processes, local commodities with the greatest potential for the tourism food market are identified. The
lessons from case studies analysis lead to the design of new approaches to the development of food
value chains for the tourism sector. Results of this analysis can be applied to other Caribbean countries
that have similar agricultural characteristics and depend on the tourism industry. Main findings
demonstrate that if Caribbean producers are able to develop competitive food value chains, a cost saving
alternative food supply will be available to the tourism sector and this specific segment of the Caribbean
agricultural sector can be sustainable.
Keywords – Food Value Chains, Food Trade, Tourism Food Demand

Developing Food Value Chains to meet Tourism Demand in the Caribbean: Case Studies of St. Kitts Nevis and St. Lucia 32
Farm & Business: Volume No. 8, No. 1, July 2016…
Introduction
The tourism industry has become the principle economic sector in the Caribbean and the leading source of foreign exchange for many of its countries. However, a significant proportion of food for the tourism industry continues to be imported from extra-regional sources due to the inability of the local agricultural sector to meet the increasing demand for high quality produce (Renard, 2001; Timms, 2006). Despite numerous efforts over many years, there has been little success in providing a sustainable supply from domestic agricultural production (including of value added products) to meet tourism demand. However, increasing linkages between the agricultural and the tourism sectors can contribute to overcoming fiscal difficulties due to high public debt and high levels of food imports, as well as address certain social problems in the region.
Opportunities arising from improved linkages between the tourism and agricultural
sectors provide important macroeconomic and social benefits. By developing competitive value-chains, countries could reduce the food import bill, improve national food security, increase rural employment and reduce rural poverty (FAO, 2013a; Hepburn, 2013). This paper investigates ways in which the tourism industry can provide a greater contribution to regional economic development and presents an approach which can be used to increase linkages between tourism and agriculture through the development of competitive food value chains in case studies of St. Kitts and Nevis and St. Lucia.
The main challenges for Caribbean farmers in meeting food supply required by the
tourism industry relate to their inability to compete with imported crops in terms of quality, price and adequate volume. These challenges of domestic agriculture in meeting food supply requirements are traditionally related to low productivity, high production costs and poor marketing systems (Beckford and Campbell, 2013; FAO, 2011, 2012; IICA, 2014). However, opportunities exist for local produce to successfully compete with imported products as interviews carried out with hotels and restaurants in two selected countries revealed that supply managers prefer to purchase local vegetables and fruits due to the better taste, freshness and longer shelf life. Countries with high imports related to tourist preferences can promote fresh food consumption as part of the tourism thrust. At the same time food production value chains in the countries will need to be strengthened to meet the demand (FAO, 2013b). Caribbean countries have the conditions and resources to produce an adequate supply of fresh fruit and vegetables if farmers can introduce new production systems that address the current problems. Attention would need to be paid to increased use of fertilizers, irrigation and post-harvest storage. The results of this paper show that higher production yields will decrease the current cost of production, making local produce more competitive.
To transition successfully, farmers need increased access to technical and financial
assistance to achieve further commercialisation and meet the demand from the tourism industry. The weak public policy and governmental support framework as well as private sector structural weaknesses have contributed to the lack of inclusion of Caribbean farmers in tourism food markets. This paper presents policy measures utilized in other countries, which can provide support for small farmers including in St. Kitts and Nevis and St. Lucia.
This paper is divided into three parts. The first part explains the linkages between
tourism and agriculture in the Caribbean economy and the main social benefits from meeting the demand of the tourism sector, including supply of fresh food products. The second part analyses the value chain development of onions and cole crops in St. Kitts and Nevis with the special reference to the demand from tourism. The third part is a case study on value chain

Developing Food Value Chains to meet Tourism Demand in the Caribbean: Case Studies of St. Kitts Nevis and St. Lucia 33
Farm & Business: Volume No. 8, No. 1, July 2016…
development of fruits and vegetables in St. Lucia. Both case studies summarize the main problems facing domestic agricultural supply in meeting the tourism sector demand and provide policy recommendations to help expand the share of domestic products in meeting the tourism sector market.
1. TOURISM AND AGRICULTURAL LINKAGES IN THE CARIBBEAN ECONOMY
1.1 Potential Demand from Tourism Sector Tourism plays a vital role in the Caribbean region and it is one of the fastest growing industries globally. According to the World Travel and Tourism Council Report (2014), tourism's contribution to regional GDP of Caribbean is estimated at 14.2% in 2014 and it accounts for 11.4% of regional employment. As the two most common pillars of the region‘s economy, sugar and bananas industries, have declined, tourism has increasingly become a major source of income for many of the Caribbean countries. For some countries, such as the Bahamas and Antigua and Barbuda, tourism accounts for more than half of their GDP. With an increasing number of tourist arrivals and cruise ship visits per year, tourism continues to be an important opportunity for further promoting economic development in the Caribbean.
The tourism industry has direct benefits for the economy and additionally, significant
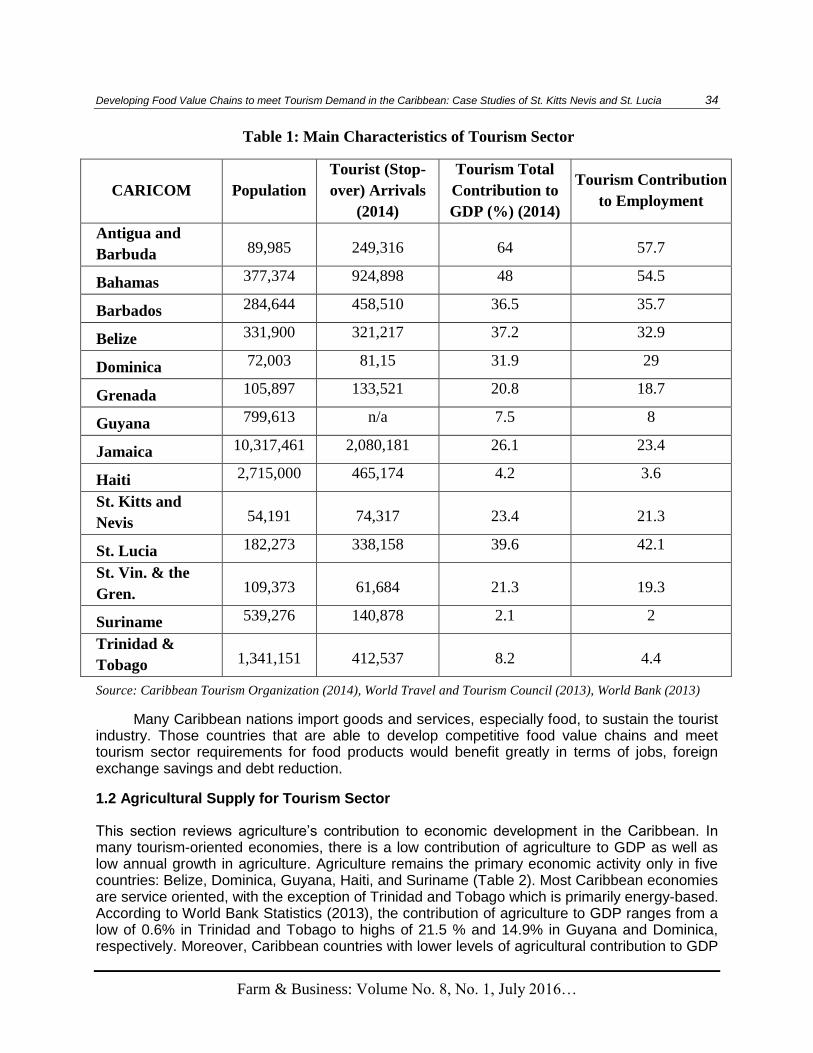
indirect social benefits. It stimulates local economies through foreign investment and also creates employment opportunities for the local population. This includes employment by hotels, restaurants and leisure industries as well as travel agents, airlines and other passenger transportation services. World Travel and Tourism Council Report (2014) estimates that the tourism sector in 2013 supported 1,909,000 jobs in the Caribbean16, including jobs indirectly supported by the industry. This is estimated to rise by 2.8% in 2014 to 1,963,000 jobs and to 2,377,000 jobs in 2024 (12.2% of total employment). Moreover, the Cruise Lines International Association (CLIA)17 reports that the Caribbean is the leading cruise destination and it accounts for 45.3%18 of global ship deployments. Cruise passengers to the region are estimated at 21.84 million19. Table 1 summarizes the main characteristics of FAO Caribbean countries in terms of population, tourist arrivals and contribution of tourism industry to national economies. The number of tourist arrivals is more than double the national population for most of the counties, highlighting the importance of the tourism industry as a substantial market in national economies. Furthermore, for some countries, such as Antigua and Barbuda and the Bahamas tourism accounts around half of their GDP, providing also more than 50% of employment. Therefore, growing demand from tourism sector opens a potential market for local food production.
16
Caribbean includes CARICOM and non-CARICOM islands. 17
CLIA is the world's largest cruise industry trade association with representation in North and South America, Europe, Asia and Australasia. http://www.cruising.org/ 18
CLIA’s figure adjusted to include the Bahamas and Bermuda. 19
Total cruise passenger arrivals as given in table represent the sum of arrivals at all destinations. However, because most cruise ships stop at more than one destination, this figure is considerably larger than the actual number of cruise passengers visiting the region.
Developing Food Value Chains to meet Tourism Demand in the Caribbean: Case Studies of St. Kitts Nevis and St. Lucia 34
Farm & Business: Volume No. 8, No. 1, July 2016…
Table 1: Main Characteristics of Tourism Sector
CARICOM Population
Tourist (Stop-
over) Arrivals
(2014)
Tourism Total
Contribution to
GDP (%) (2014)
Tourism Contribution
to Employment
Antigua and
Barbuda 89,985 249,316 64 57.7
Bahamas 377,374 924,898 48 54.5
Barbados 284,644 458,510 36.5 35.7
Belize 331,900 321,217 37.2 32.9
Dominica 72,003 81,15 31.9 29
Grenada 105,897 133,521 20.8 18.7
Guyana 799,613 n/a 7.5 8
Jamaica 10,317,461 2,080,181 26.1 23.4
Haiti 2,715,000 465,174 4.2 3.6
St. Kitts and
Nevis 54,191 74,317 23.4 21.3
St. Lucia 182,273 338,158 39.6 42.1
St. Vin. & the
Gren. 109,373 61,684 21.3 19.3
Suriname 539,276 140,878 2.1 2
Trinidad &
Tobago 1,341,151 412,537 8.2 4.4
Source: Caribbean Tourism Organization (2014), World Travel and Tourism Council (2013), World Bank (2013)
Many Caribbean nations import goods and services, especially food, to sustain the tourist industry. Those countries that are able to develop competitive food value chains and meet tourism sector requirements for food products would benefit greatly in terms of jobs, foreign exchange savings and debt reduction.
1.2 Agricultural Supply for Tourism Sector
This section reviews agriculture‘s contribution to economic development in the Caribbean. In many tourism-oriented economies, there is a low contribution of agriculture to GDP as well as low annual growth in agriculture. Agriculture remains the primary economic activity only in five countries: Belize, Dominica, Guyana, Haiti, and Suriname (Table 2). Most Caribbean economies are service oriented, with the exception of Trinidad and Tobago which is primarily energy-based. According to World Bank Statistics (2013), the contribution of agriculture to GDP ranges from a low of 0.6% in Trinidad and Tobago to highs of 21.5 % and 14.9% in Guyana and Dominica, respectively. Moreover, Caribbean countries with lower levels of agricultural contribution to GDP

Developing Food Value Chains to meet Tourism Demand in the Caribbean: Case Studies of St. Kitts Nevis and St. Lucia 35
Farm & Business: Volume No. 8, No. 1, July 2016…
tend to be net food-importers with a high ratio of food dependence20 - greater than 0.5. This is especially true in the case of Antigua and Barbuda, the Bahamas and Barbados, where the annual growth rate for agricultural value is negative.
Table 2: Agricultural Performance and Food dependence Ratio
CARICOM Agriculture, value
added (% of GDP)
Agriculture, value added
(annual % growth)
Food Dependence
Ratio
Antigua and Barbuda 2.1 -12.7 0.92
Bahamas 2.1 -9 0.92
Barbados 1.5 -3.4 0.87
Belize 13.1 20.3 0.40
Dominica 14.9 0.7 0.55
Grenada 5.4 3.2 0.81
Guyana 21.5 3.7 0.41
Jamaica 6.7 2.5 0.44
Haiti n/a 4.5 0.63
St. Kitts and Nevis 1.5 0.8 0.95
St. Lucia 3.6 19.1 0.83
St. Vin. & the Gren. 7.5 17.6 0.68
Suriname 9.3 9.1 0.64
Trinidad & Tobago 0.6 -19.1 0.85
Source: World Bank (2013), FAOSTAT (2012)
Partly due to the low contribution of agriculture to national economies, the Caribbean
tourism sector mainly relies on food imports as suppliers continue to import food products as opposed to accessing the local market. Despite numerous efforts over many years to establish direct linkages between farmers and hotels, there has been little success in sustainably supplying tourism demand from domestic production and value-chains. However, those countries that are able to develop competitive food value chains and meet tourism sector requirements for food products can significantly increase the level of foreign exchange. For some countries, this strategy is especially critical to increase the level of the high levels of leakage of foreign exchange expenditures from the tourism left in the country (as much as 90% in the Bahamas and 50% in Barbados21).
20
Food Dependence Ratio=Total Food Imports/Total Consumption, where Total Consumption = (Domestic Production + Imports). 21
CTA, IICA, CARICOM (2013), Investing in Agrotourism Development in the Caribbean Region (2013), Agrotourism Seminar, Caribbean Week of Agriculture (CWA).

Developing Food Value Chains to meet Tourism Demand in the Caribbean: Case Studies of St. Kitts Nevis and St. Lucia 36
Farm & Business: Volume No. 8, No. 1, July 2016…
Caribbean farmers have difficulties competing internationally due to higher production costs, caused by low land productivity and scarce water resources for irrigation, high costs for other inputs, limited food-processing sector and low economies of scale. The main problem is not only low production, but is also a question of quality and reliability. Private sector structural weaknesses have also contributed to the lack of inclusion of Caribbean farmers in tourism food markets. Thus, as jobs in agriculture can be created, development of local food value chains is crucial for regional food security. Adoption of new practices and training of farmers can improve the provision of goods and services to the selected value chains in a sustainable manner (FAO, 2014a; FAO, 2014b).
Analysis done by CTA, IICA and CARICOM in 2013 to investigate agrotourism development in the Caribbean region indicates a strong preference by tourists for products that are authentic, linked to local agriculture, culture and heritage in a destination. A focus on freshness and 'localness' of food products is presented as a key component of this strategy. Therefore, if local farmers can improve quality and reliability to meet commercial needs and consumer tastes, the tourism industry can contribute in a much greater manner to regional economic development. Caribbean agriculture has potential to compete in domestic markets and meet tourism demand but development of improved food supply chains and linking them with tourism food market is necessary.
1.3 Social benefits from meeting tourism sector demand and agricultural food supply.
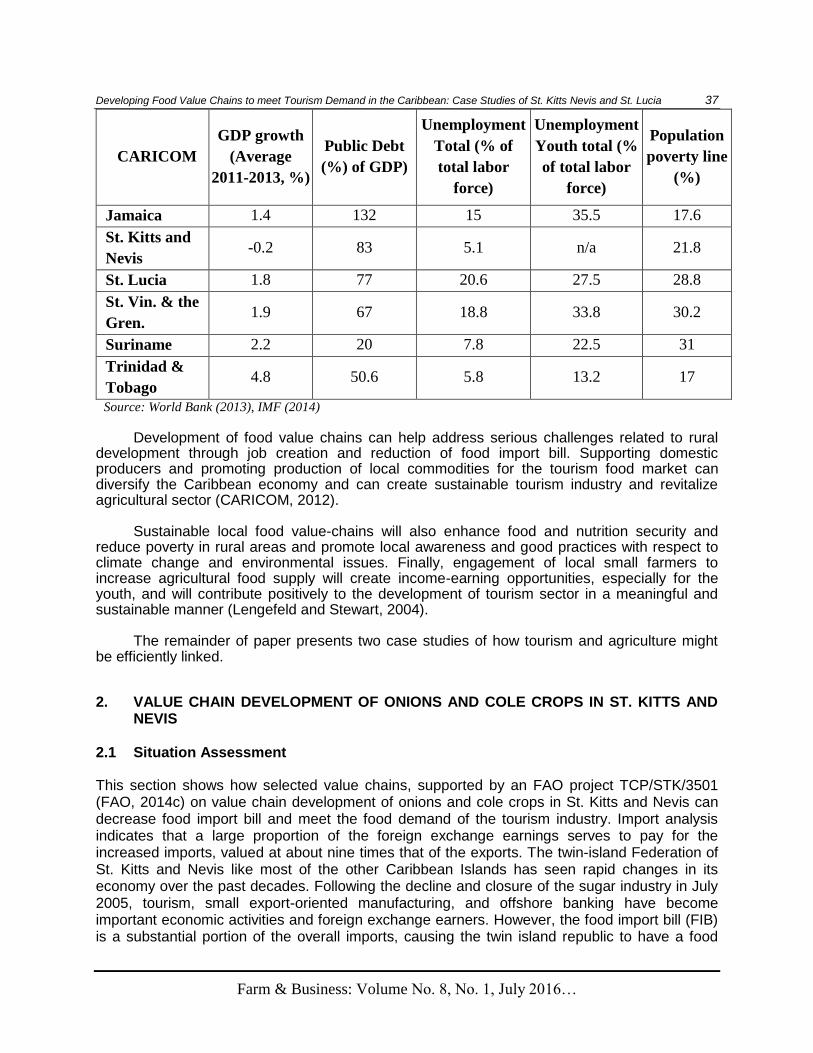
This section presents the main social benefits from linking local agriculture with the tourism industry. Overall, the Caribbean region continued to be adversely affected by relatively weak economic conditions in terms of low economic growth, high public debt and high level of unemployment, especially, among youth. All countries have low average economic growth except for Trinidad which has an energy-oriented economy (Table 3). High levels of public debt, especially in case of Jamaica and Barbados, reduce the ability of countries to implement social programs and contribute to rural development and economic growth. Moreover, the high level of unemployment in all countries, especially among youth, further contributes to high poverty level.
Table 3: Overview of Main Economic and Social Indicators in the CARICOM
CARICOM
GDP growth
(Average
2011-2013, %)
Public Debt
(%) of GDP)
Unemployment
Total (% of
total labor
force)
Unemployment
Youth total (%
of total labor
force)
Population
poverty line
(%)
Antigua &
Barbuda 2.1 89 8.4 19.9 18.4
Bahamas 2.1 57.6 13.6 28.9 9.3
Barbados 0.4 101.2 12.2 27 19.3
Belize 3.4 79.6 14.6 29.7 41
Dominica 1.2 70 11 26 29
Grenada 2.4 110 10.2 31.5 38
Guyana 1.8 58 11.1 23.9 35
Haiti 2.5 20.4 7 17.4 58.5
Developing Food Value Chains to meet Tourism Demand in the Caribbean: Case Studies of St. Kitts Nevis and St. Lucia 37
Farm & Business: Volume No. 8, No. 1, July 2016…
CARICOM
GDP growth
(Average
2011-2013, %)
Public Debt
(%) of GDP)
Unemployment
Total (% of
total labor
force)
Unemployment
Youth total (%
of total labor
force)
Population
poverty line
(%)
Jamaica 1.4 132 15 35.5 17.6
St. Kitts and
Nevis -0.2 83 5.1 n/a 21.8
St. Lucia 1.8 77 20.6 27.5 28.8
St. Vin. & the
Gren. 1.9 67 18.8 33.8 30.2
Suriname 2.2 20 7.8 22.5 31
Trinidad &
Tobago 4.8 50.6 5.8 13.2 17
Source: World Bank (2013), IMF (2014)
Development of food value chains can help address serious challenges related to rural
development through job creation and reduction of food import bill. Supporting domestic producers and promoting production of local commodities for the tourism food market can diversify the Caribbean economy and can create sustainable tourism industry and revitalize agricultural sector (CARICOM, 2012).
Sustainable local food value-chains will also enhance food and nutrition security and
reduce poverty in rural areas and promote local awareness and good practices with respect to climate change and environmental issues. Finally, engagement of local small farmers to increase agricultural food supply will create income-earning opportunities, especially for the youth, and will contribute positively to the development of tourism sector in a meaningful and sustainable manner (Lengefeld and Stewart, 2004).
The remainder of paper presents two case studies of how tourism and agriculture might
be efficiently linked.
2. VALUE CHAIN DEVELOPMENT OF ONIONS AND COLE CROPS IN ST. KITTS AND
NEVIS
2.1 Situation Assessment
This section shows how selected value chains, supported by an FAO project TCP/STK/3501 (FAO, 2014c) on value chain development of onions and cole crops in St. Kitts and Nevis can decrease food import bill and meet the food demand of the tourism industry. Import analysis indicates that a large proportion of the foreign exchange earnings serves to pay for the increased imports, valued at about nine times that of the exports. The twin-island Federation of St. Kitts and Nevis like most of the other Caribbean Islands has seen rapid changes in its economy over the past decades. Following the decline and closure of the sugar industry in July 2005, tourism, small export-oriented manufacturing, and offshore banking have become important economic activities and foreign exchange earners. However, the food import bill (FIB) is a substantial portion of the overall imports, causing the twin island republic to have a food

Developing Food Value Chains to meet Tourism Demand in the Caribbean: Case Studies of St. Kitts Nevis and St. Lucia 38
Farm & Business: Volume No. 8, No. 1, July 2016…
dependence ratio equal to 0.95. Total agricultural and food imports are estimated at ECD 111.6 mn22, where the proportion of fruits and vegetables imports is estimated at ECD 17.8 mn or 16 % of total food imports.
Agriculture, together with forestry and fisheries, contributes 1.7% of St Kitts and Nevis‘
GDP (World Bank, 2013). An analysis of the period 1995 through 2011 indicates that total food imports increased from USD 24.4 mn in 1995 to USD 40.4 mn in 2011. Over the said period, the growth of the tourism sector continued to expand. Current tourism contribution to GDP is estimated at 23.4 %. However, foreign exchange earnings from the tourism industry are mainly used to pay for increasing imports, valued at about nine times that of the exports.
The tourism sector offers a great opportunity for local agricultural development through
the utilization of fresh local products. Environmental conditions including soil and climate are favourable for the year-round production of local crops. Examining the most commonly imported fruits and vegetables shows that most of these commodities can be grown locally thus reducing foreign exchange leakage. Substitution of imported for locally grown products can be as high as 32% of total fruits and vegetables (Table 4).
Therefore opportunities exist for local produce to successfully compete with imported
products on the supermarket shelves. Further export opportunities also exist in the nearby sub-regional markets that currently depend on the importation of local vegetables and fruits from extra-regional sources.
Table 4: Top 20 imported commodities from fruits & vegetables group
Commodity Value (EC$)
% of Fruits &
Vegetables Imports
Commodities
that can be
grown locally
Juice, fruit nes 1,555,124 8.7%
Potatoes, frozen 1,505,723 8.4% x
Juice single fruit n.e.s. 1,024,554 5.7%
Potatoes 704,193 3.9% x
Grapes, fresh. 651,729 3.6%
Onions, fresh or chilled. 565,492 3.2% x
Apples, fresh. 560,672 3.1%
Cabbage lettuce 513,190 2.9% x
Headed broccoli 467,875 2.6% x
Nuts and other seeds, 465,264 2.6% x
Other orange juice 445,420 2.5%
22
Ministry of International Trade, Industry and Commerce, St. Kitts & Nevis (2014).

Developing Food Value Chains to meet Tourism Demand in the Caribbean: Case Studies of St. Kitts Nevis and St. Lucia 39
Farm & Business: Volume No. 8, No. 1, July 2016…
Commodity Value (EC$)
% of Fruits &
Vegetables Imports
Commodities
that can be
grown locally
Sweet peppers 415,932 2.3% x
Frozen orange juice 366,256 2.0%
Other apple juice 365,505 2.0%
Grapes 328,255 1.8%
Mixtures of vegetables, frozen. 324,908 1.8%
Cabbages, fresh 287,442 1.6% x
Carrots, fresh 286,341 1.6% x
Garlic, fresh 274,734 1.5% x
Other beans dried 240,741 1.3% x
TOTAL 11,349,350 63% 32%
Source: National Statistics
FAO project foresees value-chain development of onions and cole crops (cabbage, cauliflower, broccoli, brussels sprouts) in St. Kitts and Nevis as one of the main strategies to reduce the food import bill and create employment. According to National Statistics, total imports of onions in 2014 are estimated at ECD 0.5 EC mn, which is 4% of fruits & vegetables; imports of cole crops (cauliflower, broccoli, cabbages, cabbage lettuce and brussels sprouts) are estimated at ECD 1.9 mn, which is 11% of total fruits & vegetables imports.
Total domestic supply of onions is estimated at 325 MT - only 120 MT were locally
produced in St. Kitts & Nevis, while 205 MT were imported. In all 63% of domestic supply of onions is imported. Overall domestic supply of cole crops in St. Kitts and Nevis is estimated at 311 MT, and 91% of this is imported. Local production of cabbages is 25.9 MT and broccoli 0.8 MT; while imports of these crops were 284 MT.
2.1.1 Challenges of domestic agricultural supply to meet tourism demand
Based on field work carried out by the researcher in St. Kitts and Nevis in May 2015 and interviews with extension officers and small farmers main challenges of domestic agricultural supply to meet tourism demand were identified. Six main problems of the agricultural sector limit producers in St. Kitts and Nevis from meeting the food demand of the tourism industry: access to land, marketing, irrigation, lack of post-harvest outlets, inconsistency of supply and low quality of local commodities. While local produce has an advantage of freshness and taste, the proportion of local purchases by the tourism sector is still very low due to sporadic distribution, seasonality of production and inconsistent quality.
Agricultural production of cole crops and onions in St. Kitts and Nevis is primarily through
small farming, where producers operate on less than 2 ha of land. Current production models are characterized by traditional land management, where about 85% of farmers are landless farmers and have to lease the land from the Government. Furthermore, most of the farmers rely on rain fed water therefore, production yields are severely affected, due to lack of irrigation.

Developing Food Value Chains to meet Tourism Demand in the Caribbean: Case Studies of St. Kitts Nevis and St. Lucia 40
Farm & Business: Volume No. 8, No. 1, July 2016…
Higher production is also possible, by increasing the number of harvests per year but the production cycle is very limited with only one per year. With irrigation, up to four possible cycles per year are possible, which is not currently realized. Other limitations to regular supply are the lack of storage and processing facilities which increase post-harvest losses. As result, domestic crops cannot be supplied during the whole year. Furthermore, farmers have very limited access to restaurants and hotels to sell their commodities, as a result street markets continue to be main market outlets. Farmers are also not motivated to introduce any quality control and grading system as they do not receive a better price for a better quality of crops. All these issues prevent expansion of local agriculture to supply the increasing food demand from tourism sector.
2.2 EXPANSION OF DOMESTIC MARKET SHARE
2.2.1 Prices
In order for the domestic agricultural sector in St. Kitts and Nevis to be competitive, the price of local production needs to be competitive with that of imported products. Analysis of current average retail prices indicates that local commodities are only slightly higher priced than imported commodities (Table 5). Local farmers could reduce their prices to equal or below that of imported commodities with higher production yields, which could be obtained with adequate training to farmers on improved production and management techniques. This will enable the tourism sector purchasing managers to increase the volume of purchased domestic products if farmers can meet quality requirements of the tourism industry and guarantee the consistency of supply.
Table 5: Current Average Retail Prices from Selected Supermarkets May 201523
Commodity Local EC$/lbs. Imported EC$/ lbs.
Onion 2.6 2.5
Broccoli 6.61 8.96
Cabbages 3.2 3
There is currently a 100% mark-up by farmers, and even so the difference in retail price between local and imported commodities is minimum. After introduction of improved management the cost of production is expected to drop by 50%, suggesting that farmers can apply the same a mark-up of 100% and their prices will be very competitive with imported commodities.
2.2.2 Land
The agricultural land area of St. Kitts and Nevis is 23.1 % of total land (6000 ha). The closure of the sugar industry in 2005 provided access to fertile agricultural land that was previously occupied by sugarcane. The amount of ex sugar cane land in St. Kitts and Nevis that is potentially available for agriculture is estimated at 3156 Ha (Table 6). Efficient land policy for landless farmers can expand domestic production of cole crops and onions and replace imported commodities, saving annually about 2.4 ECD mn of national budget.
23
Ram’s, CNC, Valu Mart, Best Buy, Chinese Supermarket (chain).

Developing Food Value Chains to meet Tourism Demand in the Caribbean: Case Studies of St. Kitts Nevis and St. Lucia 41
Farm & Business: Volume No. 8, No. 1, July 2016…
Table 6: Land Distribution in St. Kitts and Nevis
Land Area (ha)
Land Area 26,000
Agricultural area 6,000
where total ex sugar cane land24
3,937
- ex sugar cane land approved for agriculture uses 781
- ex sugar cane land potentially available for agriculture 3,156
Forest area 11,000
Other land utilization 9,000
Source: Ministry of Sustainable Development of St. Kitts and Nevis
Land Requirements for the Expansion of Onions Production
Currently domestic production of onions occupies only 6 Ha25 of harvested area, while harvested area of cabbages occupies 7 Ha. In order to expand production of onions to enable substitution of imported onions, based on current volume of imports of onion in 2014 of 205 MT/ 471,789 lbs, on average around 30 acres are needed annually or less than 2.5 acres per month with an increase in yield to 14 000 lbs/acre. At current yields of 10 000 lbs/acre, 45.1 acres is required (Table 7). Yields will also need to increase from the current level of 10,000 lbs/acre to 14,000-16,000 lbs/acre. Small farmers, operating on less than 2 Ha26 can be also engaged to increase the domestic share of total market.
Table 7: Land requirements for import substitution of onions
Onions Acres Required Annually
10 000
12 000 14 000 16 000 18 000 20 000
Imports (lbs.)
lbs/acre27
lbs/acre lbs/acre lbs/acre lbs/acre lbs/acre
45.1 35.1 32.2 28.2 25.1 22.5
451,947 Monthly Acres Requirement for 2 crops cycle
3.7 2.9 2.6 2.3 2.1 1.8
Land Requirements for the Expansion of Cole Crops Production
To expand cole crops production to meet current volume of imports in 2014 of 626,112 lbs. approximately only 60 acres are required annually or 5 acres per month - if there is an increase in yield from the current level of 3,000 lbs/acre to 9,000-12,000 lbs/acre.
24
Data is only for St. Kitts. In Nevis sugar cane was not grown. 25
Production data only refers mainly to St. Kitts, data for Nevis is not captured. 26
1 Ha=2,47 acres. 27
Here and after in grey colour current yield of onions production in St. Kitts and Nevis is indicated.

Developing Food Value Chains to meet Tourism Demand in the Caribbean: Case Studies of St. Kitts Nevis and St. Lucia 42
Farm & Business: Volume No. 8, No. 1, July 2016…
Table 8: Land requirements for import substitution of cole crops
Cole Crops Acres Required Annually
Imports 3 000 6 000 9 000 12 000 13 000 16 000
(lbs.) lbs/acre28
lbs/acre lbs/acre lbs/acre lbs/acre lbs/acre
209 104 70 52 48 39
626,112 Monthly Acres Requirement for 2 crops cycle
17 9 6 4.3 4 3.2
2.3 LINKS WITH TOURISM SECTOR
This section estimates the total demand of the tourism industry for onions and cole crops, both local and imported. It also identifies the key requirements for farmers to increase the supply of local products to the tourism sector. The factors informing this are based on a survey conducted in May 2015 with food importers in the tourist industry. The methodology is as follows: estimates of tourism demand of cole crops and onions are based on Resort A‘s29 monthly purchases and average number of guests. The demand per guest is extrapolated to the total demand of tourism sector by multiplying by the total number of visitors. These findings indicate the quantity of this potential demand which can be supplied by local production of onions and cabbages. Furthermore, proportion of current supply consumed by the tourist sector is estimated in order to show the percentage of domestic supplies that goes to the tourism sector.
There were twenty-five scheduled interviews with purchase managers of the biggest
hotels in St. Kitts and Nevis, extension and marketing officers from the Ministry of Agriculture and Fisheries and domestic producers. These interviews took place in May, 2015. Participants were asked for to quantify food purchases from local farmers, indicate main mechanisms of domestic supply and identify main constraints. The survey found that consumption of total food imports by tourism sector (hotels, restaurants) account around 40% of total food imports and total food imports is equal to ECD 44.6 mn. Hotels and restaurants can order local commodities either through the Marketing Department of Ministry of Agriculture or directly placing order for farmers. The current local purchase of onions by hotels and restaurants is less than 6% annually of total domestic production, while purchases of cabbages account for only 2%. Supply consistency, grading, packaging and diversification are key indicated requirements of tourism operators in order to increase local purchases.
St. Kitts Resort A - Case Study30
St. Kitts Resort A has on average 988 guests per month. Demand per guest is estimated based on monthly purchases of local and imported onions and cabbages (Table 9).
28
Here and after in grey colour current yield of cabbage production in St. Kitts and Nevis is indicated. 29
To respect company privacy policy business name is not indicated. 30
The respondent asked to be anonymous

Developing Food Value Chains to meet Tourism Demand in the Caribbean: Case Studies of St. Kitts Nevis and St. Lucia 43
Farm & Business: Volume No. 8, No. 1, July 2016…
Table 9: Estimated Demand per Guest
Monthly
Demand
(Imports)
A
Monthly Demand
(Local)
B
Total Demand per
guest:
(A+B)/ 988
C
Commodity
Volume (lbs.) Volume (lbs.) Volume (lbs.)
Onion 8,200 300 8.6
Cabbage 1,200 30 1.24
Extrapolating per guest demand and multiplying it by total number of visitors31 in St. Kitts and Nevis in 2014 (74,317 tourists), it is possible to estimate total demand of the tourism sector for selected commodities as well as the proportion of domestic supply consumed by the tourist sector. This shows that approximately 639,126 lbs. of onions and 92,153 lbs. of cabbages are needed annually to satisfy the demand of tourism industry (Table 10). It shows that 89% of total domestic supply of onions is consumed by local hotels and restaurants and only 30% of total domestic supply of cabbages goes to the tourism sector. The high proportion of onions consumed by the tourist sector indicates a potential market for local production to meet this growing demand.
Table 10: Estimated Demand by Tourism Industry
Commodity
Total Tourism
Demand
(C*74,317)
(lbs.)
D
Domestic
Production
(lbs.)
E
Imports
(lbs.)
F
Total
Supply
(E+F)
(lbs.)
G
Proportion of
Supply
consumed
by the
Tourism
Sector (D/G)
(%)
H
Onion 639,126 264,554 451,947 716,501 89
Cabbage 92,153 57,099 243,094 300,193 30
2.3 PRODUCTION COST ANALYSIS (cabbage, onions)
This section estimates profit margins for farmers based on production costs and improved yields. In particular, a baseline survey questionnaire was used to provide the parameters for calculating the cost of production under current and improved management systems. Main parameters refer to cost of land preparation, planting material, fertilizing, weed and pest control, irrigation, harvesting, transportation and storage. The researcher developed cost of traditional and improved production models in May 2015 in close collaboration with extension officers from Ministry of Agriculture and Fisheries of St. Kitts and Nevis. National data from the baseline
31
Only stop-over arrivals

Developing Food Value Chains to meet Tourism Demand in the Caribbean: Case Studies of St. Kitts Nevis and St. Lucia 44
Farm & Business: Volume No. 8, No. 1, July 2016…
survey (44 farmers who grow cole crops and onions in St. Kitts as part of Farmer Field School approach) was used to estimate the cost and the associated yields of existing traditional and improved practices. Estimated production costs are presented in Appendix. The main difference between two production models (current and improved) is based on increased use of fertilizers, additional labour, irrigation and post-harvest storage.
2.3.1 Cole Crops Production Costs (Cabbage)
The cost of production for cabbage under a traditional management system is estimated at ECD 4,884/acre. Introduction of improved practices such as weed control, fertilizers, irrigation and post-harvest storage increase this cost to ECD 13,934 (Appendix A-B). However, the lower production cost of traditional systems also has a low yield of 3,000 lbs/acre due to post-harvest losses and use of rain fed agriculture, while yield under the improved management system is expected to reach 16,000 lbs/acre. The estimated cost per lbs. at increased yields thus decreases by almost half from ECD 1.62 to ECD 0.87 (Table 11).
Table 11: Cabbage: estimated Cost (EC$) of Production at increasing Yields
YIELD COST PER ACRE EC$
COST PER LBS.
(LBS/ACRE)
3000 lbs/acre 4,884 1.62
6000 lbs/acre 9,000 1.5
9000 lbs/acre 11,000 1.22
12.000 lbs/acre 11,500 0.95
13.000 lbs/acre 12,000 0.92
16.000 lbs/acre 13,934 0.87
Table 12 presents the estimations of profit margins at different yields of production using the current wholesale price of local cabbage (ECD 2 /lbs). The production cost in Table 11 is used to demonstrate that current profit margin under yield 3,000 lbs/acre is only 0.38 ECD while under improved yield it can be up to 1.13 ECD. At current yields the profit margins for one production cycle (16 weeks) is low and contributes less than 10% to household income. However, profit margins increase from ECD 1,116 to ECD 18,066 per production cycle at higher yields. Furthermore, under improved production techniques farmers can realize up to 3 production cycles per year, thus tripling estimated profit margins. It implies that small farming can be not only profitable, but can also satisfy the growing demand of the tourism industry.
Table 12: Cabbage Estimated Profit Margin
COST OF
PROFIT MARGIN
YIELD (LBS/ACRE)
SALES (A* ECD 2)
PER CYCLE (B-C) $EC
PRODUCTION ($EC)
A
B
D
C
3 000 lbs/acre 6,000 4,884 1,116
6 000 lbs/acre 12,000 9,000 3,000
9 000 lbs/acre 18,000 11,000 7,000
12 000 lbs/acre 24,000 11,500 12,500
13 000 lbs/acre 26,000 12,000 14,000
16 000 lbs/acre 32,000 13,934 18,066

Developing Food Value Chains to meet Tourism Demand in the Caribbean: Case Studies of St. Kitts Nevis and St. Lucia 45
Farm & Business: Volume No. 8, No. 1, July 2016…
2.3.2 Onions Production Costs
The cost of production for onions under a traditional management system is estimated at ECD 9,963/acre. Introduction of improved practices such as weed control, fertilizers, irrigation and post-harvest storage increase this cost up to ECD 11,430 (Appendix C-D). The estimated yield of current traditional production systems is 10,000 lbs/acre. However, under improved production with inputs of than 1,500 ECD (cost difference between traditional and improved systems), yield can increase to up to 20,000 lbs/acre. Table 13 shows that little improvement is needed in order to decrease current cost of production per lbs. from ECD 1 to ECD 0.57.
Table 13: Onions: estimated Cost (EC$) of Production at increasing Yields
YIELD COST PER ACRE EC$
COST PER LBS.
(LBS/ACRE)
10,000 lbs/acre 9,963 1
12,000 lbs/acre 10,300 0.86
14,000 lbs/acre 10,600 0.82
16,000 lbs/acre 10,900 0.68
18,000 lbs/acre 11,200 0.62
20,000 lbs/acre 11,430 0.57
Table 14 presents the estimations of the farmer‘s profit margins at different yields based on the current wholesale price of local onions in St. Kitts and Nevis (ECD 1.5 lbs). At current yields under traditional management profit margins per production cycle (18 weeks) are almost five times less than under improved management system. Profit margins gradually increase from ECD 5,037 to ECD 18,570 with very little additional investment (column C). Furthermore, improved production systems would allow harvesting twice per year, thus doubling the profit margins.
Table 14: Onions Estimated Profit Margin
COST OF PROFIT MARGIN
YIELD (LBS/ACRE) SALES (A* ECD 1.5 ) PRODUCTION PER CYCLE
A B ($EC) (B-C) $EC
C D
10,000 lbs/acre 15,000 9,963 5,037
12,000 lbs/acre 18,000 10,300 7,700
14,000 lbs/acre 21,000 10,600 10,400
16,000 lbs/acre 24,000 10,900 13,100
18,000 lbs/acre 27,000 11,200 15,800
20,000 lbs/acre 30,000 11,430 18,570

Developing Food Value Chains to meet Tourism Demand in the Caribbean: Case Studies of St. Kitts Nevis and St. Lucia 46
Farm & Business: Volume No. 8, No. 1, July 2016…
2.4 POLICY SUPPORT FOR VALUE CHAINS DEVELOPMENT
The models above show that there is a market opportunity for farmers to compete with imports, producing and selling local onions and cole crops and increasing their incomes. However, farmers must have access technical and financial assistance from the Government in order to meet the strong demand of the tourism industry. Improving the inadequate quality of local products and ensuring reliability to supply required volumes are the main components of a strategy based on the linking the local agriculture and tourism sector. This section presents policy measures used to support small farmers in other countries. These cases show the efficacy of five principal areas of support: marketing assistance, land distribution, irrigation, post-harvest losses and quality control.
First, further marketing support should be developed in order to link local farmers with tourism sector operators. Technical assistance to the respective farmers is needed to build an effective distribution system and ensure consistent supply. Second, attention must be given to issues such as distribution of available and unused ex sugar cane land for landless farmers. Third, improvement of current policy for irrigation is needed to facilitate permission for farmers to get lower water rates for farming and implement drip irrigation. Fourth, greater emphasis must be placed on the importance of post-harvest losses, and practical steps should be taken to create central storage outlets for farmers. Currently only one storage outlet in St. Kitts is under development and it is not being utilized. Finally, farmers should be assisted with the improvement of packaging and grading systems to meet the quality required by the tourism sector. Overall, if policy support is provided for farmers, the tourism industry in St Kitts and Nevis is expected to continue to offer good market opportunities for local producers. As result, by meeting the demand of tourism industry, farmers have an excellent opportunity to expand current agricultural production of selected commodities and thereby increase their incomes.
3. VALUE CHAIN DEVELOPMENT OF SELECTED CROPS ST. LUCIA
3.1 Situation Assessment
This section shows how development of selected value chains in St. Lucia, supported by an FAO project on value chain development of staples (sweet potatoes, yams), fruits (cantaloupe, water melon) and vegetables (tomato, sweet pepper, spinach and salad beans) can contribute to reduce the food import bill, diversify the agricultural sector and meet the demand for food of the tourism industry. St. Lucia is an island nation with a population of 182,300 (World Bank, 2013) and an area of 620 sq. km. Like many other Caribbean states, St. Lucia is facing a number of challenges related to the transition from an agricultural economy to a more service-based economy, namely one based on tourism. This change from an agro-based to a tourism-based economy was influenced significantly by the loss of market access due to changes to international trade rules for the banana industry, which lead to St Lucia losing some its preferential access to markets in Europe. Traditionally, St. Lucia‘s production of bananas for exports was the primary source of foreign exchange within the agricultural sector and economy. However, since the changes, the contribution of the agricultural sector has continued to decline and tourism has replaced agriculture as the main economic driver, now accounting for 40% of GDP.
Agriculture‘s contribution to GDP in St Lucia has declined over the past decade from
11% in 1993 to 3% in 2013. The agricultural sector has been declining due to several economic,
Developing Food Value Chains to meet Tourism Demand in the Caribbean: Case Studies of St. Kitts Nevis and St. Lucia 47
Farm & Business: Volume No. 8, No. 1, July 2016…
technical and institutional factors, which have also affected food and nutrition security in the country. Furthermore, St. Lucia is classified by the WTO as a net food-importing country and the current food import bill amounts to approximately 350 ECD mn. Total imports of fruits and vegetables imports account for 16 % of the food import bill and equal 56 ECD mn per year. A large proportion of foreign exchange earnings is used to pay for the increasing food imports. So far the agricultural sector has not responded to this expansion of the tourism market.
Creating linkages between the agriculture and the tourism sector could provide important
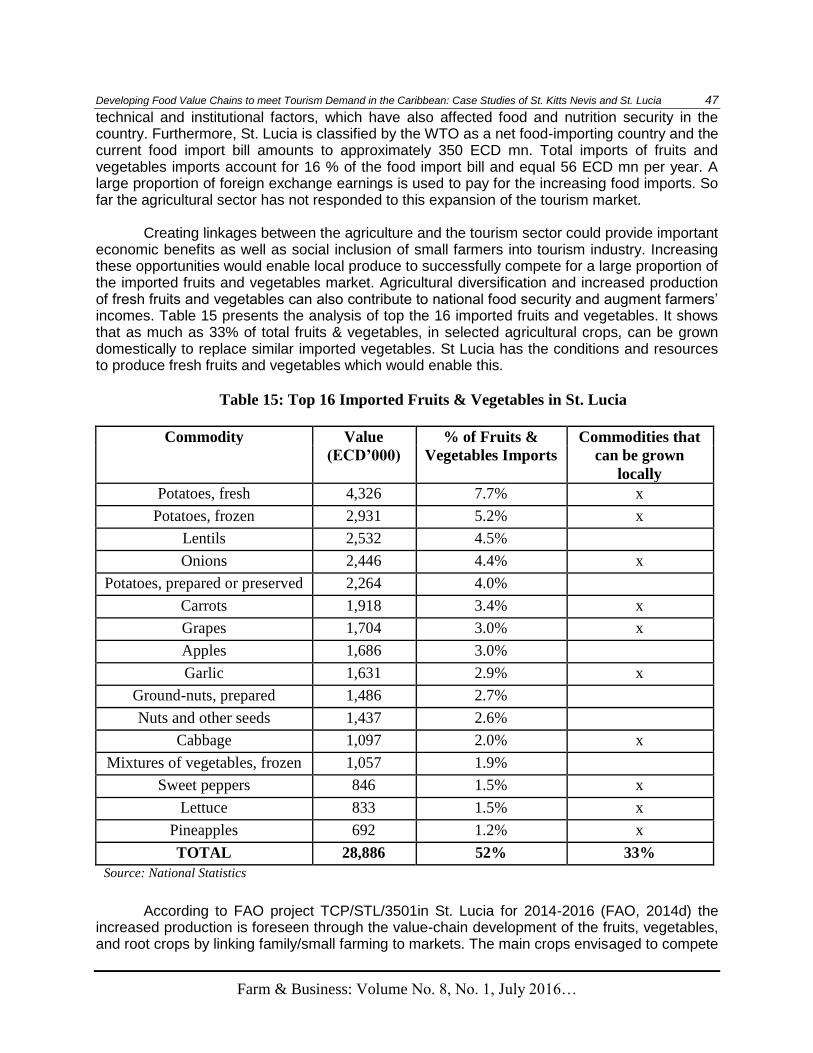
economic benefits as well as social inclusion of small farmers into tourism industry. Increasing these opportunities would enable local produce to successfully compete for a large proportion of the imported fruits and vegetables market. Agricultural diversification and increased production of fresh fruits and vegetables can also contribute to national food security and augment farmers‘ incomes. Table 15 presents the analysis of top the 16 imported fruits and vegetables. It shows that as much as 33% of total fruits & vegetables, in selected agricultural crops, can be grown domestically to replace similar imported vegetables. St Lucia has the conditions and resources to produce fresh fruits and vegetables which would enable this.
Table 15: Top 16 Imported Fruits & Vegetables in St. Lucia
Commodity Value % of Fruits & Commodities that
(ECD‟000) Vegetables Imports can be grown
locally
Potatoes, fresh 4,326 7.7% x
Potatoes, frozen 2,931 5.2% x
Lentils 2,532 4.5%
Onions 2,446 4.4% x
Potatoes, prepared or preserved 2,264 4.0%
Carrots 1,918 3.4% x
Grapes 1,704 3.0% x
Apples 1,686 3.0%
Garlic 1,631 2.9% x
Ground-nuts, prepared 1,486 2.7%
Nuts and other seeds 1,437 2.6%
Cabbage 1,097 2.0% x
Mixtures of vegetables, frozen 1,057 1.9%
Sweet peppers 846 1.5% x
Lettuce 833 1.5% x
Pineapples 692 1.2% x
TOTAL 28,886 52% 33%
Source: National Statistics
According to FAO project TCP/STL/3501in St. Lucia for 2014-2016 (FAO, 2014d) the
increased production is foreseen through the value-chain development of the fruits, vegetables, and root crops by linking family/small farming to markets. The main crops envisaged to compete

Developing Food Value Chains to meet Tourism Demand in the Caribbean: Case Studies of St. Kitts Nevis and St. Lucia 48
Farm & Business: Volume No. 8, No. 1, July 2016…
with imports are tomatoes, carrots, cantaloupe, melons, sweet potatoes and spinach. Estimation show that even focusing on these crops alone would improve domestic and tourism industry supply and enhance the resilience of the agriculture sector, where savings could account for 3.5 ECD mn (Table 16).
Table 16: Imports of selected commodities in St. Lucia in 2014
Commodity Value ($EC) NET MASS (MT)
Tomatoes 631,177 120,5
Carrots 1,918,199 666
Cantaloupes 515,425 154
Melons 433,610 97,4
Sweet Potatoes 14,481 0.27
Spinach 6,610 0.053
TOTAL 3,519,502 1,034
Source: National Statistics
The total domestic supply of selected commodities is estimated at 2,712 MT - only
1,675MT were locally produced, while 1,034 MT were imported (Table 17). In all 60% of domestic supply is produced locally and 40% is imported. Of the produce supplied domestically, the proportion of imported carrots and cantaloupes is especially high, accounting for 98% and 84% of total domestic supply, respectively. Domestic production of tomatoes, sweet potatoes, spinach, yams and beans is higher than the proportion of imports. Farmers in St. Lucia are already competitive with certain products, and therefore have a high capacity to increase their share of the domestic market.
Table 17: Domestic supply selected commodities in St. Lucia in 2014
A B C=A+B D=B/C,
Commodity Domestic Imports Domestic Imports in
Production (MT) Supply Domestic
(MT) (MT) Supply
Tomatoes 263 120 383 31%
Carrots 15 666 681 98%
Cantaloupes 29 154 183 84%
Sweet Potatoes 576 0.27 576.27 0.05%
Spinach 5 0.053 5.053 1%
Yams 476 n/a 476 n/a
Salad Beans 74 n/a 74 n/a
TOTAL 1,438 940 2,378
Source: National Statistics
Developing Food Value Chains to meet Tourism Demand in the Caribbean: Case Studies of St. Kitts Nevis and St. Lucia 49
Farm & Business: Volume No. 8, No. 1, July 2016…
3.1.1 Challenges of domestic agricultural supply to meet tourism demand
Based on field work carried out by the researcher in St. Lucia in June 2015 and several interviews with extension officers and small farmers, main challenges of domestic agricultural supply to meet tourism demand were identified. This section analyses five constraints of the agricultural sector in St. Lucia related to meeting the tourism industry demand: access to inputs, irrigation, lack of proper production schedules, quality issues, marketing infrastructure and processes. These constraints prevent farmers from increasing local production to meet the growing demand from the tourism industry.
First, agricultural production in St. Lucia is practised primarily as small scale farming.
Farmers in St. Lucia traditionally produced mainly bananas for export and, to a lesser degree, non-traditional crops for export and domestic consumption. With the diversification of the agricultural sector into non-traditional crops, many small farmers face the problem of lack of access to inputs: credit, land, seeds, and fertilizers. Farmers cannot access credit because of lack of record keeping and collateral availability. Furthermore, complicated family land tenure issues and inadequate land distribution policies prevent farmers from expanding their farming activity. Finally, critical inputs such as imported seeds and fertilizers are often out of stock when most needed given inadequate amounts of the local supplies.
Second, agricultural production in St. Lucia is characterised by high seasonality as most
of the farmers do not use irrigation, instead relying on rain fed agriculture. In particular, high costs of irrigation equipment cannot be afforded by majority of small farmers. As result, while local crops are preferred by most hotels and restaurants in St. Lucia, the inconsistency of supply due to seasonality of production prevents farmers from supplying the tourism industry in a continuous and consistent manner all-year-round.
Third, according to St. Lucia Extension Division many small farmers have limited knowledge of crop production scheduling and the best time for planting different vegetables. Therefore, periodically, production without proper land preparation and planning leads to gluts, high production losses and loss of competitiveness.
Fourth, quality control of domestic produce is needed. For several years the Ministry of
Agriculture, Lands, Fisheries & Forestry initiated a Farmer Certification Programme to ensure that farmers meet international market standards. Farmers were trained in Good Agricultural Practices (GAP) that promote environmental and economic sustainability, and result in safe and healthy agricultural products. These GAP standards assure purchasers that fruits and vegetables grown domestically meet the highest health and safety standards. After completion of training, farmers were issued with the farmer's identification card that guaranteed better prices for domestic produce from local supermarkets and hotels. However, this programme has limited duration and capacity. Meanwhile, the tourism industry requests farmers groups to produce local crops according to their quality standards (size, shape, colour, level of maturity). This quality control is rewarded by the tourism industry with higher prices. Therefore, communication from the tourist industry on the specifications that produce must meet need to be improved and disseminated more widely. Only one resort, Sandals, has produced such specifications for each crop in order to help increase the quality of local fruits and vegetables.
Finally, at the national level a better product marketing system is needed to coordinate
national demand and supply. There is not enough information to guide producers on what to grow and to inform food buyers on what is available. Poor marketing infrastructure and low level of communication prevents hotels from purchasing greater quantities from local farmers and from the St. Lucia Marketing Board.

Developing Food Value Chains to meet Tourism Demand in the Caribbean: Case Studies of St. Kitts Nevis and St. Lucia 50
Farm & Business: Volume No. 8, No. 1, July 2016…
3.2 EXPANSION OF DOMESTIC MARKET SHARE IN ST. LUCIA
3.2.1 Prices
Competitively priced local produce with high quality standards is essential to increasing domestic agriculture market share. The average retail prices of locally produced and imported commodities purchased by hotels and supermarkets in St. Lucia in 2014 are shown in table 18. Prices of local commodities vary during the year due to seasonal production. However, price analysis shows that for local commodities hotels pay higher prices to the farmers than supermarkets because of higher quality standards. Moreover, farmers are price competitive in production of carrots, spinach, sweet potatoes and salad bean production. If farmers can implement irrigation and new production techniques, higher yields will reduce production costs and be competitive against imported products.
Table 18: Average Prices of Selected Agricultural Produce (2014)
Price -Hotel to Price - Supermarket to Price – Imported
Commodity farmers (Local farmers (Local Produce
Produce) EC$/lbs. Produce) EC$/lbs. EC$/lbs.
Tomatoes 9.87 7.1 6.81
Carrots 5.77 5.1 2.72
Spinach 7.67 6.5 -
Sweet Potatoes 5.47 4.3 -
Cantaloupe 6.27 4.5 4.52
Honeydew 6.4 4.2 -
Salad beans 7.2 7.3 -
Source: National Statistics
3.2.2 Land
St. Lucia is 620 sq. km or 62,000 Ha, of which agricultural land area accounts for 17% of total land (10,600 Ha). The decline of the banana industry has provided additional land which is potentially available for agricultural development and diversification. Table 19 shows current distribution of land in St. Lucia. However, small and fragmented farms, which generally operate on less than 1 ha and a complex land tenure system is an important constraint to farm investment, therefore improvement of the land tenure system and access to land is one of the main priorities in St. Lucia.

Developing Food Value Chains to meet Tourism Demand in the Caribbean: Case Studies of St. Kitts Nevis and St. Lucia 51
Farm & Business: Volume No. 8, No. 1, July 2016…
Table 19: Land Distribution in St. Lucia
Country Area
Land Area 62,000 Ha
Agricultural area 10,600 Ha
- Arable land 3,000 Ha
- Permanent Crops 7,000 Ha
- Permanent meadows and pastures 600 Ha
Forest area 47,000 Ha
Other land utilization 3,400 Ha
Source: FAOSTAT
Land Requirements for the expansion of two most imported commodities: Carrots and Cantaloupes
Local production of carrots and cantaloupes needs to increase to satisfy local demand due to the increasing demand by households and the hotels. Tables 20 and 21 show land requirements for imports substitution of two the most imported commodities in St. Lucia - carrots and cantaloupes. Based on the current volume of imports of carrots in 2014 of 666 MT/ 1,467,864 lbs., on average around 110 acres are needed annually or less than 9 acres per month with an increase in yield up to 13-14,000 lbs./acre from the current 10,000 lbs./acre. Farmers in St. Lucia operate on average under 1 ha (2.47 acres). However, small farmers can be also engaged in this import substitution strategy through participation in farmers‘ cooperatives.
Table 20: Land requirements for import substitution of carrots
Carrots Imports
Acres Required Annually
10,000
11,000 12,000 13,000
14,000
(lbs.)
lbs/acre32
lbs/acre lbs/acre lbs/acre
lbs/acre
146,7 133 122 113 105
1,467,864
Monthly Acres Requirement for 2 crops cycle
12,2 11 10 9.4 8.7
Based on current volume of imports of cantaloupes in 2014 of 154 MT/ 339,512 lbs., land requirement for imports substitution of cantaloupes is on average around only 15 acres
32
Here and after in grey colour current yield of production in St. Lucia is indicated.

Developing Food Value Chains to meet Tourism Demand in the Caribbean: Case Studies of St. Kitts Nevis and St. Lucia 52
Farm & Business: Volume No. 8, No. 1, July 2016…
required annually or 2 acres per month - if there is an increase in yield up to 22-24,000 from the current 14,000 lbs./acre (Table 21). Overall, import substitution of cantaloupes seems to be more feasible as fewer acres are required annually and small farmers can be easily engaged.
Table 21: Land requirements for import substitution of cantaloupes
Cantaloupes
Acres Required Annually
14,000
18,000 20,000
22,000
24,000
Imports (lbs.)
lbs/acre33
lbs/acre lbs/acre lbs/acre
lbs/acre
24.2 19 17 15 14
339,512
Monthly Acres Requirement for 2 crops cycle
2.2 1.57 1.4 1.2 1.1
3.3 LINKS WITH TOURISM SECTOR
This section analyses the demand of the tourism industry for local and imported fresh produce and summarizes the key requirements for local small farmers to access tourism markets. Tourism industry has a vital importance for the economy of St. Lucia. Total stop-over visitor arrivals was estimated at 338,158 guests in 2014, almost doubling the total population of St. Lucia. Clearly, to meet this substantially increased demand, development and further diversification of local agriculture is needed. A survey carried out in June 2015 by the researcher among food buyers34 in St. Lucia (tourism industry and wholesalers) suggests a willingness on the part of hotels and restaurants to purchase local vegetables and fruits due to better taste and longer shelf life of local commodities. The current purchasing scheme implemented by most of the hotels in St. Lucia uses 30% of local fruits and vegetables and 70% imported. Even if local produce has an advantage of freshness and taste, the proportion of local produce purchased by the tourism sector is still very low due to sporadic distribution, seasonality of production and inconsistent quality.
Many hotels have their own groups of farmers and vendors who supply them with local
crops, using private relationships based on gentlemen‘s agreements. All food buyers interviewed indicated that they prefer to buy locally even if the price is higher than imported fruits and vegetables. Therefore, the tourism industry offers particularly good opportunities for farmers who demonstrate the ability to supply the required volume and quality on a regular basis. Demand for vegetables is expanding in volume and variety and the tourist industry is an important source of income for local farmers. Table 22 shows the quantity of local commodities, purchased by major hotels in 2014 and the value generated for local farmers. In particular, local tomatoes are especially in demand. Even if the price of local produce is higher than imported tomatoes, all hotels confirm a willingness to pay more in order to have better taste and freshness.
33
Here and after in grey colour current yield of production in St. Lucia is indicated. 34
8 hotels, 2 restaurants, 1 supermarket, 4 Food Imports Agencies were interviewed.

Developing Food Value Chains to meet Tourism Demand in the Caribbean: Case Studies of St. Kitts Nevis and St. Lucia 53
Farm & Business: Volume No. 8, No. 1, July 2016…
Table 22: Hotel Purchases of Domestic Commodities in 2014
Commodity Quantity (kg) Value (EC$)
Tomatoes 79,323 777,763
Carrots 715 4,128
Spinach 6,686 51,273
Sweet Potatoes 62,590 342,924
Cantaloupe 29,658 184,429
Honeydew 22,823 145,557
String beans 3,475 21,158
Source: National Statistics
However, quality control continues to be one of the main constraints amongst food
purchasers within the tourism industry. Furthermore, many farmers cannot guarantee the constant supply. As a result the majority of hotels have to source the fruits and vegetables required directly from abroad instead of buying locally. Analysis of the top food importers in St. Lucia indicates that 90% of their imports are used to directly supply the demand from tourism (60% hotels and 30% restaurants). The top imported commodities for the tourism industry include potatoes, carrots, tomatoes, lettuce, cabbage, onions, cantaloupe, apples and grapes. In particular, carrots, tomatoes and cantaloupes are in high demand but local farmers are not able to guarantee the supply needed and the required quality throughout the year. Therefore, only an improved and coordinated production and marketing system can decrease the current level of food imports. With adequate domestic production systems, supply and quality, estimated incomes for farmers could amount for more than 53,000 ECD per week and more than 638,000 annually for these three products. Based on estimations presented in Tables 20 and 21, it is possible to conclude that under improved management system with higher yields, on average only 3 acres would be required to meet the demand of Sandals for carrots and cantaloupes. Individual farmers through farmers‘ cooperatives could coordinate production to improve consistency of supply.
Table 23: Sandals Demand of Fresh Selected Commodities
Commodity Demand/lbs. Value (ECD)
Weekly Annually Weekly Annually
Carrots 3,000 36,000 17,310 207,720
Tomatoes 3,000 36,000 29,610 355,520
Cantaloupe 1,000 12,000 6,270 75,240
TOTAL 7,000 84,000 53,190 638,480
Developing Food Value Chains to meet Tourism Demand in the Caribbean: Case Studies of St. Kitts Nevis and St. Lucia 54
Farm & Business: Volume No. 8, No. 1, July 2016…
Greater coordination through farmers‘ cooperatives is one of the ways to deal with supply
consistency, grading, and packaging. Successful examples already exist in St Lucia, which can serve as models for further development of coordination mechanisms. BelleVue Farmers‘ Cooperative in St. Lucia is one of the examples of collaboration between the agricultural sector and the tourism industry. Currently, this cooperative sells to more than 35 hotels and restaurants in St. Lucia at a premium price. It supports this price based on ability to supply higher value produce which are fresher (picked same day), fully organic, and ensuring timely and reliable delivery. Inconsistency of supply in terms of quantity and quality was the major challenge to local farmers. FAO has previously supported St. Lucia in increasing the links between the agricultural sector and the tourism industry for the fruit salad value chain development (papaya, melon and pineapple). The Bellevue Farmers‘ Cooperative project a participant in this analysis was able to increase production of papaya by 50%, melon by 30% and pineapple by 20% and to negotiate favourable prices with the main food buyers and local luxury hotel chains, for example Sandals Resorts. This case study provides an example how local farmers can develop competitive food value chains and therefore increase quality and food safety to a standard which meets the food requirement of the tourism sector. By coordinating the supply through cooperatives and developing appropriate contracts, linkages with buyers and access to markets was strengthened.
3.4 PRODUCTION COST ANALYSIS OF SELECTED COMMODITIES
This section estimates profit margins for farmers based on production costs under current and improved yields. The cost of production under two management systems was calculated by researcher in June 2013 in close collaboration with the extension officers of the Ministry of Agriculture, Food Production, Fisheries, Co-operative and Rural Development in St. Lucia. National data was used to estimate the cost and the associated yields of existing traditional and improved practices. The main parameters are cost of land preparation, labour cost, planting material, fertilizing, irrigation, harvesting and transportation. The main difference between the two production models is based on assumptions of mechanized land preparation, increased use of fertilizers, additional labour, irrigation and transportation.
Table 24 presents the comparison between costs and yields under traditional and
improved production practices for commodities most in demand by the tourism industry: tomatoes, carrots, and cantaloupes. Improved practices reflect additional investment to soil preparation, irrigation and post-harvesting and increase the cost production. Traditional cost of production estimated per acre is lower than the improved cost but as expected this traditional management provides lower yields. According to Table 24 increased yields under improved management system with minimal investment will decrease the cost of production per pound of each selected crop.

Developing Food Value Chains to meet Tourism Demand in the Caribbean: Case Studies of St. Kitts Nevis and St. Lucia 55
Farm & Business: Volume No. 8, No. 1, July 2016…
Table 24: Estimated Cost of Production at Increasing Yields
Commodity Traditional Current
Improved Increased
Traditional Improved
System System System Cost System
yield yield
Cost per Cost per per lbs., Cost per
(lbs/acre) (lbs/acre)
acre, (EC$) acre, (EC$) (EC$) lbs., EC$
B D
A C E (F)
Tomatoes $11,430 11,200 $16,590 18,750 1.02 0.88
Carrots $7,090 10,000 $8,211 14,000 0.71 0.59
Cantaloupe $9,643 14,000 $12,562 24,000 0.69 $0.52
If farmers implement an improved production system for various crops it can guarantee higher yields. They will have higher returns in sales under improved production management and therefore their estimated profit margins increase accordingly (Table 26). Growing tomatoes under an improved production model is an especially profitable activity for small farmers which can enable farmers to increase their incomes by an additional 28,060 ECD per year.
Table 26: Estimated Profit Margin under Different Management Systems
Price - SALES SALES
PROFIT PROFIT DIFEREN
MARGIN MARGIN CE IN
Hotel Traditional Improved
Traditional Improved PROFIT
Commodity Purchases System, System,
System, System, MARGIN,
(EC$/lbs.) (EC$) (EC$)
(EC$) (EC$) (EC$)
G H=B*G I=D*G
J=H-A K=I-C L=K-J
Tomatoes 4.4 49,280 82,500 37,850 65,910 28,060
Carrots 2.6 26,00 36,400 18,910 28,189 9,279
Cantaloupe 2.8 39,200 67,200 29,557 54,638 25,081
3.5 POLICY SUPPORT FOR VALUE CHAINS DEVELOPMENT IN ST. LUCIA
The cost estimation models above show that there is an important market opportunity for farmers to replace a larger percentage of imports and increase their incomes, by using improved production systems. However, public policy intervention is needed to provide technical and financial assistance for small farmers, in order to enable them to improve productivity, which is necessary to decrease imports of certain key vegetables and fruits. This section provides examples of public policy measures which could be implemented in St. Lucia to support small farming in meeting the demand from the tourism industry. These measures addressed mainly the problems of domestic agricultural supply indicated previously: improved input distribution systems, training of farmers to better schedule production, subsidized irrigation equipment, quality certification programs and creation of marketing infrastructure.

Developing Food Value Chains to meet Tourism Demand in the Caribbean: Case Studies of St. Kitts Nevis and St. Lucia 56
Farm & Business: Volume No. 8, No. 1, July 2016…
First, creation of an input distribution system is needed to ensure a constant and reliable
supply of inputs to farmers. Provision of planting material with better characteristics will increase yields and make farmers‘ prices more competitive. To facilitate credit the National Food Production Plan (2015) seeks to provide greater access to credit thorough special arrangements for farmers with banks and other financial institutions for agricultural financing. In addition, the development of a Land Bank in close collaboration with assistance from FAO will lead to support for farmers with land administration issues and will facilitate access to available land in order to expand domestic production.
Second, farmers should be assisted with education training on better scheduling,
improved production practices, post-harvest technologies and use of crop rotation. In close collaboration with extension officers from the Ministry of Agriculture, farmers under these education programs could increase knowledge about improved management systems and develop new technical skills.
Third, further expansion of local produce can be addressed through improved irrigation.
However, the high cost of the initial investment for irrigation equipment (about 4,000 ECD in the case of tomato production) prevents many small farmers from using irrigation. Therefore, subsidized irrigation equipment for small farmers, who grow key commodities under the agricultural diversification program, could help farmers to get higher yields and ensure consistent supply.
Fourth, farmers‘ certification programs should be revitalized by the Ministry of Agriculture
in order to improve production/marketing linkages, better defining market requirements and developing production plans to manage the supply of fresh produce. Moreover, farmers have to be educated on the requirements for packaging, maturity, size and shelf life of each crop in order to meet specifications from the tourism industry.
Finally, the creation of an electronic dissemination platform, which provides real time
information on local supply (varieties, quantity, prices), which food buyers can use to obtain information on local sources of supply is essential to meet the demand from the tourism sector. Better communication between farmers and hotels is needed in order to create sustainable market linkages. There is a need for a facility that can coordinate local production, estimate tourism demand and can be used as reference point to measure the exact quantity of authorized imports for issuing import licenses. By implementing this system, farmers will have tremendous opportunity to establish pre-ordering arrangement and grow local crops, based on the demand from tourism buyers.
4. RECOMMENDENED APPROACH TO THE DEVELOPMENT OF FOOD VALUE CHAINS FOR THE TOURISM SECTOR
The lessons from case studies analysis lead to the design of new approach to the development of food value chains for the tourism sector. Results of this analysis can be applied to other Caribbean countries that have similar agricultural characteristics and depend on the tourism industry.
I. Value Chains – any actors involved in the supply of product should continue their operations in a value chain context.
II. Promote varied support points: government, private sector, cooperatives and small farmers organizations

Developing Food Value Chains to meet Tourism Demand in the Caribbean: Case Studies of St. Kitts Nevis and St. Lucia 57
Farm & Business: Volume No. 8, No. 1, July 2016…
III. Quality is linked to certification to ensure easy and clear communication of
products standards, especially, in terms of size, appearance and maturity.
IV. Targeting of specific market volumes linked to specific buyers in specific time period is one of the highest priority needs.
V. There is no alternative to utilization of irrigation if constant volumes and quality of produce is to lead to increased domestic market share by small and medium size farmers.
VI. Land banks and land utilization schemes, explicitly, linked to ex-banana and sugar lands should also be an integral part of the new approach.
VII. Approach to greater market share for domestic agriculture produce should pay more attention to quality and regularity of supply than to price as price is not cited by hotels and restaurants as major constraint of local purchase.
CONCLUSIONS
The tourism sector is of critical importance for the Caribbean as a primary source of economic activity. However, the tourism industry is one of the major consumers of imported agricultural products due to the incapacity of local agriculture to meet the increasing demand for high quality local produce. Many Caribbean nations continue to import food products to sustain the tourist industry because local farmers cannot provide consistent supply, quality and diversification of local produce as the key issues indicated by the tourism operators in order to increase local purchases. As result, only those countries that are able to develop competitive food value chains and meet the demand of the tourism sector, will have a huge potential market for local production due to the increasing number of visitor arrivals and increasing food demand.
Improvement of the link between agriculture and the tourism industry can provide rural employment, improve food security in the country and reduce foreign exchange leakage. It provides important economic benefits for net food importing countries as well as social inclusion of small farmers into the tourism industry, the major growth sector. The promotion of agriculture tourism linkages in the Caribbean is especially important for the development of a sustainable tourism industry, while at the same time diversifying domestic agriculture.
The case study analysis of two countries: St. Kitts and Nevis and St. Lucia, indicates that
there are several constraints that prevent famers from increasing local production to meet the growing demand from the tourism industry. The main agricultural problems are related to: access to inputs, irrigation, low quality of local commodities and weak marketing infrastructure. As a result even if local produce has an advantage of freshness and taste, the proportion of local purchases by the tourism sector is still very low due to sporadic distribution, seasonal production and inconsistent quality. To overcome these issues better governance is needed. Moreover, one of the main strategies should focus on improving production and coordination among farmers through a centralized marketing system. Together this will help to increase use of local production and decrease current food imports by the tourism industry. Finally, case studies analysis of linkages between agricultural sector and tourism industry highlighted the importance of technical and financial assistance to the respective farmers in order to build an effective distribution system and ensure consistent supply of high quality local crops.

Developing Food Value Chains to meet Tourism Demand in the Caribbean: Case Studies of St. Kitts Nevis and St. Lucia 58
Farm & Business: Volume No. 8, No. 1, July 2016…
REFERENCES:
Beckford, C.L, Campbell, D.R. (2013). Domestic Food Production and Food Security in the
Caribbean: Building Capacity and Strengthening Local Food Production Systems.
Palgrave Macmillan. 9781137296993.
CARICOM (2012). Agribusiness Development Strategy. Presented to the 40th Special Meeting
of the Council for Trade & Economic Development (COTED). Dominica, October 19,
2012
CTA, IICA, CARICOM (2013). Investing in Agrotourism Development in the Caribbean Region
(2013), Agrotourism Seminar, Caribbean Week of Agriculture (CWA).
FAO (2011). Regional Consultation on Policy and Programmatic Actions to Address High Food
Prices in the Caribbean. Summary of Proceedings. Port of Spain, Trinidad and Tobago,
13-14 June
http://www.fao.org/fileadmin/user_upload/ISFP/Caribbean_Regional_Consultation_on_P
olicy_and_Programmatic_Actions_t%E2%80%A6.pdf
FAO (2012). Profile of the Small-Scale Farming in the Caribbean. Workshop on Small-Scale
Farming in the Caribbean. Prepared by B. Graham http://www.fao.org/3/a-au343e.pdf
FAO (2013a). The Food Security through Commercialization of Agriculture Program in the
Caribbean Region. Food and Agriculture Organization of the United Nations, Rome,
Italy.
FAO (2013b). CARICOM Food Import Bill, Food Security and Nutrition. Issue Brief 5,
Subregional Office for the Caribbean, Food and Agriculture Organization of the United
Nations, Bridgetown, Barbados.
FAO (2014a). FAO. 2014. Developing sustainable food value chains – Guiding principles. Rome
http://www.fao.org/3/a-i3953e.pdf
FAO (2014b). The State of Food and Agriculture 2014. Innovation in Family Farming. Rome
http://www.fao.org/3/a-i4040e.pdf
FAO (2014c). TCP/STK/3501. Technical assistance to promote agricultural diversification
towards the reduction of the importation/import bill of selected crops – onions, and cole
crops.
FAO (2014c). TCP/STL/3501. Support to the Development of the Fruits, Vegetables, and Roots
and Tubers Value-chains in St. Lucia by Linking Family/Small Farming to Markets.
FAOSTAT. Online statistical database. Food and Agriculture Organization of the United Nations,
http://faostat.fao.org/site/535/DesktopDefault.aspx?PageID=535#ancor

Developing Food Value Chains to meet Tourism Demand in the Caribbean: Case Studies of St. Kitts Nevis and St. Lucia 59
Farm & Business: Volume No. 8, No. 1, July 2016…
Hepburn, E. (2013). Investigating the Understanding, Interest and Options for Agri-tourism to
Promote Food Security in the Bahamas. Proceedings of the 30th West Indies
Agricultural Economics Conference.
http://www.caestt.com/files/30th%20Proceeding/Final%20Docs/Editorial.pdf
IICA (2014). The Agricultural Act of 2014 (2014 U.S. Farm Bill) and Its Impact on Agriculture in
Latin America and the Caribbean. Technical Note
http://www.iica.int/sites/default/files/document/2015-08/technical_note_02_2014.pdf
Lengefeld, K., Stewart, R. (2004). Tourism-agricultural linkages: boosting inputs from local
farmers. Business Implementation of Pro Poor Tourism: Case Study Briefs 3. PPT Pro-
Poor Tourism.
Timms, B. F. (2006). Caribbean Agriculture-Tourism Linkages in a Neoliberal World: Problems
and Prospects for St. Lucia, International Development Planning Review 28.1: 35-56.
Renard, Y. (2001). Practical Strategies for Pro-Poor Tourism: A Case Study of the St. Lucia
Heritage
Tourism Programme (Pro-Poor Tourism Working Paper No. 7), London, Overseas Development
Institute, International Institute for Environment and Development, and the Centre for
Responsible Tourism.
World Bank (2008). Organization of Eastern Caribbean States: Increasing Linkages of Tourism
with the Agriculture, Manufacturing and Service Sectors, Report No. 44060-LAC.
World Travel and Tourism Council Report (2014). Economic Impact 2014 Caribbean.
http://www.wttc.org//media/files/reports/economic%20impact%20research/regional%20r
eports/cari bbean2014.pdf
World Bank. World Development Indicators, http://data.worldbank.org/indicator

Developing Food Value Chains to meet Tourism Demand in the Caribbean: Case Studies of St. Kitts Nevis and St. Lucia 60
Farm & Business: Volume No. 8, No. 1, July 2016…
Appendix A: COST OF PRODUCTION – Cole Crops (cabbage) in St. Kitts & Nevis Traditional Management System
- yield 3,000 lbs/acre (ECD per acre)
CUMMULATIVE
ITEM DESCRIPTION UNIT COST COST/
COST PER
ACRE
ACRE
Land preparation
Ploughing, Furrowing 150 hour*4 hours 600
600
Planting Material/Planting
Planting Material (seeds) 55/package *3 165
Labour 75/day 75 240
Fertilizing
Bonus 30/bag *2 bags 60
15:15:15 184/bag * 9 bags 1656
1,716
Weed Control
Weedicide -Herbecide 310/acre 310
Gramoxine 75/spraying *2 150
Manual Weeding 350/week 350
810
Pest/Disease Control
Pesticide applications Phoenix 204,Karate 30 234
Fungicides applications 64/application 64
Labour 350/week 350
648
Irrigation
Labour 75/day 150
Water 80 80
230
Harvesting/Transportation/Storage
Packing/bagging 640 640
640
TOTAL ECD 4,884
Source: Ministry of Agriculture and Fisheries of St. Kitts and Nevis, Agricultural Extension Division

Developing Food Value Chains to meet Tourism Demand in the Caribbean: Case Studies of St. Kitts Nevis and St. Lucia 61
Farm & Business: Volume No. 8, No. 1, July 2016…
Appendix B: COST OF PRODUCTION – Cole Crops (cabbage) in St. Kitts & Nevis Improved Management System –
yield 16,000 lbs/acre (ECD per acre)
CUMMULATIVE
ITEM DESCRIPTION UNIT COST COST/ COST PER ACRE
ACRE
Land preparation
Ploughing, Furrowing 150 hour*4 hours 600
600
Planting Material/Planting
Seedling 2000 2000
Labour 75/day 75
2,075
Fertilizing
Bonus 30/bag *2 bags 60
15:15:15 184/bag * 9 bags 1656
1,716
Weed Control
Weedicide -Herbecide 310/acre 310
Gramoxine 75/spraying *2 150
Manual Weeding 350/week 350
810
Pest/Disease Control
Pesticide applications Phoenix 204,Karate 30 234
Fungicides applications 64/application 64
Labour 350/week 350
648
Irrigation
Labour 75/day 150
Water 80 80
Water Transportation 2373 2373 2,603
(irrigation for 3 weeks)
Harvesting/Transportation/Storage
Reaping 1200 1200
Packing/bagging 640 640
Transportation 3632 3632
Subsidized storage 10/1000 lbs. 10
5,482
TOTAL ECD 13,934
Source: Ministry of Agriculture and Fisheries of St. Kitts and Nevis, Agricultural Extension Division

Developing Food Value Chains to meet Tourism Demand in the Caribbean: Case Studies of St. Kitts Nevis and St. Lucia 62
Farm & Business: Volume No. 8, No. 1, July 2016…
Appendix C: COST OF PRODUCTION – ONION in ST. KITTS & NEVIS (Traditional Management System) – yield 10,000
lbs./acre (ECD per acre)
CUMMULATIVE
ITEM DESCRIPTION UNIT COST COST/ COST PER ACRE
ACRE
Land preparation
Ploughing, Furrowing 150 hour*4 hours 600
600
Panting Material/Planting
Planting material 4 tins/170 680
Labour 75/day 75
755
Fertilizing
MPK 186/bag *4 bags 744
Sulphate Am 120/bag *2 bags 240
Bonus 30/bag * 1 bag 30
Labour 350/week 350
1,364
Weed Control
Weedicide -Herbecide 368/acre 368
Labour 350/week *2 750
1,118
Pest/Disease Control
Pesticide applications Diazinon 80
Fungicides applications Acrobat/application 64
Labour 350/week 350 494
Harvesting/Transportation/Storage
Reaping 1200 1200
Transportation 3632 3632
Packing/bagging 400 bags/2 800
5,632
TOTAL ECD 9,963
Source: Ministry of Agriculture and Fisheries of St. Kitts and Nevis, Agricultural Extension Division

Developing Food Value Chains to meet Tourism Demand in the Caribbean: Case Studies of St. Kitts Nevis and St. Lucia 63
Farm & Business: Volume No. 8, No. 1, July 2016…
Appendix D: COST OF PRODUCTION – ONION in ST. KITTS & NEVIS (Improved management system) – yield 20,000 lbs./acre
(ECD per acre)
CUMMULATIVE
ITEM DESCRIPTION UNIT COST COST/ COST PER ACRE
ACRE
Land preparation
Ploughing, Furrowing 150 hour*4 hours 600
600
Panting Material/Planting
Planting material 4 tins/170 680
Labour 75/day 75
755
Fertilizing
MPK 186/bag *4 bags 744
Sulphate Am 120/bag *2 bags 240
Bonus 30/bag * 1 bag 30
Labour 350/week 350
1,364
Weed Control
Weedicide -Herbecide 368/acre 368
Labour 350/week *2 750
1,118
Pest/Disease Control
Pesticide applications Diazinon 80
Fungicides applications Acrobat/application 64
Labour 350/week 350
494
Irrigation
Water 80 80
Water Transportation 1187 1187
1,267
Harvesting/Transportation/Storage
Reaping 1200 1200
Packing/bagging 400 bags/2 800
Transportation 3632 3632
Subsidized storage 10/1000 lbs. 200
5,832
TOTAL ECD 11,430
Source: Ministry of Agriculture and Fisheries of St. Kitts and Nevis, Agricultural Extension Division
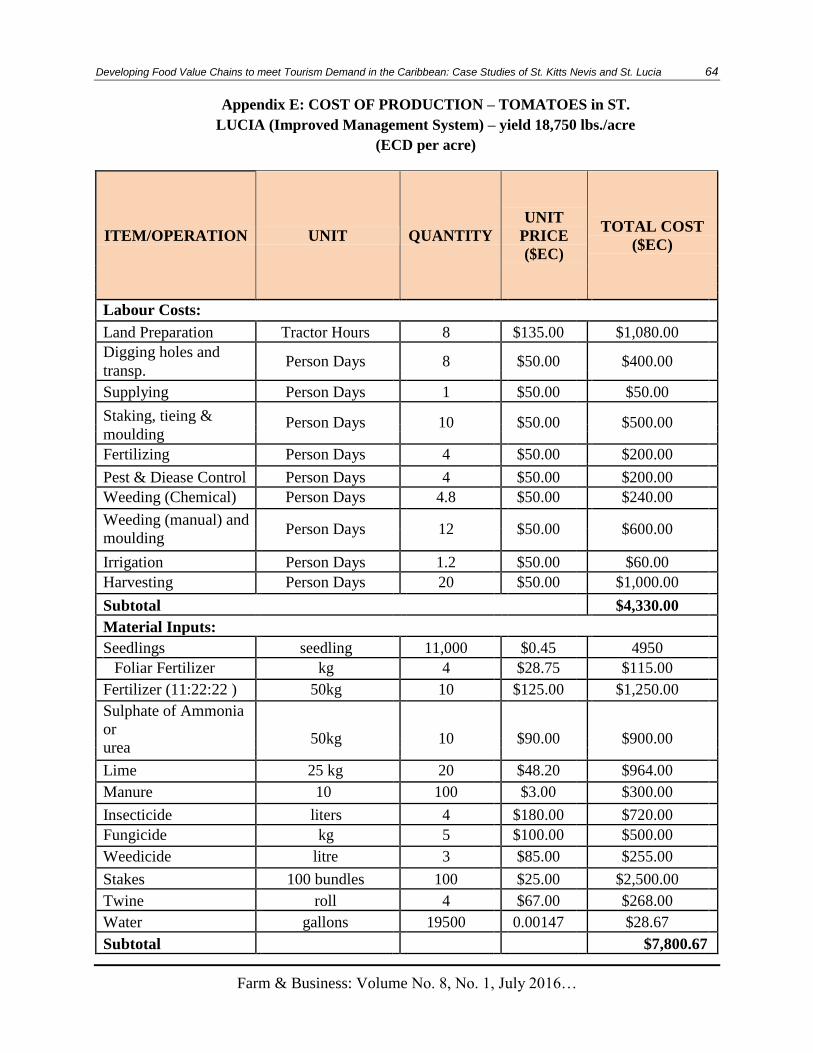
Developing Food Value Chains to meet Tourism Demand in the Caribbean: Case Studies of St. Kitts Nevis and St. Lucia 64
Farm & Business: Volume No. 8, No. 1, July 2016…
Appendix E: COST OF PRODUCTION – TOMATOES in ST.
LUCIA (Improved Management System) – yield 18,750 lbs./acre
(ECD per acre)
ITEM/OPERATION UNIT QUANTITY
UNIT
PRICE
($EC)
TOTAL COST
($EC)
Labour Costs:
Land Preparation Tractor Hours 8 $135.00 $1,080.00
Digging holes and Person Days 8
$50.00
$400.00
transp.
Supplying Person Days 1 $50.00 $50.00
Staking, tieing & Person Days 10 $50.00
$500.00
moulding
Fertilizing Person Days 4 $50.00 $200.00
Pest & Diease Control Person Days 4 $50.00 $200.00
Weeding (Chemical) Person Days 4.8 $50.00 $240.00
Weeding (manual) and Person Days 12
$50.00
$600.00
moulding
Irrigation Person Days 1.2 $50.00 $60.00
Harvesting Person Days 20 $50.00 $1,000.00
Subtotal $4,330.00
Material Inputs:
Seedlings seedling 11,000 $0.45 4950
Foliar Fertilizer kg 4 $28.75 $115.00
Fertilizer (11:22:22 ) 50kg 10 $125.00 $1,250.00
Sulphate of Ammonia
or 50kg 10
$90.00
$900.00
urea
Lime 25 kg 20 $48.20 $964.00
Manure 10 100 $3.00 $300.00
Insecticide liters 4 $180.00 $720.00
Fungicide kg 5 $100.00 $500.00
Weedicide litre 3 $85.00 $255.00
Stakes 100 bundles 100 $25.00 $2,500.00
Twine roll 4 $67.00 $268.00
Water gallons 19500 0.00147 $28.67
Subtotal $7,800.67

Developing Food Value Chains to meet Tourism Demand in the Caribbean: Case Studies of St. Kitts Nevis and St. Lucia 65
Farm & Business: Volume No. 8, No. 1, July 2016…
ITEM/OPERATION UNIT QUANTITY
UNIT
PRICE
($EC)
TOTAL COST
($EC)
Other Costs
Contingencies 10% of Labour & Material $1,213.07
Tools 5% of Material $390.03
Supervision 15% of Labour & Material $1,819.60
Transport of inputs lbs 1 100 $100.00
Transport to market lbs 18750 0.05 $937.50
Subtotal $4,460.20
Grand Total ECD 16,590.86
Source: Ministry of Agriculture, Food Production, Fisheries, Cooperatives & Rural Development of St. Lucia,
Extension Division

Developing Food Value Chains to meet Tourism Demand in the Caribbean: Case Studies of St. Kitts Nevis and St. Lucia 66
Farm & Business: Volume No. 8, No. 1, July 2016…
Appendix F: COST OF PRODUCTION – TOMATOES in ST. LUCIA (Traditional Management System) – yield 11,200 lbs./acre
(ECD per acre)
UNIT TOTAL COST
ITEM/OPERATION
UNIT
QUANTITY
PRICE
($EC)
($EC)
Labour Costs:
Land Preparation Person Days 15 $50.00 $750.00
Digging holes and transp. Person Days 8 $50.00 $400.00
Supplying Person Days 1 $50.00 $50.00
Staking, tieing & moulding Person Days 10 $50.00 $500.00
Fertilizing Person Days 4 $50.00 $200.00
Pest & Diease Control Person Days 4 $50.00 $200.00
Weeding (Chemical) Person Days 4.8 $50.00 $240.00
Weeding (manual) and Person Days 12
$50.00
$600.00
moulding
Harvesting Person Days 20 $50.00 $1,000.00
Subtotal $3,940.00
Material Inputs:
Seedlings seedling 11,000 $0.45 4950
Foliar Fertilizer kg 4 $28.75 $115.00
Fertilizer (11:22:22 ) 50kg 10 $125.00 $1,250.00
Sulphate of Ammonia or 50kg 10
$90.00
$900.00
urea
Lime 25 kg 20 $48.20 $964.00
Manure 10 100 $3.00 $300.00
Insecticide liters 4 $180.00 $720.00
Fungicide kg 5 $100.00 $500.00
Weedicide litre 3 $85.00 $255.00
Subtotal $5,004.00
Other Costs
Contingencies 10% of Labour & Material $894.40
Tools 5% of Material $250.20
Supervision 15% of Labour & Material $1,341.60
Subtotal $2,486.20
Grand Total ECD 11,430.20
Source: Ministry of Agriculture, Food Production, Fisheries, Cooperatives & Rural Development of St. Lucia, Extension Division

Developing Food Value Chains to meet Tourism Demand in the Caribbean: Case Studies of St. Kitts Nevis and St. Lucia 67
Farm & Business: Volume No. 8, No. 1, July 2016…
Appendix G: COST OF PRODUCTION – CARROTS in ST. LUCIA (Improved management system) – yield 14,000 lbs./acre (ECD per
acre)
ITEMS
Unit
No. of Units
Cost/unit
Total Cost
($)
($)
Labour Costs:
Soil Preparation Tractor hours 8 $135.00 $1,080.00
Sowing Manday 2 $50.00 $100.00
Fertilizing Person Days 3 $50.00 $150.00
Pesticide application Person Days 6 $50.00 $300.00
Harvesting Person Days 13 $50.00 $650.00
Sub-total $1,630.00
Material Inputs:
Seed kg 15.0 $140.00 $2,100.00
Foliar Fertilizers bag 1.0 $120.00 $120.00
Biostimulants liters 4.0 $100.00 $400.00
NPK - 12:12:17 50 kg 3 $150.00 $450.00
Fungicide liters 1.5 $220.00 $330.00
Insecticide 250ml 3 $45.00 $405.00
Water/irrigation Pump hours 45 $5.00 $675.00
Sub-total $4,480.00
Other Costs:
Contingencies 10% of Labour & Material $611.00
Tools 5% of Material $224.00
Supervision 15% of Labour & Material $916.50
Transport of inputs Trip 1 100 $100.00
Transport to farmgate Lbs 12500 $0.02 $250.00
Sub-total $2,101.50
Total ECD 8,211.50
Source: Ministry of Agriculture, Food Production, Fisheries, Cooperatives & Rural Development of St. Lucia, Extension Division

Developing Food Value Chains to meet Tourism Demand in the Caribbean: Case Studies of St. Kitts Nevis and St. Lucia 68
Farm & Business: Volume No. 8, No. 1, July 2016…
Appendix H: COST OF PRODUCTION – CARROTS in ST. LUCIA (Traditional management system) – yield 10,000 lbs./acre (ECD per
acre)
ITEMS
Unit
No. of Units
Cost/unit Total Cost
($)
($)
Labour Costs:
Soil Preparation Person Days 25 $50.00 $1,250.00
Sowing Manday 2 $50.00 $100.00
Fertilizing Person Days 3 $50.00 $150.00
Pesticide application Person Days 6 $50.00 $300.00
Harvesting Person Days 13 $50.00 $650.00
Sub-total $2,450.00
Material Inputs:
Seed kg 15.0 $140.00 $2,100.00
Foliar Fertilizers bag 1.0 $120.00 $120.00
Biostimulants liters 4.0 $100.00 $400.00
NPK - 12:12:17 50 kg 3 $150.00 $450.00
Fungicide liters 1.5 $220.00 $330.00
Insecticide 250ml 3 $45.00 $405.00
Sub-total $3,805.00
Other Costs:
Contingencies 10% of Labour & Material $611.00
Tools 5% of Material $224.00
Sub-total $835.00
Total ECD 7,090.00
Source: Ministry of Agriculture, Food Production, Fisheries, Cooperatives & Rural Development of St. Lucia, Extension Division

Developing Food Value Chains to meet Tourism Demand in the Caribbean: Case Studies of St. Kitts Nevis and St. Lucia 69
Farm & Business: Volume No. 8, No. 1, July 2016…
Appendix I: COST OF PRODUCTION – CANTALOUPE in ST. LUCIA (Improved Management System) – yield 24,000 lbs./acre (ECD
per acre)
ITEMS
Unit
No. of Units
Cost/unit Total Cost
($)
($)
Labour Costs:
Soil Preparation Tractor hours 8 $135.00 $1,080.00
Planting Manday 3 $50.00 $150.00
Fertilizing Person Days 3 $50.00 $150.00
Pesticide application Person Days 12 $50.00 $600.00
Harvesting Person Days 10 $50.00 $500.00
Sub-total $1,980.00
Material Inputs:
Seedlings seedling 4800.0 $0.35 $1,680.00
Foliar Fertilizers bag 1.0 $120.00 $120.00
Biostimulants liters 4.0 $100.00 $400.00
NPK - 12:12:17 50 kg 3 $115.00 $345.00
Bio Neem litre 1 $200.00 $200.00
Plastic Mulch Roll 5 $500.00 $2,500.00
Trigard 50g 1 $87.25 $87.25
New Mectin 250 ml 2 $160.00 $320.00
Banrot kilogram 0.5 $325.00 $162.50
Phyton 27 250ml 6 $45.00 $810.00
Water/irrigation Pump hours 50 $5.00 $750.00
Sub-total $7,374.75
Other Costs:
Contingencies 10% of Labour & Material $935.48
Tools 5% of Material $368.74
Supervision 15% of Labour & Material $1,403.21
Transport of inputs Trip 1 100 $100.00
Transport to farmgate Lbs 20000 $0.02 $400.00
Sub-total $3,207.43
Total ECD 12,562.18
Source: Ministry of Agriculture, Food Production, Fisheries, Cooperatives & Rural Development of St. Lucia, Extension Division

Developing Food Value Chains to meet Tourism Demand in the Caribbean: Case Studies of St. Kitts Nevis and St. Lucia 70
Farm & Business: Volume No. 8, No. 1, July 2016…
Appendix J: COST OF PRODUCTION – CANTALOUPE in ST. LUCIA (Traditional Management System) – yield 14,000 lbs./acre
(ECD per acre)
ITEMS
Unit
No. of Units
Cost/unit Total Cost
($)
($)
Labour Costs:
Soil Preparation Person Days 25 $50.00 $1,250.00
Planting Manday 3 $50.00 $150.00
Fertilizing Person Days 3 $50.00 $150.00
Pesticide application Person Days 12 $50.00 $600.00
Harvesting Person Days 10 $50.00 $500.00
Sub-total $2,650.00
Material Inputs:
Seedlings seedling 4800.0 $0.35 $1,680.00
Foliar Fertilizers bag 1.0 $120.00 $120.00
Biostimulants liters 4.0 $100.00 $400.00
NPK - 12:12:17 50 kg 3 $115.00 $345.00
Bio Neem litre 1 $200.00 $200.00
Plastic Mulch Roll 5 $500.00 $2,500.00
Trigard 50g 1 $87.25 $87.25
New Mectin 250 ml 2 $160.00 $320.00
Banrot kilogram 0.5 $325.00 $162.50
Phyton 27 250ml 6 $45.00 $810.00
Sub-total $6,624.75
Other Costs:
Tools 5% of Material $368.74
Sub-total $368.74
Total ECD 9,643.49
Source: Ministry of Agriculture, Food Production, Fisheries, Cooperatives & Rural Development of St. Lucia, Extension Division