farm labor in the united states
TRANSCRIPT

R E P O R T R ESUMESED 015 041FARM LABOR IN THE UNITED STATES.BY BISHOP, CHARLES E.
EDRS PRICE MF$0.75 HC $5.96 147P.
RC 001 863
PUB DATE 67
DESCRIPTORS AGRICULTURAL LABORERS, *AGRICULTURAL TRENDS;AGRICULTURE, ECONOMIC DEVELOPMENT, *FARMERS, *FARM LABORPROBLEMS, FARM LABOR SUPPLY, FARM LABOR LEGISLATION, FARMMECHANICS (OCCUPATION), *FARM OCCUPATIONS: LABORERS, LABORMARKET, *MANPOWER DEVELOPMENT, MANPOWER UTILIZATION, OFF FARMAGRICULTURAL OCCUPATIONS, AGRICULTURAL POLICY INSTog MICHIGANSTATE UNIV., NORTH CAROLINA STATE UNIV.,
SEVEN ESSAYS EXAMINE THE REASONS AND PRESENT TABLEAUS OFDATA RELATIVE TO THE LOW PRODUCTIVITY OF SMALL FARMS COMPAREDWITH LARGE FARMS, THE LOW FINANCIAL RETURNS OF FARM LABOR,AND THE MASS EXODUS OF FARM MANPOWER. THE CHARACTERISTICS,TRENDS, AND SOCIOECONOMIC SITUATION OF HIRED FARM LABORDURING THE PERIOD 1947 -1964 ARE PRESENTED. THE CHANGINGTECHNOLOGY AND ITS RESULTANT FARM LABOR ADJUSTMENTS TO SEEKNON FARM EMPLOYMENT AND MULTIPLE JOB HOLDING, WHICH LEAD TOOCCUPATIONAL MOBILITY ARE DISCUSSED. SUGGESTIONS ARE MADE FORRELATING FARM MANPOWER POLICY TO THE NATIONAL MANPOWER POLICYAND THE NATIONAL ECONOMIC GOALS. THIS DOCUMENT AVAILABLE FOR$6.00 FROM COLUMBIA UNIVERSITY PRESS, NEW YORK CITY, NEWYORK. (JH)


U.S. DEPARTMENT OF HEALTH, EDUCATION & WELFARE
OFFICE OF EDUCATION
THIS DOCUMENT HAS BEEN REPRODUCED EXACTLY AS RECEIVED FROM THE
PERSON OR ORGANIZATION ORIGINATING IT. POINTS OF VIEW OR OPINIONS
STATED DO NOT NECESSARILY REPRESENT OFFICIAL OFFICE OF EDUCATION
POSITION OR POLICY.
Farm Labor
in the United States
EDITED BY C. E. BISHOP
COLUMBIA UNIVERSITY PRESS
New York and London 1967

Charles Edwin Bishop is Head of the Department of Economics andExecutive Director of the Agricultural Policy Institute at NorthCarolina State University. Mr. Bishop is coauthor of Introduction toAgricultural Economic Analysis.The research reported herein was financed through the programsof the Office of Manpower Policy, Evaluation, and Research, UnitedStates Department of Labor.
"PERMISSION TO REPRODUCE THIS
COPYRI HTED MATERIAL HAS BEEN GRANTED
BY CzZe/-,-,7Or-)`-7
TO ERIC AND ORGANIZATIONS OPERATING
UNDER AGREEMENTS WITH THE U.S. OFFICE OFEDUCATION. FURTHER REPRODUCTION OUTSIDE
THE ERIC SYSTEM REQUIRES PERMISSION OF
THE COPYRIGHT OWNER."
Copyright © 1967 Columbia University PressReproduction in whole or in part permitted for any purpose of theUnited States Government. No copyright is claimed for Chapter 2, "TheCurrent Situation of the Hired Farm Labor Force," by Gladys K. Bowles.Library of Congress Catalog Card Number: 66-28037Printed in the United States of America

Preface
Technological progress in American agriculture has resulted in great-ly increased productivity of farm labor and in a sharp reduction in thenumber of farm workers. These effects, however, have not been uni-formly distributed among regions and types of farms. Consequently,two of the current major concerns with respect to farm labor are theimprovement of the persistently low return for labor services in farm-ing and maintenance of an adequate supply of farm labor to carry outfarm operations, particularly in types of farming which have not beenmechanized. These objectives might be achieved relatively easily bysubstantially increasing the farm wage rate except for the fact that formany years the United States has been pursuing a low-cost food pol-icy and that it has an agriculture consisting predominantly of family-operated farms. On many of these farms the return received by theoperator and his family for labor services is less than that received byhired farm workers.
The low returns for farm manpower in the United States are due inpart from the fact that this nation has never developed an explicitmanpower policy for agriculture. Instead, farm manpower has beenexempted from much of the major labor legislation. Primary empha-sis in agricultural policies and programs has been placed on productmarkets and product market conditions. In the factor markets,land use and conservation policies have been developed and farmershave been provided with subsidies to encourage them to make speci-fied uses of land. Special credit programs have been developed toencourage farmers to make particular types of investments. Voca-tional education and training have been provided for practically all

Vi PREFACE
farm youth desiring such programs, but these education and trainingprograms have been highly oriented toward farming and farm-relatedoccupations with little reference to nonfarm employment opportuni-ties and to manpower policy.
In view of the rapid changes occurring in the structure of agricul-ture and of the importance of occupational and geographic mobilityto a solution to the low-income problems in rural America, there is aneed to relate manpower policy for agriculture more explicitly to na-tional manpower policy and to general economic goals. To this endthe Office of Manpower Policy, Evaluation and Research sponsored aconference on farm manpower in Washington, D. C., October 28 to29, 1965. The papers contained in this monograph provided thebackground for discussion of farm manpower problems and policiesat the conference.
Raleigh, North Carolina
July, 1966
C. E. BISHOP

Contents
Chapter 1 Dimensions of the Farm Labor Problem 1
C. E. BISHOP
2 The Current Situation of the Hired Farm LaborForceGLADYS K. BOWLES
19
3 Farm Labor Adjustments to Changing Technology 41G. S. TOLLEY and B. M. FARMER
4 National Employment, Skills, and Earnings of FarmLaborTHEODORE W. SCHULTZ
53
5 Occupational Mobility from the Farm Labor Force 71DALE E. HATHAWAY
6 Farm Manpower Policy 97VARDEN FULLER
7 Manpower Development Programs for Farm People 115CURTIS C. ALLER
Index 137

- _ . . . . :
Farm Labor in the United States
rsa

[1]
Dimensions of theFarm Labor ProblemC. E. BISHOP
Unquestionably, the most significant aspect of the farm labor prob-lem is the persistently low return for labor services in farming. Al-though there is substantial variation among states and regions of theUnited States, the return for labor services in farming is lower thanthe return in nonfarm employment in all major regions.'
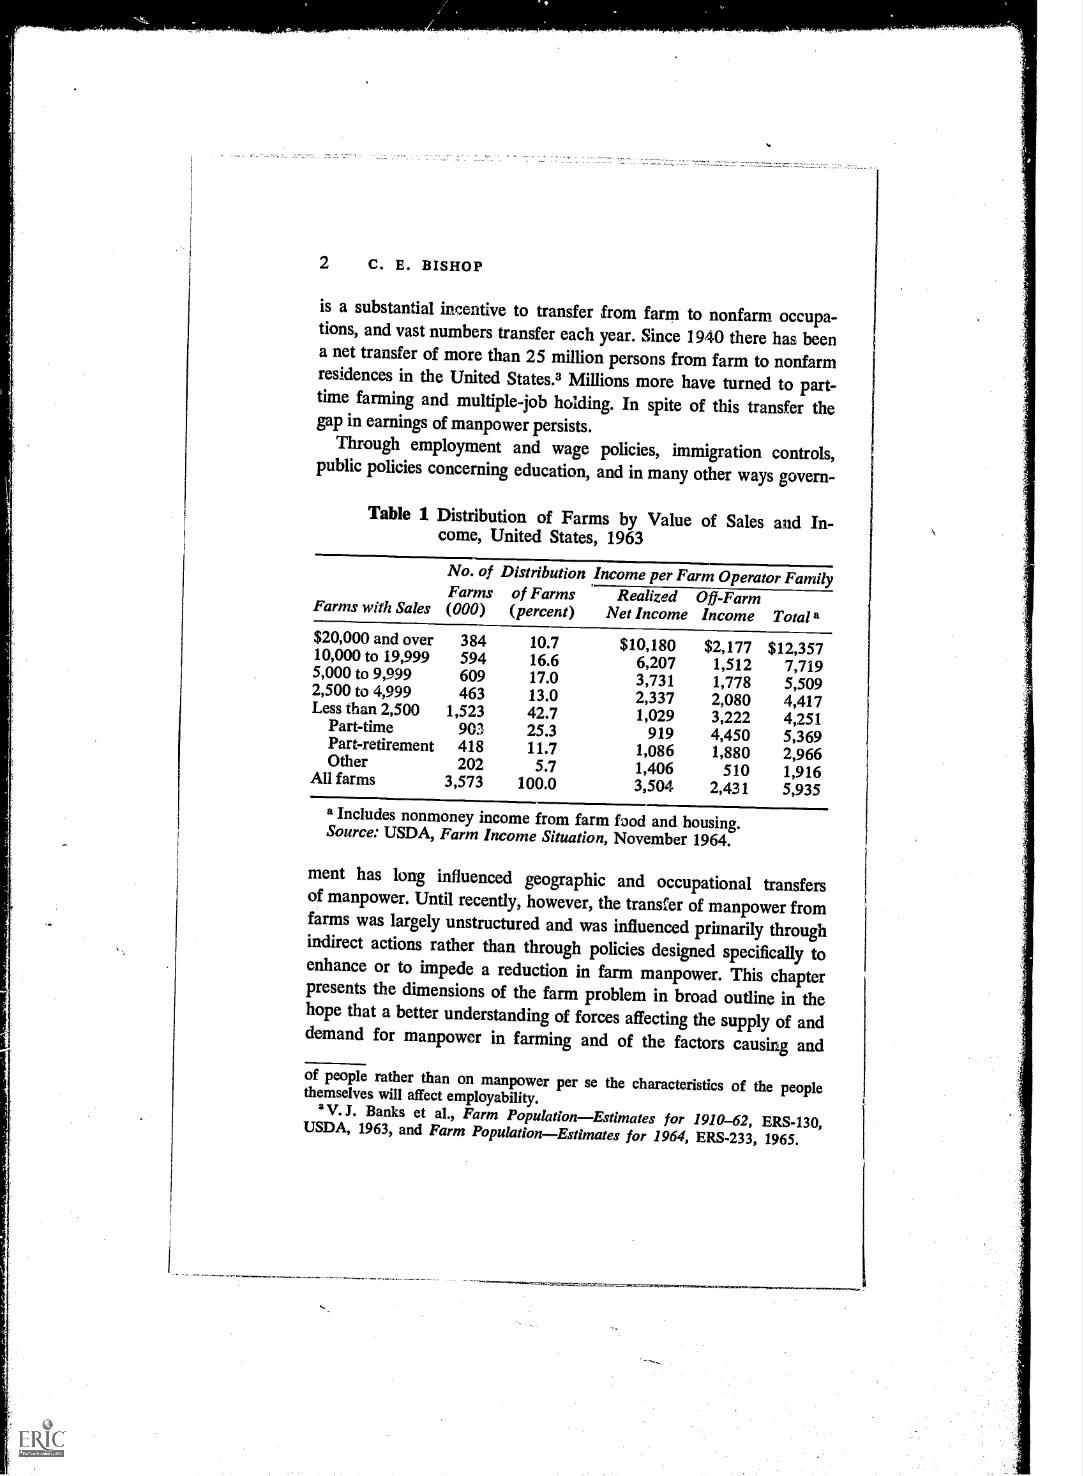
It should not be inferred from these findings, however, that allfarm families have low incomes or that the return is low for all farmlabor. In 1963 more than 27 percent of the three and one-half millionfarms in the United States sold more than $10,000 of farm products(Table 1). The average net income of these farm operator families,including income from off-farm sources, was greater than the averagefor all families in the United States. Nevertheless, recent studieswhich attempt to adjust the farm and nonfarm labor returns fordifferences such as those in age, sex, education, and skill componentssuggest that even after standardization of these factors the return forlabor services in agriculture remains 30 to 40 percent less than thereturn for comparable labor in nonfarm occupations? In short, thereC. E. BISHOP is Executive Director of the Agricultural Policy Institute,North Carolina State University, Raleigh, N. C.
2D. Gale Johnson, "Functioning of the Labor Market," Journal of FarmEconomics, Vol. XXXIII, February 1951, pp. 75-86. C. E. Bishop, "Under-employment of Labor in Southeastern Agriculture," Journal of Farm Eco-nomics, Vol. XXXVI, May 1954, pp. 258-72.
'D. Gale Johnson, "Labor Mobility and Agricultural Adjustment," Agri-cultural Adjustment Problems in a Growing Economy, Iowa State Uni-versity Press, 1958, pp. 163-72. D. E. Hathaway, Government and Agriculture,Macmillan, 1963, p. 35. It should be recognized that manpower is delivered inthe form of people and that since wages are based predominantly on the inputs
2 C. E. BISHOP
is a substantial incentive to transfer from farm to nonfarm occupa-tions, and vast numbers transfer each year. Since 1940 there has beena net transfer of more than 25 million persons from farm to nonfarmresidences in the United States.3 Millions more have turned to part-time farming and multiple-job holding. In spite of this transfer thegap in earnings of manpower persists.
Through employment and wage policies, immigration controls,public policies concerning education, and in many other ways govern-
Table 1 Distribution of Farms by Value of Sales and In-come, United States, 1963
No. of Distribution Income per Farm Operator Family
Farms with SalesFarms(000)
of Farms(percent)
Realized Off-FarmNet Income Income Total a
$20,000 and over 384 10.7 $10,180 $2,177 $12,35710,000 to 19,999 594 16.6 6,207 1,512 7,7195,000 to 9,999 609 17.0 3,731 1,778 5,5092,500 to 4,999 463 13.0 2,337 2,080 4,417Less than 2,500 1,523 42.7 1,029 3,222 4,251Part-time 903 25.3 919 4,450 5,369Part-retirement 418 11.7 1,086 1,880 2,966Other 202 5.7 1,406 510 1,916All farms 3,573 100.0 3,504 2,431 5,935
a Includes nonmoney income from farm food and housing.Source: USDA, Farm Income Situation, November 1964.
ment has long influenced geographic and occupational transfersof manpower. Until recently, however, the transfer of manpower fromfarms was largely unstructured and was influenced primarily throughindirect actions rather than through policies designed specifically toenhance or to impede a reduction in farm manpower. This chapterpresents the dimensions of the farm problem in broad outline in thehope that a better understanding of forces affecting the supply of anddemand for manpower in farming and of the factors causing and
of people rather than on manpower per se the characteristics of the peoplethemselves will affect employability.V. J. Banks et al., Farm Population-Estimates for 1910-62, ERS-130,USDA, 1963, and Farm Population-Estimates for 1964, ERS-233, 1965.

DIMENSIONS OF FARM LABOR PROBLEM 3
perpetuating disequilibria in the returns for labor services may pro-vide the basis for the development of effective farm manpower policy.
FARM MANPOWER NEEDSAND TECHNOLOGICAL CHANGE
Farm manpower needs ,,re determined by the market conditions forfarm products and the relative productivities of manpower and otherresources in producing farm products. At the high per capita incomesprevailing in the United States there is little inclination to purchaseadditional food when income increases or when the prices of foodsdecline. Moreover, the demand elasticities are relatively low in West-ern Europe and in other major commercial markets for United Statesfarm products. The rate of growth in the demand for United Statesfarm products in major commercial markets, therefore, is determinedlargely by increases in population, and the demand is increasingslowly,
Since the mid 1930s technological innovations in United Statesagriculture have been occurring at a very rapid pace, and the mostimportant determinant of manpower needs in farming has beenchanges in the technology used in producing farm commodities. Twoaspects of technological improvements that are particularly relevantto manpower needs in farming are the resource substitution effectsand the firm size effects generated by technological improvement.
For the most part, technological innovations in agriculture havenot been neutral in their effects on the demand for resources. Rather,most innovations have altered relative resource productivities in sucha way as to provide incentives to change the resource mix employed.Early innovations in agriculture were largely of a biological, chemi-cal, or mechanical nature.4 Typically, these improvements in technol-ogy increased the productivity of capital and altered the technicalrates of substitution of capital for manpower, reducing the amount ofcapital which was necessary to replace a unit of manpower at particu-lar levels of output. Many of these innovations also altered the rates
4 E. O. Heady, "Basic Economic and Welfare Aspects of Farm TechnologicalAdvance," Journal of Farm Economics, Vol. XXXI, May 1949, pp. 293-316.

4 C. E. BISHOP
of substitution of manpower and land, making it possible to reducethe amount of manpower in relation to land needed to produce speci-fied levels of output. Technological innovations, therefore, have pro-vided strong incentives to increase the use of capital and to decreasethe use of manpower and to a lesser extent the use of land in the pro-duction of farm commodities.5
There is a second major effect of changes in farm production tech-nology. Typically, technological innovations decrease the cost ofproducing additional output, thereby increasing the most profitablelevel of output for the firm. Since most innovations provide incentivesto expand output at the firm level, the size effects are in the directionof increased use of manpower.
Technological improvements affect size and manpower use in yetanother way. The increases in investment and in the size of operationwhich are accompanied by technological improvements generally leadto a greater degree of production specialization and to changes in theorganizational structure of agricultural industries. These organiza-tional improvements may occur within the firm as a result of resourcerecombination and greater specialization or they may occur throughvertical or horizontal integration among firms. In either case organi-zational improvements tend to decrease the amount of manpowerused for specified levels of output. In effect, therefore, organizationalchanges also lead to a substitution of other resources for manpower.
In summary, the technological changes which have been takingplace in agriculture have provided incentives to substitute capital formanpower and to increase the size of farm firms. At the firm level,the substitution effects tend to decrease the demand for manpowerwhereas the size effects tend to increase the demand for manpower.Because of the slow rate of growth in farm product demand, however,prices fall rapidly as aggregate output expands. Under these condi-tions the only way for the size effects to be fully realized at the firmlevel is through a reduction in the number of firms. In the aggregate,therefore, the substitution effects between capital and manpower ex-ceed the size effects, with a consequent sharp reduction in the em-
5 Recent innovations also have made it possible to reduce the amount ofcapital needed for given levels of output. Even so, these innovations haveprovided further incentives to substitute capital for manpower in the pro-duction of farm commodities.

DIMENSIONS OF FARM LABOR PROBLEM 5
ployment of manpower in farming. Thus farm people have beenforced to choose between (1) massive transfers of manpower to non-farm occupations in an effort to increase the return for the manpowerremaining in farming or (2) occupational immobility, large-scale un-deremployment, and sharply reduced returns for manpower in farm-ing,
Since the late 1930s, the processes of adjustment outlined abovehave been taking place very rapidly in United States agriculture. Evenso, the adjustments have not been completed, or are they likely to becompleted in the near future. They are not once-and-over changes. Aseconomic development occurs, capital is accumulated, and it becomesrelatively low priced in comparison to manpower. Under these condi-tions research tends to be oriented in the direction of creating newtechnology which increases the rate of substitution of capital formanpower.° The decrease in the demand for manpower in farming,therefore, is a normal complement of economic growth and should beexpected to continue.
A MASSIVE EXODUSOF MANPOWER FROM FARMING
Since 1920 there has been a massive exodus of manpower from farmsin the United States? Gross migration probably was two to threetimes as large as net migration during this period. However, theeffects have not been uniformly distributed among regions, and, inspite of this vast migration, the return for labor in farming remainscomparatively low.
By 1950 the adjustments which had been effected in the agricultureof the Corn Belt and of the West were large enough to have achievedroughly a parity of returns for farm and nonfarm labor services inthose regions. In the meantime, the South and New England laggedbehind. During the decade of the 1950s, however, technological im-provements occurred rapidly in farming, and the returns for farmmanpower in the Corn Belt and in the West degenerated relative to
J. R. Hicks, The Theory of Wages, The Macmillan Company, 1932, Chap-ter 6.
7 V. J. Banks et al., Farm Population.

6 C. E. BISHOP
the returns for comparable manpower in nonfarm employment inthose regions. By 1960 in all major regions the returns for farmmanpower were substantially less than the returns for comparablemanpower in nonfarm employment.
As a result of rapid and extensive technological innovations inAmerican agriculture during the 1950s, the labor market was unableto effect sufficient manpower transfers to prevent a deterioration inthe relative return for farm manpower. If the factor markets func-tioned perfectly, agricultural innovation would be accompanied by atransfer of manpower from farm to nonfarm employment until wagedifferences were eliminated except for costs of transfer, costs ofacquisition of skills, and differences represented in heterogeneity ofmanpower resources, or in employment and living conditions. In spiteof the mass transfer of manpower from agriculture, the gap in earn-ings of labor in farm and nonfarm employment has not been closed.Furthermore, the supply of farm manpower is so large relative to thedemand that since 1950 earnings of farm manpower have increasedat a slower rate than increases in labor productivity.8
IMPEDIMENTS TO MOBILITY
The reasons for the failure of the labor market to transfer sufficientquantities of manpower from farms to bring about equality of returnsfor resources should be found in the conditions of supply of man-power to nonfarm employment or the conditions of demand for thismanpower. Numerous factors could conceivably reduce the elasticityof supply of manpower from farms to nonfarm employment.
The United States economy has been characterized by a strong ele-ment of agricultural fundamentalism, which has been an importantinfluence in the development of public policies and programs affectingagriculture. It manifests itself in the many special considerationsgiven to agriculture and to particular segments of agriculture. Someof these considerations impede mobility and structural change.9
° L. B. Jones and J. W. Christian, "Some Observations on the AgriculturalLabor Market," Industrial and Labor Relations Review, Vol. 18, No. 4, July1965, pp. 522-34.
W. D. Diehl, Farm-Nonfarm Migration in the Southeast: A Costs ReturnsAnalysis, Ph.D. dissertation, North Carolina State University, Raleigh, N.C.,1964, p. 30.

DIMENSIONS OF FARM LABOR PROBLEM 7
Farming, moreover, has traditionally been viewed as a "superior"occupation by farm families. They have encouraged their sons anddaughters to become farmers. For example, a recent study on the life-time occupational mobility of males shows that 82 percent of thefarmers and farm managers in the United States in 1962 had fatherswho were farmers and farm managers whereas 60 percent of the farmlaborers and foremen had fathers in that occupational group." Eventhough there is a high prot bility that the fathers of persons engagedin farm employment in the United States were also engaged in farmemployment, the occupational inheritance of farmers and farm man-agers is only moderately high (Table 2). One in six of the sons offarmers and farm managers are currently in the same occupations astheir fathers; the remainder are scattered over various occupationalgroups. The sons of farm laborers and foremen are less likely to re-main in agriculture than are the sons of farmers and farm managers.Even so, occupational inheritance is excessive in farming, and moresons remain on farms than can expect to make a reasonable livingfrom farming.
Farm youth also are handicapped by the limited opportunitieswhich have been provided them for nonagricultural vocational train-ing. A very high percentage of the male farm youth in secondaryschools are enrolled in courses in vocational agriculture." In 1960there were approximately 600 thousand rural farm males of highschool age, and fewer than 90 percent of them were enrolled in highschool. In the same year there were 464 thousand males enrolled invocational agriculture. Since some youth who enroll in vocationalagriculture courses obviously drop out of school, the number offarm youth with some training in vocational agriculture in 1960who were of high school age at that time obviously exceeded464 thousand. Clearly, a very high percentage of the rural farm malesattending high school receive some training in vocational agriculture.
A rather high percentage of those receiving training in vocationalagriculture have entered farming as a career. A compilation of the re-sults of studies analyzing the occupations of former vocational agri-
" Current Population Report, Lifetime Occupational Mobility of Adult Males,March 1962, Series P-23, No. 11, May 1964.
11C. E. Bishop and G. S. Tolley, "Migration in Farming and Related Oc-cupations," Education for a Changing World of Work, Appendix II, 0E-80025,U. S. Department of Health, Education, and Welfare, 1963.

Tab
le 2
Cur
rent
Occ
upat
ion
by F
athe
r'sO
ccup
atio
n-N
onin
stitu
tiona
l Mal
e Po
pula
tion
25-6
5 Y
ears
Old
for
the
Uni
ted
Stat
es: M
arch
196
2
Fath
er's
Occ
upat
ion
(Per
cent
Dis
trib
utio
n)
Tot
alPo
pu-
la-
tion
25-6
4Y
ears
Old
Cur
rent
Occ
upat
ion
Prof
es-
sion
al,
Tec
h.,
and
Kin
dred
Wor
kers
Man
ager
s,O
ffic
ials
,an
dPr
opri
etor
s,E
xcep
tFa
rm
Sale
sW
ork-
ers
Cle
ri-
cal
and
Kin
dred
Wor
kers
Cra
fts-
men
,Fo
rem
en,
and
Kin
dred
Wor
kers
Ope
ra-
tives
and
Kin
dred
Wor
kers
Serv
ice
Wor
kers
,in
cl.
Priv
ate
Hou
se-
hold
Lab
or-
ers
Exc
ept
Farm
and
Min
e
Farm
-er
san
dFa
rmM
an-
ager
s
Farm
Lab
or-
ers
and
Fore
-m
enT
otal
100.
012
.516
.15.
06.
620
.718
.95.
96.
95.
61.
8Pr
ofes
sion
al, t
ech.
, and
kind
red
wor
kers
100.
041
.017
.59.
06.
98.
710
.33.
12.
01.
80.
4M
anag
ers,
off
icia
ls, a
ndpr
opri
etor
s, e
xc. f
arm
100.
021
.634
.19.
17.
113
.88.
52.
51.
91.
00.
3Sa
les
wor
kers
100.
019
.530
.015
.06.
211
.910
.43.
22.
11.
70.
1C
leri
cal a
nd k
indr
edw
orke
rs10
0.0
28.0
17.8
7.8
9.6
16.9
9.2
6.0
3.0
1.3
0.0
Cra
ftsm
en, f
orem
en, a
ndki
ndre
d w
orke
rs10
0.0
13.0
16.5
4.7
7.8
29.4
17.5
5.1
4.8
0.8
0.4
Ope
rativ
es a
nd k
indr
edw
orke
rs10
0.0
11.7
12.2
4.4
6.6
23.8
25.9
5.9
7.5
0.9
0.9
Serv
ice
wor
kers
, inc
l.pr
ivat
e ho
useh
old
100.
010
.014
.25.
79.
521
.021
.011
.16.
31.
00.
2L
abor
ers,
exc
ept f
arm
and
min
e10
0.0
5.9
8.0
3.6
8.0
22.3
26.3
9.1
14.1
1.2
1.1
Farm
ers
and
farm
mgr
s.10
0.0
5.3
11.5
2.5
4.7
10.7
20.5
5.2
8.5
17.8
4.3
Farm
labo
rers
and
fore
men
100.
02.
37.
52.
03.
820
.526
.08.
113
.46.
210
.2O
ccup
atio
n no
t rep
orte
d10
0.0
8.6
14.0
3.6
6.6
20.3
21.3
10.4
10.9
2.3
1.7
Sour
ce: C
urre
nt P
opul
atio
n R
epor
ts, S
erie
sP-
23, N
o. 1
1, M
ay 1
2, 1
964.
The
pop
ulat
ion
in th
is r
epor
t inc
lude
s71
8,00
0 m
embe
rs o
f th
e A
rmed
For
ces
livin
gof
f po
st o
r w
ith th
eir
fam
ilies
on p
ost;
all o
ther
mem
bers
of
the
Arm
ed F
orce
sar
e ex
clud
ed. E
xclu
ded
also
are
thos
e no
t in
expe
rien
ced
civi
lian
labo
r fo
rce.

DIMENSIONS OF FARM LABOR PROBLEM 9
culture students between 1918 and 1960 shows "that one third of theformer students were farming and approximately 8 percent were em-ployed in farm related occupations when the studies were made." 12A study of students who were graduated since World War II gavesimilar results.
A recent Iowa study indicates that 39 percent of the farm boyswho were graduated from high school in 1959 planned a career infanning. Such a high proportion of farm youth cannot be employedefficiently in farming. There is little question that more youth aspireto careers in farming than the industry can accommodate with rea-sonable returns for labor, and management services.
The direct costs of transfer also may serve as an impediment to oc-cupational mobility. Farm to nonfarm manpower transfers frequentlyinvolve geographic mobility as well as occupational mobility. Thedirect costs of moving depend on the size of the family, the amount ofproperty moved, the distance, and the method of transportation. Onestudy reports on the costs of moving from one labor market to an-other in the United States in 1962 and 1963.13 The average cost ofmoving for people other than those who were transferred by theiremployer was $180. The cost of moving was less for younger agegroups. Three-fourths of those who were under 25 years of agemoved for less than $50. For 83 percent of the movers, costs wereless than 10 percent of a year's income. Although there are manynonpecuniary costs involved in geographic mobility, the direct costsprobably are not sufficient to serve as a major impediment to migra-tion.
Migration from farms has been highly selective with respect to ageand with respect to education. The young, who have less invested inagriculture, also have better, nonfarm opportunities and a longer pe-riod of prospective employment in which to recoup the costs of mi-gration. They, therefore, are much more prone to transfer to nonfarmoccupations. An age cohort analysis by Tolley and Hjort shows that,although there is considerable variation among regions of the UnitedStates in projected migration rates by age, in all regions a very high
" Ibid., p. 24.13 The Cost of Geographic Mobility, Area Redevelopment Administration,
U. S. Department of Commerce, 1964.

10 C. E. BISHOP
rate of transfer is expected for persons in the 15 to 24 age group(Table 3). This high rate of transfer emphasizes the need for non-farm vocational skills if these young people are to avoid becoming apart of the large number of unemployed youth. .
Clearly the major avenue through which the supply of farm man-
Table 3 Projections to 1970 for Males Remaining on Farmsand Migrating off Farms
Agein
1960
Number of1960 Rural FarmMales Surviving
to 1970
Number Expectedto be Rural
Farm Malesin 1970
ImpliedOf} -FarmMigration
PercentMigrating
(in thousands)United States
5-14 1,542 631 911 59.015-24 985 259 726 73.725-34 566 436 130 23.035-44 750 629 118 15.745-65 1,287 1,140 150 11.75,130 3,095 2,035 39.7
Northeast5-14 99 47 52 52.515-24 66 29 36 54.525-34 43 38 5 11.635-44 54 46 7 13.045-65 86 74 14 16.3
348 234 114 32.8
North Central5-14 610 268 342 56.115-24 367 139 228 62.125-34 241 219 22 9.135-44 319 288 31 9.745-65 533 493 41 7.7
2,070 1,407 664 32.1
South, white5-14 470 188 282 60.0
15-24 338 59 279 82.525-34 178 112 66 37.135-44 248 194 53 21.445-65 457 414 44 9.61,691 967 724 42.8

DIMENSIONS OF FARM LABOR PROBLEM 11
Agein
1960
Number of Number Expected1960 Rural Farm to be RuralMales Surviving Farm Males
to 1970 in 1970
ImpliedOff-FarmMigration
PercentMigrating
(in thousands)South, nonwhite
5-14 221 70 151 68.315-24 131 8 124 94.725-34 49 21 28 57.035-44 55 37 17 30.945-65 93 67 26 28.0
549 203. 346 63.0
West5-14 142 58 84 59.2
15-24 83 24 59 71.125-34 55 46 9 16.435-44 74 64 10 13.545-65 118 92 25 21.2
472 284 187 39.6
Source: C. E. Bishop and G. S. Tolley, "Manpower in Farming and Re-lated Occupations," Education for a Changing World of Work, 0E-80025,U.S. Department of Health, Education, and Welfare, 1963. The estimateswere based on a method developed by G. S. Tolley and H. W. Hjort, "AgeMobility and Southern SkillLooking Ahead for Area Development,"Journal of Farm Economics, Vol. XLV, February 1963, pp. 31-46.
power is determined is through conditions affecting the entry of youthinto farm occupations. In spite of the high rate of exodus, the rate ofentry into farming still is considerably in excess of the number of newfarming opportunities created which can yield a return for labor serv-ices equal to the return received in nonfarm employment.
In an earlier study I suggested an alternative hypothesis that thesupply of labor to nonfarm firms is highly elastic with respect to pre-vailing relative rates of return in farm and nonfarm employment."There is no doubt that considerable manpower can be transferredfrom farm to nonfarm employment at prevailing farm and nonfarmrates of return for labor services. In my judgment the actual rate of
14C. E. Bishop, "Economic Aspects of Changes in the Farm Labor Force,"Chapter 4 in Labor Mobility and Population in Agriculture, Iowa State Uni-versity Press, 1961, p. 40.

12 C. E. BISHOP
migration is determined largely by shifts in the demand for manpowerin nonfarm employment.
Changes in farm population through migration and reclassificationof residence since 1920 are shown in Figure 1. After the sharp dropin farm prices in 1920 there was a large transfer from farms. Thetransfer decreased in size throughout the remainder of the 1920s andearly 1930s, and remained fairly stable throughout the remainder ofthe 1930s. The pattern since 1940 has been much more variable, butthe trend has been downward.
Change Through Migration (100,000)40
30
20
10
0
- 10
-20
- 30
40
To farms
I Ito oe". * " %
IA I %Oft,
4II.. Net change
0 As..... Irk %
0.... .. .....
lit....%.
de /It..,...,s.From farms
V
il V
im l i l t I I I I I I I I 1 1 1 1_, 1 1 1 1 1 1 1 IIII I,Il1920 1925 1930 1935 1940 1945 1950 1955 1960 1965
Figure 1. Change in farm population through migration and reclassi-fication of residence. Source: Farm Population, ERS,USDA.
The transfer in the opposite direction, from nonfarm to farm resi-dences, shows three different trends over time. Throughout the 1920sthe trend was upward. After a sharp decline in the early 1930s thetrend was rather stable through the early 1940s. Since the adjustmentsfollowing World War II the trend has been downward and rathersteady.
An earlier analysis emphasized the significance of the level of un-employment to migration and concluded that during periods whenunemployment was above 5 percent the number of job openings in

DIMENSIONS OF FARM LABOR PROBLEM 13
occupations for which migrants qualify is a major factor limiting mi-gration. During such periods farm people are willing to migrate tononfarm areas in large numbers without an increase in relative pay-ments for labor services in nonfarm employment." On the otherhand, when the level of unemployment in the economy was below the5 percent level, the migration of farm people to nonfarm residencesincreased as the nonfarm wage rate increased relative to returns forlabor services in farming.
A similar hypothesis was set forth recently by Jones and Christian.They concluded that the principal causal factor for the low wage ratesin United States agriculture was "the redundant supply of labor inagriculture, a condition which . . . is perpetuated by lack of oppor-tunity in alternative occupations. Agricultural labor is 'trapped' in the`other America.' " 16
Other supporting evidence for the deficiency of demand for man-power hypothesis is obtained by looking at the distribution of mi-grants over occupations. Sjaastad shows that more than 70 percent ofthe workers who transfer from farm to nonfarm occupations are em-ployed in the blue-collar occupationscraftsmen and foremen, op-eratives and kindred workers, and laborers other than farm.17 Fur-thermore, there is some indication that the percentage of migrantsfrom farms entering these occupations has been increasing overtime." These, of course, are the occupational categories in whichunemployment has been greatest. Jones and Christian emphasizedthat the competition confronting agricultural workers in search ofalternative employment is most severe where employment opportuni-ties seem to them to be greatest."
The excellent work of Perkins and Hathaway provides us with agreater insight into the effects of unemployment upon occupational
15 Ibid.
" Jones and Christian, Industrial and Labor Relations Review, p. 523.17 L. A. Sjaastad, "Occupational Structure and Migration Patterns," Labor
Mobility and Population in Agriculture, Iowa State University Press, 1961, p.21
1° C. E. Bishop, "Agriculture and a Full Employment Economy," AgricultureExperiment Station Bulletin 556, Virginia Polytechnic Institute, 1964.
" B. B. Perkins, Labor Mobility between the Farm and Nonfarm Sector,Ph.D. dissertation, Michigan State University, East Lansing, Michigan, 1964,p. 114.

14 C. E. BISHOP
transfers. Whereas most mobility studies have been concerned withgeographic migration, the Perkins and Hathaway study deals with in-dustry changes. They provide the best information to date on thetransfer from nonfarm to farm employment. There is a substantialdifference between gross and net migration. The ratio of net to grossmigration is sometimes taken as an indication of the efficiency of mi-gration. Even if mobility were perfect, there could be a significanttransfer of people to rural areas. Nevertheless, the flow of peoplefrom nonfarm to farm occupations in the United States is largeenough to be a cause of concern. The impact of the backflow on thefarm labor force is emphasized in Perkins' conclusion that "if in-farmmobility had been zero during the years 1956-59, the annual averagereduction in the size of the farm labor force would have been 15.8percent instead of 3.6 percent. Even if those who moved back intoagriculture after only a year in the nonfarm sector had stayed in thatsector the net off-farm mobility rate would have been nearly dou-bled." 20 A better system of guidance of manpower transfers fromfarm to nonfarm occupations could contribute greatly to moreefficient use of manpower.
Improvement in the returns for farm labor services also is hinderedby impediments to structural change in agriculture. The structuralchanges which are implied by agricultural development are oftenextensive, and many rigidities are encountered. The major impact oftechnological change has been on consolidation of farms. The averageage of operators of farms selling less that $5,000 of farm products in1959 was 50 years, 4 years more than for farms selling $10,000 ormore of products.21 It is widely known that unemployment is highamong the older age groups and that the difficulty of transferringamong occupations increases with age. The problems of structuralreadjustments within agriculture, therefore, are interrelated with theproblems of obtaining nonfarm employment for persons in the olderage groups.
Moreover, the land market like the labor r -ket is far from per-fect. Among the more important obstacles to efficient transfer ofland are (1) the immobility of manpower, (2) the high premiumplaced on land ownership in rural communities, (3) the capital gains
Ibid.a' U. S. Census of Agriculture, 1959, Vol. II, Chapter 11.

DIMENSIONS OF FARM LABOR PROBLEM 15
potential from land ownership, resulting in part from farm price poli-cies, (4) the low liquidity of investments in land in isolated areas, and(5) the lack of a well-conceived policy on agrarian structure.22
Structural changes also are complicated by the fact that mechani-zation has had differential effects among commodities and regions.The large seasonal differences in labor requirements in the productionof farm commodities constitute an obstacle to labor mobility, espe-cially for regions which depend heavily on monoculture of crops.Mechanization of farm production has done little to reduce peakmanpower needs for some commodities. The productivity of laborservices is very low in the production of some of these commodities,and the wage rate is correspondingly low. However, although themarginal productivity of manpower may be near zero during much ofthe year, during peak periods it is very high. The costs of not havingsufficient manpower to meet peak needs, therefore, may be very high.
The lack of mechanized techniques of production to decrease man-power needs at peak periods undoubtedly is a factor which perpetu-ates low returns for labor services in agriculture. Very few areas havebeen able to develop an agriculture which provides reasonable in-comes for farm families when the manpower is employed for onlyshort periods of the year. In order to reduce underemployment, it hasbeen necessary to mechanize the jobs with peak manpower require-ments, thereby substituting capital for manpower, or to alter theproduct mix in such a way as to achieve less seasonal variation in themanpower input by providing er-floyment for additional manpowerduring the slack periods.
MANPOWER POLICY BY DEFAULT
The low returns for farm manpower in the United States probablystem in part from the fact that this nation has never developed an ex-plicit manpower policy for agriculture.23 Instead, farm manpower
"J. Klotzman, A Study of Obstacles to Shifts in the Use of AgriculturalLand, DAA-T-345, OECD, Paris, 1964, p. 10.
C. E. Bishop, "Combating Rural Poverty," in Our Stake in CommercialAgriculture, Rural Poverty and World Trade, Center for Agricultural and Eco-nomic Development, Report No. 22, Iowa State University, Ames, Iowa, 1965.

16 C. E. BISHOP
has been exempted from most major labor legislation. Primaryemphasis in agricultural policies and programs has been placed onproduct markets and product market conditions. In the factor marketarea, land us" and conservation policies have been developed andfarmers have been provided with subsidies to encourage them tomake specified uses of land. Likewise, special credit programs havebeen developed to encourage farmers to make particular types of in-vestments. As indicated above, vocational education and traininghave been provided for practically all farm youth desiring such pro-grams, but these education and training programs have been highlyoriented toward farming and farm-related occupations with littlereference to nonfarm employment opportunities and to manpowerpolicy.
In view of the changes now taking place and the importance of oc-cupational and geographic mobility of labor to a solution of low-income problems in rural America, manpower policy for agricultureshould be related explicitly to national manpower policy and to gen-eral economic goals. Increasing the mobility of manpower may ormay not be a desirable part of such a policy. Certainly, mobility isnot an end to be achieved as such. Instead, policies should be di-rected toward improving the mobility potential of manpower throughtraining and through other programs in order to provide occupationaland geographic flexibility and toward providing specific kinds ofassistance to people to enable them to make and to carry out mobilitydecisions. As a minimum, farm manpower policy should seek to (1)gauge the employment potential in farming in terms of a reasonablereturn for manpower services, (2) provide counsel to individuals andfamilies concerning income potentials in farm and nonfarm employ-ment, (3) continue specialized training programs for those who areto continue as farmers, (4) expand nonfarm vocational training forthose who have limited opportunities in farming, and (5) providespecial counseling, guidance, and possibly relocation loans or grantsto those who transfer to nonfarm occupations. The objective of theseprograms would be to increase the productivity of and returns forlabor services, . In the same way in which land-use policy has recog-nized that there are substantial differences in the productive potentialand best uses of land, farm manpower policy would emphasize the

DIMENSIONS OF FARM LABOR PROBLEM 17
differences in productive potential and adjustment capacity of farmpeople.
Finally, a farm manpower policy should include the developmentof an early warning system to detect changes in technology which arelikely substantially to decrease farm manpower needs. Early detectionof these changes and analysis of their probable magnitudes shouldmake it possible to cushion the ensuing adjustments.

[2]
The Current Situationof the Hired Farm Labor ForceGLADYS K. BOWLES
This paper has two parts: (1) a section on the characteristics ofhired farm workers, their employment and earnings from farm andnonfarm wage work in 1964, and related materials, to give a broadpicture of the current socio-economic situation of the hired farmlabor force, and (2) a section on the characteristics of the populationof households with at least one person who did farm wage work in1962, to provide relevant materials on the population dependent invarying degrees on hired farm work.Source of Data on Hired Farm Workers. There are several federalsources of data on hired farm workers, and it should be pointed outthat the various sets of data do not always show consistent trend pat-terns in numbers of workers, levels of wage rates, or annual earnings,even after survey coverage, sampling differences, and other methodo-logical and conceptual matters are considered. Fortunately, the broadoutlines of the socio-economic situation of hired farm workers arenot obscured by the differences that appear among the various series,and references to such differences will be kept to a minimum in thischapter.
Most of the data utilized in this chapter come from annual surveysconducted by the Bureau of the Census for the Economic ResearchService published in the series of reports relating to the hired farmworking force 1.z'$
OLADYS K. BOWLES is Supervisory Statistician in the Economic ResearchService of the U. S. Department of Agriculture.
1 Gladys K. Bowles, The Hired Farm Working Force of 1964: A Statistical

20 GLADYS K. BOWLES
HIRED FARM WORKERS
About 3.4 million persons in the civilian noninstitutional population
14 years old and over in December 1964 did some work on farms for
cash wages or salary in 1964.4Trends in Number of Hired Farm Workers. Averages for the 5-yearperiods, 1945-49 and 1960-64, from the hired farm worker seriesindicate that the number of persons who do farm wage work in thecourse of a year has not changed significantly. This is in contrast to
the steady decline that has occurred among farm operators and un-
paid family workers employed on farms. It is also in contrast to thetrend shown by the U. S. Department of Agriculture series on hired
farm employment,5 which shows a decline of 20 percent in the
annual average number of hired workers on farms between these two
5-year periods.These differences in direction and the magnitude of change of these
series are not necessarily inconsistent. The evidence from recent years
points toward increasing seasonality in agricultural employment.Thus the number of people working during a year will tend to show a
smaller change than annual averages based on employment for one
week in each of the 12 months.The hired farm working force is customarily very heterogeneous in
Report, Agricultural Economic Report 82, USDA, ERS, Washington, 1965.
30 pp.'Gladys K. Bowles and Calvin L. Beale, Characteristics of the Population of
Hired Farm Worker Households, Agricultural Economic Report 84, USDA,ERS, Washington, 1965. 21 pp.
Gladys K. Bowles and Walter E. Sellers, Jr., The Hired Farm WorkingForce of 1963 (with Supplementary Data for 1962), Agricultural EconomicReport 76, USDA, ERS, Washington, 1965. 63 pp.
Not included in this 3.4 million are persons doing some farm wage workin 1964 who died, entered the Armed Forces, or were otherwise removedfrom the survey population by the time of the survey in December. For in-stance, most of the 200,000 foreign nationals admitted for agricultural workunder contract in 1964 are excluded because they had returned to their homesprior to the time of the survey. The total number of persons who are excludedfrom the ERS survey probably does not exceed 500,000.
5 U. S. Department of Agriculture, Statistical Reporting Service, Farm Labor,Crop Reporting Board, Washington, 1965. Various issues.

CURRENT FARM LABOR FORCE 21
composition. In this discussion it will be helpful to distinguish severalrather distinctive groups. One group is the casual workers, who doless than 25 days of farm wage work during a year; they totaledabout 1.4 million persons in 1964. In the 5-year periods referred toearlier, casual workers increased by 27 percent. These short-timeworkers are mainly housewives, students, and others who are not inthe labor force except for very short periods. A considerable propor-tion of them come from households whose principal source of incomeis from nonfarm work or from farming and who are generallyat higher income levels than the groups who get their income prima-rily from farm wage work.
The second group, noncasual workers, totals about 2 million work-ers and is comprised of two major subgroups. The first subgroup in-cludes about 650,000 regular and year-round workers. Regularworkers are defined here as those who work for one or more farmemployers for 150 to 249 days in a year; year-round workers are em-ployed for 250 days or more. The second subgroup includes 1.3 mil-lion seasonal workers who work 25 to 149 days a year. Between1945-49 and 1960-64 seasonal workers have averaged about thesame in number; regular workers have declined about 10 percent.The biggest proportional decline has occurred among year-roundworkers where the number dropped nearly one-third.
Workers included in the Economic Research Service (ERS) surveydid about 271 million man-days of work on farms, about one-fourthof the total number of days of labor on farms in 1964. Regular andyear-round workers, who comprised about one-fifth of the hired farmworking force, did about two-thirds of the total number of man-daysof farm wage work. This is in contrast to the situation some 15 or 20years ago, when these workers comprised about one-fourth of thehired farm working force and did about three-fourths of the man-daysof work. Casual workers, who made up about two-fifths of the hiredfarm working force, did about 5 percent of the 271 million man-daysof farm wage work (Figure 1).Characteristics of Hired Farm Workers. About 71 percent of the1964 hired farm working force were men and boys; about 69 percentv :tre white. Only about a fourth were engaged chiefly in farm wagework. Over half, primarily housewives and students, were not in the

22 GLADYS K. BOWLES
Million Workers5
4
3
2
1
0
Million Days Worked500
400
300
200
100
0
Regular andyear round°
1945 1950 1955 1960 1965 1945 1950*NOT AVAILABLE°WORKED 25-149 DAYS
°WORKED 150 OR MORE DAYSWORKED LESS THAN 25 DAYS
1955 1960 1965
Figure 1. Number of hired farm workers and man-days worked.Source: ERS, USDA.
labor force most of the year; and even among noncasual workers,many were outside the labor force most of the year (Figure 2).
The hired farm working force is on the whole a relatively younggroup, having a median age of 25.3 years in 1964. Over one-fourthwere young people 14 to 17 years old, who engage in farm workmainly in the summertime.
About 11 percent of the workers in the 1964 ERS survey did somefarm wage work outside their home counties. These are usually calledthe domestic migratory workers, although a small proportion mayactually be imported foreign workers.Distribution of Workers. Nearly two-thirds of the 1964 hired farmworking force lived in nonfarm places at the time of the survey inDecember, although some of them may have lived on farms at sometime during the year. This is in contrast to the situation some yearsago when approximately 65 percent lived on farms (Figure 3) at thetime of year the ERS annual surveys were conducted.
In 1964 over half the workers lived in the South and about one-tenth in the Northeastern States. The remainder were located aboutequally in the North Central and Western States. The distribution of

CURRENT FARM LABOR FORCE 23
Percent of Total100
Unemployed A
Not in labor force
Nonfarm workOther farm work°
Farm wage work
0--1947 &'49 '52 & '54 '56 & '57 '59 &'60 '63 & '64
ANOT AVAILABLE FOR 1947 &'49°INCLUDES OPERATING A FARM AND UNPAID FAMILY LABOR
Figure 2. Chief activity of farm wage workers. Workers did 25 daysor more of farm wage work during the year; average of se-lected years. Source: ERS, USDA.
3,946,000 All farm wage workers 3,484,000
NONFARM
Average of Average of1948-49 1963-64
Figure 3. Residence of hired farm workers. Residence of farm wageworkers in December of the reference years. Data relate topersons 14 years old and older in the civilian noninstitutionalpopulation who had done some farm wage work during thespecified years. Source: ERS, USDA.

24 GLADYS K. BOWLES
workers among the different regions has varied only slightly in recentyears. Within these broad regions there are, however, widely diversepatterns in the proportions of farms which utilize any hired labor orin the use of regular and seasonal farm wage workers.
One of the striking features of the employment structure in agricul-ture is the heavy concentration of hired workers on a small propor-tion of the farms and in certain types of farming. Three states, Cali-fornia, Texas, and Florida, accounted for about one-third the totalfarm labor bill in 1964.° These states and North Carolina, NewYork, Illinois, Arkansas, Washington, Iowa, and Oregon accountedfor about one-half the total farm labor bill in that year. According tothe USDA series on farm employment, these states had about 47 per-cent of the annual average number of hired workers on farms in1964.
Utilization of hired labor also varies extensively among types offarms. For instance, livestock and dairy farms usually have a com-paratively high proportion of regular workers, as the stock requireregular attention. Tobacco and cotton farms use few regular workersbut rely heavily on seasonal workers. Fruit and nut farms and vegeta-ble farms are also large users of seasonal hired workers, and theyhave also been the principal users of imported foreign workers inrecent years. These specialty-product farms have been about the onlyusers of the 36,000 foreign workers authorized by the Department ofLabor in 1965. Citrus fruits, strawberries, apples, potatoes, shade to-bacco, sugar cane, tomatoes, and some other specialty crops haveutilized foreign workers at various periods in this year.Geographic Mobility of Hired Workers. According to the latest re-port on mobility of the population published by the Bureau of theCensus 7 (see also table below) male hired farm workers have thehighest mobility rate of all civilian male wage and salary workers inmajor occupational groups. About 29 percent of male wage and sal-ary farm workers lived in a different house in March 1964 from thehouse they lived in a year earlier. This percentage compares with
U. S. Department of Agriculture, Economic Research Service, Farm In-come, FIS 199, Supplement, Washington, August 1965. 135 pp.
U. S. Bureau of the Census, Mobility of the Population of the United States,March 1963 to March 1964, Population Characteristics, Series (P-20), No.141, Washington, 1965. 50 pp.

CURRENT FARM LABOR FORCE 25
mobility rates of around 20 for male wage and salary workers inwhite collar, manual, afid service jobs. Also the migration rate (basedon workers who lived in a different county from that lived in a yearearlier) was higher for hired farm workers than for other majorcivilian occupational categories.
Mobility Rates of Male Wage and Salary Workers, March1963--March 1964, in Percentages
(Persons 14 years old and over)
Intercounty Movers (Migrants)
Between StatesWage and Within- Non-
Salary All County Within Contig- contig-Workers Movers Movers Total a State Total uous uous
Total 20.9 14.1 6.8 3.5 3.3 1.2 2.1White collar 20.0 11.8 8.1 4.1 4.1 1.6 2.5Manual 21.3 15.5 5.8 3.1 2.7 0.9 1.7Service 20.0 14.4 5.6 3.0 2.7 0.7 1.9Farm 29.2 18.5 10.7 5.2 5.5 2.0 3.5
Source: U.S. Bureau of the Census, Series P-20, No. 141, Mobility of thePopulation of the United States, March 1963 to March 1964.
Higher rates of mobility and migration stem, to a large extent,from characteristics of the hired farm worker occupation. Amongthese are: (1) seasonality of employment with associated nonfarm-to-farm and farm-to-farm moves. About 65 percent of the hired farmwork force lived in nonfarm places in December, a month of lowfarm work activity. Yet many of these workers have moved from anonfarm place to a farm for a period of employment and have re-turned to a nonfarm place, but not necessarily to the same house oreven the same city or town. (2) A high proportion (about 40 per-cent) of the workers have more than one employer in the year, in-volving farm-to-farm moves in many cases. (3) Probably most im-portant, however, is the significant proportion of workers who travelabout the country (11 percent) while engaging in and looking forfarm work. Another factor that might be mentioned is the high pro-portion (about 55 percent) of workers who live in rented or rent-freehouses, from which moves can be made with relative ease.

26 GLADYS K. BOWLES
About 11 percent of the wage and salary farm workers made anintercountry move between 1963 and 1964, and nearly equal propor-tions of these workers (about 5.5 percent) moved within a state andbetween states. Of those moving state to state a slightly higherproportion ended up in a noncontiguous state rather than a state con-tiguous to their native state.
A great deal of the attention given to hired farm workers is focusedon the migratory group which travels about the country while seekingand engaging in hired farm work. Migration in search of work oftenaggravates problems of low income, unemployment, and underem-ployment, and presents a multitude of other social and economicproblems for workers; and their family members, particularly towomen and young children. Being highly visible and often acute,problems of these workers are brought to the attention of the publicto a greater extent than are those of other farm workers.
The mobility "streams," and thus the periodic geographic move-ment, of migratory workers are much better known than the patternsof more permanent mobility of hired farm workers. A schematicchart developed by the Department of Labor shows the origin andgeneralized travel patterns of seasonal migratory farm workers (Fig-ure 4). Originating in Texas and Florida, two distinctive groups fanout through the Central and Western States and along the AtlanticCoast and other Eastern States. Other smaller groups from Arizonaand New Mexico travel to and work in California, Washington, andOregon.
Certain states regulate labor camps, conditions of travel, day carefor children, working hours of children under 16, the activities offarm labor contractors and crew leaders, and other conditions ofwork of migratory farm laborers. Federal legislation requires thatcrew leaders register with the Employment Service and regulates theiractivities. The Economic Opportunity Act has special provisions forprograms to improve housing, sanitation, and day care of migratorychildren. The Migrant Health Act provides for special programs de-signed to improve the health conditions and medical facilities availa-ble to migratory workers and their family members. Although theseprojects include new and imaginative features, in total they are notlikely to go far in solving the special problems of the entire group of

14 "
'M
ASS
.
CO
S S"
14.3
DO
-M
D.
Figu
re 4
. Tra
vel p
atte
rns
of s
easo
nal m
igra
tory
agr
icul
tura
lw
orke
rs. S
ourc
e: U
.S. D
epar
tmen
t of
Lab
or, B
urea
u of
Em
ploy
men
t Sec
urity
, 196
1.

28 GLADYS K. BOWLES
domestic workers who travel about the country in connection withtheir agricultural work. And most of these programs dealing withfarm workers do not reach the nonmigratory workers, who compriseabout 90 percent of all hired farm workers.Seasonal Work Patterns of Hired Farm Workers. Seasonality of farmwork is recognized as one of the constant problems facing farmwage workers. Annual worker plans, designed to provide maximumemployment to workers, must necessarily recognize the incontro-vertible fact that many farm operations can provide employment foronly part of a year. And as mechanization and other technologicaldevelopments reduce the overall demand for hired farm labor, in thefuture as in the past, the proportion of short-time workers will in-crease, and their periods of employment on farms are likely to be ofshorter duration or, at best, no longer than now on the average.
Casual workers did about 80 percent of their farm wage work in 5months in 1964June through October. Noncasual workers, on theother hand, did only a little more than half their work in thesemonths. Figure 5 illustrates the 1964 seasonal work patterns of othersignificant groups of farm wage workers.
As important as information on periods of employment of hiredfarm workers are data on their periods of unemployment. We haveestimated that of the 3.4 million persons who did some hired farmwork in 1964, some 700,000 were unemployed at some time duringthe year. Of these, about 160,000 were unemployed 27 weeks orlonger and some 200,000 had three or more periods of unemploy-ment. Unless they have qualified for unemployment insurance benefitsthrough nonagricultural wage work, hired farm workers and theirfamilies are without protection during periods of unemployment.Employment and Earnings of Hired Farm Workers. Low farm-wagerates, coupled with short average duration of farm work, make theannual earnings of farm wage workers low. On the average, theirearnings are lower than the earnings of other major occupationalgroups.
The USDA series indicates that in July 1, 1964, the farm wage rateper hour for workers who did not receive board or room averaged$1.13; a year later the average was $1.17. In two states the July1965 average was 65 cents an hour; in five it was $1.40 or more. Therate was below $1.00 an hour in thirteen states, where the average

CURRENT FARM LABOR FORCE 29
was 82 cents an hour. Wage rates are lowest in the South, whereabout half the workers live and work, or have their home base, as mi-gratory workers do. Rates are somewhat higher in the North Central
Thousand People1000
800
600
400
200
0J
/Farm wage work.....i' ..fffffffffffffff
.. .%.## .0. ..
..--."'/ X
i 4_Going to school-4
Homemaking.. .i/N ,A.. .
. ..... law+ 1.11.Non arm work
F M A M J J A1964
S ON DFigure 5. Number of hired farm workers employed in 1964, by their
chief activity during theyear.
States, which have about one-fifth of the workers, and they are stillhigher in the Northeastern States. The Western States, which haveabout 19 percent of the workers, pay the highest wages, on the aver-age.
Although farm wage rates have risen substantially in all parts ofthe country in recent years, they are still very much lower than ratesfor most other occupations. In the years since World War H wages inmanufacturing industries have more than doubled, while farm wagerates have increased little more than half as much. Production work-ers in manufacturing industries earned an average of about $2.53 perhour in 1964 8 compared with $1.17 an hour for farm wage workers.
U. S. Department of Labor, Bureau of Labor Statistics, Employment andEarnings, Monthly Report on the Labor Force, and Special Labor Force Re-ports, TiSDL, BLS, Washington, 1965. Various issues.

30 GLADYS K. BOWLES
Moreover, the relative position of farm workers has actually de-teriorated since the end of the War. When adjustments are made forcost of living increases farm workers are shown to be falling behindwage workers in other industries. The relative worsening of the farm-nonfarm wage rate situation holds for all major regions of the coun-try. Even in California, where highest farm wages are paid, on theaverage, the gap between farm and nonfarm wages has widened inthe last 10 years. The ERS annual survey of hired farm workersshows that, as a group, hired farm workers earned about $7.15 a dayin cash wages from their farm wage work in 1964. For an average of80 days of farm work, in 1964 hired farm workers earned $578.
It should be noted that throughout this section of the chapter dailyand yearly earnings refer only to the cash wages received by workersand do not include the value of perquisites or fringe benefits furnishedwithout charge by the employer. Actually hired farm workers gener-ally receive less in the way of fringe benefits than do nonagriculturalworkers. A substantial proportion of farm wage workers do receivesome perquisites such as room and board, housing, meals, transporta-tion, and use of garden space. In general, the value of these itemsdoes not equal the value of health and medical insurance, paid vaca-tions, and other fringe benefits received by industrial workers, and thequality of housing, sanitary facilities, and other housing equipmentprovided for farm wage workers is very often substandard.
One of the major features of the hired farm working force is thegreat variation among major groups in the average number of days ofemployment and related daily and yearly earnings from farm wagework. A few facts will adequately demonstrate this variation in 1964:
.1.4 million casuals averaged 9 days of work and earned $57.2.0 million noncasuals averaged 129 days and earned $933.On the average, casual workers earned $5.85 a day when they
worked on farms.Men averaged $6.90 a day and women $5.15.
Nonmigratory workers averaged $5.80 a day; domestic migra-tory workers earned $6.75.
Persons who were heads of households averaged $7.05 a day;other household members earned $5.50.
Even among noncasuals, many are not in the labor force, or they

CURRENT FARM LABOR FORCE 31
do types of work other than farm wage work most of the year. Since1947-49 the proportion of noncasuals whose chief activity was farmwage work has been declining and the proportion not in the laborforce the greater part of the year has been increasing.
Among the noncasuals:1.3 million seasonal workers averaged 64 days of work and
earned $400 from farm wage work.0.3 million regulars averaged 198 days and earned $1,432.0.3 million year-rounds averaged 321 days and earned $2,560.Whites averaged 134 days at $8.15 a day, earning $1,094 in
cash wages.Nonwhites averaged 119 days at $5.10 a day, earning $609.Workers in the West received the highest daily wages, $11.15;
those in the South received the lowest, $5.75.Nonmigratory workers averaged 131 days at $6.95 a day, earn-
ing $910.Domestic migratory workers averaged 120 days at $9.00 a day,
earning $1,083.About 2.1 million persons did farm wage work only (FWO work-
ers), and about 1.3 million were employed at both farm and nonfarmwage work (FNF workers) in 1964.
FWO workers had about 100 days of farm wage employmentand earned $698.FNF workers did an average of 98 days of nonfarm wage workand 49 days of farm wage work and earned total wages of$1,379.
FWO workers earned about $6.95 a day from farm wage work;FNF workers averaged about $7.70 a day.
FNF workers earned about $10.10 a day from their nonfarmwage work.
CHARACTERISTICS OF THE POPULATION
OF HIRED FARM-WORKER HOUSEHOLDS
Although systematic data have been available for many years onhired farm workers, little has been known about the population of all

32 GLADYS K. BOWLES
ages associated with these workers. Yet such data are pertinent in anumber of contexts. By almost any measure, the occupation of farm-wage worker ranks as poorest in income and education of worker,housing, continuity of employment, and extent of inclusion in theconventional social protections of unemployment compensation, dis-ability insurance, minimum wage or collective bargaining laws. Thusit is relevant to have information not only on the farm workers them-selves but also on size and characteristics of the population de-pendent in some degree on them.
In this second part of the chapter, farm-worker households arethose households which had at least one member who had engaged inhired farm work in 1962. The population of these households wascross-classified by characteristics of the household head and by theamount of hired farm work done by members of the household. Theresult is analogous to occasional past studies that have dealt with thepopulation of farm-operator households.
In December 1962 there were 2.6 million households in the UnitedStates with one or more of the 3.6 million persons who did farm workfor wages or salary in 1962. The total population of these householdswas 11.2 million persons, or 6.1 percent of the total United Statespopulation. This represents the maximum number of persons in thenation who had some direct degree of dependence on hired farm workfor their support.
Of the pL,.--Ilation in farm-worker households, 3,054,000 persons,or 27 percent, were nonwhite. Thus nonwhites, who made up about12 percent of the general population in 1962, were greatly overrepre-sented in the farm wage-worker population.° Most of the nonwhitesare Negroes, but Japanese, Filipinos, and American Indians are alsoincluded.
One-half the population of farm wage-worker households were chil-dren and youth under 18 years of age. This figure compares withabout 37 percent for all households in the United States. Households
° Information on the general population used for comparative purposes inthis report is from various publications of the U. S. Bureau of the Census.Specifically, U. S. Bureau of the Census, U. S. Census of Population: 1960.General Social and Economic Characteristics, United States summary. FinalReport PC (1)-1C. U. S. Government Printing Office, Washington, 1962,344 pp.

ti
CURRENT FARM LABOR FORCE 33
with one or more farm wage workers were somewhat larger (4.4 per-sons) than the average household in the United States (3.8). Non-white farm-worker households averaged 4.9 persons in 1962 com-pared with 4.2 persons in white households, a difference due mainlyto the larger average number of children and youth in the nonwhitehouseholds. At the time of the survey, nonwhite households averaged2.8 persons under age 18, whereas white households averaged 2.0children and youth. Nonwhite households also typically contained alarger number of persons who had done farm-wage work in 1962(1.7) than did white households (1.3).Sex and Age Distribution of Household Heads. Farm wage-workerhouseholds have males as the head somewhat more often than doother households. In 1962, 87 percent of farm-worker householdshad a male as the head compared with 82 percent of all households.Households with a woman as the head are rather frequent amongnonwhite farm workers. More than one-fourth of these nonwhitehouseholds do not have a male head as compared with one-twelfth ofthe white-worker households without a man as the head. The headsof households having farm-wage workers are somewhat younger, onthe average, than are the heads of other households. Nearly 50 per-cent of them, in 1962, were under 45 years of age, compared with 45percent in the general population. Nonwhite heads were a little older,on the average, than white heads of farm-worker households.Education of Household Heads. The median years of school com-pleted by heads of households (25 years of age and over) which hadone or more persons doing farm-wage work in 1962 was 7.7 years.About 65 percent of these household heads had not gone beyond 8grades of school. Among nonwhite heads, more than 80 percent hadnot gone beyond 8 grades in school. Of the family heads in the gen-eral population in 1962, on the other hand, only 35 percent had notgone beyond 8 grades of school. For nonwhite heads, in the generalpopulation, the percentage was 56.Total Family Income in 1962. Households in which one or moremembers had done some farm wage work had a median net moneyincome from all sources of about $2,600 in 1962. The median forwhite households of $3,156 was more than double that of $1,505 fornonwhite households. Part of the difference in total income resulted

ni.E0,1
34 GLADYS K. BOWLES
from the fact that a higher proportion of nonwhite households wereheaded by persons who for the greater part of the year were not in thelabor force or were unemployed. Also, more white than nonwhiteheads were engaged primarily in nonfarm work rather than in farmwage work.Migratory Status. There were 178,000 households, containing 604,-000 persons of all ages, in which the head did some migratory farmwork in 1962. These households do not include all the 380,000 peo-ple who did migratory farm work during the year. Some migratoryworkers either did not come from households where the head was amigratory worker or lived in group quarters which were not definedas households. It is estimated that about 300,000 households had oneor more migratory workers. The relatively small population in house-holds headed by migratory farm workers (5.4 percent of the totalfarm-worker household population) is a reminder that the migratory-worker population is a very small segment of the total group withsome dependence on hired farm work.
DEPENDENCE ON HIRED FARM WORK
The degree of dependence of families on hired farm work for theirlivelihood varies greatly. For some, farm wage work is the principalsource of income; for others, it supplements income from nonfarmwork or from farming.Population with Minor Dependence on Hired Farm Work. Of the11.2 million people living in all farm-worker households, 6.4 million,or more than half, were in households in which the head of the housedid less than 25 days of hired farm work. The other household mem-bers had a combined total of less than 150 days of such work. About90 percent of them earned less than $100 from hired farm work, andthe group averaged over $3,000 of income per family from othersources. These households clearly had only minor dependence onfarm wage work for their support. It is estimated that less than 5 per-cent of the net income of the population in this group came fromhired farm work.
Compared with other hired-worker households those with minordependence:

CURRENT FARM LABOR FORCE 35
were least likely to live on a farm. Only 31.5 percent are onfarms compared with 41.5 percent of the other farm-workerpopulation;
were more likely to be from households where a good levelof education prevails. More than 25 percent of the householdheads had completed high school compared with 15 percentfor heads in all other farm-worker households;
had fewer nonwhites. About one-fourth of the population inthese households was nonwhite, a somewhat lower proportionthan in other dependence groups;
had more children 6 to 18 years of age (37 percent against 30percent in households with moderate or primary dependence).
In other words, many of the casual farm workers come from non-farm homes with good educational levels, and a high proportion areschool-age children earning money on local farms after school hoursor in periods of peak labor need. In 80 percent of the households,only one person did any farm work. The average level of family in-come in these households of $3,187 was equal to the average of thegeneral farm resident population, and was noticeably higher than thatof families with moderate dependence ($1,856) or primary de-pendence ($2,476).Population with Moderate Dependence on Hired Farm Work. Asecond group of households had moderate dependence on farm wagework. These were households in which the head performed 25 to 149days of farm wage work per year (usually less than 75 days) or inwhich the head did little or no farm work but other members of thehousehold did an aggregate of 150 or more days. The total popula-tion in the households of moderate farm work dependence numbered2.7 million. As a group, such households earned approximately 28percent of their income from hired farm work.
The population with a moderate dependence on farm wage workconsisted of two different types of households. The more numerouswere those in which the household head did some farm wage work,but less than 150 days per year. The second type consisted of house-holds where the head did less than 25 days of such work, if any, butthe work of one (or more) other household members added up to150 days or more of hired farm work.

36 GLADYS K. BOWLES
In the households where the head did a substantial amount of farmwage work, there were about 1.9 million people. In these households:
three-fifths were in the South, a heavier Southern concentrationthan is true of any other dependence category (except wherethe head did. 150-249 days);
about three-eighths of the population were nonwhite;three-tenths of the people lived in urban areas, a higher pro-
portion than of any other category;heads of households also did much nonfarm work and some
of them were farm operators;others were adults who were not usually in the labor force.
Also included were many people who wanted but could notobtain more work;
17 percent of the heads who had performed 25-149 days offarm wage work in 1962 were unemployed in December ofthat year.
This was the poorest group of farm-worker households, with anaverage total family income of $1,571 and only $418 a year fromfarm wage work. To some extent low income results from the factthat a higher proportion of household heads in this group was non-white and a higher proportion was of late middle age or older (and ina state of semiretirement) than is true among regular workers.
The second group of households in the moderate dependence classis much smaller, including about 748,000 persons. In these house-holds in which 150 days or more of farm wage work were performedby household members, but little or none by the head, two types ofsituations prevail; those in which the household head was a farmoperator (29 percent) and his children or wife worked for wages forhim or some other farmer, and those in which the head was too old towork (21 percent were 65 years of age and over).
Only a little over a fourth of the population was nonwhite.23 percent lived in urban places.There was very little unemployment among heads of these
households (only 1.6 percent of those in the labor force).Over 40 percent were engaged primarily in nonfarm work at
the time of the survey.The average level of family income ($3,218) was better than in
the homes of full-time farm wage workers, despite the high propor-

CURRENT FARM LABOR FORCE 37
tion of elderly heads. Only a fourth of the households in this group hadless than $2,000 income from all sources compared with five-eighths
of the households in the other group with moderate dependence onfarm wage work (where the household head works for 25-149days).Population with Primary Dependence on Hired Farm Work. These
are households in which the head did at least 150 days per year ofhired farm work. They contained a population of 2.2 million persons
in 1962 and averaged receiving about 82 percent of their incomefrom farm wage work. Workers in these households performed about64 percent of all days of hired farm work that were done in the na-tion although they contained only 20 percent of the farm-workerhousehold population.
In about two-thirds of the households with a primary dependence
on farm wage work the head was the only person who did such work.Such households actually averaged a larger total income than those in
which wives or children er gaged in farm work also. Not all the heads
of these households, however, had full-time farm work. A full workyew is about 250 days (on a 5-day basis), but a third of theheads in the primary dependence group had only 150 to 249 days offarm work yearly. The low-average family income of this latter group
suggests that employment of other family members is relatively lim-ited and that there is a good deal of underemployment among the
heads of these households.In the households with primary dependence on hired farm work:about one-fourth was nonwhite;probably because of their rather constant connection with
agriculture, nearly half the people lived on farms, and mostof the others lived in rural-nonfarm homes;
among the four major regions of the nation, a larger number ofhouseholds with primary dependence on farm wage work werelocated in the South than in any other single region, as is true
of all classes of farm workers;in the Northeast and the West the relative number of house-
holds with primary dependence was disproportionately large-24 percent in each region. In the South 20 percent and in theNorth Central States 16 percent of the households were primarily
dependent on farm wage work.

38 GLADYS K. BOWLES
INCIDENCE OF LOW LEVELS OF INCOMEAND EDUCATION AMONG HIRED FARM-WORKER HOUSEHOLDS
As noted in the 1964 Economic Report of the President, householdswith heads who were farm laborers or foreman have a very high inci-dence of poverty (defined as households with less than $3,000 in-come in a year). In 1962, 56 percent of the households headed' byfarm laborers and foremen had less than $3,000 family income, anincidence of low income exceeded only by households headed bydomestic service workers.
Among farm-worker households in 1962, the same proportion (56percent) had total income of less than $3,000. The incidence of lowincome was particularly high among nonwhites (83 percent), most ofwhom are in the South, and among households headed by personswho had done some migratory farm wage work in 1962 (71 per-cent).
Among the three farm-work dependency classes incidence of lowannual income was highest among families that did some hired farmwork but did not have regular or full employment in either farm ornonfarm work or a combination thereof, in other words, in themoderate-dependence category.
Proportion of Farm-Worker HouseholdsDependency with Less than $3,000 Family
Class Income in 1962 (percentage)
Total 56Minor 48Moderate 71Primary 61
The relationship of income and education has received much atten-tion in recent years. Low levels of education of many hired farmworkers mean that they can obtain only relatively low-paying types offarm and nonfarm jobs. Among households with persons who haddone some hired farm work in 1962 that were headed by persons at

CURRENT FARM LABOR FORCE 39
least 25 years old, 65 percent of the household heads had com-pleted only 8 grades of school or less, about one-third of whom hadcompleted less than 5 grades of school. Households where the head
had completed less than 5 years of schooling averaged about $2,000
income from all sources and those where the head had 5 to 8 yearsaveraged about $3,000 total family income. Higher average levelsof income were associated with each higher level of educationalattainment of the head, with those headed by persons who had com-
pleted high school averaging nearly $5,800.Within each educational category, the average income of nonwhite
households was less than that of white households. In fact, the aver-
age income of households headed by nonwhites who had completed
high school was only a few hundred dollars higher than the income of
white families with a head who had completed less than 5 years of
school.Households headed by migratory workers averaged about $2,600
from all sources in 1962. Among these households the same relation-
ships, pointed out above, existed between level of education and fam-
ily income. Households headed by persons with less than 5 years of
school completed averaged about $1,900 family income whereasthose with heads who had completed high school had an average
family income of $4,200.Among housebnlds in the three categories of dependency on farm
wage work, the relationships between income and education of the
household head followed the general pattern. Households with mod-
erate dependence on farm wage work headed by persons who hadcompleted less than 5 years of school averaged only $1,600 income;
households with minor dependence on such work, headed by persons
who had completed at least high school averaged about $6,200 fam-
ily income in 1962.In farm-worker households, fully one-half the population consisted
of children under 18 years of age, and nearly two-thirds of the chil-
dren and youth under 18 years in households in some way dependent
on farm wage work were in households where the head had com-
pleted 8 grades of school or less. In the primary and moderate de-
pendence categories over 70 percent of the children were in house-
holds headed by persons who had had no high school education.

40 GLADYS K. BOWLES
About three-eighths of the children in households having a primarydependence on farm wage work are in homes where the head of thehouse has less than 5 years of schooling. These homes average 3 chil-dren under 18 years each, compared with an average of 2 children inthe other primary-dependence homes of higher education. Thus,within the farm worker population, children are overrepresented inhouseholds of extremely low education.
About 3 million, or 54 percent, of the children and youth were inhouseholds in which total family income in 1962 was less than$3,000. These 3 million young people comprise 27 percent of the11.4 million children and youth under 18 years of age living in allhouseholds in the United States where family income totaled less than$3,000 in 1962.
It is the heavy proportion of children in farm-worker householdsthat in part creates concern over the welfare of this population. Thelow education of the majority of the parents and the intermittent andseasonal nature of the work of many of them produce conditionswhich help to perpetuate low education and low aspirations from onegeneration to another.

[ 3]
Farm Labor Adjustments
to Changing Technology
G. S. TOLLEY AND B. M. FARMER
According to estimates by Loomis and Barton, man-hour inputs inUnited States agriculture are projected to decline 48 percent from
1960 to 1980.1 Basing their work on an analysis of Heady andTweeten, Heady and Ball2 estimated that hired labor will decline
30 to 35 percent between 1960 and 1980 whereas family labor willdecline 45 to 55 percent. Daly 3 projected a decline in the number offarms from 3.7 million in 1962-63 to 2.0 million in 1980. Daly be-lieves that hours per farm of operator and family workers will notchange much, but hours per farm of hired work he projects to in-crease, so that the decline in the hours worked by hired farm workersis less than a third. Most projections of the changing number of farmsindicate declines in the future at about the same rate as in the 1950s,when there was a 30 percent decline in the number of farms. Seymour
Smidt and Tolley 4 projected labor inputs for 1980 under a variety of
assumptions about underlying conditions leading to changes in agri-culture. The projected decline in labor inputs under the alternativeassumptions was from a farm labor force figure on 5.7 million in1960 to a range of 3.0 to 5.3 million in 1980.
a. S. TOLLEY is a Professor in the Department of Economics in North CarolinaState University (on leave with USDA). B. M. Farmer is a former graduateassistant in the Department of Fconomics of the same University.
1 USDA Technical Bulletin 1238, 1961. U. S. Statistical Bulletin 233, revised
1961.2E. 0. Heady and A. G. Ball, "Economic Growth of the Farm Firm and
Projected Changes in Farming," Structural Changes in Commercial Agriculture,CAED Report 24, Iowa State University, 1965.
a Rex Daly, Agriculture in the Years Ahead, USDA, 1964.' S. Smidt and G. S. Tolley, "Agriculture and the Secular Position of the U. S.
Economy," Econometrica, 1964.

42 TOLLEY AND FARMER
In short, every look that is taken ahead shows a continuation ofthe general nature of adjustments that have been going on in the lastfew years of substantial declines in labor inputs. The range of uncer-tainty about actual labor inputs comes partly from demand un-certainty but more importantly from uncertainty about labor inputrequired to satisfy this demand, that is, labor productivity. There maybe only moderate labor declines, or there may be more substantialdeclines, but almost certainly there will be a continued generaldecline in labor input for both hired and family workers.
Let us now take a less aggregative look. An overview of the struc-ture of labor use in agriculture is given in Tables 1 through 4. Com-parisons within any one table are instructive, but the reader is cau-tioned against relying on conclusions reached from a comparison ofthe four tables. Differences in definitions, as for instance betweentotal man-hours and average annual employment, and several othercomplications make the tables noncomparable. Table 1 shows whathas been happening over the last few decades to total man-hours offarm labor and how the total has been distributed among individualcrop and livestock products. The conditions of employment and theadjustment problems are markedly different for full-time hired work-ers, seasonal hired workers, farm operators (who are considered self-employed), and farm family workers who are unpaid. Table 2 givesan indication of how average annual employment is distributedamong these types of persons and reveals that all contribute substan-tially to farm-labor input. The self-employed, supplying about halfthe total, are the largest of the four contributing groups. As revealedin 'Table 3, seasonal hired work is heavily concentrated among rela-tively few crops. Cotton, vegetables, and fruits are the most importantgroups and utilize somewhere near equal amounts of seasonal labor.By activity, as given in Table 4, well over half the seasonal hiredlabor is for harvesting.
Let us now try to relate future labor use to specific technologiesand thereby obtain ideas as to adjustment implications of the technol-ogies and policy problems implied. Berkwood Farmer in a study atNorth Carolina State University has been attempting to see whatspecific technologies on the horizon and factors affecting rate ofadoption may mean for future labor use. Survey schedules wereobtained throughout the country during the summer of 1964 in order

FARM LABOR ADJUSTMENTS 43
Table 1 Man-hours of Labor Used for Farmwork, by Groupsof Enterprises, United States, Selected Periods andYears, 1910-1964 a
(In millions of hours)
1910-1914 1939 1950 1964All farm work b 23,127 20,675 15,137 8,420Livestock and livestock products 0
All 4,836 5,998 5,548 3,282Meat animals 1,151 1,301 1,451 1,254Milk cows 2,658 3,452 2,749 1,393Poultry 786 993 1,161 465
Crops dAll 12,963 10,581 6,922 3,963Feed grains 3,915 2,745 1,484 513Hay and forage 1,263 1,173 695 464Food grains 905 528 327 177Vegetables 668 802 643 385Fruits and nuts 800 760 619 571Sugar crops 197 203 135 91Cotton 3,937 2,390 1,298 586Tobacco 457 871 745 545Oil crops 78 226 199 191
a Data found in 1965 issue of Changes in Farm Production and Effi-ciency: A Summary Report, U.S. Department of Agriculture Statistical Bul-letin 233, Washington, D.C., revised July 1965.
b Includes labor used on crops, livestock, and overhead.Q For livestock included in each group, see Table 1, footnotes 3 to 7, of
publication named in footnote a, above.d For crops included in each group see Ibid., Table 1, footnotes 8 to 16.Note: Supplement III to the publication quoted contains a table similar to
this one for each region.
Table 2 Average Annual Employment in Agriculture by Typeof Worker
1964 1963 1962 1961(000) (000) (000) (000)
Employment in agriculture 4,761 4,946 5,190 5,463Wage and salary 1,582 1,676 1,666 1,733(Seasonal hired farm workers) (705) (675) (707) (749)Self-employed 2,366 2,437 2,619 2,744Unpaid family 813 834 905 985
Source: Current Population Survey and Bureau of Employment Security.

44 TOLLEY AND FARMER
Table 3 Estimated Average Annual Employment of SeasonalHired Labor, by Crop, 1964 a
Crops Number(thousands)
Percent
All craps 705.2 100.0Cotton 129.3 18.3
All vegetables 154.6 21.9Tomatoes 28.8 4.1Beans 19.8 2.8Potatoes 18.6 2.6Other vegetables 87.4 12.4
All fruits 131.5 18.6Citrus 26.4 3.7Strawberries 25.2 3.6Grapes 14.2 2.0Other fruits 65.7 9.3
Hay and grain 52.7 7.5Hay 21.0 3.0Grain 31.6 4.5
Tobacco 63.4 9.0Livestock 19.8 2.8Other crops 153.9 21.8
a Includes employment in harvesting, cultivation, and other activities.Source: Bureau of Employment Security, In-Season Farm Labor Re-
ports.
to ascertain detailed cultural practices currently being used and thelabor inputs required for each cultural practice. The criteria for selec-tion of areas were, first, that there should be production of commodi-ties which are major labor users and, second, that these should havepresent or potential policy problems. Production of dairy cattle, hogs,cotton, wheat, and feed grains in various parts of the country wassampled. The survey results give an indication of what proportion ofproduction is currently under various kinds of technology and whatthe man-hours required for each technology are. The differences inpractices being used by farmers, even in the same region, are striking.
A companion part of this study is aimed at estimating potentiallabor inputs. Information pertaining to new technologies was ob-

FARM LABOR ADJUSTMENTS 45
Table 4 Estimated Average Annual Employment of SeasonalHired Agricultural Workers by Crop Activity, 1964 a
CropActivity
Number"(thousands)
Percent ofTotal
All Activities 705.4 100.0
General 78.7 11.2
Cultivating 137.4 19.5Cotton 46.7 6.6Fruits 32.7 13.9Other crops 57.9 8.3
Harvesting 415.6 58.9Cotton 73.2 10.4Vegetables 132.0 18.7Beans 18.8 2.7Tomatoes 26.4 3.7Potatoes 15.8 2.2Other vegetables 71.1 10.1Other crops 78.3 11.1
Activity unspecified 73.6 10.4
a From Farm Labor Developments, U.S. Department of Labor, January1965.
b Average of 15th of month employment.
tained from physical scientists at various land-grant colleges, andfrom USDA personnel in Washington, D.C., and Beltsville, Mary-land. For each major crop, questions such as the following wereasked:
1. What new technologies are available and will become availablewithin the next 10 years in the production of a given commodity?
2. What is the likelihood of their adoption?3. If adopted, what effects will there be on future farm size, out-
put, and man-hours?4. What type of management will be required for the adoption of
the new technology?Based on the answers, estimates were made of the savings in labor
that would result from bringing present practices up to r otentials.Some considerations not taken account of in the potentials couldmake the estimated labor changes conservative; other considerationscould make them optimistic. Not all operators will adopt them even if

46 TOLLEY AND FARMER
the technologies are profitable. The profitability of some of the newerpractices depends on size of operation, which may be limited by landor capital availability. However, the net effect of any neglected con-siderations probably is to make the estimated labor changes conserva-tive. All the potential technologies of this study are now physicallyoperational. Research has shown many of them to be profitable.Some were found in the survey to be already in use by some farmers.Within 10 years new technologies not now anticipated may be devel-oped and become available.
Table 5 compares demand projections with the potential improve-
Table 5 Potential Demand and Labor Coefficient Changes,1964 to 1975-80
Commodity
Percentage Shiftin Demand
PotentialPercentageChange in
LaborCoefficient1975 1980
DairyNew York +25 +37 82Wisconsin 75
CattleIowa +32 +49 56
HogIllinois +30 +47 54
CottonNorth and South Carolina
Coastal Plain +21 +32 91Texas 54
WheatKansas +17 +25 23
Feed grainsIowa +16 +24 50 aIllinois 41 bIllinois 37Nebraska 22 dTexas 28 ea Corn on Iowa cattle farms. b Illinois cash corn. C Corn on Illinois hog
farms. d Nebraska corn practices. e Sorghum on Texas cotton farms.
ment in the average labor coefficient if all farmers were to use thebest technology known today. A greater decline in the labor coeffi-

FARM LABOR ADJUSTMENTS 47
cient than increase in demand implies that to equate supply anddemand it will be necessary for less labor to be used. Thus by glanc-ing down the table we can see where the biggest pressures to ejectlabor from agriculture are likely to occur. More will be said about theadjustments accompanying this ejection later in this chapter.
The 75 to 80 percent decline in the labor coefficient for dairy prac-tices comes roughly equally from three sources: automated feeding,more highly mechanized milking systems, and increase in milk yieldsper cow. In accounting for the 56 percent decline in the labor coeffi-cient for cattle, going to fully automative feeding is about three timesas important as increased average weights per animal. The decline inlabor coefficient in hogs is due about equally to the possibility of de-veloping fully automated feeding and more efficient cleaning prac-tices.
The overwhelmingly important consideration accounting for thelarge potential declines in labor coefficients for cotton is use of herbi-cides reducing need for chopping and hoeing labor. The projectedpotential decrease in labor coefficient for wheat is due about equallyto use of larger equipment and to increased yields per acre. These twofactors also account for the potential decline of the labor coefficientfor feed grains.
The results for cotton are dramatic but largely a continuation ofwhat we have been witnessing for several years. The more seriousportent for policy purposes may be the results for dairying. The im-plication is that even allowing for substantial increases in demand,perhaps a 50 percent reduction in labor will be necessary to equatesupply and demand.
Insofar as the reduction in labor input can be achieved throughusing less hired labor, production control policy problems will beeased. It is when operator labor is squeezed that particularly difficultproblems are encountered, as operators attempt to remain in businesscompeting with one another. The full analysis of the implications ofthese projections for adjustment problems has not yet been com-pleted. The considerations entering into this analysis may be brieflyreviewed because they throw light on how the nature of coming ad-justment problems is importantly related to potential changes in laborcoefficients.
Concern with adjustment requires attention to amounts of man-

48 TOLLEY AND FARMER
hours supplied by operator labor, other family labor, and hired labor.It will be assumed that the number of farmers who at the present timehave a basic farm production unit large enough to adopt the potentialtechniques will adopt them within the next few years. Other operatorswith below optimum production size units will have to wait to consol-idate their holdings by taking over production units of retiringoperators until their production units are increased to the size whereit will be economically feasible for the adoption to occur.
The following assumptions are important in the adjustment proc-ess:
1. On farms where operator and/or operator-family labor performmost of the work except in peak seasons, it is assumed that farmersadopting the new technologies will eliminate practically all seasonalhired labor.
2. On farms where operator and year-round hired laborers do allthe work, there will be either an enlargement in the overall farmingoperation and retention of some of the hired laborers or the hiredlaborers will be released and the size of operations kept about thesame.
3. On farms with the operator doing all the work, the adoption ofnew technologies will allow for farm unit(s) expansion.
Shifts in product supply curves will not be as great as suggested byconsidering only the actual changes in the labor coefficient. Even inthe absence of supply-demand equilibration, the actual change inlabor coefficients results partly from a downward shift in labor de-mand and partly from an increase in output produced by the remain-ing labor. The downward shifts in demand for labor take the form ofless hired labor, less family work, and reduced hours worked by theoperator. To estimate the actual change in supply of farm productsaccompanying the actual change in the labor coefficient in the ab-sence of feedback, we need to separate the two effects on the laborcoefficient.
On one hand, if adjustment to new technologies took the formcompletely of shifts in farm labor demand, they would lead to no in-crease in the supply of farm products. On the other hand, if therewere no downward shifts in labor demand associated with adoptionof the new technologies, there would be an increase in supply exactly

FARM LABOR ADJUSTMENTS 49
inversely proportional to the change in the labor coefficients. Realitymay vary between these two extremes. The next step, then, is to sepa-rate the downward labor demand shifts from upward commoditysupply shifts accompanying changes in labor coefficients, in order tocompare commodity supply with future commodity demand.
The difference between prospective supply and demand is impetusto feedback leading to product or factor market equilibrations thatwill make future amount supplied equal to future amount demanded.In the absence of government programs, product prices would changein response to supply-demand divergences. This would affect supplythrough interrelated changes in farm resources devoted to particularenterprises, change in the number of farms and possible effects on therate of adoption of technology itself. For instance, a change in prod-uct prices may affect the profitability of adopting a new technology.As another example, if number of farms is affected, then availabilityof factors for expansion will be affected and so may change the adop-tion of technologies which depend on scale. With government pro-grams, a similar set of interrelated equilibrations is to be expectedresulting from changes in factor availabilities or marketing quotasaccompanying policy attempts to keep amounts produced approxi-mately equal to amounts demanded.
The analysis above underscores the fact that there are many differ-ent manpower-related problems in agriculture, the major ones havingtheir roots in technological change. How these impinge depend on themanagerial and employment status of workers and on the skill selec-tivity of technological changes. The basic similarities between themanpower problems associated with agriculture and those of the restof the nation have not been adequately recognized. They are of onepiece. As in the rest of the economy, rapid technological changes ofthe last few decades have been displacing unskilled workers and per-sons of lower managerial ability. Furthermore, the adjustment proc-esses and problems have been similar in that hired labor has beendirectly displaced whereas persons in entrepreneurial positions havebeen able to hang on, barely making a living, long after it is clear thatthere is no place for them in the new technologies, for which theyhave neither the managerial aptitudes nor the hope of acquiring thenecessary resources. Thus the proprietor of the corner grocery store,

50 TOLLEY AND FARMER
the family fisherman, and the operator of the small farm all findthemselves in similar circumstances.
Two manpower policy problems of particular current importancemay be considered. One is related to hired workers, the other to self-employed farm operators. Both are policy problems associated withhuman resource adjustment to scientific advances in productionmethods.
First, consider the impacts of minimum wage legislation for hiredfarm labor. We do not have precise estimates of these impacts, but wedo have some definite views about the need for obtaining estimates.Too often the impacts are treated as a closed issue. On the one hand,some consider it obvious that the only important effects of a mini-mum wage will be to throw persons out of work and to result in lowerwages of those not covered. On the other hand, there are those whoconsider only the increased incomes of covered workers.
A question to be researched is: How many workers will be dis-placed from industries covered by a minimum wage? To answer thisquestion requires recognizing the competition of the hired workers. Infarming, hired-worker production in one region is competing withthat of hired workers in other regions and with that of family farmworkers. It is well known that hired farm wage rates vary markedlyamong regions and are lowest in the South. This fact gives clues as towhere the major impact of a minimum wage would be and provides astarting point for analyzing the impacts in more detail. The elim-inatability of hired farm labor from the production process dependson the substitutability of other inputs for labor. A "smootit produc-tion function" assumption is likely to be misleading. It may be betterto think, first, of readily available peasures that can be taken toeliminate labor, such as the use of herbicides to replace preharvestingcotton labor. Below a given wage level, a cotton grower will not findit profitable to use herbicides; whereas if wages are raised above acertain critical level, he may have an incentive to eliminate virtuallyall the labor used in controllirtg weeds. Second, there are ways ofeliminating labor that are developable in response to pronounced in-creases in incentives to reduce the wage bill. Research and promotionof various mechanical means of carrying out crop activities are exam-ples.

FARM LABOR ADJUSTMENTS 51
The next question is: What happens to any workers who are dis-placed because of a minimum wage? This unanswered question infact depends on whether workers find alternative employment and, ifso, in what kind of job. If hired farm workers are geographically oroccupationally immobile, as many of them are, then in the absence ofa minimum wage they may be in low productivity jobs with earningsbelow what they could earn in alternative employment. Introductionof a minimum wage could induce them to move to jobs where theirincome is higher and where their contribution to the production of thenation is higher. We believe that empirical investigation related to themobility of labor will be required to ascertain what the full effects ofminimum wages are.
A researchable question requiring the cooperation of sociologistsand economists is particularly applicable to migratory farm workers:What are the social costs of the hired farm worker's way of life? Ananswer to this question would give clues as to how much it is worth tofoster research that will eliminate labor, particularly seasonal labor,from agricultural production processes.
Finally, consider a manpower problem related to family farmoperators which is less well understood than are hired farm laborproblems. This has to do with the so-called boxed-in farm operators.Thee are farmers on small units who have established themselves ina way of lift; which has become technologically outmoded. Researchbased on census information and farm management analysis leaveslittle doubt that there are at least a million such farmers. Possibly thenumber is as high as 2 millionwhich amounts to the great majorityof farmers. Many of these are retiring each year, but many are alsobeing added each year because of the continued march of technologi-cal potentials. Boxed-in farmers have relatively low earnings and arebeyond the age where migration normally occurs. There is more andmore recognition that it is quite unrealistic to expect these persons tomake substantial geographical or occupational adjustments.
What policy alternatives are to be considered for these farmerswho are producing little of value to themselves or to the country? Thesolution will almost certainly have to be one that is largely "in place."Doing nothing implies a continuation of waste of human resources.Dole payments could better the lot of these families in material terms

52 TOLLEY AND FARMER
but would do little for their, self- respect or for the nation at large. Aview gaining increasing acceptance is that more intense efforts shouldbe made to provide productive employment in private and public ac-tivities within commuting distance of rural homes. Aside from tradi-tional kinds of public works, this work could include highway andpark beautification and subprofessional employment, particularly inhealth occupations.

[4]
National Employment, Skills,
and Earnings of Farm LaborTHEODORE W. SCHULTZ
The nation's farm labor takes on relevance as a problem. By way ofpreface, what is the problem and what are the reasons for our con-cern? The earnings of farm labor per person, hired and self-employed, are in fact very low compared to those of nonfarm labor.But why are they so low?
Is the central problem an inefficient labor market as it serves thefarm labor force? If true, presumably the low earnings of farm laborcould be raised by some appreciable amount by developing a moreefficient labor market. I doubt, however, that this is the key problemwhen allowance is made for the periodic slackness in the aggregatedemand for labor in the United States economy, for the cost ofacquiring information about job opportunities, and for the damagethat has been done to skills by the long-standing discrimination in theschooling and training of persons in the farm labor force.
Is the problem predominantly that of gains in agricultural pro-ductivity? Here presumably the low earnings of farm labor are re-vealed in "structural maladjustments" that are caused by these gainsin agricultural productivity, along with the further presumption that itis beyond the capacity of a normal labor market to correct such"structural maladjustments." This aspect of the dynamics of our eco-nomic growth is the source of some of the difficulty that we face here,but it is not, in my judgment, the key problem.
Turning now to still another question: Is the central problemcaused by slackness in the aggregate demand for labor? An aflirma-
THEODORE W. SCHULTZ is Charles M. Hutchinson Distinguished Service Pro-fessor of Economics at the University of Chicago.

54 THEODORE W. SCHULTZ
tivr3 answer would rest on the proposition that the earnings of thefarm labor force are reduced more than are the earnings of the non-farm labor force by such slack in the aggregate demand for labor. Intracing the effects of periodic movement in unemployment on theearnings of farm labor, I would rate this as the first half of the centralproblem. In this context, I look upon the age and skills (that is,schooling, experience, and training) of the farm labor force, for allpractical purposes, as given in the short run. Last, then: Are thecapabilities of the farm labor force the second half of the centralproblem? Without belaboring the economic logic and the relevantattributes of farm labor, let me at this point simply assert the proposi-tion that the primary reason the earnings of the farm labor force areso low is to be found in the lack of skills that the economy demandsand that this lack would keep these earnings relatively low, eventhough the economy were fully employed.
There are other issues, some of which overlap or are integral partsof the four preceding problems. Is there all too little mobility for anefficient functioning of this part of the labor market? Hathawayand Perkins 1 show that there is much more shuttling of laborbetween the farm and nonfarm sectors than any of us had realized,but the net out movement is thwarted by unemployment and bya lack of marketable skills. The range of occupations is narrow,especially for farm laborers seeking employment consisting mainlyof the jobs that are least desirable in pay and in prospects for advance-ment in the smaller cities. There is a closely related question, namely:Is the response of farm labor to job opportunities in the nonfarm
sector slow, sluggish, and thus subject to long lags? The inferenceto be drawn from the work of Hathaway and Perkins is in generalotherwise. The difficulty, so it would appear, is not in preferences thatinhibit the response of farm labor or in not trying to satisfy thesepreferences, but predominantly in the paucity of job opportunitiesfor the low skills that in general characterize farm workers seekingnonfarm employment.
Could it be that farm wages are at fault? They should be higher if1 Brian Perkins and Dale Hathaway, The Movement of Labor between Farmand Nonfarm Jobs, Research Bulletin 13, Michigan State University, EastLansing, 1966.

NATIONAL EMPLOYMENT, SKILLS, AND EARNINGS 55
they undervalue the economic productivity of such labor in farming.It could be that farm wages lag over time, relative to the rise in realwages generally, and that particular farmers, that is, those whooperate large farms and who employ a large number of farm workers,pay less than the going wage and less than the economic productivityof the farm workers they hire. Consider first the rise in wages in man-ufacturing. We observe that from 1958 to the present manufacturingwages have risen about a fourth, in current dollars, and that over alonger period, say since 1939, hourly farm wages have increased morethan fivefold (17 to 93 cents), whereas wages in manufacturing haveincreased a bit more than fourfold ($0.63 to $2.62.) 2 Consider nextwho pays the highest wages; we find that, in general, the larger thefarm the higher the farm wages. Consider also whether farm wagesare sticky and subject to monopolistic determination by farm employ-ers. I know of no firm evidence that would support this characterizationof wage determination within agriculture. On the contrary, it is prob-ably one of the more purely competitive parts of the entire labormarket. This view is not inconsistent with the fact that the availabilityof relatively cheap foreign labor for farm work has a measurable de-pressing effect on farm wages in the areas where such labor is em-ployed. One of the strong implications of this view of farm wages is thatlegislation to establish minimum wages throughout agriculture is aninappropriate public approach to increase the earnings of the rank andfile of all farm workers. Although it would benefit some, it would leaveothers much worse off, and in the process it would increase rather thanreduce the poverty among the families of this part of the farm popula-tion. But it should also be made clear that for the self-employed partof the farm labor force, that is, farm operators, there are serious ob-stacles when it comes to leaving their farms in order to take non-farm jobs.
I take it to be true that no one is so brash as to apply the "guide-lines" to farm labor. But should not labor in agriculture receive aspecial bonus in view of the very large gains in farm output per man-hour, which increased 37 percent from 1958 to 1964, whereas farm
The average gross hourly earnings in agriculture were $0.166 in 1939 and$0.929 for July 1965, and those of all manufacturing $0.627 and $2.62 respect-ively.

56 THEODORE W. SCHULTZ
wages in current dollars rose only a fourth? Yet a longer view mightsuggest caution: During the period from 1939 to 1964 this output permanhour in agriculture rose fourfold and the hourly farm wage in-creased more than fivefold.3 I shall return to the problem associatedwith the rapid gains in agricultural productivity.
The implications of this preface are fairly obvious. The centralproblem is not that the amount of mobility between the farm andnonfarm sectors is unduly small, or that farm wages are sticky andsubject to serious imperfections caused by monopoly power exercisedby the farmers who employ farm labor and thereby impair the effi-cient functioning of the labor market. Nor is it predominantly a prob-lem of structural maladjustments arising out of the rapid gains inagricultural productivity which are beyond the reach of the labormarket. The problem which should be given highest priority has twofundamental Darts, that is, the slack in aggregate demand for laborsince 1957, and the low level of marketable skills of the farm laborforce generally. The first part of the problem is at this juncture fairlyclose to being resolved, at least until the rate of unemployment beginsto rise once again. The second part is acutely upon us as the unre-solved problem that matters most.
I now turn to a consideration of the state of our knowledge and itsrelevance as we seek solutions to the farm labor problem.
ECONOMIC KNOWLEDGEAND ITS RELEVANCE
Growth and Productivity. We know that our type of economicgrowth increases the demand for nonfarm products and servicesmuch more than for farm products and services. We know also thatthe type of productivity gains we are experiencing in agriculture re-duces the demand for farm labor. Although as history it is still allvery recent, we have learned to accept the fact that an advancedeconomy can increase its agricultural output and at the same time de-
The index of farm output per manhour was 35 in 1939 and 141 in 1964; andgross hourly earnings were $0.166 and $0.904 respectively in current dollars,not in terms of real wages.

NATIONAL EMPLOYMENT, SKILLS, AND EARNINGS 57
crease the absolute size of the farm labor force. Nor is this develop-ment any longer unique to the United States, with our 60 percentincrease in farm output since 1940 along with a reduction by one-halfof the farm labor force; a similar development has characterized mostof the countries of western Europe since World War II. Has this de-velopment spent itself? The answer is no. On the contrary, there arecompelling reasons for believing it will continue for a decade andlonger; for that matter, as long as we can project the knowledge nowavailable to us. As to relevance, I doubt that there is much point inour trying to make projections of the more distant future changes in"agricultural technology" because of the many unknowns that areconcealed from us when it comes to determining the precise sources ofthe additional production that is loosely attributed to "technologicalchange" and projections also of prospective changes 1n the prices ofproducts and factors.Excess Supply of Farm Labor. We know also that the supply oflabor in agriculture is excessively large. Studies by Edward Schuh 4give us some useful estimates of accumulated excess supply after themid-fifties. The supply would be too large even if we had had fullemployment since 1957, and if our federal farm programs had notbeen so biased in favor of income fi am farm property, and if we hadtaken steps to reduce the cost to farm people of acquiring informationabout nonfarm job opportunities because, even so, there would belags in adjusting to the persistent and rapid shifts in the demands forlabor. The exact amount of the excess supply is not of much rele-vance, for there can be no doubt that it is presently very large. Whatmatters is how to cope with it, how to develop institutions and pro-grams to minimize the excess supply at the least cost possible.National Employment. We could no doubt forget about nationalunemployment with impunity if the movements in unemployment weresmall, ranging between 4 and 5 percent, and if, in addition, our farmlabor, hired and self-employed, were all white with a tolerably goodhigh school education, married, with $5,000 of net assets, and none ofthem were residing in the South and West North Central regions! But
G. Edward Schuh, "The Long-Run Equilibrium in the Hired Farm LaborForce: History and Implications," Journal of Farm Economics, Vol. XLIII,December 1961, pp. 1338-39.

58 THEODORE W. SCHULTZ
to proceed on these two conditional propositions would be the heightof irresponsibility.
Hathaway's estimates (Chapter 5 of this book) are very instruc-tive, and it behooves us to use them to the utmost while we awaitstudies on other relevant aspects of national employment. The maininference from his studies supports the large shift in the net additions tothe farm labor force associated with the movement in the national rateof unemployment that occurred during the latter half of the fifties. In1956-57, the third year during which the annual rate of unemploy-ment had been 4.3 percent or slightly less, the net decline in the "be-ginning farm labor force" was 4.9 percent. The rate of unemploymentthen jumped to 6.8 percent in 1958, and it was still at 5.5 percent in1959, and as a consequence the "beginning farm labor force" notonly ceased to decline but also reversed itself and rose by 2.1percent--a shift of 7 percentage points. A rise of 1.2 percentagepoints in unemployment resulted in a net change of 7 percentagepoints (adverse) in the "beginning farm labor force."
Beyond this, unfortunately, we are still dependent on general im-pressions and a few clues derived from economic logic and from datacollected for purposes other than to help resolve the problem at hand.I find it difficult to understand why our knowledge of the effects ofmovements in the rate of national unemployment on farm labor is soinadequate. Why has it suffered so much from neglect in view of theimportance of the problem? Why has there been virtually no eco-nomic analysis bearing directly on this issue in the Departments ofAgriculture and Labor and by agricultural economists in our land-grant colleges of agriculture, allowing for a few exceptions? My an-swer would be that this gross neglect is the price we have paid for theoveremphasis that the USDA has placed on farm commodities andhigh price supports, and for the overspecialization of land-grant agri-cultural economists on narrowly conceived production economics offarms. The failure on the part of economists' in the Department ofLabor in this respect baffles me no end. The belief that minimumwages throughout agriculture are the cure-all for the low earnings offarm labor is a misconception. Nor are training programs likely to beeffective, despite their merits in other respects, unless the aggregate

NATIONAL EMPLOYMENT, SKILLS, AND EARNINGS 59
demand for labor is maintained at the level we are now approaching.I feel sure that a slack in the national demand for labor not only
reduces the incentives to mobility from our farms but also enlargesthe practice of discrimination. My colleague, Harry G. Johnson,5points out, and in my judgment correctly, that slack in the labormarket reduces measurably the "incentives to change occupation, toeducate oneself, or to move geographically" because of the risk ofbeing unemployed afterwards. Also, he writes:
When jobs are scarce and applicants are plentiful, so jobs have tobe rationed, it is inevitable that the rationing will be done accord-ing to social standards of deservingnessor more bluntly, by dis-crimination. Color, sex, age, inexperience, and inferior educa-tional attainment are obvious characteristics that can serve as ameans of automatically excluding individuals from the competi-tion for scarce jobs. Moreover, in times of job scarcity those fa-vored by discrimination will be led by collective self-interest toinsist on its enforcement, to reduce their own exposure to the riskof unemployment. It is no accident that unemployment falls moreheavily on Negroes than on white males, and more heavily on theyoung than on married men with families.
It is probably true that only Negroes are more vulnerable thanfarm labor to this rationing of jobs, that is, to such additional job dis-crimination caused by a slack in the national demand for 11.)or. Farmlabor is vulnerable on each of the following counts: few years ofschooling, often poor in quality, few skills acquired through nonfarmlabor experiences, and a narrow range of poor occupations, which arestagnant or even declining. Since there are also Negroes in the farmlabor force, they bear the heaviest burden of all when there is a slackin the national demand for labor.Economics of Negro Employment in Agriculture. One searches invain for studies of the job market for Negroes who are in the farmlabor force. The demand and supply factors that determine their eco-nomic lot are largely concealed in the realm of statistics. An excep-tion is James Maddox's forthcoming study, Economic Development
5 From his paper, "Unemployment and Poverty," Poverty Amid Affluence.edited by Leo Fishman, Yale University Press, 1966.

60 THEODORE W. SCHULTZ
and Manpower Requirements in the South, by the Twentieth CenturyFund, for it breaks new ground. A few Negroes are farmers who arequietly abandoning their unproductive farms. But most Negroes whoare still identified with agriculture are wage workers, and over two-fifths of these are women. Bowles 6 credits these women with 25 mil-lion days of farm work in 1964. Their earnings are pitifully small,$4.00 per day for farm work; but they are the one class of farmworkers who nevertheless earn more per day while working on farmsthan they earn at nonfarm work.? Even though no studies have beenmade of the economics of the jobs held by Negro females in agricul-ture, no great amount of economic insight is required to predict whatwould happen to these farm jobs in the event that the present level ofminimum wages were applied to them. Nonwhite males account for afourth of all male farm wage workers, but for them, too, we areignorant of the underlying demand and supply factors at work. TheNegro farm operators who are left are concealed among the 245,000nonwhite farm operators as of 1960, compared to 603,000 male and445,000 female nonwhite wage workers as of 1964. Negroes in theSouth in 1940 accounted for 23 percent, but by 1959 for only 16.5percent, of all farm operators in that region. The average value of thefarms they operated was only one-fourth that of farms with whiteoperators, $6,200 and $25,400 respectively.
What are the underlying economic factors that Negroes in thefarm labor force must face? In my judgment they benefited more thanany other class of workers from the strong labor market that pre-vailed from the early forties until 1957, and since then they havebeen set back more. The number of Negro farm operators, however,declined more rapidly than the number of whites after 1957 becauseNegro operators find it more difficult than whites to acquire the in-creasing amount of capital required to farm efficiently, and becauseour federal farm programs entail particular adverse economic effectsthat are in general more telling upon Negro than upon white farmoperators.
The low skills and the small earnings of Negroes in the farm labor
Gladys K. Bowles, The Hired Farm Working Force of 1964, AgriculturalEconomic Report 82, USDA, Table 5.
71bid., Table 7.

NATIONAL EMPLOYMENT, SKILLS, AND EARNINGS 61
force are both predominantly a legacy of generations of social andpolitical discrimination.° American Negroes have long been sup-pressed in agriculture. The values and institutions of white people inrural farm communities where there are Negroes are still strong bar-riers to the social advance and the political representation of Negroesand to their acquiring access to valuable skills on a par with thoseavailable to white people. The USDA, also, has a long record of treat-ing Negroes as second class citizens.9 In sharp contrast, our centralcities have been preparing the stage despite all manner of stresses !Indstrains so that Negroes can become first class citizens. Future his-torians will no doubt discover that Negroes, like Jews, have found incities protection and opportunity denied to them in the countryside.
Consider for a moment the preferences of Negroes. Given their cul-tural values which summarize generations of maltreatment as workersin agriculture, what is their job preference? I am convinced that forAmerican Negroes agriculture is an inferior occupation. What I meanby "inferior" here can be expressed in economic terms. SupposeNegroes had a real choice, supported by wholly dependable informa-tion, between jobs in agriculture and jobs in other sectors which wouldgive them the same level of real earnings. They would prefer theformer to the latter. These cultural values are deeply rooted inthe history of slavery and in the failure of agricultural institutionssince emancipation to grant them social status, human dignity, civilrights, schooling, and economic opportunity.1° In their desire to getout of agriculture, Negroes have one advantage, namely, most ofthose in agriculture are young people. As of March 1964, Negroes in
I draw here directly upon my paper, "Urban Developments and Policy Im-plications for Agriculture," Investment in Human Capital Series, Paper 65:08,University of Chicago, September 1, 1965.U.S. Commission on Civil Rights, Equal Opportunity in Farm Programs:An Appraisal of Services Rendered by Agencies of the United States Depart-ment of Agriculture, Washington, D. C., 1965. The Secretary of Agriculture,Orville L. Freeman, under date of June 17, 1965, submitted to the President areport of substantial actual progress on the part of the USDA in correctingsome of its discriminatory practices.
" Closely akin is the low social status of agriculture in many parts of theworld. In the Caribbean, for example, agriculture is in general rated very lowas an occupation, and this anthropologists attribute predominantly to thecultural legacy of slavery.

62 THEODORE W. SCHULTZ
the farm population had a median age of 17.6 years, whereas that ofwhites was 31.9 years.11
With respect to the occupational and regional distribution ofNegroes, the economy will not approach an economic equilibrium 12until virtually all Negroes have left agriculture and most of them havemigrated and found work outside the Old South, on a par with themigration out of agriculture during recent decades. Paramount in thistransformation is a strong, tight national labor market.
INVESTMENT IN FARM PEOPLE
I have noted that lack of valuable skills is a fundamental part of thefarm labor problem. The investment approach is an appropriate andefficient way to enhance the earning capacity of farm labor. Here,too, what we know and its relevance require attention, but the prom-ise and importance of this approach lead me to give it a separateheading.
Let me build on full employment as the foundation. Suppose anaggregate demand for labor with little or no slack in the market weremaintained for the next five years and longer, the earnings of mostpersons who are now classified as being in the farm labor force,whether hired or self-employed, would rise relatively, but they wouldstill continue to remain relatively low for the simple reason that themarketable skills of farm people are in general far below par. Let merepeat also that unless there is such an aggregate demand, that is,tight employment, the necessary incentives to acquire the experience,training and even schooling which are the sources of the more valu-able skills will be blunted, thwarted, and even nullified.Definition of Skills. The concept of skills in this context includes
Bureau of the Census, Population Characteristics, Negro Population, March1964, Series P-20, No. 142, October 11, 1965, Table 1.
" I do not wish to imply by "economic equilibrium" that there exists a singleonce-and-for-all adjustment. As the economy adjusts, additional developmentsoccur which then call for additional and perhaps quite different adjustments.Thus vdjustment is a process and not a discrete move in response to a partic-ular existing maladjustment. The search here is for policies, institutions, andmechanisms which will be efficient in producing the adjustment process.

NATIONAL EMPLOYMENT, SKILLS, AND EARNINGS 63
all human capabilities that are valuable in activities pertaining to pro-duction. Thus capabilities that enter into consumption are omitted,although as a rule they, too, improve as a consequence of investmentactivities that increase the productive skills of a people. The skillsthat contribute to production are partly innate (inherited) and partlyacquired; our concern here is restricted to those that are acquired.Their economic value is determined by demand for and supply ofskills. It should be noted also that particular skills, although yearshave been spent in acquiring them, may become a drug on the mar-ket. The demand for farming skills is contracting, and these particularskills are in excess supply. Moreover, our type of economic growthcauses all manner of skills to become obsolete, a process which hasgiven rise to the statement that most persons during their workingyears face the prospect of changing occupations two or more times.Then too, the value of a skill depends in part on its location; that is,a peson with a particular skill must not only find where that skill isin demand but he must also be prepared to work at that location.Thus an essential part of the investment in skills is the cost of acquir-ing job information and the cost of migrating to the place where theappropriate job is to be had." Since acquired skills can be ranked ac-cording to their economic value, it will be convenient to refer to thosethat fetch relatively high earnings as high skills and, conversely, tothose that are associated with relatively low earnings as low skills. Bythis standard, as already noted, marketable skills of most Negroesrank very low, and so do the skills of most persons in the farm laborforce regardless of color.Functional Distribution of Income. When it comes to integratingfunctional and personal distribution of income, economic theory isnot helpful. Even so we know some salient features underlying partic-ular changes over time in the distribution of income. It becomes moreunequal when relatively large numbers of young workers enter uponemployment, when the proportion of women in the labor force in-creases, and when cyclical unemployment is on the rise. It becomesmore equal as an economy moves toward a d maintains a lower rateof unemployment than formerly, as the cost of mobility, including job
'See special supplement of the Journal of Political Economy, "Investmentin Human Beings," 'Vol. 70, October 1962, papers by Larry A. Sjaastad andGeorge J. Stigler.

64 THEODORE W. SCHULTZ
information, falls, and of major importance as the schooling of thelabor force rises. Increases in on-the-job training presumably wouldalso reduce the inequality of the personal distribution of income.
By all accounts the functional share of income from property hasbeen declining." The stock of tangible reproducible wealth has notincreased at so high a rate as the acquired abilities of workers. Differ-ences in the private rates of return have favored investment in humancapital. True, the relative decline in income from material wealthwould undoubtedly have been somewhat less during the recent pasthad the tax on corporate income remained at the prewar level. Mean-while, what has been happening to the personal distribution of wealthholdings? It is hard to believe that laborers have been acquiringa substantially larger share of his wealth and that it is the source thathas brought about the observed rise in their income. The stock ofwe h represented by houses may be an exception, in the sense that ithas been an attractive investment for many families of laborers whilethe economy has been adjusting to the favorable tax treatment thathome ownership has been receiving. But homes owned by familieswith less than $3,000 of income in 1962 had a mean value of only$3,750. Any plausible increase in the net worth of low-income work-ers since the mid-thirties could account for only a very small part ofthe decline in the proportion of families falling below, say, $3,000.
Meanwhile, labor's functional share of national income has beenrising. The demand for workers with high skills has been increasing ata higher rate than that for workers with low skills. The incentive to in-crease skills has been strong and the supply of skills has been re-sponding for people have been investing much more than formerly toincrease their skills. But why has the demand for skills been shiftingupward in this manner? In my judgment it has come about mainly asa consequence of the dynamic process in which skills along with newuseful knowledge gradually have been increasing national income.At the same time the resulting rise in per capita income of con-sumers has altered the mix of products and services demanded in
" Here I follow closely a part of my paper, "Public Approaches to MinimizePoverty," in Poverty Amid Affluence, edited by Leo Fishman, Yale Uni-versity Press, 1966.

NATIONAL EMPLOYMENT, SKILLS, AND EARNINGS 65
such a way that the products and services requiring high skills haveincreased at a higher rate than those requiring low skills. Anotherfactor in this process has undoubtedly been the increase in the de-mand for producer durables and services by the military establish-ment, which also has been increasing the demand for high skills.Three Testable Hypotheses. In analyzing investment in humancapital, whether in farm people or in human beings in general, it isnecessary to specify, identify, and where possible estimate the magni-tude of the factors that alter the demand for and supply of productiveskills. The cost of acquiring skills and the returns from them areessential parts of the analysis. The rate of return may be positive, yetso low that the investment is not warranted either on private or publicaccount because alternative investment opportunities may be betterthan these.
Savings from income and the investment of them in response torates of return can alternatively be viewed as a process of acquiring in-come streams in response to the price(s) of the sources of theseincome streams. The latter formulation has the marked advantagethat we can straightaway apply the concepts of demand and supplyto determine the price of alternative sources of (permanent) incomestreams. An income stream can be given quantitative dimensions perunit of time, that is, a one-dollar-per-year income stream. Except forincome transfers, to obtain possession of an income stream it is nec-essary to acquire the source of that stream. These sources are valua-ble, and each income stream in this sense has a price. The price maybe high or low, and it may be rising or falling over time.
The underlying assumptions are the following: The sources ofincome streams are acquired at particular prices; these prices changeover time; and people respond to changes in these prices subject tothe restraints of the capital market, their preferences and capacity tosave, the effects of taxes and subsidies and of discrimination with re-spect to employment and investment. We can then postulate a dy-namic process and derive the following comp! mentary hypothesesthat pertain to our type of economic growth of recent decades."
Here I follow closely my paper, "Investing in Poor People: An Economist'sView," American Economic Review, Vol. 60, May 1965, pp. 510-20.

66 THEODORE W. SCHULTZ
,1. The price of the sources of income streams that represent theacquired human capabilities of value in economic endeavor declinedduring this period relative to the price of material forms.
2. In responding to this change in the relative prices of these twosources of income the rate of investment in human sources rose dur-ing this period relative to that in material sources.
3. The increase in the investment in human sources relative to theinvestment in nonhuman sources has increased earnings relative toproperty income, and the more equal distribution of investment inmen has tended to equalize earnings among human agents.
These are testable hypotheses, which appear to win support from anumber of new studies. The private rates of return to schooling sup-port the first. My attempt to test the second hypothesis, admittedly avery rough approximation of the increases in the last two of thesestocks, indicates for the period between 1929 and 1957 that the stockof reproducible tangible wealth increased at an annual rate of about 2percent whereas that of education in the labor force rose at a rate of4 percent, and that of on-the-job training of males in the labor force atover 5 percent. The marked increase in the proportion of the laborforce that has attended .high school and college is one of the develop-ments in support of the third hypothesis.
The long-run changes in the supply of the sources of incomestreams may be explored either in terms of adjustments to shiics inthe demand or in terms of factors which play a fairly independentrole. The adjustment process in which demand and supply inter-act is the core of the economic behavior underlying the formulation ofthe second hypothesis here advanced. The major "independent" factorsaffecting the supply are as follows: research and development activi-ties and the acquisition of a part of the resulting useful knowledge bypeople, the mobility (immobility) of labor in leaving declining indus-tries and occupations, the amount and distribution of public invest-ment in schooling, and, closely related, the discrimination againstNegroes, rural farm children, and others with respect to schooling.Implications. The first and most general implication is that thereal earnings of workers have been rising because the demand forhigh skills has been increasing relative to that for low skills and be-cause workers have been acquiring the more valuable skills.

NATIONAL EMPLOYMENT, SKILLS, AND EARNINGS 67
Another implication is that the earnings of particular classes ofworkers, including farm workers, are relatively low because the de-mand for their skills has been declining. Although workers generallyhave been responding to increases in the demands for high skills,workers in the farm labor force have not responded. The reasons fortheir lack of response are fairly obvious: unemployment, the adverseincidences of economic growth on some sectors, inadequate informa-tion, and a lack of opportunity to invest in acquiring the more valu-able skills because of discrimination and the restraints on the capitalmarket in providing funds for this purpose. In this connection, severalof the arguments advanced earlier in this chapter are applicable andmay be summarized as follows:
I. The market for the skills that are required in agriculture haslong been depressed. The oldest members of the farm labor forcehave no real alternative but to settle for the depressed, salvage valueof the skills they possess. Concealed here is the fact that in manyfarm communities the quality of elementary and secondary schoolinghas been and continues to be far below par, and thus the oncominggeneration from these areas is ill-prepared to take advantage of thestrong market in other parts of the economy for high skills. It shouldalso be said that the vast expenditures by the federal government onbehalf of agriculture have not been used to raise the level of theseskills; on the contrary, they have been used in ways that enhance theincome from some classes of property and worsen the personaldistribution of income among farm families. Thus it should not comeas a surprise that although farm families are presently a very smallfraction of all United States families, they account for much of theobserved poverty, and that many of the families in urban areas, whoselearning capacity is very low have recently come from our farms.
2. The economic value of the skills of Negroes is lower still. Inaddition, both on our farms and in our cities, there has been and con-tinues to be much job discrimination. But most important is the lowlevel of the skills of Negroes, which is mainly a consequence of thehistory of discrimination against Negroes in schooling. Not only haveNegroes obtained fewer years of schooling, but the schooling hasbeen of very low quality, and especially so for the older Negroes inthe labor force.

68 THEODORE W. SCHULTZ
3. The South is burdened with lower earnings for work than otherregions basically for three reasons: (1) It is more dependent on agri-culture than the rest of the United States (it accounted for over 45percent of all United States farms at the time the 1959 census of agri-culture was taken); (2) the labor force in the South is more largelyNegro than in the North and West and in terms of marketable skillsthe Negroes in the South are even worse off than the Negroes in otherregions; and (3) relatively more of the whites in the labor force in theSouth have low skills than whites in other regions. In short, the Southhas been lagging seriously in providing people the opportunities to in-vest in acquiring the high skills for which the demand has beenincreasing at so rapid a rate, predominantly because of social, politi-cal, and economic discrimination adverse to poor people.Related Findings and Additional Implications. I shall refer, at last,to some recent work on the economics of education that is relevanthere.
1. In a study, Micha Gisser,16 while at Chicago, developed anapproach to estimate the "two effects of additional schooling on theeffective supply of human agents committed to farming, that is, (1)the out-migration effect reducing the supply and (2) the capabilityeffect increasing the supply." His estimates for the United States showthat both effects are substantial but that the out-migration effect isappreciably larger than the capability effect. He found that an in-crease in the level of schooling in rural farm areas of 10 percent willinduce a 6 to 7 percent additional migration out of agriculture and interms of the net effect it will raise the farm wage rate 5 percent."
2. Griliches' studies 18 to determine the sources of gains in agri-cultural productivity show that the schooling of the farm labor forceis a significant variable in determining the labor input. He found thatthe quality of this labor measured by schooling is as important as the
" Micha Gisser, "Some Implications of Schooling and the Farm Problem,"Paper 6305, Agricultural Economics Research Series, University of Chicago,July 18, 1963.
Micha Gisser, "Schooling and the Farm Problem," Econometrica, Vol. 33,No. 3, July 1965, pp. 582-92.
" Zvi Griliches, "Research Expenditures, Education, and the AggregateAgricultural Production Function," American Economic Review, Vol. 54,December 1964, pp. 961-74. Also, see his earlier studies listed under "Ref-erences" in the paper cited.
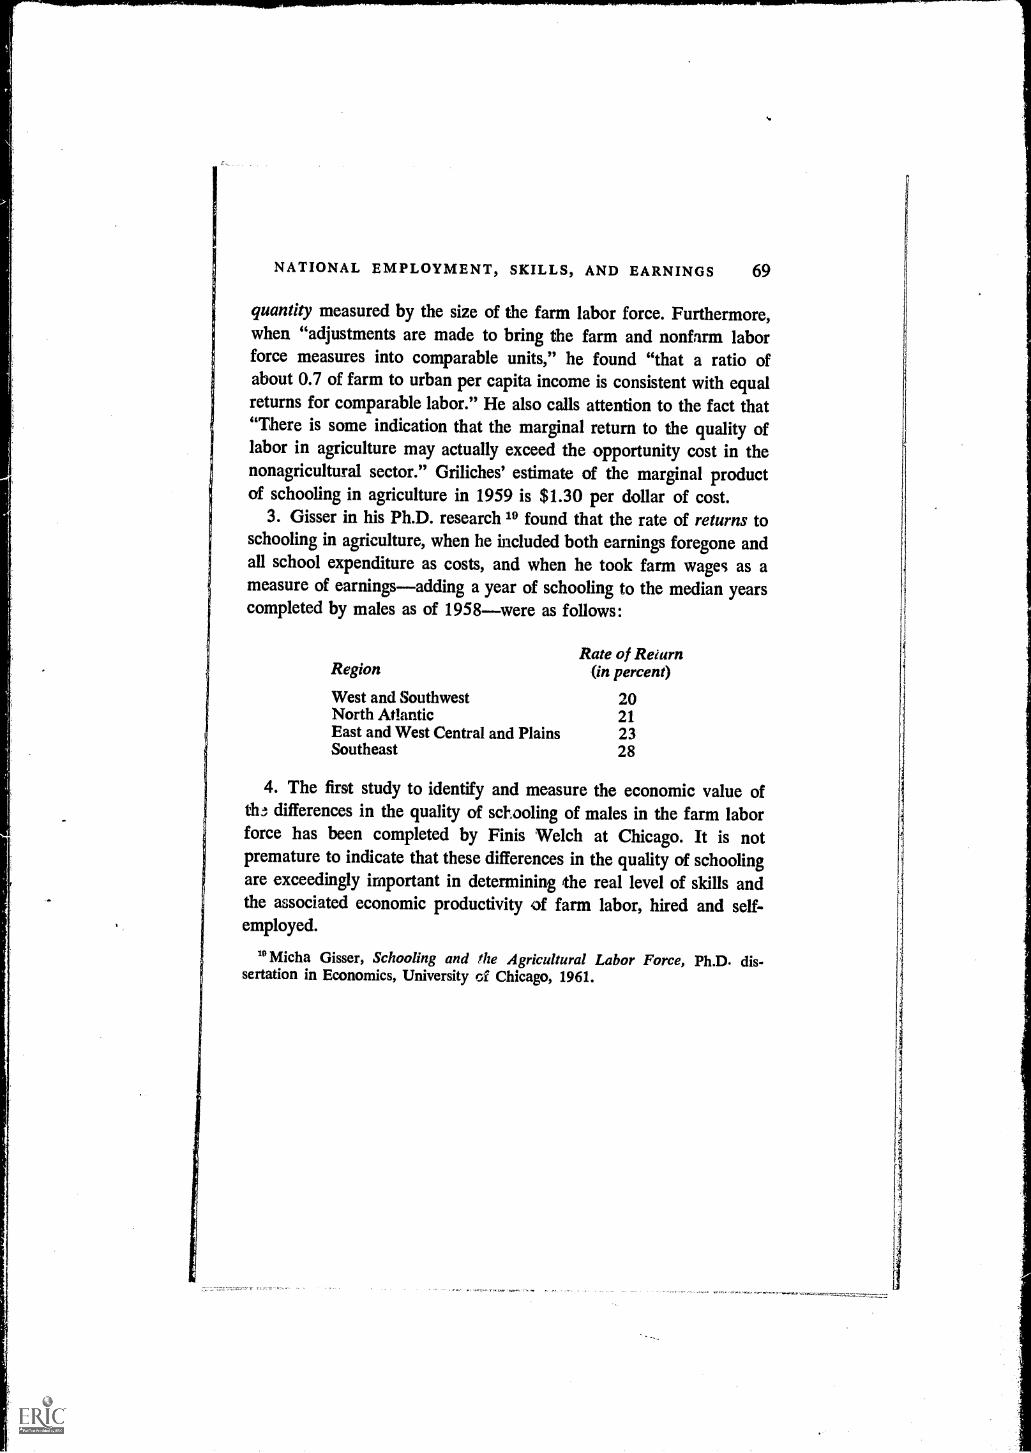
NATIONAL EMPLOYMENT, SKILLS, AND EARNINGS 69
quantity measured by the size of the farm labor force. Furthermore,when "adjustments are made to bring the farm and nonfarm laborforce measures into comparable units," he found "that a ratio ofabout 0.7 of farm to urban per capita income is consistent with equalreturns for comparable labor." He also calls attention to the fact that"There is some indication that the marginal return to the quality oflabor in agriculture may actually exceed the opportunity cost in thenonagricultural sector." Griliches' estimate of the marginal productof schooling in agriculture in 1959 is $1.30 per dollar of cost.
3. Gisser in his Ph.D. research 19 found that the rate of returns toschooling in agriculture, when he included both earnings foregone andall school expenditure as costs, and when he took farm wages as ameasure of earningsadding a year of schooling to the median yearscompleted by males as of 1958were as follows:
Rate of ReiurnRegion (in percent)
West and Southwest 20North Atlantic 21East and West Central and Plains 23Southeast 28
4. The first study to identify and measure the economic value ofth3 differences in the quality of schooling of males in the farm laborforce has been completed by Finis Welch at Chicago. It is notpremature to indicate that these differences in the quality of schoolingare exceedingly important in determining the real level of skills andthe associated economic productivity of farm labor, hired and self-employed.
"Micha Gisser, Schooling and the Agricultural Labor Force, Ph.D. dis-sertation in Economics, University of Chicago, 1961.

[5]
Occupational Mobility
from the Farm Labor ForceDALE E. HATHAWAY
The continued need for occupational mobility of farm people is evi-dent in the low return to human effort in agriculture and the futureprospects that even less labor will be needed in agriculture. Bothpoints have been well established by others. Therefore, it is enoughhere merely to point out that we need to know more about the proc-esses of occupational mobility so that we may take actions that willenable those processes to work better. While occupational mobilityobviously is occurring now and has been for the life of our country, itis also obvious that serious impediments to mobility remain, and newones may be arising. These impediments account in part for the fail-ure of the returns to labor in agriculture to rise relative to those innonagricultural pursuits.
In .his paper I shall discuss four central issues relating to occupa-tional mobility from agriculture. They are:
1. How does occupational mobility take place?2. What are the factors influencing occupational mobility of
rural people?3. How does the labor market work for rural people?4. What are the implications of the preceding issues for public and
private policy?In discussing these issues I shall draw widely upon the research of
others on the subject, and I shall deal with rural people in general
DALE E. HATHAWAY is a professor in the Department of Agricultural Eco-nomics at Michigan State University. His paper has benefited from the com-ments of Dr. Arley Waldo and W. Keith Bryant, Department of AgriculturalEconomics, University of Minnesota, and Dr. Brian Perkins, College of Agri-culture, University of Guelph.

72 DALE E. HATHAWAY
rather than limit the discussion to hired farm workers, farm opera-tors, or some other narrow category, although many illustrations willdeal with specific categories. I believe it is important to deal withrural people inasmuch as the farm labor problem cannot be realis-tically separated from the labor mobility problem of the entire ruralpopulation. To completely separate the farm work force and the rurallabor force assumes a compartmentalization within the rural laborforce that does not exist and can be misleading at times.
HOW OCCUPATIONAL MOBILITY OCCURS
One of the most important factors leading to a reduction in the farmwork force is not occupational mobility in the true sense. This is theoccupational mobility that occurs from one generation of the laborforce to the next. It typically occurs when rural young people enterthe labor force, and the difference between the retirement rate fromthe farm labor force and the rate of new entry to the farm labor forceis the most significant factor leading to a reduction in the number ofpersons employed in agriculture. Because of the relatively advancedage of the farm operator labor force the difference between retirementand entry rate will continue to be of major importance in the futurereduction of the farm operator labor force.
The hired farm work force is much younger, with a median age of25.3 years in 1964.1 Even if we exclude the casual workers (lessthan 25 days of farm work), 43 percent of the regular workers wereunder 25 years old and 58 percent were under 35 years old.2 Thus,with so few near retirement age, the difference between entrants andretirements is not going to reduce sharply the hired farm labor force.Therefore, we must be concerned especially with occupational mobil-ity from farm work to nonfarm work if the hired farm labor force isto be reduced sufficiently to bring the earnings of its members intoline with the earnings of nonfarm workers.
Although the remainder of this paper deals with occupational mo-
t Gladys K. Bowles, The Hired Farm Work Force of 1964, Agricultural Eco-nomic Report 82, USDA, ERS, August 1965.
Ibid., Table 4, p. 11.

FARM LABOR FORCE 73
bility of persons out of the farm labor force, the importance of in-creasing the opportunities of rural youth to enter the nonfarm laborforce at the time they enter the active labor force cannot be overem-phasized. The easiest and best way to bring adjustments in the farmlabor force is at this point, and all subsequent adjustments are likelyto involve greater social and economic costs.
Most of our statistics measure the numbers of persons employed inan occupation or industry at a given point in time, and there is atendency to assume that the net changes shown by changes in abso-lute numbers over time are the result of a relatively simple transferprocess whereby persons move from one occupation to another. If,however, we look at the employment record of a given set of individ-uals over a period of time the picture appears quite different.3 Wefind, for instance, that the gross occupational mobility out of the farmwork force is very high. At the same time there is a substantial backmovement into the farm work force so that the net reduction in mostyears is small (Table 1). In fact at least one year in the late 1950sit appears there may have been a net inflow into the farm workforce.
This extensive movement back and forth does not appear to be theresult of a small group of highly mobile workers in the hired farmlabor force. Despite the long tenure in their current jobs (18.0 years)found in a study of Job Tenure of American Workers,4 Social Secu-rity data indicate significant occupational mobility out of and into ag-ricultural employment for both farm operators and hired laborers.3Thus occupational mobility is not a continuous, smooth, one-wayprocess that works well Zr. everyone. Instead, it appe .rs to be a proc-ess of trial and error adjustment to individual situations of uncer-tainty and imperfect knowledge.
Turning to those persons who are in the farm labor force, either asself-employed farm operators or as hired farm workers, we ask howoccupational mobility from farming takes place. Do such individuals
s Brian B. Perkins, Labor Mobility between the Farm and Nonfarm Sector,Unpublished Ph.D. thesis, Michigan State University, 1964.
4 Harvey R. Hamel, Job Tenure of American Workers, January 1963, Ad-vance Summary, Special Labor Force Report.
Perkins, Labor Mobility between the Farm and Nonfarm Sector, Chapter

DALE E. HATHAWAY
decide suddenly one day to leave agricultural employment and, hav-ing severed their ties in agriculture, present themselves for nonfarmemployment? The answer to the question would appear to be no, forthe process of occupational mobility for the farm labor force seems tobe gradual and uncertain and works unsatisfactorily for many of theparticipants in the process. It appears that the process of occupa-
Table 1 A Comparison of Mobility Rates and Nonfarm Un-employment Rates, 1955-59 a
Based on all Persons inSocial Security Sample
Mobility Period1955-56 1956-57 1957-58 1958-59
Percentage of Farm Labor Force in BeginningYear That Participated in Occupation Mobility
Off-farm rate 14.6 15.6 12.5 13.8In-farm rate 13.3 10.7 14.3 11.7Net % change in begin-
ning farm labor force 1.3 4.9 +1.8 +2.1Based on Persons in Samplewith Coverage in All Years
1955-59Off-farm rate 17.5 18.1 13.3 14.0In-farm rate 14.8 11.8 15.0 12.2Net % change in begin-
ning farm labor force 2.7 6.3 +1.7 1.8Unemployment Rate inNonfarm Labor Force a 4.2 4.3 6.3 5.5
a The unemployment rates refer to the second year of each period.Computed from employment statistics published in The Economic Reportof the President, January 1963.
Source: Adapted from Brian Perkins and Dale Hathaway, The Move-ment of Labor between Farm and Nonfarm Jobs, Research Bulletin 13,Michigan State University, 1966, Table 17.
tional mobility from the farm labor force most often occurs via theroute of multiple job holding, where the individual has a part-time jobin the nonfarm labor force for a year or more.
Annual surveys of the Bureau of Census, the Census of Agricul-ture, and other data on multiple job holding tend to show an almostconstant proportion of farm operators and hired farm workers whohave nonfarm as well as farm employment. Because of the relatively

FARM LABOR FORCE 75
constant percentage of such persons it often has been assumed thatthese persons are permanently in this status. Continuous register data,such as Social Security data, give quite a different picture, however.They show that although the proportion of the farm labor force em-ployed in nonfarm industries is relatively constant, the persons soemployed are not the same ones.° About 60 percent of all farm oper-ators covered by Social Security as farm operators in 1955 had somecurrent or previous nonfarm employment coverage; only 6 percentwere multiple job holders for five consecutive years during the period1955-59.7
Perkins' found conclusive evidence that multiple job holding is amajor factor in occupational mobility for both self-employed farmoperators and hired farm workers.° He found that the farm-nonfarmoccupational mobility rate for multiple job holding farm operators in1955-59 was over six times that of farm operators not holding non-farm jobs, and the mobility rate for multiple job-holding farm wageworkers was over four times as high as for farm wage workers notholding nonfarm jobs in the beginning year. Moreover, for both farmoperators and wage workers the mobility rates rose directly with thenumber of years of nonfarm job experiences in the previous threeyears.
Thus a major link in the occupational mobility out of agricultureappears to be via the process of multiple job holding. This is not sur-prising in a sense, for success begets success. If we can show a pro-spective nonfarm employer previous nonfarm work experience, thechances for nonfarm employment undoubtedly are improved. Equallyimportant, if we have some satisfactory experience in nonfarm em-ployment, the personal uncertainty of leaving agricultural employ-ment for the nonfarm labor market is reduced. Therefore, the use ofmultiple job holding as a method.of testing the water before plunging
° Arley D. Waldo, The Oft -Farm Employment of Farm Operators In theUnited States, Unpublished Ph.D. thesis, Michigan State University, 1962. DaleE. Hathaway and Arley D. Waldo, Multiple Jobholding. by Farm Operators,Research Bulletin 5, Michigan State University Agricultural Experiment Sta-tion, East Lansing, 1964.
Hathaway and Waldo, Multiple Jobholding by Farm Operators, Table 5,p. 15, and Uel Blank, OASI Data of the Farm Work Force, Unpublished Ph.D.thesis, Michigan State University, 1960, p. 183.
° Perkins, Labor Mobility between the Farm and Nonfarm Sector, Table V-2.

76 DALE E. HATHAWAY
in over our head is understandable, but it also raises some majorquestions.
First, the entry to nonfarm employment via multiple job holdingmeans entry to labor market that is relatively restricted geographi-cally, at least for farm operators and permanent farm wage workers.It is less restrictive in this regard for migratory farm wage workers,but even these persons are most likely to enter the rural or small-townlabor market rather than the large urban markets. As I shall showlater this results in more sharply differing patterns of employment andearnings than we find in the large urban labor markets.
Although discussion on migration from farming usually is on mat-ters of long-distance migration from rural areas to large urban cen-ters, most of the evidence from surveys suggests that most rural peo-ple migrate relatively short distances when changing occupations.Long-distance rural-urban migration is primarily a phenomenon ofthe young nonwhites leaving the South, and it sometimes obscures themore common situation regarding farm-nonfarm occupation mobil-ity"
We might regard the multiple job-holding route of occupationalmobility as an individualistic ad hoc method of achieving nonfarmjob skills, a type of personal unemployment insurance against the un-certainty facing a new entrant to the nonfarm labor market, an indi-vidual employment service testing and guidance system for personaljob preference evaluations, and a personal insurance of some socialstability. There is ample evidence, however, that at least on the agri-cultural side this type of arrangement is far from optimal, inasmuchas it retards rather than encourages the necessary restructuring of ag-riculture. It also severely restricts the kind of labor market whichfarm people enter. Thus we can ask whether there may not be moreefficient and desirable ways for farm people to get nonfarm skills,
In this regard see Harold Guither, "Factors Influencing Decisions to LeaveFarming," Journal of Farm Economics, Vol. 45, No. 3, August 1963, pp. 567-76. His study supports both the limited geographical and multiple job holdingthesis regarding occupational mobility. Also see Calvin L. Beale, John C. Hud-son, and Vera J. Banks, Characteristics of the U. S. Population by Farm andNonfarm Origin, Agricultural Economics Report 66, Economic ResearchService, USDA, December 1964, Table 5, which shows that 79 to 95 percentof the farm-born persons are residing in the region where they were born.

FARM LABOR FORCE 77
achieve economic security while changing occupations, and get guid-ance and experience in nonfarm work. The development of ways toprovide these vital services would appear to be the responsibility ofthe Department of Labor.
FACTORS INFLUENCING OCCUPATIONAL MOBILITY
In general, the factors influencing occupational mobility from thefarm labor force might be summed up by saying that opportunity foreconomic improvement is the primary factor motivating occupationalmobility. There appear to be several factors that influence this oppor-tunity for improvement. Some of them are related to the general em-ployment level, the location of the individual, and the occupationaland industrial structure. Some are related to individual worker char-acteristics of age, education, sex, and race.Unemployment and Mobility. One of the most important aspects ofopportunity for occupational mobility out of the farm work force isrelated to the overall level of nonfarm unemployment. Although thiseffect has been commented on before, it had not been well docu-mented until the Perkins study of Social Security data. Table 1 showsthe occupation mobility rates out of and into the farm work force fora 5-year period covering a vigorous business expansion and a sharprecession which markedly increased the nonfarm unemployment rate.These data indicate there was an actual net inflow into the farm workforce during the year of highest unemployment. The inflow was espe-cially marked by a return of farm operators to farming.
What is not shown in this table but was evident in the data wasthat the rate of entry into the farm work force by rural young peoplealso increased as nonfarm unemployment rose. Thus nonfarm unem-ployment affects the size of the farm work force in three ways: (1) Itreduces the rate of occupational mobility out of farming; (2) it in-creases the rate of back movement from nonfarm to farm jobs; and(3) it increases the rate of new entrants to farming as rural youthfind nonfarm opportunities limited.
In examining the impact of nonfarm unemployment on the off-

Qr
78 DALE E. HATHAWAY
farm mobility rates of various groups, it appears that the greatest im-pact was to reduce the occupational mobility of the younger sagegroups significantly. The decline apparently affected farm operatorsand hired farm workers and whites and nonwhites about the same. Asmentioned earlier, however, the back movement of farm operatorswas higher, presumably because they had somewhere to go.
Another issue is the effect of local unemployment on the earningsof rural farm families and of farmers and farm managers. Surpris-ingly, Bryant found that outside the South local unemployment didnot depress the income level of farm families." However, local un-employment was a major factor depressing the earnings of farmmanagers for the United States and in most regions. Outside theSouth the labor market for rural males and rural females is appar-ently quite differentiated, so that local male unemployment does notaffect total rural farm family incomes. In the South, however, thereappears to be considerable competition between males and females inthe unskilled labor market so that local unemployment depresses fam-ily income as well as the earnings of farmers.
Thus it is clear that nonfarm unemployment depresses the earningsof labor in agriculture. It does so because it results in a reduction inthe rate of outflow from agriculture and because it increases the rateof outflow from agriculture and increases the rate of backflow intothe farm labor force. Since labor mobility within agriculture is rela-tively limited, especially among farm operators, and since so muchfarm-nonfarm occupational mobility is local there is a direct relation-ship between local unemployment and farm earnings as well as an ag-gregate impact upon occupational mobility out of the farm workforce.Location and Mobility. It has been suggested that occupational mo-bility out of farming is facilitated by location relative to large urbanindustrial centers.n Moreover, it has been suggested that this mobil-ity will result in higher earnings in agriculture adjacent to such cen-
" Wilfrid Keith Bryant, An Analysis of Inter-Community Income Differ-entials in Agriculture in the United States, Unpublished Ph. D. thesis, MichiganState University, 1963.
11T. W. Schultz, Economic Organization of Agriculture, McGraw-Hill BookCo., New York, 1953.

FARM LABOR FORCE 79
ters because of the better operation of the factor (labor) market. Re-cent analyses throw additional light upon these relationships.
An analysis of the occupation distribution of residents by distancefrom the nearest Standard Metropolitan Statistical Areas (SMSA)and taking into account the size of the SMSA indicate a strong rela-tionship between the occupation distribution of rural farm males andtheir proximity to large cities (Table 2). For instance, white ruralmales were more frequently employed as salesmen in areas close toSMSA's, and, moreover, there was a positive relationship betweencity size and the frequency of such employment. Some relationshipbetween location and occupation distribution was found for whiterural farn1 males for 17 out of 21 occupation classifications tested.Such relationships could occur (1) because the total occupation mixvaries according to distance from cities or (2) because rural farmmales have different competitive positions in different labor markets.If the occupation structure of rural males was due to the first reason,the same relationships between occupation structure and locationshould exist for all males in a given area (rural farm, rural nonfarm,or urban). But they do not. Only in the case of metal craftsmen andoperatives in nondurable manufacturing do we find the same relation-ship for all residence groups and races.
The occupational distribution of white rural farm males is thegroup most affected by location. White rural nonfarm males did notdiffer markedly from urban males in this regard. Surprisingly, the oc-cupation distribution of nonwhite males n all residence groups ap-pears much less related to distance than white males are.
If we take city size as well as distance into account, most of thedifferences between rural and urban males and whites and nonwhitesdisappear, except for the significantly less frequent relationship be-tween occupation distribution for nonwhite rural farm males."
These observations can be summed up as follows. Around verylarge cities the entire male occupational structure is related to prox-imity to the city. Around smaller cities, however, the occupationalstructure for rural males is the one most affected by location, suggest-ing that the relatively thin nonfarm labor markets around smaller
"I suspect this is due to the very small numbers of nonwhite rural farmmales near the largest cities, which are located primarily outside the South.

Tab
le 2
The
Rel
atio
nshi
p be
twee
n R
esid
ence
Cla
ssif
icat
ion,
Rac
e, a
nd P
roxi
mity
to C
ities
and
Occ
upat
ion
Dis
-tr
ibut
ion
of E
mpl
oyed
Mal
es in
196
0
Occ
upat
ion
RF
RN
F U
rban
RF
RN
F U
rban
RF
RN
F U
rban
RF
RN
F- U
rban
Whi
te W
hite
Whi
te N
W N
W N
W W
hite
Whi
te N
WN
W N
W N
WM
ales
Mal
es M
ales
Mal
es M
ales
Mal
es M
ales
Mal
es M
ales
Mal
esM
ales
Mal
es
Prof
essi
onal
, tec
hnic
al, k
indr
edFa
rmer
s an
d fa
rm m
anag
ers
Mgr
s., o
ffic
ials
, pro
prie
tors
Cle
rica
l, ki
ndre
dSa
les
wor
kers
Fore
men
Mec
hani
csM
etal
cra
ftsm
enC
onst
. cra
ftsm
enO
ther
cra
ftsm
enC
pt.,
driv
ers
Cpt
., du
rabl
e m
anuf
actu
res
Dis
tanc
e0
00
00
00
00
00
00
00
00
0+
00
0+
++
00
00
00
00
++
0+
0
+Si
ze-D
ista
nce
+0
0 0+
++
+0
0+
+0
+0
++
00
00
00 0
++
0
+0

Cpt
., no
ndur
able
man
ufac
ture
sC
pt.,
nonm
anuf
actu
res
Priv
. hou
seho
ldSe
rvic
e w
orke
rsFa
rm la
bore
rsC
onst
. lab
orer
sM
fg. l
abor
ers
Oth
er la
bore
rsO
ccup
atio
n no
t rep
orte
dN
o. o
ccup
atio
ns r
elat
ed to
prox
imity
17
++
-I-
++
00
00
00
00
00
00
00
++
0±
4-0
0+
00
00
0+
00
0+
00
00
00
00
00
0+
00
00
+0
00
0+
00
00
0+
00
++
00
++
-I-
0+
+13
115
95
1415
142
1313
Cod
e: A
plu
s si
gn (
-F)
mea
ns th
ere
was
a s
igni
fica
nt p
ositi
ve r
elat
ions
hip
betw
een
the
prop
ortio
n of
the
labo
r fo
rce
em-
ploy
ed in
the
occu
patio
n an
d pr
oxim
ityto
an
urba
n ar
ea. A
neg
ativ
e si
gn (
)m
eans
the
rela
tions
hip
betw
een
the
prop
ortio
nem
ploy
ed in
the
occu
patio
n an
d pr
oxim
ityw
as s
igni
fica
ntly
neg
ativ
e. A
zer
o (0
) m
eans
ther
ew
as n
o si
gnif
ican
t rel
atio
nshi
pbe
twee
n pr
oxim
ity a
nd th
e pr
opor
tion
empl
oyed
in th
e oc
cupa
tion.
Sig
nifi
canc
ew
as d
eter
min
ed b
y te
stin
g th
e pe
rim
eter
s of
regr
essi
ons
betw
een
occu
patio
n an
d th
e di
stan
ceor
siz
e-di
stan
ce v
aria
ble,
usi
ng th
e "t
" te
st a
t the
.05
leve
l.So
urce
: D. E
. Hat
haw
ay, J
. Alla
n B
eegl
e, a
nd W
. Kei
thB
ryan
t, R
ural
Am
eric
a, b
ook
to b
e pu
blis
hed
in 1
966
as p
art o
fC
ensu
s M
onog
raph
Ser
ies,
Cha
pter
6.

82 DALE E. HATHAWAY
cities and towns tend to affect adversely the occupations available tofarm males seeking nonfarm employment and to limit their prospectsfor entering the more desirable nonfarm occupations.
For females the situation appears quite different (Table 3). Theoccupational structure of all residence groups and both races seemsmuch less sensitive to location relative to cities over 50,000 popula-tion than was the case for males. The strongest relationships werefound to be between city size and distance and the occupational dis-tribution of urban females. Thus the labor market for rural femalesappears less related to location than is the case for males.
Despite the strong relationship between occupation distributionand location for rural farm males, however, there is no apparent rela-tionship between either the relative or the absolute income level infarming and location.
The differences in earnings of two occupation groupsoperativesand farmers and farm managersdo not increase with distance fromSMSA's.13 Indeed, except for the South and the Great Plains, the earn-ings differentials between these occupations are such that farmerswould be about as well off to take local jobs as operatives as to mi-grate to SMSA's if this is the primary occupation for which they canqualify. However, migration offers them a wider range of occupationsthan they would obtain locally.
Finally, there is no consistent relationship between proximity to alarge city and the earnings of farmers and farm managers." Despitethe indication that the occupation structure of rural farm males isstrongly related to location, the differential in earnings is not, and therelationship with respect to location and earnings within agriculture isvery mixed. On the basis of data presently available there is little evi-dence to support the thesis that location is a prime factor in occupa-tion mobility and/or earnings of farm workers. However, locationmay be very important in determining the occupation mix available tothose moving from agriculture.
" D. E. Hathaway, "Urban-Industrial Development and Income Differentialsbetween Occupations," Journal of Farm Economics, Vol. 46, February 1964,pp. 56-66.
" W. K. Bryant, An Analysis of Inter-Community Income Differentials inAgriculture in the United States, Unpublished Ph.D. thesis, Michigan StateUniversity, 1963.

ta e
ee
a io
nse
een
esi e
nce
ass
s ca
ion,
ace,
an
roxm
uE
mpl
oyed
Fem
ales
in 1
960
yo
i yes
an
ccup
a io
n o
Whi
te F
emal
esN
onw
hite
Fem
ales
Dis
tanc
eSi
ze-D
ista
nce
Dis
tanc
eSi
ze-D
ista
nce
Rur
alR
ural
Rur
alR
ural
Rur
al N
on-
Rur
al N
on-
Rur
al N
on-
Rur
al N
on-
Farm
far
m U
rban
Far
m f
arm
Urb
an F
arm
far
m U
rban
Farm
far
m U
rban
Prof
essi
onal
, tec
hnic
al, k
indr
ed0
00
Farm
ers
and
farm
man
ager
s0
0M
anag
ers,
off
icia
ls, a
nd p
ropr
ieto
rs0
0C
leri
cal a
nd k
indr
ed+
00
+±
Sale
s w
orke
rs0
0C
raft
smen
, for
emen
, and
kin
dred
++
+0
+C
pt.,
dura
ble
man
ufac
ture
s±
±+
++
Cpt
., no
ndur
able
man
ufac
ture
s0
++
00
Cpt
., no
nman
ufac
ture
s0
Priv
ate
hous
ehol
d0
+0
Serv
ice
wor
kers
00
Farm
labo
rers
00
0L
abor
ers
+0
00
0O
ccup
atio
n no
t rep
orte
d0
++
0+
No.
occ
upat
ions
rel
ated
topr
oxim
ity6
98
69
0 00
0O
0 0 +0
00
O0
+0
0+ 0
00
0
11
00
O0
00
0+
+0
0+
O0
0+
O0
++
+0
+O
00
+O
0 0+
+O 0
00
±0
0+
37
43
612
Cod
e: A
plu
s si
gn (
-I-)
mea
ns th
ere
was
a s
igni
fica
nt p
ositi
ve r
elat
ions
hip
betw
een
the
prop
ortio
nof
the
labo
r fo
rce
em-
ploy
ed in
the
occu
patio
n an
d pr
oxim
ity to
an
urba
n ar
ea. A
neg
ativ
e si
gn (
) m
eans
the
rela
tions
hip
betw
een
the
prop
ortio
nem
ploy
ed in
the
occu
patio
n an
d pr
oxim
ity w
as s
igni
fica
ntly
neg
ativ
e. A
zer
o (0
) m
eans
ther
e w
as n
osi
gnif
ican
t rel
atio
nshi
pbe
twee
n pr
oxim
ity a
nd th
e pr
opor
tion
empl
oyed
in th
e oc
cupa
tion.
Sig
nifi
canc
e w
as d
eter
min
edby
test
ing
the
peri
met
ers
of r
e-gr
essi
ons
betw
een
occu
patio
n an
d th
e di
stan
ce o
r si
ze-d
ista
nce
vari
able
, usi
ng th
e "t
" te
st a
t the
.05
leve
l.So
urce
: D. E
. Hat
haw
ay, J
. Alla
n B
eegl
e, a
nd W
. Kei
th B
ry a
nt, R
ural
Am
eric
a, b
ook
to b
epu
blis
hed
in 1
966
as p
art o
f C
en-
sus
Mon
ogra
ph S
erie
s, C
hapt
er 6
.
1

84 DALE E. HATHAWAY
Mobility and Personal Characteristics. Much has already been re-ported on the strong relationship between occupational mobility andage. This was found to be true again, using the Social Security data,but it also suggests an important economic reason for this relation-ship. It appears that in most years persons over 45 years old wholeave the farm work force tend to have an average lower income innonfarm employment than they previously had in farm employment(Table 4). In periods of recession this is true for those over 35 years
Table 4 The Mean Income Differentials of Off-Farm Moversby Employment Status, Race and Age: The Nation,1955-56, 1956-57, 1957-58, and 1958-59 a
(In Dollars)
1955-56
Mobility Period:
1956-57 1957-58 1958-59All off-farm movers 286 110 21 229
Farm employment status:Single job operators 117 73 150 158Multiple job operators 49 318 411 378Single job wage workers 368 364 149 414Multiple job wage workers 430 271 141 484
Race:Non-Negro 286 106 28 228Negro 284 155 51 244
Age:under 25 540 417 231 56525-34 350 193 53 33935-44 232 8 49 7845-54 72 18 185 3655 and over 7 339 336 303a Based on Social Security sample data.Source: Brian Perkins and Dale Hathaway, The Movement of Labor
between Farm and Nonfarm Jobs, Table 12.
old. If this experience holds as a general rule and is fairly well recog-nized by farm people, it is not surprising that the rate of occupationalmobility declines rapidly with age and remains relatively stable at avery low level beyond age 35.
It has been generally assumed that Negroes have a higher mobility

FARM LABOR FORCE 85
rate than non-Negroes, but this could not be substantiated in our re-search. Instead, the high mobility rate for Negroes appears morelikely to be associated with the relatively larger proportion of themunder 35 years old than with race.15
It also has not been substantiated that the occupational migrationis a negative function of income in agriculture. There is no indicationthat occupational mobility declines as income in farming rises, or thatmultiple job holding declines as income from fanning rises. Actuallythe rate of multiple job holding apparently rises with farm income,although its character and intensity change. All this suggests thatearnings both in farm work and outside are related to the individual'sage, education, skills, and other personal and financial assets.16
Unfortunately not enough is known regarding the impact of num-ber of years of education and quality of education on occupation mo-bility from the farm work force. There can be little doubt, however,that both significantly impede the out-movement from farm employ-ment. One indication of this is the high proportion of high schooldropouts employed as farm laborers compared to young people of thesame age who were employed high school graduates." On the otherhand, a study of potential occupation mobility and personal factorsfound no significant relationship between formal education and po-tential mobility.18 This result may not be inconsistent in that peoplewith little education may have potential in terms of willingness tochange occupations but find that achieving satisfactory changes in oc-cupation is more difficult than they realized. Moreover, there may bea discontinuous relationship between education and occupationalmobility.
15 Brian Perkins and Dale Hathaway,. The Movement of Labor betweenFarm and Nonfarm Jobs, Michigan State University Research Bulletin 13, 1966."Hired farm workers (25 days or more) also had their peak annual earn-ings at age 25-34 in 1964. See Bowles, The Hired Farm Work Force of 1964,Table 9." Jacob Schiffman, "Employment of High School. Graduates and Dropoutsin 1961" Monthly Labor Review, May 1,962." H. W. Baumgartner, "Potential Iviobility in Agriculture: Some Reasons forthe Existence of a Labor-Transfer Problem," Journal of Farm Economics,Vol. 47, February 1965, pp. 74-S2.

86 DALE E. HATHAWAY
HOW DOES THE LABOR MARKETOPERATE FOR THE FARM WORK FORCE?
The questions to be dealt with here relate mainly to how the labormarket functions for farm people engaged in occupational mobilityfrom the farm work force. Some of the issues are: What kind of oc-cupational mobility do farm people achieve in today's labor market,why do so many who move to nonfarm employment return to farmwork, and are there any obvious barriers to entry that retard occupa-tional mobility from farm work?
One test of the occupational mobility out of agriculture is to lookat the occupations of rural males who are employed outside the agri-cultural industry. It appears safe to assume that most persons classi-fied as rural farm residents generally are or have been employed inagriculture, especially as farm operators. Because the rural nonfarmpopulation is so heterogeneous, containing many urban fringe resi-dents in the Northeast and Midwest, it is not correct to assume thatmost rural nonfarm residents have had any past association with farmemployment."
Table 5 shows the nonagricultural occupation distribution by resi-dence, sex, and color in 1960. The occupation distribution of ruralmales is heavily skewed toward the lower-paying, less skilled occupa-tions. For instance, about 42 percent of the white rural farm malesand 68 percent of the nonwhite rural farm males work as operativesor laborers, compared to about one-quarter of white urban males inthese two occupations.
Except for a lower proportion employed in clerical work and ahigher proportion employed as operatives the sharp differences in oc-cupational structure do not appear for white rural farm females. How-ever, almost all nonwhite rural farm females are concentrated in threeoccupationsprivate household workers, service workers, and opera-tives. Thus it appears that the labor market functions to place mostrural farm males in the less desirable nonfarm occupations, and this
" See D. E. Hathaway, J. Allan Beegle, and W. Keith Bryant, Rural Amer-ica, for a discussion of the characteristics of the rural nonfarm population.

Tab
le 5
Occ
upat
iona
l Dis
trib
utio
n of
Per
sons
mp
oyu
ean
d R
ural
, 196
0gr
li I
Ors
I.1
1Se
x, 'o
rur
oaa
Whi
teN
onw
hite
Rur
alR
ural
Rur
alR
ural
U.S
.U
rban
Non
farm
Far
mU
.S.
Urb
an N
onfa
rmFa
rmM
ale
Tot
al, e
xcl.
farm
ers,
far
mm
grs.
, far
m la
bore
rs, a
ndfa
rm f
orem
en10
0.0
100.
010
0.0
100.
0'10
0.0
100.
010
0.0
100.
0M
grs.
, off
icia
ls, a
nd p
ropr
ieto
rs12
.513
.011
.29.
02.
62.
71.
81.
4C
leri
cal a
nd k
indr
ed7.
78.
55.
25.
45.
76.
51.
71.
4Sa
les
wor
kers
8.0
8.7
5.9
5.2
1.7
1.9
0.9
1.0
Cra
ftsm
en, f
orem
en, a
nd k
indr
ed22
.221
.425
.323
.011
.511
.511
.310
.4O
pera
tives
and
kin
dred
21.2
19.3
26.5
31.3
26.5
24.8
31.5
36.1
Priv
ate
hous
ehol
d0,
10.
10.
10.
10.
80.
80.
91.
0Se
rvic
e w
orke
rs, e
xcl.
priv
ate
hous
ehol
d5.
66.
14.
53.
515
.516
.89.
46.
2L
abor
ers,
exc
l. fa
rm a
nd m
ine
6.1
5.2
8.6
10.6
21.9
19.7
33.3
31.8
Occ
upat
ion
not r
epor
ted
4.5
4.7
3.9
6.1
9.5
10.1
5.9
8.3
Fem
ale
Tot
al, e
xcl.
farm
ers,
far
mm
grs.
, far
m la
bore
rs, a
ndfa
rm f
orem
en10
0.0
100.
010
0.0
100.
010
0.0
100.
010
0.0
100.
0M
grs.
, off
icia
ls, a
ndpr
opri
etor
s4.
14.
04.
63.
01.
21.
21.
20.
8C
leri
cal a
nd k
indr
ed33
.235
.724
.422
.23.
89.
92.
61.
7Sa
les
wor
kers
8.8
8.9
8.7
8,0
1.8
1.9
1.2
1.3
Cra
ftsm
en, f
orem
en, a
nd k
indr
ed1.
31.
31.
21.
20.
70.
80.
40.
3O
pera
tives
and
kin
dred
16.0
14.6
20.8
21.3
13.3
14.0
9.7
7.8
Priv
ate
hous
ehol
d4.
23.
75.
87.
335
.632
.353
.259
.3Se
rvic
e w
orke
rs, e
xcl.
priv
ate
hous
ehol
d12
.611
.815
.813
.721
.522
.218
.013
.0L
abor
ers,
exc
l. fa
rm a
ndm
ine
0.5
0.4
0.7
0.6
1.0
0.9
1.2
1.2
Occ
upat
ion
not r
epor
ted
5.4
5.5
4.8
6.1
8.4
8.9
5.0
5.5

88 DALE E. HATHAWAY
also occurs for nonwhite rural farm females. Undoubtedly this is afunction both of the personal characteristics of the individuals in-volved and of the relatively limited nonfarm labor market in mostrural areas.We can obtain two views of the industrial distribution of the non-farm jobs taken by persons leaving agriculture. One view is obtainedby examining the industry of employment of persons who left the
farm labor force for nonfarm employment as indicated by Social Se-curity data (Table 6). It shows that those leaving agriculture tend to
Table 6 The Industrial Distributions of Wage Jobs Taken byMovers in the 1956-57 and the 1957-58 MobilityPeriods, by Farm Occupation of Movers a
IndustryFarm Operators Farm Wage Workers1957 1958 1957 1958
Agriculture,b forestry,and fisheries 2.7% 2.4% 8.9% 6.1%Mining 4.2 2.6 2.8 2.2Construction 15.2 14.8 16.1 19.2Manufacturing 22.3 21.3 23.4 21.5Utilities 4.5 4.9 4.7 5.3Wholesale and retail trade 18.1 21.9 24.6 26.3Finance, insurance,and real estate 2.3 2.4 1.7 1.7Services 8.2 10.3 10.9 10.8Government 21.1 17.9 4.8 5.3Other c 1.3 1.5 2.1 1.4All industries 100.0 100.0 100.0 100.0
a Distributions of movers' jobs based on Social Security sample data. Dis-tribution of unskilled occupations in 1960 computed from Census of Popu-lation, PC (1), 1D, U.S.b Excluding farm employment. C Including nonclassifiable and nonclas-sified.Source: Brian Perkins and Dale Hathaway, The Movement of Laborbetween Farm and Nonfarm Jobs, adapted from Table 7.
enter manufacturing, construction, and wholesale and retail trade. Inaddition, an unusually high proportion of the farm operators takingnonfarm work enter government. Apart from government, the indus-trial distribution of farm operators who moved and hired farm work-

90.1
24.1
0101
1.11
1111
0.1.
..-
Tab
le 7
Dis
trib
utio
n of
Em
ploy
ed P
erso
ns, b
y C
olor
and
Sex,
Urb
an a
nd R
ural
, for
the
U.S
.,196
0T
otal
Whi
teN
onw
hite
U.S
.R
ural
Rur
alU
rban
Non
farm
Far
mR
ural
Rur
alU
.S. U
rban
Non
farm
Far
mR
ural
Rur
alU
.S. U
rban
Non
farm
Far
mM
ale
Tot
al, e
xcl.
agri
cultu
re, f
ores
try,
and
fish
erie
s10
0.0
100.
010
0.0
100.
010
0.0
100.
010
0.0
100.
010
0.0
100.
010
0.0
100.
0M
inin
g1.
71.
04.
02.
91.
81.
04.
13.
00.
60.
32.
51,
2C
onst
ruct
ion
9.2
8.1
12.5
15.0
9.1
8.0
12.4
15.0
10.0
9.3
13.6
15.9
Man
ufac
turi
ng33
.232
.834
.435
.133
.633
.434
.234
.928
.426
.837
.038
.7T
rans
p., c
omm
unic
atio
ns, a
nd p
ublic
utili
ties
9.3
9.5
8.7
8.5
7.1
9.5
8.7
8.5
9.3
9.6
7.9
8.5
Who
lesa
le a
nd r
etai
l tra
de18
.719
.217
.516
.818
.919
.317
.817
.116
.417
.013
.612
.2Fi
nanc
e, in
sura
nce,
and
rea
l est
ate
3.7
4.2
2.1
1.7
3.9
4.4
2.2
1.8
2.0
2.2
0.7
0.4
Serv
ices
12.5
12.8
12.2
9.2
14.1
14.6
12.9
9.7
18.2
18.6
16.0
12.6
Gov
ernm
ent
5.8
6.1
4.6
4.9
5.7
2.4
4.7
5.1
6.6
7.2
3.7
2.3
All
othe
r4.
04.
23.
05.
23.
63.
72.
95.
08.
43.
95.
18.
1Fe
mal
eT
otal
, exc
l. ag
ricu
lture
, for
estr
y, a
ndfi
sher
ies
100.
010
0.0
100.
010
0.0
100.
010
0.0
100.
010
0.0
100.
010
0.0
100.
010
0.0
Min
ing
and
cons
truc
tion
0.9
0.9
0.8
0.7
1.0
1.0
0.9
0.7
0.3
0.3
0.3
0.3
Man
ufac
turi
ng21
.220
.623
.822
.822
.822
.125
.424
.59.
710
.36.
74.
9T
rans
p., c
omm
unic
atio
ns, a
nd P
ublic
utili
ties
3.7
4.0
2.8
2.6
4.1
4.4
3.0
2.8
1.1
1.2
0.5
0.6
Who
lesa
le a
nd r
etai
l tra
de21
.221
.121
.818
.322
.622
.623
.119
.311
.011
.58.
86.
8Fi
nanc
e, in
sura
nce,
and
rea
l est
ate
5.9
6.5
3.7
3.7
6.5
7.2
4.0
4.0
1.7
1.9
0.5
0.3
Serv
ices
37.7
37.3
38.7
42.0
34.0
33.6
35.0
38.4
64.7
62.3
77.3
81.2
Gov
ernm
ent
4.4
4.4
4.4
4.6
4.5
4.4
4.7
5.0
3.9
4.3
1.4
0.6
All
othe
r4.
95.
13.
95.
34.
64.
73.
95.
27.
78.
24.
55.
3

90 DALE E. HATHAWAY
ers who moved was not as different as we might expect from lookingat the occupation distributions.Another view of the industrial distribution resulting from occupa-tion mobility can be obtained by looking at the industrial distributionof the rural farm population in 1960 (Table 7). For all rural farm
males, white and nonwhite, the high proportion employed in manu-facturing is again obvious. In fact, it is even higher than the rate ofentry to manufacturing, suggesting either that the rate of retention inmanufacturing is higher or, more likely, that persons who experiencegeographical mobility as well as occupational mobility are more likelyto find employment outside manufacturing. It appears that geographi-cal mobility may be related to employment in the wholesale and retailtrades.
There is little difference between the industry distribution of whiterural females and their urban counterparts. All females are heavilyconcentrated in service industries, wholesale and retail trade, andmanufacturing. Nonwhite females in all residence groups are heavilyconcentrated in service industries, with wholesale and retail trade aweak second. There appears to be a greater concentration in serviceindustries among rural farm nonwhite females than for other resi-dence groups.
There is also a differential in industry of nonfarm employment byage of the person at the time occupational mobility occurs. (Table 8shows one year which appears representative.) Almost half of theyounger farm operators who took nonfarm employment went intoconstruction and manufacturing. Older farm operators tended to gointo government and services. Similar differences, although somewhatless pronounced, were found for farm wage workers.
In a sense it appears that much of the occupational mobility mayprove to be "out of the frying pan into the fire" in so far as the indi-viduals involved are concerned. A very high proportion of the occu-pational mobility out of the farm labor force appears to be in un-skilled occupations and into industries where, like agriculture, un-skilled labor is rapidly being displaced by machines. Thus, as thingsseem to be working out, yesterday's underemployed in agriculturemay become tomorrow's unemployed factory workers, twice dis-placed by the substitution of labor by capital.

Tab
le 8
The
Ind
ustr
ial D
istr
ibut
ions
of W
age
Jobs
Tak
en b
y M
over
s in
the
1956
-57
Mob
ility
Per
iod,
by
Farm
Occ
upat
ion
of M
over
s an
d by
Age
a
1957
Indu
stry
(In
Perc
enta
ges)
Farm
Ope
rato
rsFa
rm W
age
Wor
kers
Und
erA
ge:
2525
-34
35-4
445
-54
55 a
ndov
erU
nder
2525
-34
35-4
445
-54
55 a
ndov
er
Agr
icul
ture
,b f
ores
try,
and
fish
erie
s8.
1%2.
2%2.
8%3.
1%1.
1%9.
7%7.
5%5.
7%9.
7%11
.9%
Min
ing
1.2
3.6
4.2
7.5
2.2
2.9
2.9
2.7
2.1
4.0
Con
stru
ctio
n16
.314
.219
.118
.17.
414
.616
.318
.319
.813
.5M
anuf
actu
ring
31.4
29.9
24.1
20.8
11.0
24.7
25.5
24.3
20.9
12.7
Util
ities
3.5
6.6
5.5
2.7
3.3
4.6
7.0
4.2
3.7
2.0
Who
lesa
le a
nd r
etai
ltr
ade
16.3
20.1
16.1
17.4
20.6
27.0
23.1
23.8
21.9
23.0
Fina
nce,
insu
ranc
e, a
ndre
al e
stat
e1.
23.
30.
61.
05.
51.
01.
42.
81.
34.
8Se
rvic
es7.
05.
510
.84.
811
.49.
59.
611
.612
.019
.4G
over
nmen
t15
.113
.115
.023
.236
.84.
54.
34.
45.
27.
5O
ther
C0
1.5
1.9
1.4
0.7
1.6
2.4
2.3
3.4
1.2
All
indu
stri
es10
0.0
100.
010
0.0
100.
010
0.0
100.
010
0.0
100.
010
0.0
100.
0a
Bas
edon
Soc
ial S
ecur
ity s
amr,
:e d
ata.
b E
xclu
ding
far
mem
ploy
men
t. C
Inc
ludi
ng n
oncl
assi
fied
and
non
clas
sifi
able
.So
urce
: Bri
an P
erki
ns a
nd D
ale
Hat
haw
ay, T
he M
ovem
ent o
f L
abor
bet
wee
n Fa
rm a
ndN
onfa
rm J
obs,
Tab
le 8
A.

92 DALE E. HATHAWAY
Mention already has been made of the high back movement of per-sons who had moved from farm to nonfarm employment. Even inyears of low unemployment such back movement appears to be sur-prisingly high. This raises questions as to the reasons for such reversemobility. One obvious explanation would be that persons who leftfarm employment found that they made less in nonfarm employmentthan they had in agricultural employment. An indication that adverseeconomic experience in the nonfarm labor market is a strong factor inback movement into the farm labor force is shown in Table 9. It ap-
Table 9 Income Differentials of Off-Farm Movers by Type ofCoverage in the Year Following the Mobility Period:1955-56,1956-57, and 1957 -58'
Mobility Period
(In Dollars)
Persons Who WereFarm Employed inBoth Years of theMobility Period
Type of Coverageof Movers in
Year FollowingMobility Period:Nonfarm Farm
Sector Sector($) ($) ($)
1955-56Median income in 1955 1,287 1,295 1,305Median income in 1956 1,480 1,942 1,284Differential of median incomes b +193 +647 21Mean income differential C +438 75
1956-57Median income in 1956 1,429 1,367 1,542Median income in 1957 1,468 1,766 1,205Differential of median incomes b +39 +399 337Mean income differential C I1I +295 228
1957-58Median income in 1957 1,448 1,484 1,697Median income in 1958 1,600 1,654 1,256Differential of median incomes b +152 +170 441Mean income differential C MON11111 +131 305a Computed from Social Security sample data.b Equal to the median income of the group in the second year less its
median income in the first year of the period.e Equal to the simple average of the measured income differentials of the
individuals in the group.

FARM LABOR FORCE 93
pears that persons who left farm employment and remained in non-farm employment were those who experienced rather significant in-come gains from this occupational mobility. The average gains werelarger during years of high employment. On the other hand, thosewho left farming and then returned to farm employment after a yearof nonfarm employment experienced a decline in income in their non-farm employment, on the average. Moreover, if the year they leftfarming was a year of high nonfarm unemployment the average in-come losses were relatively large, apparently large enough to induce areturn to the farm work force.
The lower earnings of those who returned to farming seem to havebeen the result both of less off-farm employment and of rates of paylower than were received by those who remained in their nonfarmjobs. Examination of Social Security data indicates that the backmovers had fewer quarters of covered employment than those whoseoccupational mobility was more permanent and the back movers hada significantly lower income per quarter of covered employment.
Several personal characteristics of the back movers are significant.First those returning to agriculture contained a much higher propor-tion of farm operators than was true of the original outmovers, indi-cating that either farm operators are less successful in occupationalmobility than hired farm laborers or that, given an adverse nonfarmexperience, farm operators more frequently have some place to goback to in agriculture.
Back movers tended to be older than the average of those partici-pating in occupational mobility, again indicating the adverse selectiv-ity of the present labor market toward older workers. The rate ofback movement did not appear to be related to the race of the individ-ual.
The regional effects of the back movement into the farm laborforce were of some importance. Some regions, the Northeast and Pa-cific, continued to experience a net out-migration from the farm laborforce despite the rise in nonfarm unemployment in 1958. In the WestNorth Central and South there was a large back movement, especiallyof farm operators in the South. This raises an interesting question:Why did the South experience the most adverse situation relative toback movement into farm employment during a recession which was

94 DALE E. HATHAWAY
heavily concentrated in durable goods manufacturing outside thearea? 20
We can deduce that this was the result of three factors. First, farmworkers in the South and West North Central regions are more likelyto have to migrate physically in order to enter nonfarm work than inother regions. Local labor markets clearly offer fewer opportunities inthe South than in Whet :tgions.21 Second, those who leave agricul-tural employment tend to go to industries which are subject to cycli-cal as well as secular downturns in employment. Finally, such personstend to be marginal in the nonfarm industries and thus are subject tolayoff when labor force reductions occur. It is not surprising, then, tofind that it was the South, where the local unemployment rates werelower than average for the nation, which experienced the greatestbackflow into farm employment during the recession. Because of therelatively low level of skills and of education that prevail among the
Southern farm work force they are likely to suffer the most adverseeffects in the modern labor market even when the major causes arelocated in other regions.
In general, while occupational mobility from the farm labor forceis high, the labor market does not work satisfactorily for farm peopleattempting to find nonfarm employment. Many who leave the farmwork force return to it, probably as the result of adverse income ex-perience. Farm people clearly are not achieving a wide diffusion inthe total nonfarm labor market when they do leave agriculture. In-stead, most of them end up in lower-paying, less promising occupa-tions in the nonfarm economy, and in the contracting rather than theexpanding industries insofar as labor force is concerned.
Farm people have been handicapped in leaving farm employmentfor several generations by their generally fewer years of formal educa-tion and by the lower quality of that education. Moreover, this handi-cap is greatest in the age group 25 to 45, where occupational mobility
Total employment declined by about 1.5 million from 1957 to 1958 (ave.),and employment in durable goods manufacturing declined 1.0 million. (Eco-nomic Report of the President, January 1962, Table B.-24, p. 236.)W. Keith Bryant, An Analysis of Inter-Community Income Differentialsin Agriculture in the United States.

FARM LABOR FORCE 95
is most probable if it is to occur at all .22 If greater occupational mo-bility out of agriculture is going to occur for farm workers over 25 itprobably will require special policies to offset the adverse selectivityof the present labor market toward such persons.
IMPLICATIONS FOR POLICY
In the aggregate the transfer of persons from the farm work force tononfarm employment has appeared rapid to most people. Yet under-lying this rapid reduction in the farm work force there is ample evi-dence of frequent frustrations, disappointments, and financial lossesfor large numbers of farm people. No one would suggest that all thefrustrations and disappointments of life can and should be removedby public policy, but certainly a society with the resources of ours cando more than is now being done to achieve mobility out of those oc-cupations where technical advance (which vastly benefits all society)is putting tremendous economic and social pressure for greater occu-pational mobility.
On the issue of full employment there can be no argument at thispoint in time. It is a necessary prerequisite for greater occupationalmobility from the farm labor force. Perhaps the greatest need for rec-ognition of this fact is among farm people themselves, whose repre-sentatives often are among those most opposed to policies that willexpand employment.
The widespread use of multiple job holding as a way out of agricul-ture suggests several needs. One need is for much better occupationaltesting and counseling for those interested in occupational mobility.The high rate of entry into industries with a stable or declining laborforce would also suggest need for further counseling. Multiple job
22The difference in median years of school completed between white ruraland urban males ran as follows in 1960: Total 25 years and over 2.5
years; 25-29 years old 0.4 year; 30-34 years old 1.4 years, 35 to 39 yearsold 1.8 years; 40 to 44 years old 2.9 years; 45 to 49 years old 2.5 years; 50 to54 years old 1.8 years; 55 to 59 years old 0.7 year; 60 to 64 years old 0.5year. Source: Dale E. Hathaway, J. Allan Beegle, and W. Keith Bryant, RuralAmerica, Chapter 6, Table 6-4, to be published in 1966.

1.110011WPW1111111111.11"11111101110/41.01111.01.M,
96 DALE E. HATHAWAY
holding and the high rate of back-movement also suggest the need forgreater income security for those engaged in occupational mobility.Until the rate of adverse experience declines substantially we canhardly blame farm people for keeping some contact with agricultureuntil they feel securely situated somewhere else.
The issue of training or retraining for occupational mobility is al-ways present. Such training costs generally will not be borne by thefirst nonfarm employer since, once achieved, they become part of theskills of the individual trainee and cannot be captured by the em-ployer. Therefore, it has been generally assumed that such trainingshould be the direct function of a public agency. This is questionable.Another approach would be a public subsidy to cover the cost in-curred by the trainee in a private company. Obviously, one of thebarriers to occupational mobility is that the marginal value product ofthe new entrant is less than his cost to the employer until he has ac-quired the necessary skills to perform effectively in his new job. Asminimum wages increase, this gap may become so high that no indus-try can afford to hire an unskilled worker. This will push more andmore of the needed occupational training back into an already over-burdened educational system and will preclude occupational mobilityfor many persons who for age or other reasons are unable to return tothe formal educational system.
Another advantage of the subsidized in-place training would be thatthe individuals would have work experience as well as training. Asany teacher knows, the two are not the same, and both are needed.Moreover, such a system would reduce placement problems appreci-ably, which often are major even with well-trained individuals.
Most of my suggestions are aimed at improving the chances of suc-cessful occupational mobility out of farming. The gross rate of move-men ,. need not be increased in order to sharply increase the net rate ofout-movement from farming. I suspect, however, that if the chancesfor successful out-movement from the farm labor force were im-proved the lure of agricultural life might prove very weak for manynow earning less than $1,000 per year as a farm wage worker or theoperator of an uneconomic farm.

[6]
Farm Manpower PolicyVARDEN FULLER
FARM MANPOWER POLICY VERSUSNATIONAL MANPOWER POLICY:A HISTORY OF ALIENATION
That we have serious and broad deficiencies in farm manpower policyis not a startling new discovery, nor are these deficiencies attributableto lack of knowledge. Although farm labor and related matters ofrural poverty and underemployment have never been highly glamor-ous areas of research, agricultural economists and rural sociologists,both in government and in academic institutions, have sustained aninterest and a commendable level of research activity in these areas.From these efforts, policy makers have had within their grasp fullysubstantiated evidence on several pervasive problems: (1) that verylarge proportions of farms have been too small to offer full employ-ment to the farm family, and that technological advance was resultingin many of these small inadequate farms at the same time that thenumber of adequate commercial farms was increasing; (2) that withsustained and rapid technological advance, labor requirements wererapidly declining, thereby creating intense pressure for mobility andoccupational adjustment; (3) that farm people are highly mobile andhave migrated in magnitudes historically unparalleled; (4) that theprocess of migration was draining away the most productive age cate-gories and, even so, frequently resulted in considerable hardship tothe migrant because of his lack of information and preparation forother work; (5) that particular segments of American agriculturecontinued to depend upon obtaining the services of a very large popu-
VARDEN FULLER is Professor of Agricultural Economics, University ofCalifornia, Berkeley.

98 VARDEN FULLER
lation of seasonal and migratory workers for whom sufficient employ-ment to gain an acceptable livelihood was not available.
By emphasizing that we have had knowledge which has gonelargely unutilized I do not wish to imply that our policy deficiencieshave been attributable to perversity or ill will on the part of policymakers and administrators. Rather, it seems more realistic to findthe policy obstructions in the structure of political forces and inambivalences associated therewith.
In this country it has never been clearly decided whether agricultureis a regular occupational category and therefore subject to the regi-men of being examined in labor force terms. It is not a foible ofstatisticians that employment statistics are reported in the nonagricul-tural, agricultural dichotomy. Whether we regard the historic modelof the yeoman family farmer as being a transformation of Europeanpeasantry or not, it is true that the thinking about farm people hasrun somewhat parallel in the sense that until quite recently farm peo-ple and their economic activities were regarded as being somewhatapart from national occupational structures. Neither for the Euro-pean peasant nor for the American farmer was the concept of incomeparity (as a reciprocal of manpower adjustment) a relevant conceptuntil recently. We share with other industrial countries the evolutionof the philosophywith some backing in explicit policythat farm-ers should have incomes equal to those that prevail in comparable oc-cupational categories, but Americans have not yet gone that far withrespect to hired farm workers.
Ambivalences of perception do not survive except in a politicalcontext that is favorable to their survival. In the few years in whichwe have begun to look on farm labor through a manpower focus, therelevant political public might be classified in three ways: (1) thoseadversely affected by the lack of affirmative manpower policy, includ-ing farm families pushed into migration, those with insufficient re-sources, and those who haw tried to make a living as seasonal andmigratory wage workers; (2) those who benefited from the adversityof the prior group and those not adversely affected by the absence ofan affirmative manpower policy, including employers of hired farmlabor, those who were interested in obtaining additional land for farmenlargement, and those who saw a political advantage in having farm
FARM MANPOWER POLICY 99
income statistics attenuated through the inclusion of low incomeunits; (3) the indifferent or confused general public.
Political power has been highly concentrated in the second cate-gory, that is, those not adversely affected by an impassive-negativefarm manpower policy. It is they who have had organizational articu-lation and the ability to employ ideological manipulation in the inter-est of perpetuating ambiguities. In this environment the latitude ofdiscretion available to legislators and administrators has been sharplyconstrained, both as to policy development and as to prosecution ofprogram under existing authorities.
The nation has had important policies and programs that initiallywere affirmative to farm manpower. Foremost among them were theliberal land policies embraced in the Homestead Act and related leg-islation, the Reclamation Law which subsidized the development offarm land, and the experimental-educational structure of the land-grant college system which accelerated the advancement of produc-tion technology. When the accumulated impacts of technological ad-vance became negative to the income position of farmers, under cir-cumstances analyzed by C. E. Bishop in Chapter 1, government hadto nullify the productivity it had helped to create by instituting pro-duction controls, including the subsidizing of the idleness of a consid-erable part of the nation's most productive acreage under the SoilBank and related legislation. In retrospect we may now observe cer-tain eccentricities in American political capabilities. Finding our-selves in the dilemma of having expanded our agricultural capabilitytoo rapidly and therefore being confronted with surpluses, we havereacted legislatively by retiring excess land under full compensationand retiring excess farm people into an oblivion of no pay, and untilquite recently with very little concern for their welfare.
For hired farm labor our legislative response has been even moreexplicitly negative. In the New Deal era Congress passed a series oflabor actsFair Labor Standards, Social Security, UnemploymentInsurance and Labor Relationsfrom which hired farm labor wassystematically excluded. Subsequently, after the World War II emer-gency the Secretary of Labor accepted a mandate from farm em-ployer organizations to create a separate, identifiable farm placementservice as a condition of having this function restored to the Depart-

100 VARDEN FULLER
ment of Labor from the War Food Administration. Finally therecame the ultimate in alienation of farm labor when in 1951, underthe guise of the Korean War emergency, organized farm employer in-terests obtained the passage of Public Law 78, which put the UnitedStates Government, and specifically the Secretary of Labor, into theposition of being an agent to procure temporary farm labor (fromMexico) on terms already discordant with prevailing American laborstandards and destined to become even more so under the latitude ofcollusive action allowed farm employer interests.
With the majority of the general electorate hopelessly paralyzed inconfusion while the minority divided its support prolabor and pro-management on sentimental and affiliative grounds, farm labor issuesand problems have seldom achieved the status of respectable debate.Only in the contemporary context of a broad national concern aboutpoverty and unemployment in general does the situation of the lessprivileged in agriculture begin to emerge from the bounds of narrowagrarian equity argumentation.
In the restricted sense of eliminating redundant labor from farms,the essentially laissez-faire policy of past decades has already donemuch of the job. As a version of history, it has become fashionable tolook upon this export of labor as an agricultural contribution to eco-nomic growth. Such a contribution it has been, but as a windfall.Since the technological revolution was virtually an autonomous forcegenerated out of scientific advance and not deliberately designedtoward the objective of releasing farm workers, it is better history toacknowledge that, without the blessing of a highly favorable nonfarmemployment climate, technological advance and an impassive em-ployment policy would have been on collision course.
As the residual of farm population has declined in magnitude, itscomposition has also shifted toward older age categories and towarda sharply diminished rate of natural increase. The potential of migra-tion is sharply decreased for both the immediate and the distant fu-ture. Given this outlook, we might be tempted to the conclusion thatan affirmative policy for farm manpower is no longer a matter ofgreat urgency, that the portable component of the population and itsassociated problems have already been exported or will take care ofthemselves, and that the immobile componentbased largely on

FARM MANPOWER POLICY 101
what Reverend Weller 1 calls "Yesterday's People"are as well offin their current situations as they would be in any other that could bemade available to them. If in considering this question we are think-ing in terms of a manpower policy particularized to farming, I wouldbe doubtful; but if our thinking is in terms of affirmative actions tobring farm people and their occupations into the orbit of nationalmanpower policy, then I believe that the only reasonable choice is todo so.
Although remnants of Jeffersonian agrarian philosophy still sur-vive, they no longer have political significance. Whether deliberatelyor by default, most of the turning points other than those in laborstandards that commit farming to be a component of the industrialsociety have already been passed. What remains to be done are somefinishing and polishing of occupational status within commercial farm-ing and the clarification of complementary employment relations be-tween commercial fanning, noncommercial farming, and other ruralindustries.
INTEGRATING FARMAND NATIONAL MANPOWER POLICY
If the proposition is accepted that the manpower policy appropriatefor agriculture should not in objective be different from national man-power policy, several areas for development are indicated. These fallbasically into three categories. The first is the removal of a series ofstatutory discriminations incurred in the 1930s against farm workers.The second is a category of particular efforts by agencies to extend tofarm people the educational, training, and antipoverty program bene-fits for which they are eligible but which are not easily made availableto them because of remoteness, lack of information, and motivation.The third category of actions, which should be given considerablestress, has a broad environmental relation to the more specific man-power programs; it is the development of a more diversified, more ra-tionalized, and firmer employment base in rural communities.
1"Is There a Future for Yesterday's People?" Saturday Review, October 16,1965, pp. 33-36.

102 VARDEN FULLER
In this connection I shall promote the beliel that farm people un-dergoing occupational adjustment, and others as well, should havechoices other than the uncertain ones of moving into congested met-ropolitan centers. Correlatively, national and local government lead-ers should be concerned about amenities and the incurring of metro-politan congestion costs, while al??, in some rural areas incurring thecosts of depopulation. Finally, I Rill make the argument that the de-velopment of the rural nonfarm economy has suffered from politicalneglect and unimaginative conception.Eliminating Statutory Discriminations against Hired Farm Work-ers. In the legislative proceedings on fair labor standards, unemploy-ment insurance, social security, and labor relations much emphasiswas given to the particular characteristics of farm employment. At-tention was centered around the image of the working farm family as-sisted by the hired man who, after gaining experience and savingmoney, would advance up the ladder to a farm of his own. It was anidealized rich human relationship of pronounced congeniality and fra-ternity, one clearly not to be tampered with by regulations and legalconstraints.
For the incidental seasonal and temporary hired help there werethe burdens of having to keep formal payroll records, of having tomake detailed reports on wages, hours, and earnings, and of havingenforcement agents poking into the family business. Given the prevail-ing image of the family farm as a reference concept, the equity matterseemed direct and simple. If burdens and costs were to be imposed bylaw, they would fall directly on the farm family, which typically andon the average was too poor to absort any additional burdens. Con-sequently, since no other interest organization was present to chal-lenge the validity and universality of the family farm model, the apriori case for total exclusion of farm labor was quite readily estab-lished.
In specific detail, some telling objections could be raised againstminimum wages, unemployment insurance, and unionization for farmworkers. These objections were generally similar to or parallel withcounterpart objections made against any programs at all; but in theparticular environment of agricultural employment they had greaterpoignancy. The national minimum wage would have struck hard in

FARM MANPOWER POLICY 103
low-wage southern agriculture; short-term, seasonal hiring made itdifficult to apply the insurance principle of unemployment insurance;perishable crops and livestock were vulnerable if unionization were toresult in effective strikes.
Nevertheless from the legislative record we may reasonably inferthat the ability of Congress to find validity in these kinds of argu-ments was closely correlated with the presence or absence of counter-vailing political power. Had there been a greater balance of interests,legislative attention would likely have turned from thoughts of exclu-sion to thoughts about the possibilities of resolution, adaptation, andaccommodation.
The contemporary political environment in which these exclusionsof farm labor may be reconsidered is quite different from the one thatprevailed in the New Deal days. Because of the broad interest in un-employment, poverty, and underprivilege, substantial support fromoutside the farm worker population may now be expected. Whereasin the 1930s the issues between farm employers and hired farm work-ers were seen in rather restricted personal and equity terms, thesesame issues now would likely be seen and resolved in a broader con-text and one embracing the rights of individuals in industrial democ-racy and self-determination.
Even so, with reference to the removal of agriculture from the na-tional minimum wage (which is the only item in this category cur-rently being prop: --(I) some of the old arguments are still beingmade. The principal contention is that under a mandatory higherwage much of the employment of hand labor will be discontinued andthe work will be done by machines. There is unquestionably much va-lidity in this contention; further mechanization is likely in any eventbut under wage pressure it would be accelerated.
Because there are no effective barriers to entry into farm jobs thereis no question but that agriculture offers opportunities to low-produc-tivity individuals in work that does not have a high value. In a some-what obscure way, temporary farm work is as much conjuncture ofunsolved social and economic problems as it is an employment cate-gory. The cause and effect relationships that appear in this conjunc-ture are sometimes confusing. When the workers are found to be pooror destitute, farm wages and employment conditions are often

104 VARDEN FULLER
blamed. Actually, the cause and effect relationship, at least initially atthe time of entry into farm work, may be more the other way. Al-though farm workers may not have become poor from working in ag-riculture, they have become agricultural workers because they werealready poor. Thus in the sense of providing an opportunity for thosenot accepted elsewhere, temporary farm work may be regarded asameliorating poverty rather than causing it. Moreover, many individ-uals and groups have made their way through temporary farm em-ployment and into more acceptable situations in agriculture and else-where. Hence it has not been entirely a dead end.
Nevertheless, the maintaining of a segment of quasi-employment inagriculture is the counterpart of the ancient cottage industry systemand has the same propensity to disguise a backlog of unsolved socialproblems. If we were to imagine the situation in which problems oftechnological displacement, discrimination in employment, old age,mental and physical health, vocational rehabilitation, and educationwere all solved we would be imagining a situation in which very fewpersons would be available for seasonal farm work. It seems mostdubious that society does well by individuals who have the potentialof productivity and self-dependence and whose needs are therapeuticand rehabilitative if it preserves arrangements which obscure thesepotentialities and needs.
Extension of the national minimum wage will be a step towardclearing away this agricultural quasi-employment obscurity, but itcannot do the complete job. The therapeutic and rehabilitative meas-ures available through the current manpower training, employment,and anti-poverty programsall of which should decrease the amelio-rative dependence on farm workwill have to bear the majorburden.
And beyond the prospective results of these measures there is apervasive problem which may survive, which is the persistent down-ward pressure on factor earnings of labor, both self-employed andhired. Bishop dealt with some aspects of this situation in the firstchapter, but some additional comments need to be made.
Wage rates paid to hired labor and earnings of self-employed laborhave both been persistently low. Some explanations have beenoffered, but they are shrouded in obscurity partly because of the gen-

FARM MANPOWER POLICY 105
eral issues of farm depression, government policy, and ability to pay.As both self-employed and hired farm people have some mobility andcould presumably leave, we are impelled to the conclusion that theimplicit supply price of labor to agriculture is peculiarly different. Forseasonal and migratory hired workers there is the recharging residualsupplyfreedom of entry explanation which approaches being asufficient one. But this does not account for the persistence of low re-turns to the self-employed, whose numbers have declined sharply thelast quarter century.
In my view the downward pressure on labor earnings derives ini-tially from the particular attributes of the farm enterprise. There arelarge-scale farms in which the functions of manager and worker areclearly separated. In national proportions these farms are a small mi-nority, but in areas of concentration, particularly in California, theirnumbers are more than incidental and their share of output is impres-sive. Nevertheless, the implicit model quite subconsciously employedfor policy thinking and in the application of political perspective isthe family farm enterprise, the essence of which is self-employment,self-management, and self-capitalization, and in which hired farmlabor is supplemental and incidental. Self-employment of farm opera-tor and family members accounts for approximately 70 percent of thehours worked in the nation's agriculture.
For reasons that are difficult to explain in other than historical andideological terms, American farmers have established a behavior pat-tern giving primary emphasis to their roles as land owner and capital-ist; they have little regard for the roles of themselves and members oftheir families as self-employed laborers. The empirical evidence for
this conclusion and the mechanism through which it is made opera-tive are the market for land and the relationship between land valuesand farm income.
Since 1950 aggregate realized agricultural income has remainedsubstantially constant in current dollar terms. In this time farm popu-lation has declined by one-half and total man-hours used in agricul-ture by approximately two-fifths. Under these circumstances, accord-ing to classical economic theory, the a priori expectation would be
that the value of land should fall and the value of labor should rise.
But in American agriculture the classical logic has been inverted, for

106 VARDEN FULLER
the residual claimant is not land but labor. Accordingly, during theseyears the level of labor returns has changed very little, but the capital-ization of farm land has doubled.
In effect, the benefit of labor-saving technological advances hasbeen fully absorbed into land values. If land inflation had not oc-curred, the total dollar residual for labor would have been substan-tially constant through 1950-62; consequently, as man-hours oflabor declined the earnings per hour could have significantly in-creased. In 1962 the inflated value demands of land after 1949 werein effect costing something like 36 cents per hour of labor earning.2
Farm price-support programs, which characteristically have theireligibility embedded in land and its production history, contribute tothis situation. By their behavior in land markets, farmers have dem-onstrated that they are quite prepared to sacrifice current labor in-come in the competition to acquire land. The;.r behavior appears tobe built on the expectation that land inflation will continue indefi-nitely and that they will be able to realize compensatory income incapital gains.
It is quite apparent that in such a system of wage determination,full integration with the national wage structure will be difficult, be-cause in the national system wage determination emerges from muchmore clearly separated roles of labor, management, and investment.
Less than full employment is a deep affliction of the farm workforce. Yet the aphorism has validity that what farm workers need isnot unemployment insurance but more work. Admittedly, an insur-ance approach with tax premiums based on the expectation of con-tinued employment is not a satisfactory way to cope with a situationin which underemployment and unemployment in magnitude are thenormal expectation. Nevertheless, the needs are not met by the apho-rism; nor were they met by categorical exclusion.
The inherently biological peaks of seasonal activity are likely to re-main an intractable problem. The initial impact of technologicalchange was to aggravate this situation. This happened because peakseasonal hand-labor tasks, especially in the harvesting of fruits and
More details are contained in a statement prepared by the writer for theSenate Committee on Agriculture and Forestry which appeared in the Con-gressional Record, April 1, 1965, p. A1579.

FARM MANPOWER POLICY 107
vegetables, were left exposed after other tasks that had offered com-plementary employment were mechanized or transferred off the farm.The residual employment on the individual farm and in the area wasshorter in term and therefore less attractive to persons seeking con-tinuous employment. Moreover, the mechanization of some tasks inadvance of others has also left exposed situations, as in the instanceof cotton and grapes in California.
After mechanization of hand and stoop labor tasks, most of thestrife and hardship in the particular crop have seemed to disappear,although some of the work remaining still involves temporary sea-sonal employment.
Except for the mechanization of hand tasks, approaches to mini-mizing the impacts of seasonality have been mainly unfruitful exhor-tations. It has been declared that farmers should diversify their cropsand livestock in order to have a more continuous demand for labor.Or, alternatively, if individual farms were to be specialized in cropshaving peak labor needs, diversification should occur within the area.As most farming areas already have some diversification and somecomplementarity in seasonality, it has been proposed that there becentral pooling of various labor needs, thereby enabling more contin-uous employment of workers who would shift systematically fromone crop to another. This arrangement proved to be effective withMexican Nationals, British West Indians, and Puerto Ricans undercontract but has been less successful when no contractual relationsexisted.
Still another proposal occasionally made is that public employmentbe programmed counterseasonally, or that counterseasonal industriesbe encouraged to locate in farming areas.
That these various propositions have a record of failure (otherthan in the instances of pooling programs for contract foreign andPuerto Rican labor) is perhaps sufficiently explained by the unfoldingof experience. The farmers got their work done without it; there wasnot enough pressure upon them or upon government officials to moti-vate action.
I see no harm in letting unemployment insurance do what it can,especially for the more regularly employed farm hands whose situa-tion is about as the Act contemplates. For the remainder of the less

108 VARDEN FULLER
than full employment problem of both self-employed and hired work-ers, the main reliance will have to be upon occupational adjustmentthrough training and mobility and upon the development of comple-mentary seasonal employment in a diversified rural economy.
Exclusion of hired farm labor from the representation election andunfair labor practice provisions of the Labor-Management Relations(Taft-Hartley) Act in 1947 was an exercise of unilateral power byfarm organizations. Unlike minimum wages and unemployment in-surance, on which plausible if not necessarily inherently compellingarguments against coverage could be made, the case against labor re-lations had to rest on political power augmented only by broadlyshared anti-union sentiments.
Given the characteristics of farm employment and the compositionof the labor force, the obstacles to unionization are formidable evenunder the protection of the Act; other peculiar and particular obsta-cles (such as determination of the appropriate bargaining unit)would stand in the way of effective collective bargaining even ifunionization were attained. Consequently, eligibility for the moderateaids available under the Act does not guarantee unionization or col-lective bargaining, and in my view it is quite possible that there wouldnow be not much more of either if coverage had existed since 1947.
Nevertheless, there is something peculiarly diabolical in the dis-criminatory denial of aids to self-determination to a population seg-ment most in need of them. Moreover, there have been numerouschaotic strike situations (as this is being written, there is one in grapepicking in the Delano district of the San Joaquin Valley of Califor-nia) in which a determination of representation under the officialrules and procedures of the National Labor Relations Board ought tobe a benefit to the parties immediately concerned and surely would behelpful to the community at large, including especially those officialscharged with keeping the peace.Particular Efforts to Extend Vocational Education Training and Mo-bility Assistance to Farm People. In contrast to the discriminatoryexclusion of farm people from the labor statutes of the 1930s, farmpeople are fully eligible to participate in the contemporary education,manpower, anti-poverty, and community development programs. Theproblems lie in organizing projects and developing participation.

!L.
FARM MANPOWER POLICY 109
These contemporary programs are of the "outreach" type in the sensethat they depend upon initiative being taken by local governmentsand local community leaders for the utilization of the technical assist-ance and appropriations centering in federal government. Conse-quently, these programs are vulnerable to the influence of entrenchedpowers and interests, which may' prevent significant projects from get-ting started.
This vulnerability is particularly great in rural areas because of theinarticulateness of sparsely scattered people who might be potentialparticipants as against influential commercial farmers who may dis-favor projects which imply the prospects of reducing their labor sup-plies. Even if the local power structure may be affirmative to a partic-ular project there remain the difficulties inherent in a widely scat-tered, not well-informed, potential clientele.
As C. C. Aller reports in Chapter 7, the Department of Labor isputting considerable emphasis on its experimental and developmentprojects and on new arrangements including vocational training cen-ters to extend training programs into the rural sector. The early re-sults of the current training and mobility projects are not yet conclu-sive, but they do indicate promise and potential as well as the neces-sity for program personnel to acquire experience on tactical ap-proaches and arrangements.
In programs that depend so heavily upon local initiative there areseveral aspects of public administration that become critical. Two ofthese relate to the field organizations which function between federalauthority (program supply) and local clientele (program demand).Will the efforts of these agencies be coordinated and articulated orduplicated and diverse? How much constraint will come to bear uponlocal representatives of federal agencies by reason of political com-mitments to local power leadership?
The two most directly relevant general agencies which have out-reach facilities are the agricultural extension service, whose functionis primarily agricultural education, and the employment service struc-ture of the Department of Labor, which has specific program respon-sibilities in national manpower activities. Out of their respectivebackgrounds each of these organizations has acquired political alli-ances with commercial farming and with the leadership of farm or-

110 VARDEN FULLER
ganizations which tend to constrain them with respect to other sectorsof rural communities.
In these circumstances there are several possible alternatives: ( 1 )Amend the legislation to provide selective program authority and di-rect line agencies. (2) Create a new rural affairs agency or depart-ment to coordinate and proliferate currently authorized programs.(3) Endeavor to achieve maximum performance from the agenciesalready existing. For reasons which will be enlarged upon, the thirdalternative has practicality and also possibly enough potential to war-rant being given a reasonably extended trial period.Concluding Comment on Labor Policy Integration. Until 1964 con-gressional action consistently supported an ever-widening gap be-tween standards for labor in agriculture as against those in othermajor industrial sectors of the economy. In 1964 the Congress took asignificant step in reversing this direction when the authority for ad-ministrative action in contracting Mexican Nationals for farm laborunder Public Law 78 was not extended. Statutorily, this amounted toallowing the termination of a temporary war emergency measure en-acted in 1951 and subsequently renewed several times. Secretary ofLabor Wirtz quite correctly interpreted the congressional position asconstituting a policy declaration that agriculture should no longerhave an exotic labor supply but should obtain its workers from do-mestic sources and from internal labor markets. Nevertheless, during1965 incredible demands were made upon the Secretary of Labor toutilize executive discretion in nullification of legislative policy. Instanding firmly and resourcefully against these pressures SecretaryWirtz has secured the congressional step and has taken a giant stride
on the transitional route to integrating farm manpower into nationalmanpower policy.
rt.
DIVERSIFICATION AND DEVELOPMENTOF THE RURAL ECONOMYAS A SUPPLEMENT TO MANPOWER POLICY
Inherently the primary object of manpower policy is to promote indi-vidual occupational ability and self-dependence. For those who ac-

FARM MANPOWER POLICY 111
cept the proposition previously outlined, the object of farm man-power policy is to equalize the opportunity for achieving the aboveends as between those associated with agriculture and all others. Yet,as Dr. Tolley finds, the years to come will probably see ever less needand opportunity in farming. If so, does this imply that surplus farmpeople will have to continue to move to the cities even if prospectsthere are far from certain?
In the prevailing thought pattern, developed against a backgroundof an urban versus a rural-farm model, the impassive response to thisquestion is almost certain to be affirmative, but I believe that thispropensity to a dichotomistic view should be sharply examined.
As the substance of this section will be largely argumentative, itmay as well begin with an allegation: Because political and scholarlyattention has been polarized on the complex problems of the metro-politan centers, and in the rural scene upon the price and incomeproblems of the commercial farmer, the rural nonfarm sector of theeconomy has been neglected. Except for noting the untidiness ofurban sprawl, we have scarcely been aware that the decline in thefarm population has been offset by an increase in the rural nonfarmpopulation. Where rural depopulation has been evident there hasbeen concern about maintaining the service infrastructure. Much hasbeen said and much written about decentralization of industry, re-gional development, and community development. There has been anagency structure for the promotion of rural area development throughthe USDA and ARA. It would, however, be a considerable exaggera-tion to claim that the rural nonfarm population has received consid-eration in proportion to either the city or the farm populations.
A number of factors could well have produced a greater interest inrural nonfarm matters: (1) nonfarm people have outnumbered farmpeople in the rural population throughout the postwar years and noware four-to-one; (2) a significant and rising proportion of farmoperators have employment off their farms; (3) of the gainfully em-ployed population living on farms, two-fifths in 1960 reported non-farm occupations; (4) as shown by Bowles, seasonal and migratoryfarm workers characteristically obtain a considerable portion of theirannual employment in nonfarm jobs.
These facts demonstrate the existence of substantial complemen-

112 VARDEN FULLER
tarity in the relations between agriculture and other industries as wellas considerable individual versatility in transferring between farm andnonfarm occupations. Nevertheless, policy thinking seems to run inrather insulated farm versus nonfarm dichotomous terms.
Admittedly, being optimistic on the potential of a viable diversifiedrural economy rests more heavily upon imagination than upon evi-dence. But our thinking about decentralization of economic activitieshas tended implicitly or explicitly to carry the prefix "industrial."Thinking in terms of a model based on goods manufacturing has im-posed serious constraints on our imagination as to the activities thatcould be as economically carried on in the country as in the metropol-itan centers. If the hypothesis is valid that approaches to full employ-ment in the future will depend upon an increasing governmental com-ponent primarily centered on services, explorations are in order tofind optimum geographic location. Most frequently mentioned is rec-reation, which is favored by tradition and established practice but hasnot, I believe, begun to approach its potential. Retirement is a grow-ing and potentially very large "industry" in which rural areas havebeen variously involved. And finally there are the two very importantgrowth industries: education and health. Is it not reasonable to be-lieve that substantial proportions of the potential expansion in these ac-tivities could just as effectively be handled in the country as in the city?If the reckoning unit for costs and benefits is comprehensive enough,the social accounting would include substantial allowances for avoid-ing the infrastructural costs of congestion in the cities and also someof the burden of maintaining infrastructures for low-density ruralpopulations. And there are some collateral matters such as fresh airand clean water. Furthermore, in accordance with the usual patternof development, a complementary structure of enterprises for profitcould be expected to follow.
Federal initiative, with respect to the development of the agricul-tural component of rural life through the USDA and the related land-grant college-experiment station-extension structure, enjoys an illus-trious history. Political and professional leadership centering in andaround agriculture has not been unaware of the far-reaching environ-mental changes that press for a developmental approach less exclu-sively focused on the interests and needs of commercial farming. Such

FARM MANPOWER POLICY 113
a consciousness was embraced in the land-use planning approach of1938-42; it was explicitly integral to the Rural Development initia-
tives of the Department of Agriculture in 1956, which subsequentlyunder Secretary Freeman was broadened to the concept of RuralAreas Development, and in 1965 further broadened in name andconcept to the Rural Community Development Service.
It is not to be denied that the agencies and institutions centeringtheir activities on agriculture hold a valuable store of knowledge and
expertise on the many facets of rural community development. More-
over, from one staff member to the next their personnel probably hasa greater interest in community affairs than is manifest. The restrain-ing force lies in the pressures of farm politics which create an over-whelming demand for budget and program in alignment with the in-
terests of commercial farmers.However, the constraining influence of farm political pressures
should not be seen as an insurmountable obstacle to comprehensive
rural development. There is evidence that attitudes are changing;farm organization spokesmen are not being so stridently insistent
upon an agricultural focus for all agency activities; agriculturalagency people are showing interest and imagination in cooperatingwith the newly created agencies. The new Smaller Communities Pro-
gram initiated by the Department of Labor is a thrust into the arenaof interagency coordination toward the goal of meeting needs in
place.These comments have led to a three-part conclusion: (1) the po-
tential for development of economic diversity in rural areas is greater
than has yet been realized; (2) the restraints upon such developments
have been mainly political and organizational and are now becomingless repressive; and (3) integral to a manpower policy which seeks to
develop individual capacity should be the planning and promotion of
opportunities in other than the congested metropolitan areas. ThePublic Works and Economic Development Act of 1965 is a note-worthy new addition to our policy commitment in this direction, par-ticularly its Titles III and V, authorizing technical assistance, re-
search, and information, and also regional action planning commis-
sions,I wish to emphasize that in the foregoing remarks I am not sup-

114 VARDEN FULLER
porting any form of nostalgic agrarianism or any concept of "op-portunity homesteads." Self-sufficing and suboommercial farm pro-duction should be left to those who are affluent enough to afford it.The kind of development which I believe deserves consideration isneo-rural and pluralistic. It is neo-rural in the sense suggested by Wil-bur Zelinsky that marked differences in activities, interests, and atti-tudes need not characterize rural as opposed to urban living in thefuture, and that the future of the rural community need not be deter-mined by what happens in agriculture .3 It is pluralistic in the senseoutlined by Ginzberg, Hiestand, and Reubens in their book ThePluralistic Economy, which offers a perceptive analysis of the inter-relatedness in growth among the profit, the not-for-profit, and thegovernment sectors of the economy. In their concluding paragraph,'Ginzberg and associates interpret the established directions of changeto imply similar expectations and obligations for the future:
The progress of our economy depends on the efficiency of each ofits three sectorsprivate, nonprofit, and governmentand on co-operation i.nd complementary action among them. No sector byitself can provide all of the jobs that will be required by our ex-panding labor force. The nation has no option but to strive towardthe accomplishment of a satisfactory level of employment. A re-sponsible democracy adhering to its tradition and protective of itsfuture will seek to provide jobs for all citizens who are capable ofconstructive work. Only such a democracy will be able to com-mand the continuing support of its people.
In commending this conclusion I wish to emphasize that amenitiesas well as economies are to be achieved if in pursuing these objectiveswe endeavor to provide some latitude of choice between vertical andhorizontal living.
'See "Changes in the Geographic Patterns of the Rural Population in theUnited States, 1790-1960," Geographical Review, Vol. LII, 1962, pp. 492-524.*See Eli Ginzberg, Dale L. Hiestand, and Beatrice G. Reubens, The Plural-istic Economy, McGraw-Hill Book Co., 1965, pp. 217-18.

171
Manpower Development
Programs for Farm PeopleCURTIS C. ALLER
Manpower development programs for farm people is a very complexsubject, involving all the institutions, processes, and practices throughwhich our society imparts vocational skills and other work-related at-tributes to people who live or work in rural areas.
To see this subject in perspective, it is important to keep in mindthat manpower development is just one of a number of approachesincluded in the federal government's growing arsenal of manpowerprograms. The effectiveness of manpower development activities inmeeting the needs of workers, communities, and employers depends,in large part, on coordination with these other programs and on prog-ress in °the . fields of manpower policy. Gradually, the outlines of acomprehensive and cohesive manpower program have been emerging.This involves linking all existing manpower programs, including thosein the area of manpower development, into a coordinated effort tosolve problems, identifying gaps in existing services, and developingnew ways to improve the effectiveness of the processes and mecha-nisms of the job market. This constructive approach has been stimu-lated by the establishment of the Manpower Administration in theDepartment of Labor.
In achieving this approach we have found that the following aresome basic elements that deserve consideration for inclusion in anoverall program:
CURTIS C. ALLER is Director of the Office of Manpower Policy, Evaluation,and Research in the U.S. Department of Labor. This chapter is based on apaper prepared by Dr. Albert Shostack, whose assistance is gratefully acknowl-edged.

116 CURTIS C. ALLER
1. First, there should be explicit recognition of the Government'sresponsibility for taking active steps to help communities, industries,and individuals to overcome difficult manpower problems whichwould otherwise impose undue personal hardship or excessive strainson the institutions and processes of the job market.
2. Second, efforts to improve the effectiveness of manpower distri-bution and utilization require:
a. Improvement of information on employment opportunities andtrends.
b. Expansion of facilities for evaluating the interests and aptitudesof rural youths and adults, for vocational counselings, and forjob placement services.
c. Measures to assist farm workers who must migrate to outsideareas in search of a job.
d. Reduction in the use of foreign workers on United States farms,and better utilization of domestic seasonal farm workers.
e. Measures to structure and decasualize the job market for sea-sonal farm workers.
3., Third, there is a need to expand job creation efforts in agricul-tural areas. In addition to monetary and fiscal policy affecting theeconomy as a whole, the following steps deserve consideration:
a. Economic development programs in depressed areas.b. Expansion of job opportunities in conservation and beautifica-
tion programs.c. Specialized assistance to small farm operators, including devel-
opment of off -farm sources of income.d. Work experience programs to provide temporary employment,
training, and a source of income for unemployed rural workers.4. Fourth, labor standards should be improved. We need to de-
velop minimum wage legislation, closer regulation of child labor, bet-ter safety regulations, and improvement of the living and workingconditions of migratory farm workers. Of key importance would belegislation to protect the right of farm workers to join and bargaincollectively through labor organizations.
5. Fifth, a comprehensive manpower program for farm workersshould include income maintenance proposals such as unemploymentinsurance coverage, workmen's compensation coverage, and easier

MANPOWER DEVELOPMENT PROGRAMS 117
access to coverage under the old age and survivor's insurance kiN.6. Sixth, a systematic program of research into agricultural man-
power needs, problems, and solutions should be undertaken.7. Finally, for the rural sector as well as urban, a comprehen-
sive manpower program should include key manpower developmentactivities (a) to help individuals obtain the general education andwork skills they need to achieve their maximum skill and earnings po-tential, in line with their interests and aptitudes; and (b) to help meetthe complex skill requirements of the nation's employers. Elements ofa well-rounded manpower development program would therefore em-brace:
a. Measures to insure good elementary and secondary educationfor all young people in agricultural areas.
b. Financial assistance to help needy youngsters stay in school andto move on to higher education for which they may be qualified.
c. Effective vocational education, emphasizing skills in growingindustries and occupations.
d. Training and work experience opportunities for jobless out-of-school youth.
e. Retraining facilities for unemployed adults, supplemented byallowances to help them support their families during the train-ing period.
f. Facilities for part-time adult education to help employed work-ers upgrade and update their skills and knowledge.
g. Alternatives in the form of work opportunity or income main-tenance when work is not available or training not feasible.
h. Finally, sufficient income to bring families above the povertyline.
Clearly the components of a comprehensive manpower programfor people who live and work in rural areas are interrelated. The suc-cess or failure of any component depends on progress made on othermanpower fronts. Therefore, this chapter, directed primarily at man-power development, should be viewed in perspective as covering onlyone part of the rural manpower scene.
Even for this more limited terrain, it is important to recognize thatthe remarkable legislative advances of recent years, the ManpowerDevelopment and Training Act (MDTA), the Area Redevelopment

118 CURTIS C. ALLER
Act (ARA), Economic Opportunity Act (EOA), and the VocationalEducational Act (VEA), promise more than can be delivered. Weshould not forget that the size of the target groups is far larger thanour present resources can handle. Thus in the face of three millionunemployed workers, substantial involuntary part-time employment,and millions of underemployed workers who need upgrading to obtainor retain decent jobs, the MDTA program will be able to reach fewerthan 350,000 people this year (1965). This number includes 175,000institutional trainees, 100,000 to be enrolled in on-the-job training,some 50,000 to be served in experimental or demonstration projects,and much smaller numbers to be involved in labor mobility demon-stration projects, employee bonding demonstration projects, andother research-oriented activities.
Similarly, when we consider the millions of rural people who havemoved in recent decades from farm to nonfarm pursuits, from farmareas to cities, and from southern agricultural areas to northern andwestern slumswith virtually no federal government assistancethefewer than 100,000 rural people served so far under the MDTA andARA programs seem of small consequence. In fact, early programs toencourage land settlement and population movement, in rural areas,such as the Homestead Act, may represent a more active manpowerpolicy than any of our current operations.
Although I have some official responsibilities in the MDTA pro-gram, I do not view its relatively small size as a crippling handicap.Once we understand the limitations on MDTA resources, the need toderive the largest return from the limited inputs available suggeststwo main program approaches. First, it suggests that the MDTA pro-gram should be viewed as a pilot demonstration activity, stressing thedevelopment and testing of new approaches, checking ways of solvingfundamental problems, and giving leadership on the frontier of themanpower field.
Second, our limited resources suggest that MDTA services shouldbe aimed at people who have the most serious employment and voca-tional training problems, people who are least able to adjust on theirown to the drastic changes occurring in the job market, and who aremost likely to be missed by established manpower development andrelated services. This group would include unskilled workers with low

MANPOWER DEVELOPMENT PROGRAMS 119
educational attainment, minority group members facing barriers inmoving up the occupational ladder, the long-term unemployed, un-employed people moving to urban areas without vocational educationor financial resources, and people in chronically depressed areas. Byemphasizing assistance to these categories, federal manpower devel-opment programs can provide significant economic and social bene-fits; can help to ease the most severe personal hardships and socialand economic tensions; can avoid duplication of state, local govern-ment, and private manpower activities; and can generally derive max-imum effectiveness from their relatively small-scale resources.
Because of the limitations on our resources, and the need to con-trol and direct them toward the most important activities and long-run objectives, a basic change in MDTA program operations willshortly be put into effect. Up to now, because of the urgent need toset the recently enacted MDTA into motion, proposals for individualtraining projects have been developed on a local area basis with rela-tively little coordination or federal direction. Although these projectshave been effective in meeting the needs in many local areas, theyhave made it difficult to provide overall guidance and to achieve abalanced use of resources in the program as a whole. This procedurewill give way to a more systematic approachthe establishment of aformal system of national and state planning. The proposed systemprovides a means for participating state agencies to make their train-ing needs known to the national office in advance of each fiscal year.It also provides for annual national guidelines which will indicate thekinds of workers, industries, occupations, areas, and training ap-proaches that should be emphasized in the coming year's MDTA op-erations. We expect this kind of advance planning will assure a bal-anced use of MDTA resources to meet the most urgent needs of prob-lem groups and to test and demonstrate new methods for solving themost difficult manpower problems. It will permit priorities for serv-ices to be established in an orderly and systematic manner.
The proposed planning system will permit a careful review of thetraining needs of farm and rural nonfarm people each year and willhelp insure the provision of a fair share of the program resources tomeet these needs. With the help of national office review of the an-nual state plans, there should be assurance that farm people with the

120 CURTIS C. ALLER
most difficult training and employment problems are given specialemphasis and that they receive training for the most appropriatekinds of job opportunities. The planning system will also includesteps to consider the resources available from the "war on poverty"and from other programs, to help effect a coordinated approach tomanpower problems.
My central assignment for this conference, however, is to lookbriefly at the way our new tools have been used and to indicate thedirections for further advances. To do this it will be helpful to groupthe population into several categories which have distinctive needsand institutional arrangements, and to consider these groups one at atime. We will consider first the youngsters who are attending school,and then move on to the unemployed out-of-school youths, farm peo-ple who have jobs, unemployed adult workers, and special problemgroups.
IN-SCHOOL YOUTH
The first category to be considered are young farm people who areattending school. Perhaps this segment of the farm population re-ceives less attention than it deserves from planners of manpower de-velopment programs. This may occur because it is not an immediateproblem group. Youths in school do not present immediate questionsof joblessness, lack of vocational preparation, symptoms of socialdisorganization associated with idleness, or other deficiencies that the"problem groups" display. Yet, of course, meeting the manpower de-velopment needs of this group is essential for the long-run balance ofhuman resources and manpower requirements, for bringing out thefullest potential of both the individual worker and the overall econ-omy, and for prevention of the serious manpower problems that arealready of concern to us. This group is both an opportunity forour future and, more recently, the source of many of our presentproblems.
Like other youth, young people with farm backgrounds require agood general education as a basic preparation for the kinds of adapta-tions and adjustments they will face in the changing job market. They
1.

MANPOWER DEVELOPMENT PROGRAMS 121
require, also, realistic and early guidance toward occupational careersor toward higher education on the basis of a competent evaluation oftheir aptitudes, interests, and abilities, in the light of expert knowl-edge of prospective job opportunities. Finally, youngsters who are notgoing on to higher education should expect their schooling to providea good technical or other occupational preparation that would fitthem for at least beginner jobs in their chosen vocation.
We have certainly not been able to meet these needs for all farmyoungsters, and this has contributed to the unemployment and under-employment which some of the youths face later in life. There is aneed for new approaches in this fundamental area, so crucial to thecondition of the labor force of tomorrow. There are several situationsin which government action may be advisable.
First, a very obvious problem that lends itself to solution by gov-ernment action involves youths who are unable to complete their edu-cation because of inadequate financial resources. The solution to thisproblem is certainly more complicated than a system of grants orscholarships, because complex family and motivation factors may beinvolved. Nonetheless, the broadening of manpower developmentprograms in this area alone would probably go a long way toward al-leviating future manpower problems of greater complexity.
Federal action to help impoverished youthi complete school hasalready made a good start with the Department's NeighborhoodYouth Cops (NYC) established under the Economic OpportunityAct. The NYC provides paid work experience and related services toneedy youths, between the ages of 16 and 22, who require such as-sistance to increase their employability, or to help them continue theireducation. Enrollees are usually paid a minimum of $1.25 an L.for undertaking useful work under the supervision of state, local, orprivate nonprofit agencies. NYC projects have already been approvedfor almost 90,000 youths in rural areas. This number representsabout one-fifth of all the youths for whom NYC enrollment has beenauthorized. The great majority of the rural enrollees will be youths inhigh school who need supplemental earnings to continue their educa-tion.
The Economic OppOrtunity Act, the Education Act of1965, and other programs provide assistance for needy college stu-

122 CURTI& C. ALLER
dents, administered by the Department of Health, Education, andWelfare. The biggest remaining gap in removing financial obstacles toschool attendance, therefore, seems to concern younger children,below the age of 16. For some youngsters from poor families, com-pulsory school attendance laws alone cannot adequately insure ex-posure to a suitable level of education. We have learned of childrenwho still stay away from school for lack of proper clothing; childrenwho do not attend school because they must help farmworker parentsduring the harvest season; and children who do not do their best in
school because of inadequate diets, heating, or lighting at home.It would be advisable in manpower development terms to consider
ways of helping such youths under 16 meet their school responsibili-ties. One idea mentioned has been the reduction of the minimum agelimit for Neighborhood Youth Corps enrollees, from 16 to perhaps
14. Another possibility might be 'straight scholarships for some im-
poverished youngsters without requiring them to do outside work fortheir money. Alternatively, we can continue to view the young child's
school attendance as dependent on the overall resources of the par-ents, and explore family income supplements such as children's al-lowances, the so-called negative income tax, and modifications of
public assistance procedures..44, second difficult area is the choice of vocations by rural youths
whc aie attending school. In part, this problem of choosing a life's
work is shared with nonfarm people. To help them select appropriate
courses of education and training, youngsters are encouraged to make
some kind of tentative occupational choice years in advance of enter-
ing the labor force. Similarly, schools must make choices on the con-
tent of their vocational training based on estimates of what skill re-
quirements will look like years in the future. These decisions must be
made in the face of rapidly changing technology and manpowerneeds, with little knowledge of the independent and competing deci-
sions of other youngsters and of other schools. Obviously, manpower
development programs must place great emphasis on accurate assess-
ment of future manpower requirements and resources and on compe-
tent vocational guidance of in-school youth.Rural youngsters and their teachers have a special problem in this
matter. Since most rural youth have to look to nonfarm jobs as a

MANPOWER DEVELOPMENT PROGRAMS 123
means of earning a living, they face the most difficult employment
and training adjustments. Yet, in spite of the strong efforts of the em.
ployment service agencies, notably in the Smaller Communities Pro-
gram, and of educational authorities to bring services to rural areas,
we can be certain that many farm youths face major career decisions
without adequate guidance and support. Perhaps we should seek fed-
eral assistance to meet a goal, such as competent vocational counsel-
ing and evaluation services available to every school-age youth by
1970.A third problem area, noted by the report of a Panel of Consult-
ants on Vocational Education appointed by the Secretary of Health,Education, and Welfare in 1961, and by other sources, has been the
lag in gearing rural school systems to the vocational needs of farmyoungsters. Many rural schools have been unable to provide adequate
training for a broad spectrum of nonfarm occupations, particularlyoccupations suitable for those youths who are required to migrate to
cities to find work. There have been problems of procuring ade-quately trained vocational education teachers, expensive up-to-date
equipment, and appropriate school plants in rural areas. In somecases, training has continued to be given in traditional agriculturaloperations, even though most of the students would be unable to put
this kind of training to use.In this field the federal government can well expand its contribu-
tion. The federal role is easily justified because the out-migration ofrural youth makes it unfair to impose the entire cost of their educa-
tion on their home area. The Vocational Education Act of 1963 hassuccessfully broadened federal aid for vocational training in local
areas by updating the types of vocational training eligible for assist-
ance and by tying the training more realistically to current and antici-
pated job market needs. Much remains to be don4, however.
A promising approach is the development of a network of central
vocational training centers capable of preparing rural youths and un-
employed adults in a wide range of skilled occupations in which there
is reasonable expectation of employment. Such central schools, which
could support staffs of highly qualified instructors and the latest tech-
nical equipment, would provide a wider range of training for nonfarmoccupations, and of higher quality, than the typical local school in

124 CURTIS C. ALLER
rural areas. This idea received strong impetus in connection with ad-ministration of the MDTA program, which encountered high costs,questionable quality, and a limited range of training objectives in try-ing to set up training in some rural low-income areas. The VocationalEducation Act of 1963 already provides some assistance to stateagencies adopting the area vocational school concept; this programmay deserve to be expanded.The Office of Education of the Department of Health, Education,and Welfare is showing good leadership in the task of reorienting thevocational training emphases of rural schools to the needs of today'sjob market. The vocational training outlook for the upcoming genera-tion of farm youth is promising. I think that most will have beenequipped with the kinds of work skills and other attributes needed tofind a productive and secure phase in the work force.Finally, a fourth problem of relevance to farm youths in schoolconcerns the special needs of some particularly impoverished groups,such as may be found among Negroes in southern agricultural areas,residents of some Appalachian areas, and people of Mexican descentin the Southwest. Adaptation to the demands of the job market forsuch youngsters often requires more than the level of general educa-tion and vocational training available in their local schools. Many ofthese youngsters require a reorientation of folkways, attitudes, andcultural outlook to prepare them for unfamiliar urban and industriallife. Some grow up unfamiliar with the simpler requirements of theworld of work: basic hygiene, how to get about and use the servicesavailable in the city, and the discipline of industrial life.The schools, of course, cannot control the entire environment ofthe child; the child's subculture, parents, and friends exert powerfulinfluences on him. Nonetheless, a stress by rural schools on the formsof behavior and ways of thought that would help the farm child adaptto life and work in nonfarm environments is strongly suggested. Thisstress should begin at the earliest possible age; in this sense, ProjectHead Start is as much a manpower development program as theMDTA itself. I think that the desegregation of schools under the im-petus of court decisions and the Civil Rights Act is a most promisingdevelopment in this respect, in that it will expose increasing numbers

MANPOWER DEVELOPMENT PROGRAMS 125
of disadvantaged minority group children to the cultural patterns andexpectations of the larger society in which they live.
OUT-OF-SCHOOL, UNEMPLOYED YOUTH
I would like to turn now from youngsters in school to youths whohave completed or dropped out of school and who are unemployed orsubstantially underemployed. This area of jobless out-of-school youth
is one in which Department of Labor programs can and do play asignificant role. Through local offices and mobile units of state em-ployment service agencies affiliated with the Department of Labor,
many thousands of rural youth ;have ben tested, evaluated, coun-seled, and referred to the most appropriate job opportunity or toavailable government manpower programs. Federally subsidizedMDTA and ARA training projects have assisted some rural youth;
more than one-third of the MDTA trainees enrolled in rural areas todate have been under 22 years of age. Weekly youth training allow-
ances have helped provide a means of subsistence to young peopletaking this training. Significantly, the great bulk of the rural youths in
MDTA training have been enrolled in classes for nonagricultural oc-cupations, in which job opportunities are better than on farms.
The Department of Labor's Neighborhood Youth Corps program
also assists jobless farm youth. Although most enrollees now receiv-
ing paid work experience and related services under NYC are attend-
ing school, a significant number are participating in full-time work
programs for out-of-school youth. Such NYC programs would seem
to be of most benefit to youngsters who do not adapt readily to class-room-type training and to regular studies. The President's nationalbeautification program offers many opportunities for employing andtraining out-of-school NYC enrollees in rural areas.
Apprenticeship is a third youth program of great interest to the
Department of Labor. Unfortunately, opportunities for participationin formal apprenticeship programs, as an avenue for training forskilled blue collar jobs, are very limited in rural farm areas. We

126 CURTIS C. ALLER
should consider ways to expand these opportunities for farm young-sters.
There is a need for innovation in developing new forms of govern-ment assistance to youths who migrate from the farm to urban areas.Left on their own, many of these youngsters encounter serious per-sonal, social, and economic difficulties. Consideration might be givento setting up staging centers which would be available to counsel theyouths and help them make advance work and living arrangementsbefore their departure; youth hostels and reception centers whichcould provide temporary shelter, recreation services, and emergencyallowances for the youths after their arrival in the city; and relatedmeasures. Such facilities might alleviate the adjustment problems ofmany migrating girls and boys and prevent them from getting intotrouble or missing good opportunities in their new location.
A big problem for both farm and nonfarm people concerns thoseyouths who cannot adapt to formal schooling or training and who arealready showing behavior and attitude problems which interfere withlabor force adjustments. This difficult problem plagues our cities andis undoubtedly aggravated by the unaided and uncoordinated move-ment to cities of masses of farm people with low skill and educationalattainment, The Job Corps represents one hopeful approach towardproviding the basic environmental changes needed to help problemyouths adjust to the demands of regular employment.
Several exploratory projects have been undertaken under theMDTA to prepare prison inmates for decent jobs prior to their im-pending release, and to assist and train persons on parole. The resultsof these projects, so far, have been beyond our expectations, and weexpect soon to move to a far larger program.
Intensive consideration has also been given by the Manpower Ad-ministration to assisting youths with especially difficult employmentand training problems at the point where they are examined, tested,and rejected by Selective Service authorities. To date, the emphasishas been on trying to bring Selective Service rejectees into employ-ment offices for evaluation of their employment problems, for compe-tent vocational counseling, and for referral to appropriate services. Afurther step warranting consideration might be a voluntary trainingprogram to remedy educational and training defects for those 'eject-

MANPOWER DEVELOPMENT PROGRAMS 127
ees who would like to have the opportunity to serve in the ArmedForces.
EMPLOYED WORKERS
A third category of farm people, the workers who are fully employedor who are not severely underemployed and who prefer to remain intheir current occupation, also have important needs. Since they pre-sent no immediate problem, our tendency might be to overlook theirmanpower development at this time. But like employed nonfarmworkers, these farm people should have opportunities to upgrade andupdate their skills, to remedy educational deficiencies, to prepare foroccupational changes that might occur in the future, and to otherwiseimprove their knowledge and earnings potential. The wide range ofpublic night schools and other part-time educational facilities foundin urban areas is not matched in most farm areas. Certainly, the up-grading and other training programs of large private industrial em-ployers are not found on even very large agricultural establishments.We might well consider, therefore, ways to encourage the develop-ment of part-time general education and vocational training facilitiesfor employed people in rural farm areas.
The situation is considerably different for farm operators. The De-partment of Agriculture has long maintained widespread training fa-cilities for farmers and their families, ranging from homemakingpractices to agricultural and construction methods and management.The Extension Service and other agricultural agencies are well-knownforms of manpower development.
The MDTA gave special recognition to the needs of small farmoperators by permitting members of farm families with annual in-comes of less than $1,200 to qualify for weekly living allowances andtraining. A significant number of people have qualified under thisprovision.
It is of particular interest to note that MDTA training has been au-thorized for well over 2,000 individuals for the occupation of farmoperator. By the end of September, 1965, about 1,200 were in train-ing or had completed training for this occupation under the MDTA,

128 CURTIS C. ALLER
and others have been trained as farmers under the Area Redevelop-ment Act. Generally speaking, the participants in these courses aresmall farm operators whose personal abilities and land resources havepotential for future development. They are taught to improve farmingpractices, adopt the latest methods and equipment, grow new crops,improve management and administrative skills, and otherwise to in-crease their returns so as to earn an adequate livelihood. Typically,the training programs are meshed with supportive services providedby organizations affiliated with the Department of Agriculture andother agencies in the local area.
A large proportion of the small farmers participating in these train-ing programs are in Puerto Rico. Most other particimints are minorityracial group members, for example, Indians in Arizona and Montana,nonwhites in Tennessee. Small farmers in several Appalachian areashave been aided. The few programs that have already been completedwill be evaluated intensively to see whether this type of training isfeasible and whether it can make a place for competent small farmoperators in selected segments of the agricultural economy.
UNEMPLOYED FARM WORKERS
Unemployed and substantially underemployed farm workers are mynext category for discussion. This is the group which is the main con-cern of the MDTA program. This category of workers could be sub-divided into smaller groups for analysis purposes, distinguishing theneeds of small farm operators, unpaid workers who are members oftheir families, year-round farm hands, and seasonal hired farm work-ers. For purposes of this paper, however, the group will be discussedas a whole.
Estimates of the participation of rural and farm people in theMDTA program are still rather rough. As many as one out of everyfive MDTA enrollees lives in rural areas, as defined by the census.This would mean that training and related services have been author-ized for about 100,000 to date, including some ARA participants.We know that 7 out of 10 MDTA enrollees in rural areas are males,
MANPOWER DEVELOPMENT PROGRAMS 129
more than one-third are less than 22 years of age, and 15 percent arein the "older worker" group, 45 or more years old.
Turning to the occupational objectives of the rural enrollees, wefind that only 7 percent have been trained for farm occupations. Mostof the men have been trained for skilled and semiskilled blue collarjobs, and the women have tended toward clerical, sales, and servicejobs. In particular, very few of the younger trainees were enrolled incourses for farm occupations; they were directed to nonagriculturaloccupations with expanding manpower requirements.
Although relatively few rural enrollees are being trained in agricul-tural occupations, a substantial proportion of those who previouslyworked on farms are receiving training in advanced farm skills. Fullyhalf the approximately 11,000 enrollees who reported farm work astheir primary occupation are being trained for agricultural jobs.' Thegreat bulk (95 percent) of these workers are males; about one-fourthare nonwhite. Most farm workers who have not been assigned to ag-ricultural training are being prepared for skilled and semiskilled bluecollar occupations.
All told, only about 15,000 of the half million trainees authorizedunder MDTA and ARA have been assigned to training for agricul-ture.2 The workers selected for farm courses have generally had farmbackgrounds, even when agriculture was not their primary job. Theyare unemployed or underemployed farm people for whom the learn-ing of advanced agricultural skills represents the most advantageousadaptation in the job market. Emphasis has been placed on selectingthe kind of applicants who would have difficulty in adapting to non-farm jobs, moving to urban settings, and undertaking new ways of lifeand work.
Three out of five of the enrollees preparing for farm occupationshad never progressed beyond the eighth grade. Almost 30 percent are45 or more years old; this is almost triple the proportion of olderworkers in the MDTA program as a whole. Only 17 percent wereyouths under 22 years of age, fax fewer than in nonfarm MDTAcourses. One-fourth of the trainees are nonwhite; others belong to theethnic or language minority groups. Most of them had very low earn -
iData through September 1, 1965.2 Data through September 30, 1965.

130 CURTIS C. ALLER
ings in their last regular employment before entering the training pro-gram; one-third of the nonwhites had earned less than 75 cents perhour. Many of the adult trainees had not held any regular employ-ment in the past at all. For such people, training for steady work onfarms in their home areas may be of the greatest long-term benefit.
The agricultural occupations for which training is being providedfall into several categories. The largest category, about 55 percent ofthe total, consists of the relatively skilled farm occupationsfarmequipment operators, dairymen, foremen, tree pruners, and the like.Next in volume, about one-fourth of the total, is training for smallfarm operators, mentioned previously. An important third category,accounting for slightly less than 20 percent of authorized trainees,consists of jobs that are related to agriculture but involve work in anurban or nonfarm setting. These jobs include, for example, nurseryattendants, park caretakers, and gardeners. Demand in these occupa-tions is rising. Recently, attention has also been given to trainingAmerican workers to replace foreign labor on United States farms. Arecent example is the negotiation of an on-the-job training project toprovide short-term training under MDTA for 500 workers in theFlorida citrus harvest.
Where it is advisable to retrain farm people for nonfarm jobs, par-ticularly away from their home area, we have learned that the train-ing is more effective when accompanied by appropriate supportiveservices tailored to their special needs. For example, this may involveproviding housing for migratory farm families near the training site;intensive counseling; training in hygiene, proper food habits, and pat-terns of acceptable behavior; demonstration of the use of modern ap-pliances; arrangements for a flexible trailing schedule adapted tovariations in seasonal labor requirements; individual tutoring; andremedial education. For some workers, training involves a transitionfrom outdoor to indoor work, from active labor to sedentary activity,and from the use of heavy tools to the use of delicate instruments. Ineffect, basic changes in way of life often accompany the occupationaltraining of farm people.
After training, some workers from farm areas need assistance inmoving to locations where jobs are available in their r tw occupation.We have done some preliminary experimental work in assisting such

MANPOWER DEVELOPMENT PROGRAMS 131
moves by means of labor mobility demonstration projects authorizedon a relatively small scale by Section 104 of the MDTA. These proj-ects, involving grants and loans for moving expenses, assistance in ar-ranging employment opportunities, and provision of counseling serv-ices will be evaluated and their experience will be utilized to makeour assistance for farm people more effective.
There are three areas on which attention may profitably be focusedto improve ways of meeting the manpower development neees of un-employed farm workers. First, more attention should be given to co-ordinating the several program activities now available to assist theseworkers. A more effective use of our resources would result from co-ordination of efforts under the MDTA, the Public Works and Eco-nomic Development Act of 1965, the basic education and farmworker assistance programs of the Economic Opportunity Act,Community Action Programs under the Economic Opportunity Act,the Department of Agriculture, and other available resources. This isnot intended as criticism; most of the programs are practically new-born. We are beginning to explore with these other agencies effectivemethods of coordination.
Second, we should consider new ways to facilitate the adjustmentof farm people who migrate to urban areas. Guidance and stagingcenters in the farm areas, reception centers in urban areas, specializedforms of financial assistance, and a variety of down-to-earth, bread-and-butter services deserve consideration. I think that our public pol-icy has progressed to the point that the nation is unwilling to acceptthe social and economic hardships that go along with the haphazardmovement of masses of ill-prepared people to urban slums. If we donot bring order to the migration process, and help the individuals un-derlying the massive statistics, society will pay higher costs in theform of welfare burdens, delinquency, and similar problems.
In the Office of Manpower Policy, Evaluation, and Research theneeds of farm people on the move will receive significant attention inexpanded research activities, emphasizing basic information neededfor planning action programs. An example of what can be done is aspecific research project being developed in Washington with a com-petent nonprofit research organization. This study will effectively ana-lyze the characteristics and experience of recent migrants from rural

132 CURTIS C. ALLER
to urban areas. The migrants will be identified through their children,utilizing the resources of urban school systems. The migrant parentswill be interviewed to determine their work and residence histories,employment status, adjustment problems, and training needs. If ap-propriate, the parents will be referred to public employment serviceoffices for any necessary assistance.
This experimentation with the early identification of rural in-mi-grants may not only provide a source of information on the character-istics, motivations, and experiences of the in-migrants but mz v alsohelp to ascertain the kinds of services such people need to avoid be-coming welfare cases or members of the hard-core unemployed.
Third, experience with the Neighborhood Youth Corps work expe-rience program for youths indicates the feasibility of undertaking pro-grams of work experience for unemployed adults as well. Such pro-grams may be particularly useful in increasing the employability ofjobless farm workers who cannot easily adapt to formal training andwho learn best by doing practical tasks. A small-scale work experi-ence program oriented to adults on public welfare rolls is already un-der way, stimulated by new resources made available by Title V of theEconomic Opportunity Act. Extension of this concept as a manpowerdevelopment tool, rather than a welfare tool, is well worth consid-ering.
SPECIAL PROBLEM GROUPS
The final category of agricultural workers to be mentioned consists ofthose special groups whose needs cannot be met by generalized pro-grams but who require services tailored to their unusual characteris-tics and problems; for example, migratory and Indian farm workers.A great deal can be done for these special groups under Title III-Band other sections of the Economic Opportunity Act. The Bureau ofIndian Affairs also has programs in the manpower developmentfield.
The most significant contribution of the Manpower Administrationto meeting the needs of these special groups has been through exper-imental and demonstration projects. These so-called E & D projects,
MANPOWER DEVELOPMENT PROGRAMS 133
undertaken under the MDTA, are used to test or demonstrate newways of meeting especially difficult manpower needs, of identifyingand solving problems, and of assisting particular types of workerswha are likely to be covered inadequately by existing manpower de-veltopment services. Through last June, almost 10,000 disadvantagedrural people received training or other services in these E & Dprojects.
Typically, the projects are conducted by local governments, non-profit welfare groups, and community organizations under contractwith the Department of Labor. In the projects for rural people, theorganizations involved have included land grant colleges, churchgroups, such as the Migrant Ministry of the National Council ofChurches, and national organizations serving impoverished agricul-tural people.
The emphasis in the experimental projects for rural people hasbeen on developing new ways of reaching and gaining the confidenceof disadvantaged groups, new ways of teaching .ahem needed workand social skills, intensive job development efforts, and efforts tomeet the total needs of the family and to improve the overall socialand cultural setting. E & D projects have included efforts to tailortechniques to meet the special needs of minority group workers andof migrant workers; development of new sources of labor supply tosupplant foreign workers on United States farms; development of off-farm job opportunities to provide income in slack seasons; provisionof job information, training, and counseling to help farm workers in-crease their earnings; assistance in moving to new areas where per-manent jobs are available; and provision of basic remedial educationto help workers qualify for further vocational training. One project,conducted in several scattered areas, tried to determine whether care-fully supervised work on farms, associated with preconditioning activ-ities, counseling, and supportive services, can improve the work orien-tation and attitudes of problem youths from urban areas.
In the 1965 amendments to the MDTA, Congress gave special rec-ognition to the role of E & D projects in spearheading the manpowerdevelopment program, and it earmarked resources to operate E & Dprojects. A separate Office of Special Manpower Programs has beenset up in the Manpower Administration to handle this type of work,

134 CURTIS C. ALLER
and an advisory board of distinguished experts will soon be estab-lished. They will be devoting a substantial amount of attention tomeeting the needs of farm people in the program for the coiningyear (1966).
CONCLUSION
I have touched but briefly on some of the important manpower devel-opment needs of our rural population. The problems in this area arevery substantial and long standing; the solutions are slow and un-dramatic. Yet we do know a great deal about what has been happen-ing in agriculture and why. This is clearly revealed in the analysespr 3sented by the other participants in this conference. The task nowis to utilize our present knowledge and grc, ring administrative capac-ity so as to move beyond tokenism toward broad and pervasive solu-tions.
Because I have emphasized the topic of manpower developmentprograms, I would like to stress again the obvious fact that such pro-grams alone cannot solve all agricultural manpower problems. Man-power development programs should merely be one part of a co-ordinated approach to the problems of rural people, tied to programsof better distribution and utilization of workers and to improvementsin wages and labor standards. In particular, there are two approachesthat deserve, in my opinion, immediate consideration for solving keymanpower problems.
First, of particular value for seasonal farm workers would be aprogram to structure the agricultural job market and to decasualizeworker-employer relationships. Such a program would attempt tochange prevailing patterns of short-term jobs, intermittent employ-ment, migrancy, and casual day-to-day employment relationships. Itwould seek to modify the specialized institutions of the farm jobmarket, such as the labor contractor ''stem, the crew system, day-haul recruitment, and payment on a piece rate basis. The goal wouldbe more systematic distribution and utilization of farm workers, guar-antees of more regular employment and income, and more stable em-ployer-employee relationships through the development of ingenious

MANPOWER DEVELOPMENT PROGRAMS 135
new institutions and practices. The Annual Worker Plan developedby the Federal-State Employment Service system shows, in a prelimi-nary way, what can be done by creative thinking along these lines.The work of the late Lloyd Fisher,8 in his book "The Harvest LaborMarket," is also suggestive in this area. My own studies on the de-casualization of the agricultural industry in Hawaii have convincedme that such bold new apprcaches are feasible. But if this is to hap-pen it will require, I think, the strategic intervention of the academiccommunity. Both innovative thought and hand research work arenecessary.
The second key area to which I would urge earnest attention is thescandalous use of the public welfare system to subsidize employers ofagricultural labor. Drawing on the pool of welfare recipients, farmoperators are assured of an adequate labor supply when and whereneeded, simply returning the workers to the relief rolls for storageduring lulls in labor needs. The farm operators thus escape the respon-sibility normally imposed on employers in nonagricultural industries toprovide regular employment and adequate earnings, supplemented byunemployment insurance coverage and a variety of fringe benefits,sufficiently attractive to draw and hold a stable work force. At thesame time, individual relief recipients are not helped to make long-range adjustments in the job market. Using public assistance in thisway, with its high social and human costs, is the antithesis of thehuman resource development approach that we should be following.
The new wave of government manpower development activities
which has emerged over the last few years can be used creatively to
bring unemployed and underemployed rural people into the main-stream of the nation's productive life.
'Lloyd H. Fisher, The Harvest Labor Market in California, Harvard Uni-versity Press, 1953.

Index
Agriculture: primary emphasis in pol-icies and programs, v; fundamental-ism, 6-7; impediments to structuralchange, 14-15; lack of explicitmanpower policy, 15-17; emphasison product markets, 16; low socialstatus, 61; historic attitudes toward,98-99; political attitudes toward,98-99
Agriculture, Department of: failureto analyze effects of national un-employment on farm, labor, 58-59;attitude toward Negroes, 61; ruraldevelopment agencies, 113; Exten-sion Service, 109-10, 127; trainingfacilities, 127-28; need for coor-dination of programs with otheragencies, 131
Annual Worker Plan, 135Antipoverty programs, 108-9, 120Appalachian area, 124, 128Area Redevelopment Act, 117-18,
128-29Arizona, 26, 128Arkansas, 24
British West Indians, 107
California, 24, 26, 105, 107Capital, substituted for manpower, 3-
5, 15Caribbean area, 61nCasual workers, 21, 28, 34-35; earn-
ings and employment, 30; excludedfrom labor legislation, 102
Census, Bureau of the, surveys, 19 ff.Children, migratory, 26
Collective bargaining, 32, 108Community Action Programs, 131Community development programs,
108-9Conservation, v, 16Contract labor, 107, 110Corn Belt, 5-6Cotton: utilization of labor, 24; sea-
sonal employment, 42, tables 44,45; man-hours, table 43; potentialdemand and labor coefficientchange, 46-47; elimination ofhired labor, 50; effects of mechani-zation, 107
Credit programs, v, 16Crew leaders, 26Crops: man-hours, table 43; seasonal
employment, tables 44, 45; diversi-fication, 107
Dairy: utilization of labor, 24; man-hours, table 43; potential demandand labor coefficient change, 46-47
Demonstration projects, 118, 131-33Disability insurance, 32Diversification, 107, 110-14
Earnings: low levels, v, 53-56; com-pared to nonfarm, 5-6; of hiredfarm workers, 28-31, 53-56, 85n,103-5; in South, 68; effect of localnonfarm unemployment on, 78; anddistanc( from SMSA, 82; related topersonal characteristics, 85; down-ward pressure on, 104-6; see alsoIncome; Wage rates

138 INDEX
Economic Development and Man-power Requirements in the South(Maddox), 59-60
Economic Opportunity Act, 26, 121,131-32
Economic Report of the President(1964), 38
Economic Research Service surveys,19 ff.
Education: farm-oriented, inefficient,v, 7, 9, 16; need for nonfarm train-ing, v, 10; of hired farm workers,32; among farm-worker households,33, 38-40; relationship to income,38-39; increased rate of investmentin, 66; discrimination in, 66-C7; lowquality of rural, 67; economics of,68-69; and mobility, 85, 94; medianyears, urban vs. rural, 95n; sub-sidized, 96; vocational training andmobility programs, 108-9, 120-25;economic assistance programs, 121-22; special group problems, 124;see also Vocational training
Employee bonditlg demonstrationprojects, 118
Employer organizations, 98-100Employers, subsidized by welfare sys-
tem, 135Employment: average annual for hired
farm workers, 30-31; continuity,32; average annual seasonal, bytype of worker, table 43, by crop,table 44, by crop activity, table 45
Europe, Western, 3Experimental projects, 118, 132-33
Factor market, v, 16Fair Labor Standards Act, 99Farm families: income, v, 1-2, table
2; occupational inheritance, 7-9,table 8; average annual employ-ment, table 43; incidence of povertyamong, 67; underemployment, 97;idealised concept, 102; self-concept,105; financial assistance for, 127;training facilities for, 127-28; seealso Farm operators
Farm operators: average age and valueof farms, 14; projected decline infamily labor, 41-42; labor input,42; average annual employment,table 43; effects of technologicalchanges on, 47-49; boxed-in, 51-52; possible reasons for low earn-ings, 53-56; obstacles to mobility,55; Negro, 60; retirement vs. entryrates, 72; multiple job holding by,74-76, 111; percentage with non-farm Social Security coverage, 75;backflow, 77-78, 93; effects of localnonfarm unemployment on earn-ings, 78; industrial distribution ofwage jobs, table 88; distribution ofoccupations, by age, table 91; in-come parity applied to, 98; down-ward pressure on earnings, 104-6;self-concept, 105; training pro-grams, 127-28; exploitation of wel-fare system by, 135
Farm organizations, 108-10, 113Farm population: projected, table 10-
11; changes in, since 1920, figure12
Farms: number of, 1; distribution, bysales and income, table 2; increasein size, 4; specialization, 4; changesin organizational structure., 4; valueand average operator age, 14; pro-jected decline in number, 41; valueof Negro and white in South, 60;percentage in South, 68; large-scale, 105; see also Farm families
Farm-worker households: defined, 32;number and populaion, 32; propor-tion of white to tic/white, 32; pro-portion of children and youths, 32-33, 39-40; average size, 33; sex andage distribution of household head,33; educational level, 33, 38-40;income, 33-14, 38-,t0; migratorystatus, 31; with minor dependenceon farm wage work, 34-35, 38-39;earnings from hired farm work, 34-37; with moderate dependence onfarm wage work, 35-39; with, pri-

mary dependence on farm wagework, 37-39
Federal-State Employment Service,135
Feed grains, see GrainsFisher, Lloyd, 135Florida, 24, 26Foreign nationals, 20n, 22, 100, 107;
principal users of, 24; number au-thorized (1965), 24; effect of useon wage rates, 55; contract labor,107, 110
Freeman, Orville L., 61n, 113Fringe benefits, farm vs. nonfarm, 30Fruits, 24, 42, 106-7; man-hours,
table 43; seasonal employment,tables 44, 45
Ginzberg, Eli, et at., quoted 114Gisser, Micha, 68, 69Grains: man-hours, table 43; seasonal
employment, table 44; potential de-mand and labor coefficient change,46-47
Grapes, 107Griliches, Zvi, 68
Harvest Labor Market in California,The (Fisher), 135
Hay: man-hours, table 43; seasonalemployment, table 44
Health, Education, and Welfare, De-partment of, 122, 124
Herbicides, 47, 50Higher Education Act, 121Hired farm workers: occupational in-
heritance, 7, table 8; source of data,19; numbers, 20; foreign nationals,20n, 24, 100, 110; types of, 20-21;casual, 21, 28, 30, 34-35, 102; reg-ular, 21, 24, 28, 30-31, 72; seasonal,21, 28-29, 31, 42, 48, 98, 102, 111,134-35, tables 44, 45; characteris-tics of, 21-22, 25, 32; man-daysworked, figures 22, 23; migratory,22, 25-28, 30-31, 38-39, 98, 107,111, 132-35; chief activity, figure22; distribution, 22-24, figure 23;
INDEX 139
utilization of, 24; mobility, 24-28,72, figure 27; work patterns, season-al, 28-29; earnings, 28-31, 53-56,85n, 103-5; employment, 28-31,98, figure 29, tables 43, 44; fringebenefits, 30; households, 31-40; ex-cluded from labor legislation, 32,99, 102-3; projected decline in man-hours, 41-42; effects of techno-logical changes on, 48; impacts ofminimum wage legislation on, 50-51; median age, 72; retirement vs.entry rates, 72; multiple job holdingby, 74-76; ages of peak earnings,85n; industrial distribution of wagejobs, table 88; distribution of occu-pations, by age, table 91; parity con-cept not applied to, 98; unioniza-tion, 102-3, 108; eliminating statu-tory discrimination against, 102-10;training programs, farm and non-farm, 128-30; relocation programs,130-32; exploited by welfare sys-tem, 135; see also Labor, farm
Home ownership, 64Homestead Act, 99, 118Housing, 32
Illinois, 24Income: farm vs. nonfarm, 1; off-
farm, table 2; and seasonality, 15;of hired farm workers, 28-32, offarm-worker households, 33-40; re-lationship to education, 38-39; ofmigratory workers, 39; functionaldistribution, 63-65; changes in sup-ply of sources, 65-69; differentialsof off-farm movers, tables 84, 92;negative function of mobility, 85;and backfiow, 92-93; parity con-cept, 98; relation to land values,105-6; see also Earnings; Wagerates
Indian Affairs, Bureau of, 132Indians, 32, 128, 132Interest groups, 99-100, 102-3, 108-
10, 113Iowa, 24

140 INDEX
Japanese, 32Job Corps, 126Job market, see Labor marketJob Tenure of American Workers
(Hamel), 73Johnson, Harry G., quoted 59
Labor, Department of: failure to ana-lyze effects of national unemploy-ment on farm labor, 58-59; respon-sibilities in developing occupationalmobility, 77; farm placement serv-ice, 99-100; training and mobilityprograms, 109, 125-26; employmentservice, 109-10; Smaller Commun-ities Program, 113, 123; ManpowerAdministration, 115, 132-33
Labor, farm: current concerns with, v;low return for, v, 1, 5-6, 15, 53-56;substitution of capital for, 3-5, 15;returns vs. productivity 6; over-supply, 6, 11, 13, 56-57; impedi-ments to mobility, 6-15, 54, 59, 71,77-78, 94, 96; occupational alterna-tives, 13; unemployment and olderage groups, 14; productivity andseasonality, 15; excluded from laborlegislation, 15-16, 32, 99, 102-3,108; projected decline in man-hourinputs, 41-42, table 43; annualaverage employment, table 43; po-tential effect of technologicalchanges, 45-52, table 46; lack ofskills, 54, 56, 63; effects of increasedproductivity, 56-57; effects of un-employment, 57-59, 78; median ageof whites and Negroes, 62; invest-ment approach to increased earningcapacity, 62-69; effect of increasedschooling on, 68-69; importance ofnonfarm opportunity for youth, 73;male-female competition, 78; mobil-ity near urban centers, 78-83, tables80-81, 83; manpower policy inte-gration, 101-10; central pooling of,107; contract, 107, 110; exploita-tion by welfare system, 135; seealso Hired farm workers; Man-power
Labor camps, 26Labor contractors, 26Labor legislation: exclusion of farm
labor from, 15-16, 32, 99, 102-3,108; and migratory workers, 26;termination of P.L. 78, 110
Labor-Management Relations Act,108
Labor market: for Negroes in agricul-ture, 59-62; male-female competi-tion in, 78; competitive position ofrural farm people, 79-83; and farmwork force, 86-95, tables 87, 88,89, 91, 92
Labor Relations Act, 99Land: obstacles to efficient transfer of,
14-15; policies, 99; values in rela-tion to income, 105-6; capitaliza-tion of, 106
Land-grant college system, 99Land use, v, 16Livestock: utilization of labor, 24;
man-hours, table 43; seasonal em-ployment, table 44; potential de-mand and labor coefficient change,46-47
Maddox, James, 59Manpower: transfer to nonfarm resi-
dences, 2; determination of needs,3-5; substitution of capital for, 3-5, 15; transfer from farm to non-farm occupations, 5-6, 9; supplyand demand, 6; impediments tomobility, 6-15, 54, 71, 77-78; off-farm migration, by age, 9-13, table10-11, figure 12; male farm popula-tion, projected, table 10-11; back-flow, 12, 14, 77-78, 92-94; defi-ciency of demand hypothesis, 13;see also Labor, farm; Manpowerdevelopment programs; Manpowerpolicies
Manpower Development and TrainingAct, 117-20, 123-33 passim; experi-mental and demonstration projects,132-33; 1965 amendments, 133
Manpower development programs,115 ff.; objectives, 115-17; voca-

tional training, 118; demonstrationprojects, 118, 132-33; for in-schoolyouth, 120-25; for minority groups,124; for out-of-school, unemployedyouth, 125-27; for employed work-ers, 127-28; for unemployed farmworkers, 128-32; for special prob-lem groups, 132-34
Manpower policies: goals, 16-17,110-11; controlled by interestgroups, 99-100, 102-3, 108-10; in-tegration of, 101-10; and rural areadevelopment, 110-14; farm vs. non-farm views, 111-12
Manpower Policy, Office of, vi, 131Markets, for U.S. farm products, 3Mechanization, see Technology, in-
novations inMexicans, 100, 107, 110Migrant Health Act, 75Migration, 5, 9-13, table 10-11, figure
12; rate, hired farm and nonfarm,compared, 25; effect of increasededucation on, 68; long vs. short dis-tance, 76; hardships of, 97; need forurban assistance facilities, 126;training and relocation assistance,130-32; see also Manpower devel-o.)ment programs; Mobility
Migratory workers, 22, 25-26; travelpatterns, 26, figure 27; earnings andemployment, 30-31, 38-39, 98;number of households, 34; and elim-ination of labor, 51; and multiplejob holding, 76; contract labor, 107;nonfarm employment, 111; man-power development programs, 132-33
Minimum wage legislation, 32, 50-51,108; inappropriate for farm labor,55, 58; arguments for and against,102-4
Minority groups, 124-25, 128-30,132-33; see also Negroes; Non-whites
Mobility: impediments to, 6-15, 54,59, 71, 76-78, 94, 96; backflow, 12,14, 77-78, 92-94; geographic, ofhired farm workers, 24-28, figure
INDEX 141
27; rates, 25, 97; and minimumwage, 51; and education, 68, 85, 94;processes of, 71-77; and nonfarmunemployment rates, table 74; andmultiple job holding, 74-76; fac-tors influencing, 77-85; and loca-tion, 78-83, tables 80-81, 83; andage, 84, 90, table 91; and personalcharacteristics, 84-85, 88, 93; nega-tive function of income, 85; occupa-tional distribution, 86-95, tables 87,88, 89, 91, 92; geographic, relationto nonfarm occupation, 90; policyimplications, 95-96; federal assist-ance programs, 108-9; dichotomouspolicies, 111-12; demonstrationprojects, 118, 131-33; see also Man-power development programs
Montana, 128Multiple job holding, 74-76, 85, 95-
96, 111
National Council of Churches, Mi-grailt Ministry, 133
Negroes: male farm population(South), projected, table 11; vul-nerability to unemployment, 59;job market for, in agriculture, 59-62; historical attitude of USDA to-ward, 61; attitude toward agricul-ture, 61; median age, in farm pop-ulation, 61-62; low level of skills,63, 67-68; educational discrimina-tion, 67; mean income differentialsof off-farm movers, table 84; mo-bility rate, 84-85; occupational dis-tribution, 86-90, tables 87, 89;special educational needs, 124;training programs, 129-30; see alsoNonwhites
Neighborhood Youth Corps, 121-22,125, 132
New Deal era, 99, 103New England, 5; see also Northeast-
ern statesNew Mexico, 26New York State, 24Noncasual workers, 21; see also Reg-
ular workers

142 INDEX
Nonfarm population, see Rural non-farm population
Nonwhites: proportion in farm-work-er households, 32; average size offarm-worker households, 33; inhouseholds with moderate depend-ence on farm wage work, 36; educa-tion-income levels, 38-39; occupa-tion distribution, 79, tables 80-81,83; training programs, 128-30; seealso Negroes
North Carolina, 24North Central states: projected male
farm population and off-farm mi-gration, table 10; proportion ofhired farm workers, 22; wage rates,29
Northeastern states: projected malefarm population and off-farm mi-gration, table 10; proportion ofhired farm workers, 22; wage rates,29; out-migration from farm labor,93
Nut farms, 24, tables 44, 45
Occupational inheritance, 7-9, table 8Occupational mobility, see MobilityOccupations, distribution, 79-83, 86-
95, tables 87, 88, 89, 91, 92Oil crops, table 43On-the-job training, 118, 130Oregon, 24, 26
Pacific Coast states, 93Panel of Consultants on Vocational
Education, 123Parity, concept, 98Parolees, training, 126Pluralistic Economy, The (Ginzberg,
Hiestand, and Reubens), 114Poultry, table 43Poverty: incidence among farm-work-
er households, 38; and minimumwage legislation, 55; incidenceamong farm families, 67; cause andeffect relationship, 103-4
Price-support programs, 105Prison inmates, training, 126
Product markets, emphasis on, v, 16Productivity: and low earnings, 53;
increase in, per man-hour, 55-57;effects of increase on labor demand,56-57; effect of increased schoolingof labor force, 68-69; controls, 99
Products, demand for, 3; specializa-tion, 4
Project Head Start, 124Property, 64Public Law 73, 100, 110Public Works and Economic Develop-
ment Act, 113, 131Puerta Ricans, 107, 128
Reclamation Law, 99Regional action planning commissions,
113Regular workers, 21, 24, 28; earnings
and employment, 30-31; percent-age under 25 and 35 years old, 72
Relocation programs, 130-32Residence: changes in, 24-26, figure
12; of farm-born persons, 76n; andmobility, 78-83, Nbles 80-81, 83
Rural area development, 110-14Rural nonfarm population, 111
Seasonality, 15, 20; and high rates ofmobility and migration, 25-26;work patterns, 28-29; effects ofmechanization on, 48, 106-7
Seasonal workers, 21, 24; earningsand employment, 31, 98, 111, tables44, 45; concentration, 42; effects oftechnological changes on, 48, 106-7; excluded from labor legislation,102; proposals for improving con-ditions, 134-35
Selective Service rejectees, 126Skills: lack of, in farm labor force,
54, 56; defined, 62-63; supply anddemand for, 65-69
Social Security Act, 99Soil Bank, 99Southern states: earnings in, 5, 29,
31, 38, 68; projected male farmpopulation and off-farm migration,

table 10-11; proportion of haredfarm labor, 22, 29; concentrationof households with moderate de-pendence on farm wage work, 36;percentage of Negro farm operatorsin, 60; value of Negro and whitefarms, compared, 60; percentage offarms in, 68; low level of skills in,68; male-female job competition,78; backflow, 93-94
Standard Metropolitan StatisticalAreas, 79-83
Strikes, 108Subsidies, v, 16Sugar crops, table 43
Taft-Hartley Act, 108Technology, innovations in: nature
of resource substitution effects,3. '; firm size effects, 3-4; andmanpower needs, 3-5; and con-solidation of farms, 14; differentialeffects among commodities and re-gions, 15; potential effects, 45-52,table 46; effects on seasonal activ-ity, 48, 106-7; effects on farm la-bor, 97
Tennessee, 128Texas, 24, 26Tobacco: utilization of labor, 24;
man-hours, tab 43; seasonal em-ployment, table 4
Unemployment: and mobility, 12-13,77-78, table 74; among older agegroups, 14; national, effects onfarm labor, 57-59; local nonfarm,effect on farm earnings, 78
Unemployment insurance, 28, 32,102-3, 106-8
Unemployment Insurance Act, 99Unionization, 102-3, 108United States: low-cost food policy,
v; lack of explicit manpower pol-icy for agriculture, v, 15-17; agri-
INDEX 143
cultural fundamentalism, 6-7; agri-cultural policies, 57-58, 98-100;adverse effects of policies on Ne-groes, 60; policy implications of mo-bility, 95-96; manpower policies,controlled by interest groups,99-100, 102-3, 108-10; training andmobility assistance programs, 108-9; and rural area development, 110-14
Vegetables, 24, 42, 107; man-hours,table 43; seasonal employment,tables 44, 45
Vocational Education Act, 123-24Vocational training, 108-9, 118, 120-
25, 128-30; farm, number in, 7; in-efficiency of, 7, 9; need for inn-farm, 16; subsidized, 96; agricul-tural, 127-29
Wage rates, v, 13; national and re-gional, 28-29, 31; form vs. non-farm, 29-30, 54-55; higher, paidby larger farms, 55; effect of for-eign labor on, 55; rise in, and pro-ductivity, 55-56; effect of increasedschooling and out-migration on, 68
Washington, State of, 24, 26Welch, Finis, 69Welfare system, 135Western states: farm and nonfarm
earnings, 5-6; projected male farmpopulation and off-farm migration,table 11; proportion of hired farmworkers, 22; wage rates, 29, 31
West North Central states, 93-94Wheat, 46-47Wirtz, W. Willard, 110
Year-round workers, 21, 31; see alsoRegular workers
Zelinsky, Wilbur, 114