farm management handbook 2018-19 | fas.scot
TRANSCRIPT
The
Farm
Management
Handbook
2018/19
Editor
Kara Craig
SAC Consulting
September 2018
This publication is co-funded by the Scottish Government and EU as part of the SRDP Farm Advisory Service.
Enquiries:
Telephone: 0131 603 7525
Email: [email protected]
Website: www.sruc.ac.uk/fmh
Price: £25 plus postage and packaging
© SAC Consulting 2018

ISSN 0308-5708
ISBN 978-0-9931063-7-8
ELECTRONIC VERSION OF THE FARM MANAGEMENT HANDBOOK
An electronic version is available free at www.fas.scot as part of the SRDP Farm Advisory Service.
ORDERING A HARD COPY OF THE FARM MANAGEMENT HANDBOOK IS EASY
If you would like to order a hard copy of the publication it can be obtained from SAC Consulting as detailed below:
Visit the SAC Consulting webpages and order online: www.sruc.ac.uk/fmh
Email: [email protected]
Telephone: 0131 603 7525 (answerphone out of office hours)
Contact your local SAC Consulting office (see pages 514-516)
Write to: Farm Management Handbook Sales, SAC Consulting, 2 Technopole Centre, Bush Estate, Penicuik, Midlothian EH26 0PJ (cheques payable to SAC Commercial Ltd)

Foreword
A year ago the greatest uncertainty facing UK agriculture was Brexit; a year later this still holds true. The only difference is there is one year less to prepare before the UK’s planned departure from the EU in March 2019. Other than that very little concrete progress has been made. While the UK has reached provisional agreement with the EU to continue existing support, trade and single market arrangements until December 2020, this has yet to be ratified.
It is more vital than ever that farmers and managers understand the state of their current business and the options for change and restructuring open to them. The objective is to make farm businesses fit for the future whether the driver of change is Brexit or other local or global factors.
To aid this challenging task the 39th edition of the Farm Management Handbook, produced with the support of the Scottish Government’s SRDP Farm Advisory Service (FAS) provides a comprehensive and up-to-date source of information for farmers, managers, bankers, accountants, students and all consultants involved in the assessment and planning of farm and rural businesses.
Planning allows returns to be assessed and enterprise mixes adjusted to strike the right balance between risk and return. For this reason the crop and livestock financial data remain central to the Farm Management Handbook. In addition to reviewing all financial margin data, this year we have added more detail to arable, forage crops and diversification sections.
The SAC Farm Management Handbook is a budgeting book. Provision of physical information upon which the financial measures are based enables the user to adjust data, where necessary, to account for differences occurring locally or on individual farms. The Handbook is an annual publication, more regular market and input cost data are provided at www.fas.scot under Farm Business and Agribusiness News topics. Enterprise budgets are expressed to gross margin level. The fixed costs of an individual business should also be taken into account when preparing forward budgets as they can have a significant impact on the profitability and/or success of a business.
The Handbook could not be produced without the help of colleagues and friends throughout the industry. This help, and indeed all comments and suggestions, are very much appreciated.
Kara Craig September 2018

Acknowledgements
SAC Consulting Rural Business Unit acknowledges with thanks the considerable assistance received from many people outside SRUC and from specialist colleagues within the organisation. In particular, the following people have made major contributions to this edition of the Handbook:
Kerry Allison, Rebecca Audsley, Adele Baron, Alastair Beattie, Julian Bell, Craig Bothwell, Jim Campbell, Niall Campbell, Aileen Carr, George Chalmers, Gavin Elrick, Lisa Fitzsimmons, Janis Forrest, Poppy Frater, Gillian Inman, Simon Jacyna, Innes Jessiman, Calum Johnston, Lorna MacPherson, Neil Melville, Peter Lindsay, Robert Logan, Mary McDowell, Robin Mair, Dr Foteini Manolaraki, Colin Mason, Douglas Priest, Martin Richards, Fiona Salter, Janette Sutherland, Alistair Trail and Malcolm Young.
SAC Consulting would like to thank the following organisations for their contribution to the Handbook:
The Scottish Government
Chiene + Tait CA, Edinburgh
The Scottish Machinery Rings
SAC Consulting would also like to thank the individuals and organisations that help update the Handbook but do not wish to be formally acknowledged. Your contributions are very much appreciated.

Contents

Enterprise Budgeting .............................................................................. 1
Crop Inputs ............................................................................................... 3 Introduction ............................................................................................. 4 Fertiliser .................................................................................................. 4 Lime ........................................................................................................ 4 Slurry and Manure .................................................................................. 4 Nutrient Planning .................................................................................... 6 Residual Values of Fertilisers, Manures and Lime ................................. 8 Pesticide Use ....................................................................................... 12
Arable ...................................................................................................... 15 Introduction ........................................................................................... 16 Wheat - Winter ..................................................................................... 18 Wheat - Spring ..................................................................................... 20 Barley - Winter ...................................................................................... 22 Barley - Spring ...................................................................................... 24 Oats - Winter ........................................................................................ 26 Oats - Spring ........................................................................................ 28 Triticale ................................................................................................. 30 Oilseed Rape - Winter .......................................................................... 32 Oilseed Rape - Spring .......................................................................... 34 Spring Field Beans ............................................................................... 36 Spring Peas .......................................................................................... 38 Cauliflower and Broccoli ....................................................................... 40 Timothy - Hay, Greencut ...................................................................... 42 Stubble to Stubble Arable Operations .................................................. 44 Equivalent Grain Weights at Varying Moisture Contents ..................... 45 Futures and Options Markets ............................................................... 45
Potatoes .................................................................................................. 47 Introduction ........................................................................................... 48 Potatoes - Loose New (Covered and Open) ........................................ 50 Potatoes - Baby New ............................................................................ 52 Potatoes - Early Set Skin Pre-Pack Bakers (Covered and Open) ....... 54 Potatoes - Pre-Pack Salads ................................................................. 56 Potatoes - Maincrop Ware (Pre-Pack Bakers) ..................................... 58 Potatoes - Maincrop Ware (Pre-Pack Premium Varieties) ................... 60 Potatoes - Maincrop Ware (Processing - Chips) .................................. 62 Potatoes - Maincrop Ware (Processing - Crisps) ................................. 64 Potatoes - Seed (Low and High Number Varieties) ............................. 66 Potatoes - Dual Purpose (Seed and Ware) .......................................... 68
Grassland ............................................................................................... 71 Introduction ........................................................................................... 72 Sward Improvement ............................................................................. 74 Preserved Grass Production Costs ...................................................... 75 Grassland - Grazing ............................................................................. 76 Grassland - Silage and Aftermath Grazing .......................................... 78 Grassland - Hay and Aftermath Grazing .............................................. 80

Forage Crops ......................................................................................... 83 Introduction........................................................................................... 84 Brassica and Root Crop Technical Data .............................................. 85 Preserved Forage Crop Technical Data and Production Costs ........... 87 Forage Peas and Pea/Cereal Mixtures (Arable Silage) ....................... 88 Forage Maize ....................................................................................... 90 Whole Crop Cereal - Winter Wheat ..................................................... 92 Rye for Early Grazing ........................................................................... 94 Kale ...................................................................................................... 96 Forage Rape ........................................................................................ 98 Dutch or Stubble Turnips ................................................................... 100 Swedes and Turnips .......................................................................... 102 Chicory ............................................................................................... 104 Fodder Beet ....................................................................................... 106 Red Clover ......................................................................................... 108
Livestock .............................................................................................. 111 Livestock Units ................................................................................... 112 Livestock Traceability ......................................................................... 113 Animal Health Planning ...................................................................... 115 Nutritive Values and Relative Values (£) of Feedingstuffs ................. 118 Gestation Table .................................................................................. 121
Dairying................................................................................................. 123 Introduction......................................................................................... 124 Lactation Curves ................................................................................ 126 Dairy Cow - Summary of Assumptions .............................................. 127 Dairy Cow - Low Input Spring Calving ............................................... 128 Dairy Cow - 7,000 Litres ..................................................................... 130 Dairy Cow - 8,500 Litres ..................................................................... 132 Dairy Cow - High Output Housed Year Round .................................. 134 Replacement Heifer Rearing .............................................................. 136 Contract Dairy Heifer Rearing ............................................................ 140 Total Cost of Production - Dairying .................................................... 141
Beef Cattle ............................................................................................ 143 Introduction......................................................................................... 144 General Reference Data .................................................................... 146 Hill Suckler Cows ............................................................................... 148 Upland Suckler Cows - Mainly Silage Diets ....................................... 150 Lowground Suckler Cows - Mainly Straw Diets ................................. 152 Spring Calving Cows Producing 18 - 20 Month Finished Cattle ........ 154 Overwintering Spring-Born Suckled Calves ....................................... 156 Finishing Spring-Born Suckled Calves Intensively at 12 Months....... 158 Finishing Year Old Autumn-Born Suckled Calves at 18 Months ....... 160 Finishing Year Old Spring-Born Suckled Calves at 18 - 20 Months .. 162 Beef Cattle Summer Finishing ........................................................... 164 Calf Rearing Costs to 3 Months ......................................................... 166 Intensive Finishing of Dairy Bred Bulls .............................................. 168

Forage Based Finishing Dairy Steers at 24 Months .......................... 170
Sheep .................................................................................................... 173 Introduction ......................................................................................... 174 General Reference Data .................................................................... 176 Extensive Hill ...................................................................................... 178 Improved Hill ...................................................................................... 180 Draft Blackface Ewes ......................................................................... 182 Crossbred Ewes ................................................................................. 184 Pure Bred Flock .................................................................................. 186 Early Finished Lamb Production ........................................................ 188 Easy Care (Wool Shedding) ............................................................... 190 Gimmering .......................................................................................... 192 Short Keep Lambs - Winter Finishing on Rape .................................. 194 Short Keep Lambs - Indoor Finishing on Concentrates ..................... 196 Long Keep Lambs - Finishing on Swedes .......................................... 198
Red Deer ............................................................................................... 201 Introduction ......................................................................................... 202 Red Deer - Lowground Breeding and Feeding .................................. 204 Red Deer - Upland Breeding Selling Calves ...................................... 206 Red Deer - Finishing Stag Calves ...................................................... 208
Pigs........................................................................................................ 211 Introduction ......................................................................................... 212 Breeding Pigs - Indoor Units .............................................................. 214 Breeding Pigs - Outdoor Units ........................................................... 216 Finishing Pigs ..................................................................................... 218
Poultry ................................................................................................... 221 Introduction ......................................................................................... 222 Chicken Egg Production ..................................................................... 222 Broiler Meat Production ...................................................................... 224 Brexit issues ....................................................................................... 224 Useful Poultry References.................................................................. 225 Laying Hens - Free Range ................................................................. 226 Broilers ............................................................................................... 228
Organic Farming .................................................................................. 231 Introduction ......................................................................................... 232 Organic Farming Contacts ................................................................. 235 Organic Wheat - Winter ...................................................................... 236 Organic Oats - Spring ......................................................................... 238 Organic Barley - Spring ...................................................................... 240 Organic Beans - Spring ...................................................................... 242 Organic Potatoes - Maincrop.............................................................. 244 Organic Dairying ................................................................................. 246 Organic Suckler Cows - Mainly Silage Diets ...................................... 250 Organic Finishing Cattle ..................................................................... 252 Organic Breeding Ewes - Finished Lamb Production ........................ 254
Crofts and Small Farms ...................................................................... 257 Introduction......................................................................................... 258 Crofting ............................................................................................... 258 Small Farms ....................................................................................... 260 Rural Aid Schemes for Crofts and Small Farms ................................ 260 Croft and Small Farm Gross Margins ................................................ 262 Suckler Herd - Croft and Small Farm ................................................. 264 Free Range Laying Hens - Croft and Small Farm ............................. 268
Diversification ...................................................................................... 271 Introduction......................................................................................... 272 Part-Time Off-Farm Work ................................................................... 272 On Farm Diversification ...................................................................... 272 Speciality Crops ................................................................................. 274 Alternative Livestock .......................................................................... 276 Retailing ............................................................................................. 278 Tourism .............................................................................................. 281 Leisure Activities ................................................................................ 284 Equestrian Enterprises ....................................................................... 284 Wedding Venues ................................................................................ 291 Pet boarding facilities ......................................................................... 291
Forestry and Farm Woodlands ........................................................... 293 Introduction......................................................................................... 294 Trees and the Law ............................................................................. 294 Woodland and Shelter ........................................................................ 296 Scottish Timber Log Prices ................................................................ 297 Christmas Trees ................................................................................. 297 Financial Assistance for Farm Woodlands ......................................... 300 Trees and Taxation ............................................................................ 310
Renewable Energy ............................................................................... 311 Introduction......................................................................................... 312 Grants and Incentives ........................................................................ 313 Wind Power ........................................................................................ 321 Hydro Power ...................................................................................... 323 Solar Photovoltaics ............................................................................ 325 Biomass Heating ................................................................................ 327 Farm Scale Biodiesel ......................................................................... 329 Anaerobic Digestion ........................................................................... 330 Biomass Crops for Energy ................................................................. 334
Fuel ........................................................................................................ 337 Introduction......................................................................................... 338 Fuel Prices ......................................................................................... 338 Calorific Values of Fuels .................................................................... 339 Fuel Cost Values ................................................................................ 340 Fuel Storage ....................................................................................... 340

Labour and Machinery......................................................................... 343 Introduction ......................................................................................... 344 Standard Labour Requirements ......................................................... 344 Machinery Operating Data ................................................................. 345 Estimating Machinery Costs ............................................................... 349 Machinery Contractors’ Charges ........................................................ 353 Grain Drying ....................................................................................... 357 Drainage ............................................................................................. 357 Fencing ............................................................................................... 359 Dry Stone Walling ............................................................................... 360 Agricultural Vehicles on the Road ...................................................... 361 Labour Legislation and Policy ............................................................ 362 Health and Safety ............................................................................... 367
Land and Buildings .............................................................................. 371 Introduction ......................................................................................... 372 Land Tenure ....................................................................................... 372 Charges for Short-Term Lets and Services........................................ 379 Space Requirements for Livestock and Storage ................................ 380 Planning Permission and Building Warrant ........................................ 384 Wayleaves and Easements ................................................................ 388 Guide to Building Costs ...................................................................... 389
Climate Change and the Environment ............................................... 393 Introduction ......................................................................................... 394 Agriculture and Climate Change ........................................................ 394 Farming for a Better Climate .............................................................. 396 Forestry and Climate Change ............................................................ 397 Pollution and the Environment ........................................................... 398
New Entrants ........................................................................................ 401 Introduction ......................................................................................... 402 Starting Up an Agricultural Business .................................................. 402 Business Planning .............................................................................. 404 Financial Planning .............................................................................. 405 Business Structure ............................................................................. 408 Farming Opportunities ........................................................................ 408 Finance ............................................................................................... 411 New Entrants Initiatives ...................................................................... 412
Whole Farm Data .................................................................................. 415 Introduction ......................................................................................... 416 Source of Contents for 2018 .............................................................. 416 Description of Farm Types ................................................................. 417 Definition of Terms ............................................................................. 418 England - LFA Grazing Livestock Farms ........................................... 420 England - Lowland Grazing Livestock Farms..................................... 421 England - Dairy Farms ....................................................................... 422 England - Cereal Farms ..................................................................... 423 England - General Cropping Farms ................................................... 424
England - Specialist Pig Farms .......................................................... 425 England - Specialist Poultry Farms .................................................... 426 England - Horticulture Farms ............................................................. 427 England - Mixed Farms ...................................................................... 428 Scotland - Specialist Sheep (LFA) Farms .......................................... 429 Scotland - Specialist Beef (LFA) Farms ............................................. 430 Scotland - Cattle and Sheep (LFA) Farms ......................................... 431 Scotland - Dairy Farms ...................................................................... 432 Scotland - Specialist Cereal Farms .................................................... 433 Scotland - General Cropping Farms .................................................. 434 Scotland - Mixed Farms ..................................................................... 435
Rural Aid Schemes .............................................................................. 437 Introduction......................................................................................... 438 Overview of CAP Schemes ................................................................ 438 Scotland ............................................................................................. 440 England .............................................................................................. 452 Wales ................................................................................................. 456 Northern Ireland ................................................................................. 461 Cross Compliance .............................................................................. 465
Credit..................................................................................................... 467 Amortisation Table ............................................................................. 468 Sinking Fund Table ............................................................................ 469 Approximate Annual Percentage Rates of Annual Nominal Rates .... 470 Approximate Annual Percentage Rates of Annual Flat Rates ........... 471 Compounding Table ........................................................................... 472 Annuity Tables ................................................................................... 473 Discount Tables ................................................................................. 474 Long-Term Loans ............................................................................... 475 Medium-Term and Short-Term Credit ................................................ 475
Taxation ................................................................................................ 479 Introduction......................................................................................... 480 Income Tax......................................................................................... 480 Property Rental Income ..................................................................... 482 Tax Credits ......................................................................................... 482 Pensions............................................................................................. 483 Capital Allowances ............................................................................. 484 Losses ................................................................................................ 485 Relief for Fluctuating Profits (Averaging) ........................................... 485 Herd Basis of Livestock Valuation ..................................................... 486 Self Assessment Procedures ............................................................. 486 Corporation Tax Procedures .............................................................. 487 Corporation Tax Rates ....................................................................... 487 Annual Tax on Enveloped Dwellings ................................................. 487 Capital Gains Tax ............................................................................... 488 Inheritance Tax .................................................................................. 489 Value Added Tax ................................................................................ 491
National Insurance Contributions (NICs) ............................................ 495 Stamp Duty (SD) ................................................................................ 495 Stamp Duty Land Tax (SDLT)/Land Building Transaction Tax (LBTT) in Scotland.............................................................................................. 495 Single Farm Payment Scheme/Basic Payment Scheme ................... 496 Commercial Woodlands ..................................................................... 497 Anti-Avoidance ................................................................................... 498 Making Tax Digital .............................................................................. 498 Summary of Income Tax and Capital Gains Tax Rates ..................... 499
Miscellaneous ...................................................................................... 501 Summary of Farm Management Practices ......................................... 502 Glossary of Acronyms ........................................................................ 506 Imperial-Metric Conversion ................................................................ 511
Contacts ................................................................................................ 513 SAC Contact Details ........................................................................... 514 Machinery Ring Contact Details ......................................................... 519
Index ...................................................................................................... 521

ENTERPRISE BUDGETING 1
Enterprise Budgeting
The Farm Management Handbook is designed to provide guidelines in preparing forward budgets.
Output Output is based on anticipated sales prices (adjusted for replacement costs where required) plus enterprise specific subsidies (as applicable). Livestock output prices are based on market forecasts while crop output prices are based on forward sales values for 2019 as set in summer 2018.
All non enterprise specific subsidies, e.g. Basic Payment Scheme (BPS) and Less Favoured Area Support Scheme (LFASS) are excluded from the enterprise gross margins. These subsidies are regarded as whole farm income therefore should be included in whole farm gross margin budget calculations. See Rural Aid Schemes section (page 437) for more information on subsidies.
Variable costs Variable costs (e.g. feed, seed, fertiliser, vet and medicine and sprays) are specific to an enterprise and vary in proportion to the size of the enterprise. Enterprise gross margins will vary considerably between individual businesses due to differing land quality, climate, production system, yields, prices and managerial abilities. All variable costs are based on projected prices for the year ahead, set in summer 2018.
Gross margins A gross margin is not a profit figure. No account is taken of "fixed" or "overhead" costs such as labour, power and machinery, property upkeep, rent or finance charges.
The gross margin of an enterprise is:
OUTPUT
less
VARIABLE COSTS
Enterprise performance levels are expressed on a per head and, for land using enterprises, on a per hectare (acre) basis. It is also assumed that the enterprise is in a “steady state” where, for instance, the size of a dairy herd is the same at the start and end of the year.
The gross margin data represents good technical performance at estimated prices for 2018/19 but should not be regarded as industry standards or targets, nor should it be used as actual data for compensation purposes. That is, these are indicative margins that should be customised to the specific requirements of the user.
ENTERPRISE BUDGETING 2
Fixed costs Fixed costs (e.g. labour, machinery, general overheads and finance) are costs that cannot readily be allocated to a specific gross margin. Fixed costs are generally unaffected by small changes in enterprise size but can vary from year to year. As a result, they are often referred to as overhead or indirect costs. Depreciation (for property and machinery) is also considered as a fixed cost and it is useful to keep this separate to allow a broad assessment of the capital investment needs of a business. If actual fixed costs are not available for a particular farm type, the figures in the Whole Farm Data section (page 415) can be used.
Rounding Because of rounding, individual items may not add to sub-totals or totals.
Remember! The gross margins are indicative and are not industry standards or targets. Care should therefore be taken when comparing actual results with values in the handbook or when using this information for budgeting purposes. Data should be adjusted to reflect local physical differences and changes in price.
Should you require assistance in using the Handbook, please contact your local SAC Consulting office. For contact details see Contacts section (page 513).

Crop Inputs

CROP INPUTS 4
Introduction
Crop inputs such as fertilisers, organic manures, lime and sprays all have a quantifiable value on farm. This section provides information that many of the crop gross margins and grassland and forage crop cost of production data refer to and include.
Fertiliser
Fertiliser levels used in the enterprise data are intended only as a guide for budgeting purposes and should not be regarded as a recommendation. In practice, many factors affect the level of N, P2O5 and K2O required by a specific crop, including previous cropping policy, the quantity of organic manures being used and soil nutrient status. Budgeted N levels will require adjustment for Nitrate Vulnerable Zone (NVZ) Action Programme regulations.
Fertiliser prices used are based on typical prices paid in summer 2018. Fertiliser costs used in the gross margins are shown in the table below.
Nitrogen (Ammonium Nitrate) £230.00 /t £0.67/kg N
Phosphate (Triple Super Phosphate) £315.00 /t £0.68/kg P2O5
Potassium (Muriate of Potash) £272.00 /t £0.45/kg K2O
Nutrient CostFertiliser Price
All gross margins assume nutrients are derived from purchased fertiliser and applied to soils at moderate P and K status. Nutrient inputs for crops should be adjusted for applied organic nutrients which can reduce costs.
Lime
No charge for share of lime is included in the variable costs of arable, grassland and forage crops. Costs for lime will vary significantly depending on type (e.g. calcium, magnesium), distance from source, type of haulage (artic or 8 wheeler) and spreading contractor’s charges. An appropriate annual maintenance charge (including delivery and application) to be included in individual margins could be calculated to suit specific farm practice using the example below:
Cost Rate Frequency of application Annual charge
£35/t 3.7t/ha 4 years £32.34/ha
For more information on lime see SRUC Technical Note 656.
Slurry and Manure Use of slurries or manures has not been considered in the enterprise data but they are a valuable source of major nutrients (N, P2O5 and K2O), secondary nutrients, trace elements and organic matter.

CROP INPUTS 5
When planning inorganic fertiliser applications for crops and grassland, the total crop requirement should be adjusted to account for any use of slurries and manures.
The following table is an estimated value based on the total nutrients present in the stored slurry and manure prior to application to land.
Manure Type DM (%) Total
plant
nutrient
kg/t or
kg/m3
£/kg
25 N 6.0 0.67 4.00
P2O5 3.2 0.68 2.19
K2O 8.0 0.45 3.63
9.82
Cattle Slurry 6 N 2.6 0.67 1.73
P2O5 1.2 0.68 0.82
K2O 3.2 0.45 1.45
4.01
Sheep FYM 25 N 7.0 0.67 4.67
(Fresh) P2O5 3.2 0.68 2.19
K2O 8.0 0.45 3.63
10.48
Pig FYM 25 N 7.0 0.67 4.67
(Fresh) P2O5 6.0 0.68 4.11
K2O 8.0 0.45 3.63
12.40
Pig Slurry 4 N 3.6 0.67 2.40
P2O5 1.8 0.68 1.23
K2O 2.4 0.45 1.09
4.72
Layer manure 35 N 19.0 0.67 12.67
P2O5 14.0 0.68 9.59
K2O 9.5 0.45 4.31
26.56
60 N 30.0 0.67 20.00
P2O5 25.0 0.68 17.12
K2O 18.0 0.45 8.16
45.28
Total value
(£/t or £/m3)
Cattle FYM
(Fresh)
Broiler/turkey
litter
Availability to crops of the nutrients in organic manures will be significantly altered by the timing and method of application, and other factors including temperature, rainfall and crop growth stage and health. For further guidance on the use of organic manures, refer to SRUC Technical Note 650.

CROP INPUTS 6
Nutrient Planning
Using the information below, total quantities of slurries and manures produced on farm can be calculated.
Livestock
m3/day m
3/wk
Dairy Cow (annual milk yield > 9,000l) 0.064 0.45
Dairy Cow (annual milk yield 6,000-9,000l) 0.053 0.37
Dairy Cow (annual milk yield < 6,000l) 0.042 0.29
Dairy Heifer (13 months to first calf) 0.040 0.28
Dairy Heifer (3 to 13 months) 0.020 0.14
Beef Cow (> 500kg) 0.045 0.32
Beef Cow (≤ 500kg) 0.032 0.22
Steer/heifer (over 25 months) 0.032 0.22
Steer/heifer (13 to 25 months) 0.026 0.18
Cattle (3 to 13 months) 0.020 0.14
Bull beef (over 3 months) 0.026 0.18
Calf (up to 3 months) 0.007 0.05
Sow (130 to 225kg) & litter 0.011 0.08
Maiden Gilt (90 to130kg) 0.006 0.04
Breeding Boar (66 to 150kg) 0.006 0.04
Breeding Boar (over 150kg) 0.008 0.06
Weaner (7 to 31kg) 0.001 0.01
Grower (31 to 66kg) - dry fed/liquid fed 0.004/0.007 0.03/0.05
Finisher (66kg to slaughter) - dry fed/ liquid fed 0.006/0.010 0.04/0.07
Ewe (> 60kg) 0.005 0.04
Ewe (≤ 60kg) 0.003 0.02
Lambs (6 months to tupping) 0.002 0.01
Goat 0.003 0.02
Breeding deer 0.006 0.04
Other deer 0.003 0.02
Horse 0.024 0.17
Laying Hens (per 1000, up to 17 wks) 0.040 0.28
Laying Hens (per 1000 caged, > 17 wks) 0.120 0.84
Laying Hens (per 1000 free range, > 17 wks) 0.091 0.64
Broilers (table, per 1000) 0.120 0.84
Broiler (breeders, per 1000, up to 25 wks) 0.040 0.28
Broiler (breeders, per 1000, > 25 wks) 0.120 0.84
Turkeys (per 1000, male) 0.160 1.12
Turkeys (per 1000, female) 0.120 0.84
Ducks (per 1000) 0.100 0.70
Typical volume of
excreta produced
CROP INPUTS 7
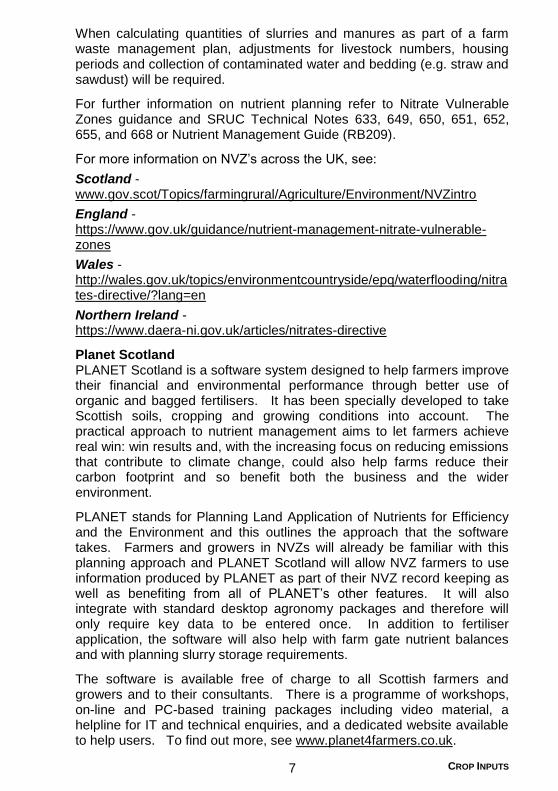
When calculating quantities of slurries and manures as part of a farm waste management plan, adjustments for livestock numbers, housing periods and collection of contaminated water and bedding (e.g. straw and sawdust) will be required.
For further information on nutrient planning refer to Nitrate Vulnerable Zones guidance and SRUC Technical Notes 633, 649, 650, 651, 652, 655, and 668 or Nutrient Management Guide (RB209).
For more information on NVZ’s across the UK, see:
Scotland - www.gov.scot/Topics/farmingrural/Agriculture/Environment/NVZintro
England - https://www.gov.uk/guidance/nutrient-management-nitrate-vulnerable-zones
Wales - http://wales.gov.uk/topics/environmentcountryside/epq/waterflooding/nitrates-directive/?lang=en
Northern Ireland - https://www.daera-ni.gov.uk/articles/nitrates-directive
Planet Scotland PLANET Scotland is a software system designed to help farmers improve their financial and environmental performance through better use of organic and bagged fertilisers. It has been specially developed to take Scottish soils, cropping and growing conditions into account. The practical approach to nutrient management aims to let farmers achieve real win: win results and, with the increasing focus on reducing emissions that contribute to climate change, could also help farms reduce their carbon footprint and so benefit both the business and the wider environment.
PLANET stands for Planning Land Application of Nutrients for Efficiency and the Environment and this outlines the approach that the software takes. Farmers and growers in NVZs will already be familiar with this planning approach and PLANET Scotland will allow NVZ farmers to use information produced by PLANET as part of their NVZ record keeping as well as benefiting from all of PLANET’s other features. It will also integrate with standard desktop agronomy packages and therefore will only require key data to be entered once. In addition to fertiliser application, the software will also help with farm gate nutrient balances and with planning slurry storage requirements.
The software is available free of charge to all Scottish farmers and growers and to their consultants. There is a programme of workshops, on-line and PC-based training packages including video material, a helpline for IT and technical enquiries, and a dedicated website available to help users. To find out more, see www.planet4farmers.co.uk.

CROP INPUTS 8
Residual Values of Fertilisers, Manures and Lime
Many fertilisers and manures have a residual value that needs to be calculated as part of a farm valuation or when a farm transfers between owners or tenants.
Estimates of the residual value of manures can be obtained by a feeding stuff calculation or by calculation of nutrients in manure (FYM) or slurry. The following valuations are based on information taken from SRUC Technical Notes on fertilisers as noted on page 7. Valuers must show discretion in the values used and to vary the values used according to the standard of husbandry, previous cropping, the state of drainage and the effectiveness of crop protection. Values are given in respect to growing seasons, not calendar years.
Compensation for manures using the residual values of feeding stuffs Residues of feeding stuffs fed to livestock will be recovered in manures or slurries thus giving these organic manures a specific value. The values of nutrients in purchased feeds or feeds produced on the farm which are retained in farmyard manures or slurries can be calculated using the figures in the following table.
Feeding stuff
N P2O5 K2O
Before 1
growing
season
After 1
growing
season
Soya bean meal or cake 6.99 1.50 2.68 11.21 5.60
Rapeseed meal or cake 5.77 2.33 1.55 7.33 3.67
Beans 4.53 1.03 1.39 6.10 3.05
Peas 3.52 1.15 1.14 5.05 2.53
Fish meal 10.50 7.63 1.03 8.30 4.15
Wheat 1.75 0.65 0.47 2.21 1.10
Barley 1.78 0.79 0.52 2.43 1.21
Oats 1.48 0.67 0.52 2.32 1.16
Maize 1.42 0.60 0.37 1.77 0.89
Bran & other offals of wheat 2.54 2.36 1.49 6.39 3.19
Maize gluten 60% 9.68 0.58 0.12 2.85 1.42
Brewers’ & distillers'
grain (wet) 1.07 0.23 0.02 0.39 0.19
Brewers’ and distillers'
grain (dried) 3.42 1.03 0.06 1.32 0.66
Hay 1.49 0.51 2.16 7.85 3.92
Compensation value
(£)
Average % in per tonne of food
feeding stuff consumed

CROP INPUTS 9
Feeding stuff
N P2O5 K2O
Before 1
growing
season
After 1
growing
season
Dried grass 2.80 0.73 2.92 10.81 5.40
Grass silage 0.69 0.19 0.79 2.91 1.45
Wheat straw 0.54 0.15 1.07 3.81 1.91
Barley straw 0.58 0.22 1.53 5.41 2.70
Oat straw 0.46 0.18 1.82 6.35 3.18
Straw treated with ammonia 0.96 0.18 1.22 4.43 2.21
Swedes 0.15 0.06 0.24 0.87 0.43
Turnips 0.19 0.08 0.20 0.75 0.37
Potatoes 0.30 0.09 0.58 2.07 1.03
Dried sugar beet
pulp (molasses) 1.55 0.15 1.92 6.94 3.47
Pot ale syrup 2.52 2.26 1.25 5.53 2.77
Molasses (sugar cane) 0.65 0.20 3.42 11.84 5.92
Compound cakes & meals
for each 1% crude protein 0.16 0.08 0.06 0.27 0.13
Feed additives containing
urea for each 1% crude
protein 0.16 0.00 0.00 0.04 0.02
Compensation value
(£)
Average % in per tonne of food
feeding stuff consumed
For further feeding stuffs see PLANET (www.planet4farmers.co.uk).
The calculation of nutrients in FYM or slurry from feeding stuffs depends on the following principles:
a) The proportions of nutrients present in FYM and slurry will under ideal conditions be 35% for N, 45% for P2O5 and 75% K2O.
b) Where storage conditions are sub-optimal then these percentages should be reduced by up to half.
c) For slurry the percentage given in a) for N should only be used for spring or summer application. For autumn and winter application the allowances should be reduced by 2/3 and 1/3 respectively.
An example calculation for the value of FYM taken from the nutrients from a feeding stuff is shown in the following table:

CROP INPUTS 10
e.g. residual value of one tonne of barley fed to livestock.
N 17.8 0.67 11.87 35 4.15 2.08
P2O5 7.9 0.68 5.41 45 2.43 1.22
K2O 5.2 0.45 2.36 75 1.77 0.88
19.63 8.36 4.18
Value of FYM (£/t)
% Before 1
growing
season
After 1
growing
season
Plant
Nutrientkg/t £/kg Total £/t
In calculating the value of manures, instances occur where records of the feeds fed to livestock are not available. In this case the value of stored farmyard manure or slurry can be estimated on the basis of the average nutrient content as shown in the following tables whilst also considering, in the case of slurry, the season of application.
Residual value of fertilisers and manures The current value of the major plant nutrients, the principal forms used in agriculture, and proportions available for use over time for which compensation can be estimated is detailed in the following table:
Source 1 2 3
N (a) Inorganic fertilisers, dried
blood, dried poultry manure
and liquid digested sludge nil nil nil
(b) Other organic manures 1/5 1/10 nil
P2O5 All fertilisers and manures 1/2 1/4 1/8
K2O All fertilisers and manures nil nil nil
Proportion of applied plant
nutrients available for crop
use after (growing season)
Storage and application principals, as per those stated in the previous section, will affect the value of manures. In the following examples, the proportion of nutrients available in the three growing seasons following application as a compound fertiliser (for example 20:10:10), fresh cattle FYM and cattle slurry, are valued.
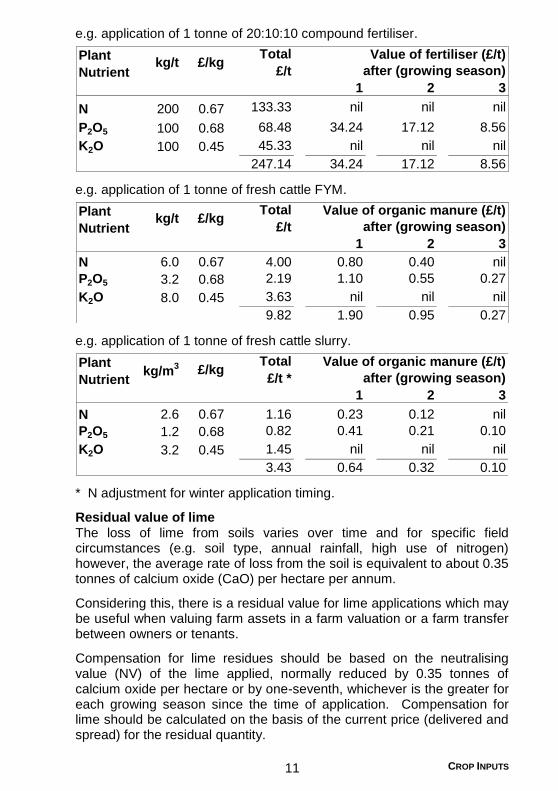
CROP INPUTS 11
e.g. application of 1 tonne of 20:10:10 compound fertiliser.
1 2 3
N 200 0.67 133.33 nil nil nil
P2O5 100 0.68 68.48 34.24 17.12 8.56
K2O 100 0.45 45.33 nil nil nil
247.14 34.24 17.12 8.56
Plant
Nutrientkg/t £/kg
Total
£/t
Value of fertiliser (£/t)
after (growing season)
e.g. application of 1 tonne of fresh cattle FYM.
1 2 3
N 6.0 0.67 4.00 0.80 0.40 nil
P2O5 3.2 0.68 2.19 1.10 0.55 0.27
K2O 8.0 0.45 3.63 nil nil nil
9.82 1.90 0.95 0.27
Plant
Nutrientkg/t £/kg
Total
£/t
Value of organic manure (£/t)
after (growing season)
e.g. application of 1 tonne of fresh cattle slurry.
1 2 3
N 2.6 0.67 1.16 0.23 0.12 nil
P2O5 1.2 0.68 0.82 0.41 0.21 0.10
K2O 3.2 0.45 1.45 nil nil nil
3.43 0.64 0.32 0.10
Plant
Nutrientkg/m
3 £/kgTotal
£/t *
Value of organic manure (£/t)
after (growing season)
* N adjustment for winter application timing.
Residual value of lime The loss of lime from soils varies over time and for specific field circumstances (e.g. soil type, annual rainfall, high use of nitrogen) however, the average rate of loss from the soil is equivalent to about 0.35 tonnes of calcium oxide (CaO) per hectare per annum.
Considering this, there is a residual value for lime applications which may be useful when valuing farm assets in a farm valuation or a farm transfer between owners or tenants.
Compensation for lime residues should be based on the neutralising value (NV) of the lime applied, normally reduced by 0.35 tonnes of calcium oxide per hectare or by one-seventh, whichever is the greater for each growing season since the time of application. Compensation for lime should be calculated on the basis of the current price (delivered and spread) for the residual quantity.

CROP INPUTS 12
An appropriate calculation of residual quantity of liming materials is set out in the following table:
Quantity CaO Annual loss
applied equiv. of CaO
(NV %) applied equivalent
t/ha t/ha t/ha 1 2 3 4 5 6 7
7.0 (50%) 3.501/7(0.50) 3.0 2.5 2.0 1.5 1.0 0.5 nil
4.4 (46%) 2.02 0.35 1.67 1.32 0.97 0.62 0.27 nil nil
Residual quantity of CaO
equivalent (t/ha)
after (growing season)
Pesticide Use
For each of the arable and potatoes gross margins, and the grassland and forage crops variable cost data, pesticides (including herbicides, insecticides, fungicides, nematicides and plant growth regulators where applicable) are included as appropriate for each crop. Pesticide programs are from independent agronomists.
Pesticide product prices used are only an indication of industry prices and do not account for volume/group discounts and regional variances. Agronomy fees (not included in gross margins and variable cost data) can range from £10/ha for spring cropping to £13/ha for winter cropping.
Read the label before you buy, and use pesticides safely. Care must be taken to choose a brand of a pesticide product which has been authorised for use on the crop it is intended to spray. Not all brands of a particular pesticide are authorised for the same uses or crops. Be on the lookout for counterfeit pesticides.
A full list of pesticides can be found in The UK Pesticide Guide 2018 and on www.plantprotection.co.uk.
The use of pesticides is controlled under the Food and Environment Protection Act 1985, and subsequent EU Regulations.
Anyone who uses a pesticide must take “reasonable precautions” to protect human health or the environment. Anyone with the need to use a professional pesticide product in the course of their business or employment may not use that pesticide or give instruction to others on the use of that pesticide unless they have received adequate instruction, training and guidance in the correct use of that pesticide. They must hold a Chemicals Regulation Directorate (CRD) recognised Certificate of Competence unless they are working under the direct supervision of someone who holds a certificate (i.e. they are being trained). Those previously operating under ‘grandfathers rights’ (i.e. born before 31 December 1964) must now also have a Certificate of Competence.
It is the responsibility of the purchaser of a professional pesticide product to ensure that the intended user holds a Certificate of Competence.

CROP INPUTS 13
Those who hold a Certificate of Competence approved by the CRD for the safe application of pesticides can join the National Register of Spray Operators (NRoSO). The scheme ensures that operators participate in ongoing continuous professional development (CPD). UK quality assurance schemes such as Scottish Quality Cereals generally require that the NRoSO membership number of the operator making spray applications to quality assured crops is recorded for each spray application.
Currently, the recognised Certificate of Competence for the use of pesticides are issued by the National Proficiency Tests Council (Tel: 024 7685 7300) and the Scottish Skills Testing Service (Tel: 0131 339 8739).
Quality assurance schemes, such as Scottish Quality Crops or Red Tractor Assurance, will require that competence to advise on pesticide usage and to apply pesticides is demonstrated by evidence of appropriate training and qualifications, i.e. BASIS Professional Register numbers, Pesticide Application (PA) certificates or equivalent, and NRoSO membership details.
Off-label use The product label does not cover every possible use of a pesticide product. Minor uses are often covered by an Extension of Authorisation for Minor Use (EAMU). Use of any chemical in accordance with an EAMU is entirely at growers’ risk, and growers must obtain and read the appropriate document for that particular authorisation and the general Guidance Notes on off-label uses before using it (available at https://secure.pesticides.gov.uk/offlabels/search.asp).
Pesticides no longer authorised Pesticide product authorisations may be reviewed, amended, suspended or revoked at any time. A number of pesticides have been withdrawn from use. It is an offence to use a pesticide no longer authorised. To check if a pesticide product is still authorised, take a note of the MAPP number from the label, then go to https://secure.pesticides.gov.uk/pestreg/ProdSearch.asp.


Arable

ARABLE 16
Introduction
Markets and price drivers In 2018 for the second year in a row the world is expected to see a decline in grain stocks with stocks set to fall from 92 days of supply in 2016 to 77 days in 2018; the lowest in five years. Whilst this is a potential indication that world grain prices could rise further, much will depend on the actual harvest obtained. World oilseed prices have declined recently due to rising soya crop estimates though rapeseed supplies look less certain on poorer crops in the EU and Canada. In the UK stocks of wheat and barley are expected to decline further in 2018 and the UK could be a net wheat importer for the third year running. Forward grain prices for 2018 are currently £20/t higher than equivalent values one year ago, offering potentially better margins for 2019 harvest if locked in today. Input costs have been rising and this may encourage forward selling at sowing time to cover these essential variable costs.
Crops sown in autumn 2018 will not be harvested until after the UK’s planned departure from the EU at the end of March 2019 and so will be subject to what ever post-Brexit trading arrangements are in place. If the transition deal agreed between the UK and EU holds then no major changes will be expected until 2021 but if not the uncertainties of a hard Brexit may beckon. It is already possible to sell some cereal crops beyond March 2019 and this may be desirable to reduce risk during what may be a particularly uncertain period.
Livestock feed followed by milling, malting, distilling and exports are the main UK markets. In Scotland, the whisky sector uses around half of total Scottish grain output. Scotch whisky output reached record levels in 2013 before falling to a low in 2016 that was 20% lower for grain whisky and 8% lower for malt whisky. Rising whisky exports in 2017 are expected to continue in 2018 aided by a weak sterling and a global economic recovery. As a result demand for malting barley and wheat for distilling are both expected to rise (modestly) in 2018. A combination of

ARABLE 17
late sowings and a dry spring in 2018 may limit spring barley yield potential and could leave Scotland with a shortfall in distilling malting barley by harvest.
Marketing Achieving a satisfactory grain price is essential for profitable cereal production. Grain and oilseed producers benefit from well developed futures markets which make for transparent pricing and enable crops to be bought and sold up to two years ahead of harvest. Given that prices readily swing £50 to £100/t between seasons, arable farmers should consider spreading sales to achieve a satisfactory average. It is essential that arable farmers set their own target prices based on their costs.
Premium crops such as malting barley and milling oats are generally grown on contract as there can be little or no spot trade at harvest, particularly in Scotland. Contract conditions vary widely but will require that specific standards are attained such as moisture, germination, nitrogen levels and screenings. Many contracts offer growers flexibility in the pricing, through use of min-max or LIFFE wheat futures as a base.
Margins Crop returns are highly sensitive to the yield and market price. Differences in fixed costs, particularly machinery, can have the greatest impact on profitability while variations in input costs such as fertiliser and sprays are relatively small between farms. Higher straw prices in the north and west can result in a good return from straw than in otherwise more marginal cereal cropping areas.
Variety choice Crop varieties should be selected to match the farm conditions, the chosen agronomic strategy and intended end use. Feed markets are less demanding but may require some parameters to be met such as minimum specific weight. For home use other characteristics such as straw length can be important. Premium markets such as malting barley and milling wheat have very specific requirements and lists of approved varieties. See links below to relevant market and variety information:
Scottish varieties; www.sruc.ac.uk/downloads/120312/crop_publications UK recommended varieties; https://cereals.ahdb.org.uk/varieties.aspx Malting requirements and varieties; www.ukmalt.com/ Milling requirements; www.nabim.org.uk/wheat/wheat-varieties/ Subsidies and support All eligible farmers receive area related direct support under the CAP’s Basic Payment Scheme. To ensure eligibility arable farmers have to meet rules for Crop Diversification, requiring at least three crops to be grown on arable areas of over 30ha and adherence to the Ecological Focus Areas with 5% of eligible land in appropriate land uses. (See the Rural Aid Scheme section on page 437 for full details).

ARABLE 18
Wheat - Winter
PHYSICAL DATA
(a) Seed Certified seed second generation (C2) sown at 230 kg/ha (1.83
cwt/acre).
(b) Fertiliser 200 : 67 : 83 kg/ha N : P2O5 : K2O (160 : 54 : 66 units/acre). See
page 4 for more information on nutrient planning.
(c) Sprays Herbicides Autumn residual herbicide to control annual meadow
grass and broad leaved weeds.
Fungicides Four fungicide applications at GS25-30, GS31-32, GS39 and GS59 to cover eyespot, septoria and head diseases, including growth regulation.
Additional treatments to the basic programme could include:
Wheat bulb fly £155/t for seed treatment.
Take all £160/t for seed treatment.
Mildew £21.00/ha
Aphids £3.70/ha
Wild oats £21.75/ha
Slugs £7.70/ha per application.
Annual meadow grass £23.73/ha (spring control).
Black grass £37.95/ha
Bromes £25.00/ha
Desiccant
£4.00/ha
(d) Other crop expenses For baling straw, costs for net wrap at 50-77p/bale for large round
straw bales average weight 200kg are included. Omit other expenses costs if selling straw in the bout.
Additives can be used to preserve moist grain for feeding livestock. Cost will vary depending on product, length of storage period and moisture content at treatment. Alkaline grain treatments (for grain harvested at 16-22% moisture for long term storage), add £19-21/t. Propionic acid treatments (for grain harvested at 18-20% moisture for long term storage), add £6-10/t. Ammonia treatment for feeding straw will cost £23-26/t straw. Treatment costs exclude grain processing and straw tubelining (see pages 354-355 for these costs).
ARABLE 19
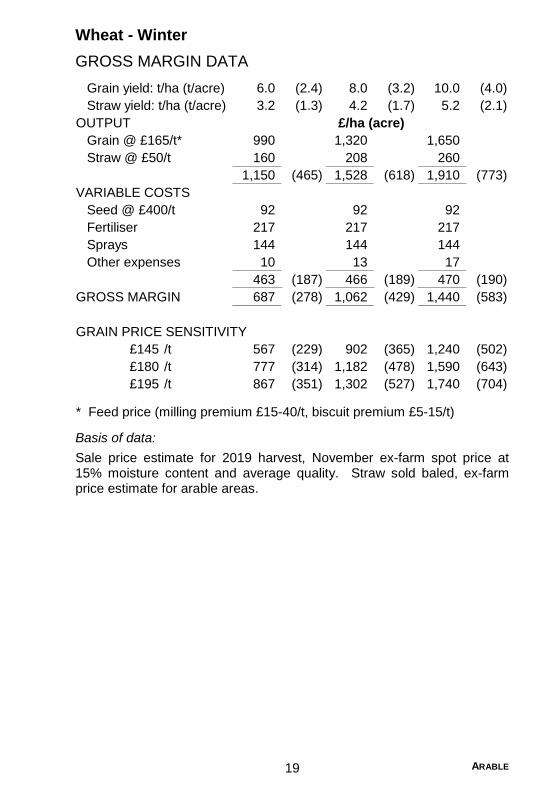
Wheat - Winter
GROSS MARGIN DATA
Grain yield: t/ha (t/acre) 6.0 (2.4) 8.0 (3.2) 10.0 (4.0)
Straw yield: t/ha (t/acre) 3.2 (1.3) 4.2 (1.7) 5.2 (2.1)
OUTPUT
Grain @ £165/t* 990 1,320 1,650
Straw @ £50/t 160 208 260
1,150 (465) 1,528 (618) 1,910 (773)
VARIABLE COSTS
Seed @ £400/t 92 92 92
Fertiliser 217 217 217
Sprays 144 144 144
Other expenses 10 13 17
463 (187) 466 (189) 470 (190)
GROSS MARGIN 687 (278) 1,062 (429) 1,440 (583)
GRAIN PRICE SENSITIVITY
£145 /t 567 (229) 902 (365) 1,240 (502)
£180 /t 777 (314) 1,182 (478) 1,590 (643)
£195 /t 867 (351) 1,302 (527) 1,740 (704)
* Feed price (milling premium £15-40/t, biscuit premium £5-15/t)
£/ha (acre)
Basis of data:
Sale price estimate for 2019 harvest, November ex-farm spot price at 15% moisture content and average quality. Straw sold baled, ex-farm price estimate for arable areas.

ARABLE 20
Wheat - Spring
PHYSICAL DATA
(a) Seed Certified seed second generation (C2) sown at 220 kg/ha (1.75
cwt/acre).
(b) Fertiliser 150 : 52 : 71 kg/ha N : P2O5 : K2O (136 : 42 : 57 units/acre). See
page 4 for more information on nutrient planning.
(c) Sprays Herbicides One application for spring germinating broadleaved
weeds.
Fungicides Two applications for leaf diseases at GS31-32 and GS39-49.
Additional sprays to the basic programme could include:
Mildew £10.80/ha
Wild oats £21.75/ha
Desiccant £4.00/ha
(d) Other crop expenses For baling straw, costs for net wrap at 50-77p/bale for large round
straw bales average weight 200kg are included. Omit other expenses costs if selling straw in the bout.
Additives can be used to preserve moist grain for feeding livestock. Cost will vary depending on product, length of storage period and moisture content at treatment. Alkaline grain treatments (for grain harvested at 16-22% moisture for long term storage), add £19-21/t. Propionic acid treatments (for grain harvested at 18-20% moisture for long term storage), add £6-10/t. Ammonia treatment for feeding straw will cost £23-26/t straw. Treatment costs exclude grain processing and straw tubelining (see pages 354-355 for these costs).

ARABLE 21
Wheat - Spring
GROSS MARGIN DATA
Grain yield: t/ha (t/acre) 4.5 (1.8) 6.5 (2.6) 8.5 (3.4)
Straw yield: t/ha (t/acre) 2.5 (1.0) 3.6 (1.4) 4.7 (1.9)
OUTPUT
Grain @ £165/t* 743 1,073 1,403
Straw @ £50/t 124 179 234
867 (351) 1,252 (507) 1,637 (662)
VARIABLE COSTS
Seed @ £430/t 95 95 95
Fertiliser 168 168 168
Sprays 41 41 41
Other expenses 8 11 15
312 (126) 315 (128) 319 (129)
GROSS MARGIN 555 (225) 937 (379) 1,318 (533)
GRAIN PRICE SENSITIVITY
£145 /t 465 (188) 806 (326) 1,148 (465)
£180 /t 622 (252) 1,034 (418) 1,445 (585)
£195 /t 690 (279) 1,131 (458) 1,573 (637)
* Feed price (milling premium £15-40/t, biscuit premium £5-15/t)
£/ha (acre)
Basis of data:
Sale price estimate for 2019 harvest, November ex-farm spot price at 15% moisture content and average quality. Straw sold baled, ex-farm price estimate for arable areas.

ARABLE 22
Barley - Winter
PHYSICAL DATA
(a) Seed Certified seed second generation (C2) sown at 220 kg/ha (1.75
cwt/acre). Alternatively, hybrid 6 row sown at 145 kg/ha (1.16cwt/ac). Conventional seed price used.
(b) Fertiliser 180 : 67 : 83 kg/ha N : P2O5 : K2O (144 : 54 : 66 units/acre). See
page 4 for more information on nutrient planning.
(c) Sprays Herbicides Autumn residual herbicide to control annual meadow
grass and broadleaved weeds.
Fungicides Three fungicide applications at GS25-30, GS31 and GS49 for rhynchosporium, mildew and other leaf diseases.
Additional sprays to the basic programme could include:
Wild oats £21.75/ha
Aphids £3.70/ha
Desiccant £4.00/ha
(d) Other crop expenses For baling straw, costs for net wrap at 50-77p/bale for large round
straw bales average weight 200kg are included. Omit other expenses costs if selling straw in the bout.
Additives can be used to preserve moist grain for feeding livestock. Cost will vary depending on product, length of storage period and moisture content at treatment. Alkaline grain treatments (for grain harvested at 16-22% moisture for long term storage), add £19-21/t. Propionic acid treatments (for grain harvested at 18-20% moisture for long term storage), add £6-10/t. Ammonia treatment for feeding straw will cost £23-26/t straw. Treatment costs exclude grain processing and straw tubelining (see pages 354-355 for these costs).

ARABLE 23
Barley - Winter
GROSS MARGIN DATA
Grain yield: t/ha (t/acre) 6.0 (2.4) 7.5 (3.0) 9.0 (3.6)
Straw yield: t/ha (t/acre) 3.3 (1.3) 4.1 (1.7) 5.0 (2.0)
OUTPUT
Grain @ £145/t* 870 1,088 1,305
Straw @ £55/t 182 227 272
1,052 (426) 1,315 (532) 1,577 (638)
VARIABLE COSTS
Seed @ £395/t 87 87 87
Fertiliser 204 204 204
Sprays 112 112 112
Other expenses 11 13 16
414 (167) 416 (168) 419 (170)
GROSS MARGIN 638 (259) 899 (364) 1,158 (468)
GRAIN PRICE SENSITIVITY
£125 /t 518 (210) 748 (303) 978 (396)
£160 /t 728 (295) 1,011 (409) 1,293 (523)
£175 /t 818 (331) 1,123 (454) 1,428 (578)
* Feed price (malting price approx. £10-20/t higher)
£/ha (acre)
Basis of data:
Sale price estimate for 2019 harvest, November ex-farm spot price at 15% moisture content and average quality. Straw sold baled, ex-farm price estimate for arable areas.

ARABLE 24
Barley - Spring
PHYSICAL DATA
(a) Seed Certified seed second generation (C2) sown at 190 kg/ha (1.51
cwt/acre).
(b) Fertiliser 130 : 52 : 71 kg/ha N : P2O5 : K2O (104 : 42 : 57 units/acre). See
page 4 for more information on nutrient planning.
(c) Sprays Herbicides Post emergence herbicide to control broadleaved
weeds.
Fungicides Two applications at GS31 and GS45 for rhynchosporium, mildew and other leaf diseases.
Additional sprays to the basic programme could include:
Mildew £12.75/ha
Wild oats £21.75/ha
Aphids £3.70/ha
Desiccant
£4.00/ha
(d) Other crop expenses For baling straw, costs for net wrap at 50-77p/bale for large round
straw bales average weight 200kg are included. Omit other expenses costs if selling straw in the bout.
Additives can be used to preserve moist grain for feeding livestock. Cost will vary depending on product, length of storage period and moisture content at treatment. Alkaline grain treatments (for grain harvested at 16-22% moisture for long term storage), add £19-21/t. Propionic acid treatments (for grain harvested at 18-20% moisture for long term storage), add £6-10/t. Ammonia treatment for feeding straw will cost £23-26/t straw. Treatment costs exclude grain processing and straw tubelining (see pages 354-355 for these costs).

ARABLE 25
Barley - Spring
GROSS MARGIN DATA
Grain yield: t/ha (t/acre) 4.0 (1.6) 5.5 (2.2) 7.5 (3.0)
Straw yield: t/ha (t/acre) 2.1 (0.8) 2.9 (1.2) 3.9 (1.6)
OUTPUT
Grain @ £145/t* 580 798 1,088
Straw @ £55/t 114 157 215
694 (281) 955 (386) 1,303 (527)
VARIABLE COSTS
Seed @ £415/t 79 79 79
Fertiliser 154 154 154
Sprays 61 61 61
Other expenses 7 9 12
301 (122) 303 (123) 306 (124)
GROSS MARGIN 393 (159) 652 (263) 997 (403)
GRAIN PRICE SENSITIVITY
£125 /t 313 (127) 541 (219) 846 (342)
£160 /t 453 (183) 734 (297) 1,109 (449)
£175 /t 513 (208) 816 (330) 1,221 (494)
* Feed price (malting price approx. £15-50/t higher)
£/ha (acre)
Basis of data:
Sale price estimate for 2019 harvest, November ex-farm spot price at 15% moisture content and average quality. Straw sold baled, ex-farm price estimate for arable areas.
ARABLE 26
Oats - Winter
PHYSICAL DATA
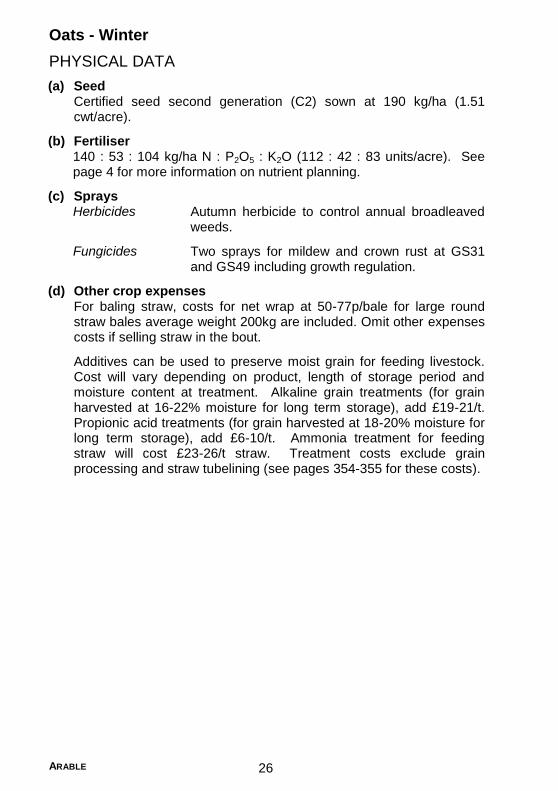
(a) Seed Certified seed second generation (C2) sown at 190 kg/ha (1.51
cwt/acre).
(b) Fertiliser 140 : 53 : 104 kg/ha N : P2O5 : K2O (112 : 42 : 83 units/acre). See
page 4 for more information on nutrient planning.
(c) Sprays Herbicides Autumn herbicide to control annual broadleaved
weeds.
Fungicides Two sprays for mildew and crown rust at GS31 and GS49 including growth regulation.
(d) Other crop expenses For baling straw, costs for net wrap at 50-77p/bale for large round
straw bales average weight 200kg are included. Omit other expenses costs if selling straw in the bout.
Additives can be used to preserve moist grain for feeding livestock. Cost will vary depending on product, length of storage period and moisture content at treatment. Alkaline grain treatments (for grain harvested at 16-22% moisture for long term storage), add £19-21/t. Propionic acid treatments (for grain harvested at 18-20% moisture for long term storage), add £6-10/t. Ammonia treatment for feeding straw will cost £23-26/t straw. Treatment costs exclude grain processing and straw tubelining (see pages 354-355 for these costs).

ARABLE 27
Oats - Winter
GROSS MARGIN DATA
Grain yield: t/ha (t/acre) 5.0 (2.0) 7.5 (3.0) 9.0 (3.6)
Straw yield: t/ha (t/acre) 3.2 (1.3) 4.7 (1.9) 5.7 (2.3)
OUTPUT
Grain @ £155/t* 775 1,163 1,395
Straw @ £50/t 158 237 284
933 (378) 1,400 (567) 1,679 (679)
VARIABLE COSTS
Seed @ £420/t 80 80 80
Fertiliser 177 177 177
Sprays 80 80 80
Other expenses 10 15 18
347 (140) 352 (143) 355 (144)
GROSS MARGIN 586 (238) 1,048 (424) 1,324 (535)
GRAIN PRICE SENSITIVITY
£135 /t 486 (197) 897 (363) 1,144 (463)
£170 /t 661 (268) 1,160 (469) 1,459 (590)
£185 /t 736 (298) 1,272 (515) 1,594 (645)
* Milling price
£/ha (acre)
Basis of data:
Sale price estimate for 2019 harvest, November ex-farm spot price at 15% moisture content and average quality. Straw sold baled, ex-farm price estimate for arable areas.

ARABLE 28
Oats - Spring
PHYSICAL DATA
(a) Seed Certified seed second generation (C2) sown at 190 kg/ha (1.51
cwt/acre).
(b) Fertiliser 100 : 53 : 104 kg/ha N : P2O5 : K2O (80 : 42 : 83 units/acre). See
page 4 for more information on nutrient planning.
(c) Sprays Herbicides Typical weed control for annual broadleaved
weeds.
Fungicides Two sprays at GS25-30 and GS49 for mildew and crown rust including growth regulator.
(d) Other crop expenses For baling straw, costs for net wrap at 50-77p/bale for large round
straw bales average weight 200kg are included. Omit other expenses costs if selling straw in the bout.
Additives can be used to preserve moist grain for feeding livestock. Cost will vary depending on product, length of storage period and moisture content at treatment. Alkaline grain treatments (for grain harvested at 16-22% moisture for long term storage), add £19-21/t. Propionic acid treatments (for grain harvested at 18-20% moisture for long term storage), add £6-10/t. Ammonia treatment for feeding straw will cost £23-26/t straw. Treatment costs exclude grain processing and straw tubelining (see pages 354-355 for these costs).

ARABLE 29
Oats - Spring
GROSS MARGIN DATA
Grain yield: t/ha (t/acre) 3.5 (1.4) 5.0 (2.0) 6.5 (2.6)
Straw yield: t/ha (t/acre) 2.1 (0.8) 3.0 (1.2) 3.9 (1.6)
OUTPUT
Grain @ £155/t* 543 775 1,008
Straw @ £50/t 105 150 195
648 (262) 925 (374) 1,203 (487)
VARIABLE COSTS
Seed @ £420/t 80 80 80
Fertiliser 150 150 150
Sprays 59 59 59
Other expenses 7 10 12
296 (120) 299 (121) 301 (122)
GROSS MARGIN 352 (142) 626 (253) 902 (365)
GRAIN PRICE SENSITIVITY
£135 /t 282 (114) 526 (213) 771 (312)
£170 /t 404 (163) 701 (284) 999 (404)
£185 /t 457 (185) 776 (314) 1,096 (444)
* Milling price
£/ha (acre)
Basis of data:
Sale price estimate for 2019 harvest, November ex-farm spot price at 15% moisture content and average quality. Straw sold baled, ex-farm price estimate for arable areas.
ARABLE 30
Triticale
PHYSICAL DATA
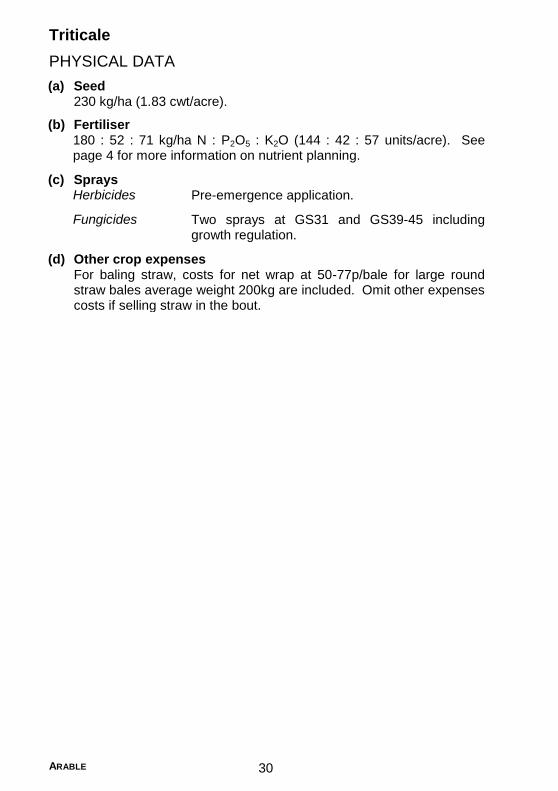
(a) Seed 230 kg/ha (1.83 cwt/acre).
(b) Fertiliser 180 : 52 : 71 kg/ha N : P2O5 : K2O (144 : 42 : 57 units/acre). See
page 4 for more information on nutrient planning.
(c) Sprays Herbicides Pre-emergence application.
Fungicides Two sprays at GS31 and GS39-45 including growth regulation.
(d) Other crop expenses For baling straw, costs for net wrap at 50-77p/bale for large round
straw bales average weight 200kg are included. Omit other expenses costs if selling straw in the bout.

ARABLE 31
Triticale
GROSS MARGIN DATA
Grain yield: t/ha (t/acre) 4.0 (1.6) 6.0 (2.4) 8.0 (3.2)
Straw yield: t/ha (t/acre) 2.6 (1.1) 3.9 (1.6) 5.2 (2.1)
OUTPUT
Grain @ £155/t 620 930 1,240
Straw @ £40/t 104 156 208
724 (293) 1,086 (439) 1,448 (586)
VARIABLE COSTS
Seed @ £435/t 100 100 100
Fertiliser 188 188 188
Sprays 57 57 57
Other expenses 8 12 17
353 (143) 357 (145) 362 (146)
GROSS MARGIN 371 (150) 729 (294) 1,086 (440)
GRAIN PRICE SENSITIVITY
£135 /t 291 (118) 609 (246) 926 (375)
£170 /t 431 (174) 819 (331) 1,206 (488)
£185 /t 491 (199) 909 (368) 1,326 (537)
£/ha (acre)
Basis of data:
Sale price estimate for 2019 harvest, November ex-farm spot price at 15% moisture content and average quality. Straw sold baled, ex-farm price estimate for arable areas.

ARABLE 32
Oilseed Rape - Winter
PHYSICAL DATA
(a) Seed Oil 45%
Seed rate Hybrid - 4kg/ha : Conventional - 5kg/ha Conventional seed price used.
(b) Fertiliser 200 : 49 : 38 + 75 kg/ha N : P2O5 : K2O + SO3
(160 : 39 : 30 + 60 units/acre). See page 4 for more information on nutrient planning.
(c) Sprays Herbicides Pre-emergence herbicide to control annual
meadow grass and broadleaved weeds.
Fungicides Autumn and spring fungicides for sclerotinia, light leaf spot or phoma.
Desiccation Desiccation has largely replaced swathing. If swathing is used over desiccation, reduce spray costs by £16.00/ha. For swathing costs see page 354.
Additional sprays to the basic programme could include:
Slugs £7.50/ha per application.
Sclerotinia £17.75/ha (high risk situations)
Rape winter stem weevil and pollen beetle
£4.25/ha
Volunteer cereals £12.00/ha
Mayweed £26.95/ha
Pod sticker £8.60/ha
(d) Other crop expenses Assuming straw has been chopped. If baling, include costs for net
wrap at 50-77p/bale for round straw bales, average weight 200 kg.
ARABLE 33
Oilseed Rape - Winter
GROSS MARGIN DATA
GROSS MARGIN DATA
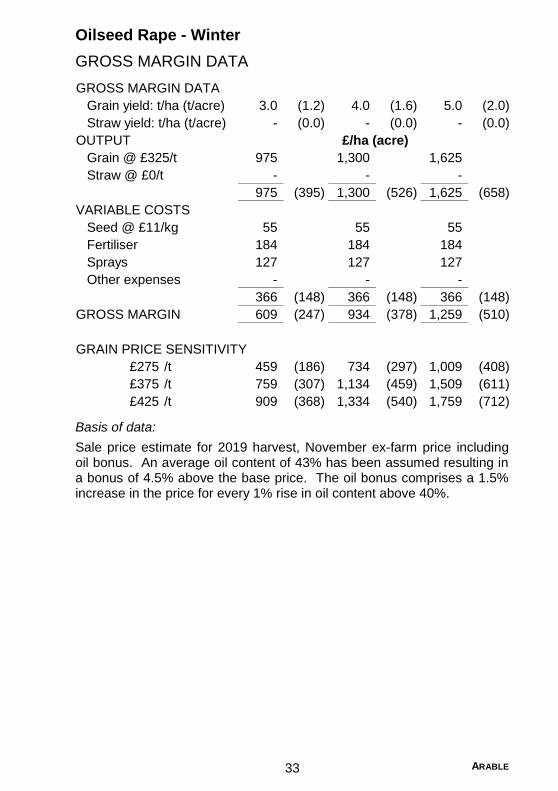
Grain yield: t/ha (t/acre) 3.0 (1.2) 4.0 (1.6) 5.0 (2.0)
Straw yield: t/ha (t/acre) - (0.0) - (0.0) - (0.0)
OUTPUT
Grain @ £325/t 975 1,300 1,625
Straw @ £0/t - - -
975 (395) 1,300 (526) 1,625 (658)
VARIABLE COSTS
Seed @ £11/kg 55 55 55
Fertiliser 184 184 184
Sprays 127 127 127
Other expenses - - -
366 (148) 366 (148) 366 (148)
GROSS MARGIN 609 (247) 934 (378) 1,259 (510)
GRAIN PRICE SENSITIVITY
£275 /t 459 (186) 734 (297) 1,009 (408)
£375 /t 759 (307) 1,134 (459) 1,509 (611)
£425 /t 909 (368) 1,334 (540) 1,759 (712)
£/ha (acre)
Basis of data:
Sale price estimate for 2019 harvest, November ex-farm price including oil bonus. An average oil content of 43% has been assumed resulting in a bonus of 4.5% above the base price. The oil bonus comprises a 1.5% increase in the price for every 1% rise in oil content above 40%.

ARABLE 34
Oilseed Rape - Spring
PHYSICAL DATA
(a) Seed Oil 45%
Seed rate 5 kg/ha
(b) Fertiliser 100 : 28 : 22 + 40 kg/ha N : P2O5 : K2O + SO3
(80 : 22 : 18 + 32 units/acre). See page 4 for more information on nutrient planning.
(c) Sprays Herbicides Pre-emergence herbicide for problem weeds such as
shepherds’ purse.
Fungicides
One spray to control pollen beetle.
Desiccation Desiccation has largely replaced swathing. If swathing is used over desiccation, reduce spray costs by £16.00/ha. For swathing costs see page 354.
Additional sprays to the basic programme could include:
Volunteer cereals
£12.00/ha
Sclerotinia £36.00/ha
Pod sticker £8.60/ha
(d) Other crop expenses Assuming straw has been chopped. If baling, include costs for net
wrap at 50-77p/bale for round straw bales, average weight 200 kg.

ARABLE 35
Oilseed Rape - Spring
GROSS MARGIN DATA
GROSS MARGIN DATA
Grain yield: t/ha (t/acre) 1.8 (0.7) 2.5 (1.0) 3.0 (1.2)
Straw yield: t/ha (t/acre) - (0.0) - (0.0) - (0.0)
OUTPUT
Grain @ £325/t 585 813 975
Straw @ £0/t - - -
585 (237) 813 (329) 975 (395)
VARIABLE COSTS
Seed @ £12/kg 60 60 60
Fertiliser 96 96 96
Sprays 38 38 38
Other expenses - - -
194 (79) 194 (79) 194 (79)
GROSS MARGIN 391 (158) 619 (250) 781 (316)
GRAIN PRICE SENSITIVITY
£275 /t 301 (122) 494 (200) 631 (255)
£375 /t 481 (195) 744 (301) 931 (377)
£425 /t 571 (231) 869 (352) 1,081 (437)
£/ha (acre)
Basis of data:
Sale price estimate for 2019 harvest, November ex-farm price including oil bonus. An average oil content of 43% has been assumed resulting in a bonus of 4.5% above the base price. The oil bonus comprises a 1.5% increase in the price for every 1% rise in oil content above 40%.
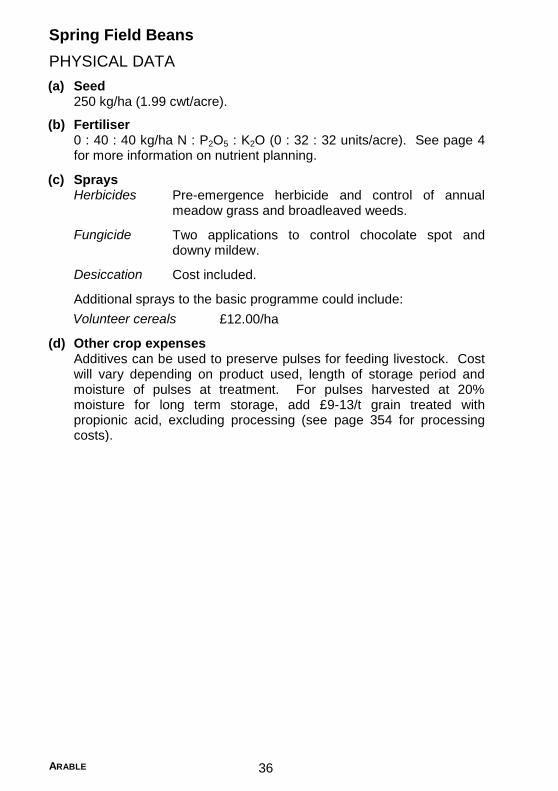
ARABLE 36
Spring Field Beans
PHYSICAL DATA
(a) Seed 250 kg/ha (1.99 cwt/acre).
(b) Fertiliser 0 : 40 : 40 kg/ha N : P2O5 : K2O (0 : 32 : 32 units/acre). See page 4
for more information on nutrient planning.
(c) Sprays Herbicides Pre-emergence herbicide and control of annual
meadow grass and broadleaved weeds.
Fungicide Two applications to control chocolate spot and downy mildew.
Desiccation Cost included.
Additional sprays to the basic programme could include:
Volunteer cereals £12.00/ha
(d) Other crop expenses Additives can be used to preserve pulses for feeding livestock. Cost
will vary depending on product used, length of storage period and moisture of pulses at treatment. For pulses harvested at 20% moisture for long term storage, add £9-13/t grain treated with propionic acid, excluding processing (see page 354 for processing costs).

ARABLE 37
Spring Field Beans
GROSS MARGIN DATA
Grain yield: t/ha (t/acre) 2.5 (1.0) 5.0 (2.0) 6.0 (2.4)
OUTPUT
Grain @ £200/t 500 1,000 1,200
500 (202) 1,000 (405) 1,200 (486)
VARIABLE COSTS
Seed @ £420/t 105 105 105
Fertiliser 50 50 50
Sprays 107 107 107
Other expenses - - -
262 (106) 262 (106) 262 (106)
GROSS MARGIN 238 (96) 738 (299) 938 (380)
GRAIN PRICE SENSITIVITY
£170 /t 163 (66) 588 (238) 758 (307)
£215 /t 276 (112) 813 (329) 1,028 (416)
£230 /t 313 (127) 888 (359) 1,118 (452)
£/ha (acre)
Basis of data:
Sale price 2019 harvest, November ex-farm price. Deductions for field beans, which do not meet minimum quality standards, can reduce the price considerably.

ARABLE 38
Spring Peas
PHYSICAL DATA
(a) Seed 250 kg/ha (1.99 cwt/acre).
White/Large Blue Compounding Pea
(b) Fertiliser 0 : 20 : 30 kg/ha N : P2O5 : K2O (0 : 16 : 24 units/acre). See page 4
for more information on nutrient planning.
(c) Sprays Herbicides A pre-emergence herbicide to control annual and
broadleaved weeds.
Fungicide Two sprays at flowering for downy mildew and botrytis control.
Insecticide Aphid control.
Desiccation A desiccant is included.
(d) Other crop expenses Additives can be used to preserve pulses for feeding livestock. Cost
will vary depending on product used, length of storage period and moisture of pulses at treatment. For pulses harvested at 20% moisture for long term storage, add £9-13/t grain treated with propionic acid, excluding processing (see page 354 for processing costs).

ARABLE 39
Spring Peas
GROSS MARGIN DATA
Grain yield: t/ha (t/acre) 2.5 (1.0) 4.0 (1.6) 5.5 (2.2)
OUTPUT
Grain @ £200/t 500 800 1,100
500 (202) 800 (324) 1,100 (445)
VARIABLE COSTS
Seed @ £500/t 125 125 125
Fertiliser 27 27 27
Sprays 111 111 111
Other expenses - - -
263 (106) 263 (106) 263 (106)
GROSS MARGIN 237 (96) 537 (218) 837 (339)
GRAIN PRICE SENSITIVITY
£170 /t 162 (66) 417 (169) 672 (272)
£215 /t 275 (111) 597 (242) 920 (372)
£230 /t 312 (126) 657 (266) 1,002 (406)
£/ha (acre)
Basis of data:
Sale price estimate for 2019 harvest, November ex-farm price. Deductions for protein peas, which do not meet minimum quality standards, can reduce the price considerably. Bad weather at harvest can result in very high loss levels.

ARABLE 40
Cauliflower and Broccoli
PHYSICAL DATA
(a) System Transplants grown in trays in glasshouses over winter are purchased
and field planted from early March to late summer for harvest from June/July to November (or early spring the following year if overwintered cauliflower). Varieties, geographical location and use of crop covers dictate management, harvest timing and end market.
(b) Seed
Cauliflower Broccoli
Sowing rate 38,000 plants/ha 46,000 plants/ha
Cost varies with variety, disease resistance and target market.
(c) Fertiliser
N P2O5 K2O
Cauliflower 290 kg/ha 100 kg/ha 175 kg/ha Broccoli 250 kg/ha 100 kg/ha 175 kg/ha
Adjustments made for soil status where necessary. See page 4 for more information on nutrient planning.
(d) Sprays Herbicides Stale seed beds burnt off with glyphosate.
Residual herbicide applied post transplanting.
Fungicides
Applications to control mildew, white blister, ring spot and alternaria.
Insecticides For aphid and caterpillar control.
Trace elements Boron, manganese, magnesium sulphate, molybdenum applications all may be required.
(e) Other crop expenses Based on 1/5 of the grown area being under covers (i.e. nets, fleece or polythene).
(f) Irrigation Irrigation can be necessary. These costs have not been included.
(g) Casual labour These costs are not included. Using the data below a guide to cost could be calculated. Labour charged at £12/hr at rates below:
Operation hr/ha
Transplanting 17 Harvest (fresh) 32 Harvest (florets) 20 Additional labour 17
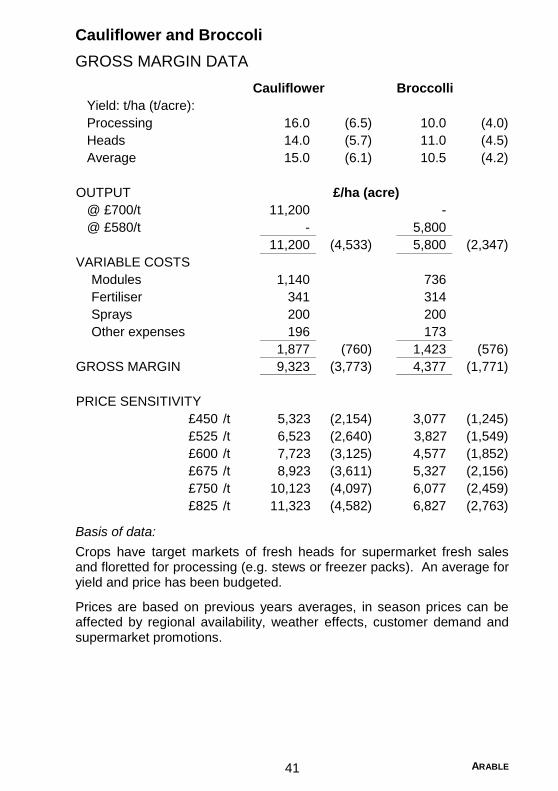
ARABLE 41
Cauliflower and Broccoli
GROSS MARGIN DATA
Cauliflower Broccolli
Yield: t/ha (t/acre):
Processing 16.0 (6.5) 10.0 (4.0)
Heads 14.0 (5.7) 11.0 (4.5)
Average 15.0 (6.1) 10.5 (4.2)
OUTPUT
@ £700/t 11,200 -
@ £580/t - 5,800
11,200 (4,533) 5,800 (2,347)
VARIABLE COSTS
Modules 1,140 736
Fertiliser 341 314
Sprays 200 200
Other expenses 196 173
1,877 (760) 1,423 (576)
GROSS MARGIN 9,323 (3,773) 4,377 (1,771)
PRICE SENSITIVITY
£450 /t 5,323 (2,154) 3,077 (1,245)
£525 /t 6,523 (2,640) 3,827 (1,549)
£600 /t 7,723 (3,125) 4,577 (1,852)
£675 /t 8,923 (3,611) 5,327 (2,156)
£750 /t 10,123 (4,097) 6,077 (2,459)
£825 /t 11,323 (4,582) 6,827 (2,763)
£/ha (acre)
Basis of data:
Crops have target markets of fresh heads for supermarket fresh sales and floretted for processing (e.g. stews or freezer packs). An average for yield and price has been budgeted.
Prices are based on previous years averages, in season prices can be affected by regional availability, weather effects, customer demand and supermarket promotions.

ARABLE 42
Timothy - Hay, Greencut
PHYSICAL DATA
(a) System As practised on the Carses of Stirling and Clackmannan.
(b) Yield Average between 7 t/ha (2.8 t/acre) and 8 t/ha (3.2 t/acre) with some
aftermath grazing (or alternatively round bale silage).
Price rises usually as the season progresses but hay also loses weight with storage - as much as 15% over a winter, depending upon the conditions of storage.
(c) Seed Annual charge: assumes a 10-year sward life and that ‘Basic’ seed
will be sown to keep open the option of a seed crop.
Seed rate: 13-18 kg/ha.
(d) Fertiliser Standard practice would see only N applied annually, usually as
sulphate of ammonia, supported by periodic dressings of phosphate and potash.
The fertiliser costs overleaf consider an application of the rates below.
See page 4 for more information on nutrient planning.
kg/ha (units/acre) Average Premium
N 80 (64) 120 (96) P2O5 (annual allocation) 40 (32) 50 (40) K2O 48 (38) 60 (48)
(e) Sprays Annual nominal charge to cover a range of circumstances.
(f) Other crop expenses
Net wrap cost is costed on the basis of 5-6 round bales/t and assuming one roll of net will wrap 410 bales.

ARABLE 43
Timothy - Hay, Greencut
GROSS MARGIN DATA
Average yield: t/ha (acre) 7.0 (2.8) 8.0 (3.2)
OUTPUT
Hay (ex-field or early store) @ £110/t 770 880
Aftermath grazing let @ £40/ha 40 40
810 (328) 920 (372)
VARIABLE COSTS
Seed (annual charge) 9 9
Fertiliser 102 141
Sprays (annual charge) 5 5
Other expenses 15 17
131 (53) 172 (70)
GROSS MARGIN 679 (275) 748 (302)
£/ha (acre)
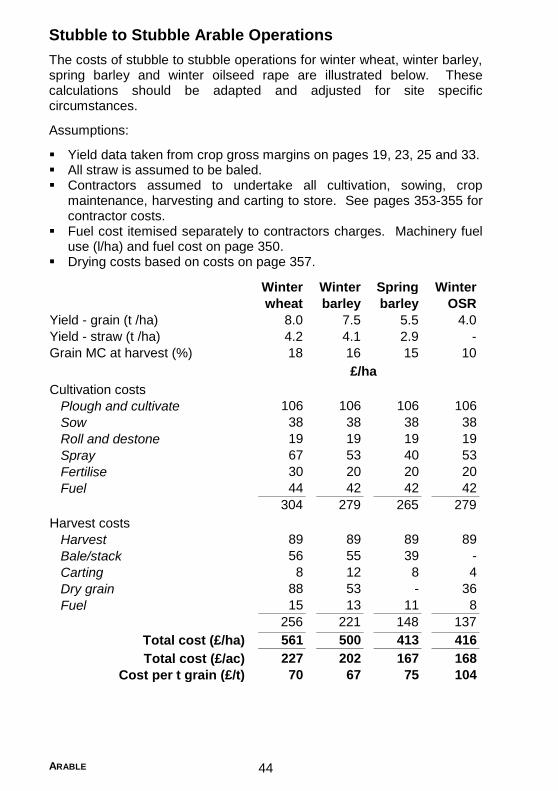
ARABLE 44
Stubble to Stubble Arable Operations
The costs of stubble to stubble operations for winter wheat, winter barley, spring barley and winter oilseed rape are illustrated below. These calculations should be adapted and adjusted for site specific circumstances.
Assumptions:
Yield data taken from crop gross margins on pages 19, 23, 25 and 33. All straw is assumed to be baled. Contractors assumed to undertake all cultivation, sowing, crop
maintenance, harvesting and carting to store. See pages 353-355 for contractor costs.
Fuel cost itemised separately to contractors charges. Machinery fuel use (l/ha) and fuel cost on page 350.
Drying costs based on costs on page 357.
Winter Winter Spring Winter
wheat barley barley OSR
Yield - grain (t /ha) 8.0 7.5 5.5 4.0
Yield - straw (t /ha) 4.2 4.1 2.9 -
Grain MC at harvest (%) 18 16 15 10
Cultivation costs
Plough and cultivate 106 106 106 106
Sow 38 38 38 38
Roll and destone 19 19 19 19
Spray 67 53 40 53
Fertilise 30 20 20 20
Fuel 44 42 42 42
304 279 265 279
Harvest costs
Harvest 89 89 89 89
Bale/stack 56 55 39 -
Carting 8 12 8 4
Dry grain 88 53 - 36
Fuel 15 13 11 8
256 221 148 137
Total cost (£/ha) 561 500 413 416
Total cost (£/ac) 227 202 167 168
Cost per t grain (£/t) 70 67 75 104
£/ha
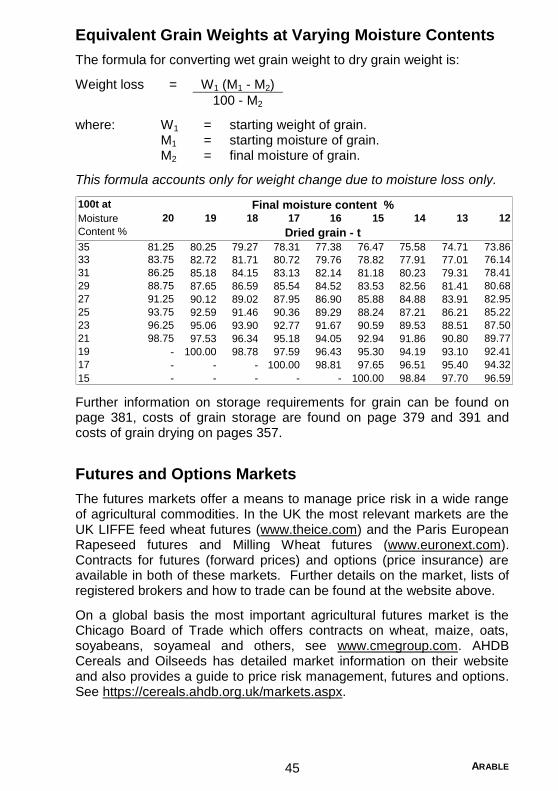
ARABLE 45
Equivalent Grain Weights at Varying Moisture Contents
The formula for converting wet grain weight to dry grain weight is:
Weight loss = W1 (M1 - M2)
100 - M2
where: W1 = starting weight of grain. M1 = starting moisture of grain. M2 = final moisture of grain.
This formula accounts only for weight change due to moisture loss only.
100t at
Moisture 20 12
Content %
35 81.25 73.86
33 83.75 76.14
31 86.25 78.41
29 88.75 80.68
27 91.25 82.95
25 93.75 85.22
23 96.25 87.50
21 98.75 89.77
19 - 92.41
17 - 94.32
15 - 96.59
75.58 74.71
Final moisture content % 19 18 17 16 15 14 13
80.72 79.76 78.82 77.91
Dried grain - t
80.25 79.27 78.31 77.38 76.47
77.01
85.18 84.15 83.13 82.14 81.18 80.23 79.31
82.72 81.71
84.88 83.91
87.65 86.59 85.54 84.52 83.53 82.56
90.36 89.29 88.24 87.21
81.41
90.12 89.02 87.95 86.90 85.88
86.21
95.06 93.90 92.77 91.67 90.59 89.53 88.51
92.59 91.46
94.19 93.10
97.53 96.34 95.18 94.05 92.94 91.86
100.00 98.81 97.65 96.51
90.80
100.00 98.78 97.59 96.43 95.30
95.40
- - - - 100.00 98.84 97.70
- -
Further information on storage requirements for grain can be found on page 381, costs of grain storage are found on page 379 and 391 and costs of grain drying on pages 357.
Futures and Options Markets
The futures markets offer a means to manage price risk in a wide range of agricultural commodities. In the UK the most relevant markets are the UK LIFFE feed wheat futures (www.theice.com) and the Paris European Rapeseed futures and Milling Wheat futures (www.euronext.com). Contracts for futures (forward prices) and options (price insurance) are available in both of these markets. Further details on the market, lists of registered brokers and how to trade can be found at the website above.
On a global basis the most important agricultural futures market is the Chicago Board of Trade which offers contracts on wheat, maize, oats, soyabeans, soyameal and others, see www.cmegroup.com. AHDB Cereals and Oilseeds has detailed market information on their website and also provides a guide to price risk management, futures and options. See https://cereals.ahdb.org.uk/markets.aspx.


Potatoes

POTATOES 48
Introduction
Markets and price drivers The potato market in the UK is split between seed, ware for fresh market and ware for processing. The unprecedented spring of 2018 meant a very late start to planting. In 2017 ware crops were planted at the end of March while in 2018 they were not planted until May. Some seed crops continued to be planted well into June. However, the higher than average soil temperatures in May did help growth and plants emerged quickly from warm soil making up some time due to the late planting date. The concern then was lack of rain and the prolonged dry conditions during May and June with irrigation (where available) necessary for crops. It is difficult to predict if the delayed planting and dry conditions will have any significant effect on yield at the end of the 2018 growing season. Price trends for potatoes are shown in the following chart.
Recently consumer trends indicate a stabilisation or increase in potato consumption which will be important to sustain if longer term prices are to remain supported.
The UK processed potato market is increasing at the expense of the fresh potato market and accounts for most potato consumption. The bulk of raw supply is grown on contract in England though an increasing amount of frozen processed product is being imported as well as raw material. Sterling’s weakness against the Euro may encourage greater use of home produced potato products provided supply is available.
UK seed production is confined to Scotland and areas of higher altitude in England. The market for export of high grade seed has nearly doubled recently. As export is mainly to non EU countries the even greater weakness of Sterling against the US dollar has stimulated export demand. The natural perishability of the potato is the largest threat to this market so the maintenance of high health standards is imperative.

POTATOES 49
Marketing Contracts have been a standard feature of the processing market for a long time where factories need to procure supplies well in advance and ensure that their growers attain a sustainable price. The fresh market is far more volatile and complex with growers utilising cold storage to lengthen their supply season and take advantage of higher prices later into the new year. In these recent seasons of oversupply, contracts have become more popular where growers have tried to lock in a proportion of crop to a known price. However, in a season of undersupply growers will hold onto uncontracted stocks as long as possible to negotiate higher prices. The grower’s hand is also strengthened by producing potatoes free from damage, disease and skin blemish as aesthetics are a major selling point in the fresh potato sector.
The seed market is virtually all done on contract where growers multiply seed stocks in partnership with the seed houses. Growers must attain high standards of crop health, seed purity and hygiene, good yields of the correct size band and timely and accurate supply. Reputation and reliability will gain growers higher quality contracts.
Margins Crop returns are highly sensitive to the net (packed out) yield achieved which also affects the price. Attention to crop health and damage minimisation are critical. Seed costs are variable with growers looking to multiply their own seed where they can. Fertiliser costs can be adjusted according to market with savings on nitrogen and potash for new, salad and seed potato growers. Sprays are quite uniform across the board but the need for nematicides to combat Potato Cyst Nematode (PCN) is a significant outlay. Differences in fixed costs, particularly machinery, have the greatest impact on overall profitability.
Variety Choice The most important factor when selecting a potato variety is suitability for the end market. For crisps, tubers with good shape, high dry matter, resistance to damage and yellow flesh are required. For chips, oval tubers with good uniformity and low reducing sugar content are best. For the fresh packing market, taste and resistance to disease causing skin blemishes are important. The most popular variety is Maris Piper which can be boiled, chipped or roasted equally well, and even commands brand loyalty. Salad varieties are becoming more popular as they can be boiled within 20 minutes without peeling and chopping, which makes them competitive with pasta and rice.
Resistance to pests and diseases is becoming increasingly important due to the loss of key chemical active ingredients. The most valuable traits are resistance to PCN (which also helps to reduce the viable population of PCN in the field), blackleg, powdery scab and blight. Gross yield as with wheat and barley is not as important as net/sold yield is to potatoes. Emphasis is on quality over quantity in the pursuit of profitability.

POTATOES 50
Potatoes - Loose New (Covered and Open)
PHYSICAL DATA
Machine harvested
(a) Seed Nominal planting rate of 3.5 t/ha. No charge included for chitting.
Bought in seed. Cost varies with variety, e.g. Rocket, Epicure, seed size and classification grade. Seed rate also varies with variety and seed size.
(b) Fertiliser 90 : 150 : 110 kg/ha N : P2O5 : K2O (72 : 120 : 88 units/acre). See
page 4 for more information on nutrient planning.
(c) Sprays Seed treatment Half seed rate treatment for rhizoctonia.
Herbicides Residual herbicide tank mix with multiple active ingredients.
Blight control 3-5 spray program with protectant and tuber blight control chemicals. Cost may be higher in high blight pressure years.
Desiccation Haulm destruction by pulverizing. No chemical cost. For pulverising costs, see page 355.
(d) Other crop expenses
Levy costs are included.
25 kg bags (£9.00-9.50/t of crop) could be an additional item, depending on circumstances.
Includes cost of fleece material and labour cost of covering, uncovering and general maintenance during the season.
(e) Irrigation Irrigation may be applied in some circumstances for yield and quality.
These costs are not included. Annual capital charge could be £350-500/ha plus £1.60-1.90/ha.mm with a contract charge of approximately £5.40/ha.mm.
(f) Casual labour These costs are not included. Costs calculated using the data below
could be used. Labour charged at £12/hr (assumes lifting and grading done at the same time) at the rates below:
Operation hr/ha
Lifting (by harvester) 20 Grading low yield 25 medium yield 38

POTATOES 51
Potatoes - Loose New (Covered and Open)
GROSS MARGIN DATA
Yield: t/ha (t/acre):
Ware 14 (5.7) 20 (8.1)
Stockfeed - (0.0) - (0.0)
OUTPUT
Ware @ £475/t 6,650 -
Ware @ £300/t - 6,000
Stockfeed @ £0/t - -
6,650 (2,691) 6,000 (2,428)
VARIABLE COSTS
Seed @ £305/t 1,068 1,068
Fertiliser 213 213
Sprays 263 228
Other expenses 918 43
2,462 (996) 1,552 (628)
GROSS MARGIN 4,188 (1,695) 4,448 (1,800)
WARE PRICE SENSITIVITY
£200 /t 338 (137) 2,448 (991)
£350 /t 2,438 (987) 5,448 (2,205)
£500 /t 4,538 (1,837) 8,448 (3,419)
£650 /t 6,638 (2,686) 11,448 (4,633)
£800 /t 8,738 (3,536) 14,448 (5,847)
Covered Open
£/ha (acre)
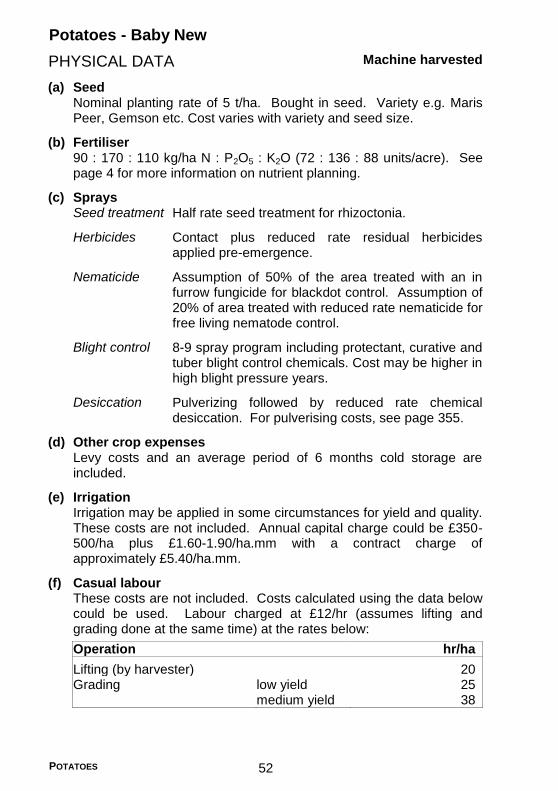
POTATOES 52
Potatoes - Baby New
PHYSICAL DATA
Machine harvested
(a) Seed Nominal planting rate of 5 t/ha. Bought in seed. Variety e.g. Maris
Peer, Gemson etc. Cost varies with variety and seed size.
(b) Fertiliser 90 : 170 : 110 kg/ha N : P2O5 : K2O (72 : 136 : 88 units/acre). See
page 4 for more information on nutrient planning.
(c) Sprays Seed treatment Half rate seed treatment for rhizoctonia.
Herbicides Contact plus reduced rate residual herbicides applied pre-emergence.
Nematicide Assumption of 50% of the area treated with an in furrow fungicide for blackdot control. Assumption of 20% of area treated with reduced rate nematicide for free living nematode control.
Blight control 8-9 spray program including protectant, curative and tuber blight control chemicals. Cost may be higher in high blight pressure years.
Desiccation Pulverizing followed by reduced rate chemical desiccation. For pulverising costs, see page 355.
(d) Other crop expenses
Levy costs and an average period of 6 months cold storage are included.
(e) Irrigation Irrigation may be applied in some circumstances for yield and quality.
These costs are not included. Annual capital charge could be £350-500/ha plus £1.60-1.90/ha.mm with a contract charge of approximately £5.40/ha.mm.
(f) Casual labour These costs are not included. Costs calculated using the data below
could be used. Labour charged at £12/hr (assumes lifting and grading done at the same time) at the rates below:
Operation hr/ha
Lifting (by harvester) 20 Grading low yield 25 medium yield 38

POTATOES 53
Potatoes - Baby New
GROSS MARGIN DATA
Yield: t/ha (t/acre):
Ware 27 (10.9) 27 (10.9)
Stockfeed - (0.0) - (0.0)
OUTPUT
Ware @ £215/t 5,805 -
Ware @ £245/t - 6,615
Stockfeed @ £0/t - -
5,805 (2,349) 6,615 (2,677)
VARIABLE COSTS
Seed @ £230/t 1,150 1,150
Fertiliser 226 226
Sprays 463 463
Other expenses 43 1,015
1,882 (761) 2,854 (1,155)
GROSS MARGIN 3,923 (1,588) 3,761 (1,522)
WARE PRICE SENSITIVITY
£100 /t 818 (331) -154 -(62)
£175 /t 2,843 (1,151) 1,871 (757)
£250 /t 4,868 (1,970) 3,896 (1,577)
£325 /t 6,893 (2,790) 5,921 (2,396)
£400 /t 8,918 (3,609) 7,946 (3,216)
Ex -store
£/ha (acre)
Off-field

POTATOES 54
Potatoes - Early Set Skin Pre-Pack Bakers (Covered and Open)
PHYSICAL DATA
Machine harvested
(a) Seed Planted at 2.4 t/ha with bought in seed. Cost varies with variety, e.g.
Marfona, Osprey etc, seed size and classification grade.
(b) Fertiliser 170-180 : 130 : 200 kg/ha N : P2O5 : P : K2O (136-144 : 104 : 160
units/acre). See page 4 for more information on nutrient planning.
(c) Sprays Seed treatment Reduced rate seed treatment for Rhizoctonia
control.
Nematicide Assumption of 15-20% of the area treated with nematicide for free living nematode or PCN control.
Herbicides Cover crops residual herbicide tank mix. Uncover crops contact plus reduced rate residual herbicides applied pre-emergence.
Blight control 8-9 spray program including protectant, curative and tuber blight protection chemicals.
Slug control 3-4 applications.
Desiccation Pulverising followed by 2-3 spray chemical desiccation program. For pulverising costs, see page 355.
(d) Other crop expenses
Levy costs and fleece for covered crop included.
(e) Irrigation Irrigation may be applied in some circumstances for yield and quality.
These costs are not included. Annual capital charge could be £350-500/ha plus £1.60-1.90/ha.mm with a contract charge of approximately £5.40/ha.mm.
(f) Casual labour These costs are not included. Costs calculated using the data below
could be used. Labour charged at £12/hr at the rates below:
Operation hr/ha
Lifting (by harvester) 20 Grading (half the grading
done by regular labour) low yield 44
high yield 50

POTATOES 55
Potatoes - Early Set Skin Pre-Pack Bakers (Covered and Open)
GROSS MARGIN DATA
Yield: t/ha (t/acre):
Ware 42 (17.0) 47 (19.0)
Stockfeed - (0.0) - (0.0)
OUTPUT
Ware @ £170/t 7,140 -
Ware @ £135/t - 6,345
Stockfeed @ £0/t - -
7,140 (2,890) 6,345 (2,568)
VARIABLE COSTS
Seed @ £305/t 732 732
Fertiliser 293 300
Sprays 545 510
Other expenses 918 43
2,488 (1,007) 1,585 (641)
GROSS MARGIN 4,652 (1,883) 4,760 (1,927)
WARE PRICE SENSITIVITY
£50 /t -388 -(157) 765 (310)
£100 /t 1,712 (693) 3,115 (1,261)
£125 /t 2,762 (1,118) 4,290 (1,736)
£175 /t 4,862 (1,968) 6,640 (2,687)
£200 /t 5,912 (2,393) 7,815 (3,163)
£250 /t 8,012 (3,242) 10,165 (4,114)
Covered
£/ha (acre)
Open

POTATOES 56
Potatoes - Pre-Pack Salads
PHYSICAL DATA
Machine harvested
(a) Seed Nominal planting rate of 5 t/ha. Bought in seed. Variety e.g.
Charlotte etc. Cost varies with variety and seed size.
(b) Fertiliser 90 : 170 : 110 kg/ha N : P2O5 : K2O (72 : 136 : 88 units/acre). See
page 4 for more information on nutrient planning.
(c) Sprays Seed treatment Half rate seed treatment for Rhizoctonia.
Herbicides Contact plus reduced rate residual herbicides applied pre-emergence.
Nematicide Assumption of 50% of the area treated with an in furrow fungicide for blackdot control. Assumption of 20% of area treated with reduced rate nematicide for free living nematode control.
Blight control 8-9 spray program including protectant, systemic, curative and tuber blight control chemicals. Cost may be higher in high blight pressure years.
Slug control 2 reduced rate application of slug pellets.
Desiccation Pulverizing followed by reduced rate chemical desiccation. For pulverising costs, see page 355.
(d) Other crop expenses
Levy costs and an average period of 6 months cold storage are included.
(e) Irrigation Irrigation may be applied in some circumstances for yield and quality.
These costs are not included. Annual capital charge could be £350-500/ha plus £1.60-1.90/ha.mm with a contract charge of approximately £5.40/ha.mm.
(f) Casual labour These costs are not included. Costs calculated using the data below
could be used. Labour charged at £12/hr (assumes lifting and grading done at the same time) at the rates below:
Operation hr/ha
Lifting (by harvester) 20 Grading low yield 25 medium yield 38

POTATOES 57
Potatoes - Pre-Pack Salads
GROSS MARGIN DATA
Yield: t/ha (t/acre):
Ware 37 (15.0)
Stockfeed 4 (1.6)
41 (16.6)
OUTPUT
Ware @ £255 /t 9,435
Stockfeed @ £20 /t 80
9,515 (3,851)
VARIABLE COSTS
Seed @ £280/t 1,400
Fertiliser 226
Sprays 449
Other expenses 1,519
3,594 (1,454)
GROSS MARGIN 5,921 (2,396)
WARE PRICE SENSITIVITY
£75 /t -739 -(299)
£150 /t 2,036 (824)
£200 /t 3,886 (1,573)
£250 /t 5,736 (2,321)
£300 /t 7,586 (3,070)
£375 /t 10,361 (4,193)
£/ha (acre)

POTATOES 58
Potatoes - Maincrop Ware (Pre-Pack Bakers)
PHYSICAL DATA
Machine harvested
(a) Seed Planted at 2.4 t/ha (can range from 2.0-3.0 t/ha for 35-55 mm seed
depending on variety). Bought in. Cost varies with variety, seed size and classification grade.
(b) Fertiliser 200 : 130 : 200 kg/ha N : P2O5 : K2O (160 : 104 : 160 units/acre).
See page 4 for more information on nutrient planning.
Reduce N by 33% for indeterminate varieties, e.g. Vales Sovereign.
(c) Sprays Seed treatment Reduced rate seed treatment for rhizoctonia control.
50% of the area treated with in furrow fungicide for control of blackdot.
Nematicide Assumption of 15-20% of area treated for free living nematode or PCN control.
Herbicides Contact plus reduced rate residual herbicide tank mix.
Blight control 12 spray blight program for moderate blight pressure including protectant, systemic, curative and tuber blight protection chemicals.
Slugs control 2-3 applications.
Desiccation 2-3 spray chemical desiccation program.
(d) Other crop expenses
Levy costs and costs for average cold storage period of 6 months are included.
(e) Irrigation Irrigation may be applied in some circumstances for yield and quality.
These costs are not included. Annual capital charge could be £350-500/ha plus £1.60-1.90/ha.mm with a contract charge of approximately £5.40/ha.mm.
(f) Casual labour These costs are not included. Costs calculated using the data below
could be used. Labour charged at £12/hr at the rates below:
Operation hr/ha
Lifting (by harvester) 20
Grading (half the grading done by regular labour)
low yield 55
high yield 70

POTATOES 59
Potatoes - Maincrop Ware (Pre-Pack Bakers)
GROSS MARGIN DATA
Yield: t/ha (t/acre):
Bakers 16 (6.5) 24 (9.7)
Pre-pack 26 (10.5) 31 (12.5)
Outgrades 8 (3.2) 10 (4.0)
50 (20.2) 65 (26.3)
OUTPUT
Bakers @ £195/t 3,120 4,680
Pre-pack @ £100/t 2,600 3,100
Outgrades @ £30/t 240 300
5,960 (2,412) 8,080 (3,270)
VARIABLE COSTS
Seed @ £300/t 720 720
Fertiliser 313 313
Sprays 494 494
Other expenses 1,843 2,383
3,370 (1,364) 3,910 (1,582)
GROSS MARGIN 2,590 (1,048) 4,170 (1,688)
WARE PRICE SENSITIVITY
£50 /t 1,290 (522) 2,620 (1,060)
£130 /t 3,370 (1,364) 5,100 (2,064)
£210 /t 5,450 (2,206) 7,580 (3,068)
£290 /t 7,530 (3,047) 10,060 (4,071)
£/ha (acre)
Note:
Many packers will split grade the pack size (e.g. 45/50-65/70 mm) from the baker (65/70-85 mm), paying a flat rate for all sizes above the 45/50 mm bottom riddle.

POTATOES 60
Potatoes - Maincrop Ware (Pre-Pack Premium Varieties)
PHYSICAL DATA
Machine harvested
(a) Seed Planted at 1.9 t/ha (varies with variety e.g. Maris Piper, Desiree, King
Edward etc). Bought in. Cost varies with variety, seed size and classification grade.
(b) Fertiliser 180 : 130 : 200 kg/ha N : P2O5 : K2O (144 : 104 : 160 units/acre).
See page 4 for more information on nutrient planning.
(c) Sprays Seed treatment Reduced rate seed treatment for rhizoctonia
control. Treated with in furrow fungicide for control of blackdot.
Nematicide Assumption of 15-20% of area treated for free living nematode or PCN control.
Herbicides Contact plus reduced rate residual herbicides applied pre-emergence.
Blight control 12 spray blight program for high blight pressure including protectant, systemic, curative and tuber blight protection chemicals.
Slugs control Comprehensive reduced dose season program.
Desiccation 3 spray chemical desiccation program.
(d) Other crop expenses
BPC levy, average cold storage period of 6 months and sprout suppression are included.
(e) Irrigation Irrigation may be applied in some circumstances for yield and quality.
These costs are not included. Annual capital charge could be £350-500/ha plus £1.60-1.90/ha.mm with a contract charge of approximately £5.40/ha.mm.
(f) Casual labour These costs are not included. Costs calculated using the data below
could be used. Labour charged at £12/hr at the rates below:
Operation hr/ha
Lifting (by harvester) 20
Grading (half the grading done by regular labour)
low yield high yield
55 70
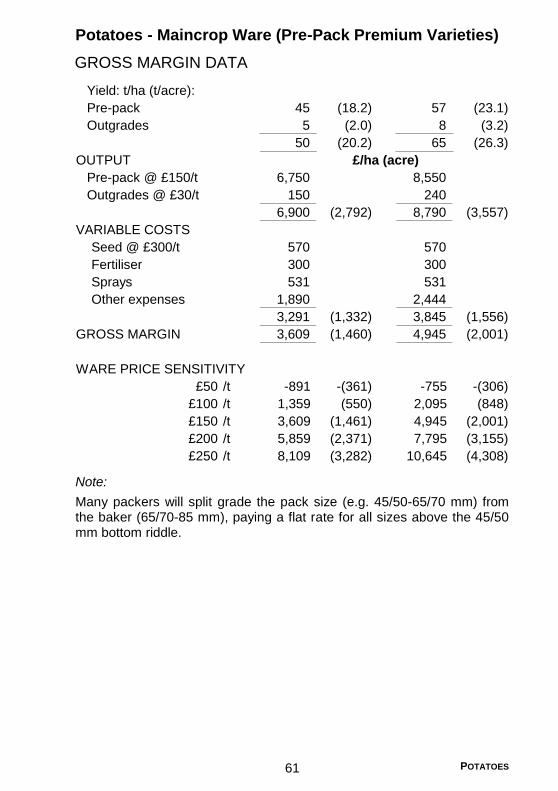
POTATOES 61
Potatoes - Maincrop Ware (Pre-Pack Premium Varieties)
GROSS MARGIN DATA
Yield: t/ha (t/acre):
Pre-pack 45 (18.2) 57 (23.1)
Outgrades 5 (2.0) 8 (3.2)
50 (20.2) 65 (26.3)
OUTPUT
Pre-pack @ £150/t 6,750 8,550
Outgrades @ £30/t 150 240
6,900 (2,792) 8,790 (3,557)
VARIABLE COSTS
Seed @ £300/t 570 570
Fertiliser 300 300
Sprays 531 531
Other expenses 1,890 2,444
3,291 (1,332) 3,845 (1,556)
GROSS MARGIN 3,609 (1,460) 4,945 (2,001)
WARE PRICE SENSITIVITY
£50 /t -891 -(361) -755 -(306)
£100 /t 1,359 (550) 2,095 (848)
£150 /t 3,609 (1,461) 4,945 (2,001)
£200 /t 5,859 (2,371) 7,795 (3,155)
£250 /t 8,109 (3,282) 10,645 (4,308)
£/ha (acre)
Note:
Many packers will split grade the pack size (e.g. 45/50-65/70 mm) from the baker (65/70-85 mm), paying a flat rate for all sizes above the 45/50 mm bottom riddle.

POTATOES 62
Potatoes - Maincrop Ware (Processing - Chips)
PHYSICAL DATA
Machine harvested
(a) Seed Planted at 3.0 t/ha with 35/55mm seed (varies depending on variety,
e.g. Maris Piper, Markies, etc). Bought in. Cost varies with variety, seed size and classification grade.
(b) Fertiliser 180 : 130 : 300 kg/ha N : P2O5 : K2O (144 : 104 : 240 units/acre).
See page 4 for more information on nutrient planning.
Organic manures may be best avoided for processing crops – late and variable release of N could affect fry quality.
(c) Sprays Seed treatment None unless rhizoctonia infection present on seed.
Nematicide Assumption of 15-20% of area treated for free living nematode or PCN control.
Herbicides Contact plus reduced rate residual herbicides applied pre-emergence.
Blight control 12 spray blight program for high blight pressure including protectant, systemic, curative and tuber blight protection chemicals. Blight sprays include chemical for alternaria control for Markies.
Slug control Comprehensive reduced dose season program.
Desiccation 3 spray chemical desiccation program.
(d) Other crop expenses
Levy costs, storage and sprout suppressant costs are included. Chip processing in Scotland is mainly for chip shops, so costs of bags need to be included (£9.00-9.50/t of crop for 25 kg bags).
(e) Casual labour These costs are not included. Costs calculated using the data below
could be used. Labour charged at £12/hr at the rates below:
Operation hr/ha
Lifting (by harvester) 20
Grading (half the grading done by regular labour) 40

POTATOES 63
Potatoes - Maincrop Ware (Processing - Chips)
GROSS MARGIN DATA
Yield: t/ha (t/acre):
Ware 52 (21.0) 52 (21.0)
Stockfeed 5 (2.0) 5 (2.0)
57 (23.1) 57 (23.1)
OUTPUT
Off-field @ £130/t 6,760 -
Ex-store @ £170/t - 8,840
Stockfeed @ £20/t 100 100
6,860 (2,776) 8,940 (3,618)
VARIABLE COSTS
Seed @ £225/t 675 675
Fertiliser 345 345
Sprays 458 458
Other expenses 43 1,006
1,521 (615) 2,484 (1,005)
GROSS MARGIN 5,339 (2,161) 6,456 (2,613)
WARE PRICE SENSITIVITY
£50 /t 1,179 (477) 216 (87)
£110 /t 4,299 (1,740) 3,336 (1,350)
£170 /t 7,419 (3,002) 6,456 (2,613)
£230 /t 10,539 (4,265) 9,576 (3,875)
£300 /t 14,179 (5,738) 13,216 (5,348)
Off-field Ex-store
£/ha (acre)
Note:
Prices quoted include typical bonus additions for good dry matter, low tuber count, good size (length), good fry colour and low defect levels.
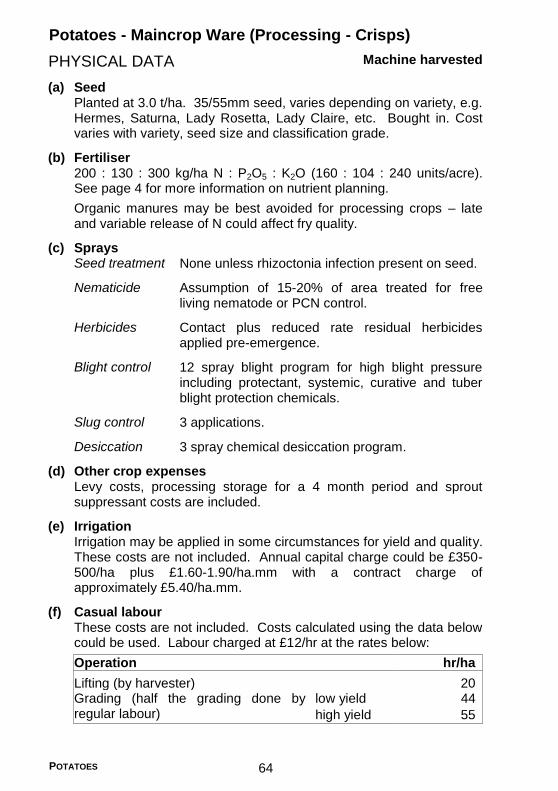
POTATOES 64
Potatoes - Maincrop Ware (Processing - Crisps)
PHYSICAL DATA
Machine harvested
(a) Seed Planted at 3.0 t/ha. 35/55mm seed, varies depending on variety, e.g.
Hermes, Saturna, Lady Rosetta, Lady Claire, etc. Bought in. Cost varies with variety, seed size and classification grade.
(b) Fertiliser 200 : 130 : 300 kg/ha N : P2O5 : K2O (160 : 104 : 240 units/acre).
See page 4 for more information on nutrient planning.
Organic manures may be best avoided for processing crops – late and variable release of N could affect fry quality.
(c) Sprays Seed treatment None unless rhizoctonia infection present on seed.
Nematicide Assumption of 15-20% of area treated for free living nematode or PCN control.
Herbicides Contact plus reduced rate residual herbicides applied pre-emergence.
Blight control 12 spray blight program for high blight pressure including protectant, systemic, curative and tuber blight protection chemicals.
Slug control 3 applications.
Desiccation 3 spray chemical desiccation program.
(d) Other crop expenses
Levy costs, processing storage for a 4 month period and sprout suppressant costs are included.
(e) Irrigation Irrigation may be applied in some circumstances for yield and quality.
These costs are not included. Annual capital charge could be £350-500/ha plus £1.60-1.90/ha.mm with a contract charge of approximately £5.40/ha.mm.
(f) Casual labour These costs are not included. Costs calculated using the data below
could be used. Labour charged at £12/hr at the rates below:
Operation hr/ha
Lifting (by harvester) 20
Grading (half the grading done by regular labour)
low yield 44
high yield 55

POTATOES 65
Potatoes - Maincrop Ware (Processing - Crisps)
GROSS MARGIN DATA
Yield: t/ha (t/acre):
Ware 44 (17.8) 44 (17.8)
Stockfeed 4 (1.6) 4 (1.6)
48 (19.4) 48 (19.4)
OUTPUT
Off-field @ £90/t 3,960 -
Ex-store @ £150/t - 6,600
Stockfeed @ £20/t 80 80
4,040 (1,635) 6,680 (2,703)
VARIABLE COSTS
Seed @ £265/t 928 928
Fertiliser 358 358
Sprays 462 462
Other expenses 43 854
1,791 (725) 2,602 (1,053)
GROSS MARGIN 2,249 (910) 4,078 (1,650)
WARE PRICE SENSITIVITY
£50 /t 489 (198) -322 -(130)
£110 /t 3,129 (1,266) 2,318 (938)
£170 /t 5,769 (2,335) 4,958 (2,006)
£230 /t 8,409 (3,403) 7,598 (3,075)
£300 /t 11,489 (4,650) 10,678 (4,321)
£/ha (acre)
Ex-storeOff-field

POTATOES 66
Potatoes - Seed (Low and High Number Varieties)
PHYSICAL DATA
Machine harvested
(a) Seed Planted at 4.8 t/ha (can range from 3.5-6.1 t/ha for 35/55 mm seed
depending on variety and top riddle size on which daughter crop will be sold). Half bought in. Cost varies with variety, seed size and classification grade.
(b) Fertiliser 80 : 170 : 110 kg/ha N : P2O5 : K2O (64 : 136 : 88 units/acre). See
page 4 for more information on nutrient planning.
Reduce N by 25% for indeterminate varieties, e.g. Cara and Hermes.
(c) Sprays Seed treatment Multipurpose seed treatment applied at grade plus
reduced rate fungicide applied for rhizoctonia.
Nematicide Assumption of no treatment applied. Application may be required in field and varieties at risk of spraing.
Herbicides Contact plus reduced rate residual herbicides applied pre-emergence.
Blight control 8-9 spray program with protectant, systemic, curative and tuber blight protection products for moderate-high blight pressure.
Aphid control Up to 8 applications.
Slug control 2 applications.
Desiccation Pulverising followed by chemical desiccation. For pulverising costs, see page 355.
(d) Other crop expenses
Levy costs, SGRPID field inspection fees, roguing and labels are included. Positive ventilation and cold storage. Other costs may include bags (£7.50-11.20/t of crop), chemical treatment at storage time and royalties (which will depend on variety).
(e) Casual labour These costs are not included. Costs calculated using the data
below could be used. Labour charged at £12/hr at the rates below:
Operation hr/ha
Lifting (by harvester) 20
Grading (half the grading done by regular labour) 40

POTATOES 67
Potatoes - Seed (Low and High Number Varieties)
GROSS MARGIN DATA
Yield: t/ha (t/acre): seed 25 (10.1) 35 (14.2)
Yield: t/ha (t/acre): ware 6 (2.4) 6 (2.4)
Yield: t/ha (t/acre): s/feed 2 (0.8) 2 (0.8)
33 (13.4) 43 (17.4)
OUTPUT
Seed @ £220/t 5,500 -
Ware @ £45/t 270 -
Stockfeed @ £20/t 40 -
Seed @ £190/t - 6,650
Ware @ £45/t - 270
Stockfeed @ £20/t - 40
5,810 (2,351) 6,960 (2,817)
VARIABLE COSTS
Seed @ £360/t 1,728 1,440
Fertiliser 220 220
Sprays 527 514
Other expenses 2,645 3,405
5,120 (2,072) 5,579 (2,258)
GROSS MARGIN 690 (279) 1,381 (559)
SEED PRICE SENSITIVITY
£150 /t -1,060 -(429) -19 -(8)
£250 /t 1,440 (583) 3,481 (1,409)
£300 /t 2,690 (1,089) 5,231 (2,117)
Low
£/ha (acre)
High

POTATOES 68
Potatoes - Dual Purpose (Seed and Ware)
PHYSICAL DATA
Machine harvested
(a) Seed Planted at 3.8 t/ha (can range from 3.5-5 t/ha for 35x55 mm seed
depending on variety. Half bought in. Cost varies with variety, seed size and classification grade.
(b) Fertiliser
150 : 150 : 200 kg/ha N : P2O5 : K2O (120 : 120 : 160 units/acre). See page 4 for more information on nutrient planning.
(c) Sprays Seed treatment Multipurpose seed treatment applied at grade plus
reduced rate fungicide applied for rhizoctonia. Fungicide incorporated into soil on 50% area for powdery scab control.
Nematicide Assumption of no treatment applied. Application may be required in field and varieties at risk of spraing.
Herbicides Contact plus reduced rate residual herbicides applied pre-emergence.
Blight control 8-9 spray program with protectant, systemic, curative and tuber blight protection products for moderate blight pressure.
Aphid control Up to 8 applications.
Slug control 2-3 applications.
Desiccation
Pulverising followed by chemical desiccation. For pulverising costs, see page 355.
(d) Other crop expenses Levy costs, SGRPID field inspection fees; roguing and labels and
positive ventilation and cold storage are included. Other costs may include bags (£7.50-£11.20/t of crop), chemical treatment at storage time and royalties (which will depend on variety).
(e) Irrigation Irrigation may be applied in some circumstances for yield and quality.
These costs are not included. Annual capital charge could be £350-500/ha plus £1.60-1.90/ha.mm with a contract charge of approximately £5.40/ha.mm.
(f) Casual labour These costs are not included. Labour charged at £12/hr as per
labour rates on page 64 for low yields.

POTATOES 69
Potatoes - Dual Purpose (Seed and Ware)
GROSS MARGIN DATA
Yield: t/ha (t/acre): seed 22 (8.9)
Yield: t/ha (t/acre): ware 19 (7.7)
Yield: t/ha (t/acre): s/feed 4 (1.6)
45 (18.2)
OUTPUT
Seed @ £150/t 3,300
Ware @ £90/t 1,710
Stockfeed @ £20/t 80
5,090 (2,060)
VARIABLE COSTS
Seed @ £210/t 798
Fertiliser 293
Sprays 592
Other expenses 3,512
5,195 (2,102)
GROSS MARGIN -105 -(42)
WARE PRICE SENSITIVITY
£50 /t -865 -(350)
£110 /t 275 (111)
£170 /t 1,415 (573)
£230 /t 2,555 (1,034)
£/ha (acre)


Grassland

GRASSLAND 72
Introduction
This section covers basic technical and financial cost data related to grassland production.
The variable cost data tables for grass, silage and hay provide the basis of the forage costs for the livestock enterprise gross margin figures.
Potential dry matter yields (kgDM/ha) at different N levels/ha
kg N/ha Yield (kgDM/ha)
Cow grazing days /ha
Stocking density (LU/ha)
0 3,000 240 0.46 75 4,200 335 0.64 125 5,500 439 0.84 175 7,000 559 1.07 250 8,000 639 1.23 310 10,000 799 1.53
The values above assume a Perennial Ryegrass (PRG) dominant sward with low (<20%) clover content under average grass growth conditions. Note: PRG + 30% white clover swards produce ~7,500-8,000 kgDM/ha at zero N.
Grazing system and utilisation rate The following table outlines the potential increase in utilised grass DM that is achieved by adopting rotational (3-8 fields) or paddock (more than 8 paddocks) grazing systems. In addition to the extra yield produced more grass is utilised by either grazing (higher stocking rates) or by identifying surplus grass for conservation. A rotational grazing system will improve the quality of the pasture.
System Annual Yield
(t DM/ha)
Utilisation (%)
Usable yield
(t DM/ha)
Percentage increase on
set stocking
Set stocking 8.5 50 4.3 - Rotational 10.2 65 6.6 56% Paddock 10.2 80 8.2 92%
Livestock units The livestock unit (LU) system is a reflection of the energy requirements of different classes of stock. The following table is a guide to LUs along with annual ME requirements and possible kgDM required (depending on forage quality).
This information along with data on grass production and utilisation can be used to calculate potential stocking rates for land. Adjustments must be made for any rough grazing, length of time stock are on the farm and the contribution of purchased feed, e.g. 1 tonne of barley @ 86% DM with 12.5ME provides 10,750 MJ ME.

GRASSLAND 73
Class of stock LU MJ ME /year
kgDM @
10.5ME
750 kg dairy cow producing 9,000 litres milk 1.60 76,500 7,286* 625 kg dairy cow producing 4,500 litres milk 1.00 48,000 4,571 650 kg beef cow plus calf to weaning 0.75 36,000 3,429 Beef heifer 300 kg to calving at 2 0.60 28,800 2,743 Bulls 0.65 31,200 2,971 Cattle 0-12 months 0.34 16,320 1,554 Cattle 12-24 months 0.65 31,200 2,971 Cattle over 24 months 0.80 38,400 3,657 Breeding ewe 60 kg 0.09 4,320 411 Breeding ewe 70 kg 0.10 4,800 457 Breeding ewe 80 kg 0.11 5,280 503 Rams 0.08 3,840 366 Lambs birth to weaning/sale 0.04 1,920 183 Ewe lambs - weaning to 2 yrs 0.06 2,880 274
* will require significant concentrate supplementation
More detail on LUs can be found on page 112.
Stocking rate Stocking rate is expressed as grazing livestock units, GLU per effective (adjusted) hectare where:
2.5 GLU/ha (1 per acre) is very intensive (very high N input) 2.0 GLU/ha is intensive (high N input) 1.5 GLU/ha is semi intensive (moderate N input or high clover %) 1.0 GLU/ha is extensive (low N input/clover based) 0.5 GLU/ha is very extensive (very low/no N inputs)
Choice of seed mixtures The seed mixture should be chosen using recommended varieties tested in Scotland by SRUC, England & Wales by NIAB-TAG or Northern Ireland by DAERA. Grass swards will contain mainly PRG, white clover and Timothy. Varieties chosen should be compatible and chosen according to the farm system, the use of the ley (silage, hay, dual purpose), special requirements such as disease resistance and winter hardiness.
Swards that are worn out with a low percentage of sown species remaining will have a lower yield potential and will have a much lower response to nitrogen. If sward performance is not sufficient to maintain stocking rates, or requires additional purchased feed, then renewing the sward is recommended.

GRASSLAND 74
Sward Improvement
Options for sward improvement range from full ploughing (reseeding/replacement) to oversowing (renovation). The approximate costs of different improvement methods are outlined in the following table. These include variable costs as well as the cultivation costs.
Assumptions:
A long-term seed mixture at full rate, 37kg/ha, for ploughing and direct drilling, and half rate, 18kg/ha, for oversowing.
Fertiliser inputs are based on moderate P and K soil status. No nitrogen and half rate of P and K is assumed for the over sow at seedling emergence. pH is assumed to be ideal thus no cost for lime is included.
Chemical costs for the destruction of the old sward prior to cultivation have been assumed for ploughing and direct drilling options. Other pesticides may be required for specific circumstances.
Cultivation methods are assumed to be carried out by contractors. Contractor costs can be found on pages 353-355.
Machinery fuel use (l/ha) and fuel cost on page 350.
Reliability
Speed of improvement
Loss of grass production
Variable costs
Seed 156 156 76
Fertiliser 90 90 -
Sprays 8 8 -
254 (103) 254 (103) 76 (31)
Cultivation costs
Spray 13 13 -
Plough 62 - -
Power harrow/subsoil 51 - -
Harrow - - 29
Roll and destone 19 - -
Sow 31 53 31
Roll 24 24 24
Fertilise 10 10 -
Fuel cost 47 15 10
257 (104) 116 (47) 95 (38)
Total costs 511 (207) 370 (150) 171 (69)
No. of years per cultivation 7 7 7
Total cost per annum 73 (30) 53 (21) 24 (10)
High
Mod/High
Rapid
High
£/ha (acre)
Moderate
Low
Over sowDirect drillPlough
High
Moderate Moderate

GRASSLAND 75
Preserved Grass Production Costs
The following table shows the cost of producing preserved grass as silage or hay.
Assumptions:
Yield and N fertiliser are outlined on pages 78 and 80. Establishment costs based on figures on page 74. Annual variable costs are based on variable cost data (less annual
share of seed) shown on pages 79 and 81. Annual production costs are assumed to be carried out by contractors.
Contractor costs can be found on pages 353-355. Machinery fuel use (l/ha) and fuel cost on page 350. Other crop expenses for ensiled silage are based on using plastic
sheets. For baled silage, this includes net wrap and plastic wrap as described on pages 79. For hay, the cost for net wrap is included in the annual variable costs.
Land rent and maintenance or a finance charge associated with a silage clamp have not been included in the calculations.
Yield potential will vary and no account has been taken for wastage in the preserved state and at feeding.
Silage Silage Hay
1 cut 1 cut 1 cut
ensiled bales bales
N fertiliser use (kgN/ha) 125 125 125
Yield (t FW/ha) 24 24 6
Yield (t DM/ha) 7 7 5
Bale weight (round 4' x 4' - kg) - 650 250
Establishment costs (annual share) 73 73 73
Annual variable costs 153 153 189
Annual production costs
Spray 13 13 13
Fertilise 10 10 10
Mow 30 30 30
Rake 16 - 41
Lift, cart and clamp crop 110 - -
Bale, wrap and stack - 179 48
Other crop expenses 3 139 -
Fuel 36 16 21
218 388 164
Total cost per annum (£/ha) 444 614 426
Cost per t FW (£/t) 19 26 71
Cost per t DM (£/t) 62 85 83
Cost per bale (£/bale) - 17 18
£/ha

GRASSLAND 76
Grassland - Grazing
PHYSICAL DATA
(a) System Assume a 7 year sward life.
Establishment costs described on page 74.
(b) Yield See page 72 for the dry matter yield and stocking rate (LU/ha)
assumptions for varying Nitrogen application rates.
(c) Seed A nominal annual charge (assume a 7 year sward life, for longer leys
reduce the annual charge accordingly):
Mixture £/ha
One year 105-130 Two-three years 115-170 Four-six years 125-175 Permanent 130-185
(d) Fertiliser
See page 4 for more info on nutrient planning.
kg/ha (units/acre)/annum
N 75 (60) 125 (100) 175 (140) 250 (200) 310 (250) P2O5 15 (12) 15 (12) 20 (16) 30 (24) 30 (24) K2O 15 (12) 15 (12) 20 (16) 30 (24) 30 (24)
(e) Sprays A nominal annual charge (assume a 7 year sward life, for longer leys
reduce the annual charge accordingly) to cover a herbicide during establishment, followed by a herbicide to control a broader range of perennial weeds, such as docks, thistles and nettles.

GRASSLAND 77
Grassland - Grazing
VARIABLE COST DATA
Fertiliser kg N/yr 75 (60) 125 (100) 175 (140) 250 (200) 310 (248)
VARIABLE COSTS *
Seeds 22 22 22 22 22
Fertiliser 67 100 139 201 241
Sprays 13 13 13 13 13
Other expenses - - - - -
102 (41) 135 (55) 174 (70) 236 (96) 276 (112)
FERTILISER PRICE SENSITIVITY (+/-)
10 p/kg N 8 (3) 13 (5) 18 (7) 25 (10) 31 (13)
10 p/kg P2O5 2 (1) 2 (1) 2 (1) 3 (1) 3 (1)
10 p/kg K2O 2 (1) 2 (1) 2 (1) 3 (1) 3 (1)
£/ha (acre)
* The cost per tonne of dry matter grown varies and should also include a share of reseeding costs (contractor/machinery upkeep/fuel). Cost will also depend on the actual response to nitrogen (see page 72), and grazing utilisation.

GRASSLAND 78
Grassland - Silage and Aftermath Grazing
PHYSICAL DATA
(a) System Assume a 7 year sward life.
Establishment and harvest costs are described on page 74 and 75.
(b) Yield Settled silage (kg fresh weight) at 25%DM.
Fertiliser N kg/ha
(units/acre)/annum 70 (56) 130 (104) 250 (200) 310 (248)
Silage t/ha (t/acre)
1st cut 24 (9.7) 22 (8.9) 28 (11.3) 20 (8.1)
2nd cut - - 10 (4.0) 16 (6.5) 16 (6.5)
3rd cut - - - - - - 16 (6.5)
Total 24 (9.7) 32 (13.0) 44 (17.8) 52 (21.0)
j
Apportionment - the following yield ratios are suggested:
Silage 50 80 80 95
Aftermath 50 20 20 5
(c) Seed A nominal annual charge (assume a 7 year sward life, for longer leys
reduce the annual charge accordingly):
Mixture £/ha
One year 105-130 Two-three years 115-170 Four-six years 125-175 Permanent 130-185
(d) Fertiliser Neither P2O5 nor K2O is assumed for aftermaths, although their use
would be recommended subject to nutrient management planning. See page 4 for more info on nutrient planning.
Silage cuts
For silageN 70 (56) 100 (80) 220 (176) 310 (248)
P2O5 41 (33) 54 (43) 75 (60) 88 (70)
K2O 144 (115) 192 (154) 264 (211) 312 (250)
For aftermath
N 0 (0) 30 (24) 30 (24) - -
TwoOne
kg/ha (units/acre)/annum
ThreeTwo

GRASSLAND 79
Grassland - Silage and Aftermath Grazing
VARIABLE COST DATA
Fertiliser kg N/ha
(units/acre)/annum 70 (56) 130 (104) 250 (200) 310 (248)
Silage cuts One Two Two Three
VARIABLE COSTS
Seeds 22 22 22 22
Fertiliser 140 211 338 408
Sprays 13 13 13 13
Other expenses - - - -
175 (71) 246 (100) 373 (151) 443 (179)
FERTILISER PRICE SENSITIVITY (+/-)
10 p/kg N 7 (3) 13 (5) 25 (10) 31 (13)
10 p/kg P2O5 4 (2) 5 (2) 7 (3) 9 (4)
10 p/kg K2O 14 (6) 19 (8) 26 (11) 32 (13)
£/ha (acre)
(e) Sprays A nominal annual charge (assume a 7 year sward life, for longer leys
reduce the annual charge accordingly) to cover a herbicide during establishment, followed by a herbicide to control a broader range of perennial weeds, such as docks, thistles and nettles.
(f) Other crop expenses
Heavy duty silage covers cost approximately £1.73/m2 (7-10 year
lifespan). Associated gravel bags cost approximately £1.40/bag. Silage sheets cost approximately £0.18/m
2 for top sheets and
£0.37/m2 for wall liners. Clamp film is approximately £0.11/m
2. If
baling, include costs for net wrap at 50-77p/bale for large round bales and bale wrap at £1.70-3.00/bale depending on number of layers of net and wrap and size of bales.
The use of an inoculant will typically add £1.15-1.60/t depending on the product chosen and its rate of application.
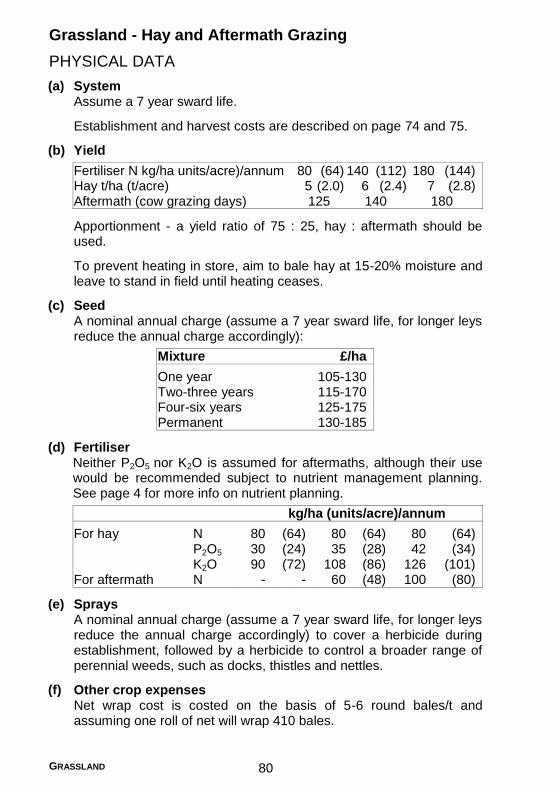
GRASSLAND 80
Grassland - Hay and Aftermath Grazing
PHYSICAL DATA
(a) System Assume a 7 year sward life.
Establishment and harvest costs are described on page 74 and 75.
(b) Yield
Fertiliser N kg/ha units/acre)/annum 80 (64) 140 (112) 180 (144) Hay t/ha (t/acre) 5 (2.0) 6 (2.4) 7 (2.8) Aftermath (cow grazing days) 125 140 180
Apportionment - a yield ratio of 75 : 25, hay : aftermath should be used.
To prevent heating in store, aim to bale hay at 15-20% moisture and leave to stand in field until heating ceases.
(c) Seed A nominal annual charge (assume a 7 year sward life, for longer leys
reduce the annual charge accordingly):
Mixture £/ha
One year 105-130 Two-three years 115-170 Four-six years 125-175 Permanent 130-185
(d) Fertiliser Neither P2O5 nor K2O is assumed for aftermaths, although their use
would be recommended subject to nutrient management planning. See page 4 for more info on nutrient planning.
kg/ha (units/acre)/annum
For hay N 80 (64) 80 (64) 80 (64) P2O5 30 (24) 35 (28) 42 (34) K2O 90 (72) 108 (86) 126 (101) For aftermath N - - 60 (48) 100 (80)
(e) Sprays A nominal annual charge (assume a 7 year sward life, for longer leys
reduce the annual charge accordingly) to cover a herbicide during establishment, followed by a herbicide to control a broader range of perennial weeds, such as docks, thistles and nettles.
(f) Other crop expenses Net wrap cost is costed on the basis of 5-6 round bales/t and
assuming one roll of net will wrap 410 bales.

GRASSLAND 81
Grassland - Hay and Aftermath Grazing
VARIABLE COST DATA
Fertiliser kg N/ha
(units/acre)/annum 80 (64) 140 (112) 180 (144)
VARIABLE COSTS
Seeds 22 22 22
Fertiliser 115 166 206
Sprays 13 13 13
Other expenses 8 10 11
158 (64) 211 (85) 253 (102)
FERTILISER PRICE SENSITIVITY (+/-)
10 p/kg N 8 (3) 14 (6) 18 (7)
10 p/kg P2O5 3 (1) 4 (2) 4 (2)
10 p/kg K2O 9 (4) 11 (4) 12 (5)
£/ha (acre)


Forage Crops

FORAGE CROPS 84
Introduction
Home-grown forage crops offer high yielding alternatives to grass; but establishment cost and time out of pasture production must be considered. Yield, quality and utilisation are key to cost-effective forage crop production. Increasing the amount of grazed forage in the diet reduces reliance on expensive purchased feed.
Forage crops can be useful in both arable and grazing rotations; they make a good break crop between grass to grass re-seeds and provide time to correct deficiencies in pH, P and K, soil compaction and weed control. They can also be used as a pioneer crop in uncultivated areas.
Crops can be either full season crops or catch crops. To ensure high DM yields and to justify the cost of production and length of time taken out of production a full season crop should be grown on good land with full cultivations and correct agronomy. A catch crop can be grown after silage or wholecrop cereal to give a bonus crop of forage and allow an early re-seed the following spring.
Wholecrop silage Wholecrop silage can provide a high-starch, high-fibre feed, replacing some or all of the grass silage in the ration. It is high yielding; therefore production costs per kilogram of dry matter (DM) are competitive with other forages, although the crude protein can be lower, unless using a legume or a cereal-legume mix. The earlier harvest reduces risk of bad weather at harvest time and provides time for winter cropping. Compared with grass silage, managing consistent quality is easier.
Brassicas and root crops Brassica crops such as kale, forage rape, rape/kale hybrids, grazing turnips and swedes and stubble turnips provide nutritious, cost effective feeds. Out-wintering on brassicas can extend the grazing season or fill a forage gap in dry summers and also allows more animals to be kept, with minimal extra capital investment in buildings.
Leafy brassicas are generally high in protein while roots/bulbs are higher in energy. Fodder beet is the highest energy yielding crop, allowing high stocking densities – some farmers will manage 100 ewes per hectare for around two and a half months (Jan – Mar).
Forage brassica and root crops should only be fed to livestock up to 70% of the total DM intake and a grass runback and fresh water should always be provided. Another source of forage should be supplied, for example straw for dry cows, silage or hay for more productive stock. For lamb finishing, concentrates can also provide additional nutrition. Correct mineral/trace element supplementation is important when using forage crops.
The use of an electric fence is advisable to encourage stock to eat the whole crop evenly for high utilisation. It is important to assess the yield of

FORAGE CROPS 85
the crop (by cutting and weighing several 1m2 sections) and then
accurately working out the area the group of stock require each day. To assess the yield make a frame that is 1m
2 and cut several representative
samples of the crop. Place the sample in a bag and weigh using a spring balance. Multiply the average of your samples by 10,000 to give a fresh weight per hectare then again by the DM% (from the following tables) to give DM yield/ha. The crop can then be rationed to the stock based on their nutritional requirements, taking into account the likely utilisation % and other forages that are also being fed to the stock.
Brassica and Root Crop Technical Data
The following tables provide technical data that can be used in conjunction with the variable cost data for all the crops illustrated later in the section.
Variable costs include seed, chemical and fertiliser as per variable cost data for each crop. Costs of establishment are not included and will vary enormously depending on previous cropping, whether it is a full season or catch crop and past experience of the various methods of establishment. Machinery costs on pages 353-355 can be referred to for typical ploughing, cultivation and drilling costs.
Kale
Forage
rape
Kale/rape
hybrid Chicory
Sown May- Jul Apr- Aug Apr-Aug May-Jul
Utilised July-Mar Aug- Dec Jun-Jan Mar-Nov
Variable cost (£/ha) 290 128-162 121-290 115
Grazings 1 1 1-2 Several
DM (%) 15-17 10-14 12-15 12
ME (MJ/kgDM) 10.5 10.5 10.5 12
CP (%) 14-17 19-20 18-19 18
% utilisation 80 80 80 70
Av DM yield (t/ha) 7.5 4.5 6 10
Cow graze days/ha 1
1,260 756 1,008 1,680
ha/50 cows/100days 1
4.0 6.6 5.0 3.0
Lamb graze days/ha 2
6,000 3,600 4,800 7,000
ha/250 lambs/100days 2
4.2 6.9 5.2 3.6

FORAGE CROPS 86
Swede Turnips
Stubble
turnips
Fodder
beet
Sown Mar-May Apr- Jun May-Aug Mar-Jun
Utilised Oct-Apr Sep-Apr Aug-Dec Oct-Jun
Variable cost (£/ha) 345 350 172 517
Grazings 1 or lifted 1 1 1
DM (%) 11-15 12-15 12-15 13-16
ME (MJ/kgDM) 12.5 10.5 10.5 13
CP (%) 10-11 17-18 17-18 6-8
% utilisation 80 80 80 80
Av DM yield (t/ha) 8 5 4 15
Cow graze days/ha 1
1,600 840 672 -
ha/50 cows/100days 1
2.6 4.6 7.9 -
Lamb graze days/ha 2
6,400 4,000 3,200 12,000
ha/250 lambs/100days 2
3.9 6.3 7.8 2.1
2 Lambs allowed 1kg DM/day of crop.
1 Cows getting 50MJ/day from crop and the rest from other forage.
Dry cow wintering example - A herd of dry suckler cows require 75MJ/hd/day ME. On a diet of kale and straw, 50MJ is expected to come from kale. At 7.5tDM/ha, 10.5ME and 80% utilisation each m
2 of kale will
contain 6.3 MJ. Therefore the herd of 50 cows require 397m2 of kale per
day.
Lamb grazing example - 250 store lambs are given an allowance of 1kgDM of forage rape per head/day. With a yield of 4.5tDM/ha and utilisation of 80% then the group of lambs will require 694m
2/day or
approximately 0.49ha (1.2ac) per week.

FORAGE CROPS 87
Preserved Forage Crop Technical Data and Production Costs
The following table shows the cost of preserving forage crops including arable silage, forage maize and wholecrop wheat.
Assumptions:
All crops ensiled. Yield potential will vary depending on site, timing, weather conditions
and wastage at feeding. For breakdown, see variable cost data for each individual crop. Establishment and production costs based on contractor charges on
pages 353-355, and fuel use (l/ha) and fuel cost on page 350. Total cost per annum does not include land rent and maintenance or
finance charge associated with a silage clamp. The true cost will be higher due to wastage.
Arable Forage
silage maize ferm'd crack'd
pea/ under winter winter
cereal mix plastic wheat wheat
ensiled ensiled ensiled ensiled
Yield (t FW/ha) 30 40 25 15
Yield (t DM/ha) 8 15 10 12
ME (MJ/kgDM) 10 10.5 10.5 10.5
CP (%) 16 9 9.5 9.5
Variable costs 256 463 379 563
Establishment costs
Plough 62 62 62 62
Sow 54 124 54 54
Roll and de-stone 19 19 19 19
Fuel 43 43 43 43
178 248 178 178
Production costs
Spray 13 13 40 40
Fertilise/Slurry/FYM 10 13 30 30
Lift, cart and clamp crop 156 168 156 156
Other crop expenses 3 3 3 3
Fuel 17 37 20 20
199 234 249 249
Total cost per annum (£/ha) 633 944 807 990
Cost per t FW (£/t) 21 24 32 66
Cost per t DM (£/t) 79 63 81 83
Wholecrop
£/ha

FORAGE CROPS 88
Forage Peas and Pea/Cereal Mixtures (Arable Silage)
PHYSICAL DATA
(a) System Forage peas (sown Mar-Jun) are grown as a catch crop to be grazed
in situ, zero-grazed or ensiled/baled (harvested at flowering when pods have formed but not yet filled and wilted for 1-2 days). Peas can be grown alone, or in mixtures with barley or oats and undersown with grass for arable silage. Peas are highly palatable to livestock so must be introduced gradually and monitored to prevent bloat. Total production costs including establishment and harvest are described on page 87.
(b) Yield (in 12-16 weeks)
Fresh Dry matter t/ha (t/acre)
Forage peas 20-30 (8-12) 6-8 (2.4-3.2) Arable silage 20-35 (8-14) 6-10 (2.4-4.0)
(c) Seed rates (kg/ha)
Forage peas: Arable silage undersown with grass:
direct drill 125 peas 40-60 (broadcast 150) cereal 60-80 total 100-140
Seed mixtures cost (p/kg): Cereal 38.3 Peas 57
(d) Fertiliser – kg/ha (units/acre)
Undersown arable silage Forage peas at sowing after harvest
N 0 (0) 40-60 (32-48) 50 (40) P2O5 50 (40) 90 (72) 25 (20) K2O 50 (40) 90 (72) 25 (20)
Apportionment of the cost of fertiliser in the seed bed and the residual value of nitrogen to the subsequent crop may be justified. See page 4 for more information on nutrient planning.
(e) Sprays Pre emergence herbicide for forage peas can be used at a cost of
£55.80/ha. There are no broad spectrum post emergence herbicides available for this crop. Varietal tolerance to a proposed spray should be ascertained.
A silage additive (£1.00-1.60 per tonne silage – depending on the product chosen and its rate of application) is recommended for silages with a high pea content.
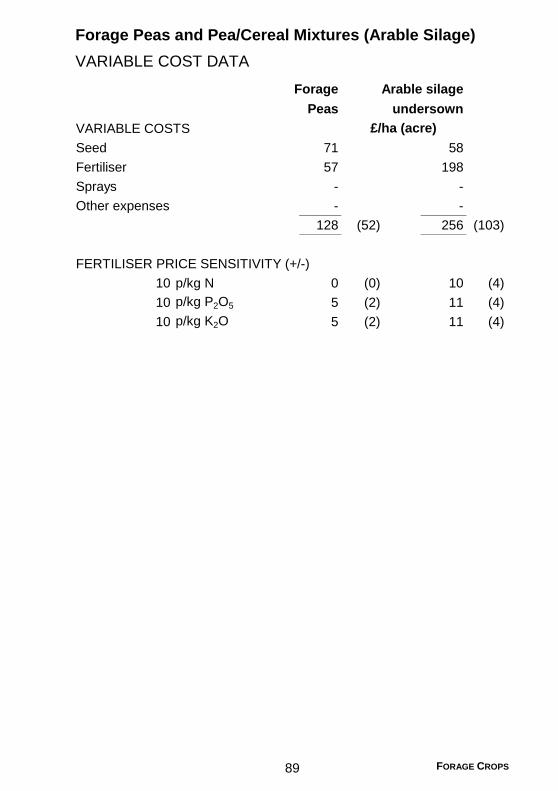
FORAGE CROPS 89
Forage Peas and Pea/Cereal Mixtures (Arable Silage)
VARIABLE COST DATA
Forage Arable silage
Peas undersown
VARIABLE COSTS
Seed 71 58
Fertiliser 57 198
Sprays - -
Other expenses - -
128 (52) 256 (103)
FERTILISER PRICE SENSITIVITY (+/-)
10 p/kg N 0 (0) 10 (4)
10 p/kg P2O5 5 (2) 11 (4)
10 p/kg K2O 5 (2) 11 (4)
£/ha (acre)

FORAGE CROPS 90
Forage Maize
PHYSICAL DATA
(a) System Forage maize is ensiled and the clamp should be monitored for
overheating. Introduce gradually in to the animal’s diet, ensuring there is an adequate source of long fibre in the ration and protein supplementation is essential. Contractor costs for establishment and harvest are described on page 87.
(b) Yield
Without plastic With plastic
Fresh (t/ha) 40 50 DM (t DM/ha) 12 15
(c) Seed Target established plant density 100,000 plants/ha; sow at 15%
above target plant density. Do not sow too early (soil temperature 8-10ºC, 10 cm depth for 7 days).
Seed cost based on £67.50/pack (45,000 seeds).
(d) Fertiliser
kg/ha (units/acre)
N 120 (96) P2O5 60 (48) K2O 165 (132)
Maize sown under plastic will have no placement fertiliser and will rely on nutrients from slurry only. See page 4 for more information on nutrient planning.
(e) Sprays Pre-emergence herbicide, then later before 8 leaf stage (without
plastic).
In some years, slugs can be a problem. Pellets will cost in the region of £7.00/ha per application.

FORAGE CROPS 91
Forage Maize
VARIABLE COST DATA
Without With
plastic plastic
VARIABLE COSTS
Seed 173 173
Fertiliser 196 -
Sprays etc. 60 54
Other expenses - 236
429 (173) 463 (187)
FERTILISER PRICE SENSITIVITY (+/-)
10 p/kg N 12 (5) -
10 p/kg P2O5 6 (2) -
10 p/kg K2O 16 (6) -
£/ha (acre)

FORAGE CROPS 92
Whole Crop Cereal - Winter Wheat
PHYSICAL DATA
(a) System Whole cropping of wheat provides an alternative feed to silage
providing a good source of starch and fibre. The crop can be harvested at various growth stages creating different products. Additives can be used for improving preservation and feed quality. See page 18 for more detail.
(b) Yield
Fermented Cracked whole crop whole crop
Fresh (t/ha) 29 14 DM (t DM/ha 10 12
(c) Seed Certified seed second generation (C2) sown at the rate of 220 kg/ha.
(d) Fertiliser
See page 4 for more information on nutrient planning.
kg/ha (units/acre)
N 200 (160) P2O5 67 (54) K2O 83 (66)
(e) Sprays Herbicides Autumn residual herbicide to control annual meadow
grass and broad leaved weeds.
Fungicides Two applications at GS31-32 and GS39 for eyespot, leaf diseases (e.g. septoria).
For sprays against other hazards see page 18.
(f) Other crop expenses Fermented whole crop wheat can be made successfully without an
additive, but the use of additives can improve aerobic stability. Additive costs range from £1.00-1.60 per tonne - depending on the product chosen and its rate of application. Refer to page 79 for other crop expenses such as plastic covers.

FORAGE CROPS 93
Whole Crop Cereal - Winter Wheat
VARIABLE COST DATA
Fermented Cracked
whole crop whole crop
VARIABLE COSTS
Seed @ £400/t 88 88
Fertiliser 217 217
Sprays etc. 74 74
Other expenses - 184
379 (153) 563 (228)
FERTILISER PRICE SENSITIVITY (+/-)
10 p/kg N 20 (8) 20 (8)
10 p/kg P2O5 7 (3) 7 (3)
10 p/kg K2O 8 (3) 8 (3)
£/ha (acre)

FORAGE CROPS 94
Rye for Early Grazing
PHYSICAL DATA
(a) System A catch crop of winter rye sown after early harvested cereal
(Sep/Oct) and followed by light grazing at the end of the calendar year and subsequent cropping.
(b) Yield Can be variable but, given early sowing, dry matter yields of up to
0.75t DM/ha in autumn and 2.25t DM/ha in spring can be achieved. Total dry matter yields up to 5.5t DM/ha can be achieved.
Forage rye can provide early spring grazing for 15-20 cows or 50-60 sheep per hectare over a three-week period.
(c) Seed Rate – 185 kg/ha.
Early sowing is important but it is often difficult to obtain good viable seed in August or early September.
(d) Fertiliser
See page 4 for more information on nutrient planning.
kg/ha (units/acre) Seed bed Early spring Total
N - - 80 (64) 80 (64) P2O5 30 (24) - - 30 (24) K2O 30 (24) - - 30 (24)

FORAGE CROPS 95
Rye for Early Grazing
VARIABLE COST DATA
VARIABLE COSTS
Seed 97
Fertiliser 87
Sprays etc. -
Other expenses -
184 (75)
FERTILISER PRICE SENSITIVITY (+/-)
10 p/kg N 8 (3)
10 p/kg P2O5 3 (1)
10 p/kg K2O 3 (1)
£/ha (acre)

FORAGE CROPS 96
Kale
PHYSICAL DATA
(a) System System involves strip grazing behind an electric fence (to reduce
crop wastage), allowing at least 3m of space per cow and a runback including hay/straw and water.
Kale can also be fed as part of a catch crop mixture which includes kale, stubble turnips and forage rape. Each brassica complements each other by means of nutritional benefits (see pages 85-86). Other benefits include winter hardiness and a prolonged utilisation period of the crop, with some varieties being early maturing and others being late.
(b) Yield
Fresh DM t/ha (t/acre)
Autumn kale 70 (28.3) 8 (3.2) Winter kale 50 (20.2) 7 (2.8)
Strip-grazed, a suitable daily allowance per cow (3 hr grazing) would be 47kg FW, including 20% wastage.
(c) Seed Rate (direct drilled ungraded seed) – 4.0 kg/ha at £13/kg.
Seed treated with neonicotinoid which is still approved for animal feed, game and seed.
(d) Fertiliser
kg/ha (units/acre)
N 160 (128) P2O5 50 (40) K2O 170 (136)
Fertiliser rates will vary greatly with circumstances. Some farmers may also choose to top dress some of the N. See page 4 for more information on nutrient planning.
(e) Sprays Herbicides
Stale seed bed and a pre emergence herbicide.
Slugs Slug pellets may be broadcast or drilled with the seed at a cost of £7.00/ha.
Flea Beetle Insecticide may be required at a cost of £4.25/ha.

FORAGE CROPS 97
Kale
VARIABLE COST DATA
VARIABLE COSTS £/ha (acre)
Seed 52
Fertiliser 218
Sprays etc. 20
Other expenses -
290 (117)
FERTILISER PRICE SENSITIVITY (+/-)
10 p/kg N 16 (6)
10 p/kg P2O5 5 (2)
10 p/kg K2O 17 (7)

FORAGE CROPS 98
Forage Rape
PHYSICAL DATA
(a) System Grazed system which must be introduced gradually with an area of
runback with alternative forage e.g. grass/hay/straw as well as free access minerals and water.
There are several hybrids (rape/kale) on the market which are quick to establish and can be utilised within 10-12 weeks after sowing. They offer the benefit of early grazing in summer/autumn if other forage supplies are limited.
Sown with Italian ryegrass provides additional feed, grazing after the rape has been utilised and ensilaging opportunity.
(b) Yield Total dry matter yield of approximately 4.5t DM/ha. About 50
lambs/ha (20 lambs/acre) (starting weight approx. 27 kg) will finish off rape, with a suitable ‘run back’ on to grass or stubble.
(c) Seed
kg/ha (lb/acre)
Drilled 6 (5.3) Direct drilled/broadcast 8 (7.1)
These rates will need to be varied with soil condition.
Seed cost – £3.50/kg.
Inclusion of 10 kg Italian ryegrass would add approx. £22.50/ha to the cost.
(d) Fertiliser
kg/ha (units/acre) Drilled/broadcast Direct drilled
N 100 (80) 140 (112) P2O5 25 (20) 25 (20) K2O 35 (28) 35 (28)
Catch crops after early potatoes would require less fertilisers. See page 4 for more information on nutrient planning.
(e) Sprays Burn off land pre drilling for direct drilled crops only.
Insecticide for flea beetle may be required at a cost of £4.25/ha.
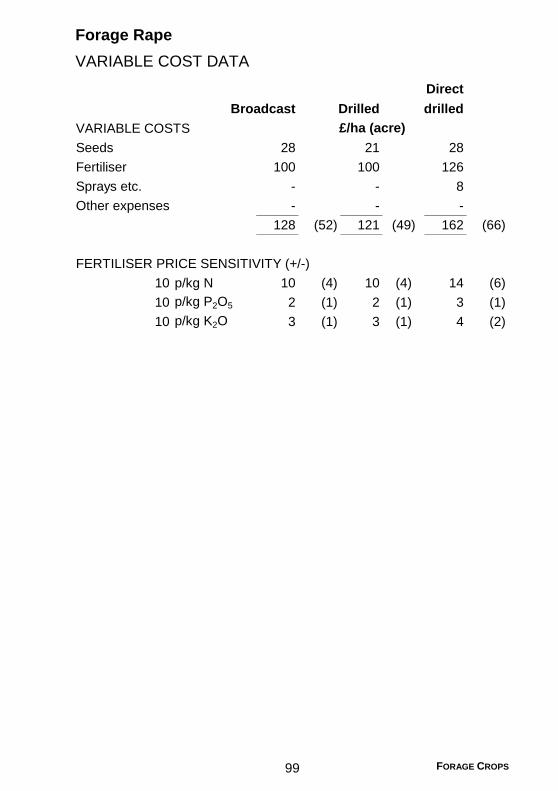
FORAGE CROPS 99
Forage Rape
VARIABLE COST DATA
Direct
Broadcast Drilled drilled
VARIABLE COSTS
Seeds 28 21 28
Fertiliser 100 100 126
Sprays etc. - - 8
Other expenses - - -
128 (52) 121 (49) 162 (66)
FERTILISER PRICE SENSITIVITY (+/-)
10 p/kg N 10 (4) 10 (4) 14 (6)
10 p/kg P2O5 2 (1) 2 (1) 3 (1)
10 p/kg K2O 3 (1) 3 (1) 4 (2)
£/ha (acre)

FORAGE CROPS 100
Dutch or Stubble Turnips
PHYSICAL DATA
(a) System Grazed system which must be introduced gradually with an area of
run-back with alternative forage e.g. grass/hay/straw as well as free access to minerals and water. Strip grazing is preferred to reduce wastage.
There are hybrids on the market which are sown in the spring and establish quickly, allowing utilisation in the summer. It is a leafy plant which has the potential to regrow but also to bolt.
(b) Yield Can be highly variable particularly affected by date of sowing; but
drilled crops sown in early July can finish 50-70 lambs/ha (20-28 lambs/acre) (starting weight approx. 27kg), although often requiring cereal supplementation to do so. Total dry matter yield approximately 4t DM/ha.
(c) Seed Seed rates can be varied to alter the proportions of leaf to bulb.
kg/ha (lb/acre)
Direct drilled 3.6 (2.7-5.4)
Seed cost – £4.60/kg
(d) Fertiliser
These rates are variable, higher N rates increase the leaf to bulb ratio. See page 4 for more info on nutrient planning.
kg/ha (units/acre)
N 90 (72) P2O5 100 (80) K2O 50 (40)
(e) Sprays Burn off land pre drilling for direct drilled crops only.
Insecticide for flea beetle may be required at a cost of £4.25/ha.

FORAGE CROPS 101
Dutch or Stubble Turnips
VARIABLE COST DATA
Direct
Drilled drilled
VARIABLE COSTS
Seed 21 21
Fertiliser 151 151
Sprays etc. - 8
Other expenses - -
172 (69) 180 (73)
FERTILISER PRICE SENSITIVITY (+/-)
10 p/kg N 9 (4) 9 (4)
10 p/kg P2O5 10 (4) 10 (4)
10 p/kg K2O 5 (2) 5 (2)
£/ha (acre)

FORAGE CROPS 102
Swedes and Turnips
PHYSICAL DATA
(a) System The crop allows for two feeding systems, strip grazing by use of
electric fencing or lifting and storing in a clamp. Roots must be clean and undamaged to prevent the risk of fungal disease in storage.
(b) Yield
Swedes Turnips Fresh DM Fresh DM roots, t/ha (t/acre)
Average 75 (30.4) 8.0 (3.2) 60 (24.3) 5.0 (2.0) Premium 100 (40.5) 9.5 (3.8) 80 (32.4) 7.5 (3.0)
In addition, turnips will yield 15 to 30 t leaf/ha (1.5 to 3.0 t DM).
(c) Seed Swede seed graded, dressed and precision sown (15 cm spacing) at
0.4 kg/ha and treated with neonicotinoid which remains approved for swede.
Turnip at 5kg/ha, untreated seed as neonicotinoid treatment not now approved.
Seed cost (p/kg):
Swedes – graded 97 Turnips – treated 11
(d) Fertiliser
See page 4 for more info on nutrient planning.
Swedes Turnips kg/ha (units/acre)
N 90 (72) 90 (72) P2O5 200 (160) 200 (160) K2O 150 (120) 125 (100)
(e) Sprays Pre-emergence herbicide for annual grass and broad leaved weeds.
Insecticide for flea beetle may be required at a cost of £4.25/ha.

FORAGE CROPS 103
Swedes and Turnips
VARIABLE COST DATA
Swedes Turnips
VARIABLE COSTS
Seed 39 55
Fertiliser 265 254
Sprays etc. 41 41
Other expenses - -
345 (140) 350 (142)
FERTILISER PRICE SENSITIVITY (+/-)
10 p/kg N 9 (4) 9 (4)
10 p/kg P2O5 20 (8) 20 (8)
10 p/kg K2O 15 (6) 12 (5)
£/ha (acre)

FORAGE CROPS 104
Chicory
PHYSICAL DATA
(a) System Three year ley incorporating chicory, plantain and white clover. The
crop is best utilised in a rotational grazed system. This allows for grazing every ~6 weeks to prevent the plant from flowering and crown damage. No winter grazing. The crop should be rested, typically by mid-September, in year of establishment and by November thereafter. Additional animal health benefits should also be considered.
(b) Yield Can be variable and thrives better in warmer soils. A crop suitable
for over 40 lambs/ha (16 lambs/acre) is possible in year of establishment (year 1). Adopt a restricted grazing period in year one. Some 15-30 ewes and twins/ha (6-12 ewes and twins/acre) can be grazed in years 2 and 3, typically from June, and lambs during that autumn.
About 40 lambs/ha (16 lambs/acre) (starting weight of approx. 34kg) will finish off pure chicory within 4 weeks. Crop would then be available to finish a further 12-25 lambs/ha (5-12 lambs/acre).
(c) Seed Rate – 10 kg/ha.
Sow into a fine, warm and firm seedbed by early June.
Seed costs - £15.00/kg. Includes plantain and white clover. Cost annualised over an assumed three year rotation.
(d) Fertiliser
kg/ha (units/acre)
N 50 (40) K2O 25 (20) P2O5 25 (20)
Little or no fertiliser is required where established on a prime site using white clover as a companion crop. See page 4 for more info on nutrient planning.
(e) Sprays An annual charge to cover pre-drilling stale seed bed preparation.
Otherwise, herbicides must not be used to control weeds in chicory. Poor competitor so good establishment is critical. Only topping should be carried out to control tall weeds post-emergence.
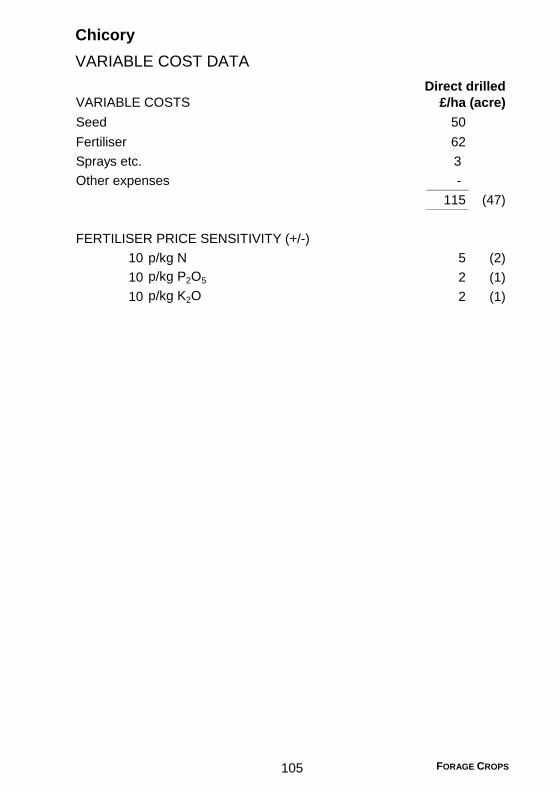
FORAGE CROPS 105
Chicory
VARIABLE COST DATA
Direct drilled
VARIABLE COSTS £/ha (acre)
Seed 50
Fertiliser 62
Sprays etc. 3
Other expenses -
115 (47)
FERTILISER PRICE SENSITIVITY (+/-)
10 p/kg N 5 (2)
10 p/kg P2O5 2 (1)
10 p/kg K2O 2 (1)

FORAGE CROPS 106
Fodder Beet
PHYSICAL DATA
(a) System Fodder beet can be grazed behind an electric fence or harvested and
fed as chopped or whole. If harvesting the crop soil contamination should be kept to a minimum to prevent further cleaning costs and promote intakes.
(b) Yield
Roots - t/ha (t/acre) Fresh DM
Average 60 (24.3) 10 (4.0) Premium 90 (36.4) 14 (5.7)
In addition, fodder beet will yield 35 t leaf/ha (3 to 4 t DM).
(c) Seed Pelleted monogerm seed precision drilled at 15 cm spacing in 55 to
65 cm rows (approx. 3-4 kg/ha). Treated seed would add a further £75 to costs.
(d) Fertiliser
kg/ha (units/acre)
N 100 (80) P2O5 60 (48) K2O 150 (120)
Potash level may be reduced to 75 kg/ha where agricultural salt (400 kg/ha) is applied.
All or part of the nutrient requirement can be satisfied with slurry or FYM. See page 4 for more info on nutrient planning.
(e) Sprays Pre-emergence broad leaved weed control and then up to four post
emergence applications at low rates.

FORAGE CROPS 107
Fodder Beet
VARIABLE COST DATA
VARIABLE COSTS £/ha (acre)
Seed 200
Fertiliser 176
Sprays etc. 141
Other expenses -
517 (209)
FERTILISER PRICE SENSITIVITY (+/-)
10 p/kg N 10 (4)
10 p/kg P2O5 6 (2)
10 p/kg K2O 15 (6)

FORAGE CROPS 108
Red Clover
PHYSICAL DATA
(a) System Red clover-ryegrass mixtures provide a good silage crop whilst
offering high quality aftermaths for finishing lambs. Up to 300g per day growth rate is possible in weaned lambs grazing red clover. Not suitable for winter grazing or intense autumn grazing.
Phyto-oestrogens affect ewe fertility so avoid grazing 6 weeks either side of tupping and limit grazing replacement ewe lambs on red clover as there is some, albeit limited, evidence that it affects reproductive tract development.
(b) Yield
t/ha (t/acre) Fresh DM
Average 37 10 Premium 56 15
(c) Seed For a high red clover sward:
15kg/ha (6kg/acre) red clover 5kg/ha (2kg/acre) grass seed
Spring sowing at 10-15mm depth when soil temperatures exceed 10°C works best.
(d) Fertiliser
kg/ha (units/acre)
N 0 (0) P2O5 70 (56) K2O 70 (56)
P and K application should be guided by recent soil analysis. Clover require higher pH than grasses, target 6-6.5. Nitrogen application is not required. See page 4 for more info on nutrient planning.
(e) Sprays Do not use residual herbicides on previous crops that could affect
germination of clover.

FORAGE CROPS 109
Red Clover
VARIABLE COST DATA
VARIABLE COSTS £/ha (acre)
Seed @ £8.25/kg 141
Fertiliser 80
Sprays etc. -
Other expenses -
221 (89)
FERTILISER PRICE SENSITIVITY (+/-)
10 p/kg N 0 (0)
10 p/kg P2O5 7 (3)
10 p/kg K2O 7 (3)


Livestock

LIVESTOCK 112
Livestock Units
Livestock units
Livestock units
Dairy cows 1.00 Ewes and ewe replacements 3
Dairy bulls 0.65 Light weight
Beef cows 0.75 Medium weight 0.08
Beef bulls 0.65 Heavy weight 0.11
Other cattle 1 Rams 0.08
0-12 months 0.34 Lambs
12-24 months 0.65 Birth to store 0.04
Over 24 months 2 0.80 Birth to fat 0.04
Barley beef 0.47 Birth to hoggets 0.08
Horses 0.80 Purchased stores 0.04
1 excluding intensive beef systems
2 reduced in proportion to time animal on farm
3 excluding suckling lambs
Notes
1. A Livestock Unit is usually defined in terms of feed requirements. The ratios in the table above are based on metabolisable energy requirements, with one unit being considered as the maintenance of a mature 625 kg Friesian cow and the production of a 40-45 kg calf, and 4,500 litres of milk at 36 g/kg of butterfat and 86 g/kg solids-not-fat.
2. To calculate the stocking density of grazing livestock, allowances should strictly be made for variation in output, e.g. yield per cow or liveweight gain per head, and also for quantities of non-forage feed consumed by each category of stock.
3. To calculate the total livestock units on a farm reduce in proportion the time animals are on farm within any year. The appropriate livestock units should be multiplied by the monthly average livestock numbers, except in the case of lambs and purchased stores where throughput should be used.
4. Because of the range in breed and type of animal within any one category (e.g. Friesian and Jersey dairy cows), the results obtained from the use of these figures must be interpreted with care.
5. Livestock units used by the Scottish Government for calculating stocking densities as part of eligibility for subsidy schemes differ slightly. See page 440 for more detail.
Basis of data: Defra, ‘Definitions of Terms used in Agricultural Business Management’ (Mar 2010).

LIVESTOCK 113
Livestock Traceability
Cattle All cattle are required to have a ‘passport’. Without a passport cattle cannot be slaughtered for human consumption.
Cattle are required to be double tagged. Beef calves must have both tags fitted within 20 days of birth. Dairy calves must have one tag fitted within 36 hours of birth and the second tag must be fitted within 20 days of birth. For all calves, births must be registered on the Cattle Tracing System (CTS) within 27 days of birth. Lost tags must be replaced within 28 days of discovery.
Deaths must be reported and passports returned within 7 days. If the animal is over 24 months of age, it must be tested for BSE.
When an animal moves from one holding to another, both off and on movements should be reported to CTS within 36 hours of the movement taking place. For further guidance see www.bcms.gov.uk.
An on-farm record must be retained for all cattle on the holding. All births, deaths and movements need to be recorded in farm records. These records must be retained for a 10 year period.
In Scotland from 1st January 2017 links between holdings no longer
apply. To keep cattle you must register each holding that you use (owned, rented or seasonally rented) with ScotMoves. Cattle moving to and from the different holdings (location codes) within a business now have to be recorded with ScotMoves within 48 hours of moving. This can be done by email, online, telephone/fax or paper. ScotMoves is not compulsory and on/off movements can be lodged with BCMS but the keeper must be registered as a keeper of cattle at the receiving holding and no more than one keeper can be registered on that holding. Full details including possible exemptions can be found at www.scoteid.com.
Sheep To keep sheep you must register each holding that you use (owned, rented or seasonally rented) with your local Rural Payments and Inspections Directorate (RPID) office. It is compulsory for all Scottish sheep born after 31 December 2009 to be tagged with an Electronic Identifier (EID) before they leave the holding of birth (unless under a concession) or are 9 months old, whichever comes first.
There are three types of tag that can be used:
Slaughter Tags (a single EID tag with a flock mark and no visible individual identifier).
A matching set of double tags with individual identifiers, one of which must be an EID tag.
An EID bolus and black ear tag.

LIVESTOCK 114
All sheep that are to be sold or slaughtered by the time they are one year old can be identified with any one of the above tags. However, the most common for sheep under 12 months old are slaughter tags for store and finished lambs.
Any animals kept beyond 12 months of age must have a matching set of double tags with individual numbers – one an EID tag. Any slaughter tagged animals that are to remain on the holding after they are a year old, must be upgraded (provided they are completely traceable) by removing the slaughter tag and replacing with a matching set of double tags with individual identifiers one of which must be an EID tag on or before they are one year old. These must be recorded in the replacement register.
A record of identification must be kept in the flock records with the date the animals were EID tagged and their individual number if double tagged or flock number if slaughter tagged. Batch recording can be used.
Any homebred sheep losing their tags must have them replaced within 28 days of discovery. If they are on the holding of birth you can use your existing double tags one of which must be EID. If the sheep are not on the holding of birth then red replacement EID tags must be used. Replacements must be recorded in the flock records.
Flock books (Holding Register – orange book) should include a section on identification and replacements and a continuous record must be kept. The register must be retained for three years.
All sheep movements in Scotland must be reported to SAMU (Scottish Animal Movements Unit) within 3 days. Any EID animals moving through Scottish Critical Control points (markets, abattoirs etc) are logged and uploaded to the ScotEID database. These movements can form part of your records. The ScotEID website www.scoteid.com is a source of information on tagging rules and regulations as is Scottish Governments own website at www.gov.scot/Topics/farmingrural/Agriculture/animal-welfare/IDtraceability/SheepandGoats
Goats The rules for goats are identical to sheep except the EID component is not compulsory and tattoos can be used.
Deer To keep deer you must register each holding that you use (owned, rented or seasonally rented) with your local Rural Payments and Inspections Directorate (RPID) office. Deer must be identified as required by the Tuberculosis (Deer) Order 1989 (as amended) before moving on or off a holding and before a TB test (unless under 16 weeks old).
The owner/keeper must complete a movement declaration (found at www.gov.scot/Topics/farmingrural/Agriculture/animal-welfare/Diseases/MovementRestrictions) which must be retained on the premises of departure for six months.

LIVESTOCK 115
Pigs To keep pigs you must register every holding that you use with your local SGRPID office. From 1
st October 2011, all pigs must be identified with an
eartag, tattoo or slapmark. If under 12 months old, a temporary mark (paint) can be used. However for movements to a show or exhibition, for breeding purposes, to a semen collection centre or, intra-Community trade or export or under a walking licence, all pigs must also have an eartag or a tattoo with the herd mark and a unique individual identification number. All replacement tags must be cross referenced in the holding register.
Movements must be notified either prior to leaving the holding or on the day of the move. This can be done electronically through www.scoteid.com or by telephone or in writing to the ScotEID information Centre. The receiving keeper must check and confirm receipt of pigs within 3 days of their arrival. The movements also need to be noted in the holding register within 48 hours of the move. These records must be kept for a minimum of 3 years and once a year the pigs on the holding must be recorded. ScotEID can be used for this.
Poultry Following the Avian Influenza (Preventative Measures) (Scotland) Order 2007 any person keeping more than 50 poultry must register as a keeper. This can be done through https://www.gov.uk/poultry-registration-scotland, by post, telephone or email. Movement records must be kept for poultry and/or eggs. Where the breeding, laying or broiler flock has more than 250 birds, salmonella testing records must be kept.
All livestock movements All movements of cattle, sheep, goats and other ruminating animals (except camelids) and swine are subject to a standstill period (unless an exemption applies). This period of standstill, in effect, does not permit the movement of any animal to a market if it has been presented at a market within the previous 13 days (20 for pigs), or an English or Welsh market within the previous 6 days (20 for pigs), except any animal marketed in a livestock market in any of the Scottish island areas. Many exemptions apply and they can be found at: www.gov.scot/Topics/farmingrural/Agriculture/animal-welfare/Diseases/MovementRestrictions/ExemptHTML
Animal Health Planning
A health plan should be dynamic and change as production and disease data becomes available. It should be reviewed when key information becomes available and updated accordingly. Crucially, it must be of real benefit to the farm business.
Health plan tools available include:

LIVESTOCK 116
Scottish Animal Health Planning System (SAHPS), http://www.sahps.co.uk/
My Healthy Herd (MHH), http://www.myhealthyherd.co.uk WLBP Animal Health Plan, https://farmrecords.wlbp.co.uk
Many vets’ practices have devised their own health planning scheme, which reflect particular needs for their practice area. Before committing to any particular health plan scheme, farmers should consult with their vet on the most suitable system available for their farm and requirements.
The SAHPS was developed to support vets and farmers involved in flock/herd health planning. The SAHPS web-based software and SAHPS app (Beef Health Planning mobile phone app linked to the SAHPS software and the British Cattle Movement System enabling farmers to collect data as events and actions occur) have been fully funded to date by the Scottish Government and are free to Scottish veterinary practices and farmers. They are also available to veterinary practices and farmers in England and Wales on a chargeable basis.
The SAHPS provides the opportunity for online collaboration between vet, farmer and consultant. All parties can enter information from their individual locations and communicate in real time resulting in a central data set which is readily accessed and easily reviewed. Farm data including animal performance, disease occurrence, routine/current treatments and/or vaccination programmes can be recorded either through the SAHPS web-based system and/or the SAHPS app.
Key functions of SAHPS:
Allows you to create a tailored and comprehensive health plan. View and compare production and disease data year on year. Compare performance with similar enterprises locally and nationally. View and update a calendar of forthcoming events for your
enterprise(s), e.g. add a reminder to order drugs or treat an individual animal.
Upload your documents, e.g. lab and abattoir reports.
Key functions of the SAHPS app:
Download all cattle recently on the holding through BCMS. View animal details. Record bulls in/out dates. Record movements, births, deaths. Send/receive information to/from BCMS. Record pregnancy diagnosis results. Record diseases incidents. Record treatment to create the e-medicine book. Record animal’s weight/Body Condition Score. Record weaning information. Enter information once and use multiple times. Record and save data off-line.

LIVESTOCK 117
In 2017, key performance data taken from SAHPS highlighted that:
Cattle herds in the upper quartile weaned 23% more calves than the lower quartile and had 16% fewer barren cows.
Sheep flocks in the upper quartile weaned 33% more lambs than the lower quartile and had 6% fewer barren ewes.
Premium health schemes The Premium Cattle Health Scheme (PCHS) and the Premium Sheep and Goat Health Scheme (PSGHS) identify herds and flocks free from certain diseases and to offer a control programme for those herds/flocks in which the diseases occur. Diseases covered by these schemes are:
PCHS PSGHS
Bovine Virus Diarrhoea (BVD) Leptospirosis Infectious Bovine Rhinotracheitis
(IBR) Johne’s Disease Neospora
Maedi Visna (MV) Caprine Arthritis Encephalitis
(CAE) Enzootic Abortion of Ewes
(EAE) Scrapie Caseous Lymphadenitis (CLA)
In addition to the livestock health schemes mentioned above, SAC Consulting have launched the Premium Assured Strangles Scheme (PASS) supported by the British Horse Society (BHS).
PASS aims to:
Protect healthy horses and equine yards from infection with Strangles. Eliminate Strangles from infected yards by detecting/treating carriers. Prevent the spread of disease locally by actively eliminating infection. Offer a national control programme to reduce the risk of Strangles for
all horses.
For more information on all the above health schemes see https://www.sruc.ac.uk/info/120107/veterinary_services Veterinary medicine records If you are the keeper of food producing animals or treat farm animals intended for human consumption, you must keep the following for 5 years from the date of treatment:
A record of the proof of purchase and batch numbers of all veterinary medicines bought for these animals.
A record of all veterinary medicine products administered to them. Where medicines have not been bought documentary evidence must
be kept of how they were acquired. The record must include those administered by the vet. Number of deaths.
Animals can only be sent for slaughter after the end of the withdrawal period. The records are to prove that the product was from a legitimate

LIVESTOCK 118
source and used in accordance with its licence. They must be retained for 5 years whether or not the animal has been sold, slaughtered or died.
A keeper must also keep the following record of the disposal of unwanted medicines:
Date of disposal. Quantity involved. How and where it was disposed of.
Nutritive Values and Relative Values (£) of Feedingstuffs
The tables are provided as a general guide and should be used with care. Each foodstuff has been attributed a specific nutritive value and often this will vary, e.g. the nutritive value of draff (see page 119). The relative values of the feedingstuffs are also affected by the rationing situation.
The relative values for ruminants are calculated on an ME (metabolisable energy) and CP (crude protein) basis using barley and rapeseed meal as standard reference foods. The relative values for pigs are calculated on a NE (net energy) and Dig Lys (digestible lysine) basis, using barley and hipro soya as standard reference foods.
If the relative value of a foodstuff is higher than the price then it is good value for money. For ruminants this does not take into account other characteristics of the feedstuff, for example, the high digestible undegradable protein (DUP) content of soya bean meal for ewes in late pregnancy or digestible fibre properties of sugar beet pulp. For pigs relative value does not take into account the content of other amino acids and for both types of animal the negative characteristics such as low palatability.

LIVESTOCK 119
Nutritive values of feedingstuffs-ruminants
Dry matter ME CP
(g/kg) (MJ/kg DM) (g/kg DM)
Rapeseed meal 900 12.0 400
Barley 860 13.2 115
Hay (average) 850 8.6 85
Hay (good) 860 9.2 100
Silage (average) 240 10.6 130
Silage (good) 240 11.2 140
Barley straw 860 6.3 35
Oats 870 12.0 100
Wheat 860 13.6 115
Maize 860 13.8 95
Brewers grains (draff) 230 11.1 200
Wheat dark grains 900 13.5 340
Malt dark grains 900 12.2 265
Maize gluten (20%) 880 12.9 220
Soya bean meal (47%) 890 13.3 530
Potatoes 210 13.3 90
Swedes 105 14.0 90
Molassed sugar beet feed 890 12.5 100
Relative values (£) of feedingstuffs-ruminants
£/t
RAPESEED MEAL 240 280
BARLEY 140 160 180 140 160 180
Hay (average) 82 91 100 85 94 103
Hay (good) 94 103 113 98 108 117
Silage (average) 33 36 39 35 38 41
Silage (good) 34 38 40 36 39 43
Barley straw 44 51 58 44 51 57
Oats 123 141 158 123 141 158
Wheat 144 166 187 144 165 186
Maize 141 164 187 138 161 184
Brewers grains (draff) 40 42 44 43 46 48
Wheat dark grains 235 243 251 264 272 281
Malt dark grains 189 198 207 210 219 228
Maize gluten (20%) 178 192 205 192 206 219
Soya bean meal (47%) 305 303 310 377 373 369
Potatoes 32 38 43 31 37 42
Swedes 17 20 23 16 19 22
Molassed sugar beet feed 130 151 170 130 150 169

LIVESTOCK 120
Nutritive values of feedingstuffs-pigs
NE (MJ/kg as fed)
Dig Lys (g/kg as fed)
Hipro soya bean meal 8.4 26.6
Barley 9.6 2.8
Oats 8.0 3.0
Wheat 10.5 2.5
Wheat feed 7.7 4.6
Wheat bran 6.2 4.0
Maize 11.1 1.8
Wheat dark grains 9.3 5.6
Maize gluten (20%) 7.0 4.0
Peas 9.7 12.5
Beans 8.6 12.8
Molassed sugar beet feed 6.6 2.9
Molasses 7.0 0.1
Biscuit waste 11.7 2.5
Rapeseed meal 6.5 14.0
Relative values (£) of feedingstuffs-pigs
£/t
HIPRO SOYA BEAN MEAL 350 400
BARLEY 140 160 180 140 160 180
Oats 123 140 154 124 140 157
Wheat 147 170 194 147 169 191
Wheat feed 134 149 158 140 154 168
Wheat bran 111 122 129 116 127 138
Maize 158 181 200 157 180 194
Wheat dark grains 163 180 191 169 186 203
Maize gluten (20%) 121 134 143 125 138 151
Peas 233 246 139 253 266 279
Beans 222 233 222 244 254 265
Molassed sugar beet feed 105 118 130 107 120 134
Molasses 84 100 120 80 96 112
Biscuit waste 162 187 214 160 185 210
Rapeseed meal 209 214 193 234 239 243

LIVESTOCK 121
Gestation Table
Ge
sta
tio
n T
ab
le
Co
wE
we
Hin
dS
ow
Co
wE
we
Hin
dS
ow
Co
wE
we
Hin
dS
ow
01-J
an
12-O
ct
30-M
ay
19-A
ug
24-A
pr
06-M
ay
15-F
eb
03-O
ct
23-D
ec
28-A
ug
08-S
ep
20-J
un
05-F
eb
27-A
pr
31-D
ec
06
17
04-J
un
24
29
11
20
08
28
02-S
ep
13
25
10
02-M
ay
05-J
an
11
22
09
29
04-M
ay
16
25
13
02-J
an
07
18
30
15
07
10
16
27
14
03-S
ep
921
02-M
ar
18
07
12
23
05-J
ul
20
12
15
21
01-N
ov
19
814
26
07
23
12
17
28
10
25
17
20
26
06
24
13
19
31
12
28
17
22
03-O
ct
15
02-M
ar
22
25
31
11
29
18
24
05-J
un
17
02-N
ov
22
27
08
20
07
27
30
05-F
eb
16
04-J
ul
23
29
10
22
07
27
02-O
ct
13
25
12
01-J
un
04-F
eb
10
21
09
28
03-J
un
15
27
12
01-F
eb
07
18
30
17
06
09
15
26
14
03-O
ct
820
01-A
pr
17
06
12
23
04-A
ug
22
11
14
20
01-D
ec
19
813
25
06
22
11
17
28
09
27
16
19
25
06
24
13
18
30
11
27
16
22
02-N
ov
14
01-A
pr
21
24
02-M
ar
12
30
19
24
05-J
ul
16
02-D
ec
21
27
07
19
06
26
01-M
ar
07
17
04-A
ug
24
29
10
21
07
26
01-N
ov
12
24
11
01-J
ul
06
12
22
09
29
04-J
ul
15
26
12
03-M
ar
06
17
29
16
06
11
17
27
14
03-N
ov
920
01-M
ay
17
08
11
22
03-S
ep
21
11
16
22
01-J
an
19
814
25
06
22
13
16
27
08
26
16
21
27
06
24
13
19
30
11
27
18
21
02-D
ec
13
01-M
ay
21
26
01-A
pr
11
29
18
24
04-A
ug
16
01-J
an
23
26
07
18
06
26
31
06
16
03-S
ep
23
29
09
21
06
28
01-D
ec
12
23
11
31
05-A
pr
11
21
08
28
03-A
ug
14
26
11
02-A
pr
06
17
28
16
05-A
ug
10
16
26
13
03-D
ec
819
31
16
07
11
22
03-O
ct
21
10
15
21
31
18
813
24
05-J
un
21
12
16
27
08
26
15
20
26
05-F
eb
23
13
18
29
10
26
17
21
01-M
ay
10
28
18
23
03-S
ep
15
31
22
26
Note
: R
efe
r to
the M
iscella
neous s
ection for
gesta
tion v
alu
es for
the a
bove
liv
esto
ck.
Valu
es w
ill c
hange for
diff
ere
nt
bre
ed t
ypes.
Da
te o
f
serv
ice
Bir
ths
du
eD
ate
of
serv
ice
Da
te o
f
serv
ice
Bir
ths
du
eB
irth
s d
ue


Dairying
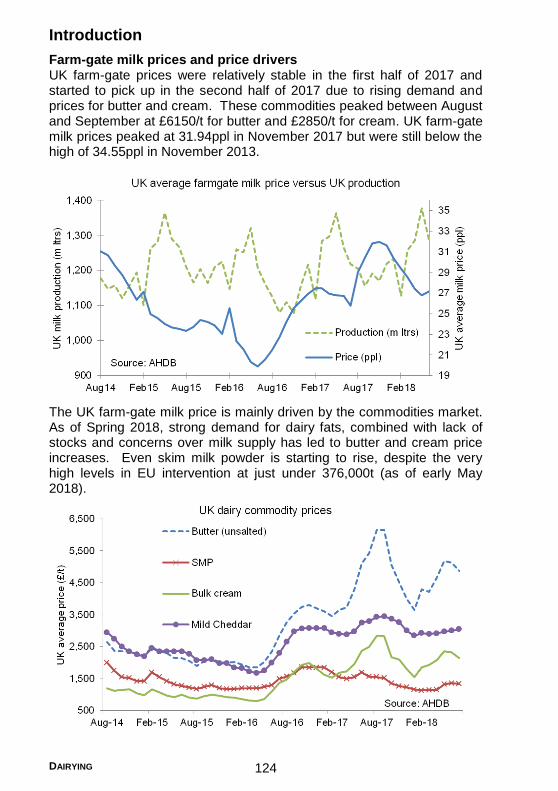
DAIRYING 124
Introduction
Farm-gate milk prices and price drivers UK farm-gate prices were relatively stable in the first half of 2017 and started to pick up in the second half of 2017 due to rising demand and prices for butter and cream. These commodities peaked between August and September at £6150/t for butter and £2850/t for cream. UK farm-gate milk prices peaked at 31.94ppl in November 2017 but were still below the high of 34.55ppl in November 2013.
The UK farm-gate milk price is mainly driven by the commodities market. As of Spring 2018, strong demand for dairy fats, combined with lack of stocks and concerns over milk supply has led to butter and cream price increases. Even skim milk powder is starting to rise, despite the very high levels in EU intervention at just under 376,000t (as of early May 2018).
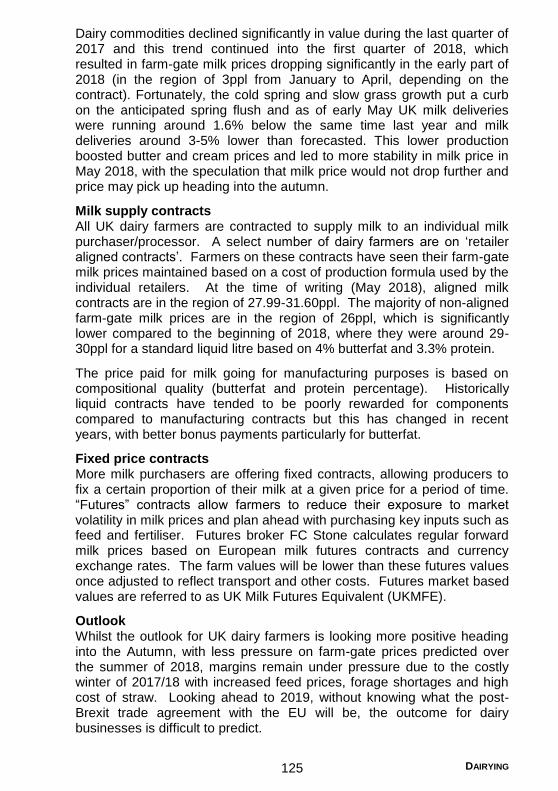
DAIRYING 125
Dairy commodities declined significantly in value during the last quarter of 2017 and this trend continued into the first quarter of 2018, which resulted in farm-gate milk prices dropping significantly in the early part of 2018 (in the region of 3ppl from January to April, depending on the contract). Fortunately, the cold spring and slow grass growth put a curb on the anticipated spring flush and as of early May UK milk deliveries were running around 1.6% below the same time last year and milk deliveries around 3-5% lower than forecasted. This lower production boosted butter and cream prices and led to more stability in milk price in May 2018, with the speculation that milk price would not drop further and price may pick up heading into the autumn.
Milk supply contracts All UK dairy farmers are contracted to supply milk to an individual milk purchaser/processor. A select number of dairy farmers are on ‘retailer aligned contracts’. Farmers on these contracts have seen their farm-gate milk prices maintained based on a cost of production formula used by the individual retailers. At the time of writing (May 2018), aligned milk contracts are in the region of 27.99-31.60ppl. The majority of non-aligned farm-gate milk prices are in the region of 26ppl, which is significantly lower compared to the beginning of 2018, where they were around 29-30ppl for a standard liquid litre based on 4% butterfat and 3.3% protein.
The price paid for milk going for manufacturing purposes is based on compositional quality (butterfat and protein percentage). Historically liquid contracts have tended to be poorly rewarded for components compared to manufacturing contracts but this has changed in recent years, with better bonus payments particularly for butterfat.
Fixed price contracts More milk purchasers are offering fixed contracts, allowing producers to fix a certain proportion of their milk at a given price for a period of time. “Futures” contracts allow farmers to reduce their exposure to market volatility in milk prices and plan ahead with purchasing key inputs such as feed and fertiliser. Futures broker FC Stone calculates regular forward milk prices based on European milk futures contracts and currency exchange rates. The farm values will be lower than these futures values once adjusted to reflect transport and other costs. Futures market based values are referred to as UK Milk Futures Equivalent (UKMFE).
Outlook Whilst the outlook for UK dairy farmers is looking more positive heading into the Autumn, with less pressure on farm-gate prices predicted over the summer of 2018, margins remain under pressure due to the costly winter of 2017/18 with increased feed prices, forage shortages and high cost of straw. Looking ahead to 2019, without knowing what the post-Brexit trade agreement with the EU will be, the outcome for dairy businesses is difficult to predict.
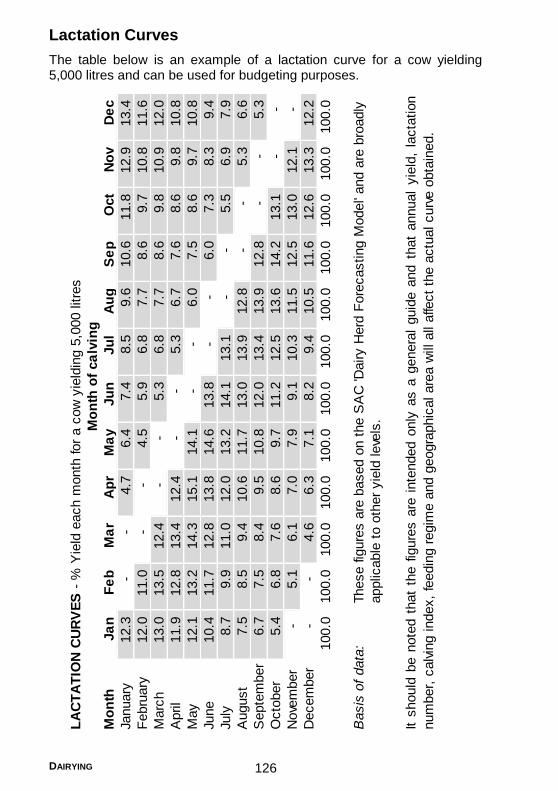
DAIRYING 126
Lactation Curves
The table below is an example of a lactation curve for a cow yielding 5,000 litres and can be used for budgeting purposes.
LA
CT
AT
ION
CU
RV
ES
- %
Yie
ld e
ach m
onth
for
a c
ow
yie
ldin
g 5
,000 litre
s
Mo
nth
Ja
nF
eb
Ma
rA
pr
Ma
yJu
nJu
lA
ug
Se
pO
ct
No
vD
ec
January
12.3
-
-
4.7
6.4
7.4
8.5
9.6
10.6
11.8
12.9
13.4
Febru
ary
12.0
11.0
-
-
4.5
5.9
6.8
7.7
8.6
9.7
10.8
11.6
Marc
h13.0
13.5
12.4
-
-
5.3
6.8
7.7
8.6
9.8
10.9
12.0
April
11.9
12.8
13.4
12.4
-
-
5.3
6.7
7.6
8.6
9.8
10.8
May
12.1
13.2
14.3
15.1
14.1
-
-
6.0
7.5
8.6
9.7
10.8
June
10.4
11.7
12.8
13.8
14.6
13.8
-
-
6.0
7.3
8.3
9.4
July
8.7
9.9
11.0
12.0
13.2
14.1
13.1
-
-
5.5
6.9
7.9
August
7.5
8.5
9.4
10.6
11.7
13.0
13.9
12.8
-
-
5.3
6.6
Septe
mber
6.7
7.5
8.4
9.5
10.8
12.0
13.4
13.9
12.8
-
-
5.3
Octo
ber
5.4
6.8
7.6
8.6
9.7
11.2
12.5
13.6
14.2
13.1
-
-
Nove
mber
-
5.1
6.1
7.0
7.9
9.1
10.3
11.5
12.5
13.0
12.1
-
Decem
ber
-
-
4.6
6.3
7.1
8.2
9.4
10.5
11.6
12.6
13.3
12.2
100.0
100.0
100.0
100.0
100.0
100.0
100.0
100.0
100.0
100.0
100.0
100.0
Basis
of
data
:These fig
ure
s a
re b
ased o
n t
he S
AC
'Dairy H
erd
Fore
casting M
odel'
and a
re b
roadly
applic
able
to o
ther
yie
ld leve
ls.
Mo
nth
of
ca
lvin
g
Itshould
be
note
dth
at
the
figure
sare
inte
nded
only
as
agenera
lguid
eand
that
annual
yie
ld,
lacta
tion
num
ber,
calv
ing index,
feedin
g r
egim
e a
nd g
eogra
phic
al are
a w
ill a
ll affe
ct
the a
ctu
al curv
e o
bta
ined.
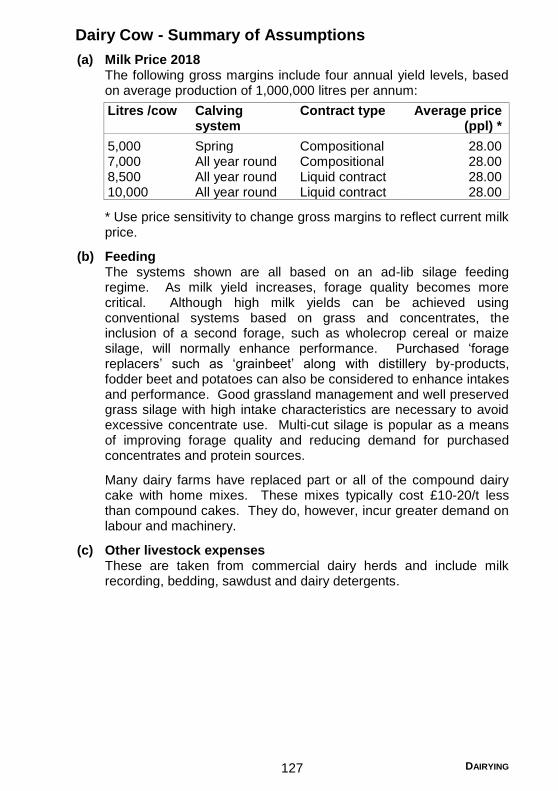
DAIRYING 127
Dairy Cow - Summary of Assumptions
(a) Milk Price 2018 The following gross margins include four annual yield levels, based on average production of 1,000,000 litres per annum:
Litres /cow Calving system
Contract type Average price (ppl) *
5,000 Spring Compositional 28.00 7,000 All year round Compositional 28.00 8,500 All year round Liquid contract 28.00 10,000 All year round Liquid contract 28.00
* Use price sensitivity to change gross margins to reflect current milk price.
(b) Feeding The systems shown are all based on an ad-lib silage feeding regime. As milk yield increases, forage quality becomes more critical. Although high milk yields can be achieved using conventional systems based on grass and concentrates, the inclusion of a second forage, such as wholecrop cereal or maize silage, will normally enhance performance. Purchased ‘forage replacers’ such as ‘grainbeet’ along with distillery by-products, fodder beet and potatoes can also be considered to enhance intakes and performance. Good grassland management and well preserved grass silage with high intake characteristics are necessary to avoid excessive concentrate use. Multi-cut silage is popular as a means of improving forage quality and reducing demand for purchased concentrates and protein sources.
Many dairy farms have replaced part or all of the compound dairy cake with home mixes. These mixes typically cost £10-20/t less than compound cakes. They do, however, incur greater demand on labour and machinery.
(c) Other livestock expenses These are taken from commercial dairy herds and include milk recording, bedding, sawdust and dairy detergents.

DAIRYING 128
Dairy Cow - Low Input Spring Calving
PHYSICAL DATA
Calving period Spring
/cow
Average annual yield (litres) 5,000
Herd life (years) 5.0
Calving interval (days) 370
Cow size (kg) 500
Feed requirements (kg):
Silage 7,000
Concentrates 750
Concentrates fed (kg/litre) 0.15
Overall forage area (ha):
Silage & aftermath grazing 0.20
Grazing 0.27
Total 0.47
Basis of data:
1. A spring calving herd managed on a low input system. Calving between February and April. Maximum utilisation of grazed grass; 150 days winter feeding period. A herd of 200 cows to produce 1m litres assumed at 4.4% BF and 3.4% P.
2. Calf sale/transfer value is an average of dairy heifers, males and beef cross calves at £117.50/hd then adjusted for calving interval and mortality. The calf value can be altered by £9.08 for each £10 difference in the sale/transfer price.
3. Cull cow sale price of £427.50/hd has been adjusted for herd life and mortality. The annual share can be altered by £1.95 for each £10 difference in cull cow price.
4. Heifer purchase/transfer price varies according to yield. A purchase price equating to 15ppl has been used. This has been adjusted for herd life and mortality. The annual share can be altered by £2.04 for each £10 difference in purchase/transfer price.
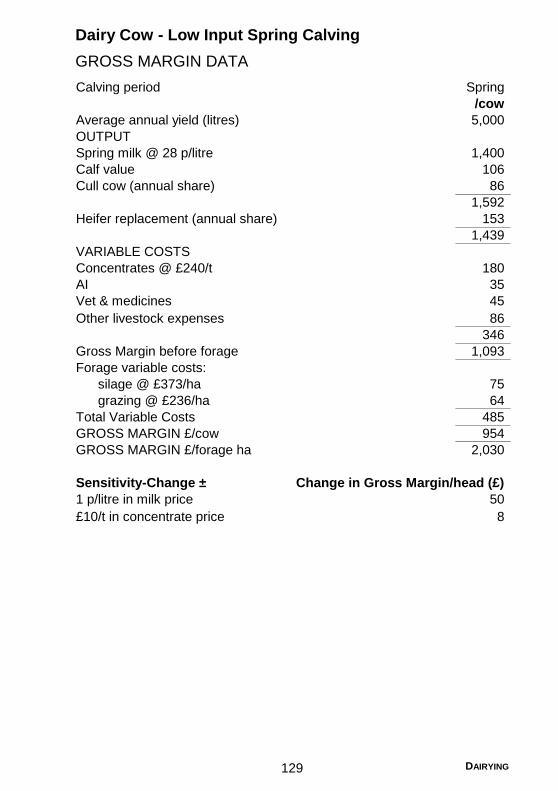
DAIRYING 129
Dairy Cow - Low Input Spring Calving
GROSS MARGIN DATA
Calving period Spring
/cow
Average annual yield (litres) 5,000
OUTPUT
Spring milk @ 28 p/litre 1,400
Calf value 106
Cull cow (annual share) 86
1,592
Heifer replacement (annual share) 153
1,439
VARIABLE COSTS
Concentrates @ £240/t 180
AI 35
Vet & medicines 45
Other livestock expenses 86
346
Gross Margin before forage 1,093
Forage variable costs:
silage @ £373/ha 75
grazing @ £236/ha 64
Total Variable Costs 485
GROSS MARGIN £/cow 954
GROSS MARGIN £/forage ha 2,030
Sensitivity-Change ± Change in Gross Margin/head (£)
1 p/litre in milk price 50
£10/t in concentrate price 8

DAIRYING 130
Dairy Cow - 7,000 Litres
PHYSICAL DATA
Calving period All year
/cow
Average annual yield (litres) 7,000
Herd life (years) 4.2
Calving interval (days) 390
Cow size (kg) 600
Feed requirements (kg):
Silage 8,500
Concentrates 1,800
Concentrates fed (kg/litre) 0.26
Overall forage area (ha):
Silage & aftermath grazing 0.25
Grazing 0.24
Total 0.49
Basis of data:
1. A moderate input system calving all year round; 200 days winter feeding period. A herd of 143 cows to produce 1m litres assumed at 4.0% BF and 3.3% P.
2. Calf sale/transfer value is an average of dairy heifers, males and beef cross calves at £133.00/hd then adjusted for calving interval and mortality. The calf value can be altered by £8.61 for each £10 difference in the sale/transfer price.
3. Cull cow sale price of £513.00 /hd has been adjusted for herd life and mortality. The annual share can be altered by £2.34 for each £10 difference in cull cow price.
4. Heifer purchase/transfer price varies according to yield. A purchase price equating to 15ppl has been used. This has been adjusted for herd life and mortality. The annual share can be altered by £2.45 for each £10 difference in purchase/transfer price.
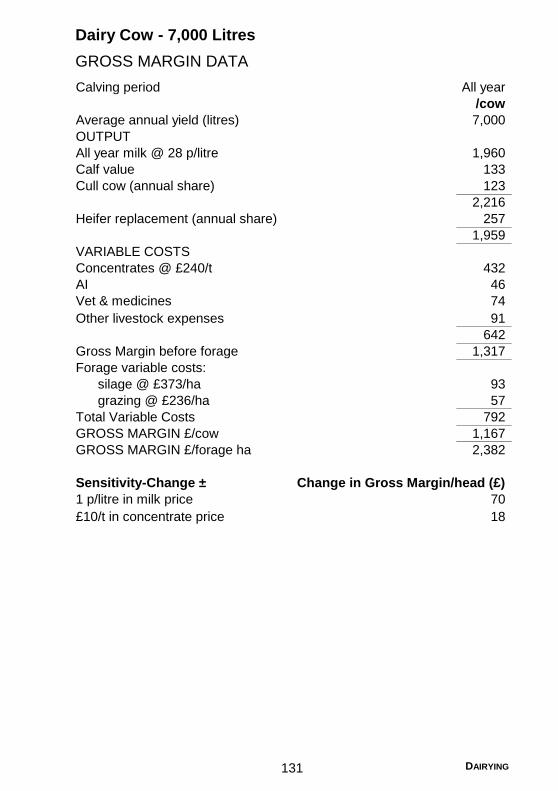
DAIRYING 131
Dairy Cow - 7,000 Litres
GROSS MARGIN DATA
Calving period All year
/cow
Average annual yield (litres) 7,000
OUTPUT
All year milk @ 28 p/litre 1,960
Calf value 133
Cull cow (annual share) 123
2,216
Heifer replacement (annual share) 257
1,959
VARIABLE COSTS
Concentrates @ £240/t 432
AI 46
Vet & medicines 74
Other livestock expenses 91
642
Gross Margin before forage 1,317
Forage variable costs:
silage @ £373/ha 93
grazing @ £236/ha 57
Total Variable Costs 792
GROSS MARGIN £/cow 1,167
GROSS MARGIN £/forage ha 2,382
Sensitivity-Change ± Change in Gross Margin/head (£)
1 p/litre in milk price 70
£10/t in concentrate price 18

DAIRYING 132
Dairy Cow - 8,500 Litres
PHYSICAL DATA
Calving period All year
/cow
Average annual yield (litres) 8,500
Herd life (years) 3.6
Calving interval (days) 405
Cow size (kg) 650
Feed requirements (kg):
Silage 9,200
Concentrates 2,800
Concentrates fed (kg/litre) 0.33
Overall forage area (ha):
Silage & aftermath grazing 0.25
Grazing 0.23
Total 0.48
Basis of data:
1. A moderate input system calving all year round; 230 days winter feeding period. A herd of 118 cows to produce 1m litres assumed at 3.9% BF and 3.2% P.
2. Calf sale/transfer value is an average of dairy heifers, males and beef cross calves at £128.00/hd then adjusted for calving interval and mortality. The calf value can be altered by £8.29 for each £10 difference in the sale/transfer price.
3. Cull cow sale price of £476.19/hd has been adjusted for herd life and mortality. The annual share can be altered by £2.71 for each £10 difference in cull cow price.
4. Heifer purchase/transfer price varies according to yield. A purchase price equating to 15ppl has been used. This has been adjusted for herd life and mortality. The annual share can be altered by £2.86 for each £10 difference in purchase/transfer price.

DAIRYING 133
Dairy Cow - 8,500 Litres
GROSS MARGIN DATA
Calving period All year
/cow
Average annual yield (litres) 8,500
OUTPUT
All year milk @ 28 p/litre 2,380
Calf value 135
Cull cow (annual share) 137
2,652
Heifer replacement (annual share) 364
2,288
VARIABLE COSTS
Concentrates @ £240/t 672
AI 55
Vet & medicines 102
Other livestock expenses 90
919
Gross Margin before forage 1,369
Forage variable costs:
silage @ £373/ha 93
grazing @ £236/ha 54
Total Variable Costs 1,066
GROSS MARGIN £/cow 1,222
GROSS MARGIN £/forage ha 2,546
Sensitivity-Change ± Change in Gross Margin/head (£)
1 p/litre in milk price 85
£10/t in concentrate price 28
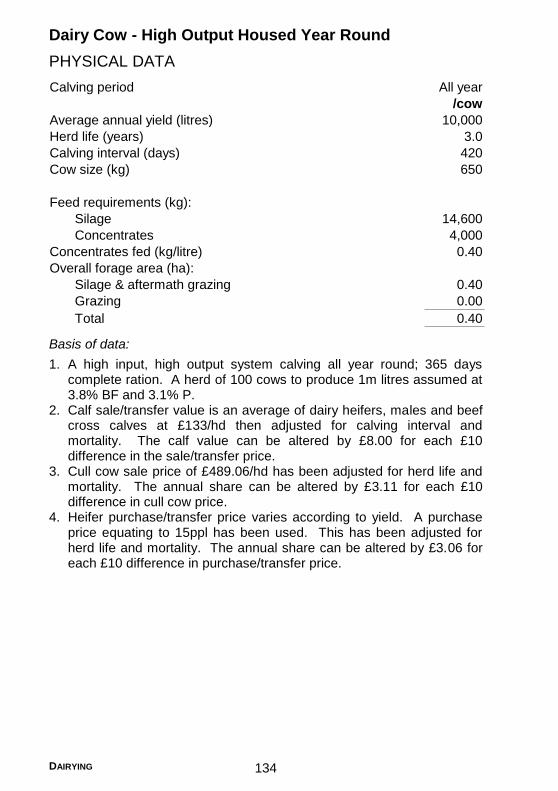
DAIRYING 134
Dairy Cow - High Output Housed Year Round
PHYSICAL DATA
Calving period All year
/cow
Average annual yield (litres) 10,000
Herd life (years) 3.0
Calving interval (days) 420
Cow size (kg) 650
Feed requirements (kg):
Silage 14,600
Concentrates 4,000
Concentrates fed (kg/litre) 0.40
Overall forage area (ha):
Silage & aftermath grazing 0.40
Grazing 0.00
Total 0.40
Basis of data:
1. A high input, high output system calving all year round; 365 days complete ration. A herd of 100 cows to produce 1m litres assumed at 3.8% BF and 3.1% P.
2. Calf sale/transfer value is an average of dairy heifers, males and beef cross calves at £133/hd then adjusted for calving interval and mortality. The calf value can be altered by £8.00 for each £10 difference in the sale/transfer price.
3. Cull cow sale price of £489.06/hd has been adjusted for herd life and mortality. The annual share can be altered by £3.11 for each £10 difference in cull cow price.
4. Heifer purchase/transfer price varies according to yield. A purchase price equating to 15ppl has been used. This has been adjusted for herd life and mortality. The annual share can be altered by £3.06 for each £10 difference in purchase/transfer price.

DAIRYING 135
Dairy Cow - High Output Housed Year Round
GROSS MARGIN DATA
Calving period All year
/cow
Average annual yield (litres) 10,000
OUTPUT
All year milk @ 28 p/litre 2,800
Calf value 107
Cull cow (annual share) 150
3,057
Heifer replacement (annual share) 459
2,598
VARIABLE COSTS
Concentrates @ £240/t 960
AI 65
Vet & medicines 125
Other livestock expenses 110
1,260
Gross Margin before forage 1,338
Forage variable costs:
silage @ £373/ha 149
grazing @ £236/ha -
Total Variable Costs 1,409
GROSS MARGIN £/cow 1,189
GROSS MARGIN £/forage ha 2,973
Sensitivity-Change ± Change in Gross Margin/head (£)
1 p/litre in milk price 100
£10/t in concentrate price 40

DAIRYING 136
Replacement Heifer Rearing
Fodder requirements of Holstein Friesian heifers The following tables provide forage data to budget for the cost of replacement heifers. Also see pages 138-139.
Approx
closing Conc Straw Silage
lwt (kg) (days) (kg) (kg) (kg)
Early autumn
(1st Sept)/24 months
Birth 40 - - - -
0-3 (S-N) 90 - 140 100 -
4-8 (D-A) 200 - 380 800 -
9-14 (My-O) 320 120 150 - -
15-20 (N-A) 430 - 300 - 5,500
21-24 (My-A) 520 100 120 - -
Total 220 1,090 900 5,500
Forage (ha) 0.53 - - 0.18
Early spring
(1st April)/24 months
Birth 40 - - - -
0-3 (A-J) 90 - 140 100 -
4-8 (J-N) 200 52 380 300 -
9-14 (D-My) 320 - 300 800 -
15-20 (J-N) 430 100 150 - -
21-24 (D-M) 520 - 150 - 5,500
Total 152 1,120 1,200 5,500
Forage (ha) 0.37 - - 0.18
Cow
grazing
Mainly silage ration

DAIRYING 137
Approx
closing Conc Straw Silage
lwt (kg) (days) (kg) (kg) (kg)
Early autumn
(1st Sept)/27 months
Birth 40 - - - -
0-2 (S-O) 90 - 170 100 -
3-8 (N-A) 200 - 450 800 -
9-14 (My-O) 320 100 300 - -
15-20 (N-A) 430 - 150 - 5,000
21-27 (My-N) 540 170 110 - 1,500
Total 270 1,180 900 6,500
Forage (ha) 0.65 - - 0.21
Early spring
(1st April)/27 months
Birth 40 - - - -
0-2 (A-M) 90 - 170 100 -
3-8 (J-N) 200 50 450 800 -
9-14 (D-My) 320 50 300 - -
15-20 (J-N) 430 80 150 - 3,250
21-27 (D-J) 540 80 100 - 3,250
Total 260 1,170 900 6,500
Forage (ha) 0.63 - - 0.21
Early spring
(1st Feb)/30 months
Birth 40 - - - -
0-3 (F-A) 85 - 100 100 -
4-9 (My-O) 170 52 350 800 600
10-16 (N-My) 290 - 350 - 4,000
17-21 (J-O) 390 120 - - -
22-28 (N-My) 510 - 200 - 4,500
29-30 (J-J) 540 - - - - Total 172 1,000 900 9,100
Forage (ha) 0.59 - - 0.29
Cow
grazing
Mainly silage ration

DAIRYING 138
Re
pla
ce
me
nt
He
ife
r R
ea
rin
g
PH
YS
ICA
L D
AT
A
Tim
e o
f b
irth
Ea
rly a
utu
mn
Ea
rly s
pri
ng
Ea
rly a
utu
mn
Ea
rly s
pri
ng
Ea
rly s
pri
ng
Ag
e a
t ca
lvin
g24 m
on
ths
24 m
on
ths
27 m
on
ths
27 m
on
ths
30 m
on
ths
Ration t
ype
Main
ly s
ilage
Main
ly s
ilage
Main
ly s
ilage
Main
ly s
ilage
Main
ly s
ilage
Milk
, w
hole
litre
20
20
20
20
20
Milk
, substitu
tekg
38
38
38
38
38
Concentr
ate
s:
sta
rter
(pro
prieta
ry)
kg
130
130
130
130
130
rearing (
150 g
/kg D
CP
)kg
360
360
450
450
350
main
ly c
ere
al m
ixkg
270
300
300
300
-
str
aw
kg
250
350
700
700
250
Fora
ge:sila
ge
kg
5,5
00
5,5
00
6,5
00
6,5
00
9,1
00
ha
0.1
80.1
80.2
10.2
10.2
9
gra
zin
gha
0.5
30.3
70.6
50.6
30.5
9
Tota
l fo
rage
ha
0.7
10.5
50.8
60.8
40.8
8
Basis
of
data
:
(a)
Qu
ali
ty o
f fo
rag
e:
ME
(M
J/k
g D
M)
DM
(g
/kg
)'S
ub
stit
uti
on
Ra
te'
Sila
ge
10.5
220
3 t
o 3
.5
(b)
(c)
Inte
nsifi
cation o
f gra
zin
g c
an s
ave
up t
o 2
5%
of th
e a
rea a
llocate
d.
The fora
ge h
ecta
res s
how
n a
re d
erive
d fro
m t
he G
rassla
nd s
ection for
sila
ge (
220 k
gN
, 2 c
uts
), a
nd g
razin
g (
175
kgN
). T
he h
ecta
res for
sila
ge inclu
de a
pro
port
ion o
f afterm
ath
gra
zin
g,
whic
h in t
urn
has b
een d
educte
d fro
m t
he
gra
zin
g r
equirem
ent.

DAIRYING 139
Re
pla
ce
me
nt
He
ife
r R
ea
rin
g
GR
OS
S M
AR
GIN
DA
TA
Tim
e o
f b
irth
Ea
rly a
utu
mn
Ea
rly s
pri
ng
Ea
rly a
utu
mn
Ea
rly s
pri
ng
Ea
rly s
pri
ng
Ag
e a
t ca
lvin
g24 m
on
ths
24 m
on
ths
27 m
on
ths
27 m
on
ths
30 m
on
ths
Ration t
ype
Main
ly s
ilage
Main
ly s
ilage
Main
ly s
ilage
Main
ly s
ilage
Main
ly s
ilage
OU
TP
UT -
Heife
r at
calv
ing
1,2
03
1,2
03
1,2
03
1,2
03
1,2
03
Less h
eife
r calf
129
129
129
129
129
1,0
74
1,0
74
1,0
74
1,0
74
1,0
74
VA
RIA
BLE
CO
STS
Milk
, w
hole
@ 2
8 p
/litre
66
66
6
Milk
, substitu
te @
£1800/t
68
68
68
68
68
Concentr
ate
s:s
tart
ers
@ £
280/t
36
36
36
36
36
rearing @
£260/t
94
94
117
117
91
main
ly c
ere
al m
ix @
£215/t
58
65
65
65
-
str
aw
@ £
80/t
20
28
56
56
20
Vet
& m
edic
ines
40
40
40
40
40
AI &
oth
er
livesto
ck e
xpenses
67
67
67
67
67
389
404
455
455
328
Gro
ss m
arg
in b
efo
re fora
ge
685
670
619
619
746
Fora
ge v
ariable
costs
:
sila
ge @
£246/h
a44
44
52
52
71
gra
zin
g @
£174/h
a92
64
113
110
103
Tota
l V
ariable
costs
525
512
620
617
502
GR
OS
S M
AR
GIN
(birth
to c
alv
ing)
549
562
454
457
572
GR
OS
S M
AR
GIN
/fora
ge h
a (
acre
)773
(313)
1,0
22
(414)
528
(214)
544
(220)
650
(263)
Note
:The
calf
price
of
£120
and
valu
eof
heife
rsold
of
£1300
have
been
adju
ste
dto
allo
wfo
rm
ort
alit
y(5
-10%
)and
barr
en
and
reje
ct
heife
rs (
5-1
0%
) re
spective
ly.

DAIRYING 140
Contract Dairy Heifer Rearing
Contract rearing dairy heifers by a dedicated rearer allows the farm to focus purely on the milking herd and reduces time and resources previously allocated to youngstock. Contracts are often based on certain targets being met, such as growth rate, age at bulling and age at first calving. Target body weights at different stages throughout the rearing process are the basis of efficient heifer rearing programmes, with a target liveweight and age at first calving being a key requirement of the contract.
Contract rearers tend to take delivery of heifers from between 2 to 4 months of age, returning them to the dairy farmer at 4 to 6 weeks before calving.
There are various types of contract in use:
Contract payment based on per animal per day. This is where the farmer pays a flat rate fee per head per day based on the actual rearing costs.
Weight gain on a per kilogram basis contract. The difference between the delivery weight to the rearer and the return weight to the farmer is divided by the number of days to determine growth rate per day. The danger with this type of contract is that the rearer must avoid producing heifers that are over-conditioned.
Sell and buy-back contract. The rearer buys the calves at an agreed price, with the farmer retaining the right to buy back the heifers 4 to 6 weeks prior to calving. The rearer retains control of the system but is responsible for all losses incurred. The farmer runs the risk of buying back heifers at an age or weight that is not desirable in their system.
A full contract where the farmer stipulates the rearing policy and covers all costs such as feed, semen and veterinary medicine costs (as well as any losses). The rearer only provides the labour and facilities.
Care must be taken to ensure that both the rearer and the dairy farmer’s responsibilities are clearly defined and that the rearer has insurance to cover any third party claims involving the heifers in his care.
Summary of charges are as follows:
Charge £/day £/month
From 14 days to 3 or 6 months of age 1.28-1.51 39-46 From 14 days to calving (at 2 years of age) 1.18-1.35 36-41 From 6 months to calving (at 2 years of age) 1.02-1.25 31-38
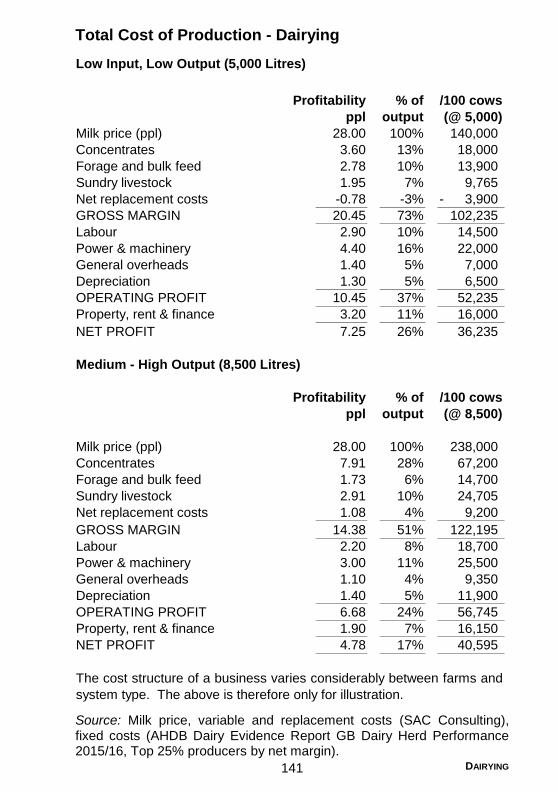
DAIRYING 141
Total Cost of Production - Dairying
Low Input, Low Output (5,000 Litres)
Profitability % of /100 cows
ppl output (@ 5,000)
Milk price (ppl) 28.00 100% 140,000
Concentrates 3.60 13% 18,000
Forage and bulk feed 2.78 10% 13,900
Sundry livestock 1.95 7% 9,765
Net replacement costs -0.78 -3% 3,900-
GROSS MARGIN 20.45 73% 102,235
Labour 2.90 10% 14,500
Power & machinery 4.40 16% 22,000
General overheads 1.40 5% 7,000
Depreciation 1.30 5% 6,500
OPERATING PROFIT 10.45 37% 52,235
Property, rent & finance 3.20 11% 16,000
NET PROFIT 7.25 26% 36,235
Medium - High Output (8,500 Litres)
Profitability % of /100 cows
ppl output (@ 8,500)
Milk price (ppl) 28.00 100% 238,000
Concentrates 7.91 28% 67,200
Forage and bulk feed 1.73 6% 14,700
Sundry livestock 2.91 10% 24,705
Net replacement costs 1.08 4% 9,200
GROSS MARGIN 14.38 51% 122,195
Labour 2.20 8% 18,700
Power & machinery 3.00 11% 25,500
General overheads 1.10 4% 9,350
Depreciation 1.40 5% 11,900
OPERATING PROFIT 6.68 24% 56,745
Property, rent & finance 1.90 7% 16,150
NET PROFIT 4.78 17% 40,595
The cost structure of a business varies considerably between farms and
system type. The above is therefore only for illustration.
Source: Milk price, variable and replacement costs (SAC Consulting), fixed costs (AHDB Dairy Evidence Report GB Dairy Herd Performance 2015/16, Top 25% producers by net margin).


Beef Cattle
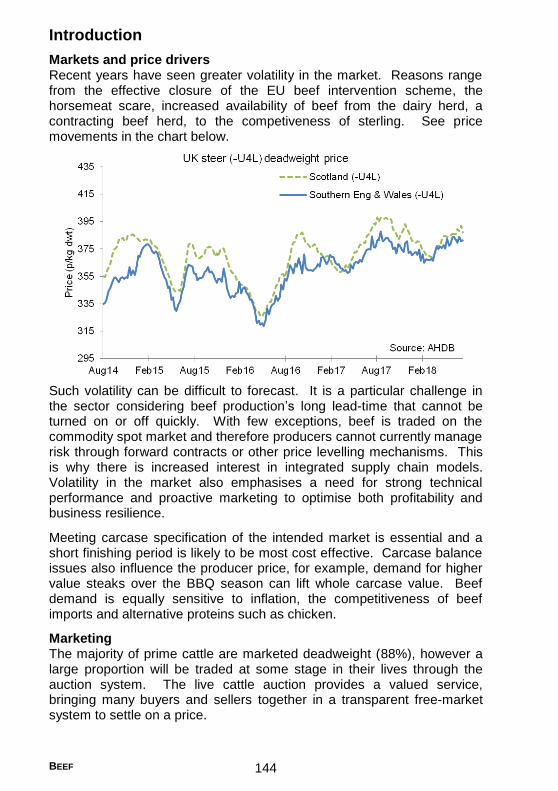
BEEF 144
Introduction
Markets and price drivers Recent years have seen greater volatility in the market. Reasons range from the effective closure of the EU beef intervention scheme, the horsemeat scare, increased availability of beef from the dairy herd, a contracting beef herd, to the competiveness of sterling. See price movements in the chart below.
Such volatility can be difficult to forecast. It is a particular challenge in the sector considering beef production’s long lead-time that cannot be turned on or off quickly. With few exceptions, beef is traded on the commodity spot market and therefore producers cannot currently manage risk through forward contracts or other price levelling mechanisms. This is why there is increased interest in integrated supply chain models. Volatility in the market also emphasises a need for strong technical performance and proactive marketing to optimise both profitability and business resilience.
Meeting carcase specification of the intended market is essential and a short finishing period is likely to be most cost effective. Carcase balance issues also influence the producer price, for example, demand for higher value steaks over the BBQ season can lift whole carcase value. Beef demand is equally sensitive to inflation, the competitiveness of beef imports and alternative proteins such as chicken.
Marketing The majority of prime cattle are marketed deadweight (88%), however a large proportion will be traded at some stage in their lives through the auction system. The live cattle auction provides a valued service, bringing many buyers and sellers together in a transparent free-market system to settle on a price.

BEEF 145
The most common method to spread risk, when selling at livestock auctions, is to target large or multiple sales per year. Price can be influenced by gaining feedback from buyers and selling the right type of cattle at the appropriate sales. Similarly, when selling direct to processors, a higher price might be achievable if a large number of in-specification cattle can be delivered at pre-arranged times and/or supply can be spread throughout the year.
Margins The financial contribution of cattle to farm profitability is inevitably sensitive to the sales price. However, there is only limited opportunity to influence this but potential exists through improving output per hectare and cost control.
The most profitable suckler cow enterprises make a positive net margin before subsidy. Top performing suckler beef systems consistently rear more calves per cow, to heavier weights, using less purchased feed. Grassland management is also better. Furthermore, while fixed costs may be lower they are also diluted by selling more kilos of beef.
The budgeted 2018/19 gross margin per suckler cow looks relatively good, subject to strong technical performance. Costs are budgeted higher but this is mitigated by a better forecast sale price. In reality, the calving percentage could be compromised by cows in a lower body condition score at bulling 2017. The finisher’s margin has been challenging over recent years due to relatively high store cattle prices coupled with greater price volatility for finished cattle. This improved last year and again this year prices look comparatively buoyant which will help mitigate a rise in budgeted cost of feeds and bedding straw.
Other benefits How the enterprise complements other parts of the business is also important. For example, the share and spread of demand for labour and machinery will affect the success of the enterprise mix in a business. Furthermore, well managed multiple enterprises can spread risk and improve cash flow, having additional and multiple sale dates.
Suckler cows play a significant role in managing upland grazings, providing benefit to biodiversity, landscape management and grazing quality. Mixed livestock grazing systems also contribute to reduced worm burdens for both cattle and sheep. Their manure is also an important source of nutrients for arable cropping as part of a crop rotation. Consequently, any enterprise should not be viewed in isolation.
Subsidies and support The Scottish Suckler Beef Support Scheme (SSBSS), commenced in 2015. Payment is made on male and female calves, which are at least 75% beef bred, born on your holding and have been kept there for at least 30 days. The net payment rate per eligible calf on the mainland was approximately £98 and £142 on the islands, for last year (2017).

BEEF 146
Actual payment rates are determined by the number of calves claimed each year and the exchange rate for that year. Payments are confirmed once applications are validated in the Spring following the year of claim.
The Beef Efficiency Scheme (BES) is a five-year scheme focusing on cattle genetics and management practice – aiming to improve genetic selection in respect of growth rates, feed conversion, maternal behaviour, nutrition practice and disease resistance. A payment equivalent to £32 per calf will be available each year for the first three years, paid on an area basis.
For further details on payments and the requirements of these schemes see pages 445 and 450 in the Rural Aid Schemes section.
General Reference Data
Effect of slaughter age on performance of intensively finished Holstein bulls
Slaughter weight (kg) 326 399 456 494
Slaughter age (days) 223 270 301 358
Finishing period (days) 150 185 207 276
Finishing gain (kg) 233 288 331 390
Finishing gain (kg/day) 1.55 1.56 1.60 1.41
Feed intake (kg) 998 1,422 1,653 2,152
FCR (kg feed/kg gain) 4.28 4.94 4.99 5.52
Carcass weight (kg) 172 215 242 267
KO% 52.9% 54.0% 53.0% 54.1%
Saleable meat yield (kg) 127 158 176 193
Saleable meat yield (%) 73.9% 73.2% 72.8% 72.2%
Store cattle valuations The sale value of store cattle can vary depending on time of sale. This variation has been removed for the gross margins.
The age and weight of calves at sale varies depending on season or month of calving - be cautious when comparing spring and autumn calving herds.
Note that an increasing share of fixed costs are attributable as the length of time trading stock spend on farm increases – this is true where other breeding or trading stock could have made use of the farm resources.
Foster calves To reduce risk of disease, it is assumed that no foster calves are bought to replace dead calves. No cost for replacement calves has been included in the margins thus, if foster calves are bought, the appropriate adjustment should be made to the gross margin.

BEEF 147
Liveweight to deadweight-price conversion In order to calculate the deadweight price divide the liveweight price by the killing out percentage (KO %). For example: 200 p/kg / 0.52 = 385 p/kg deadweight. See following quick reference table:
Liveweight Killing out %
Price 50% 52% 54% 56% 58% 60%
(p/kg) Deadweight price (p/kg)
160 320 308 296 286 276 267
162 324 312 300 289 279 270
164 328 315 304 293 283 273
166 332 319 307 296 286 277
168 336 323 311 300 290 280
170 340 327 315 304 293 283
172 344 331 319 307 297 287
174 348 335 322 311 300 290
176 352 338 326 314 303 293
178 356 342 330 318 307 297
180 360 346 333 321 310 300
182 364 350 337 325 314 303
184 368 354 341 329 317 307
186 372 358 344 332 321 310
188 376 362 348 336 324 313
190 380 365 352 339 328 317
192 384 369 356 343 331 320
194 388 373 359 346 334 323
196 392 377 363 350 338 327
198 396 381 367 354 341 330
200 400 385 370 357 345 333
202 404 388 374 361 348 337
204 408 392 378 364 352 340
206 412 396 381 368 355 343
208 416 400 385 371 359 347
210 420 404 389 375 362 350
212 424 408 393 379 366 353
214 428 412 396 382 369 357
216 432 415 400 386 372 360
218 436 419 404 389 376 363
220 440 423 407 393 379 367
222 444 427 411 396 383 370
224 448 431 415 400 386 373
226 452 435 419 404 390 377
228 456 438 422 407 393 380
230 460 442 426 411 397 383

BEEF 148
Hill Suckler Cows
PHYSICAL DATA
Spring Autumn
Calving period Feb-Apr Sep-Nov
Calves weaned 90% 90%
Month of weaning October July
Days to weaning 220 270
Month of sale October October
Lwt of calves: at weaning (kg) 235 270
Lwt of calves: at sale/transfer (kg) 235 335
Herd life of cows (years) 7 7
Herd life of bulls (years) 4 4
Cow mortality (%) 1 1
Calf mortality (%) 4.5 4.5
Cow:bull ratio (:1) 35 35
Feeding/cow and calf (winter days): 180 200
silage (t) 5.4 7.5
straw (kg) - -
creep feed (kg) (incl. pre sale) - 250
cow concentrates (kg) 50 200
cow cobs (kg) 50 50
grazing (hill/rough pasture) >0.5 >0.6
Silage fertiliser (kg N/ha) 125 125
Silage:
yield (t/ha from 1-cut) 20 20
DM quality (g/kg) 220 220
ME quality (MJ/kg DM) 10 10
Rough grazing (ha) >0.6 >0.5
Silage & aftermath grazing (ha) 0.27 0.375
Housing system: In cubicles*.
Straw for general use incl. calving pens 0.33 0.42
Straw bedding (if in bedded courts) (t) 1.25 1.50
Based on bought-in straw.
* Amend bedding costs for cows outwintered or housed on straw. Assumptions:
1. Grazing is assumed to be hill grazing with some improvements, carrying a maintenance charge of £50/grazing livestock unit.
2. SSBSS value is based on mainland payments, adjusted for living calves at 30 days of age, and an exchange rate of £0.88/€. For further detail on this scheme see pages 145-146 and 445.

BEEF 149
Hill Suckler Cows
GROSS MARGIN DATA
Spring Autumn
Calving period Feb-Apr Sep-Nov
OUTPUT £/cow £/cow
Calf sales (lwt - 90% crop)
Steers Heifers
350 kg @ 227 p 320 kg @ 222 p - 677
250 kg @ 227 p 220 kg @ 222 p 475 -
Scottish Suckler Beef Support Scheme 90 90
565 767
Less: Replacement - cow 89 89
bull 24 24
452 654
VARIABLE COSTS
Cow concentrates @ £224/t 11 45
Cow cobs @ £247/t 12 12
Creep feed @ £228/t - 57
Vet & medicines 30 30
Straw bedding @ £110/t (bought-in) 36 46
Commission, haulage & tags 39 47
128 237
Gross Margin before forage 324 417
Forage variable costs:
silage @ £175/ha 47 66
grazing @ £10/grazing livestock unit 11 15
58 81
Total Variable Costs 186 318
GROSS MARGIN £/cow 266 336
Sensitivity-Change ± Change in Gross Margin/head (£)
10 p/kg in lwt sale price 21 30
Sale weight ± 10kg 20 20
Herd life ± 1 year 17 17
Replacement Cost prices:
Cull cow In-calf heifer (purch.) £1,400
Cull bull Replacement bull £4,500
£834
£1,160
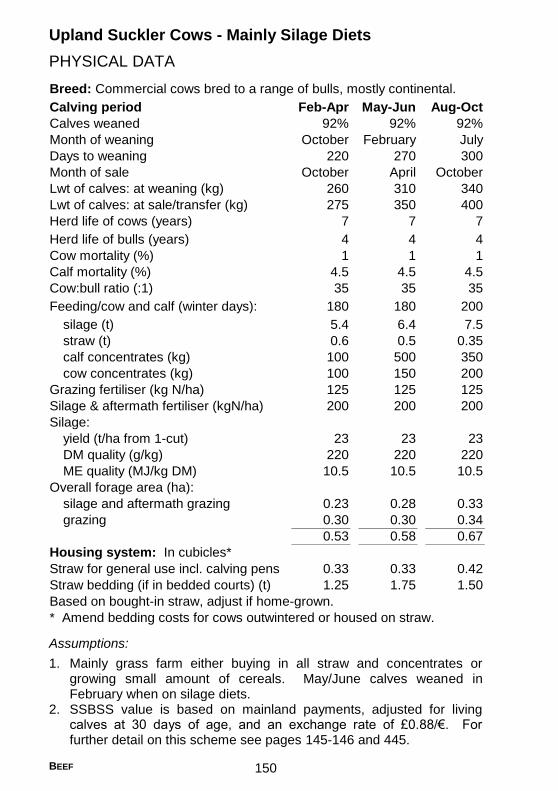
BEEF 150
Upland Suckler Cows - Mainly Silage Diets
PHYSICAL DATA
Breed: Commercial cows bred to a range of bulls, mostly continental.
Calving period Feb-Apr May-Jun Aug-Oct
Calves weaned 92% 92% 92%
Month of weaning October February July
Days to weaning 220 270 300
Month of sale October April October
Lwt of calves: at weaning (kg) 260 310 340
Lwt of calves: at sale/transfer (kg) 275 350 400
Herd life of cows (years) 7 7 7
Herd life of bulls (years) 4 4 4
Cow mortality (%) 1 1 1
Calf mortality (%) 4.5 4.5 4.5
Cow:bull ratio (:1) 35 35 35
Feeding/cow and calf (winter days): 180 180 200
silage (t) 5.4 6.4 7.5
straw (t) 0.6 0.5 0.35
calf concentrates (kg) 100 500 350
cow concentrates (kg) 100 150 200
Grazing fertiliser (kg N/ha) 125 125 125
Silage & aftermath fertiliser (kgN/ha) 200 200 200
Silage:
yield (t/ha from 1-cut) 23 23 23
DM quality (g/kg) 220 220 220
ME quality (MJ/kg DM) 10.5 10.5 10.5
Overall forage area (ha):
silage and aftermath grazing 0.23 0.28 0.33
grazing 0.30 0.30 0.34
0.53 0.58 0.67
Housing system: In cubicles*
Straw for general use incl. calving pens 0.33 0.33 0.42
Straw bedding (if in bedded courts) (t) 1.25 1.75 1.50
Based on bought-in straw, adjust if home-grown.
* Amend bedding costs for cows outwintered or housed on straw.
Assumptions:
1. Mainly grass farm either buying in all straw and concentrates or growing small amount of cereals. May/June calves weaned in February when on silage diets.
2. SSBSS value is based on mainland payments, adjusted for living calves at 30 days of age, and an exchange rate of £0.88/€. For further detail on this scheme see pages 145-146 and 445.

BEEF 151
Upland Suckler Cows - Mainly Silage Diets
GROSS MARGIN DATA
Calving period Feb-Apr May-Jun Aug-Oct
OUTPUT £/cow £/cow £/cow
Calf sales (lwt - 92% crop)
Steers Heifers
290 kg @ 227 p 260 kg @ 222 p 568 - -
370 kg @ 227 p 330 kg @ 222 p - 723 -
420 kg @ 227 p 380 kg @ 222 p - - 827
Scottish Suckler Beef Support Scheme 92 92 92
660 815 919
Less: Replacement - cow 100 100 100
bull 28 28 28
532 687 791
VARIABLE COSTS
Cow concentrates @ £224/t 22 34 45
Calf concentrates @ £218/t 22 109 76
Vet & medicines 32 32 32
Feeding straw @ £95/t (bought-in) 57 48 33
Bedding straw @ £95/t (bought-in) 31 31 40
Commission, haulage, tags & levies 43 49 53
207 303 279
Gross Margin before forage 325 384 512
Forage variable costs:
silage @ £175/ha 41 49 57
grazing @ £135/ha 41 41 46
82 90 103
Total Variable Costs 289 393 382
GROSS MARGIN £/cow 243 294 409
GROSS MARGIN £/ha 455 509 614
Sensitivity-Change ± Change in Gross Margin/head (£)
10 p/kg in lwt sale price 26 33 36
Sale weight ± 10kg 21 21 20
Herd life ± 1 year 20 20 20
Replacement cost prices:
Cull cow In-calf heifer (purch.) £1,700
Cull bull Replacement bull £5,200
£1,074
£1,305

BEEF 152
Lowground Suckler Cows - Mainly Straw Diets
PHYSICAL DATA
Breed: Dairy-beef cross cows bred to range of bulls, mostly continental.
Calving period Feb-Apr May-Jun Aug-Oct
Calves weaned (%) 92% 92% 92%
Month of weaning October December July
Days to weaning 220 200 300
Month of sale October April October
Lwt of calves: at weaning (kg) 260 310 340
Lwt of calves: at sale/transfer (kg) 275 350 395
Herd life of cows (years) 7 7 7
Herd life of bulls (years) 4 4 4
Cow mortality (%) 1 1 1
Calf mortality (%) 4.5 4.5 4.5
Cow:bull ratio (:1) 35 35 35
Feeding/cow and calf (winter days): 190 190 210
silage (t) 1.5 - -
straw (kg) 1,500 2,200 1,300
calf concentrates (kg) 120 550 400
cow concentrates (kg) 500 550 1,100
Grazing fertiliser (kg N/ha) 175 175 175
Silage & aftermath fertiliser (kg N/ha) 175 - -
Silage:
yield (t/ha from 1-cut) 23 23 23
DM quality (g/kg) 220 220 220
ME quality (MJ/kg DM) 10.5 10.5 10.5
Overall forage area (ha):
silage and aftermath grazing 0.07 - -
grazing 0.34 0.38 0.40
0.41 0.38 0.40
Housing system: Straw bedding assumed*
Straw bedding (t) 0.75 1.05 0.90
Based on home-grown straw, adjust if bought-in.
* Amend bedding costs for cows outwintered or housed elsewhere.
Assumptions:
1. Mixed farm growing sufficient grain to cover concentrate and straw feeding/bedding requirements. Only purchasing protein and minerals. May/June calves weaned earlier to reduce cow wintering costs. Small amount of silage made to cover extra grass growth in early season.
2. SSBSS value is based on mainland payments, adjusted for living calves at 30 days of age, and an exchange rate of £0.88/€. For further detail on this scheme see pages 145-146 and 445.

BEEF 153
Lowground Suckler Cows - Mainly Straw Diets
GROSS MARGIN DATA
Calving period Feb-Apr May-Jun Aug-Oct
OUTPUT £/cow £/cow £/cow
Calf sales (lwt - 92% crop)
Steers Heifers
290 kg @ 227 p 260 kg @ 222 p 568 - -
370 kg @ 227 p 330 kg @ 222 p - 723 -
420 kg @ 227 p 370 kg @ 222 p - - 816
Scottish Suckler Beef Support Scheme 92 92 92
660 815 908
Less: Replacement - cow 100 100 100
bull 32 32 32
528 683 776
VARIABLE COSTS
Cow concentrates @ £184/t (home-mix) 92 101 202
Calf concentrates @ £194/t (home-mix) 23 107 78
Feeding straw @ £70/t (home-grown) 105 154 91
Bedding straw @ £70/t (home-grown) 53 74 63
Vet & medicines 32 32 32
Commission, haulage & tags 43 49 52
348 517 518
Gross Margin before forage 180 166 258
Forage variable costs:
silage @ £175/ha 11 - -
grazing @ £174/ha 59 66 70
70 66 70
Total Variable Costs 418 583 588
GROSS MARGIN £/cow 110 100 188
GROSS MARGIN £/ha 272 264 471
Sensitivity-Change ± Change in Gross Margin/head (£)
10 p/kg in lwt sale price 26 33 37
Sale weight ± 10kg 21 21 21
Herd life ± 1 year 20 20 20
Replacement cost prices:
Cull cow In-calf heifer (purch.) £1,700
Cull bull Replacement bull £5,800
£1,074
£1,305

BEEF 154
Spring Calving Cows Producing 18 - 20 Month Finished Cattle
PHYSICAL DATA
Breed: Commercial cows bred to a range of bulls, mostly continental
Steers Heifers
Calving period Feb-Apr Feb-Apr
Calves weaned (%) 92% 92%
Month of weaning October October
Calves sold finished (%) 91% 91%
Sale weight (kg lwt) 607 564
Dead weight (kg dwt) 340 310
Weaning weight (kg lwt) 280 240
Herd life of cows (years) 7 7
Herd life of bulls (years) 4 4
Cow:bull ratio (:1) 35 35
Feeding/cow and calf (winter days):
silage (t) 5.0 5.0
straw bedding (t) 2.0 1.6
calf concentrates (kg) pre-weaning 100 100
cow concentrates (kg) 100 100
Forage area (ha): silage + aftermath 0.16 0.16
grazing 0.30 0.30
Overwintered calves:
Feeding period 180 days, October-April
Liveweight gain (kg) 110 110
Average daily liveweight gain (kg) 0.6 0.6
Feeding: barley/protein/minerals (t) 0.30 0.35
silage (t) 3.5 3.0
Silage area (ha) 0.11 0.10
Finishing cattle:
Feeding period (days): at grass 180 180
housed 60 -
Liveweight gain 217 214
Daily liveweight gain: at grass 0.8 0.8
housed 1.1 -
Feeding: concentrates at grass (t) 0.20 0.25
barley/protein/minerals in house (t) 0.70 -
straw fed in house (t) 0.1 -
Grazing area (ha) 0.23 0.20
Housing system: Straw bedding assumed, home-grown*
* Amend bedding costs for cows outwintered or on slurry systems.
Assumption: SSBSS value as per note on page 152.
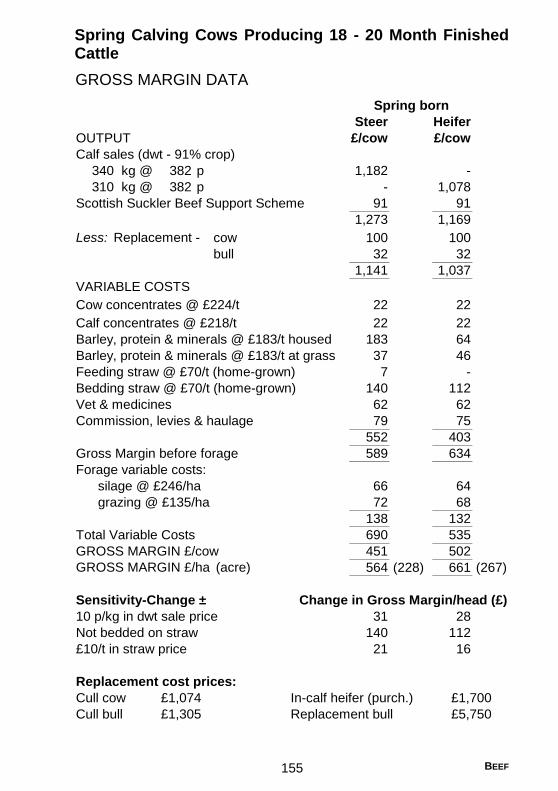
BEEF 155
Spring Calving Cows Producing 18 - 20 Month Finished Cattle
GROSS MARGIN DATA
Steer Heifer
OUTPUT £/cow £/cow
Calf sales (dwt - 91% crop)
340 kg @ 382 p 1,182 -
310 kg @ 382 p - 1,078
Scottish Suckler Beef Support Scheme 91 91
1,273 1,169
Less: Replacement - cow 100 100
bull 32 32
1,141 1,037
VARIABLE COSTS
Cow concentrates @ £224/t 22 22
Calf concentrates @ £218/t 22 22
Barley, protein & minerals @ £183/t housed 183 64
Barley, protein & minerals @ £183/t at grass 37 46
Feeding straw @ £70/t (home-grown) 7 -
Bedding straw @ £70/t (home-grown) 140 112
Vet & medicines 62 62
Commission, levies & haulage 79 75
552 403
Gross Margin before forage 589 634
Forage variable costs:
silage @ £246/ha 66 64
grazing @ £135/ha 72 68
138 132
Total Variable Costs 690 535
GROSS MARGIN £/cow 451 502
GROSS MARGIN £/ha (acre) 564 (228) 661 (267)
Sensitivity-Change ± Change in Gross Margin/head (£)
10 p/kg in dwt sale price 31 28
Not bedded on straw 140 112
£10/t in straw price 21 16
Replacement cost prices:
Cull cow In-calf heifer (purch.)
Cull bull Replacement bull
Spring born
£5,750
£1,700
£1,305
£1,074
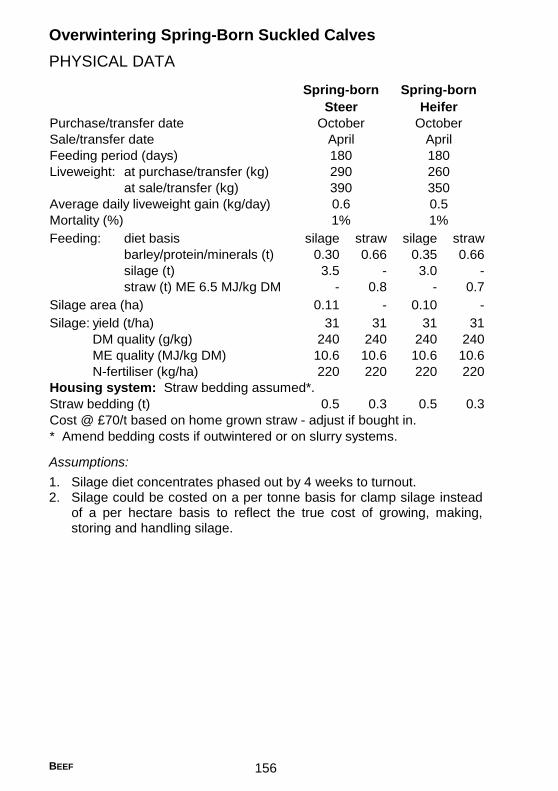
BEEF 156
Overwintering Spring-Born Suckled Calves
PHYSICAL DATA
Purchase/transfer date
Sale/transfer date
Feeding period (days)
Liveweight: at purchase/transfer (kg)
at sale/transfer (kg)
Average daily liveweight gain (kg/day)
Mortality (%)
Feeding: diet basis silage straw silage straw
barley/protein/minerals (t) 0.30 0.66 0.35 0.66
silage (t) 3.5 - 3.0 -
straw (t) ME 6.5 MJ/kg DM - 0.8 - 0.7
Silage area (ha) 0.11 - 0.10 -
Silage: yield (t/ha) 31 31 31 31
DM quality (g/kg) 240 240 240 240
ME quality (MJ/kg DM) 10.6 10.6 10.6 10.6
N-fertiliser (kg/ha) 220 220 220 220
Housing system: Straw bedding assumed*.
Straw bedding (t) 0.5 0.3 0.5 0.3
Cost @ £70/t based on home grown straw - adjust if bought in.
* Amend bedding costs if outwintered or on slurry systems.
October October
Spring-born Spring-born
Steer Heifer
April April
1%
0.6
390
290
180
1%
0.5
350
260
180
Assumptions:
1. Silage diet concentrates phased out by 4 weeks to turnout. 2. Silage could be costed on a per tonne basis for clamp silage instead
of a per hectare basis to reflect the true cost of growing, making, storing and handling silage.

BEEF 157
Overwintering Spring-Born Suckled Calves
GROSS MARGIN DATA
Steer Heifer
OUTPUT £/head £/head
Sale value (lwt - 1% mortality):
390 kg @ 227 p 876 -
350 kg @ 222 p - 769
Less: Weaned calf (lwt):
290 kg @ 227 p 658 -
260 kg @ 222 p - 577
218 192
VARIABLE COSTS
Diet basis silage straw silage straw
Barley, protein & minerals @ £183/t 55 - 64 -
Barley, protein & minerals @ £183/t - 121 - 121
Feeding straw @ £70/t (home-grown) - 56 - 49
Bedding straw @ £70/t (home-grown) 35 21 35 21
Vet & medicines 25 25 25 25
Commission, levies & haulage 44 44 40 40
159 267 164 256
Gross Margin before forage 59 49- 28 64-
Forage variable costs:
silage @ £246/ha 27 - 25 -
Total Variable Costs 186 267 189 256
GROSS MARGIN £/head 32 49- 3 64-
GROSS MARGIN £/ha (acre) 290 (118) - 34 (14) -
Sensitivity-Change ± Change in Gross Margin/head (£)
10 p/kg in lwt sale price 39 39 35 35
10 p/kg in lwt purchase price 29 29 26 26
Not bedded on straw 35 21 35 21
£10/t in straw price 5 11 5 10
Spring-born

BEEF 158
Finishing Spring-Born Suckled Calves Intensively at 12 Months
PHYSICAL DATA
Spring-born
Steer Bull
Purchase/transfer date October October
Sale date April April
Feeding period (days) 180 195
Liveweight: at purchase/transfer (kg lwt) 280 291
at sale (kg lwt) 541 603
Deadweight at sale (kg dwt) 298 338
Average daily liveweight gain (kg/day) 1.45 1.60
Mortality (%) 1.0 1.0
Feeding:
barley/protein/minerals (t) 1.5 1.7
straw (t) ME 6.5 MJ/kg DM 0.3 0.3
Housing system: Straw bedding assumed*.
Straw bedding (t) 0.5 0.5
Based on home-grown straw, adjust if bought-in.
* Amend bedding costs if on slurry based systems.

BEEF 159
Finishing Spring-Born Suckled Calves Intensively at 12 Months
GROSS MARGIN DATA
Steer Bull
OUTPUT £/head £/head
Sale value (dwt - 1% mortality):
298 kg @ 382 p (541 kg lwt) 1,125 -
338 kg @ 373 p (603 kg lwt) - 1,247
Less: Store purchase (lwt):
280 kg @ 227 p 636 -
291 kg @ 207 p - 602
489 645
VARIABLE COSTS
Barley, protein & minerals @ £190/t 285 323
Feeding straw @ £70/t (home-grown) 21 21
Bedding straw @ £70/t (home-grown) 35 35
Vet & medicines 25 25
Commission, levies & haulage 53 56
Total Variable Costs 419 460
GROSS MARGIN £/head 70 185
Sensitivity-Change ± Change in Gross Margin/head (£)
10 p/kg in dwt sale price 30 33
10 p/kg in lwt purchase price 28 29
Not bedded on straw 35 35
£10/t in straw price 8 8

BEEF 160
Finishing Year Old Autumn-Born Suckled Calves at 18 Months
PHYSICAL DATA
Autumn-born
Steer Heifer
Purchase/transfer date October October
Sale date April March
Feeding period (days) 180 165
Liveweight: at purchase/transfer (kg lwt) 420 380
Liveweight: at sale (kg lwt) 607 563
Deadweight at sale (kg dwt) 340 310
Average daily liveweight gain (kg/day) 1.0 1.1
Mortality (%) 1.0 1.0
Feeding:
barley/protein/minerals (t) 0.70 0.61
kg/day 3.9 3.7
silage (t) 4.5 3.8
kg/day 25.1 23.1
Silage area (ha) 0.15 0.12
Silage: yield 31 31
DM quality (g/kg) 240 240
Change in Gross Margin/head (£) ME quality (MJ/kg DM) 10.6 10.6
Silage fertiliser (kg N/ha) 220 220
Housing system: Straw bedding assumed*.
Straw bedding (t) 0.75 0.70
Based on home-grown straw, adjust if bought-in.
* For slatted court omit bedding costs.
Assumptions:
1. Calves from Upland/Lowground Suckler Cows – silage or straw diet. 2. Silage could be costed on a per tonne basis for clamp silage instead
of a per hectare basis to reflect the true cost of growing, making, storing and handling silage.

BEEF 161
Finishing Year Old Autumn-Born Suckled Calves at 18 Months
GROSS MARGIN DATA
Steer Heifer
OUTPUT £/head £/head
Sale value (dwt - 1% mortality):
340 kg @ 382 p (607 kg lwt) 1,286 -
310 kg @ 382 p (563 kg lwt) - 1,172
Less: Weaned calf (lwt):
420 kg @ 227 p 953 -
380 kg @ 222 p - 844
333 328
VARIABLE COSTS
Barley, protein & minerals @ £190/t 133 116
Bedding straw @ £70/t (home-grown) 53 49
Vet & medicines 19 19
Commission, levies & haulage 57 54
262 238
Gross Margin before forage 71 90
Forage variable costs:
silage @ £246/ha 37 30
Total Variable costs 299 268
GROSS MARGIN £/head 34 60
GROSS MARGIN £/ha (acre) 227 (92) 500 (202)
Sensitivity-Change ± Change in Gross Margin/head (£)
10 p/kg in dwt sale price 33 31
10 p/kg in lwt purchase price 42 38
Not bedded on straw 53 49
£10/t in straw price 7 7

BEEF 162
Finishing Year Old Spring-Born Suckled Calves at 18 - 20 Months
PHYSICAL DATA
Spring-born
Yearling steer Yearling heifer
Purchase/transfer date April April
Sale date December October
Feeding period (days): at grass 180 180
housed 60 -
Liveweight: at purchase/transfer (kg lwt) 390 350
at housing (kg lwt) 535 -
at sale (kg lwt) 607 564
Deadweight at sale (kg dwt) 340 310
Average daily lwt gain: at grass (kg/day) 0.8 0.8
housed (kg/day) 1.1 -
Mortality (%) 0.3 0.3
Feeding:
concentrates at grass (t) 0.20 0.25
barley/protein/minerals in house (t) 0.7 -
straw fed in house (t) ME 6.5 MJ/kg DM 0.1 -
Housing system: Straw bedding assumed*
Straw bedding (t)** 0.25 -
Grazing area (ha) 0.23 0.20
Grazing fertiliser (kg N/ha) 175 175
Stocking rate at grass (animals/ha) 4.2 5.0
* Amend bedding costs if on slurry based systems.
** Based on home-grown straw, adjust if bought-in.

BEEF 163
Finishing Year Old Spring-Born Suckled Calves at 18 - 20 Months
GROSS MARGIN DATA
Steer Heifer
OUTPUT £/head £/head
Sale value (dwt - 0.3% mortality):
340 kg @ 382 p (607 kg lwt) 1,295 -
310 kg @ 382 p (564 kg lwt) - 1,181
Less: Yearling calf (lwt):
390 kg @ 227 p 885 -
350 kg @ 222 p - 777
410 404
VARIABLE COSTS
Barley, protein & minerals @ £183/t (at grass) 37 46
Barley, protein & minerals @ £183/t (housed) 128 -
Feeding straw @ £70/t (home-grown) 7 -
Bedding straw @ £70/t (home-grown) 18 -
Vet & medicines 15 15
Commission, levies & haulage 57 54
262 115
Gross Margin before forage 148 289
Forage variable costs:
grazing @ £174/ha 40 35
Total Variable costs 302 150
GROSS MARGIN £/head 108 254
GROSS MARGIN £/ha (acre) 470 (190) 1,270 (514)
Sensitivity-Change ± Change in Gross Margin/head (£)
10 p/kg in dwt sale price 34 31
10 p/kg in lwt purchase price 39 35
Not bedded on straw 18 -
£10/t in straw price 3 -

BEEF 164
Beef Cattle Summer Finishing
PHYSICAL DATA
Steer Heifer
Liveweight at purchase (kg) 450 420
Liveweight at slaughter (kg lwt) 586 564
(kg dwt) 340 310
Cattle bought mid-April mid-April
Cattle sold mid-September mid-September
Finishing period (days) 150 150
Liveweight gain (kg) 136 144
Daily liveweight gain (kg) 0.9 1.0
Supplementary feed:
barley, proteins & minerals (kg) 308 250
Grazing area (ha) 0.23 0.20
Grazing fertiliser N (kg/ha) 175 175
Feed levels per day:
first 8 weeks (kg) 0 0
next 6 weeks (kg) 3 2
next 4 weeks (kg) 4 3
last 2 weeks* (kg) 5 4
* Feed at this level to finish by mid-September. Many will house by this time if finishing later.
Assumptions:
In practice, a proportion of the following cattle may be sold as forward stores or housed for autumn finishing at heavier weights. If so, additional concentrate feeding will be required.

BEEF 165
Beef Cattle Summer Finishing
GROSS MARGIN DATA
Steer Heifer
OUTPUT £/head £/head
Sale value (dwt):
340 kg @ 382 p (586 kg lwt) 1,299 -
310 kg @ 382 p (564 kg lwt) - 1,184
Less: Purchased store calf in April (lwt):
450 kg @ 227 p 1,022
420 kg @ 222 p - 932
277 252
VARIABLE COSTS
Barley, protein & minerals @ £183/t 56 46
Vet & medicines 15 15
Commission, levies & haulage 57 54
128 115
Gross Margin before forage 149 137
Forage variable costs:
grazing @ £174/ha 40 35
Total Variable costs 168 150
GROSS MARGIN £/head 109 102
GROSS MARGIN £/ha (acre) 474 (192) 510 (206)
Sensitivity-Change ± Change in Gross Margin/head (£)
10 p/kg in dwt sale price 34 31
10 p/kg in lwt purchase price 45 42

BEEF 166
Calf Rearing Costs to 3 Months
PHYSICAL DATA
Bucket fed Ad-lib fed
Liveweight (kg): at birth 40 40
at sale, 3 months 110 115
Liveweight gain (kg/day) 0.78 0.83
Feeding period (days) 90 90
Mortality (%) 5 4
kg kg
Feeding*: Milk substitute 28 42
Calf concentrates 160 150
Hay 35 30
Bedding (straw) 0.2 0.2
* Homebred calves receive colostrum followed by whole milk up to 10 days of age.
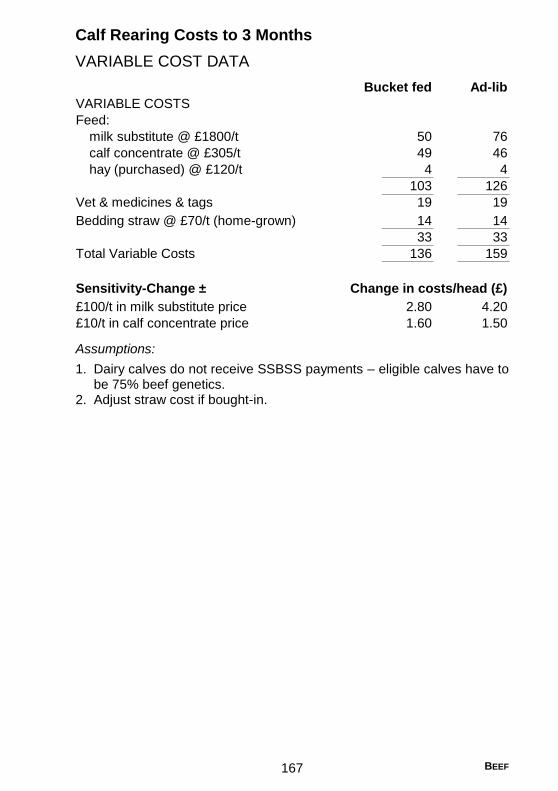
BEEF 167
Calf Rearing Costs to 3 Months
VARIABLE COST DATA
Bucket fed Ad-lib
VARIABLE COSTS
Feed:
milk substitute @ £1800/t 50 76
calf concentrate @ £305/t 49 46
hay (purchased) @ £120/t 4 4
103 126
Vet & medicines & tags 19 19
Bedding straw @ £70/t (home-grown) 14 14
33 33
Total Variable Costs 136 159
Sensitivity-Change ± Change in costs/head (£)
£100/t in milk substitute price 2.80 4.20
£10/t in calf concentrate price 1.60 1.50
Assumptions:
1. Dairy calves do not receive SSBSS payments – eligible calves have to be 75% beef genetics.
2. Adjust straw cost if bought-in.

BEEF 168
Intensive Finishing of Dairy Bred Bulls
PHYSICAL DATA
Holstein Continental
Breed Cross
Liveweight at start (kg) 110 120
Feeding period (days) 290 300
Liveweight at slaughter (kg lwt) 500 545
Deadweight at slaughter (kg dwt) 265 300
Killing out percentage (%) 53 55
Overall daily liveweight gain (kg/day) 1.3 1.4
Mortality (%) 3 3
Feeding 1:
110-120 kg liveweight/purchase to slaughter:
concentrates (barley/protein/minerals) (t) 2.15 2.30
straw (t) 0.4 0.4
Housing system: Straw bedding assumed 2.
Straw bedding 3 (t) 0.6 0.6
1
For home bred calves see ‘Calf rearing costs to 3 months’ (pages 166-167) for cost of feeding to 12-14 weeks (or 110-115kg lwt).
2 If housed on slurry based systems omit bedding costs. 3 Adjust straw cost if bought-in.

BEEF 169
Intensive Finishing of Dairy Bred Bulls
GROSS MARGIN DATA
Holstein Continental
Cross
OUTPUT £/head £/head
Sale value (dwt - adj 3% mortality):
265 kg @ 319 p 820 -
300 kg @ 357 p - 1,039
Less: Calf purchase (3 months):
@ £220 220 -
@ £320 - 320
600 719
VARIABLE COSTS
Concentrates @ £190/t 409 437
Feeding straw @ £70/t (home-grown) 28 28
Bedding straw @ £70/t (home-grown) 42 42
Vet & medicines 15 15
Commission, haulage & levies, etc. 45 51
Total Variable costs 539 573
GROSS MARGIN £/head 61 146
Sensitivity-Change ± Change in Gross Margin/head (£)
£10/t in concentrate price 21 23
10 p/kg in dwt sale price 26 29

BEEF 170
Forage Based Finishing Dairy Steers at 24 Months
PHYSICAL DATA
Holstein Continental
Breed Cross
Liveweight at start (kg) 1
110 125
Feeding period (days) 659 659
Liveweight at slaughter (kg lwt) 618 632
Deadweight at slaughter (kg dwt) 315 335
Killing out percentage (%) 51 53
Overall daily liveweight gain (kg/day) 0.8 0.8
Mortality (%) 3 3
Feeding:
110-125 kg liveweight/purchase to slaughter:
concentrates (2nd stage calf mix) (t) 0.15 0.15
concentrates (barley/protein/minerals) (t) 0.59 0.68
silage (t) - over two housing periods 6.0 6.4
Grazing area - over two summers (ha) 0.42 0.42
Silage area - for two housing periods (ha) 0.30 0.32
Silage: yield 20 20
DM quality (g/kg) 240 240
ME quality (MJ/kg DM) 10.6 10.6
Silage fertiliser (kg N/ha) 125 125
Housing system: Straw bedding assumed 2.
Straw bedding 3 (t) 1.2 1.2
1
For home bred calves see ‘Calf rearing costs to 3 months’ (pages 166-167) for cost of feeding to 12-14 weeks (or 110-115kg lwt).
2 If housed on slurry based systems omit bedding costs. 3 Adjust straw cost if bought-in.

BEEF 171
Forage Based Finishing Dairy Steers at 24 Months
GROSS MARGIN DATA
Holstein Continental
Cross 3
OUTPUT £/head £/head
Sale value (dwt - adj 3% mortality):
315 kg @ 357 p 1,091 -
335 kg @ 369 p - 1,199
Less: Calf purchase :
@ £220 220 -
@ £320 - 320
871 879
VARIABLE COSTS
Concentrate calf mix @ £250/t 29 29
Concentrate barley blend @ £190/t 112 129
Bedding straw @ £70/t (home grown) 84 84
Vet & medicines 30 30
Commission, haulage & levies, etc. 52 55
Total Variable costs 307 327
Gross Margin before forage 564 552
Forage variable costs:
silage @ £175/ha 53 56
grazing @ £135/ha 57 57
110 113
Total Variable costs 417 440
GROSS MARGIN £/head 1
454 439
GROSS MARGIN £/ha (acre) 2
315 (127) 297 (120)
Sensitivity-Change ± Change in Gross Margin/head (£)
£10/t in concentrate price 6 7
10 p/kg in dwt sale price 30 33
1 Unlike other beef finishing enterprises featured in the Farm Management Handbook, spanning over two years effectively incurs double the fixed cost share, which is not included above.
2
This enterprise produces a strong gross margin per head but the extensive nature of this enterprise dilutes its return per hectare.
3
The higher sales value of a continental-cross steer is majorly offset by the higher calf purchase price.


Sheep

SHEEP 174
Introduction
Markets and price drivers The UK is unique in the EU, being a significant sheep meat producer and exporter. It is one of the largest sheep meat producers in the world and both the third largest exporter and importer. The UK exported over 28% of sheep meat produced (2017), but imported 25% to complement seasonality of supply, price and carcass balance issues. The scale of exports particularly through peak season (Sep-Dec) makes trade links, export demand, and exchange rate competitiveness highly important.
Lamb can be a comparatively expensive protein on the retail shelf, therefore, the extent and duration of retail price promotions is a major driver of domestic consumption. The producer price is also significantly influenced by seasonality of supply as shown in the chart below.
Being predominantly finished off grass or forage crops means there is a strong relationship between the weather, grass growth and lamb supply. Producer price is also influenced by imports, principally from New Zealand. The NZ flock was in decline as greater land area had been committed to dairying, but it has since stabilised with smaller annual variation in lamb production now due to inclement weather. China is an increasingly significant market for NZ lamb. Historic trade links and being a high value market, however, mean GB remains a major customer. Recent years have shown that the timing of imported lamb onto GB retail shelves rather than the volume of imports having the biggest influence on the GB lamb and hogget trade.
Marketing Prime lamb sales are almost entirely reliant on the spot market. Since it is a seasonal product, the timing of sales has a large influence on price. As highlighted in the above chart, the GB deadweight prime lamb price fluctuates greatly within a season. The festival of Ramadan is an increasingly important marketing date, although difficult to target as it
SHEEP 175
moves forward 10 days each year. Old season lamb tends to recover value heading towards the Easter market. The cost, however, associated with growing a lamb for the early market or delaying sale until the price rises again in early spring must also be taken into account.
The auction market accounted for 57% of sheep sales across the UK (2017). Similar to the cattle market, the live auction system provides an important service. It is a mechanism that brings together sheep and customers to establish a transparent price.
The most common method to spread risk, when selling at livestock auctions, is to target multiple sales per year. The future price may be influenced by gaining feedback from buyers and acting on that information. Similarly, when selling direct to processors, an improved price may be achieved if a large number of in-specification lambs can be delivered at pre-arranged times, known in advance.
Supermarket specification lamb accounts for the majority of domestic sales, however, a butcher’s lamb is also a sizeable market (c. 10%). Exports include the heavy lamb trade to northern European countries, particularly France, which accounts for half of all exports. The Euro lamb market, predominantly to southern Mediterranean countries, is a small but key outlet for light hill lamb. While it remains important, this route has been curtailed by recession and availability of cheaper lamb imports.
Technical performance Sheep enterprise margins are inevitably sensitive to the sales price. However, there is limited opportunity to influence the overall market and greater potential exists through improving output per hectare and cost control.
Top performing flocks consistently rear more lambs, sell more finished (if they are on the right land type) and use less purchased feed. Grassland management is also better. Whilst fixed costs on these top performing farms may be lower they are also spread over more kilos of lamb sold (higher output).
Budgeted ewe gross margins per head across different systems for 2018/19 are expected to be similar or higher in the year provided a similar exchange rate and level of performance. The reality is that lambs reared percentage will be lower for many systems due to a difficult winter and spring. Lamb supply to market is also likely to be delayed.
Subsidies and support The Scottish Upland Sheep Support Scheme (SUSSS) is a coupled support payment for sheep to provide additional support to producers on LFASS category A land. The payment rate is estimated at €100/ewe hogg annually but actual payment rates will be determined by the number of hogg applications each year. The full payment is made in the Summer following the year when the claim is made. This support has not been
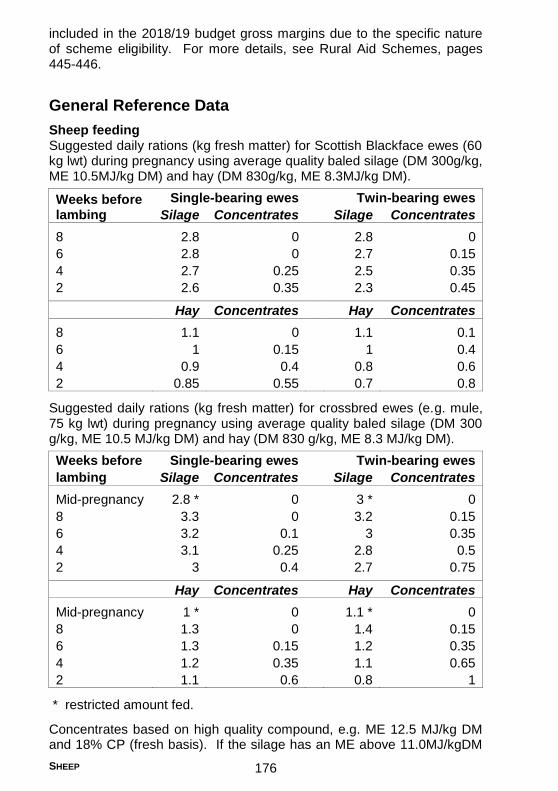
SHEEP 176
included in the 2018/19 budget gross margins due to the specific nature of scheme eligibility. For more details, see Rural Aid Schemes, pages 445-446.
General Reference Data
Sheep feeding Suggested daily rations (kg fresh matter) for Scottish Blackface ewes (60 kg lwt) during pregnancy using average quality baled silage (DM 300g/kg, ME 10.5MJ/kg DM) and hay (DM 830g/kg, ME 8.3MJ/kg DM).
Weeks before lambing
Single-bearing ewes Twin-bearing ewes
Silage Concentrates Silage Concentrates
8 2.8 0 2.8 0
6 2.8 0 2.7 0.15
4 2.7 0.25 2.5 0.35
2 2.6 0.35 2.3 0.45
Hay Concentrates Hay Concentrates
8 1.1 0 1.1 0.1
6 1 0.15 1 0.4
4 0.9 0.4 0.8 0.6
2 0.85 0.55 0.7 0.8
Suggested daily rations (kg fresh matter) for crossbred ewes (e.g. mule, 75 kg lwt) during pregnancy using average quality baled silage (DM 300 g/kg, ME 10.5 MJ/kg DM) and hay (DM 830 g/kg, ME 8.3 MJ/kg DM).
Weeks before Single-bearing ewes Twin-bearing ewes
lambing Silage Concentrates Silage Concentrates
Mid-pregnancy 2.8 * 0 3 * 0
8 3.3 0 3.2 0.15
6 3.2 0.1 3 0.35
4 3.1 0.25 2.8 0.5
2 3 0.4 2.7 0.75
Hay Concentrates Hay Concentrates
Mid-pregnancy 1 * 0 1.1 * 0
8 1.3 0 1.4 0.15
6 1.3 0.15 1.2 0.35
4 1.2 0.35 1.1 0.65
2 1.1 0.6 0.8 1
* restricted amount fed.
Concentrates based on high quality compound, e.g. ME 12.5 MJ/kg DM and 18% CP (fresh basis). If the silage has an ME above 11.0MJ/kgDM

SHEEP 177
and CP above 11% then research has shown that supplementation with soya at 100g/hd/day per lamb carried for 3-4 weeks pre lambing can replace conventional compound feeds (mineral supplementation will also be required). Alternatives to hi-pro soya are treated soya products that can be fed at half the above rate, as they contain higher levels of Digestible Undegradable Protein.
Wool The total payment made to producers on receipt of their 2018 clip includes the balancing payment due from 2017 plus the advance payment for 2018. The balancing payment made to producers for their 2017 clip is based on the final average price achieved at auction for the 2017 season less the advance payment already made, after deducting the handling costs for the 2017 clip.
The 2017 clip average values ranged from £0.30/kg (Mountain wool) up to £3.61/kg (Lustre wool).
Deductions for haulage and handling depend on the point of delivery. For wool picked up by a haulier, or delivered by the producer to a haulier’s premises or authorised collection centre, charges are as follows:
2,000 kg or over: A charge of £5.40 per approved container.
501 to 1,999 kg: A charge of £7.45 per approved container.
Under 500 kg: A charge of £10.80 per approved container.
A charge of £5.15 per approved container will apply when a producer delivers to a haulier’s premises or authorised Collection Centre. There is no carriage recharge made to producers who deliver their wool direct to their authorised grading depot. The carriage charge (if applicable) is divided between the ‘advance’ and the ‘balance’ payments.
For more details of wool prices, charges, collection centres and grading depots, please contact the BWMB (www.britishwool.org.uk).
Development of wool shedding breeds With the development of wool shedding breeds labour and shearing costs can be reduced. Wool shedding breeds can be looked at once per day and flystrike incidence is greatly reduced although normal protection against ectoparasites is still recommended. Dagging is eliminated and tailing is not required. Potential savings in protein and energy requirements may exist but are hard to quantify. Wool contamination of pastures is not an issue but fences do get covered in shed wool. Shearing costs are largely eliminated after 9 years of repeated crossing to wool shedding breeds. There is enough wool for insulation from upland and hill weather conditions but there is some evidence that they are less willing to lie down on wet ground and thus less suitable to finishing/wintering on stubble turnips.
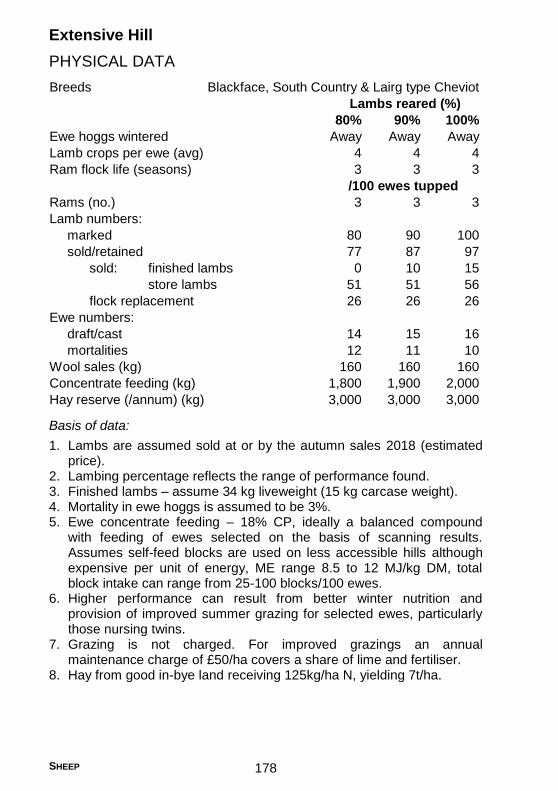
SHEEP 178
Extensive Hill
PHYSICAL DATA
Breeds Blackface, South Country & Lairg type Cheviot
80% 90% 100%
Ewe hoggs wintered Away Away Away
Lamb crops per ewe (avg) 4 4 4
Ram flock life (seasons) 3 3 3
Rams (no.) 3 3 3
Lamb numbers:
marked 80 90 100
sold/retained 77 87 97
sold: finished lambs 0 10 15
store lambs 51 51 56
flock replacement 26 26 26
Ewe numbers:
draft/cast 14 15 16
mortalities 12 11 10
Wool sales (kg) 160 160 160
Concentrate feeding (kg) 1,800 1,900 2,000
Hay reserve (/annum) (kg) 3,000 3,000 3,000
/100 ewes tupped
Lambs reared (%)
Basis of data:
1. Lambs are assumed sold at or by the autumn sales 2018 (estimated price).
2. Lambing percentage reflects the range of performance found. 3. Finished lambs – assume 34 kg liveweight (15 kg carcase weight). 4. Mortality in ewe hoggs is assumed to be 3%. 5. Ewe concentrate feeding – 18% CP, ideally a balanced compound
with feeding of ewes selected on the basis of scanning results. Assumes self-feed blocks are used on less accessible hills although expensive per unit of energy, ME range 8.5 to 12 MJ/kg DM, total block intake can range from 25-100 blocks/100 ewes.
6. Higher performance can result from better winter nutrition and provision of improved summer grazing for selected ewes, particularly those nursing twins.
7. Grazing is not charged. For improved grazings an annual maintenance charge of £50/ha covers a share of lime and fertiliser.
8. Hay from good in-bye land receiving 125kg/ha N, yielding 7t/ha.
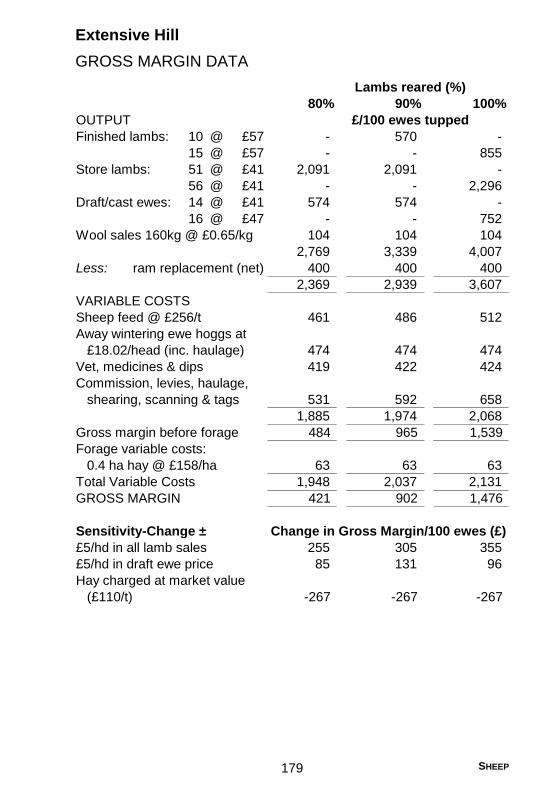
SHEEP 179
Extensive Hill
GROSS MARGIN DATA
Blackface, South Country & Lairg type Cheviot
80% 90% 100%
OUTPUT
Finished lambs: 10 @ £57 - 570 -
15 @ £57 - - 855
Store lambs: 51 @ £41 2,091 2,091 -
56 @ £41 - - 2,296
Draft/cast ewes: 14 @ £41 574 574 -
16 @ £47 - - 752
Wool sales 160kg @ £0.65/kg 104 104 104
2,769 3,339 4,007
Less: ram replacement (net) 400 400 400
2,369 2,939 3,607
VARIABLE COSTS
Sheep feed @ £256/t 461 486 512
Away wintering ewe hoggs at
£18.02/head (inc. haulage) 474 474 474
Vet, medicines & dips 419 422 424
Commission, levies, haulage,
shearing, scanning & tags 531 592 658
1,885 1,974 2,068
Gross margin before forage 484 965 1,539
Forage variable costs:
0.4 ha hay @ £158/ha 63 63 63
Total Variable Costs 1,948 2,037 2,131
GROSS MARGIN 421 902 1,476
Sensitivity-Change ± Change in Gross Margin/100 ewes (£)
£5/hd in all lamb sales 255 305 355
£5/hd in draft ewe price 85 131 96
Hay charged at market value
(£110/t) -267 -267 -267
Lambs reared (%)
£/100 ewes tupped
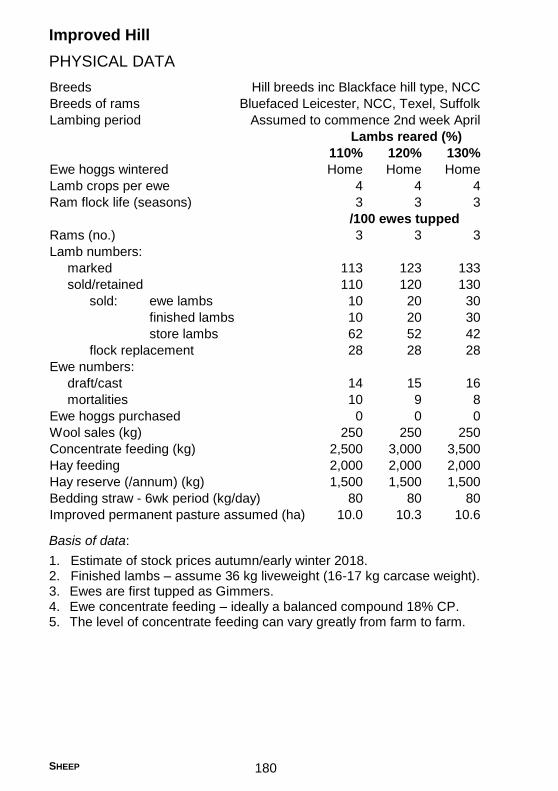
SHEEP 180
Improved Hill
PHYSICAL DATA
Breeds Hill breeds inc Blackface hill type, NCC
Breeds of rams Bluefaced Leicester, NCC, Texel, Suffolk
Lambing period Assumed to commence 2nd week April
110% 120% 130%
Ewe hoggs wintered Home Home Home
Lamb crops per ewe 4 4 4
Ram flock life (seasons) 3 3 3
Rams (no.) 3 3 3
Lamb numbers:
marked 113 123 133
sold/retained 110 120 130
sold: ewe lambs 10 20 30
finished lambs 10 20 30
store lambs 62 52 42
flock replacement 28 28 28
Ewe numbers:
draft/cast 14 15 16
mortalities 10 9 8
Ewe hoggs purchased 0 0 0
Wool sales (kg) 250 250 250
Concentrate feeding (kg) 2,500 3,000 3,500
Hay feeding 2,000 2,000 2,000
Hay reserve (/annum) (kg) 1,500 1,500 1,500
Bedding straw - 6wk period (kg/day) 80 80 80
Improved permanent pasture assumed (ha) 10.0 10.3 10.6
Lambs reared (%)
/100 ewes tupped
Basis of data:
1. Estimate of stock prices autumn/early winter 2018. 2. Finished lambs – assume 36 kg liveweight (16-17 kg carcase weight). 3. Ewes are first tupped as Gimmers. 4. Ewe concentrate feeding – ideally a balanced compound 18% CP. 5. The level of concentrate feeding can vary greatly from farm to farm.

SHEEP 181
Improved Hill
GROSS MARGIN DATA
Hill breeds inc Blackface hill type, NCC
Bluefaced Leicester, NCC, Texel, Suffolk 110% 120% 130%
OUTPUT
Ewe lambs: 10 @ £76 760 - -
20 @ £76 - 1,520 -
30 @ £76 - - 2,280
Finished lambs: 10 @ £64 (36kg lwt) 640 - -
20 @ £64 - 1,280 -
30 @ £64 - - 1,920
Store lambs: 62 @ £46 2,852 - -
52 @ £46 - 2,392 -
42 @ £46 - - 1,932
Draft/cast ewes: 14 @ £58 812 812 812
Wool sales 250kg @ £0.65/kg 163 163 163
5,227 6,167 7,107
Less: ram replacement (net) 450 450 450
4,777 5,717 6,657
VARIABLE COSTS
Sheep feed @ £256/t 640 768 896
Vet, medicines & dips 572 581 589
Bedding straw @ £95/t (bought-in) 319 319 319
Commission, levies, haulage, shearing,
scanning & tags 738 813 890
2,269 2,481 2,694
Gross margin before forage 2,508 3,236 3,963
Forage variable costs:
0.5 ha hay @ £158/ha 79 79 79
improved permanent pasture @ £135/ha 1,350 1,391 1,431
1,429 1,470 1,510
Total Variable Costs 3,698 3,951 4,204
GROSS MARGIN 1,079 1,766 2,453
GROSS MARGIN per forage ha 108 171 231
Sensitivity-Change ± Change in Gross Margin/100 ewes (£)
10 p/kg lwt in finished lamb price 35 69 104
£5/hd in all lamb sales 410 460 510
£5/hd in cast ewe price 70 70 70
30% in pasture utilisation 405 417 429
Lambs reared (%)
£/100 ewes tupped

SHEEP 182
Draft Blackface Ewes
PHYSICAL DATA
Breeds Draft Blackface to a terminal or crossing sire
Lambing period Commencing mid-March
130% 140% 150%
Ewe flock life (seasons) 1.5 1.5 1.5
Ram flock life (seasons) 3 3 3
Rams (no.) 2.5 2.5 2.5
Lamb numbers:
marked 133 143 153
sold/retained 130 140 150
sold: store 32 27 22
finished 65 70 75
breeding 33 43 53
Ewe numbers:
sales 64 64 64
mortalities 3 3 3
purchased 67 67 67
Wool sales (kg) 250 250 250
Concentrate use:
Ewe concentrate: ME 12.5 MJ/kg,
18% CP (kg) 3,500 4,000 4,500
Forage: hay - 12,600 kg and
aftermath grazing (ha) 1.8 1.8 1.8
grazing (ha) 8.0 8.3 8.6
Total forage (ha) 9.8 10.1 10.4
Bedding straw (kg/day) 80 80 80
Lambs reared (%)
/100 ewes tupped
Basis of data:
1. Estimated breeding stock prices, autumn 2018. 2. Estimate of finished and store lamb prices, summer and autumn 2018. 3. Hay yield and quality 7 t/ha; ME 8.5 MJ/kg DM. 4. Hay and aftermath grazing fertiliser level 125 kg N/ha; grazing fertiliser
level 125 kg N/ha. 5. Liveweight of lambs at sale: 36 kg, 32 kg store or sold as ewe lambs
for breeding. 6. Straw bedding based on 80 kg/day for 100 ewes housed over a 6
week lambing period.

SHEEP 183
Draft Blackface Ewes
GROSS MARGIN DATA
Draft Blackface to a terminal or crossing sire
Commencing mid-March 130% 140% 150%
OUTPUT
Ewe lambs: 33 @ £85 2,805 - -
43 @ £85 - 3,655 -
53 @ £85 - - 4,505
Finished lambs: 32 @ £64 (36 kg lwt) 2,048 - -
27 @ £64 (36 kg lwt) - 1,728 -
22 @ £64 (36 kg lwt) - - 1,408
Store lambs: 65 @ £46 2,990 - -
70 @ £46 - 3,220 -
75 @ £46 - - 3,450
Cast ewes: 64 @ £47 3,008 3,008 3,008
Wool sales 250kg @ £0.65/kg 163 163 163
11,014 11,774 12,534
Less: ewes purchased - 67 @ £66 4,422 4,422 4,422
ram replacement (net) 375 583 583
6,217 6,769 7,529
VARIABLE COSTS
Ewe concentrate @ £256/t 896 1,024 1,152
Vet, medicines & dips 609 618 626
Bedding straw @ £95/t (bought-in) 319 319 319
Commission, levies, haulage,
shearing, scanning & tags 1,268 1,329 1,391
3,092 3,290 3,488
Gross margin before forage 3,125 3,479 4,041
Forage variable costs:
hay @ £158/ha 284 284 284
grazing @ £135/ha 1,080 1,121 1,161
Total Variable Costs 4,456 4,695 4,933
GROSS MARGIN 1,761 2,074 2,596
GROSS MARGIN per forage ha 180 205 250
Sensitivity-Change ± Change in Gross Margin/100 ewes (£)
10 p/kg lwt in finished lamb price 111 93 76
£5/hd in store lamb price 325 350 375
£5/hd in breeding stock value 165 215 265
£5/hd in cast ewe price 320 320 320
£5/hd in ewe purchase price 335 335 335
30% in pasture utilisation 324 336 348
£/100 ewes tupped
Lambs reared (%)

SHEEP 184
Crossbred Ewes
PHYSICAL DATA
Breeds Large crossbred (75-85kg) e.g. Scotch Mule, Mule-cross
Breed of ram Terminal Sire
Lambing period Commencing early April
Lambing period 150% 160% 170%
Lamb crops per ewe (avg) 4.5 4.5 4.5
Ram flock life (seasons) 3 3 3
Rams (no.) 2.5 2.5 2.5
Lamb numbers:
marked 152 162 172
sold/retained 150 160 170
sold: finished lambs 120 140 160
store lambs 30 20 10
Ewe numbers:
culls 17 17 17
mortalities 5 5 5
gimmers purchased 22 22 22
Wool sales - ewes, rams & hoggs (kg) 270 270 270
Ewe concentrate: ME 12.5 MJ/kg DM, 4,500 5,000 5,500
18% CP (kg)
Forage: improved grazing (ha) 10.0 10.0 10.0
silage (ha) 2 2 2
Total forage (ha) 12 12 12
Bedding straw (kg/day) 80 80 80
/100 ewes tupped
Lambs reared (%)
Basis of data:
1. Estimates of gimmer prices 2017, finished and store lamb and cast ewe prices 2018. Finished lambs at 42 kg, store 34 kg.
2. Silage once cut, 20 t/ha, 125 kg/ha N. 3. Concentrate use increases with increasing scanning percentage. 4. Bedding straw based on 80 kg/day for 100 ewes housed over a 6
week lambing period. 5. Modern rams are capable of running at 80/100:1 in lowland flocks,
stocked tightly.

SHEEP 185
Crossbred Ewes
GROSS MARGIN DATA
OUTPUT
Terminal Sire 150% 160% 170%
Commencing early April
Finished lambs: 120 @ £77 (42kg lwt) 9,240 - -
140 @ £77 - 10,780 -
160 @ £77 - - 12,320
Store lambs: 30 @ £57 1,710 - -
20 @ £57 - 1,140 -
10 @ £57 - - 570
Cast ewes: 17 @ £78 1,326 1,326 1,326
Wool sales 270kg @ £0.85/kg 230 230 230
12,506 13,476 14,446
Less: gimmers purchased - 22 @ £118 2,596 2,596 2,596
ram replacement (net) 542 542 542
9,368 10,338 11,308
VARIABLE COSTS
Ewe concentrate @ £256/t 1,152 1,280 1,408
Vet, medicines & dips 686 694 703
Bedding straw @ £95/t (bought-in) 319 319 319
Commission, levies, haulage, 1,228 1,298 1,367
shearing, scanning & tags
3,385 3,591 3,797
Gross margin before forage 5,983 6,747 7,511
Forage variable costs:
silage @ £175/ha 350 350 350
grazing @ £135/ha 1,350 1,350 1,350
Total Variable Costs 5,085 5,291 5,497
GROSS MARGIN 4,283 5,047 5,811
GROSS MARGIN per forage ha 357 421 484
Sensitivity-Change ± Change in Gross Margin/100 ewes (£)
10 p/kg lwt in finished lamb price 484 564 645
£5/hd in all lamb sales 750 800 850
£5/hd in cast ewe price 85 85 85
£5/hd in gimmer price 110 110 110
30% in pasture utilisation 405 405 405
Lambs reared (%)
£/100 ewes tupped

SHEEP 186
Pure Bred Flock
PHYSICAL DATA
Breeds Mid-sized (60-65kg) e.g. Lleyn, Romney
Lambing period March-April
150% 160% 170%
Lamb crops per ewe 4.5 4.5 4.5
Ram flock life (seasons) 3 3 3
Rams (no.) 2.5 2.5 2.5
Lamb numbers:
marked 152 162 172
sold/retained 150 160 170
sales: ewe lambs 25 35 45
finished lambs 75 85 95
store lambs 28 18 8
flock replacements 22 22 22
Ewe numbers:
culls 18 18 18
mortalities 4 4 4
gimmers purchased - - -
Wool sales (kg) 270 270 270
Ewe concentrate: ME 12.5 MJ/kg, 4,500 5,000 5,500
18%CP (kg)
Forage: grazing (ha) 8.5 8.8 9.1
silage (ha) 1.7 1.7 1.7
Total forage (ha) 10 11 11
Bedding straw (kg/day) 80 80 80
Lambs reared (%)
/100 ewes tupped
Basis of data:
1. Estimate of ewe lamb, finished and store lamb prices, cast ewe prices, summer and autumn 2018.
2. Silage at 0.4 t/ewe; silage once cut, 20 t/ha, 125 kg/ha N. 3. For wool sales, add 200kg for Romneys. 4. Finished lambs liveweight at sale, 38 kg, store lambs 32 kg. 5. Bedding straw based on 80 kg/day for 100 ewes housed over a 6
week period. This can be deducted if no housing required. 6. Modern rams are capable of running at 80/100:1 in lowland flocks,
stocked tightly.
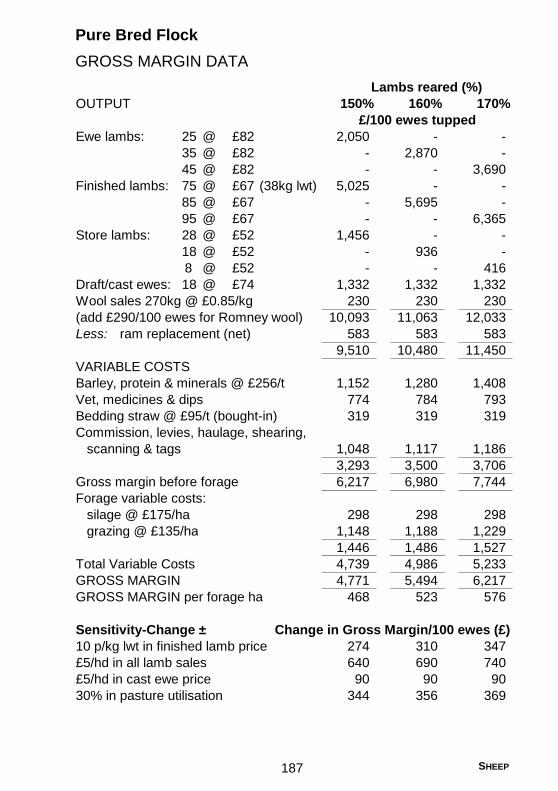
SHEEP 187
Pure Bred Flock
GROSS MARGIN DATA
Mid-sized (60-65kg) e.g. Lleyn, Romney
OUTPUT 150% 160% 170%
Ewe lambs: 25 @ £82 2,050 - -
35 @ £82 - 2,870 -
45 @ £82 - - 3,690
Finished lambs: 75 @ £67 (38kg lwt) 5,025 - -
85 @ £67 - 5,695 -
95 @ £67 - - 6,365
Store lambs: 28 @ £52 1,456 - -
18 @ £52 - 936 -
8 @ £52 - - 416
Draft/cast ewes: 18 @ £74 1,332 1,332 1,332
Wool sales 270kg @ £0.85/kg 230 230 230
(add £290/100 ewes for Romney wool) 10,093 11,063 12,033
Less: ram replacement (net) 583 583 583
9,510 10,480 11,450
VARIABLE COSTS
Barley, protein & minerals @ £256/t 1,152 1,280 1,408
Vet, medicines & dips 774 784 793
Bedding straw @ £95/t (bought-in) 319 319 319
Commission, levies, haulage, shearing,
scanning & tags 1,048 1,117 1,186
3,293 3,500 3,706
Gross margin before forage 6,217 6,980 7,744
Forage variable costs:
silage @ £175/ha 298 298 298
grazing @ £135/ha 1,148 1,188 1,229
1,446 1,486 1,527
Total Variable Costs 4,739 4,986 5,233
GROSS MARGIN 4,771 5,494 6,217
GROSS MARGIN per forage ha 468 523 576
Sensitivity-Change ± Change in Gross Margin/100 ewes (£)
10 p/kg lwt in finished lamb price 274 310 347
£5/hd in all lamb sales 640 690 740
£5/hd in cast ewe price 90 90 90
30% in pasture utilisation 344 356 369
Lambs reared (%)
£/100 ewes tupped

SHEEP 188
Early Finished Lamb Production
PHYSICAL DATA
Breeds Suffolk/Continental cross ewe to terminal sire
Lambing period Mid-December to end January
140% 150% 160%
Lamb crops per ewe (avg) 5 5 5
Ram flock life (seasons) 3 3 3
Rams (no.) 2.5 2.5 2.5
Lamb numbers:
marked 143 153 163
sold finished 140 150 160
Lamb liveweight at slaughter (kg) 40 40 40
Lamb deadweight at slaughter (kg) 19 19 19
Ewe numbers:
culls 18 18 18
mortalities 4 4 4
gimmers purchased 26 26 26
Wool sales - ewes, rams & hoggs (kg) 270 270 270
Concentrate use:
ewe concentrate: ME 12.5 MJ/kg, 6,000 6,500 7,000
18% CP (kg)
lamb concentrate (kg) 3,000 3,750 4,000
Total concentrate (kg) 9,000 10,250 11,000
Forage: hay and aftermath grazing (ha) 1.8 1.8 1.8
grazing (ha) 5.6 5.6 5.6
Total forage (ha) 7.4 7.4 7.4
Bedding straw (kg/day) 80 80 80
Lambs reared (%)
/100 ewes tupped
Basis of data:
1. Breeding stock prices, autumn 2018. 2. Finished lamb prices, summer 2019. 3. Hay yield and quality 7 t/ha; ME 8.5 MJ/kg DM. 4. Hay and aftermath grazing fertiliser level 125 kg N/ha grazing fertiliser
level 125 kg N/ha. 5. Bedding straw based on 80 kg/day for 100 ewes housed over a 12
week housing period. 6. Modern rams are capable of running at 80/100:1 in lowland flocks,
stocked tightly.
Special features: Ewes housed at lambing and often up to weaning. Lambs creep fed at grass or weaned at 6 weeks and finished on concentrates. Ewes grazed tightly during summer. Often a part flock system. Small flocks, high labour input.

SHEEP 189
Early Finished Lamb Production
GROSS MARGIN DATA
Suffolk/Continental cross ewe to terminal sire
Mid-December to end January 140% 150% 160%
OUTPUT
Finished lambs: 140 @ £81 (40 kg lwt) 11,340 - -
150 @ £81 - 12,150 -
160 @ £81 - - 12,960
Cast ewes: 18 @ £92 1,656 1,656 1,656
Wool sales 270kg @ £0.85/kg 230 230 230
13,226 14,036 14,846
Less: gimmers purchased - 26 @ £118 3,068 3,068 3,068
ram replacement (net) 542 542 542
9,616 10,426 11,236
VARIABLE COSTS
Barley, protein & minerals @ £256/t 1,536 1,664 1,792
Lamb concentrate @ £232/t 696 870 928
Vet, medicines & dips 567 568 569
Bedding straw @ £70/t (home-grown) 470 470 470
Commission, levies, haulage, 1,234 1,297 1,360
shearing, scanning & tags
4,503 4,869 5,119
Gross margin before forage 5,113 5,557 6,117
Forage variable costs:
hay @ £158/ha 284 284 284
grazing @ £135/ha 756 756 756
Total Variable Costs 5,543 5,909 6,159
GROSS MARGIN 4,073 4,517 5,077
GROSS MARGIN per forage ha 550 610 686
Sensitivity-Change ± Change in Gross Margin/100 ewes (£)
10 p/kg lwt in finished lamb price 538 576 614
£5/hd in cast ewe price 90 90 90
£5/hd in gimmer price 130 130 130
£10/tonne concentrate price 90 103 110
Lambs reared (%)
£/100 ewes tupped
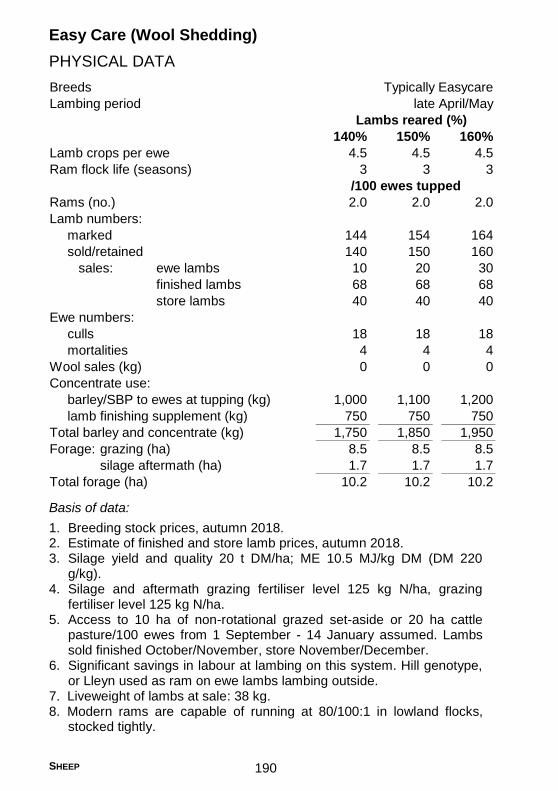
SHEEP 190
Easy Care (Wool Shedding)
PHYSICAL DATA
Breeds Typically Easycare
Lambing period late April/May
140% 150% 160%
Lamb crops per ewe 4.5 4.5 4.5
Ram flock life (seasons) 3 3 3
Rams (no.) 2.0 2.0 2.0
Lamb numbers:
marked 144 154 164
sold/retained 140 150 160
sales: ewe lambs 10 20 30
finished lambs 68 68 68
store lambs 40 40 40
Ewe numbers:
culls 18 18 18
mortalities 4 4 4
Wool sales (kg) 0 0 0
Concentrate use:
barley/SBP to ewes at tupping (kg) 1,000 1,100 1,200
lamb finishing supplement (kg) 750 750 750
Total barley and concentrate (kg) 1,750 1,850 1,950
Forage: grazing (ha) 8.5 8.5 8.5
silage aftermath (ha) 1.7 1.7 1.7
Total forage (ha) 10.2 10.2 10.2
Lambs reared (%)
/100 ewes tupped
Basis of data:
1. Breeding stock prices, autumn 2018. 2. Estimate of finished and store lamb prices, autumn 2018. 3. Silage yield and quality 20 t DM/ha; ME 10.5 MJ/kg DM (DM 220
g/kg). 4. Silage and aftermath grazing fertiliser level 125 kg N/ha, grazing
fertiliser level 125 kg N/ha. 5. Access to 10 ha of non-rotational grazed set-aside or 20 ha cattle
pasture/100 ewes from 1 September - 14 January assumed. Lambs sold finished October/November, store November/December.
6. Significant savings in labour at lambing on this system. Hill genotype, or Lleyn used as ram on ewe lambs lambing outside.
7. Liveweight of lambs at sale: 38 kg. 8. Modern rams are capable of running at 80/100:1 in lowland flocks,
stocked tightly.

SHEEP 191
Easy Care (Wool Shedding)
GROSS MARGIN DATA
Typically Easycare
late April/May 140% 150% 160%
OUTPUT
Ewe lambs 10 @ £82 820 - -
20 @ £82 - 1,640 -
30 @ £82 - - 2,460
Finished lambs: 68 @ £67 (38kg lwt) 4,556 - -
68 @ £67 - 4,556 -
68 @ £67 - - 4,556
Store lambs: 40 @ £44 1,760 - -
40 @ £44 - 1,760 -
40 @ £44 - - 1,760
Draft/cast ewes: 18 @ £62 1,116 1,116 1,116
Wool sales 0kg @ £0/kg - - -
8,252 9,072 9,892
Less: ram replacement (net) 467 467 467
7,785 8,605 9,425
VARIABLE COSTS
Barley & mineralised SBP @ £256/t 256 282 307
Lamb finishing pellets @ £232/t 174 174 174
Vet, medicines & dips 488 496 504
Commission, levies, haulage, scanning 878 941 1,005
& tags
1,796 1,893 1,990
Gross margin before forage 5,989 6,712 7,435
Forage variable costs:
silage @ £175/ha 298 298 298
grazing @ £135/ha 1,148 1,148 1,148
1,446 1,446 1,446
Total Variable Costs 3,242 3,339 3,436
GROSS MARGIN 4,543 5,266 5,989
GROSS MARGIN per forage ha 445 516 587
Sensitivity-Change ± Change in Gross Margin/100 ewes (£)
10 p/kg lwt in finished lamb price 248 248 248
£5/hd in all lamb sales 590 640 690
£5/hd in cast ewe price 90 90 90
30% in pasture utilisation 344 344 344
Lambs reared (%)
£/100 ewes tupped

SHEEP 192
Gimmering
PHYSICAL DATA
Breeds Crossbred, Cheviot, Lleyn
System Ewe lambs purchased in autumn, wintered
on swedes and hay, grazed tightly in summer
and sold as gimmers in autumn
/100 sheep
Mortalities (no.) 2
Wool sales (kg) 270
Concentrate use:
Barley (kg) 1,500
Forage: hay-5,000 kg (ha) 0.7
swedes (ha) 1.5
grazing (ha) 3.0
Total forage (ha) 5.2
Basis of data:
1. Ewe lamb price, autumn 2018. 2. Estimate of gimmer price, autumn 2019. 3. Hay yield and quality 7 t/ha; ME 8.5 MJ/kg DM. 4. Hay fertiliser level 125 kg N/ha; grazing fertiliser level 125 kg N/ha. 5. Yield of swedes 75 t/ha. See page 102-103 for swede production
costs. 6. Where an all-hay diet is envisaged, approximately 22 t or 3.1 ha extra
hay with aftermath grazing would be required to replace 2 ha of swedes.

SHEEP 193
Gimmering
GROSS MARGIN DATA
OUTPUT £/100 sheep
Crossbred gimmers: 98 @ £126 12,348
Wool sales 270kg @ £0.85/kg 230
and sold as gimmers in autumn 12,578
Less: Crossbred ewe lambs purchased - 100 @ £85 8,500
4,078
VARIABLE COSTS
Concentrates - barley & minerals @ £232/t 348
Vet, medicines & dips 330
Commission, levies, haulage, shearing, scanning & tags 1,103
1,781
Gross margin before forage 2,297
Forage variable costs:
hay @ £158/ha 111
swedes @ £345/ha 518
grazing @ £135/ha 405
Total Variable Costs 2,815
GROSS MARGIN 1,263
GROSS MARGIN per forage ha 243
Sensitivity-Change ± Change in Gross Margin/100 sheep (£)
£5/hd in sale price 490

SHEEP 194
Short Keep Lambs - Winter Finishing on Rape
PHYSICAL DATA
System Store lambs purchased in September/October,
sold finished November/December
Grazing period: range, low to high
stocking period (days) 45-75
average (days) 55
Stocking rate: range (no./ha) 40-60
average (no./ha) 50
Liveweight at start (kg) 27
Liveweight at slaughter (kg) 42
Deadweight at slaughter (kg) 19
/100 lambs
Mortalities (no.) 2
Area of rape (ha) 2
Area of grass 'run-back' (ha) 1
Concentrates (cereal) fed (kg) 500
Basis of data:
1. Estimate of store lamb price, autumn 2018. 2. Estimate of finished lamb/hogg price, November/December 2018. 3. Performance from lambs grazing rape can vary greatly between years.
The requirement for supplementary concentrates is also very variable from year to year, and area to area. Cereal supplementation will be more necessary in higher rainfall areas, and it may be difficult to finish lambs in very high rainfall areas. Small lambs under 25 kg liveweight fail to perform well on rape and should be finished inside. A dry run back area with suitable forage and water should be provided. See page 98-99 for forage rape production costs.

SHEEP 195
Short Keep Lambs - Winter Finishing on Rape
GROSS MARGIN DATA
OUTPUT £/100 lambs
Finished lambs: 98 @ £73 (42 kg lwt) 7,154
Less: Store lambs purchased - 100 @ £41 4,100
3,054
VARIABLE COSTS
Concentrates - barley & minerals @ £232/t 116
Vet & medicines 180
Commission, levies, haulage, shearing, scanning & tags 770
1,066
Gross margin before forage 1,988
Forage variable costs:
forage rape @ £128/ha 256
Total Variable Costs 1,322
GROSS MARGIN 1,732
GROSS MARGIN per forage ha 577
Sensitivity-Change ± Change in Gross Margin/100 lambs (£)
£5/hd in lamb sale price 490
30% in pasture utilisation 77

SHEEP 196
Short Keep Lambs - Indoor Finishing on Concentrates
PHYSICAL DATA
System Store lambs housed in December, sold
finished February
Liveweight at housing (kg) 28
Liveweight at slaughter (kg) 36
Deadweight at slaughter (kg) 16.5
Food conversion efficiency (kg feed/kg lwt gain) range 7 - 10
Finishing period (days) 60
Daily liveweight gain (g) 100 - 150
/100 lambs
Mortalities (no.) 2
Concentrates: whole barley (kg) 4,020
sugar beet pulp (kg) 1,610
protein supplement (46% CP) (kg) 805
salt/minerals/vitamins (kg) 165
Total mix (kg) 6,600
Hay feeding (kg) 300
Bedding straw (housed period) (kg/day) 80
Basis of data:
1. Estimate of store lamb price, autumn 2018. 2. Estimate of finished lamb price, March 2019. 3. Suitable for lambs that are difficult to finish outside: ram lambs, riggs,
anything under 25 kg in the autumn and thin lambs. 4. Profitability depends on rising lamb prices rather than food conversion
efficiency. Late-born smaller lambs, non-standard types, any lambs under 25 kg liveweight and lambs that have failed to finish outside are all suitable for this system.
5. Care should be taken when introducing housed lambs to concentrate feeding where starchy cereals e.g. barley are used. Acidosis can often result, causing digestive upsets and in some cases, mortality. Typical feed conversion rate is 8.25 kg concentrate to produce 1 kg lwt (including concentrate fed during introductory period), for Blackface and other hill breeds. Crossbred lambs convert at 7-7.5 kg when gaining from 30-35 kg to 40-45 kg. Minerals will contain no Mg and low P.

SHEEP 197
Short Keep Lambs - Indoor Finishing on Concentrates
GROSS MARGIN DATA
OUTPUT £/100 lambs
Finished lambs: 98 @ £64 (36 kg lwt) 6,272
Less: Store lambs purchased - 100 @ £41 4,100
2,172
VARIABLE COSTS
Concentrates homemix @ £232/t 1,531
Vet & medicines 180
Bedding straw @ £95/t (bought-in) 319
Commission, levies, haulage, shearing, scanning & tags 735
2,765
Gross margin before forage 593-
Forage variable costs:
hay @ £158/ha 6
Total Variable Costs 2,771
GROSS MARGIN 599-
Sensitivity-Change ± Change in Gross Margin/100 lambs (£)
10 p/kg lwt in finished lamb price 367
£5/hd in store lamb purchase price 500
£10/t in concentrate price 66
10 days in finishing period - straw, feed and hay 316
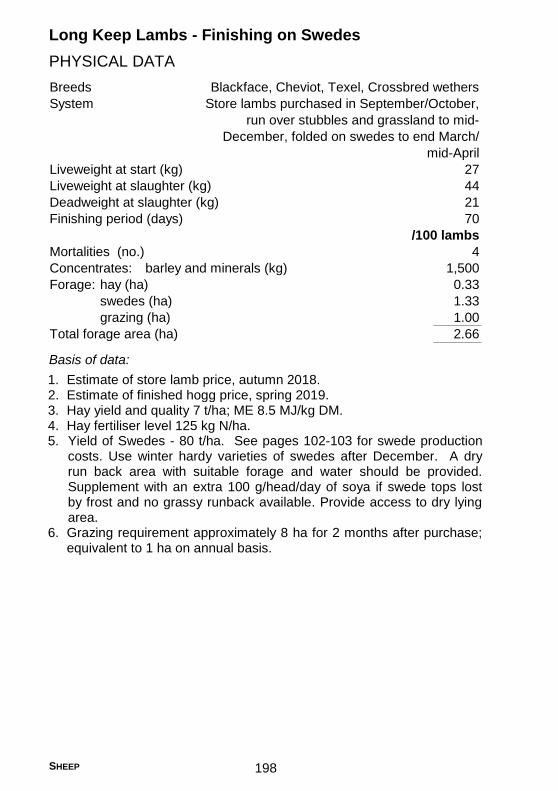
SHEEP 198
Long Keep Lambs - Finishing on Swedes
PHYSICAL DATA
Breeds Blackface, Cheviot, Texel, Crossbred wethers
System Store lambs purchased in September/October,
run over stubbles and grassland to mid-
December, folded on swedes to end March/
mid-April
Liveweight at start (kg) 27
Liveweight at slaughter (kg) 44
Deadweight at slaughter (kg) 21
Finishing period (days) 70
/100 lambs
Mortalities (no.) 4
Concentrates: barley and minerals (kg) 1,500
Forage: hay (ha) 0.33
swedes (ha) 1.33
grazing (ha) 1.00
Total forage area (ha) 2.66
Basis of data:
1. Estimate of store lamb price, autumn 2018. 2. Estimate of finished hogg price, spring 2019. 3. Hay yield and quality 7 t/ha; ME 8.5 MJ/kg DM. 4. Hay fertiliser level 125 kg N/ha. 5. Yield of Swedes - 80 t/ha. See pages 102-103 for swede production
costs. Use winter hardy varieties of swedes after December. A dry run back area with suitable forage and water should be provided. Supplement with an extra 100 g/head/day of soya if swede tops lost by frost and no grassy runback available. Provide access to dry lying area.
6. Grazing requirement approximately 8 ha for 2 months after purchase; equivalent to 1 ha on annual basis.

SHEEP 199
Long Keep Lambs - Finishing on Swedes
GROSS MARGIN DATA
OUTPUT £/100 lambs
Finished lambs: 96 @ £90 (44 kg lwt) 8,640
Less: Store lambs purchased - 100 @ £41 4,100
December, folded on swedes to end March/ 4,540
VARIABLE COSTS
Concentrates homemix @ £232/t 348
Vet & medicines 340
Commission, levies, haulage, shearing, scanning & tags 824
1,512
Gross margin before forage 3,028
Forage variable costs:
hay @ £158/ha 52
swedes @ £345/ha 459
grazing @ £135/ha 135
Total Variable Costs 2,158
GROSS MARGIN 2,382
Sensitivity-Change ± Change in Gross Margin/100 lambs (£)
£5/hd in lamb sale price 480
£5/hd in store purchase price 500
30% in pasture utilisation 194


Red Deer

RED DEER 202
Introduction
The June 2017 agricultural census recorded 8,000 farmed deer in Scotland up 1,000 head (15%) from the previous year. Currently, Scotland produces around 3,500 tonnes of venison per year from wild deer, with farmed production only around 90 tonnes.
Over the last ten years, UK retail sales of venison have steadily grown. However, UK supply has not kept pace over the same period and imported venison continues to fill the vacuum created by market demand. There is a drive in Scotland to encourage increased production of Scottish farmed venison and in so doing reduce the UK’s reliance on imports. It is estimated that an additional 1200 tonnes of venison per annum will be required to keep step with demand. Achieving such a 24 fold increase in Scottish farmed venison production by 2020 is highly challenging.
Scottish Government Cabinet Secretary for the Rural Economy and Connectivity, Fergus Ewing, has taken a keen interest in Scottish wild and farmed venison. Following the Venison Summit in February 2018 a sector plan for venison will be developed by the end of 2018 to fit with the Scotland Food and Drink strategy 2030.
In the longer-term, the required increase to meet demand could be achievable if the relative profitability of farmed deer were to improve compared to beef and sheep. Much will depend on what changes to agricultural support and trade access are made following Brexit and whether these create opportunities for new enterprises such as deer farming. Interestingly non-EU venison enjoys tariff free access to the EU compared to tariffs of ~50% for beef and sheep-meat.
Support and subsidies Historically deer farming did not attract support payments and subsidies putting it at a disadvantage to cattle and sheep farming. However, the reformed CAP regime now enables deer farmers to claim support payments under the Basic Payment Scheme.
Starting deer farming The main barriers to people entering deer farming are the start-up costs which are estimated at upwards of £50,000 for a 100 hind breeding herd. It is estimated that the minimum herd size to be profitable is 150 hinds. Red deer breeding hinds will generally cost from £300-£1,000 for pedigree stock with breeding stags costing from £500-£2,000. Other significant costs include specialist and handling facilities.
Other barriers identified include access to an abattoir, knowledge of where to obtain limited breeding stock and specialist knowledge relating to the industry. Some of these barriers are being addressed with a dedicated deer abattoir opened in Fife. Also the development of a new Scottish Venison Industry Strategy and funding of projects such as the
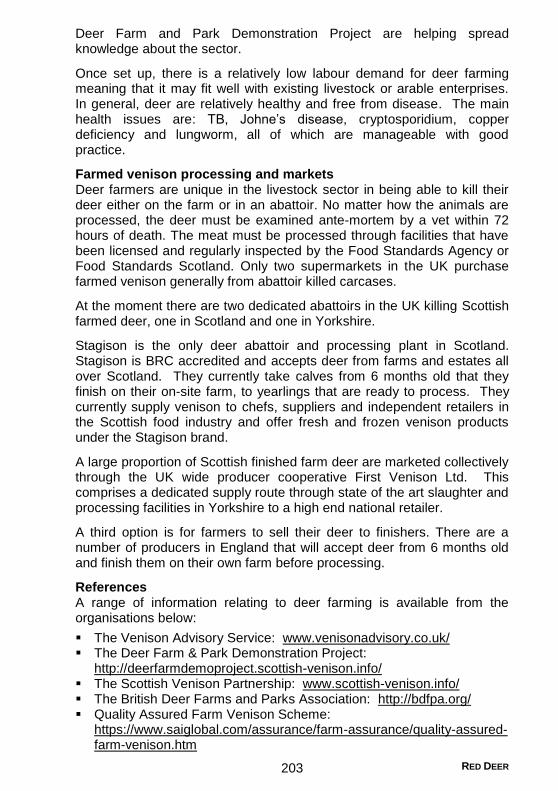
RED DEER 203
Deer Farm and Park Demonstration Project are helping spread knowledge about the sector.
Once set up, there is a relatively low labour demand for deer farming meaning that it may fit well with existing livestock or arable enterprises. In general, deer are relatively healthy and free from disease. The main health issues are: TB, Johne’s disease, cryptosporidium, copper deficiency and lungworm, all of which are manageable with good practice.
Farmed venison processing and markets Deer farmers are unique in the livestock sector in being able to kill their deer either on the farm or in an abattoir. No matter how the animals are processed, the deer must be examined ante-mortem by a vet within 72 hours of death. The meat must be processed through facilities that have been licensed and regularly inspected by the Food Standards Agency or Food Standards Scotland. Only two supermarkets in the UK purchase farmed venison generally from abattoir killed carcases.
At the moment there are two dedicated abattoirs in the UK killing Scottish farmed deer, one in Scotland and one in Yorkshire.
Stagison is the only deer abattoir and processing plant in Scotland. Stagison is BRC accredited and accepts deer from farms and estates all over Scotland. They currently take calves from 6 months old that they finish on their on-site farm, to yearlings that are ready to process. They currently supply venison to chefs, suppliers and independent retailers in the Scottish food industry and offer fresh and frozen venison products under the Stagison brand.
A large proportion of Scottish finished farm deer are marketed collectively through the UK wide producer cooperative First Venison Ltd. This comprises a dedicated supply route through state of the art slaughter and processing facilities in Yorkshire to a high end national retailer.
A third option is for farmers to sell their deer to finishers. There are a number of producers in England that will accept deer from 6 months old and finish them on their own farm before processing.
References A range of information relating to deer farming is available from the organisations below:
The Venison Advisory Service: www.venisonadvisory.co.uk/ The Deer Farm & Park Demonstration Project:
http://deerfarmdemoproject.scottish-venison.info/ The Scottish Venison Partnership: www.scottish-venison.info/ The British Deer Farms and Parks Association: http://bdfpa.org/ Quality Assured Farm Venison Scheme:
https://www.saiglobal.com/assurance/farm-assurance/quality-assured-farm-venison.htm
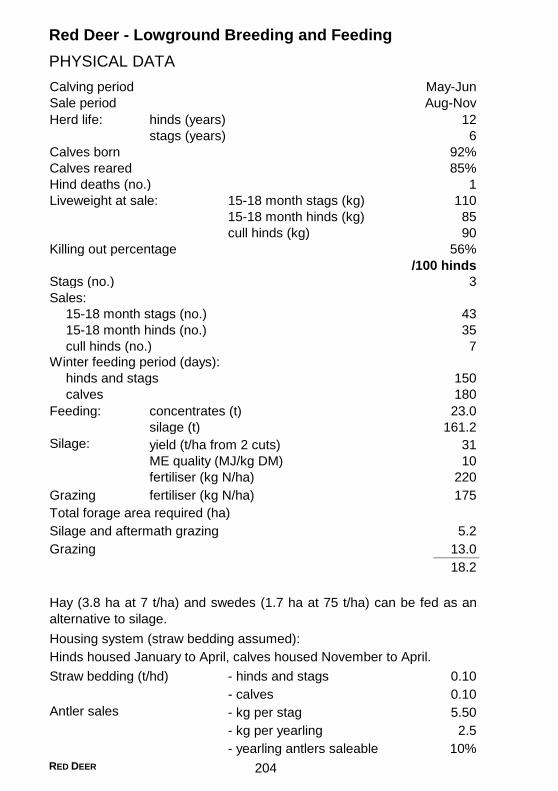
RED DEER 204
Red Deer - Lowground Breeding and Feeding
PHYSICAL DATA
Calving period May-Jun
Sale period Aug-Nov
Herd life: hinds (years) 12
stags (years) 6
Calves born 92%
Calves reared 85%
Hind deaths (no.) 1
Liveweight at sale: 15-18 month stags (kg) 110
15-18 month hinds (kg) 85
cull hinds (kg) 90
Killing out percentage 56%
/100 hinds
Stags (no.) 3
Sales:
15-18 month stags (no.) 43
15-18 month hinds (no.) 35
cull hinds (no.) 7
Winter feeding period (days):
hinds and stags 150
calves 180
Feeding: concentrates (t) 23.0
silage (t) 161.2
Silage: yield (t/ha from 2 cuts) 31
ME quality (MJ/kg DM) 10
fertiliser (kg N/ha) 220
Grazing fertiliser (kg N/ha) 175
Total forage area required (ha)
Silage and aftermath grazing 5.2
Grazing 13.0
18.2
Housing system (straw bedding assumed):
Hinds housed January to April, calves housed November to April.
Straw bedding (t/hd) - hinds and stags 0.10
- calves 0.10
Antler sales - kg per stag 5.50
- kg per yearling 2.5
- yearling antlers saleable 10%
Hay (3.8 ha at 7 t/ha) and swedes (1.7 ha at 75 t/ha) can be fed as an
alternative to silage.

RED DEER 205
Red Deer - Lowground Breeding and Feeding
GROSS MARGIN DATA
OUTPUT £/100 hindsSale value (dwt):
stags 57 kg @ 540 p/kg dwt 13,082
hinds 50 kg @ 540 p/kg dwt 9,582
cull hinds 50.4 kg @ 325 p/kg dwt 1,147
Antlers: 27.1 kg @ £10 /kg 271
24,082
Less : hinds purchased 3,600
share of replacement stag 950
19,532
VARIABLE COSTS
Concentrates @ £220/t 5,053
Vet & medicines 573
Bedding straw @ £95/t (bought-in) 1,785
Other livestock expenses 2,360
9,771
Gross Margin before forage 9,761
Forage variable costs:
silage @ £246/ha 1,279
grazing @ £174/ha 2,262
3,541
Total Variable Costs 13,312
GROSS MARGIN £/100 hinds 6,220
GROSS MARGIN £/ha 342
Sensitivity - Change ± Change in Gross Margin/100 hinds (£)
£5/hd in all deer sales 425
Replacement cost prices:
Cull hind £164 Hind (purch.) £450
Cull stag £223 Replacement stag £2,000
Basis of data:
Sale price - slaughter price based on expected prices for sales to the
abbatoir. In practice, many deer farms sell part of their production direct
to retailers, caterers and consumers at deadweight prices over £5.50/kg
but with additional processing and marketing costs.
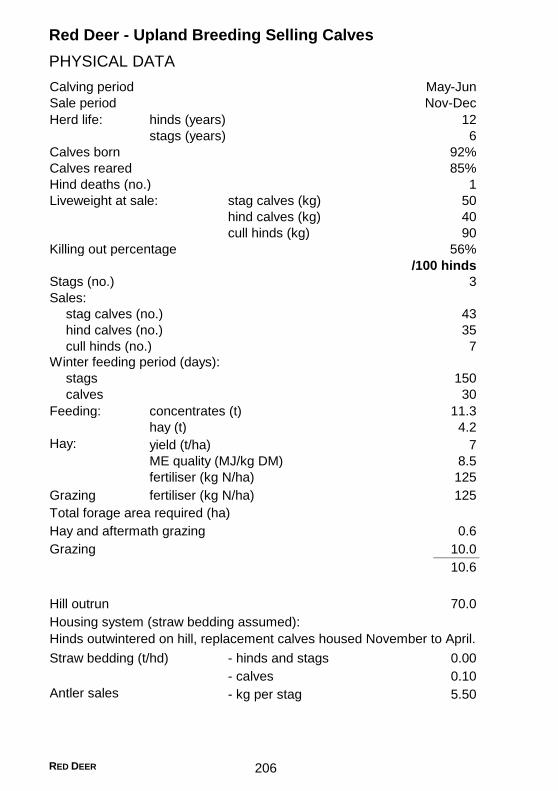
RED DEER 206
Red Deer - Upland Breeding Selling Calves
PHYSICAL DATA
Calving period May-Jun
Sale period Nov-Dec
Herd life: hinds (years) 12
stags (years) 6
Calves born 92%
Calves reared 85%
Hind deaths (no.) 1
Liveweight at sale: stag calves (kg) 50
hind calves (kg) 40
cull hinds (kg) 90
Killing out percentage 56%
/100 hinds
Stags (no.) 3
Sales:
stag calves (no.) 43
hind calves (no.) 35
cull hinds (no.) 7
Winter feeding period (days):
stags 150
calves 30
Feeding: concentrates (t) 11.3
hay (t) 4.2
Hay: yield (t/ha) 7
ME quality (MJ/kg DM) 8.5
fertiliser (kg N/ha) 125
Grazing fertiliser (kg N/ha) 125
Total forage area required (ha)
Hay and aftermath grazing 0.6
Grazing 10.0
10.6
Hill outrun 70.0
Housing system (straw bedding assumed):
Hinds outwintered on hill, replacement calves housed November to April.
Straw bedding (t/hd) - hinds and stags 0.00
- calves 0.10
Antler sales - kg per stag 5.50

RED DEER 207
Red Deer - Upland Breeding Selling Calves
GROSS MARGIN DATA
OUTPUT £/100 hindsSale value:
stag calves 50 kg @ 290 p/kg lwt 6,163
hind calves 40 kg @ 400 p/kg lwt 5,678
cull hinds 50.4 kg @ 325 p/kg dwt 1,147
Antlers: 16.5 kg @ £10 /kg 165
13,153
Less : hinds purchased 3,600
share of replacement stag 952
8,601
VARIABLE COSTS
Concentrates @ £220/t 2,480
Vet & medicines 573
Bedding straw @ £95/t (bought-in) 67
Other livestock expenses 2,360
5,480
Gross Margin before forage 3,121
Forage variable costs:
hay @ £211/ha 127
grazing @ £135/ha 1,350
1,477
Total Variable Costs 6,957
GROSS MARGIN £/100 hinds 1,644
GROSS MARGIN £/ha 155
Sensitivity - Change ± Change in Gross Margin/100 hinds (£)
£5/hd in all deer sales 425
Replacement cost prices:
Cull hind £164 Hind (purch.) £450
Cull stag £223 Replacement stag £2,000
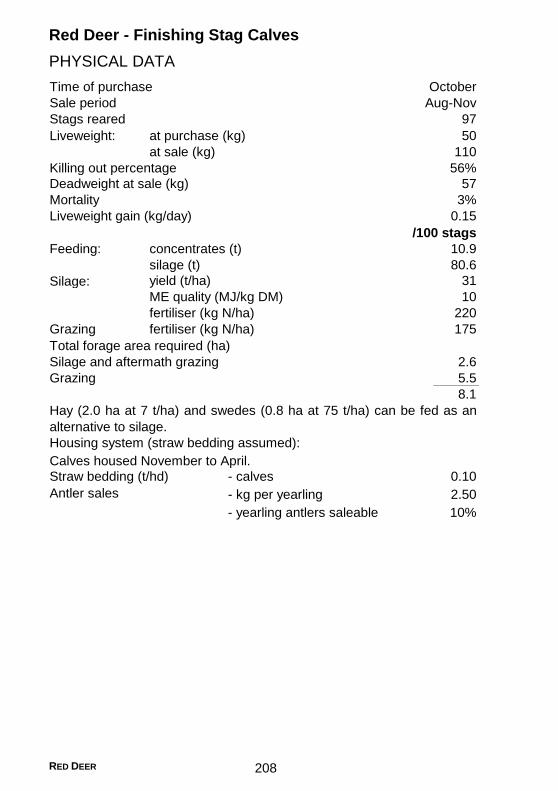
RED DEER 208
Red Deer - Finishing Stag Calves
PHYSICAL DATA
Time of purchase October
Sale period Aug-Nov
Stags reared 97
Liveweight: at purchase (kg) 50
at sale (kg) 110
Killing out percentage 56%
Deadweight at sale (kg) 57
Mortality 3%
Liveweight gain (kg/day) 0.15
/100 stags
Feeding: concentrates (t) 10.9
silage (t) 80.6
Silage: yield (t/ha) 31
ME quality (MJ/kg DM) 10
fertiliser (kg N/ha) 220
Grazing fertiliser (kg N/ha) 175
Total forage area required (ha)
Silage and aftermath grazing 2.6
Grazing 5.5
8.1
Housing system (straw bedding assumed):
Calves housed November to April.
Straw bedding (t/hd) - calves 0.10
Antler sales - kg per yearling 2.50
- yearling antlers saleable 10%
Hay (2.0 ha at 7 t/ha) and swedes (0.8 ha at 75 t/ha) can be fed as an
alternative to silage.
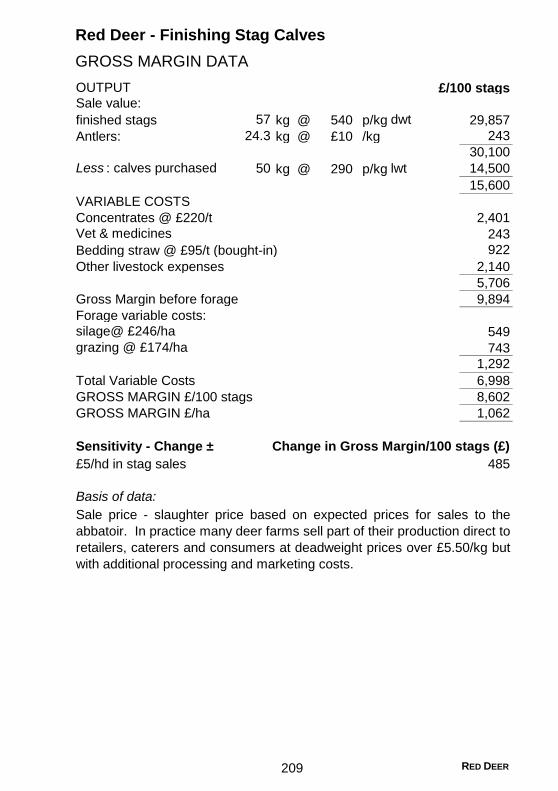
RED DEER 209
Red Deer - Finishing Stag Calves
GROSS MARGIN DATA
OUTPUT £/100 stagsSale value:
finished stags 57 kg @ 540 p/kg dwt 29,857
Antlers: 24.3 kg @ £10 /kg 243
30,100
Less : calves purchased 50 kg @ 290 p/kg lwt 14,500
15,600
VARIABLE COSTS
Concentrates @ £220/t 2,401
Vet & medicines 243
Bedding straw @ £95/t (bought-in) 922
Other livestock expenses 2,140
5,706
Gross Margin before forage 9,894
Forage variable costs:
silage@ £246/ha 549
grazing @ £174/ha 743
1,292
Total Variable Costs 6,998
GROSS MARGIN £/100 stags 8,602
GROSS MARGIN £/ha 1,062
Sensitivity - Change ± Change in Gross Margin/100 stags (£)
£5/hd in stag sales 485
Basis of data:
Sale price - slaughter price based on expected prices for sales to the
abbatoir. In practice many deer farms sell part of their production direct to
retailers, caterers and consumers at deadweight prices over £5.50/kg but
with additional processing and marketing costs.


Pigs

PIGS 212
Introduction
Markets and prices Finished pig prices have fallen from the high of 165p/kg dwt seen in summer 2017. They have recently levelled off at around 150p/kg dwt at the end of May 2018. This is a significant improvement on the prices seen in spring 2016 (113p/kg dwt). EU and global market factors have continued to impact and have been the main drivers of higher pig-meat prices. Falling EU sow numbers and a sharp rise in exports to China have finally helped plug the surplus left by Russia’s export ban on EU pork. The relative weakness of Sterling since the Brexit referendum has further supported UK values. Pig producers have enjoyed a rollercoaster ride in terms of margins over the past two years. According to AHDB in early 2016 the average UK pig finisher was losing £10 per head. Since then, as prices received increased, positive margins have been made, reaching a peak of £23/head (27p/kg) in autumn 2017 before following the price downwards through the autumn. By spring 2018 producer margins had fallen to a more modest £4/head. Feed and other costs had remained fairly constant during this time. The chart below illustrates these movements.
The 2017 UK June census showed another rise in the female breeding herd, up 0.4% on the year to 417,000 head. The Scottish breeding sow population increased by 1,086 to 32,044 head between June 2016 and June 2017 - the highest since the June census in 2011. Despite the increased breeding herd overall total pig numbers reduced slightly in the year by 1.3% suggesting that the effects of the increased sow numbers had yet to work through the system along with a slight change in age profile.
Sow productivity continues to improve with AHDB Pork reporting the average number of pigs weaned per sow in the UK for the 12 months to December 2017 was 25.8, compared with the 24.9 in 2016. UK

PIGS 213
production remains behind the EU with the EU average for 2016 at 27.53
piglets. Denmark set the bar at over 32 pigs weaned per sow per year.
The UK is far from self sufficient in pig meat with domestic production standing at approximately 53% of total UK consumption. AHDB predict that forecasted increases in production will only just keep ahead of demand. Despite clean pig slaughterings decreasing by just over 1% in 2017, the continuing trend to increased slaughter weights meant that at 902,100t, UK pig meat production was only 700t less than 2016. Most major retailers (except Tesco, Lidl and Asda) offer exclusively British pork. The UK imports a significant volume of product from a range of countries in order to fulfil the shortfall in domestic production. Most of these suppliers are from within the European Union with the biggest suppliers being Denmark, Germany and the Netherlands.
With UK product being seen by some markets as premium and the need to ensure maximum value from the carcase the UK also exports a relatively large volume of lower value product.
Marketing and processing The UK pig industry is much more rationalised than other livestock sectors, such as beef and sheep. The supply for pigs is more vertically integrated than the beef and sheep sectors with contracts more common.
In Scotland, expansion of capacity at the remaining slaughterhouses, has not so far led to any recovery in local fattening and slaughtering. In 2017 the Scottish clean pig kill in Scotland was down significantly at 230,000 head. A major fire at the Brechin plant (which is responsible for over 60% of the Scottish pig slaughter capacity) led to its closure for several months. Most pigs had to go to either England or Northern Ireland for slaughter. Despite the increased slaughtering capacity large numbers of weaners continue to head to England for finishing and slaughter.
In order to grow demand for Scottish grown pork, in 2016 QMS launched the Selected Pork Marketing Strategy Group and ran a campaign to promote the benefits of assured pork from selected farms in Scotland. Specially selected pork is approved by the Scottish SPCA who independently inspect farms and processors.
Margins The biggest cost in pig production is feed which accounts for approximately 50-60% of costs. As such the profitability of pig production generally hinges on three factors; the price received for pigs, the feed price and the efficiency of feed conversion. The more enduring route to profitability for pig producers is to raise the number of pigs reared per sow. As numbers produced continue to increase, coupled with a sustained period of profitability for the sector, producers have increased in confidence, investing further in genetics, staff training, technology and housing allowing improved performance to be sustained and further improvements to production efficiency.

PIGS 214
Breeding Pigs - Indoor Units
PHYSICAL DATA*
4 week weaning
Average Premium
Litters/sow/year (no) 2.30 2.37
Live pigs born/litter (no) 13.30 14.06
Piglet mortality (%) 12.01 11.06
Weaners/litter (no) 11.70 12.50
Pigs weaned/sow/annum** 26.92 29.64
Pigs sold/sow/annum 26.11 28.75
Age at weaning (days) 26.7
Age at sale/transfer (days) 87
Liveweight at weaning (kg) 7.22
Liveweight at sale (kg) 37.5
Sow:boar ratio 19
No. sows replaced annually (%) 54.8
No. boars replaced annually (%) 40
Sow mortality (%) 6.30
Feed use (conventional diets):
sow meal (sow, boar, gilt) (kg) 1,290
Daily liveweight gain (g/day) 0.431
Feed conversion ratio (:1) 1.80
Feed (kg of feed/sow/annum):
Creep feed (14 days of age to 9 kg lwt) 68 74
Weaner diet (9 to 15 kg lwt) 273 297
Rearing diet (15 to 34 kg lwt) 797 867
Total feed/sow/annum 2,429 2,529
* Based on data derived from AHDB Pork. ** Per sow and gilt in the herd, rounded and with an allowance for
barreners.
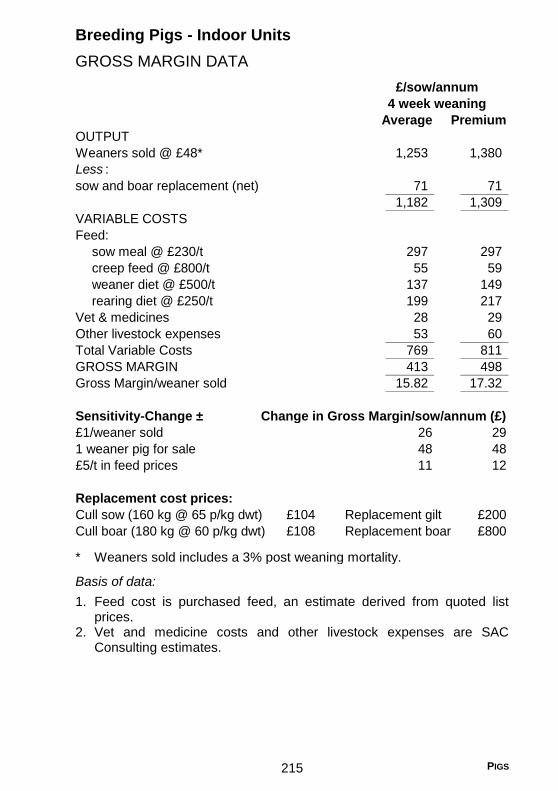
PIGS 215
Breeding Pigs - Indoor Units
GROSS MARGIN DATA
Average Premium
OUTPUT
Weaners sold @ £48* 1,253 1,380
Less :
sow and boar replacement (net) 71 71
1,182 1,309
VARIABLE COSTS
Feed:
sow meal @ £230/t 297 297
creep feed @ £800/t 55 59
weaner diet @ £500/t 137 149
rearing diet @ £250/t 199 217
Vet & medicines 28 29
Other livestock expenses 53 60
Total Variable Costs 769 811
GROSS MARGIN 413 498
Gross Margin/weaner sold 15.82 17.32
Sensitivity-Change ± Change in Gross Margin/sow/annum (£)
£1/weaner sold 26 29
1 weaner pig for sale 48 48
£5/t in feed prices 11 12
Replacement cost prices:
Cull sow (160 kg @ 65 p/kg dwt) £104 Replacement gilt £200
Cull boar (180 kg @ 60 p/kg dwt) £108 Replacement boar £800
£/sow/annum
4 week weaning
* Weaners sold includes a 3% post weaning mortality.
Basis of data:
1. Feed cost is purchased feed, an estimate derived from quoted list prices.
2. Vet and medicine costs and other livestock expenses are SAC Consulting estimates.

PIGS 216
Breeding Pigs - Outdoor Units
PHYSICAL DATA
Average Premium*
Breeding herd
Stocking rate (sows/ha) 14 14
Litters/sow/year (no.) 2.28 2.36
Live pigs born/litter (no.) 12.1 12.7
Piglet mortality (%) 13.1 12.2
Weaners/litter (no.) 10.5 11.2
Pigs weaned/sow/annum 24.0 26.4
Weight at weaning (kg) 7.3 7.6
Age at weaning (days) 26.3 25.7
Proportion sows replaced annually (%) 47.7 51.8
Proportion boars replaced annually (%) 40 40
Sow mortality (%) 4.3 5.1
Sow:boar ratio (:1) 16 16
Sow feed used (kg/annum) 1,460 1,560
Weaners
Post weaning mortality (%) 3.8 2.9
Weaners sold/sow 23.09 25.64
Age at sale/transfer (days) 86 77
Weight at sale (kg) 37.50 34.30
Weight gain (kg) 30.23 26.74
Daily liveweight gain (g/day) 516 568
Feed conversion ratio (:1) 1.80 1.60
Weaner feed (kg/weaner) 54.41 42.78
* Selected on pigs reared/sow/year.

PIGS 217
Breeding Pigs - Outdoor Units
GROSS MARGIN DATA
Average Premium
OUTPUT
Weaned pigs @ £48 1,108 1,231
Less: sow and boar 65 70
replacement (net)
1,043 1,161
VARIABLE COSTS
Feed: sow cobs @ £235/t 343 367
weaner feed @ £343/t 448 387
Vet & medicines 37 37
Transport 28 28
Other livestock expenses 60 60
Total Variable Costs 916 879
GROSS MARGIN 127 282
GROSS MARGIN/weaner sold 5.50 11.00
GROSS MARGIN £/ha (acre) 1,777 (719) 3,947 (1,598)
Sensitivity-Change ± Change in Gross Margin/sow/annum (£)
£1/weaner sold 23 25
1 weaner pig for sale 48 48
£5/t in feed prices 3- 2
Replacement cost prices:
Cull sow (160 kg @ 65 p/kg dwt) £104 Replacement gilt £200
Cull boar (180 kg @ 60 p/kg dwt) £108 Replacement boar £800
£/sow/annum
Note:
Sow costs are higher than indoor units due to the requirement for cob nuts for management purposes.

PIGS 218
Finishing Pigs
PHYSICAL DATA
Type of finisher All Finishers
Average Premium
Liveweight: at purchase/transfer (kg) 38.1 38.6
at slaughter (kg) 110.9 111.7
Deadweight: at slaughter (kg) 83.2 83.8
Killing out (%) 75 75
Mortality (%) 2.8 2.4
Liveweight gain (g/day) 800 870
Feed conversion ratio (:1) 2.88 2.60
Feed use (kg) 210 190
Days in herd 91 84
Sale price (p/kg dwt) 147 147
Feed price (£/t) 220 220
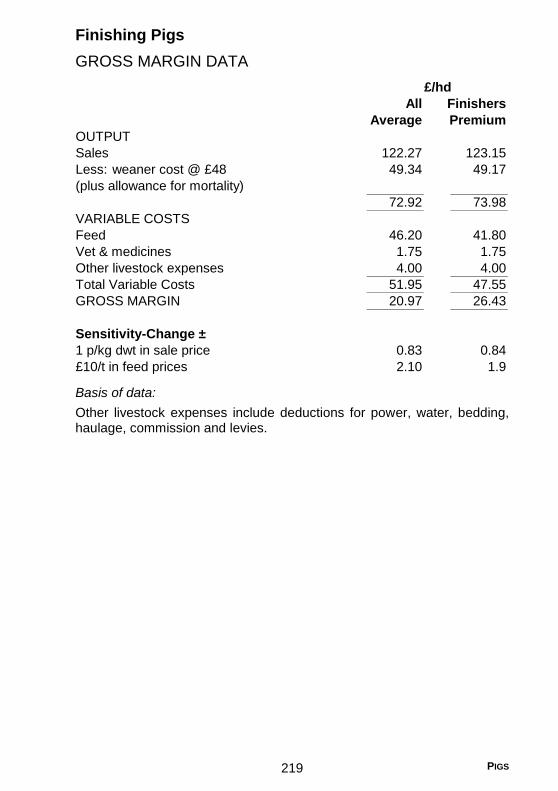
PIGS 219
Finishing Pigs
GROSS MARGIN DATA
OUTPUT
Sales 122.27 123.15
Less: weaner cost @ £48 49.34 49.17
(plus allowance for mortality)
72.92 73.98
VARIABLE COSTS
Feed 46.20 41.80
Vet & medicines 1.75 1.75
Other livestock expenses 4.00 4.00
Total Variable Costs 51.95 47.55
GROSS MARGIN 20.97 26.43
Sensitivity-Change ±
1 p/kg dwt in sale price 0.83 0.84
£10/t in feed prices 2.10 1.9
Average
Finishers
Premium
£/hd
All
Basis of data:
Other livestock expenses include deductions for power, water, bedding, haulage, commission and levies.


Poultry

POULTRY 222
Introduction
Despite strong UK domestic demand growth for eggs an increase in the number and scale of UK free-range egg producers has led to weaker egg prices and falling margins in 2017 and early 2018. Investment in large scale free-range houses (30,000 birds) particularly in Northern Ireland and parts of Scotland has contributed to this production increase and new producers need to be careful before entering.
UK chicken meat production has enjoyed a more favourable market environment in the last year with strong growth in global and UK poultry-meat demand and generally better prices offset by some increases in feed costs. Brexit poses a number of threats to both egg and poultry-meat production but the heavy reliance on EU labour remains one of the most urgent issues needing addressed during negotiations.
Chicken Egg Production
In 2017 the UK produced a record 29.9 million cases of eggs (360 eggs to a case) up 1 million on 2016. Of these, 72% of eggs were produced in England and Wales, 13% in Scotland and 15% in Northern Ireland (source - Defra 2018a). In 2017 for the first time free range systems became the largest source of UK production (just) followed by enriched cages. The table below shows egg production by system as a % of total egg production by year.
1965 1980 2010 2017
Cage* 53% 95% 50% 48.6% Barn 37% 4% 5% 2% Free range 10% 1% 42% 49% Organic - - 3% 2.4%
*
enriched cages became a legal requirement for cage systems for laying hens in 2012.
Trends for eggs by production type have varied widely over the past 50 years, and anyone considering investing in an egg production business should be sure of the market for their egg type. In recent years, the market share of free-range egg production has edged steadily higher due to consumer demand and EU regulations (Council Directive 1999/74/EC) that banned conventional cages in 2012 on welfare grounds. Egg consumption in the UK comprises 54% by retail and 46% by food service/processing. While consumer demand has been strong free-range production is now close to saturating the retail market and has only made limited headway into food service. The recent retailer pledge to move away from enriched cages by 2025 is expected to lead to increased barn egg production due to lower costs of production, rather than free-range.

POULTRY 223
Independent egg producers can sell their eggs via the large egg producers/packers, or through local businesses (e.g. hotels, farmer’s markets). Flock size and thus scale of egg output will probably govern which route an egg producer favours. See page 115 for information on poultry keeping regulations.
About 90% of eggs in the UK are produced using the British Lion Quality Code of Practice, which ensures that the eggs sold are indeed British and adhere to various UK and EU legislation governing the food safety of eggs, in particular that laying hen flocks are vaccinated against Salmonella and that all eggs are traceable. For more information, see http://www.egginfo.co.uk/.
Egg grading Egg grading percentages are dependent on a large number of variables, e.g. lighting programmes and feed specifications and can be altered by changing the feeding and lighting during rearing and the feed specifications during lay. Most major breed management manuals provide suitable information. The following table shows the egg grading ratios as a percentage with weight for each grade.
Ratio Grade A weight
Very large 6.0% >73g Large 49.0% 63-72.99g Medium 35.0% 53-62.99g Small 3.9% <53g Seconds 6.3% -
Egg price indicators
Pence per 6 pack Very Mixed large Large Medium weight
Cage - - - - Barn - - - 75 Free range 141 123 89 80 Organic - 245 180 176
Source: Leading supermarkets average price for standard 6 packs (June 2018)
Quality assurance The predominant and most recognised hen egg assurance scheme is the British Lion Quality Code of Practice.
For updates on changes to the Code of Practice for Lion Quality eggs visit the British Egg Industry Council website at: www.britisheggindustrycouncil.com
Other assurance schemes, such as Freedom Foods free range egg production, or Soil Association organic egg production, can be found at:
POULTRY 224
www.freedomfood.co.uk/industry/rspca-welfare-standards www.soilassociation.org/farmersgrowers/technicalinformation/poultryla
ying
Broiler Meat Production
In 2018, the world is expected to produce 92.5 million tonnes of broiler chicken meat (USDA), representing a 2% increase on 2017. US and Brazilian production is expected to climb strongly in 2018 due to ample feed supplies and the absence of any major disease outbreaks. Within the UK, half (50%) of all meat eaten comes from poultry (and most of that - 85% - is made up of broiler chicken) (DEFRA 2018). About 20 million broiler chicks are placed in rearing farms per week in the UK. UK chicken meat production has risen strongly in recent years, up 17% to 1.552mt in the 5 years to 2018. In Scotland broiler meat output rebounded 30% to 106kt in 2017 after a drop the year before due to rationalisation of processing and production to central Scotland. UK poultry meat output has grown strongly; up 8% in the first four months of 2018 compared to a year earlier. The number of broiler chicks placed in the UK in January to April 2018 was up 5% on 2017 placements (Defra 2018b).
The majority of broiler chickens are reared conventionally, with free range and organic production accounting for about 5% of the market. Conventional rearing typically means in light-controlled houses, but providing natural daylight through windows (along with other types of environmental enrichment, such as perches and bales of wood shavings/straw) is becoming increasingly popular. Both male and female broiler chicks grow rapidly, so either or both sexes can be reared, depending on what target slaughter weight is desirable. With conventional rearing, the average liveweight at the point of slaughter (at around 36-40 days of age) is 2.3 kg (Defra 2018b).
Legislation governing the keeping of conventionally-reared broiler chickens (Council Directive 2007/43/EC) stipulates the maximum stocking densities allowed, but note that the UK does not permit the highest stocking density of >39-42 kg/m
2 (Defra 2011). For more
information on housing space requirements see pagpe 381.
Many broiler producers sell their produce under the Assured Chicken Production scheme, which is part of the Red Tractor farm assurance scheme, to ensure food safety and traceability. For more information, see http://assurance.redtractor.org.uk/rtassurance/home.eb.
Brexit issues
Future prospects for the egg and poultry meat sectors will, like many others, be closely tied to the nature of the UK’s withdrawal agreement

POULTRY 225
with the EU and the potential for subsequent third country trade deals. The sector is currently protected by EU import tariffs from large egg and poultry meat exporters such as the US and Brazil. Both the egg and broiler sectors are heavily reliant on access to EU labour and the current lack of clarity on future UK immigration policies is a major cause for concern.
Useful Poultry References
BPC 2018: www.britishpoultry.org.uk/ BFREPA – www.bfrepa.co.uk & www.theranger.co.uk USDA 2018 Livestock and Poultry: World Markets and Trade Council Directive 1999/74/EC Laying down minimum standards for the
protection of laying hens, pp1-5. Council Directive 2007/43/EC Laying down minimum rules for the
protection of chickens kept for meat production, pp1-10. Defra 2011 Interim guidance for keepers of conventionally reared
meat chickens: www.gov.uk/government/publications/meat-chicken-keeper-guidance
Defra 2018a. United Kingdom Egg Statistics: www.gov.uk/government/statistics/egg-statistics.
Defra 2018b. United Kingdom Poultry and Poultry Meat Statistics: www.gov.uk/government/statistics/poultry-and-poultry-meat-statistics
http://www.gov.scot/Topics/farmingrural/Agriculture/Livestock/eggs/eggs

POULTRY 226
Laying Hens - Free Range
PHYSICAL DATA
Source: Hyline Brown Management Guide 2014
Egg stock Brown
Body weight at 17 weeks (kg) 1.40-1.48
Body weight at 70 weeks (kg) 1.91-2.03
Age at 50% production (age, weeks) 20
Peak production (%) 95-96
Laying period:
Pullets housed (weeks) 16
Pullets point of lay (weeks) 18
Weeks in lay per annum adjusted for downtime 48.5
Bird laying cycle (week 18 to 72) (eggs) 295-305
Adjusted egg production (bird/annum) * 250
Mortality:
Livability during lay (%) - refer to breed management guides 0.95
Stocking density (birds/ha) 2,500
Feed:
Feed use (16 to 18 weeks) (kg/hd) 1.23
Feed use (19 to 72 weeks) (kg/hd) 47.488
* Adjusted for 365d, mortality, downtime (pullet to lay, washing)
Note:
Other bird expenses includes veterinary treatments, disinfectants, litter, dead bird disposal and range maintenance.

POULTRY 227
Laying Hens - Free Range
GROSS MARGIN DATA
£/doz
Wholesale Wholesale
Hyline Brown Management Guide 2014
OUTPUT £ £
Eggs sales @ £0.895/doz 18,646 0.90
Old hen value less catching cost 47 0.00
Less :
Pullet purchase @ £4.12 per bird 4,120 0.20
14,573 0.70
VARIABLE COSTS
Concentrate feed purchased @ £260/t 11,164 0.54
Other bird expenses 750 0.04
Total Variable Costs 11,914 0.57
GROSS MARGIN 2,659 0.13
Sensitivity ± Change in Gross Margin/1000 birds/annum (£)
£0.10/doz eggs sold 2,083
£10/t feed 429
1% increase in mortality at point of lay (£/1000 birds) 27
£/1000 bird/annum
Basis of data:
1. Egg price based on BFREPA UK average packer to producer free range price, as at summer, 2018.
2. High numbers of second grade eggs may be penalised and devalue the average price received.
3. Pullet price based on estimated BFREPA price (16 week fully vaccinated 3,000 bird order), June 2018.
4. Producers selling direct to market will incur additional packaging, grading and marketing costs as well as increased transport, labour and administration costs.
Grading, packaging and marketing costs vary significantly from business to business depending on the degree of automation, the size of the packing operation and the requirements of the customer being supplied.

POULTRY 228
Broilers
PHYSICAL DATA
Average finished bird weight (kg) 2.2
Killing out % 74%
Average wholesale price (p/kg - lwt) 122
Average age at finishing (days) 37
Age ranges between 39-44 days depending on breed and final weight
Chick costs (p/bird) 37
Chick mortality (%) 4
Feed use (kg/bird) 3.6
Feed conversion ratio 1.65
Stocking density (birds/m2) 18
System turn around time 50-55 days, 6 or 7 crops per year.
Price of chicks dependent on size of order and should presume to be
fully vaccinated
Broiler stocking density limited to 33 kg/m2, for more details see the
broiler meat production introduction.
Note:
Other bird expenses include veterinary treatments, bedding and power.

POULTRY 229
Broilers
GROSS MARGIN DATA
OUTPUT p/bird
Bird sales 2.2 kg @ 90.28 p/kg lwt 198.62
Less:
Replacement - chicks incl. mortality 38.48
160.14
VARIABLE COSTS
Concentrate feed purchased @ £300/t 108.00
Other bird expenses 23.81
Total Variable Costs 131.81
GROSS MARGIN 28.33
Sensitivity ± Change in Gross Margin/bird (p)
10 p/kg 22.00
£10/t feed 3.60

Organic Farming

ORGANIC FARMING 232
Introduction
In 2017 the area of organic farmland in the UK as a whole increased (+1.87%) compared to 2016. This is the first increase since 2008. In contrast, organic production in Europe has been consistently increasing year on year and is almost double what it was in 2005.
The area of land used for organic farming in Scotland in 2017 was 122,660 hectares which was an increase of 1,062 hectares (+0.87%) compared to the previous year. Grassland accounts for the majority (~93%) of the organic land and cereals about 4%, which, in percentage terms, is similar to the previous year.
In 2017 the total number of organic livestock increased by around +12%. Although there was an increase across all four livestock types (poultry, pigs, sheep and cattle), the greatest increase was in the number of sheep (~39,000 head), followed by poultry (~5,400 head).
Total organic food sales in the UK increased in 2017 by 6% creating a market worth £2.2 billion. Organic produce makes up 1.5% of the UK food and drink sector.
At farm level, prices for the main Scottish organic outputs are improving. The organic milk price premium is generally 10ppl premium on conventional milk. The finished beef price trend has generally followed the conventional price, but the organic premium has improved at around 60-100p/kg and prices have been ahead of the previous year. The premium for organic lamb remains small at around 10-20p/kg and prices have not fluctuated as much as previous years.
The prices for organic cereals have improved in line with conventional price rises. The premium for organic cereals remains around £100/t over the conventional cereal market.
Scottish Government support for the organic sector remains strong through the Scottish Organic Action Plan, and through funding for organic farming in the 2014-2020 SRDP.
Why farm organically? Organic produce attracts a price premium. This premium can be volatile, depending on supply and demand. Organic farming systems also have lower variable costs than conventional systems, as many inputs are prohibited. When enterprise output can be maintained, organic farming enterprises have the potential to leave a good gross margin.
In Scotland, organic farming is also supported under the Agri-environment Climate Scheme (AECS) of the Rural Development Programme. Attractive rates are available for both organic conversion and maintenance funding as shown in the following table.

ORGANIC FARMING 233
Year 1 Year 2 Year 3 Year 4 Year 5 £/ha Conversion Maintenance
Arable 280 280 65 65 65 Fruit/veg 400 400 200 200 200 Improved grass 140 140 55 55 55 Rough grazing 12.50 12.50 8.50 8.50 8.50
The first two years of organic conversion payments are higher than the latter three years where maintenance rates apply. This is to compensate for lower output during the conversion period before organic premiums can be attained.
Land that is managed organically is exempt from all Greening requirements of the Basic Payment Scheme (BPS) (see the Rural Aid Schemes section on page 437).
The principles of organic farming also accord with the ethos of many land managers. Using clover and livestock manures to provide fertility, the promotion of health rather than treatment of disease, and an ‘acceptable’ weed burden that provides food for birds and pollinating species are the aims of some land managers. Going through the formal process of certification allows produce to be sold as organic, and so receive a price premium.
How to get into organic farming Some farm businesses require big changes to their systems in order to convert, while others will require little change. It is worth talking through the implications of converting with an adviser. Many organisations run organic farm walks throughout the year, giving farmers the chance to visit an organic farm which will demonstrate the link between organic farming and good environmental management.
There are several different organic bodies that provide certification (details on page 235). The choice of certification body can depend on several factors, including cost and the enterprises operated on the farm. Grant funding is available for farmers, and it is advisable that this is secured before conversion.
Organic conversion Converting to organic farming will require changes in farm management with emphasis on increasing a farm’s self-reliance: growing most of its own livestock feed; recycling nutrients through manure management; and using ley phases with a lot of clover to fix nitrogen, and which helps to provide fertility for arable crops later in the rotation. As well as building fertility, crop rotations also provide clean grazing and help manage the weed burden. The requirement for more ‘natural’ production restricts the amount of concentrates that can be fed to cattle and sheep, emphasising a forage-based system. Housed livestock have minimum stocking densities, and must also have a dedicated lying area, possibly necessitating changes to housing with existing slatted floors.

ORGANIC FARMING 234
Technical information The data used in the preparation of the gross margins overleaf has been a necessary compromise of organic production figures from across Scotland. This should be borne in mind when using the margins, for example, in areas where straw is difficult to source a much higher price should be allocated to bedding.
Silage yield is based on a lower yielding, two cut system. Where yields are high due to a large clover yield in a year with an early spring, this should be increased. If only one cut is taken and yields are lower then the forage area will have to be adjusted accordingly. Silage costs are based on baling and wrapping a third of the silage produced. This cost will increase or decrease depending on the proportion of pit or baled silage.
Organic certification Any farmer wishing to produce food for sale as organic must comply with regulations setting out the minimum standards of production. Certification bodies have their own standards which are generally more specific, and in some respects stricter than the basic EU standards. All farmers in the UK are certified to this higher level.
Compared to 2016, there was an increase in the number of licensed producers and processors in Scotland from 560 in 2016 to 578 in 2017.

ORGANIC FARMING 235
Organic Farming Contacts
Certification bodies
Scottish Organic Producers Association (SOPA)
0131 335 6606 [email protected]
The Biodynamic Association (BDA) 01453 759 501 [email protected]
Organic Farmers and Growers (OF&G) 01939 291 800 [email protected]
Irish Organic Association (IOA) +353 090 643 3680 [email protected]
The Organic Food Federation 01760 720 444 [email protected]
Organic Trust Ltd. + 353 (0) 185 30271 [email protected]
Quality Welsh Food Certification Ltd. (QWFC)
01970 636 688 [email protected]
Soil Association Certification Ltd.
England: 0300 330 0100
Scotland: 0131 666 2474
Global Trust Certification Ltd. 01244 898165 [email protected]
Information and advice
The Organic Research Centre 01488 658 298 [email protected]

ORGANIC FARMING 236
Organic Wheat - Winter
PHYSICAL DATA
(a) Seed Organic seed sown at 200 kg/ha (1.60 cwt/acre).
(b) Fertiliser No manure or mineral fertiliser applied routinely to first crop after ley.
Annualised cost of rock phosphate and permitted potash fertiliser (e.g. sulphate of potash) after derogation.
(c) Trace elements Trace elements (e.g. manganese sulphate).
(d) Other crop expenses Net wrap at 50-77p/bale for round straw bales.

ORGANIC FARMING 237
Organic Wheat - Winter
GROSS MARGIN DATA
Grain yield: t/ha (t/acre) 4.0 (1.6) 5.3 (2.1) 6.5 (2.6)
Straw yield: t/ha (t/acre) 2.1 (0.9) 2.8 (1.1) 3.4 (1.4)
OUTPUT
Grain @ £290/t* 1,160 1,537 1,885
Straw @ £50/t 106 140 172
1,266 (512) 1,677 (679) 2,057 (832)
VARIABLE COSTS
Seed @ £560/t 112 112 112
Fertiliser 23 23 23
Trace elements 10 10 10
Other crop expenses 8 11 14
154 (62) 157 (63) 159 (64)
GROSS MARGIN 1,112 (450) 1,520 (615) 1,898 (768)
GRAIN PRICE SENSITIVITY
£270 /t 1,032 (418) 1,414 (572) 1,768 (715)
£310 /t 1,192 (482) 1,626 (658) 2,028 (821)
£330 /t 1,272 (515) 1,732 (701) 2,158 (873)
* Feed price (milling premium £30/t)
£/ha (acre)
Basis of data:
Sale price estimate for 2019 crop, September/October ex-farm spot price at 15% moisture content and average quality.

ORGANIC FARMING 238
Organic Oats - Spring
PHYSICAL DATA
(a) Seed Organic seed sown at 200 kg/ha (1.60 cwt/acre).
(b) Fertiliser No manure or mineral fertiliser applied routinely to first crop after ley.
Manure applied to 2nd
and 3rd
crop after ley. Annualised cost of rock phosphate and permitted potash fertiliser (e.g. sulphate of potash) after derogation.
(c) Trace elements Trace elements (e.g. manganese sulphate).
(d) Other crop expenses Net wrap at 50-77p/bale for round straw bales.

ORGANIC FARMING 239
Organic Oats - Spring
GROSS MARGIN DATA
Grain yield: t/ha (t/acre) 3.0 (1.2) 4.0 (1.6) 5.0 (2.0)
Straw yield: t/ha (t/acre) 1.8 (0.7) 2.4 (1.0) 3.0 (1.2)
OUTPUT
Grain @ £280/t* 840 1,120 1,400
Straw @ £50/t 90 120 150
930 (376) 1,240 (502) 1,550 (627)
VARIABLE COSTS
Seed @ £540/t 108 108 108
Fertiliser 23 23 23
Trace elements 10 10 10
Other crop expenses 7 10 12
149 (60) 151 (61) 153 (62)
GROSS MARGIN 781 (316) 1,089 (441) 1,397 (565)
GRAIN PRICE SENSITIVITY
£260 /t 721 (292) 1,009 (408) 1,297 (525)
£300 /t 841 (340) 1,169 (473) 1,497 (606)
£320 /t 901 (365) 1,249 (505) 1,597 (646)
* Milling price (feed price £30/t lower)
£/ha (acre)
Basis of data:
Sale price - estimate for 2019 crop, September/October ex-farm spot price at 15% moisture content and average quality.

ORGANIC FARMING 240
Organic Barley - Spring
PHYSICAL DATA
(a) Seed Seed sown at 200 kg/ha (1.6 cwt/acre).
(b) Fertiliser No manure or mineral fertiliser applied routinely to first crop after ley.
Manure applied to 2nd
and 3rd
crop after ley. Annualised cost of rock phosphate and permitted potash fertiliser (e.g. sulphate of potash) after derogation.
(c) Trace elements Trace elements (e.g. manganese sulphate).

ORGANIC FARMING 241
Organic Barley - Spring
GROSS MARGIN DATA
Grain yield: t/ha (t/acre) 3.0 (1.2) 4.0 (1.6) 5.0 (2.0)
Straw yield: t/ha (t/acre) 1.6 (0.6) 2.1 (0.9) 2.7 (1.1)
OUTPUT
Grain @ £280/t* 840 1,120 1,400
Straw @ £55/t 87 117 146
927 (375) 1,237 (501) 1,546 (626)
VARIABLE COSTS
Seed @ £540/t 108 108 108
Fertiliser 23 23 23
Trace elements 10 10 10
Other crop expenses 6 8 11
148 (60) 150 (61) 152 (61)
GROSS MARGIN 779 (315) 1,087 (440) 1,394 (564)
GRAIN PRICE SENSITIVITY
£260 /t 719 (291) 1,007 (408) 1,294 (524)
£300 /t 839 (340) 1,167 (472) 1,494 (605)
£320 /t 899 (364) 1,247 (505) 1,594 (645)
* Feed price (malting premium £30/t)
£/ha (acre)
Basis of data:
Sale price estimate for 2019 crop.
ORGANIC FARMING 242
Organic Beans - Spring
PHYSICAL DATA
(a) Seed Seed sown at 225 kg/ha (1.8 cwt/acre).
(b) Fertiliser No manure or mineral fertiliser applied routinely to first crop after ley.
Manure applied to 2nd
and 3rd
crop after ley. Annualised cost rock phosphate and permitted potash fertiliser (e.g. sulphate of potash) after derogation.
(c) Trace elements Trace elements (e.g. manganese sulphate).

ORGANIC FARMING 243
Organic Beans - Spring
GROSS MARGIN DATA
Grain yield: t/ha (t/acre) 3.0 (1.2) 5.0 (2.0)
OUTPUT
Grain @ £380/t* 1,140 1,900
1,140 (461) 1,900 (769)
VARIABLE COSTS
Seed @ £650/t 163 163
Fertiliser 23 23
Trace elements 10 10
Other crop expenses - -
196 (79) 196 (79)
GROSS MARGIN 944 (382) 1,704 (689)
GRAIN PRICE SENSITIVITY
£340 /t 824 (333) 1,504 (609)
£420 /t 1,064 (431) 1,904 (771)
£440 /t 1,124 (455) 2,004 (811)
* Feed price
£/ha (acre)
Basis of data:
Sale price estimate for 2019 crop. Deductions for high levels of field beans which do not meet minimum quality standards can reduce the price considerably.

ORGANIC FARMING 244
Organic Potatoes - Maincrop
PHYSICAL DATA
Machine harvested
(a) Seed Planted at 2.5 t/ha. This figure can rise to 4 t/ha depending on seed
size. Organic seed must be used unless a derogation is obtained for specialist varieties.
(b) Fertiliser
Farm yard manure used, no artificial fertiliser.
(c) Sprays Seed treatment None.
Nematicide Assumption of no treatment applied.
Herbicides None used.
Blight control Copper oxychloride (derogation obtainable).
Aphid control None used.
Slug control 2 applications of ferric phosphate (derogation obtainable) for high risk situations. If low risk situation (i.e. sandy soils), reduce spray cost by £43/ha.
Desiccation
Pulverising and/or gas burning. See page 355 for costs.
(d) Other crop expenses Levy costs, SGRPID field inspection fees; roguing and labels and
positive ventilation and cold storage are included. Other costs may include bags (£7.50-£11.20/t of crop) and royalties (which will depend on variety).
(e) Irrigation Irrigation may be applied in some circumstances for yield and quality.
These costs are not included. Annual capital charge could be £350-500/ha plus £1.60-1.90/ha.mm with a contract charge of approximately £5.40/ha.mm.
(f) Casual labour These costs are not included. Costs calculated using the data below
could be used. Labour charged at £12/hr as per labour rates on page 64 for low yielding potato crops.

ORGANIC FARMING 245
Organic Potatoes - Maincrop
GROSS MARGIN DATA
Yield: t/ha (t/acre): seed - (0.0) - (0.0)
Yield: t/ha (t/acre): ware 25 (10.1) 49 (19.8)
Yield: t/ha (t/acre): s/feed 1 (0.4) 2 (0.8)
26 (10.5) 51 (20.6)
OUTPUT
Seed @ £0/t - -
Ware @ £280/t 7,000 13,720
Stockfeed @ £10/t 10 20
7,010 (2,837) 13,740 (5,561)
VARIABLE COSTS
Seed @ £300/t 750 750
Fertiliser - -
Sprays 134 134
Other expenses 2,059 3,884
2,943 (1,191) 4,768 (1,930)
GROSS MARGIN 4,067 (1,646) 8,972 (3,631)
WARE PRICE SENSITIVITY
£150 /t 817 (331) 2,602 (1,053)
£250 /t 3,317 (1,342) 7,502 (3,036)
£310 /t 4,817 (1,949) 10,442 (4,226)
£360 /t 6,067 (2,455) 12,892 (5,217)
£/ha (acre)

ORGANIC FARMING 246
Organic Dairying
Introduction Organic dairy farming aims for self-sufficiency within a unit. An effective way of doing this is by utilising high quality grass silage as the main source of both protein and energy. This achieves economies in concentrate feeding. Further economies are made by replacing dairy cake with home mixes.
Gross margins The enterprise performance levels are specific to the individual cow per annum based on the whole herd performance divided by the average number of cows in the herd. They allow for a number of variables, but also contain a number of constant assumptions.
Variables Traditionally dairy herds could either be classed as spring or autumn calving. A more level production of milk is now being encouraged by co-operatives. This has resulted in adjustments in calving patterns, with more herds now achieving all-year round calving.
Feeding systems vary ranging from a simple system of silage or grass ad-lib with parlour cake fed to yield. Higher input systems may make use of a partial mixed ration with a low level of concentrate fed along with silage, again topped up with parlour feeding. Total mixed rations may also be fed without additional parlour feed. Whatever the system, forage inclusion must be a minimum 60% of the total ration on a dry matter basis. It is a requirement of the organic standards that dairy cows must be at pasture when conditions allow, which is typically over 200 days on average per year.
Constant assumptions
Herd life 3 to 5 years Calving interval 390 days Cow mortality 1-2% Calf mortality (up to 7 days) 8% Size of cow 650 kg Winter feeding period 200 days
Rations For simplicity the feeds included have been restricted to ad-lib silage and grass plus 18% crude protein, 13.0 ME compound cake.
ORGANIC FARMING 247
Organic Dairying - Summary of Assumptions
(a) Average price assumed (ppl) An average price of 41ppl is assumed. This will fluctuate seasonally and may be partly dependent on quality characteristics.
(b) Calf value A sale/transfer price of £155/hd has been adjusted for calving interval and mortality. The calf value can be altered by £8.61 for each £10 difference in the sale/transfer price.
(c) Cull cow (annual share) A sale price of £513.00/hd has been adjusted for herd life and mortality, and assumes no variation between high and low yielding cows. The annual share can be altered by £2.34 for each £10 difference in cull cow price. Assumed herd life of 4.17 years.
(d) Heifer replacement (annual share) Heifer purchase/transfer price varies according to yield. A purchase price equating 15ppl has been used, here, and this has been adjusted for herd life and mortality. The annual share can be altered by £2.45 for each £10 difference in purchase/transfer price.
(e) Other livestock expenses These are taken from commercial dairy herds and include milk recording, bedding sawdust and dairy detergents.
ORGANIC FARMING 248
Organic Dairy Cow - 7,000 Litres
PHYSICAL DATA
Calving period All year
/cow
Average annual yield (litres) 7,000
Feed requirements (kg)
Silage (kg) 8,500
Concentrates (kg) 1,800
Concentrates fed per litre (kg) 0.26
Overall forage area (ha)
Silage and aftermath grazing 0.32
Grazing 0.35
Total 0.67
Basis of data:
See Summary of assumptions-physical data, page 246-247.

ORGANIC FARMING 249
Organic Dairy Cow - 7,000 Litres
GROSS MARGIN DATA
Calving period All year
/cow
Average annual yield (litres) 7,000
OUTPUT £
All year milk @ 41 p/litre 2,870
Calf value 134
Cull cow (annual share) 123
3,127
Less: Heifer replacement (annual share) 257
2,870
VARIABLE COSTS
Concentrates @ £405/t 729
AI 46
Vet & medicines 74
Other livestock expenses 91
939
Gross margin before forage 1,931
Forage variable costs:
Silage @ £48/ha 15
Grazing @ £48/ha 17
Total Variable costs 971
GROSS MARGIN £/cow 1,899
GROSS MARGIN £/ha 2,835
Sensitivity-Change ±
1 p/litre in milk price 70
£10/t in concentrate price 18

ORGANIC FARMING 250
Organic Suckler Cows - Mainly Silage Diets
PHYSICAL DATA
Breed: Commercial type cows bred to a range of bulls,
mostly continental
Calving period Feb-Apr
Calves weaned (%) 92
Month of weaning October
Days to weaning 220
Month of sale October
Liveweight of calves at sale
Steers (kg) 260
Heifers (kg) 240
Herd life of cows (years) 7
Herd life of bulls (years) 4
Cow mortality (%) 2
Calf mortality (%) 3
Cow:bull ratio (:1) 35
Feeding/cow and calf (winter days): 180
silage (t) 6
calf concentrates (kg) 180
cow concentrates (kg) -
Straw (t) 0.9
Silage:
Change in Gross Margin/100 ewes (£) yield 30 t/ha from 2 cuts;
quality DM 220 g/kg; ME 10.5 MJ/kg DM
Overall forage area (ha)
silage and aftermath grazing 0.20
grazing 0.45
0.65
Assumptions:
Mainly grass farm either buying in all straw and concentrates or growing small amount of cereals.
Note:
1. Cull cow value based on 100% of cull cows into the food chain. 2. SSBSS based on 94% calves claimed. See pages 145-146 and 445
for more details.

ORGANIC FARMING 251
Organic Suckler Cows - Mainly Silage Diets
GROSS MARGIN DATA
Calving period Feb-Apr
OUTPUT £/cow
Calf sales (lwt - 92% crop)
Steers Heifers
260 kg @ 227p 240 kg @ 222p 517
Scottish Suckler Beef Support Scheme 92
609
Less: Replacement - cow 88
bull 26
495
VARIABLE COSTS
Barley @ £303/t 55
Minerals 15
Vet & medicines 20
Straw - feeding & bedding @ £95/t (bought-in) 86
Commission, tags & levies 26
202
Gross Margin before forage 293
Forage variable costs:
silage @ £48/ha 10
grazing @ £48/ha 22
30 t/ha from 2 cuts; 32
Total Variable Costs 234
GROSS MARGIN £/cow 261
GROSS MARGIN £/ forage ha (acre) 402 (163)
Sensitivity-Change ±
10 p/kg in lwt sale price 23
Sale weight ± 10kg 20
Herd life ± 1 year 18
Replacement cost prices:
Cull cow £900 In-calf heifer (purch.) £1,450
Cull bull £1,150 Replacement bull £4,750

ORGANIC FARMING 252
Organic Finishing Cattle
PHYSICAL DATA
Liveweight at purchase (kg) 250
Liveweight at slaughter:
kg lwt 580
kg dwt 320
Cattle bought October
Cattle sold January
Finishing period (days) 440
Liveweight gain (kg) 330
Daily liveweight gain (kg) 0.75
Supplementary feed-barley, protein & minerals (kg) 700
Straw (t) 0.8
Overall forage area (ha)
silage and aftermath grazing 0.22
grazing 0.25
0.47

ORGANIC FARMING 253
Organic Finishing Cattle
GROSS MARGIN DATA
OUTPUT £/head
Sale value (dwt):
320 kg @ 430p 1,376
Less: Purchased store calf in October (lwt)
250 kg @ 225p 563
813
VARIABLE COSTS
Barley, protein & minerals @ £348/t 244
Vet & medicines 18
Straw - feeding & bedding @ £95/t (bought-in) 76
Commission, tags & levies 47
385
Gross Margin before forage 428
Forage variable costs:
silage @ £48/ha 11
grazing @ £48/ha 12
23
Total Variable Costs 408
GROSS MARGIN £/head 405
GROSS MARGIN £/ha (acre) 861 (348)
Sensitivity-Change ±
10 p/kg in dwt sale price 32
Dwt sale weight ± 10kg 43
ORGANIC FARMING 254
Organic Breeding Ewes - Finished Lamb Production
PHYSICAL DATA
Breeds Crossbred ewe to terminal sire
Lambing period April/May
Lamb crops per ewe (avg) 4
Ram flock life (seasons) 3
/100 ewes tupped
Rams (no.) 2.5
Lamb numbers: marked 150
mortalities 5
sold finished 145
Lamb lwt at slaughter (kg) 42
Lamb dwt at slaughter (kg) 20
Ewes: culls 20
mortalities 5
gimmers purchased 25
Wool sales (kg) 272
Concentrate use: barley/mineral (kg) 2,000
Total concentrate (kg) 2,000
Forage (ha): silage 1
grazing 12
Total forage (ha) 13
Basis of data:
1. Silage yield and quality 30 t/ha from 2 cuts; ME 10.5 MJ/kg DM. 2. Breeding stock and finished lamb prices 2018/19 season.

ORGANIC FARMING 255
Organic Breeding Ewes - Finished Lamb Production
GROSS MARGIN DATA
OUTPUT £/100 ewes tupped
Finished lambs: 145 @ £82/hd 11,890
Cast ewes: 20 @ £78/hd 1,560
Wool sales: 272kg @ £0.85/kg 231
13,681
Less: 25 gimmers purchased @ £150/hd 3,750
ram replacement (net) 292
9,639
VARIABLE COSTS
Cereals & minerals @ £356/t 712
Vet, medicines & dips 400
Commission, levies, shearing, scanning & tags 969
Gross margin before forage 7,558
Forage variable costs:
1 ha silage @ £48/ha 48
12 ha grazing @ £48/ha 576
Total Variable Costs 2,705
GROSS MARGIN 6,934
GROSS MARGIN £/ forage ha (acre) 533 (216)
Sensitivity-Change ± Change in Gross Margin/100 ewes (£)
£1/hd in finished lamb price 145
£1/hd in draft ewe price 20
5% change in lambs sold 595

Crofts and Small Farms

CROFTS AND SMALL FARMS 258
Introduction
This section gives an overview of crofting and small farms.
Information on land tenure and legislation is included as well as information on support schemes specifically directed to crofts and small farms.
Gross margins have been designed with a smaller scale in mind. These focus on beef cattle, sheep and poultry.
For new entrants to farming, this section should be read in conjunction with the New Entrant section on page 401.
Crofting
Crofting is a form of land tenure which is unique to Scotland. Generally, a croft is a relatively small agricultural land holding which is normally held in tenancy and which may or may not have buildings or a house associated with it.
Crofts range in size from less than 0.5 ha to more than 100 ha. An average croft is nearer 5 ha.
A crofter is the tenant or owner-occupier of a croft. Usually, the crofter holds the croft on the "statutory conditions", which apply to every croft tenancy, and will not have a written lease.
There are 20,570 crofts in Scotland with 15,388 individual crofters making up crofting households with a total population of around 33,000.
There are legislative duties which must be adhered to when taking over a croft. Residence on the croft is required or the crofter must reside within 32km. There is a duty not to neglect the croft, to cultivate and maintain the croft for agriculture or to put it to another purposeful use (e.g. any use which does not have an adverse effect on the croft, the public interest, the interests of the landlord or the use of adjacent land).
Common grazings There are over 1,000 common grazings in the crofting counties. A common grazing is an area of land shared by a number of crofter shareholders. The use of a common grazing is governed by a grazing committee, elected by the shareholders in the common. Individual shareholders have a ‘souming’ which governs the amount of stock they are allowed to graze. Details of shares and ‘soumings’ are contained in the common grazings regulations.
The Crofting Commission The Crofting Commission is a Non-Departmental Public Body (NDPB) responsible for regulating crofting. The Commission comprises of five
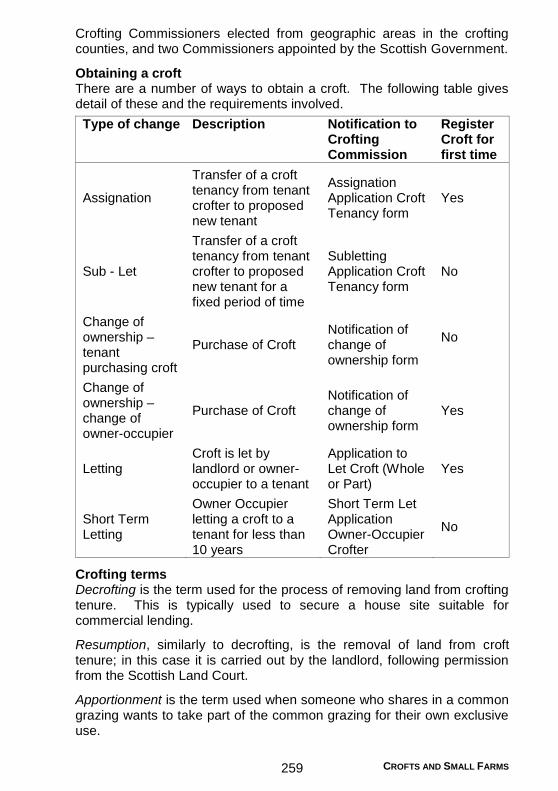
CROFTS AND SMALL FARMS 259
Crofting Commissioners elected from geographic areas in the crofting counties, and two Commissioners appointed by the Scottish Government.
Obtaining a croft There are a number of ways to obtain a croft. The following table gives detail of these and the requirements involved.
Type of change Description Notification to Crofting Commission
Register Croft for first time
Assignation
Transfer of a croft tenancy from tenant crofter to proposed new tenant
Assignation Application Croft Tenancy form
Yes
Sub - Let
Transfer of a croft tenancy from tenant crofter to proposed new tenant for a fixed period of time
Subletting Application Croft Tenancy form
No
Change of ownership – tenant purchasing croft
Purchase of Croft Notification of change of ownership form
No
Change of ownership – change of owner-occupier
Purchase of Croft Notification of change of ownership form
Yes
Letting Croft is let by landlord or owner-occupier to a tenant
Application to Let Croft (Whole or Part)
Yes
Short Term Letting
Owner Occupier letting a croft to a tenant for less than 10 years
Short Term Let Application Owner-Occupier Crofter
No
Crofting terms Decrofting is the term used for the process of removing land from crofting tenure. This is typically used to secure a house site suitable for commercial lending.
Resumption, similarly to decrofting, is the removal of land from croft tenure; in this case it is carried out by the landlord, following permission from the Scottish Land Court.
Apportionment is the term used when someone who shares in a common grazing wants to take part of the common grazing for their own exclusive use.

CROFTS AND SMALL FARMS 260
Crofting register The crofting register is map based and provides a definitive record of the extent of, and interest in, land within crofting tenure in Scotland. The register shows the boundaries of land and also name and address of the crofter. The register is maintained by the Keeper of the Registers of Scotland.
Applications to register a croft should be submitted to the Crofting Commission. As well as completing Form A which can be found at https://www.ros.gov.uk/services/forms/guidance-and-forms you must also supply a clear and legible map showing the boundaries of the croft. Maps that meet the desired standard can be acquired from local authorities, architects and surveyors and distributors of Ordnance Survey maps.
Small Farms
In contrast to crofts, small farms are not specifically mentioned in legislation; instead they are governed under the same agricultural tenancy legislation as detailed in pages 372-377. In order to be eligible for small farm specific grants and services, the Scottish Government deems a small farm to be a holding between 3ha and 30ha in size.
Rural Aid Schemes for Crofts and Small Farms
Agriculturally active crofts and small farms are entitled to the same direct subsidies that are available to the rest of the farming industry, as detailed in the Rural Aid Schemes section on page 437. There are also grant schemes specifically designed to benefit crofters and small farmers.
Crofting Agricultural Grant Scheme (CAGS) This scheme provides grants for crofters to make improvements to their crofts and help to sustain their businesses. Funds of up to £25,000 for individual crofters and £125,000 for groups of crofters can be used for capital projects, such as the construction or improvement of agricultural buildings and for the establishment of Common Grazings Committees. CAGS grant rates are shown in the following table:
Individuals Groups 1
young
crofters 2
other
crofters
young
crofters 2
other
crofters
LFA 80% 60% 90% 80% NLFA 60% 40% 80% 60% 1
e.g. Grazing committees. 2
under 41 years old, with adequate occupational skills and competence, and in business for less than 5 years.
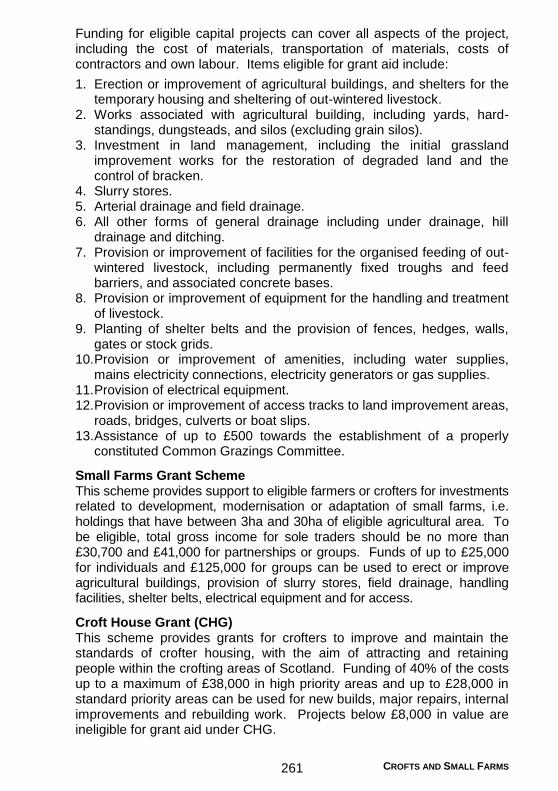
CROFTS AND SMALL FARMS 261
Funding for eligible capital projects can cover all aspects of the project, including the cost of materials, transportation of materials, costs of contractors and own labour. Items eligible for grant aid include:
1. Erection or improvement of agricultural buildings, and shelters for the temporary housing and sheltering of out-wintered livestock.
2. Works associated with agricultural building, including yards, hard-standings, dungsteads, and silos (excluding grain silos).
3. Investment in land management, including the initial grassland improvement works for the restoration of degraded land and the control of bracken.
4. Slurry stores. 5. Arterial drainage and field drainage. 6. All other forms of general drainage including under drainage, hill
drainage and ditching. 7. Provision or improvement of facilities for the organised feeding of out-
wintered livestock, including permanently fixed troughs and feed barriers, and associated concrete bases.
8. Provision or improvement of equipment for the handling and treatment of livestock.
9. Planting of shelter belts and the provision of fences, hedges, walls, gates or stock grids.
10. Provision or improvement of amenities, including water supplies, mains electricity connections, electricity generators or gas supplies.
11. Provision of electrical equipment. 12. Provision or improvement of access tracks to land improvement areas,
roads, bridges, culverts or boat slips. 13. Assistance of up to £500 towards the establishment of a properly
constituted Common Grazings Committee.
Small Farms Grant Scheme This scheme provides support to eligible farmers or crofters for investments related to development, modernisation or adaptation of small farms, i.e. holdings that have between 3ha and 30ha of eligible agricultural area. To be eligible, total gross income for sole traders should be no more than £30,700 and £41,000 for partnerships or groups. Funds of up to £25,000 for individuals and £125,000 for groups can be used to erect or improve agricultural buildings, provision of slurry stores, field drainage, handling facilities, shelter belts, electrical equipment and for access.
Croft House Grant (CHG) This scheme provides grants for crofters to improve and maintain the standards of crofter housing, with the aim of attracting and retaining people within the crofting areas of Scotland. Funding of 40% of the costs up to a maximum of £38,000 in high priority areas and up to £28,000 in standard priority areas can be used for new builds, major repairs, internal improvements and rebuilding work. Projects below £8,000 in value are ineligible for grant aid under CHG.

CROFTS AND SMALL FARMS 262
Eligibility is partly based on the production of a 5 year business plan for the croft. There are limits applied to the size of a new build house which relate to the number of bedrooms. Applications are accepted all year round, but decisions are typically made four times a year. Applications are scored based on a number of factors including those mentioned above.
Agri-Environment Climate Scheme (AECS) Full details of AECS can be found on page 448-449. There are a number of options which are particularly relevant for crofters and small farms. These include:
Management Option Payment Rate
Conservation Management of Small Units (up to 30ha) £77.78/ha Cattle Management on Small Units Retention - £107.38/ha (up to a max of 20ha @ 2 ha/cow) Introduction - £162.63/ha Cropped machair £239.76/ha
Croft and Small Farm Gross Margins
The gross margins on the following pages give an insight into livestock enterprises on a smaller scale. The gross margins are an illustration and must be adjusted for specific circumstances. The variable costs take account of added costs for smaller volumes being purchased and/or for being based in remote areas. All concentrate feeding and straw (for feeding and bedding) are assumed to be bought-in.
Beef The suckler cow margins are based on crofts and small farms with a mixture of inbye ground and rough grazing/common grazing. The margins provide an illustration of a herd with 10 native type suckler cows on in-wintered (native cross cattle) and out-wintered (pure native) systems calving mainly in February - April.
Output is based on a calving percentage of 90% and selling weaned calves in October. Income from the SSBSS (see page 445 for more detail) is based on the Island rate. This should be reduced for £40/cow (90% calving percentage) if budgeting for a mainland system. Adding value to output would come from direct marketing beef.
Replacement costs are based on purchasing all breeding stock. If hiring a bull, this cost should be adapted.
For more information on keeping cows see pages 112-121, 144-171, 380 and 383.
Sheep For crofts and small farms, sheep provide a basis in getting started in commercial livestock farming. Compared to cattle, sheep require a lower

CROFTS AND SMALL FARMS 263
capital investment to establish a flock and income can be generated within a 12 month period due to their short gestation period.
The sheep gross margins illustrate technical and financial performance for a range of croft and small farm situations. The margins are based on Blackface and Cheviot hill breeds and Mule and Texel type lowland breeds. Where other breeds are used, prices should be adjusted accordingly. Income comes from selling lambs and cast sheep at the auction market either as store or finished animals. Adding value to output would come from direct marketing lamb or fleece.
Replacement costs are based on retaining homebred ewe lambs or buying in gimmers for lowland situations. Rams are assumed to be hired. Where buying rams, costs should be adjusted. The margins do not account for keeping flock replacements.
For more information on keeping sheep see pages 112-121, 174-199, 380 and 383.
Free range chicken egg production Free range egg production is an ideal enterprise for a croft or small farm business. There is a smaller land requirement compared to other livestock, low flock set-up costs and quick and regular cashflow. Any significant capital expense will be mainly dictated by requirement for bird housing.
When keeping more than 50 birds the keeper must be registered (see page 115 for more detail). If the intention is to sell eggs beyond the farm gate, e.g. to farm shops or local shops, then the business should be registered with the Scottish Government Eggs and Poultry Unit. For details and guidance see: https://www.ruralpayments.org/publicsite/futures/topics/inspections/all-inspections/egg-and-poultry-inspections/.
For alerts from APHA about poultry diseases see: http://animalhealth.system-message.co.uk/AH_subscribe_index.php
The enterprise illustrated assumes chicken egg production using hybrid birds. Egg production using native chicken breeds or other species, such as ducks or geese could also be considered. The gross margin assumes buying point of lay pullets, purchase of feeding in 25kg bags (purchasing at least 1t at a time) and marketing eggs at the farm gate using labelled (with laying date and best before) half dozen boxes. When selling the eggs at the farm gate, a premium price is available as customers appreciate the eggs freshness, provenance and taste.
Other croft and small farm enterprise options See the Diversification section on page 272 for more information on other livestock and farm diversification ideas.

CROFTS AND SMALL FARMS 264
Suckler Herd - Croft and Small Farm
PHYSICAL DATA
Breed: Cross bred native and purebred native cows bred to native bull.
Hill suckler
Calving period
Calves weaned 90% 90%
Month of weaning October October
Days to weaning 220 220
Month of sale October October
Lwt of calves: at weaning (kg) 253 210
Lwt of calves: at sale/transfer (kg) 253 210
Herd life of cows (years) 10 10
Herd life of bulls (years) 4 4
Cow mortality (%) 1 2
Calf mortality (%) 4 4
Cow:bull ratio (:1) 10 10
Feeding/cow and calf (winter days): 180 180
silage (t) 5.4 6
straw (t) 0.6 0
calf concentrates (kg) 100 100
cow concentrates (kg) 180 225
Grazing fertiliser (kg N/ha) 75 75
Silage & aftermath fertiliser (kgN/ha) 125 125
Silage:
yield (t/ha from 1-cut) 20 20
DM quality (g/kg) 250 250
ME quality (MJ/kg DM) 10.5 10.5
Overall forage area (ha):
silage and aftermath grazing 0.27 0.30
grazing 0.40 0.40
0.67 0.70
Housing system: In cubicles (if straw bedding used, adjust straw costs)
Straw for general use incl. calving pens 0.25 0.00
Straw bedding (t) 0.75 0.00
Upland suckler
out-winteredin-wintered
Feb-Apr

CROFTS AND SMALL FARMS 265
Suckler Herd - Croft and Small Farm
GROSS MARGIN DATA
Upland suckler Hill suckler
OUTPUT
Calf sales (lwt) 90% 90%
Steers Heifers
270 kg @ 225 p 235 kg @ 220 p 506 -
220 kg @ 215 p 200 kg @ 210 p - 402
Scottish Suckler Beef Support Scheme 128 128
634 530
Less: Replacement - cow 57 52
bull 30 30
547 448
VARIABLE COSTS
47 59
26 26
Vet & medicines 30 30
111 0
Commission, haulage, tags & levies 54 50
268 165
Gross Margin before forage 279 283
Forage variable costs:
silage @ £314/ha 85 94
grazing @ £102/ha 41 41
126 135
Total Variable Costs 394 300
GROSS MARGIN £/cow 153 148
GROSS MARGIN £/ha 229 212
Sensitivity-Change ± Change in Gross Margin/head (£)
10 p/kg in lwt sale price 23 19
Sale weight ± 10kg 20 19
Herd life ± 1 year 11 5
Replacement cost prices:
Native cross cull cow £700 Native cross i/c heifer (purch.) £1,200
Pure native cull cow £600 Pure native i/c heifer (purch.) £1,000
Cull bull £800 Replacement bull (purch.) £2,000
out-winteredin-wintered
£/cow
Straw feeding and bedding @ £130/t
Cow concentrates @ £260/t
Calve concentrates @ £260/t
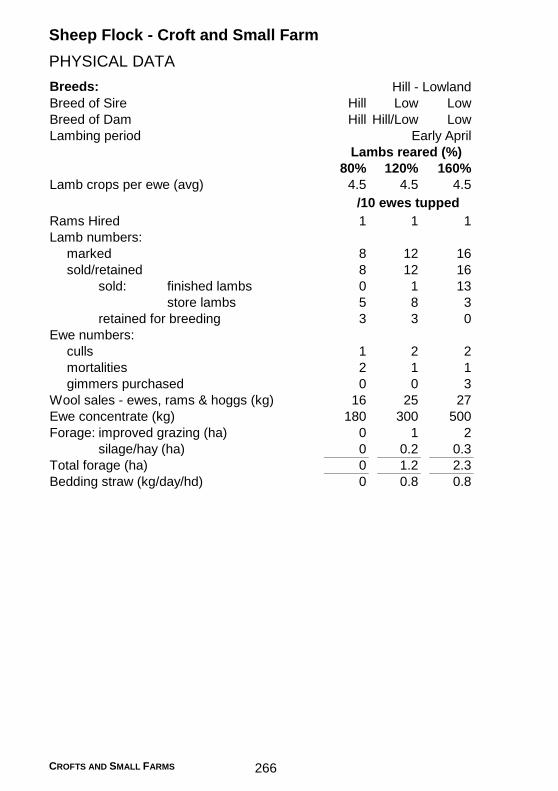
CROFTS AND SMALL FARMS 266
Sheep Flock - Croft and Small Farm
PHYSICAL DATA
Breeds: Hill - Lowland
Breed of Sire Hill Low Low
Breed of Dam Hill Hill/Low Low
Lambing period Early April
80% 120% 160%
Lamb crops per ewe (avg) 4.5 4.5 4.5
Rams Hired 1 1 1
Lamb numbers:
marked 8 12 16
sold/retained 8 12 16
sold: finished lambs 0 1 13
store lambs 5 8 3
retained for breeding 3 3 0
Ewe numbers:
culls 1 2 2
mortalities 2 1 1
gimmers purchased 0 0 3
Wool sales - ewes, rams & hoggs (kg) 16 25 27
Ewe concentrate (kg) 180 300 500
Forage: improved grazing (ha) 0 1 2
silage/hay (ha) 0 0.2 0.3
Total forage (ha) 0 1.2 2.3
Bedding straw (kg/day/hd) 0 0.8 0.8
/10 ewes tupped
Lambs reared (%)

CROFTS AND SMALL FARMS 267
Sheep Flock - Croft and Small Farm
GROSS MARGIN DATA
OUTPUT
80% 120% 160%
Finished lambs: 0 @ £0 - - -
1 @ £62 - 62 -
13 @ £68 - - 884
Store lambs: 5 @ £38 190 - -
8 @ £44 - 352 -
3 @ £53 - - 159
Cast ewes: 1 @ £37 37 - -
2 @ £55 - 110 -
2 @ £72 - - 144
Wool sales: 16 @ £0.65 10 - -
25 @ £0.65 - 16 -
27 @ £0.85 - - 23
237 540 1,210
Less: gimmers purchased @ £120/hd - - 360
ram hire @ £5/ewe 50 - -
ram hire @ £6/ewe - 60 60
187 480 790
VARIABLE COSTS
Ewe concentrates @ £260/t 47 78 130
Vet, medicines & dips 60 63 65
Bedding straw @ £130/t - 44 44
Commission, levies, haulage, 52 84 139
shearing, scanning & tags
159 269 378
Gross margin before forage 29 212 413
Forage variable costs:
silage @ £314/ha - 63 79
grazing @ £102/ha - 102 204
Total Variable Costs 159 433 660
GROSS MARGIN 29 47 130
Sensitivity-Change ± Change in Gross Margin/100 ewes (£)
10 p/kg lwt in finished lamb price - 4 50
£5/hd in all lamb sales 25 45 80
£5/hd in cast ewe price 5 10 10
£5/hd in gimmer price - - 15
Lambs reared (%)
/10 ewes tupped
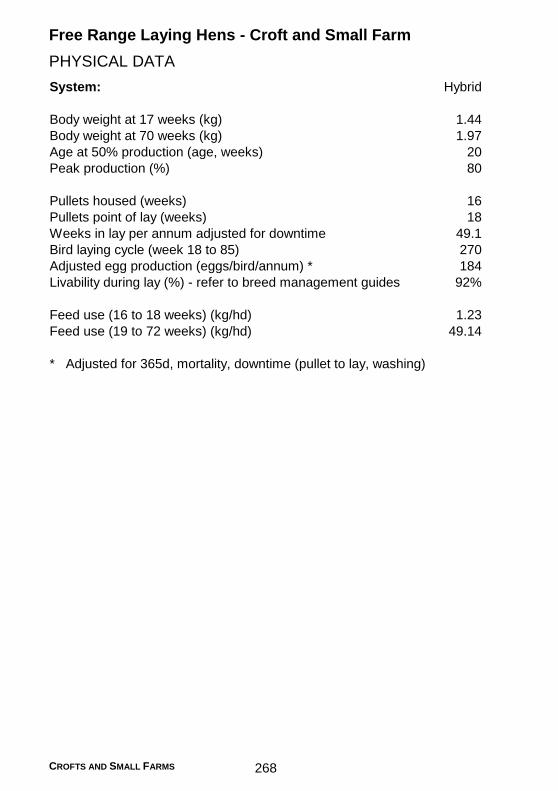
CROFTS AND SMALL FARMS 268
Free Range Laying Hens - Croft and Small Farm
PHYSICAL DATA
System: Hybrid
Body weight at 17 weeks (kg) 1.44
Body weight at 70 weeks (kg) 1.97
Age at 50% production (age, weeks) 20
Peak production (%) 80
Pullets housed (weeks) 16
Pullets point of lay (weeks) 18
Weeks in lay per annum adjusted for downtime 49.1
Bird laying cycle (week 18 to 85) 270
Adjusted egg production (eggs/bird/annum) * 184
Livability during lay (%) - refer to breed management guides 92%
Feed use (16 to 18 weeks) (kg/hd) 1.23
Feed use (19 to 72 weeks) (kg/hd) 49.14
* Adjusted for 365d, mortality, downtime (pullet to lay, washing)

CROFTS AND SMALL FARMS 269
Free Range Laying Hens - Croft and Small Farm
GROSS MARGIN DATA
OUTPUT £/100 bird/annum £/doz
Eggs sales @ £3/doz 4,598 3.00
Old hen value less catching cost 0 0.00
Less :
Pullet purchase @ £7 per bird 700 0.46
3,898 2.54
VARIABLE COSTS
Feed @ £388/t 1,431 0.93
Other bird expenses 400 0.08
Packaging - trays & cases 192 0.13
Total Variable Costs 2,023 1.14
GROSS MARGIN 1,875 1.40
Sensitivity ± Change in Gross Margin/100 birds/annum (£)
£0.10/doz eggs sold 153
£10/t feed 37
1% increase in mortality at point of lay (£/100 birds) -2
Note: Costs are typcially much higher in a smaller flock, however, this
can be mitigated through higher value egg sales direct to customers.


Diversification
DIVERSIFICATION 272
Introduction
It is estimated that around 52% of farms in the UK supplement traditional incomes through farm diversification (Source: Economic Report on Scottish Agriculture 2018). Income streams from such enterprises should help strengthen both these businesses and the wider rural economy. Government agricultural strategies recognise the need for farm businesses, where appropriate, to seek opportunities for sustainable diversification. In Scotland, public support for on-farm diversification via Rural Development funding (e.g. SRDP) may be available through the LEADER programme (2014-2020), see page 452 for more details.
While diversification seems to make good sense for many farmers, making diversification projects work can be challenging. It is important that farmers do not diversify out of desperation, as the underlying financial strength of the farm business clearly affects the resources which can be devoted to any new enterprise and it also affects the potential to borrow capital, or access any grant aid. At the very least a new enterprise will require a considerable commitment of time and energy which is bound to have a knock-on effect on the core farm business. Depending on the type of diversified enterprise chosen, it may also place pressures and demands on other resources such as labour, capital, buildings, land and machinery. Ultimately, any serious underlying financial problems in the core farm business may prevent what is otherwise a first-rate diversification development getting off the ground. The business case for diversification projects needs to be inherently strong, therefore the diversification enterprise must either complement the existing farm facilities and activities and/or be able to operate as a stand alone business.
Part-Time Off-Farm Work
Off-farm employment can provide an additional income stream to the farm business. When assessing opportunities for such work consideration should be given to factors such as the time and cost of travelling and the possible need to change the way the farm is operated to fit in with work patterns. Agricultural contracting continues to be a popular off-farm activity, using either surplus machinery or labour capacity, or machinery purchased specifically for this work. Contracting charges for a range of agricultural activities are shown on pages 353-356.
On Farm Diversification
On-farm diversification is a popular method of adding value to an existing farming, or land based, enterprise. On-farm diversification can supplement the total farm income utilising surplus resources such as land, buildings, or machinery. As with all types of diversification, thorough business planning is essential to assess the level of expected
DIVERSIFICATION 273
return from a new enterprise. As well as financial planning, legal and other issues may also need to be addressed. Aspects to consider in relation to on-farm diversification enterprises are detailed as follows:
Planning permission – Many opportunities for supplementary income will involve non-agricultural uses (change of use) of land and buildings, for which planning permission will be required. See pages 384-388 for further details.
Insurance – Likewise, many diversified enterprises will significantly alter the risks envisaged in standard insurance contracts, particularly for third party cover. Whilst some ventures may be able to be covered from the existing farm policy, it may be necessary to take out a new specific policy relating to the diversification business. It is essential that insurers are kept fully informed of these activities.
Value added tax (VAT) – If the business is VAT registered then VAT should normally be charged on business activities supplementary to an existing registered business. It may be possible by negotiation to establish that the new business is essentially separate from the existing one and need not be registered or charged VAT. In this latter case, VAT paid on inputs will not be recoverable. HMRC should be consulted regarding VAT issues. See page 491-494 for details on VAT.
Hygiene – Since 1 January 2006, EU food hygiene legislation has applied throughout the UK and this sets wide ranging standards for food preparation, handling and transport, and the premises and vehicles to be used. Penalties for failing to comply include substantial fines and imprisonment. Early consultation with the local authority is strongly recommended for any diversification activity involving food for human consumption. Useful information can also be found on the Food Standards Agency website (http://www.foodstandards.gov.scot).
Skills – A number of diversification businesses will require a range of skills beyond those normally used in many farming businesses. For example food production or retailing businesses are likely to require such skills including; customer service, sales, marketing, stock control, demand forecasting and pricing in order to be successful. It is likely that these skills either need to be acquired through training or by employing people with these talents.
Competition – For any diversification proposal, it is important to thoroughly research the marketplace and identify your competitors. Market research and competitor analysis should be carried out to identify market demand, opportunities, threats, and potential gaps in the market your enterprise could fulfil. If your diversification proposal is already being carried out, it is important to develop a Unique Selling Point (USP) to attract and retain customers.

DIVERSIFICATION 274
Sources of information for on-farm diversification Defra published an online guide for farm diversifications giving advice on suitable diversification options, alternative agricultural products, planning permission, and funding availability to support projects. This guide can be accessed at: https://www.gov.uk/guidance/diversifying-farming-businesses.
A useful guide to the process of diversification has been published by Kent Downs Rural Advice Service and can be found at: https://www.kentdowns.org.uk/planning/planning-publications/
In Wales, Farming Connect may also provide one-to-one subsidised support to registered farmers to help them think about and plan suitable diversification projects. For more information, contact your local Farming Connect Office or view details on-line at: https://businesswales.gov.wales/farmingconnect/.
A number of alternative enterprise information sheets are provided by the Centre for Alternative Land Use in Wales at: http://www.calu.bangor.ac.uk/technotes.php.en.
Speciality Crops
Speciality oil crops Several speciality oil crops have been grown in the UK for a wide range of uses. Some oilseed crops perform particularly well in Scotland yielding higher oil levels while others are not suited to Scotland due to agronomic constraints, particularly the higher risk of a late and wet harvest. Production of several crops has been concentrated in the south of England or overseas to ensure more reliable harvest conditions. Crops with greater potential for cultivation in Scotland are outlined below.
Oilseed rape – Developing specialist markets for conventional oilseed rape (Brassica napus) and also cultivation of oilseed rape varieties with specialist oil profiles allows diversification whilst having the benefit of a crop which is familiar to growers. Several growers throughout Scotland have set up specialist brands of cold pressed rapeseed oil for culinary use in recent years. These include Mackintosh of Glendaveny, Ola Oils, Summer Harvest, Borderfields, Supernature and Black and Gold. Markets have been developed which recognise the excellent nutritional characteristics of rapeseed oil (it has the lowest levels of saturated fatty acids of all commonly used fats and oils) in combination with the benefits of cold pressing to maintain natural vitamin content.
High Erucic Acid Rapeseed (HEAR) is grown to produce erucic acid, used as a specialist lubricant particularly for plastics for which it has clearance for food contact. Seed from HEAR varieties is not suitable for human consumption and HEAR varieties can not be grown in the same rotation as conventional varieties. Yields are typically below the best
DIVERSIFICATION 275
conventional varieties but similar to average yielding conventional varieties. Contracts for production are available from a number of merchants with current premiums around £25-30/t over conventional rapeseed.
Another oilseed rape type, with high oleic, low linolenic levels in its oil (HOLL), is used as a specialist healthy frying oil. The oil profile of this type means that it is very stable, resisting oxidation and retaining its taste in a catering environment. Details of varieties can be found on the North UK Oilseed Rape Varieties List (AHDB).
Linseed – Linseed oil is high in α-linolenic acid, and used for the manufacture of coatings, drying agents and putty. Although this fatty acid would be desirable for nutrition, its presence leads to rapid oxidation of the oil, reducing shelf life. The area of linseed has recently increased in the south of England as an alternative to oilseed rape which has become more difficult to establish since the neonicotinoid insecticide ban. In Scotland the area of linseed grown is currently low. Spring sown varieties tend to be rather late maturing for Scottish conditions. The introduction of autumn sown varieties provides an earlier harvest and these have potential for Scotland if winter hardiness can be confirmed with trials currently in progress.
Minor oilseed crops – A range of more novel oilseed crops can be grown in the UK and Scotland though few are presently being widely grown due to limited contracts and agronomic limitations though this may change.
Crambe: Like HEAR, Crambe (C abyssinica) is grown for the erucic acid contained in its seeds. It has been grown extensively in the UK and it grows well in Scotland. Crambe contains higher levels of erucic acid than HEAR, but its yields are slightly lower.
Echium: Echium (Echium plantagineum) also known as Viper‘s bugloss, produces high levels of stearidonic acid (14% of oil). The oil has valuable application in cosmetics and in skin care for the treatment of eczema and sunburn and as an anti-wrinkle preparation. Echium has been successfully grown in trials in Scotland. It is spring sown, the crop flowers for an extended period and time of swathing has to be carefully selected to maximise seed setting.
Specialist oilseed crops seed suppliers and contract buyers include; Premium Crops (www.premiumcrops.com), and Nature’s Crops (www.naturescrops.com). Essential oil crops Essential oil crops are generally grown on a smaller-scale than the specialist oil crops mentioned above and include high value opportunities. Several are being grown throughout the UK, including lavender,

DIVERSIFICATION 276
peppermint, rose and rosemary, although the less favourable conditions at harvest in Scotland limit production potential.
Fibre crops Flax and hemp for fibre can both be cultivated successfully in Scotland and more widely in the UK. There is interest in increasing the use of natural fibres, however, commercial scale processing of these fibres is currently absent or limited in Scotland and the UK at present.
The use of natural fibre products and the particular attributes of products derived from these fibres, is generating global interest in these crops for a wider range of fibre qualities. End uses include biocomposites for car components in the automotive industry, lightweight glass replacement in the aviation industry and insulation materials in the construction industry. A further use for hemp in construction is as hemcrete, where the inner core of the stem is blended with a lime based binder and cast around a timber frame. Hemcrete’s qualities of high levels of thermal insulation and excellent strength characters are of note and it meets building regulations, counting towards the code for sustainable homes (CSH).
Flax is traditionally used for high quality linen production requiring exacting production conditions, however, there is no longer a viable commercial market for it in the UK. There are no longer any large-scale buyers of hemp in the UK since Hemcore of Essex went into administration in 2013. A family run business remains processing its own hemp for horse bedding and construction in Yorkshire www.eastyorkshirehemp.co.uk/. There is also a nascent hemp producers association; www.ukhemp.co.uk/ .
Dual purpose hemp varieties are also available. In addition to using their stems for fibre, the oil from their seeds has an application in the specialist food market.
The lack of processing facilities in Scotland and the UK limits greater cultivation of these crops as they are bulky and expensive to transport in their raw state, hence it is necessary to have processing facilities close to the site of production for economic viability. A home office licence is required for the cultivation of hemp; this would normally be obtained by the processor of the hemp fibre.
Alternative Livestock
There are a wide range of alternative livestock enterprises that farmers can diversify into, many of which can use existing husbandry skills, and complement existing livestock systems on the farm. These alternative livestock are kept for fibre (e.g. cashmere goats, alpacas, angora goats, etc), meat (e.g. wild-boar, buffalo, ostrich, venison, ducks, geese, rabbits, etc), milk and dairy products (e.g. dairy-goats, dairy-sheep, water buffalo, etc) or worms for a variety of reasons including; composting of green
DIVERSIFICATION 277
waste, fishing bait, sale of composting and earth worms to households, etc.
Diversification into alternative livestock can bear considerable capital costs to start-up, particularly through the requirement to purchase livestock and equipment. Often the early adopters of alternative livestock species control the breeding stock and command premium prices for their stock so some industries in infancy can be expensive to enter. Examples of stock prices include:
Breeding female alpacas cost around £3,000 to £15,000 depending on age and pedigree. Stud males cost £20,000 to £40,000 depending on age and pedigree. Stocking density is 4 to 5 alpacas per acre. Fleeces vary in price - hand spinners pay £40 - £80 depending on quality. Specialist shearing is required at a cost of around £15 per animal.
Breeding wild boar sows cost from £300 - £600. Dairy goat does generally cost about £175 - £250. Boer meat goats generally cost around £200 - £400. Cashmere goat does generally cost about £100 with bucks costing
between £150 - £250. Dairy ewes generally cost from £150 - £300. Day old ducklings cost about £1.70 per chick whilst day old goslings
are about £6 per chick.
In addition to the actual cost of livestock, there are high capital costs associated with stock control, such as housing, fencing and specialist handling facilities (e.g. specialised wild boar and deer fencing). If the alternative livestock is being farmed for meat then it is also worthwhile checking that local abattoirs are licensed to slaughter that specific type of animal, and if not what alternatives (such as field slaughter) exist.
Small scale honey production may be a diversification option for some farmers. Bees play an important role in the pollination of food crops and could be introduced alongside an existing arable, fruit or vegetable enterprise. More information can be obtained from the Scottish Beekeepers’ Association (www.scottishbeekeepers.org.uk) and the British Beekeepers’ Association (www.bbka.org.uk).
Farmers considering diversifying into alternative livestock must assess the market potential for their product and ensure that an adequate return can be generated to meet the start-up costs. Some novel livestock industries have a limited infrastructure in place (to buy specialised feed, sale of breeding stock, or marketing of finished produce) meaning it is more difficult to negotiate on price or find alternative suppliers. There is a tendency in some forms of alternative livestock to rely on selling breeding stock as a means of recovering the capital investment, but market outlets for meat, fibre, and other products must be closely examined (perhaps through farmers’ markets and farm shops, or finding specialist high value niche markets for products). As such, it is advised that any farmer

DIVERSIFICATION 278
considering diversifying into alternative livestock should contact the appropriate producer association for advice and support at an early stage of the diversification process.
Information on deer farming can be found on pages 202-209.
Retailing
Selling farm produce directly to consumers can be an excellent diversification option for farmers enabling them to add value to their food or drink products. Those thinking of entering this market should take into consideration the production costs of the venture, the time, commitment, travel, competition and support required to sell directly to the consumer. These factors are not always reflected in pricing models, particularly time spent by producers and their families.
Growth in demand in the farm retail market has been promoted by food conscious consumers looking to re-connect with the countryside, purchasing fresh, local and traceable food with strong provenance.
The opportunity to develop direct retailing can be determined by factors such as capital availability and location (especially if a farm shop is proposed). Above all, a market demand and opportunity must have been established. As with any new venture, a business plan incorporating a marketing plan should be prepared and this should include information and research into all the relevant aspects of the proposal, such as:
The size of the local population within a 30-60 minute drive of the proposed retail outlet(s).
Capital costs: car parking and access, construction, storage facilities, purchase of a website domain name, purchase of delivery van, etc.
Running costs: including business rates, staff costs (bearing in mind that the shop may need to open evenings and weekends to maximise sales) and advertising.
Consideration of range, variety and pricing (this should reflect the quality of produce offered including the freshness, environmental impact and provenance of the produce on offer).
Planning permission requirements.
Legislative requirements (e.g. environmental health, food hygiene, labelling, health and safety, trading standards, access from the local Highways Authority).
Further advice is available from a number of sources including:
Connect Local: http://connectlocal.scot/ SAC Consulting Food and Drink: www.sruc.ac.uk/foodanddrink; 01224
711 044 Taste of Scotland: http://taste-of-scotland.com/farmers-markets-in-
scotland/

DIVERSIFICATION 279
National Farmers’ Retail and Markets Association: www.farma.org.uk; 0345 319 6740
The Larder - A Guide to Scotland’s Food & Drink: https://food.list.co.uk/guides/the-larder/
Scottish Government food and drink policy: https://beta.gov.scot/policies/food-and-drink/
Scotland Food and Drink: http://www.foodanddrink.scot/
Farmers’ markets There are currently over 500 certified farmers’ markets in the UK, with over 70 in Scotland (Source: National Farmers’ Retail & Markets Association). Most farmers’ markets are held monthly, with some held more frequently, particularly in areas with larger populations. Most farmers’ markets will have an ethos of providing the consumer with high quality food and drink grown or produced locally and some markets (often called community markets) will consider other products produced in the local area such as crafts or other artisan products. There is usually an expectation by both organisers of the markets and consumers that the market will offer the opportunity to buy directly from the producer.
Markets are often run by the farmers and producers themselves, or by town centre management companies, local councils or by companies appointed by councils to run markets. All farmers’ markets and individual stallholders are expected to meet the same standards of health, safety and labelling as any other retail outlet. Farmers’ markets can provide the opportunity to communicate the benefits of the product and gather feedback directly from the end user. Farmers’ markets are often considered more expensive by consumers, although research has indicated that product pricing is comparable with other retailers where similar high quality is available. In recent years a number of farmers markets have noticed a decline in interest as both consumers and farmers concentrate on farm shops and direct online sales.
Producers considering selling produce through a farmers’ market should:
Assess what is already being sold at the market? Will there be a demand for the produce? Is there enhancement of the product range?
Contact the market organiser for more information on the operation of the local market.
Visit a local market and obtain information on competitors’ products and prices.
Consult other sources of advice, e.g. the National Farmers’ Retail and Markets Association (www.farma.org.uk).
Ask whether the business can commit the time, money and other resources to preparing and selling produce at farmers’ markets?
Think about how the customer will be attracted to the product? Consider the product itself, packaging, information about the product, layout of the stall and price.

DIVERSIFICATION 280
Consider how the product can be stored and displayed, ensuring compliance with all legislation and other regulations. For more information contact the Food Standards Agency Scotland (www.foodstandards.gov.scot)
Farm shops Farm shops range in size and format, from a temporary kiosk (see page 281) by the road selling seasonal produce such as fruit, to large scale complexes with a substantial floor area, incorporating a café or restaurant and a children’s play area. The format depends upon the objectives and requirements of the business but the popularity of farm shops has increased considerably over the last decade and some of the biggest generate turnovers larger than the farms from which they originated.
Points to consider when planning a farm shop:
The increase in popularity of farm shops is linked to the growing trend amongst consumers to buy local food with provenance and traceability. Most farm shop businesses are based around products that are produced or made on the farm, in the shop, or where possible, within the local area.
A good access road, drive and car parking areas are vital as customers are reluctant to drive and walk through mud and pot holes to get to the shop or café.
A storage area similar to that of the shop, with good vehicle access will be required. Some of this will need to be chilled or refrigerated, depending upon what is being sold.
Building costs vary considerably depending upon size, type and extent of the development. Refurbishing redundant buildings can be more expensive than building new but may produce a more ‘authentic’ farm shop feel than a new build. If starting small, plan in room for expansion as the business grows, including the car parking area.
Linking the farm shop to produce grown or made on the farm and telling the history or provenance of the farm is a key marketing tool.
Encouraging customers to stay longer (dwell time) will generally increase average spend per customer. A café and or other activities such as play area, walking paths etc. will all help to increase dwell time.
This is a customer service business, so recruiting and retaining good staff is essential. If the shop is having a butchery and/or café selling good quality meals then a master butcher and chef may well be necessary.
Franchising areas (e.g. butchery or café) out to existing local businesses is worth considering as they bring the necessary skills and will help to reduce running costs.
Consider local competition and where possible incorporate a USP to differentiate from other farm retailers.
DIVERSIFICATION 281
Depending upon size, a well presented farm shop and café can generate an annual turnover of between £250,000 and £1,000,000 with some larger farm shops generating well over £1million per annum. Staff costs generally range between 20%-40% of total business turnover depending upon the type of business, with the percentage usually higher in the café (30%-50%) than the shop (12%-20%).
Footfall and spend per customer (average £11-16 per customer) are key elements in creating a successful business so keeping the offering interesting and good promotion are vital for continual growth.
Vending machines With strong demand for traceable food among consumers, installing a vending machine is a novel low cost method of diversification. Vending machines allow consumers to purchase fresh produce direct from the farm without the overheads involved with a farm shop. A 28 compartment vending machine costs around £8,000 for an ambient system to £15,000 for a refrigerated model. In the correct location with the correct produce the machines will have a payback period of around 12 months. Vending machines are good for attracting customers by offering fresh seasonal fruit and vegetables. Keeping vending machines stocked with fresh produce is important to ensure repeat customers. This may require a significant amount of labour dependent on the proximity of the machine from the farm. Typical produce includes 3-5kg potato bags, mixed vegetable boxes, fresh punnets of fruit, as well as milk and eggs.
Dairy farms could add value to their milk by investing in an on-farm milk vending machine. A milk vending machine would enable consumers to buy fresh, local milk directly from the farm. Location is a key factor determining the success of a vending machine. Vending machines should ideally be located near a busy road to attract passing trade. Farm buildings may need to be altered to accommodate the project and must meet food hygiene regulations. Milk vending machines vary in size and specifications. Costs for introducing a milk vending machine include:
100 litre (coin acceptor) machine ~ £7,000. 200 litre (coin acceptor) machine ~ £10,000. x2 200 litre machine in wooden or metal shed ~ £23,000. Contactless payment system ~ £720.
Tourism
Ecotourism and nature-based tourism An increasing number of tourists and visitors are looking for “greener” holidays or activities. This can range from looking for a true ecotourism experience to staying in “eco-friendly” accommodation to simply enjoying the natural landscape of an area. Ecotourism, which tends to be connected to educational aspects such as the promotion of sustainability, is different from nature-based tourism which can be viewed as tourism to

DIVERSIFICATION 282
places of natural significance or beauty, although there is some overlap between the two concepts.
Individual businesses could consider their own green credentials and how they could, if necessary, adjust their marketing to attract the maximum number of potential customers. Many businesses are members of initiatives such as the Green Business Tourism Scheme (www.green-tourism.com) and membership of such schemes can be used in marketing information and advertising material. A range of tourism businesses could incorporate nature-based activities such as wildlife-watching and adventure activities into what they offer their customers and how they market their business to take advantage of this interest. Information on the local environment, scenery and nature-based activities in the area could also be provided to potential customers. This also presents the opportunity for businesses to collaborate in the production of marketing information.
Self-catering Planning permission and building regulations (see pages 384-388) are the essential first steps when considering offering self-catering accommodation. If starting a new business or converting or extending your premises, you should contact your local authority planning department for their advice on planning permission at a very early stage. Even if you wish only to equip an existing building as a holiday cottage, you may need ‘change of use’ planning permission to do so. Any structural alterations to a property, or the construction of a new building, will be subject to building regulations, so again contact your local authority. Compliance with other regulations, particularly fire will also be required. Self-catering accommodation will be more successful when located along popular tourist routes and in areas with good tourist facilities/activities. As there may be strong competition for business in some areas, it is important to offer a high standard of accommodation and possibly other facilities, which will increase capital costs. Suitable parking and good vehicle accessibility are important. Good marketing is required to maximise occupancy rates and participation in quality assurance schemes will also be beneficial, e.g. VisitScotland Quality Assurance Schemes (www.visitscotland.org). Membership of associations can also be beneficial, such as the Association of Scotland’s Self-Caterers (http://www.assc.co.uk/).
Returns will depend on size, location, quality and season. It is important to keep properties well maintained and presented to encourage repeat custom and recommendations.
Bed and breakfast In common with self-catering units, the quality of bed and breakfast (B&B) accommodation must be of a high standard in order to attract customers in what is a very competitive market. Location and proximity to tourist attractions and facilities are also important selling points. It is important
DIVERSIFICATION 283
to consider seasonality and regional variations in occupancy when budgeting/forecasting. Compliance with all appropriate regulations, particularly fire regulations and relevant food hygiene regulations will also be required. If the establishment offers dinner, business rates may apply.
Facts and figures
Farmhouse B&B Self-catering
Accommodation tariffs 1 £50-£100/bed/night £230-£1,000+/week
Length of season 2 38wk 30-34wk
Occupancy rate 3 36-42% 48%
Operating costs 4 25-30% of output 50-60% of output
1
Charges vary depending on the location, low/high season, quality of the accommodation and the facilities available. Self-catering rates vary depending on number of occupants/rooms per cottage/lodge/villa.
2
The holiday season generally runs from April to October with peak occupancy expected from May to September.
3 2016 average occupancy (VisitScotland). 4
Costs include food (for B&Bs), hired/casual labour, repairs, renewals and maintenance, fuel, electricity, advertising, insurance and sundries.
Glamping pods Glamping pods (also known as wigwams) are a novel diversification option for farmers or landowners. Self-catering glamping pods are compact, functional, and fully insulated domed-shaped huts which offer customers a quality alternative to traditional camping. The pods can sleep 2 to 5 people depending on size, providing a romantic space for couples or a functional getaway for small groups. Glamping pods are ideally located near areas of spectacular scenery, on the banks of lochs, nestled beneath hillsides, along popular walking or cycling routes, or within close proximity of towns, villages or cities.
Glamping pods vary in size and specification. Pods cost around £12,000-£20,000.
Charges vary depending on season, quality, size and location. Good examples range between £45 and £90 per night. Planning permission may be required for pods in some locations.
Sources of information Sources of further information for tourist accommodation include:
Criteria/guidance for Small Serviced Classification (http://www.visitscotland.org/business_support/quality_assurance/accommodation/self_catering_accommodation.aspx)
Farm Stay (www.farmstay.co.uk) Accommodation in Scotland (http://www.explorescotland.net/holiday-
in-scotland/accommodation/)

DIVERSIFICATION 284
Farm Business Innovation 2018 (http://www.farmbusinessshow.co.uk/news/blog.asp?blog_id=2518)
Leisure Activities
In recent years there has been an increase in the number of British people choosing a holiday within the United Kingdom. The rise in the so-called “staycation” phenomenon is partly due to a falling pound against the euro. As British tourists seek holiday destinations this presents an opportunity for farmers to diversify into leisure activities.
Children’s activities Farm-based children’s soft play areas are popular among families during the holiday season. Converting old farm buildings or utilising fields for use as a children’s play park can be a profitable venture for farmers/landowners. Location, ease of access, and activities offered determine the success of the enterprise. A children’s play park would complement a farm shop, café or retail outlet. During the summer a straw bale maze is a novel activity for kids. A farm can charge around £5-10 per child per visit. Public liability insurance, health and safety, and PVG disclosure checks would be required.
Hovercrafts Hovercrafting is an extremely popular activity for stag and hen parties, corporate days, and tourists. A hovercraft is a cross between an aircraft and a boat designed to travel over water and land at speed. Hovercrafting can be incorporated into an existing farming enterprise, utilising spare grass fields (and rivers/lochs if available). Hovercraft activities can be hired out for £100-200 per person per hour. Package deals can be offered to larger groups. New hovercrafts cost around £8,000-15,000 each excluding VAT. Public liability insurance would be required to run a hovercraft activity centre.
Equestrian Enterprises
Equestrian related enterprises are often ideal diversification options for farms or rural occupiers due to the existing infrastructure and land. Enterprises that are commonly considered are:
Horse Livery Cross Country Schooling Course Riding School Horse Bed and Breakfast Horse Riding Holidays
It must be decided from the outset on the service that is to be provided and thus the level of input that is required. Factors to be considered include:

DIVERSIFICATION 285
Demand – In many areas there is an oversupply of equestrian facilities and it is strongly recommended that a feasibility study should be carried out before embarking on any new venture.
Location – Good riding country, with access for safe, off-road riding and within easy reach of at least one centre of population is the ideal situation. Enterprises with unique offerings, specialist services/facilities or located on the outskirts of major towns/cities may be able to command a higher rate.
Land – On free draining ground, horses and ponies will require around 0.50-0.75 hectares (1-2 acres) of well established, moderate quality grazing per head (equine grass mixtures are available). A larger area will be required where land is poorer or where year round turnout is required. If not enough land is available or where the diversified business is to be kept separate from the main farm business, rent will need to be considered. Grassland management costs will vary according to land available but may include a reseeding policy, with annual fertiliser applications and weed control, and seasonal field operations such as harrowing, rolling and topping.
Fencing – Well maintained fencing which is suitable for horses (electric fencing is often preferred), with good gates and an adequate water supply. In some cases smaller paddocks or all weather turnout areas may be required. See pages 359-360 for fencing costs.
Shelter – This will include field shelters and/or well ventilated permanent stables. Wooden field shelters or loose boxes cost around £2,000-£5,000 each. Conversion of an existing agricultural building may be less expensive. Construction of a 12 box yard, including tack and feed rooms could cost around £25,000 upwards (excluding groundworks and services). Rubber matting in stables is desirable but not essential. Some customers for DIY enterprises may have their own preference.
General facilities – Lorry and car hard standing parking areas, secure tack and feed stores, a muck disposal area, covered hard standing area with water supply and good drainage for grooming and washing down and toilet facilities are basic requirements. If storage for customers tack and other equipment on-site is provided, this should be factored into your insurance cover.
Riding facilities – An all-weather outdoor schooling area is almost essential in order to attract customers for some enterprises (e.g. livery yards) and an indoor arena may also be desirable (e.g. for riding schools). A 40m x 20m outdoor schooling area could cost between £10,000-40,000. A similar size indoor arena could cost between £75,000-150,000. Both outdoor and indoor costs are determined by the level of ground works required, the size of the arena, the surface chosen and provision of lighting and mirrors.

DIVERSIFICATION 286
Labour – Personnel with customer care and people skills are essential for equestrian enterprises and often a yard/facility manager with experience/qualifications in horse care and events is an important asset. Businesses employing labour will have costs such as wages, employers liability insurance and the cost of personal protective clothing. Training may be required for business owners or employees to develop their skills.
Operating costs – These are highly dependent on service provision and can include feed (concentrates and forage), bedding (straw or shavings), electricity and water, machinery repairs, fuel, property repairs, insurance, advertising/website/social media management and business rates.
Horse health and welfare – Information on the minimum requirement for keeping horses can be found in the Code of Practice for the Welfare of Equidae http://www.scotland.gov.uk/Resource/Doc/271583/0080953.pdf). Many yards will operate a worming programme on site but the cost of wormer would generally be an additional charge. It may be appropriate to consider a health scheme for the horses in the yard, e.g. the Premium Assured Strangles Scheme (PASS) (see page 117 for more detail). Although most horse owners are registered with a recognised veterinary practice, the yard should have a point of contact with a local vet in case of an emergency.
Health and safety – All businesses should be aware of health and safety implications, see pages 367-369 for more details or the publication at: http://adlib.everysite.co.uk/resources/000/264/078/Livery_Yards_Guidance_2006.pdf.
Fire safety - Businesses should also be aware of their responsibilities with regards to fire safety. More details can be found at: https://www.gov.uk/government/collections/fire-safety-law-and-guidance-documents-for-business
Value added tax (VAT) – Advice from an accountant or tax advisor should be sought to make a judgement on whether the services and products provided should be vatable, e.g. depending on the business’s VAT status the provision of DIY livery may not attract VAT, however the additional services provided through full livery are likely to attract VAT.
Rates – Buildings used for agriculture are normally exempt from rates however horses are not considered as agricultural “livestock”. Where a business is providing buildings for use by horses, these buildings are potentially rateable. Advice should be taken from local Council representatives for specific circumstances. The Small Business Bonus Scheme may apply depending on the size of the enterprise and the area occupied for commercial purposes.
Planning – For any new buildings or change of use of agricultural buildings/land (i.e. outdoor arena), planning permission will be required. Advice should be taken from a local planning consultant or the local

DIVERSIFICATION 287
Council planning department. For more information on planning regulations see pages 384-388.
Approved centres – This would show clients that the business has been assessed against detailed criteria and recognised as being well managed, offering first rate customer care, high levels of horse husbandry and general good practice throughout. See www.bhs.org.uk and www.abrs-info.org for more information.
Living accommodation – Facilities may need to be provided for staff (if required) and for guests where a lodging service is on offer, e.g. bed and breakfast, dormitories/bunkhouses or self catering in a farm cottage/static caravan/log cabin. When providing accommodation and meals, investigation into local authority regulations, e.g. fire and food hygiene, should be carried out. Membership of quality assurance schemes may also be considered.
Horse livery On-farm horse and pony livery can range from providing grazing only, to full livery (including labour, grazing, stabling, grooming, feeding and possibly exercise).
Returns will vary depending on the level of service (which is dependent on the knowledge of the person/s running the yard) and facilities being provided (e.g. a basic farm diversification or a specialist professional yard).
Livery services are likely to range from 70-100% occupancy. Grass and DIY livery are realistically the base market for farm diversification projects while part and full livery services will be more suited to yards with available skilled personnel.
Examples of livery services and approximate returns are shown in the following table:
Livery Service Returns (£/horse/wk)
Grass Grass keep only, no stable £15-30 DIY Stable and grazing only, all horse care
carried out by horse owner (hay and bedding can be included as extra)
£20-45
Part Full care* for part of the week (e.g. weekdays with DIY at weekend)
£60-90
Full Full care* including or excluding exercise £75-150
* full care includes stable, grazing, labour, feeding, bedding but excludes wormer, vet costs and farrier.
Example gross margins (not including site specific fixed costs such as labour, rent, rates, maintenance, PPE, insurance, professional and

DIVERSIFICATION 288
subscription/licence fees, etc) for livery services are shown in the following table:
Grass DIY Part Full
Occupancy (wks) 44 44 44 44
Price (£/wk) 25 40 80 110
OUTPUT
Livery 1,105 1,768 3,536 4,862
Other Income - - - -
1,105 1,768 3,536 4,862
VARIABLE COSTS
Concentrates 0.6t @ £350/t - - 217 217
Hay 2.5t @ £160/t - - 396 396
Bedding - shavings 1.2t @ £280/t - - 329 329
Misc - - - -
- - 942 942
Forage variable costs:
grazing 0.6ha @ £102/ha 61 61 61 61
Total Variable Costs 61 61 1,003 1,003
GROSS MARGIN 1,105 1,768 2,594 3,920
£/horse/year
Adding value to a livery enterprise is increasingly common through offering other services. These services can include the provision of horse care assistance to DIY livery horse owners, clipping (if skilled personnel are available), products (such as straw and hay/haylage) or such as those in the enterprises described in the following sections. Horse transport may also be offered for an additional charge.
Cross country schooling course The availability of a fairly extensive area of well drained ground in an accessible location is essential for this enterprise. Varied terrain with access to a river/stream provides options for different jump constructions including a water jump. Initial investment will be substantial and in addition to many of the equestrian enterprise factors previously mentioned, can include:
General groundworks Field access (for official and emergency service vehicles) Jump purchase Jump construction Communications
It is estimated that jumps will cost in the range of £250 to £1,000 per jump. It is highly recommended that the course and all jumps are approved by an experienced and approved course designer in terms of siting, fence design, construction, materials and safety. A consultation fee for this would be expected.

DIVERSIFICATION 289
Income will be seasonal depending on factors such as geographical location, weather and availability of land (out with normal farm management practices). The season would commonly run from the end February/start March through to October. Hire costs per horse range from £20 - £35 per hour depending on the number/height/range of jumps available. Sensible planning of the siting of fences may facilitate the generation of additional revenue from holding Hunter Trials, One Day Events or similar events.
Maintenance of ground and jumps will be cost specific to this enterprise. Casual labour (with the provision of a tractor) on the days when events are running would also be required. Management time in terms of labour will be minimal. Riding school A riding school is a specialised facility which requires experienced management and operation.
Basic requirements include the availability of land (for grazing and riding), stabling, ancillary areas and riding facilities. An indoor schooling area is almost essential in Scotland to ensure an income all year round.
The level of investment will be heavily influenced by the existing availability of buildings for conversion. Horses and ponies will also need to be purchased and costs can range from £750 - £4000 depending on size and suitability.
Income should be budgeted on year round accessibility with evenings and weekends being busy periods out-with school holidays. Lesson charges range from £10 - £50 per rider depending on the number of horses in the ride, the quality of the horse/pony being hired and level of instruction being given. Up to 8 riders may safely join a low level, slow paced beginner type lesson.
Labour and operating costs (as described previously) should be budgeted. Teaching staff will cost upwards of £15 per hour in addition to basic wage rates for yard staff. Management time and costs in terms of staffing will be significant. Local authority licensing under the Riding Establishments Act 1964 and 1970 will be essential when offering horses for lessons (riding lessons offered to someone on their own horse would not require this licence).
Horse bed and breakfast This enterprise is focussed on providing a bed and breakfast service for horses (and humans) who require respite while on long journeys or as an overnight stay prior to or during an event. The proximity of the facility to major arterial routes or areas of particular interest for off-road riding or equestrian events will be an important factor to gaining trade.
This enterprise is best suited where facilities are already in place and limited investment is required. Requirements include the availability of

DIVERSIFICATION 290
one or more stables and an area of turnout for horses. Accommodation for people (i.e. bed and breakfast in a house or self catering in a static caravan or cottage) can be optional and add value to the service.
Income may be irregular depending on location and on the time of year where there are local scenic riding routes/events available. Charges will start at £20 per person per night and £10 per night per horse depending on the quality and service offered.
Running costs and management requirements will vary but are likely to be fairly minimal.
Horse riding holidays Location is fundamental to the success of horse riding holidays. A riding holiday centre is most suited to premises in scenic and remote rural areas. Good access to off-road riding over a variety of terrain is essential.
The service can include the provision of horses to hire or there can be the option for guests to bring their own horses.
Basic facilities could include:
A covered area for tacking up. Stables (for hire horses and/or guests horses). Grazing (for hire horses and/or guests horses). A tack room. Toilet facilities. Living accommodation for guests.
The service can be enhanced by providing other riding facilities, i.e. all weather or indoor arenas, show jumping and cross country facilities and tuition and all inclusive luxury accommodation. With the above in mind, investment could be great if starting with a blank canvas. This enterprise will work best when there are already horses and facilities in place. Local authority licensing will apply where horses are provided.
Income is likely to be based on short stays (e.g. weekend) or on weekly terms and will be seasonal (end March to end September). Prices will range with a high dependence on the service and facilities provided. These can start at £250 for shorter stays to £1,300 for longer and more intensive/themed stays.
Operating costs will be highly influenced by the service being provided. Basic, smaller scale enterprises will have costs for facilities/infrastructure maintenance and the keep of horses/ponies. Premium enterprises will have a much greater expense for labour and catering.
Riding for the disabled A riding school for special needs adults or children is a rewarding diversification enterprise. Horses and ponies provide therapy, achievement and enjoyment to people with disabilities or special needs.

DIVERSIFICATION 291
Providing a safe, fun and supporting learning environment can improve the lifestyle for people with physical and learning disabilities, behavioural issues, mental health problems or other additional support needs. For further information see http://www.rda.org.uk/.
Wedding Venues
Converting old or disused farm buildings into a wedding venue may be a profitable diversification option for farmers. On-farm weddings are popular among couples looking for a scenic, countryside location with added wow-factor for their wedding. Renovating, extending, or building a wedding venue could fit with the existing farming enterprise. Points to consider when planning a wedding venue include:
Location of the venue near to a main road with good access and transport links. The location should ideally have a picturesque landscape with suitable car parking and toilet facilities.
The level of service offered; basic package of the venue as standard but extra services such as; catering, bar, disco/band, transport, and on-site accommodation could be included for an additional charge.
Planning permission may be required for the renovation or building of the venue.
Legislation requirements such as; health and safety, food hygiene, public liability insurance, and employment law may apply to the venture.
On-farm wedding venues vary in price depending on location and level of service provided. A standard package for the venue with lighting and heating can be hired out for £2,000-£4,000 per wedding per day. Full wedding packages including the venue, lighting and heating, catering, bar, disco/band can be charged around £6,000-£15,000 per wedding per day.
Pet Boarding Facilities
Animal husbandry is second nature to many farmers making a dog kennels and/or cattery a suitable diversification option to make best use of spare farm buildings. Boarding kennels or a cattery could be incorporated into an existing farm business. Kennel and cattery units vary in size and specifications. Commercial dog kennels cost around £1,500-4,000 per dog and a commercial cattery facility costs around £750-3,000 per cat. This includes groundwork, mains water supply and electricity connection.
For further information and a guide to building kennels or a cattery visit https://www.gla.ac.uk/t4/~vet/files/teaching/SAHusbandry/boardingkennels.pdf


Forestry and Farm Woodlands
FORESTRY AND FARM WOODLANDS 294
Introduction
Increasing the area of woodland in Scotland is a key Scottish Government objective to help meet national carbon emission reduction targets and support economic growth. Farmers are being encouraged to manage and increase the area of woodlands on farm and to maximise the benefits this can bring to the farm business.
This section provides guidance on; trees and the law, woodlands and shelter, timber prices, Christmas trees, financial assistance for farm woodlands and taxation.
Trees and the Law
Felling licences The felling of trees is controlled by the Forestry Commission in exercise of its powers under the Forestry Act 1967. A licence from the Forestry Commission is normally required (though not for topping or lopping), but in any calendar quarter up to 5m
3 may be felled by an occupier without a
licence provided not more than 2m3 are sold.
Certain types of felling are exempt. Full details are available from the Forestry Commission (http://scotland.forestry.gov.uk/supporting/grants-and-regulations/felling-licences). A felling licence must be obtained before the felling can commence. Unless exempt, felling without a licence is illegal and carries, on conviction, a fine of £2,500 or twice the value of the trees, whichever is higher.
It is usually a condition of any felling licence that the site is replanted, or an equivalent sized area elsewhere on the property. This obligation runs with the land. Assistance to restructure woodland is obtainable through Pillar II Scottish Rural Development Programme (SRDP) funding under the Forestry Grant Scheme (FGS).
If trees are covered by a Tree Preservation Order, in a Conservation Area, or in a Site of Special Scientific Interest (SSSI) then an application to fell must also be made to the Local Authority or Scottish Natural Heritage for the latter.
Dutch elm disease Under the Dutch elm disease (Local Authorities) (Amendment) Order 1988, local authorities may require owners to fell elms infected by Dutch elm disease. To prevent the spread of the disease, regulations also control the movement of elm logs within the terms of a licence issued by the Forestry Commission in certain areas.
Ash dieback Legislation passed on the 29th October 2012, restricts the importation and movement of ash trees for planting, because these carry a high risk

FORESTRY AND FARM WOODLANDS 295
of spreading the Chalara fraxinea fungus, which causes Chalara (Ash) dieback.
Plant Health Order prohibits movement of ash seeds, plants and trees within the country. However, ash firewood and timber can continue to be moved around the country, but it is recommended that any leaf material is removed before movement.
Phytophthera ramorum Since its discovery in south-west England in 2010, P. ramorum has spread considerably. Its high incidence in the south-west of Scotland has led to a large area being designated an ‘infection management zone’, while new cases are being found predominantly along the west coast of Scotland, with more appearing south of the Cairngorms. The infection spread map can be viewed at: https://www.forestry.gov.uk/pramorum#images
Susceptible trees include larch (Larix) species and Quercus rubra (northern red oak); Q. cerris (Turkey oak), Q. ilex (holm oak); Fagus sylvatica (beech), Castanea sativa (sweet chestnut), and Aesculus hippocastanum (horse chestnut).
P. ramorum is a notifiable disease. Do check the symptoms before alerting the Forestry Commission. Further information can be found at: https://www.forestry.gov.uk/pramorum. Currently, no cure has been found and there are no effective chemical treatments available. If P. ramorum is confirmed in woodland, Forestry Commission Scotland will issue a Statutory Plant Health Notice, placing a legal requirement on the owner to fell the trees within a set period of time. Grant aid is available to assist with agents’ fees and restocking, further information can be found on page 308-309, and at: https://www.ruralpayments.org/publicsite/futures/topics/all-schemes/forestry-grant-scheme/tree-health/
Any movement of Phytophthora-affected wood from a forest site (or subsequent move of affected material from a mill or processing site) requires a movement licence. Phytophthora-affected wood may only be moved to a facility that holds a valid processing licence.
Information on risk zones can be found at: http://scotland.forestry.gov.uk/supporting/forest-industries/tree-health/phytophthora-ramorum
Phyopthora alni All alder species in Britain are threatened by a lethal disease of which the causal agent is Phyopthora alni. No restrictions apply.
Phytophthora austrocedri Phytophthora austrocedri is a fungus-like pathogen which poses a threat to juniper trees in Britain. Juniper (Juniperus communis) is an important native species, thus a significant proportion of the small area of juniper
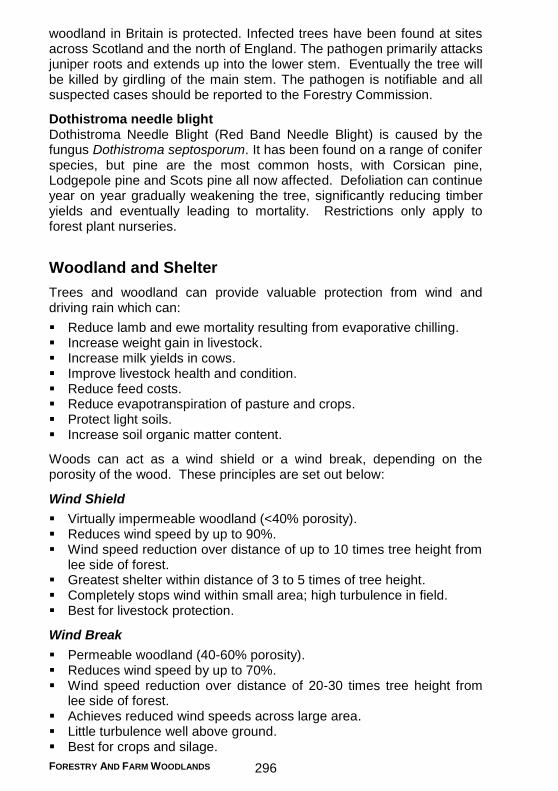
FORESTRY AND FARM WOODLANDS 296
woodland in Britain is protected. Infected trees have been found at sites across Scotland and the north of England. The pathogen primarily attacks juniper roots and extends up into the lower stem. Eventually the tree will be killed by girdling of the main stem. The pathogen is notifiable and all suspected cases should be reported to the Forestry Commission.
Dothistroma needle blight Dothistroma Needle Blight (Red Band Needle Blight) is caused by the fungus Dothistroma septosporum. It has been found on a range of conifer species, but pine are the most common hosts, with Corsican pine, Lodgepole pine and Scots pine all now affected. Defoliation can continue year on year gradually weakening the tree, significantly reducing timber yields and eventually leading to mortality. Restrictions only apply to forest plant nurseries.
Woodland and Shelter
Trees and woodland can provide valuable protection from wind and driving rain which can:
Reduce lamb and ewe mortality resulting from evaporative chilling. Increase weight gain in livestock. Increase milk yields in cows. Improve livestock health and condition. Reduce feed costs. Reduce evapotranspiration of pasture and crops. Protect light soils. Increase soil organic matter content.
Woods can act as a wind shield or a wind break, depending on the porosity of the wood. These principles are set out below:
Wind Shield
Virtually impermeable woodland (<40% porosity). Reduces wind speed by up to 90%. Wind speed reduction over distance of up to 10 times tree height from
lee side of forest. Greatest shelter within distance of 3 to 5 times of tree height. Completely stops wind within small area; high turbulence in field. Best for livestock protection.
Wind Break
Permeable woodland (40-60% porosity). Reduces wind speed by up to 70%. Wind speed reduction over distance of 20-30 times tree height from
lee side of forest. Achieves reduced wind speeds across large area. Little turbulence well above ground. Best for crops and silage.

FORESTRY AND FARM WOODLANDS 297
Scottish Timber Log Prices
The table below provides a comparison of Scottish timber prices. The values are for clear fells only. Prices vary according to market conditions, quality of timber, total volume harvested, ease of access and transport cost. Values are given in £/t, sold on an out turn tonnage basis. Roadside sales are net of harvesting costs, while standing sales are net of harvesting and haulage costs and represent the gross margin of that crop.
Typical broadleaf and conifer log prices for the year pre-April 2018 are as follows:
Species Log Type Price (£/t) Roadside Standing
Ash or beech Various 27 - 50 7 - 30 Oak Beam 87 - 125 67 - 105 Oak Planking 150 - 200 130 - 180 Burr Elm Individual tree 275 - 600 - Larch* Random length 39 - 44 19 - 24 Scots pine Logs 39 - 44 19 - 24 Sitka spruce Green logs 56 - 61 36 - 41 Sitka spruce Red logs 39 - 44 19 - 24 Sitka spruce Pallet wood 25 - 30 5 - 10 Mixed conifers Chipwood or pulp 17 - 32 7 - 12
* This is specific to large trees.
Timber crop values, at clear fell, range considerably with quality crops usually selling well. Estimated standing sale timber values for Sitka spruce (YC 16) can be £6,000 to £9,000/ha. Woodland owners increasingly keep part of the timber harvested for their own use for woodfuel. The cost to harvest and extract small round-wood to roadside is typically in the range £13-18 per tonne.
Christmas Trees
Christmas trees can provide a profitable cash crop for either a small acreage as a diversification on farm or on a larger commercial scale. By planting a new area annually, a steady income can be realised as the trees mature in an average of eight to ten years and are harvested and re-planted.
Site choice Soils should have a good structure, lighter soils with no plough pan are preferred. Drainage should be good, with no wet areas. Nutrient status should be adequate, or capable of being rectified. The site should not be in a frost pocket and should be free from perennial weeds.

FORESTRY AND FARM WOODLANDS 298
Christmas tree species
Common Name
Botanical Name
Length of production and Soils
Noble fir Abies procera Soft needles. Approximately 10-12 years to reach 2m height. Susceptible to late frosts. Soil pH approx. 5.0.
Scots pine
Pinus Sylvestris
Naturally grown on poor sites, pH slightly alkaline and acidic 5.0-7.5. Ready for market in 5-7 years depending on size required. Deep rooted.
Norway spruce
Picea abies Traditional Christmas tree. Soil pH 5.5-6.5. Approximately 8-12 years to reach marketable size.
Nordman fir
Abies nordmanniana
Susceptible to late frosts. Soil 5.0. Approximately 10-12 years to reach 2 m in height.
Frasier fir Abies fraseri Soil pH 5.0-5.8. Approximately 8-12 years to reach marketable size.
Planting and spacing Typical plant spacings and the number of trees per hectare are set out in the table below. Loading areas should be allowed for and access tracks/paths every 12-15 rows would be desirable, and this is reflected in the plant spacing in the right column.
Spacing Trees/ha, planted areas Trees/ha, inc. paths etc.
1m x 1m 10,000 8,700 1m x 1.2m 8,300 7,220 1.2m x 1.2m 6,900 6,000
Fencing for rabbits and deer will likely be required and would be site specific. Drainage may also be required.
Pruning and shearing To improve the quality of the trees from year 1, pruning and shearing will be required. This increases the density of the foliage and the tree shape.
Weeding and fertilising Regular weeding is required to prevent competition for nutrients and water, but also to maintain the form of the Christmas trees. Heavy weed growth can cause shading and/or restrict growth of the lower branches, thereby reducing the quality of the tree.
Soil fertility should be assessed and remediated ahead of planting. This then requires only nitrogen to be applied annually from year three, and top-ups of phosphorus and potassium.
Pests and diseases Common pests and diseases are listed overleaf:

FORESTRY AND FARM WOODLANDS 299
Phytophera root rot - This is a fungal disease present in the soil, affecting a broad range of tree species. It causes yellowing of the needles, wilting and death of branches.
Red band needle blight - This is caused by the fungus Dothistroma septosporum which can occur in all conifers but it mainly affects pines. This affects all ages of needle growth and leads to heavy defoliation.
Aphids and adelgids - These both suck the host plants’ sap and inject substances which affect both reproduction and plant growth. These can both be treated with broad spectrum insecticides.
Needle cast disease - This is caused by fungi and affects the previous growing season’s needles. This causes brown and or yellow spots on the needles and can cause needle loss. The advice is to apply a fungicide treatment and the removal of heavily infected trees.
Planting and felling legislation Where the planting area exceeds 20ha, or 2ha in a sensitive area such as a National Park or National Scenic Area, an Environmental Impact Assessment (EIA) determination is required from the Forestry Commission. The determination would stipulate whether an EIA is required or not, or if more information is required to inform the determination.
Whilst felling regulations apply to all woodland, the cutting of Christmas trees will fall under the following exemptions:
Felling of trees of 8cm diameter or less, measured at 1.3m above ground level;
Thinning of trees of 10cm diameter or less, measured at 1.3m above ground level.
If there is any doubt as to whether the exemptions apply or not, seek advice from Forestry Commission Scotland.
Costs
Production costs over the whole production cycle, over a seven year period are in the order of £24,500/ha. This comprises the following elements, based on 7,220 trees/ha:
£ Purchase of transplants 3,250 Planting by machine 1,080 Fertiliser 700 Herbicides 1,350 Pruning/shearing 7,200 Harvesting and marketing 10,850
24,430
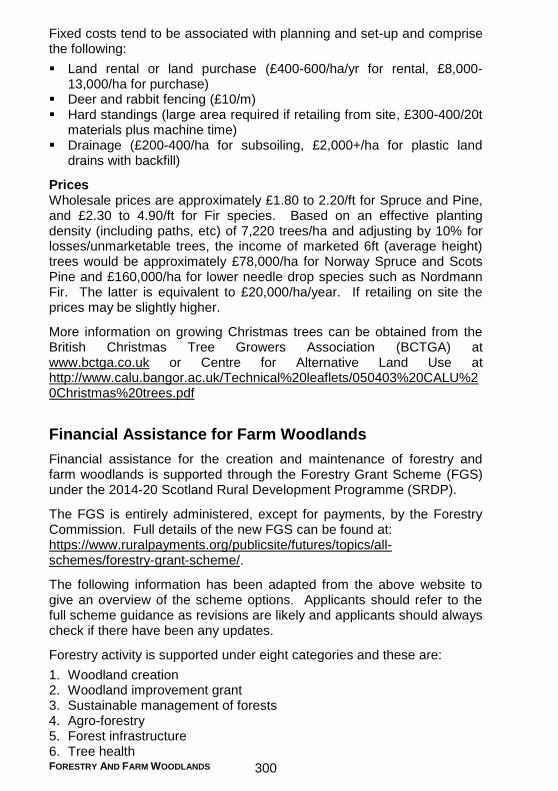
FORESTRY AND FARM WOODLANDS 300
Fixed costs tend to be associated with planning and set-up and comprise the following:
Land rental or land purchase (£400-600/ha/yr for rental, £8,000-13,000/ha for purchase)
Deer and rabbit fencing (£10/m) Hard standings (large area required if retailing from site, £300-400/20t
materials plus machine time) Drainage (£200-400/ha for subsoiling, £2,000+/ha for plastic land
drains with backfill)
Prices Wholesale prices are approximately £1.80 to 2.20/ft for Spruce and Pine, and £2.30 to 4.90/ft for Fir species. Based on an effective planting density (including paths, etc) of 7,220 trees/ha and adjusting by 10% for losses/unmarketable trees, the income of marketed 6ft (average height) trees would be approximately £78,000/ha for Norway Spruce and Scots Pine and £160,000/ha for lower needle drop species such as Nordmann Fir. The latter is equivalent to £20,000/ha/year. If retailing on site the prices may be slightly higher.
More information on growing Christmas trees can be obtained from the British Christmas Tree Growers Association (BCTGA) at www.bctga.co.uk or Centre for Alternative Land Use at http://www.calu.bangor.ac.uk/Technical%20leaflets/050403%20CALU%20Christmas%20trees.pdf
Financial Assistance for Farm Woodlands
Financial assistance for the creation and maintenance of forestry and farm woodlands is supported through the Forestry Grant Scheme (FGS) under the 2014-20 Scotland Rural Development Programme (SRDP).
The FGS is entirely administered, except for payments, by the Forestry Commission. Full details of the new FGS can be found at: https://www.ruralpayments.org/publicsite/futures/topics/all-schemes/forestry-grant-scheme/.
The following information has been adapted from the above website to give an overview of the scheme options. Applicants should refer to the full scheme guidance as revisions are likely and applicants should always check if there have been any updates.
Forestry activity is supported under eight categories and these are:
1. Woodland creation 2. Woodland improvement grant 3. Sustainable management of forests 4. Agro-forestry 5. Forest infrastructure 6. Tree health
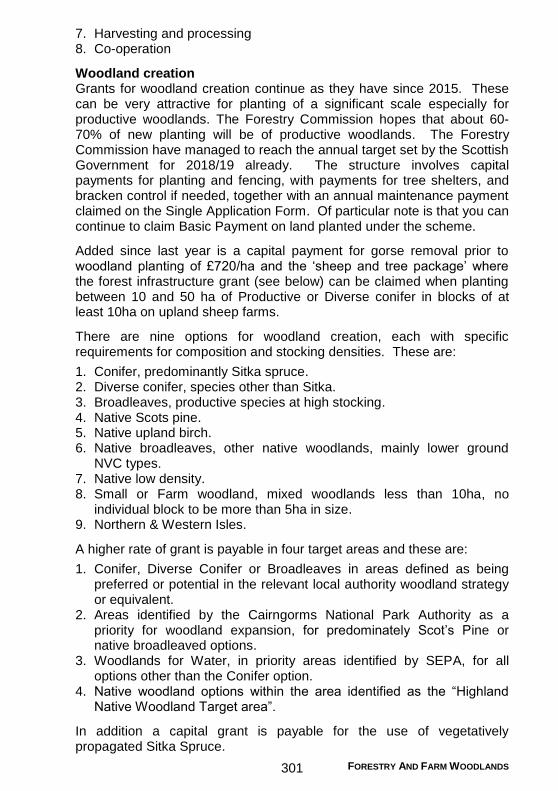
FORESTRY AND FARM WOODLANDS 301
7. Harvesting and processing 8. Co-operation
Woodland creation Grants for woodland creation continue as they have since 2015. These can be very attractive for planting of a significant scale especially for productive woodlands. The Forestry Commission hopes that about 60-70% of new planting will be of productive woodlands. The Forestry Commission have managed to reach the annual target set by the Scottish Government for 2018/19 already. The structure involves capital payments for planting and fencing, with payments for tree shelters, and bracken control if needed, together with an annual maintenance payment claimed on the Single Application Form. Of particular note is that you can continue to claim Basic Payment on land planted under the scheme.
Added since last year is a capital payment for gorse removal prior to woodland planting of £720/ha and the ‘sheep and tree package’ where the forest infrastructure grant (see below) can be claimed when planting between 10 and 50 ha of Productive or Diverse conifer in blocks of at least 10ha on upland sheep farms.
There are nine options for woodland creation, each with specific requirements for composition and stocking densities. These are:
1. Conifer, predominantly Sitka spruce. 2. Diverse conifer, species other than Sitka. 3. Broadleaves, productive species at high stocking. 4. Native Scots pine. 5. Native upland birch. 6. Native broadleaves, other native woodlands, mainly lower ground
NVC types. 7. Native low density. 8. Small or Farm woodland, mixed woodlands less than 10ha, no
individual block to be more than 5ha in size. 9. Northern & Western Isles.
A higher rate of grant is payable in four target areas and these are:
1. Conifer, Diverse Conifer or Broadleaves in areas defined as being preferred or potential in the relevant local authority woodland strategy or equivalent.
2. Areas identified by the Cairngorms National Park Authority as a priority for woodland expansion, for predominately Scot’s Pine or native broadleaved options.
3. Woodlands for Water, in priority areas identified by SEPA, for all options other than the Conifer option.
4. Native woodland options within the area identified as the “Highland Native Woodland Target area”.
In addition a capital grant is payable for the use of vegetatively propagated Sitka Spruce.

FORESTRY AND FARM WOODLANDS 302
The planting grants and capital grants applicable to the woodland creation scheme are as follows:
Planting Grant Payment rate (£/ha)
Standard Areas
Initial Planting
Annual Maintenance
Total for 5 yrs
Conifer 1,920 208 2,960 Diverse conifer 2,160 336 3,840 Broadleaves 2,880 528 5,520 Native Scots Pine 1,840 272 3,200 Native upland birch 1,840 128 2,480 Native broadleaves 1,840 272 3,200 Native low density broadleaves 560 96 1,040 Small or farm woodland 2,400 400 4,400 Northern and Western Isles 3,600 624 6,720
Target Areas Conifer 2,160 234 3,330 Diverse conifer 2,430 378 4,320 Broadleaves 3,240 594 6,210 Native Scots Pine 2,070 306 3,600 Native upland birch 2,070 144 2,790 Native broadleaves 2,070 306 3,600 Native low density broadleaves 630 108 1,170 Small or farm woodland 2,700 450 4,950 Northern and Western Isles n/a n/a n/a
Capital Item Grant Payment rate
Genetically-improved Sitka Spruce £150/ha Stock fence £4.40/m Deer fence £6.80/m Deer fence - high cost £9.90/m Upgrading stock fence to deer fence £3.28/m Rabbit-proofing stock or deer fence £1.60/m Tree shelter: above 1.2 metres £2.00 each Tree shelter: 0.6 to 1.1 metres £1.16 each Vole guard £0.20 each Enhancing or modifying a stock fence - Black Grouse and Capercaillie core areas
£2.00/m
Enhancing or modifying a deer fence - Low cost Black Grouse/Capercaillie core areas £2.00/m - High cost Black Grouse/Capercaillie core areas £4.48/m Conversion of deer fence to stock fence Black Grouse and Capercaillie core areas
£1.60/m
Gate for stock fence £136 each Gate for deer fence £172 each Badger gate £64 each Self-closing gate for non-vehicular access £280 each

FORESTRY AND FARM WOODLANDS 303
Capital Item Grant Payment rate
Building or restoring drystone dykes £26.40/sq. m Bracken control, mechanical or chemical removal £225/ha Gorse removal £720/ha
Two illustrative budgets (using the grant rates in the previous table) have been prepared based upon the current FGS to indicate typical incomes and expenditures between the various planting models and specifications for smaller farm woodlands. Some allowance has been made for the costs of grant application, general management, protection or game-keeping, insurance or long-term maintenance in these examples. Supplier and contractor costs are typical of those that apply for the stated quantities and land type and will vary with the circumstances.
Example 1 - 40ha site for conifers
Assumptions:
Planting conifers in standard area. Up to 10% of the area can be retained as open ground and still get the
full grant on it. Up to 5% of the area must be planted with broadleaves. Stocking densities of 2,500 stems/ha for conifers and 1,100 stems/ha
for broadleaves are required.
Item Quantity Typical supplier/ contractor cost
Grant
Design/grant application fees - £5,000 -
Supply and erect fencing (m) 2,600 £10.50/m £8.40/m 1
Supply and hang deer gates 2 £220/each £172 each
Ploughing (ha) 36 £270/ha -
Conifers (incl. planting) 85,000 44p each -
Broadleaves (incl. planting) 2 2,200 80p each 19p each
3
Contract supervision fees - £9,025 over 4 yr -
Replacement planting - £2,000 over 3 yr -
Weeding with herbicide 87,200 8p each -
Contingency 5% of costs -
Initial planting grant 40ha - £1,920/ha Maintenance grant (5 years) 40ha - £208/ha/yr
Cash flow summary Year 1 Years 2-3 Years 4-6 Total
Establishment costs £89,795 £15,000 £6,500 £111,295 Grant income £99,402 £16,640 £24,960 £141,002 Cumulative balance £9,607 £11,247 £29,707 £29,707 1 includes £6.80/m for deer fencing and 1.60/m for rabbit proofing 2 also includes vole guards 3
grant for vole guard only
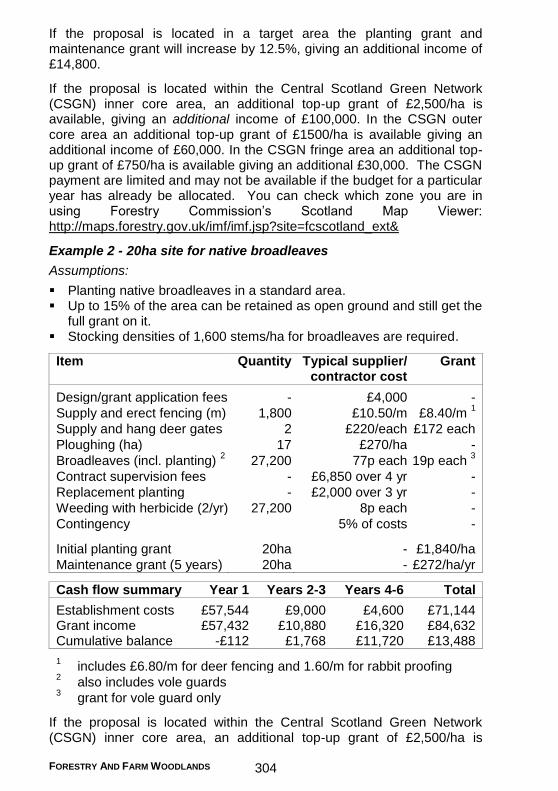
FORESTRY AND FARM WOODLANDS 304
If the proposal is located in a target area the planting grant and maintenance grant will increase by 12.5%, giving an additional income of £14,800.
If the proposal is located within the Central Scotland Green Network (CSGN) inner core area, an additional top-up grant of £2,500/ha is available, giving an additional income of £100,000. In the CSGN outer core area an additional top-up grant of £1500/ha is available giving an additional income of £60,000. In the CSGN fringe area an additional top-up grant of £750/ha is available giving an additional £30,000. The CSGN payment are limited and may not be available if the budget for a particular year has already be allocated. You can check which zone you are in using Forestry Commission’s Scotland Map Viewer: http://maps.forestry.gov.uk/imf/imf.jsp?site=fcscotland_ext&
Example 2 - 20ha site for native broadleaves
Assumptions:
Planting native broadleaves in a standard area. Up to 15% of the area can be retained as open ground and still get the
full grant on it. Stocking densities of 1,600 stems/ha for broadleaves are required.
Item Quantity Typical supplier/ contractor cost
Grant
Design/grant application fees - £4,000 -
Supply and erect fencing (m) 1,800 £10.50/m £8.40/m 1
Supply and hang deer gates 2 £220/each £172 each
Ploughing (ha) 17 £270/ha -
Broadleaves (incl. planting) 2 27,200 77p each 19p each
3
Contract supervision fees - £6,850 over 4 yr -
Replacement planting - £2,000 over 3 yr -
Weeding with herbicide (2/yr) 27,200 8p each -
Contingency 5% of costs -
Initial planting grant 20ha - £1,840/ha
Maintenance grant (5 years) 20ha - £272/ha/yr
Cash flow summary Year 1 Years 2-3 Years 4-6 Total
Establishment costs £57,544 £9,000 £4,600 £71,144 Grant income £57,432 £10,880 £16,320 £84,632 Cumulative balance -£112 £1,768 £11,720 £13,488 1
includes £6.80/m for deer fencing and 1.60/m for rabbit proofing 2
also includes vole guards 3
grant for vole guard only If the proposal is located within the Central Scotland Green Network (CSGN) inner core area, an additional top-up grant of £2,500/ha is

FORESTRY AND FARM WOODLANDS 305
available, giving an additional income of £50,000. In the CSGN outer core area an additional top-up grant of £1500/ha is available giving an additional income of £30,000. In the CSGN fringe area an additional top-up grant of £750/ha is available giving an additional £15,000. The CSGN payment are limited and may not be available if the budget for a particular year has already be allocated. You can check which zone you are in using Forestry Commission’s Scotland Map Viewer: http://maps.forestry.gov.uk/imf/imf.jsp?site=fcscotland_ext&
When planning farm woodlands it is important to consider other benefits and costs. For example:
Additional benefits can include shelter, conservation, sporting, amenity and carbon sequestration. See pages 397-398 for further information on forestry and climate change.
The loss of agricultural production from the land is an opportunity cost and this can be minimised by planting less productive land, such as where bracken has established. If a significant proportion of the farm is planted it may be possible to reduce fixed costs.
Potentially one of the largest financial impacts is the effect on land values. Generally the more productive the land that is planted with trees, the greater the potential loss in capital value; but in some circumstances capital values can be improved by new woodland, for example through better shelter, amenity or sporting.
Woodland Improvement Grant This grant aims to support forest management, activity to enhance the environment and the public’s enjoyment of existing woodlands. There are five options in this category:
1. Habitats and Species 2. Restructuring Regeneration 3. Low Impact Silvicultural Systems (LISS) 4. Woodlands In and Around Towns (WIAT) 5. Planning including Long-term Forest Plan, Forest Plan Renewal,
Woodland Grazing Plan, WIAT Urban Woodland Management Plan and Deer Management Plan
Grant payments for options under the Woodland Improvement Grant are as follows:
Option Grant payment
Habitats and Species Standard costs for capital works and items from a set list. Actual costs are available for work in woodland SSSI and Natura sites where it can be demonstrated that the actual costs of the eligible capital items will be higher than the set standard costs list for this option

FORESTRY AND FARM WOODLANDS 306
Option Grant payment
LISS Standard costs for capital works and items from a set list
WIAT Standard costs for capital works and items from a set list
Long-term Forest Plan £25/ha for first 200ha, £5/ha thereafter (minimum £500; maximum £15,000)
Forest Plan Renewal £10/ha for first 200ha, £5/ha thereafter (minimum £500; maximum £10,000)
Woodland Grazing Management Plan
£1200 per plan
WIAT Urban Woodland Management Plan
£1000 for any area up to 10ha, £25/ha thereafter
Deer Management Plan
£12/ha for first 500ha, £1/ha thereafter (minimum £5,000; maximum £15,000)
Payments for restocking, (known as restructuring regeneration) comprise a single capital payment. An approved long-term Forest Plan or Woodland Management Plan must be in place to be eligible for these grants. The payments are:
Delivering UKFS Woodland (no more than 75% of area as a single species)
£300/ha
Delivering Diversity and Resilience Woodland (no more than 60% of area as a single species)
£550/ha
Improved Vegetative Stock for Sitka Spruce £60/ha
Sustainable Management of Forests These grants support a range of activities in existing woodlands that will:
increase species and structural diversity through Low Impact Silvicultural Systems (LISS) management.
encourage natural regeneration to expand native woodlands. bring native woodlands and designated woodland features into active
management and good ecological condition. support management of rural and urban woodlands for public access. control grey squirrels where they are a threat to the red squirrel
population. control predators to benefit Capercaillie and Black Grouse. reduce deer impacts to a level that will allow regeneration of conifer
and broadleaved species.
The grant support for this category comprises nine options. All payments are made for up to a maximum of five years. An approved long-term Forest Plan or Woodland Management Plan must be in place to be eligible for these grants. Approved Deer Management Plans and/or

FORESTRY AND FARM WOODLANDS 307
Woodland Grazing Plans may also be required to be eligible for some options.
Grant Payment rate
LISS £30/ha/yr Native woodlands £25/ha/yr Livestock exclusion £43/ha/yr Woodland grazing £100/ha/yr Public access - Rural Woods £100/ha/yr Public access - WIAT £100/ha/yr for first 10ha
£10/ha/yr for any additional areas Grey squirrel control £200 per trap/yr Predator control for Capercaillie & Black Grouse £6.60/ha/yr Reducing deer impact £6.00/ha/yr
Forest Infrastructure This option has two aims:
1. Existing Woodlands - To provide support for new access infrastructure that will bring small-scale, undermanaged woodlands or inaccessible woodlands back into active management to improve the economic value of forest and woodland through timber production, to increase the area of woodland in Scotland that is in sustainable management and to improve the environmental and social benefits of woodland. This option is limited to woodlands of up to 50 hectares in size.
2. Sheep and Trees - To provide support for new access infrastructure to new woodlands as part of the Sheep and Trees initiative. This initiative is aimed at raising awareness of the many opportunities woodland can bring to land managers. This option, as part of the Sheep and Trees grant package, is only available for upland livestock farmers when creating between 10ha and 50ha of productive conifer woodland and is limited to up to 30 metres per hectare planted with a cap of 1,500 metres per application.
Grant support is available for a number of capital grant operations associated with new forest infrastructure. The capital grant operations and payment rates available are:
Grant Payment rate
Construction of: - forest road with on-site material * £25.80 per linear metre - lay-bys, turning areas, and loading bays £6.60 per square metre
Bell-mouth junction ** £32.40 per square metre
* in the Sheep and Trees option allowance of up to 30 metres/ha of woodland creation (cap of 1,500 metres/application)
** not available for the Sheep and Trees option
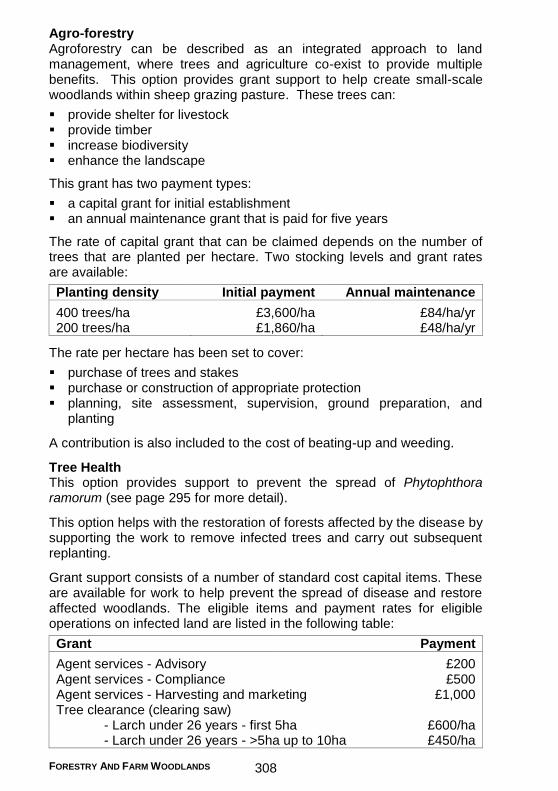
FORESTRY AND FARM WOODLANDS 308
Agro-forestry Agroforestry can be described as an integrated approach to land management, where trees and agriculture co-exist to provide multiple benefits. This option provides grant support to help create small-scale woodlands within sheep grazing pasture. These trees can:
provide shelter for livestock provide timber increase biodiversity enhance the landscape
This grant has two payment types:
a capital grant for initial establishment an annual maintenance grant that is paid for five years
The rate of capital grant that can be claimed depends on the number of trees that are planted per hectare. Two stocking levels and grant rates are available:
Planting density Initial payment Annual maintenance
400 trees/ha £3,600/ha £84/ha/yr 200 trees/ha £1,860/ha £48/ha/yr
The rate per hectare has been set to cover:
purchase of trees and stakes purchase or construction of appropriate protection planning, site assessment, supervision, ground preparation, and
planting
A contribution is also included to the cost of beating-up and weeding.
Tree Health This option provides support to prevent the spread of Phytophthora ramorum (see page 295 for more detail).
This option helps with the restoration of forests affected by the disease by supporting the work to remove infected trees and carry out subsequent replanting.
Grant support consists of a number of standard cost capital items. These are available for work to help prevent the spread of disease and restore affected woodlands. The eligible items and payment rates for eligible operations on infected land are listed in the following table:
Grant Payment
Agent services - Advisory £200 Agent services - Compliance £500 Agent services - Harvesting and marketing £1,000 Tree clearance (clearing saw) - Larch under 26 years - first 5ha £600/ha - Larch under 26 years - >5ha up to 10ha £450/ha

FORESTRY AND FARM WOODLANDS 309
Grant Payment
- Larch under 26 years - >10ha £300/ha Tree clearance (other mechanised equipment) - Larch under 26 years - first 5ha £1,200/ha - Larch under 26 years - >5ha up to 10ha £900/ha - Larch under 26 years - >10ha £600/ha Un-economic felling - Larch older than 26 years - first 5ha £1,200/ha - Larch greater than 26 years - >5ha up to 10ha £900/ha - Larch greater than 26 years - >10ha £600/ha Restocking - Delivering Diversity and Resilience in Woodlands
£1,400/ha
Manual Rhododendron Eradication - Light £3,500/ha - Medium £5,500/ha - Difficult £7,300/ha Mechanised Rhododendron Eradication - Light £2,200/ha - Medium £3,400/ha - Difficult £5,600/ha Foliar Spray Treatment Rhododendron Eradication £200/ha Follow-up Rhododendron Eradication £200/ha Stem Injection Rhododendron Eradication - Medium £3,000/ha - Difficult £4,500/ha
Harvesting and Processing This option supports investments in two main areas:
1. New specialised equipment which will increase the local small-scale harvesting and processing capacity with the aim of helping to bring woodlands into management, promoting the economic and sustainable production of timber and timber products through processing, adding value to local economies on a non-industrial scale (processing less than 10,000 tonnes per annum) and providing support to facilitate and support diversification and to assist with the creation of new small enterprises and related employment.
2. New specialised equipment for forest tree nurseries and equipment for afforestation ground preparation projects with the aim of promoting economic development in rural areas in Scotland by supporting new and existing forestry businesses and scaling up and expanding the capacity within the forest tree nursery sector and the forestry contractor resource to help delivery of the Scottish Government ambitious woodland creation target.
Grant support is based on actual costs with a maximum contribution of 40 per cent. The balance of funding must come from private funds and not from other public funds. Public funds include all EU funds, and any UK

FORESTRY AND FARM WOODLANDS 310
government funds, including local authority and lottery grants. In any single application, the minimum and maximum grant award totals will be:
Aim 1 – harvesting and primary processing equipment minimum £2,500 and maximum £35,000
Aim 1 – secondary processing equipment minimum £1,000 and maximum £6,000
Aim 2 – nursery and ground prep equipment minimum £2,500 and maximum £35,000
Grants are only available for claims made in the same year as the successful application.
The grant cannot be used for purchase of chippers. A business case must be submitted as part of the grant application.
Co-operation This option aims to encourage landscape-scale collaborative projects between two or more landowners by providing support for project facilitation and co-ordination. The subsequent management activity can be supported through other options within the Forestry Grant Scheme.
Grant support of £250 per day is available for up to 40 days to support the cost of a project co-ordinator for the following stages of a project:
Feasibility – this stage is the initial exploratory phase Consolidation – this stage focusses on the detail of the project.
Trees and Taxation
Forestry enjoys several benefits in relation to taxation. Their value to stimulating the forestry sector was recognised in the Land Reform Review in 2014. Taxation considerations for forestry are listed below:
Income Tax - All income from timber sales are exempt from Income Tax. Any surplus generated by forestry grants is exempt from Income Tax (e.g. in a woodland creation project with FGS funding). This does not apply to Farmland Premium.
Capital Gains Tax (CGT) - There is no CGT applied to the gain in value of commercial trees. CGT does however apply to a gain in value on the land.
Inheritance Tax (IHT) - Where commercial woodland has been in individual ownership for at least two years, it will normally attract 100% IHT Business Property Relief.
Corporation Tax (CT) - Where a company owns woodland which is independent of their trading operations, there is no CT liability on income generated by timber sales or surplus resulting from forestry grants.
For more detail see the Taxation section on page 479.

Renewable Energy
RENEWABLE ENERGY 312
Introduction
Fluctuating energy prices, government incentives and a growing awareness of the impact of climate change has prompted many farmers to consider generating renewable energy, as well as assessing where energy efficiency savings can be made. The introduction of the Feed-in Tariff (FIT) and Renewable Heat Incentive (RHI) greatly reduced the payback periods for renewable energy projects and helped kick-start the industry. Tariffs have been reduced for new projects as uptake has increased and energy savings are now the driving factor for most farm scale renewable projects. This section provides an introduction to the government’s financial incentives and the renewable energy technologies that are most relevant to the rural sector: wind, hydro, anaerobic digestion, biomass heating, ground source heat pumps, biodiesel and energy crops. Landowners pursuing renewable energy projects are advised to seek independent advice to verify likely energy yields, costs and technical and economic viability, rather than rely solely on information supplied by equipment manufacturers who may be pursuing their own agenda.
Energy efficiency Before considering installing any renewable energy generation technologies it makes sense to review what opportunities there may be to improve energy efficiency. Undertaking an energy audit helps to identify energy uses and highlight potential opportunities to reduce energy bills as well as to improve your business’s carbon footprint (see page 396 for more detail on carbon footprinting). The first step in reducing energy use is to measure current usage levels in order to set a baseline. Energy use can be measured by taking meter readings or by using figures from business trading accounts. Using more regular physical and financial records will provide greater detail and understanding of energy uses. Comparing the level of energy used in subsequent years against the baseline figure will then give an idea of trends in energy consumption. Sources of energy inefficiency can then be identified and addressed, both in terms of technical solutions and management changes.
Benchmarking energy use against other similar farms can also highlight where improvements need to be made. There can be differences in energy use of 30% or more with comparable businesses. The greatest savings in energy use will come from changes to farming systems and practices, therefore agricultural knowledge is vital to be able to exploit these potential savings.
Renewables options appraisal Each renewable energy technology has different characteristics, which will influence whether or not it is suited for use on a particular farm. It is vital to carefully consider what your objectives are and what you want from a renewable energy installation at an early stage. The following
RENEWABLE ENERGY 313
factors are important to consider before deciding which renewable energy technology option(s) you wish to investigate:
What is the scale and pattern of your energy demand? What energy resources do you have available on your farm? How much capital do you have access to for investment? What level of risk are you willing to take?
For general information on energy efficiency and renewables, see:
SAC Consulting Renewables Database (www.sruc.ac.uk/renewableenergy)
Farming for a Better Climate (http://www.sruc.ac.uk/farmingforabetterclimate)
Energy Savings Trust (www.energysavingtrust.org.uk) Carbon Trust (www.carbontrust.com) Scottish Renewables (www.scottishrenewables.com) Renewable Energy Association (www.r-e-a.net)
Grants and Incentives
Renewable electricity – Feed-in Tariffs Feed-in Tariffs (FITs) are aimed at renewable or low carbon electricity production developments of less than 5 MW. The scheme has been running since 2010 and is scheduled to close April 2019. The FIT is paid in two parts: the Generation Tariff and the Export Tariff. The Generation Tariff is paid for every kWh of energy generated (even if the energy is used on site) and varies depending on technology and scheme size. On top of this, generators are also eligible for an Export Tariff payment for exporting to the grid, which guarantees a minimum payment (currently 5.03p/kWh). Generators also have the option to forego the export tariff and make their own deal to sell power to an energy company, which can return a higher price. Both parts of the FIT payment are index linked and will be adjusted in line with inflation each year.
Since the scheme has been introduced there have been various consultations and changes to the tariff rates for technologies in order to either control the budget in response to higher than anticipated levels of uptake, e.g. photovoltaic (PV), or to encourage greater uptake of certain technologies, e.g. anaerobic digestion (AD).
All new installations applying for FITs are subject to two forms of degression:
1. Default Degression – this is applied every quarter regardless of deployment levels, and depending on the technology ranges from 0.1% - 1.5% per quarter.
2. Deployment Caps – a capping system as of 8 February 2016. This system operates each quarter.
RENEWABLE ENERGY 314
If any particular technology reaches the government set cap for that quarter (based on MW installed in that quarter) it would trigger a degression of 10%. Additionally if the total installed capacity is reached for a quarter then all other applications for this quarter will be entered into a queuing system to wait until the next quarter that can accept applications. However, if capacity for each quarter is not reached it will roll over into the next quarter. Given the frequent changes to FIT rates due to the degression mechanisms, rates change on a regular basis, therefore, for the most up-to-date tariff rates please refer to the Ofgem website at: https://www.ofgem.gov.uk/environmental-programmes/fit/fit-tariff-rates.
For further information on degression and cumulative capacity totals, please refer to the Government response to the consultation on a review of the Feed-in Tariff scheme, which can be found at: https://www.ofgem.gov.uk/system/files/docs/2018/01/fit_tariff_table-_january_2018.pdf and https://www.ofgem.gov.uk/environmental-programmes/fit/contacts-guidance-and-resources/public-reports-and-data-fit/feed-tariffs-deployment-caps-reports
The UK government has recently reviewed the sustainability criteria for FIT’s for Anaerobic Digestion. From 1 May 2017 any new application has an obligation to meet sustainability and feedstock restrictions for preliminary and full accreditation. The criteria is as follows:
A minimum of 50% of biogas must be derived from wastes or residues. As most non-fatty wastes have low methane potential, this normally means far more than 50% of the feedstock needs to be residues and wastes.
However, it’s not all or nothing but scaled proportionally to the amount the 50% threshold is missed by. Even where 100% crops are used 50% of the electricity produced would still receive FITs.
Carbon limits on the ELECTRICITY produced by feedstocks have been introduced at 66.7gCO2eq/MJe. From 1 April 2020 - 31 March 2025 the limit will tighten to 55.6gCO2eq/MJe after which the limit is 50.0gCO2eq/MJe. Compare this to the RHI limit 34.8gCO2eq/MJth. Most engine based CHP units produce approximately 1:1 electricity to heat, this means the RHI criteria appears almost twice as tight, in reality once the complex calculations have been carried out, the FIT limit is about 30% lower (more strict) than the RHI.
Land Criteria has also been introduced in line with those already used for the RHI. The aim is to exclude fuels or feedstocks being grown on land that has high biodiversity or carbon stock. As far as UK AD operators are concerned they would need to prove the land crops were grown on was not; designated for conservation purposes, highly biodiverse grassland, peatland, formerly afforested or former wetland. The simplest way to evidence this is farm records such as IACS from 2007/08.
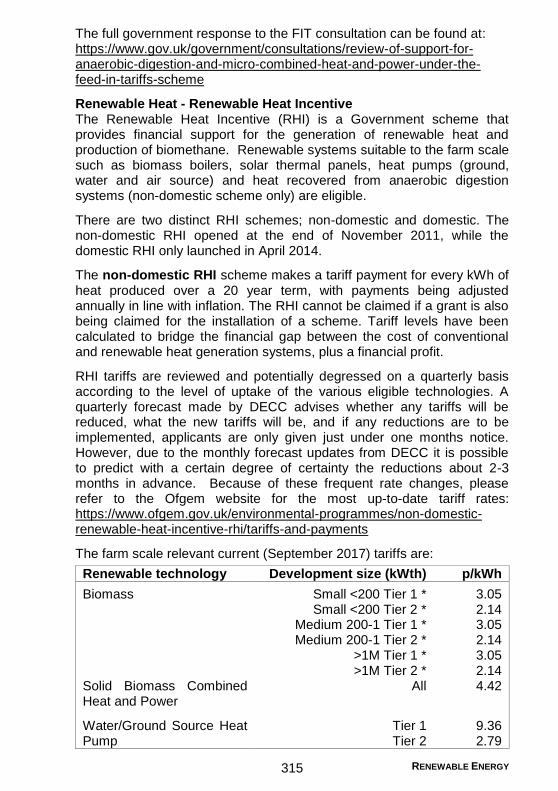
RENEWABLE ENERGY 315
The full government response to the FIT consultation can be found at: https://www.gov.uk/government/consultations/review-of-support-for-anaerobic-digestion-and-micro-combined-heat-and-power-under-the-feed-in-tariffs-scheme
Renewable Heat - Renewable Heat Incentive The Renewable Heat Incentive (RHI) is a Government scheme that provides financial support for the generation of renewable heat and production of biomethane. Renewable systems suitable to the farm scale such as biomass boilers, solar thermal panels, heat pumps (ground, water and air source) and heat recovered from anaerobic digestion systems (non-domestic scheme only) are eligible.
There are two distinct RHI schemes; non-domestic and domestic. The non-domestic RHI opened at the end of November 2011, while the domestic RHI only launched in April 2014.
The non-domestic RHI scheme makes a tariff payment for every kWh of heat produced over a 20 year term, with payments being adjusted annually in line with inflation. The RHI cannot be claimed if a grant is also being claimed for the installation of a scheme. Tariff levels have been calculated to bridge the financial gap between the cost of conventional and renewable heat generation systems, plus a financial profit.
RHI tariffs are reviewed and potentially degressed on a quarterly basis according to the level of uptake of the various eligible technologies. A quarterly forecast made by DECC advises whether any tariffs will be reduced, what the new tariffs will be, and if any reductions are to be implemented, applicants are only given just under one months notice. However, due to the monthly forecast updates from DECC it is possible to predict with a certain degree of certainty the reductions about 2-3 months in advance. Because of these frequent rate changes, please refer to the Ofgem website for the most up-to-date tariff rates: https://www.ofgem.gov.uk/environmental-programmes/non-domestic-renewable-heat-incentive-rhi/tariffs-and-payments
The farm scale relevant current (September 2017) tariffs are:
Renewable technology Development size (kWth) p/kWh
Biomass Small <200 Tier 1 * 3.05 Small <200 Tier 2 * 2.14
Medium 200-1 Tier 1 * 3.05 Medium 200-1 Tier 2 * 2.14 >1M Tier 1 * 3.05 >1M Tier 2 * 2.14 Solid Biomass Combined Heat and Power
All 4.42
Water/Ground Source Heat Pump
Tier 1 9.36 Tier 2 2.79

RENEWABLE ENERGY 316
Renewable technology Development size (kWth) p/kWh
Air Source Heat Pump 2.69 Deep Geothermal All 5.38
Solar Collectors 10.75
Bio-methane First 40,000 MWh Tier 1 3.30 Next 40,000 MWh Tier 2 1.95 Tier 3 1.49
Biogas Combustion <200 2.97 200-600 2.33 >600 0.89
* Tier bands will be removed
For more information on the non-domestic RHI scheme, see Ofgem: https://www.ofgem.gov.uk/environmental-programmes/non-domestic-renewable-heat-incentive-rhi
The domestic RHI scheme is open to single domestic premises, including farmhouses. A building is considered to be a single domestic premises if it is defined as a ‘separate and self-contained premises for Council Tax purposes’.
There are a number of eligibility criteria for the scheme. If you are considering a renewable heat project it is vital that you familiarise yourself with these criteria to avoid installing a system, which is not eligible for tariff payments. Tariff levels have been calculated to bridge the financial gap between the cost of conventional and renewable heat generation systems only, unlike the non-domestic scheme there is no financial profit built in. Therefore, the domestic scheme gives about half the total income of the non-domestic scheme, not-withstanding the various degressions in the domestic and non-domestic scheme, which have at times altered this for some technologies. It is important to note that payments for the domestic scheme are made over a seven year term (rather than the 20 year term for the non-domestic scheme), and the tariff levels are currently set at:
10.49 p/kWh for air to water heat pumps; 6.74 p/kWh for biomass boilers and pellet stoves with back boilers; 20.46 p/kWh for ground source heat pumps; 20.66 p/kWh for flat plate and evacuated tube solar thermal panels.
The domestic RHI tariff rates are subject to review and possible degression on a quarterly basis, in much the same way as for the non-domestic tariffs. For the most up-to-date tariff rates refer to the Ofgem website at: (https://www.ofgem.gov.uk/environmental-programmes/domestic-rhi/contacts-guidance-and-resources/tariffs-and-payments-domestic-rhi/current-future-tariffs)

RENEWABLE ENERGY 317
In addition, new applications on or after 1 April 2016 will now have future tariffs adjusted in line with the Consumer Price Index, which varies from the Retail Price Index of applications submitted before 1 April 2016.
Payments are made on the basis of the expected annual heat demand of the building concerned, rather than by metering the actual heat use or heat generation. The exception is solar thermal systems where by payments are calculated using the estimated annual generation figures calculated by your MCS installer on your MCS certificate.
To be eligible your scheme must only heat a single property and have an Energy Performance Certificate (EPC), which includes heat demand figures, no more than 24 months old. Furthermore your renewable heating product must be certified by the Microgeneration Certification Scheme (MCS). Any product or installations that do not have an MCS certificate will not be eligible for the Domestic RHI.
After your scheme is installed you have 12 months to apply to the domestic RHI scheme, starting from the commissioning date shown on your MCS certificate. If you fail to submit within this timeframe, you will not be eligible under the new scheme rules. All applications could be audited so you must ensure that you have all the relevant paper work ready for an audit. Where applicable you would need to produce:
A copy of your MCS Installation Certificate. Copy(s) of your MCS Compliance Certificates. Copy(s) of your domestic EPC. Copy of your utility bill or council tax bill. Purchase receipts for the renewable technologies. Fuel receipts for biomass boilers and stoves. Calibration certificates, if applicable (where the heating system is
metered).
For further information on the domestic RHI scheme see: https://www.ofgem.gov.uk/environmental-programmes/domestic-renewable-heat-incentive
As of 5 October 2015, the RHI Biomass Sustainability Criteria came into effect for the domestic and non-domestic RHI schemes. These criteria are in place to ensure any biomass used in systems receiving the RHI is sourced from sustainable sources. They have to be sustainable from both a carbon point of view and also a “land use” aspect (i.e. growing of the biomass does not involve damaging protected land types). These criteria are designed around imported timber, which has far higher risk of breaching the carbon and land use criteria. As a result, evidence requirements for end users using UK timber are more stringent than what is necessarily required. The type of end user will dictate how these criteria are met, for example:
Biomass boiler end users who buy in woodfuel (i.e. chips, pellets, firewood or briquettes), have to buy all their fuel from an RHI approved

RENEWABLE ENERGY 318
supplier on the Biomass Suppliers List, (http://biomass-suppliers-list.service.gov.uk/find-a-fuel). For end user in the domestic scheme this is the ONLY option.
Biomass boiler end users who “self-supply” their own woodfuel from their own land, will need to register as a self-supplier on the Biomass Suppliers List (https://biomass-suppliers-list.service.gov.uk/supplier-registration). Self-supply is deemed to be sustainable therefore they do not need to demonstrate the carbon or land use sustainability. However, they do usually need some kind of woodland management plan in place.
Biomass boiler end users who produce their own woodfuel (e.g. buy in roundwood from the commercial market and chip it to produce their own fuel), will need to register as a full supplier on the Biomass Suppliers List. As long as you are a small business you are able to use the online simple application process. This includes a simplified carbon calculator, which needs a few basic questions about the raw material wood, where it comes from and how it is processed. This will give an estimated carbon footprint for your fuel and needs to be less than 34.8gCO2e/MJ heat. Most woodfuels (even pellets) pass this with ease with typical values for chip from UK timber in the range of 5-8gCO2e/MJ heat.
Biomass boiler end users using straw for the year for the first time, have an equivalent to the BSL for non-woody crops – the Sustainable Fuels Register was launched to enable users of straw, Miscanthus and other non-woody biomass to register their fuels for a 1 year period, which will avoid the need to report directly to Ofgem on a quarterly basis and carrying out complex calculations. If the straw is purchased on the commercial market then this enables suppliers of straw to sell to RHI boilers, without the end user having to trace the exact growing location of every load. However, in the case of straw, the market is fairly buoyant already, it remains to be seen if commercial straw merchants will consider registering themselves unless there is a higher price for use as fuel, which currently there does not appear to be. Full details can be found at: https://www.sfregister.org.
Anaerobic digestion end users using the spare heat from the CHP unit, or burning the gas directly for heat, will need to report directly to Ofgem with evidence that the feedstocks meet the criteria. This will involve using a complex piece of software to calculate the carbon footprint. In addition evidence of the land use for the past 7-15 years will need to be given to prove that the land used to grow the feedstock has not fallen into any protected categories over the years. If it is your own land then IACS data should be sufficient, however, if the crop is purchased on the commercial market then this is going to be very difficult.
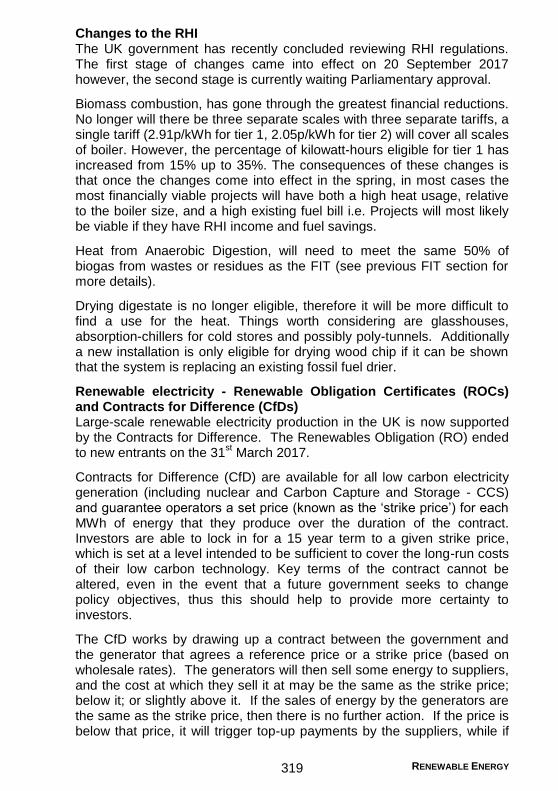
RENEWABLE ENERGY 319
Changes to the RHI The UK government has recently concluded reviewing RHI regulations. The first stage of changes came into effect on 20 September 2017 however, the second stage is currently waiting Parliamentary approval.
Biomass combustion, has gone through the greatest financial reductions. No longer will there be three separate scales with three separate tariffs, a single tariff (2.91p/kWh for tier 1, 2.05p/kWh for tier 2) will cover all scales of boiler. However, the percentage of kilowatt-hours eligible for tier 1 has increased from 15% up to 35%. The consequences of these changes is that once the changes come into effect in the spring, in most cases the most financially viable projects will have both a high heat usage, relative to the boiler size, and a high existing fuel bill i.e. Projects will most likely be viable if they have RHI income and fuel savings.
Heat from Anaerobic Digestion, will need to meet the same 50% of biogas from wastes or residues as the FIT (see previous FIT section for more details).
Drying digestate is no longer eligible, therefore it will be more difficult to find a use for the heat. Things worth considering are glasshouses, absorption-chillers for cold stores and possibly poly-tunnels. Additionally a new installation is only eligible for drying wood chip if it can be shown that the system is replacing an existing fossil fuel drier.
Renewable electricity - Renewable Obligation Certificates (ROCs) and Contracts for Difference (CfDs) Large-scale renewable electricity production in the UK is now supported by the Contracts for Difference. The Renewables Obligation (RO) ended to new entrants on the 31
st March 2017.
Contracts for Difference (CfD) are available for all low carbon electricity generation (including nuclear and Carbon Capture and Storage - CCS) and guarantee operators a set price (known as the ‘strike price’) for each MWh of energy that they produce over the duration of the contract. Investors are able to lock in for a 15 year term to a given strike price, which is set at a level intended to be sufficient to cover the long-run costs of their low carbon technology. Key terms of the contract cannot be altered, even in the event that a future government seeks to change policy objectives, thus this should help to provide more certainty to investors.
The CfD works by drawing up a contract between the government and the generator that agrees a reference price or a strike price (based on wholesale rates). The generators will then sell some energy to suppliers, and the cost at which they sell it at may be the same as the strike price; below it; or slightly above it. If the sales of energy by the generators are the same as the strike price, then there is no further action. If the price is below that price, it will trigger top-up payments by the suppliers, while if

RENEWABLE ENERGY 320
the sales by the generators are at a higher price, it will result in generators paying back the difference.
The latest round of contracts for innovative technologies (this basically means anything apart from onshore wind or solar farms and biomass power stations) opened and closed in April for initial applications. With a budget of £290million of a proposed total of £730 million until 2026, suggests there may only be a few more rounds over the next 9 years. This makes planning developments very difficult and only probably accessible to the larger projects.
For more information, please view details on-line at: https://www.gov.uk/government/publications/contracts-for-difference/contract-for-difference.
Renewable transport fuels (biofuels) Support for biofuels is provided by the Renewable Transport Fuels Obligation (RTFO). Small biodiesel producers are also entitled to a duty free allowance for the first 2,500 litres that they produce if this is used for personal consumption only.
The RTFO requires suppliers of transport or non-road mobile machinery fuel in the UK to show that a percentage of the fuel that they supply comes from renewable and sustainable sources. Fuel suppliers who supply at least 450,000 litres of fuel a year are affected; this includes suppliers of biofuels as well as suppliers of fossil fuel. Companies supplying less than 450,000 litres a year in the UK can still register if they want to claim Renewable Transport Fuel Certificates (RTFCs). Any company that supplies sustainable biofuel for use in road transport or non-road mobile machinery in the UK can claim RTFCs. These RTFCs can then be traded or sold to companies that need them to meet their obligations under the RTFO.
The RTFO came into effect on 15 April 2008 and the amount of biofuel that must be supplied by volume increased annually up to April 2013 when it reached 4.75%, a percentage considered safe in standard vehicle engines, where it will remain until further consultation.
In 2017-18, bioethanol comprised 43% of supply, biodiesel 52% and biomethanol 5%. There was also a small volume of off-road biodiesel and biomethane. 66% of biofuel covered by the RTFO is made from wastes, principally used cooking oil and tallow. 33% of raw material was sourced from UK feedstocks.
As well as obliging fuel suppliers to meet targets for the volumes of biofuels supplied, the RTFO requires companies to submit reports on carbon emission savings and the sustainability of biofuels.
The UK government closed a major consultation on the RTFO in January 2017 which was responded to in September 2017. Some of the major points in the consultation are:

RENEWABLE ENERGY 321
A maximum level for crop based biofuels will begin at 4% in 2018 to 3% in 2026 and 2% in 2032.
Raise the RFTO to 9.75% (by volume) in 2020. Following this an increasing trajectory for the Obligation level will be set so that by 2032 the Obligation will reach 12.4%.
Define and categorise wastes and introduce structures to ensure wastes with higher value end uses are less likely to be used for biofuel production. However, in certain situations where the waste would have significantly better overall environmental outcome the Administrator will determine whether the waste can be eligible for single or double RTFCs.
Double rewards will continue where the waste would not otherwise be used for a higher value end use according to the waste hierarchy concept.
Renewable fuels made from sustainable wastes and residues, or of non-biological origin, are to be incentivised.
New fuel types are being made eligible for support under RTFO, including aviation fuel and renewable hydrogen. The fuel needs to meet carbon and sustainability criteria to be eligible.
For further information on the RTFO please see: https://www.gov.uk/guidance/renewable-transport-fuels-obligation and https://assets.publishing.service.gov.uk/government/uploads/system/uploads/attachment_data/file/644843/renewable-transport-fuel-obligations-order-government-response-to-consultations-on-amendments.pdf
Wind Power
On-farm wind power has two main scales of operation to consider, with commercial wind farm sites having a focus on exporting power to the grid, while small to medium scale generation is more concerned with offsetting purchased power within the farm business. Even if the power generated is primarily being used on the farm, demand may not always be constant, therefore it is likely that a proportion of the power produced will have to be sold to the grid at certain times.
For landowners with suitable sites for large-scale wind developments there are a number of development options available:
Allow a developer to install the turbine(s) in exchange for an annual payment;
Install the turbine(s) independently either by self-funding or using bank finance, or any combination of the two;
Joint venture scheme with developer or neighbour; Community project with local buy-in.
Wind turbines Wind turbines are best located in exposed areas with open fetch especially in the direction of the prevailing wind, away from residencies,
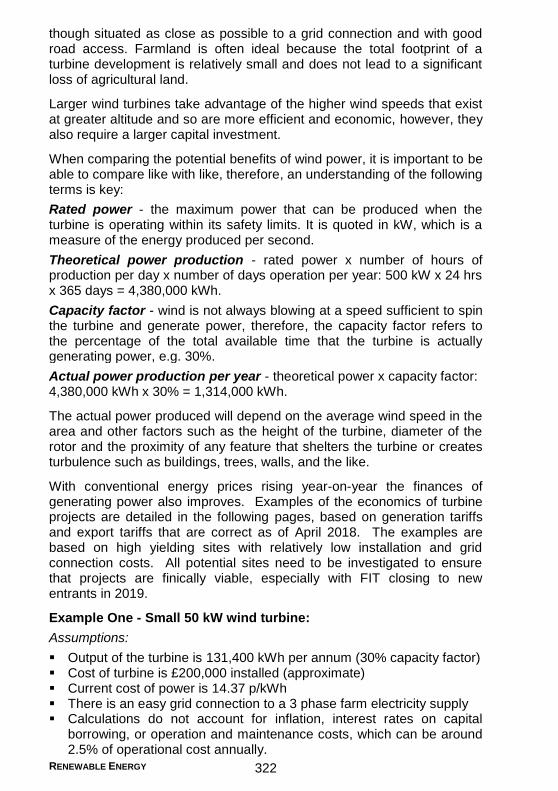
RENEWABLE ENERGY 322
though situated as close as possible to a grid connection and with good road access. Farmland is often ideal because the total footprint of a turbine development is relatively small and does not lead to a significant loss of agricultural land.
Larger wind turbines take advantage of the higher wind speeds that exist at greater altitude and so are more efficient and economic, however, they also require a larger capital investment.
When comparing the potential benefits of wind power, it is important to be able to compare like with like, therefore, an understanding of the following terms is key:
Rated power - the maximum power that can be produced when the turbine is operating within its safety limits. It is quoted in kW, which is a measure of the energy produced per second.
Theoretical power production - rated power x number of hours of production per day x number of days operation per year: 500 kW x 24 hrs x 365 days = 4,380,000 kWh.
Capacity factor - wind is not always blowing at a speed sufficient to spin the turbine and generate power, therefore, the capacity factor refers to the percentage of the total available time that the turbine is actually generating power, e.g. 30%.
Actual power production per year - theoretical power x capacity factor: 4,380,000 kWh x 30% = 1,314,000 kWh.
The actual power produced will depend on the average wind speed in the area and other factors such as the height of the turbine, diameter of the rotor and the proximity of any feature that shelters the turbine or creates turbulence such as buildings, trees, walls, and the like.
With conventional energy prices rising year-on-year the finances of generating power also improves. Examples of the economics of turbine projects are detailed in the following pages, based on generation tariffs and export tariffs that are correct as of April 2018. The examples are based on high yielding sites with relatively low installation and grid connection costs. All potential sites need to be investigated to ensure that projects are finically viable, especially with FIT closing to new entrants in 2019.
Example One - Small 50 kW wind turbine:
Assumptions:
Output of the turbine is 131,400 kWh per annum (30% capacity factor) Cost of turbine is £200,000 installed (approximate) Current cost of power is 14.37 p/kWh There is an easy grid connection to a 3 phase farm electricity supply Calculations do not account for inflation, interest rates on capital
borrowing, or operation and maintenance costs, which can be around 2.5% of operational cost annually.
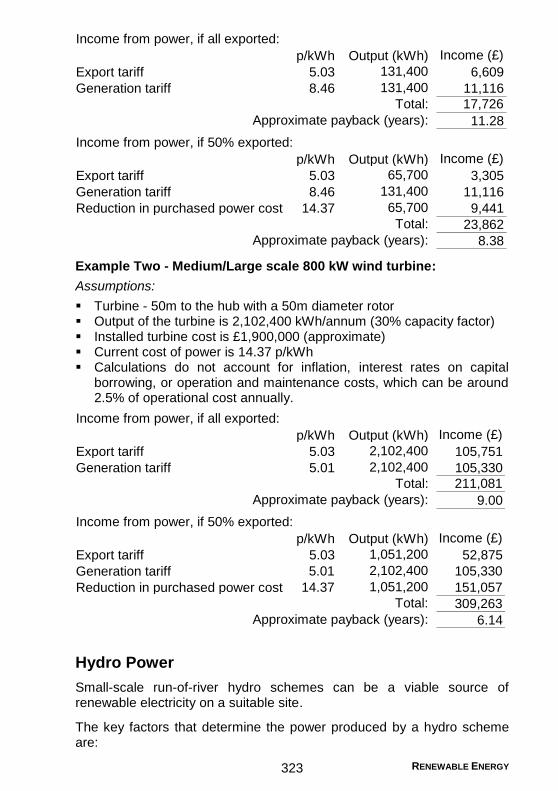
RENEWABLE ENERGY 323
p/kWh Output (kWh) Income (£)
Export tariff 5.03 131,400 6,609
Generation tariff 8.46 131,400 11,116
17,726
11.28
Income from power, if all exported:
Total:
Approximate payback (years):
p/kWh Output (kWh) Income (£)
Export tariff 5.03 65,700 3,305
Generation tariff 8.46 131,400 11,116
Reduction in purchased power cost 14.37 65,700 9,441
23,862
8.38Approximate payback (years):
Income from power, if 50% exported:
Total:
Example Two - Medium/Large scale 800 kW wind turbine:
Assumptions:
Turbine - 50m to the hub with a 50m diameter rotor Output of the turbine is 2,102,400 kWh/annum (30% capacity factor) Installed turbine cost is £1,900,000 (approximate) Current cost of power is 14.37 p/kWh Calculations do not account for inflation, interest rates on capital
borrowing, or operation and maintenance costs, which can be around 2.5% of operational cost annually.
p/kWh Output (kWh) Income (£)
Export tariff 5.03 2,102,400 105,751
Generation tariff 5.01 2,102,400 105,330
211,081
9.00
p/kWh Output (kWh) Income (£)
Export tariff 5.03 1,051,200 52,875
Generation tariff 5.01 2,102,400 105,330
Reduction in purchased power cost 14.37 1,051,200 151,057
309,263
6.14Approximate payback (years):
Income from power, if all exported:
Total:
Approximate payback (years):
Income from power, if 50% exported:
Total:
Hydro Power Small-scale run-of-river hydro schemes can be a viable source of renewable electricity on a suitable site.
The key factors that determine the power produced by a hydro scheme are:

RENEWABLE ENERGY 324
Head - The vertical distance through which the water will fall.
Flow Rate - The quantity of water that will be available for power production.
Developers of hydropower schemes require a water use licence from Scottish Environment Protection Agency (SEPA) who will seek to ensure a balance between the benefits to renewable energy generation and the adverse impacts on the water environment. Schemes where the fall in the river between the intake and discharge points has a gradient of 1 in 10 or steeper will be more likely to obtain a water use licence.
Civil engineering costs vary greatly from site to site. Development costs for very small schemes are much higher per kW capacity than larger schemes. Small sites where the available head is 3 m or less are unlikely to provide a reasonable return on investment unless existing infrastructure can be utilised to reduce capital cost. Higher head schemes need lower flows and hence smaller and cheaper equipment to generate the same power as low head schemes.
The flow rate will vary during the year, however, for a scheme to be viable there must be sufficient flow to keep the system operating at near its rated power for a large proportion of the time. Some flow must usually be left in the stream for environmental sustainability and consideration of the needs of migrating fish is important.
An indication of the power production of a scheme can be obtained from the following equation:
Power produced (kW) = 7 x Flow rate (m3/s) x Head (m)
A capacity factor of 50% can be expected where a scheme is sized on the mean flow of the river, therefore a 10 kW scheme may have an annual output of approximately 43,800 kWh, which is sufficient for about 10 houses. An example of the economics of a hydro project is detailed overleaf. The example is based on a site with high yields and relatively easy grid connection. These attributes need to be examined thoroughly to ensure that the project is financially viable.
Further information can be obtained from British Hydropower Association (www.british-hydro.org).
Example - Small high head 25kW hydro scheme:
Assumptions:
Output of the turbine is 109,500 kWh per annum (50% capacity factor) Installed cost is £140,000 (very site specific) Current cost of power is 14.37 p/kWh Easy connection (if not, can be costly) to a 3 phase farm electricity
supply

RENEWABLE ENERGY 325
Calculations do not account for inflation, interest rates on capital borrowing, or operation and maintenance costs which can effect the financial viability of a project.
p/kWh Output (kWh) Income (£)
Export tariff 5.03 109,500 5,508
Generation tariff 8.07 109,500 8,837
14,345
9.76
Income from power, if all exported:
Total:
Approximate payback (years):
p/kWh Output (kWh) Income (£)
Export tariff 5.03 54,750 2,754
Generation tariff 8.07 109,500 8,837
Reduction in purchased power cost 14.37 54,750 7,868
19,458
7.19Approximate payback (years):
Income from power, if 50% exported:
Total:
Solar Photovoltaics
The sun’s energy has always been used by farmers for growing and drying crops. With electricity prices on the increase, farmers can now look to harness the power of the sun in a rather different way. Solar photovoltaic (PV) panels, which produce electricity from sunlight, have become an increasingly common sight on farms in recent years. Despite the comparatively low solar insolation levels in Scotland when compared to the south of England, solar PV can still be a very viable option north of the border.
PV panels can be either roof or ground-mounted. Roof mounted arrays are more efficient in terms of land use because they make use of an existing area of space that is not currently adding value to a farm business. Farms also commonly have large areas of roof available in the form of barns and sheds, although it is important to check that roofs are strong enough to support a system if retrofitting to an existing structure. Another issue is that roofs do not always face in the optimum direction (south) or at the optimum angle (usually around 30-40 degrees) and may be shaded by other structures, and in these cases ground-mounted arrays can be an alternative option.
Ground mounting allows for the ideal positioning of panels, which maximises the efficiency of a scheme. However, it can also mean that land use is diverted away from food production and into energy production, which can be controversial. Land used for small-scale livestock, such as sheep and poultry, is ideal for ground-mounted solar development. The panels are mounted on a framework at a height that allows animals to graze and forage beneath them without damaging or compromising the operation of the system. Advice on the impacts of

RENEWABLE ENERGY 326
installing ground mounted solar panels on area based agricultural subsidy payments should be taken.
The introduction of the FIT Scheme in 2010 triggered a rush of solar PV installations in the UK. FIT rates for solar PV have been severely cut back in recent years, however, the capital costs of panels have also fallen over the same period, meaning that solar PV can still be a viable long-term investment in the right location and under the right conditions.
There are now energy efficiency requirements linked to FIT payments for solar PV installations, as of 15 January 2016. The FIT rates for standard solar PV installations (those installations, which are wired or attached to a building) now fall into 3 categories, higher, middle and lower with the FIT decreasing respectively. To qualify for the higher category the building you are attaching your installation to must have an Energy Performance Certificate rating of level D or above issued on or before the commissioned date. The middle rate applies to multi-installations and all other installations would receive the lower rate. There is a significant difference between the higher and lower rate, which can make a scheme viable at the higher rate and not at the lower so it is important to ensure that your building complies with the regulations.
Example - Medium scale 50kW roof mounted scheme:
Assumptions:
Output of the scheme is 40,300 kWh per annum Installed cost is £45,000 Current cost of power is 14.37 p/kWh Barn roof angle is 15 degrees to the horizontal There is an easy grid connection to a 3 phase farm electricity supply Calculations do not account for inflation, interest rates on capital
borrowing, or operation and maintenance costs The installation is fitted to a building with an EPC rating of level D or
above.
p/kWh Output (kWh) Income (£)
Export tariff 5.03 40,300 2,027
Generation tariff 4.25 40,300 1,713
3,740
10.70
p/kWh Output (kWh) Income (£)
Export tariff 5.03 20,150 1,014
Generation tariff 4.25 40,300 1,713
Reduction in purchased power cost 14.37 20,150 2,896
5,622
7.12Approximate payback (years):
Income from power, if all exported:
Total:
Approximate payback (years):
Income from power, if 50% exported:
Total:

RENEWABLE ENERGY 327
Biomass Heating
Biomass heating can be an attractive option for farms, even where the farm does not have its own source of biomass fuel. This is because the RHI has transformed the economics of installing biomass systems and is increasing the demand for woodfuel (see pages 315-319 for information on RHI).
Biomass boilers are a well proven, efficient and reliable technology that has been developed over many years in countries such as Austria and Germany. These boilers are generally technologically advanced and highly efficient. More basic boilers are available which are less efficient and have very little automation, and consequently come at a significantly lower capital cost.
There are four main types of biomass boiler: woodchip boilers, pellet boilers, log boilers and straw boilers. All four options have pros and cons and care must be taken to ensure the right type of system is selected to match user requirements, including factors such as the degree of automation required, the scale and patterns of heat demand, capital cost and local fuel availability.
A few key facts about different woodfuel options include:
Woodchip and pellet boilers can be fully automated. Log and straw boilers can be an economic option where farms have
their own log or straw supply. However, they must be loaded manually, generally on a daily basis as a minimum.
Woodchip is a lower cost fuel when compared to pellets, but is bulky and can be difficult to handle.
Wood pellets are clean, easier to handle, require less space to store and have a higher energy output. They are more expensive than chip and cannot be produced on-farm. However, the capital cost of a pellet boiler is lower than a chip boiler.
Woodchip boilers and their fuel supply systems have higher capital costs, and for technical reasons they are generally not suited to smaller, domestic applications (e.g. below 50kW).
Costs for biomass boilers are highly variable depending on the individual system requirements. There may also be significant costs associated with installations such as constructing a fuel store, or purchasing specialist vehicles to use for handling or loading fuel, etc.
The introduction of the RHI has resulted in non-domestic woodfuel systems that are creating demand for poor quality timber and creating an additional driver for poor quality farm land to be used for agri-forestry.
In most small-scale situations it is not practical to produce electrical power from biomass, because such systems are complex and expensive. For this reason generating power is only worth considering when there is a large demand for both heat and power.

RENEWABLE ENERGY 328
The following examples give an indication of the economics of biomass heating projects:
Example One - 950 kW wheat straw fired boiler for grain drying:
Assumptions:
250,000 kWh annual heat demand (drying 2,000 tonnes of grain per year, no district heating system)
Installed cost of £200,000 (approximate) Current cost of oil is 3.90 p/kWh Wheat straw supplied from the farm at £50/t Calculations do not account for inflation, interest rates on capital
borrowing or operation and maintenance costs
p/kWh Output (kWh) Income (£)
Income from Tier 1 RHI 3.05 250,000 7,625
Income from Tier 2 RHI 2.14 0 0
Oil bill savings 2.29 250,000 5,714
Total: 13,339
14.99
266,786
Approximate payback (years):
Income & savings over 20 years:
Example Two - 450 kW chip boiler for estate district heating scheme:
Assumptions:
558,000 kWh annual heat demand (based on figures from oil bills) Installed cost of £420,000 (approximate) Current cost of oil is 4.90 p/kWh Chips supplied from the farm at £65/t Calculations do not account for inflation, interest rates on capital
borrowing or operating and maintenance costs
p/kWh Output (kWh) Income (£)
Income from Tier 1 RHI 3.05 558,000 17,019
Income from Tier 2 RHI 2.14 0 0
Heating bill savings 2.83 450,000 12,735
Income from heat sales to cottage 2.83 108,000 3,056
32,810
12.80
656,208
Total:
Approximate payback (years):
Income & savings over 20 years:
Example Three - 200 kW wood pellet boiler for poultry sheds:
Assumptions:
320,000 kWh annual heat demand (based on figures from LPG bills) Installed cost of £160,000 (approximate) Current cost of LPG is 5.60 p/kWh Pellets supplied in bulk delivery at £200/t

RENEWABLE ENERGY 329
Calculations do not account for inflation, interest rates on capital and maintenance costs
p/kWh Output (kWh) Income (£)
Income from Tier 1 RHI 5.32 262,800 13,981
Income from Tier 2 RHI 2.31 57,200 1,321
Heating bill savings -0.03 320,000 -107
15,196
8.56
303,912
Total:
Approximate payback (years):
Income & savings over 20 years:
Farm Scale Biodiesel
On-farm biodiesel production is not currently competitive with diesel due to the high cost of rapeseed and vegetable oil, the low price of diesel and difficulties accessing support payments. Biodiesel can be made from a wide range of vegetable oils and animal fats (tallow). High quality straight vegetable oil (SVO) can also be used as a fuel at higher inclusion rates in certain engines. The use of biodiesel and SVO above 5% inclusion could impact on engine manufacturer’s warranties.
On-farm biodiesel production from rapeseed involves two stages; cleaning and crushing the seed to extract oil using and esterification of the oil by mixing with methanol in the presence of a catalyst to remove glycerol. Although chemically this is a simple process there is a need for careful quality control to achieve the required standards. Handling methanol and the catalyst (usually potassium hydroxide) on the farm is hazardous and requires attention to health and safety and insurance. To produce SVO is the same as for biodiesel without the esterification reaction step. Rapeseed meal is an important co-product of the crushing process and a useful protein supplement for animal feed.
Growers should calculate an ‘on the road’ price taking into account the costs of feedstock, capital and operating costs, allowing for income from production of rapeseed meal, and adding the full fuel duty and VAT. Small-scale producers may benefit from a 2,500 litre tax free personal allowance. Production costs for SVO are considerably lower.
Renewable Transport Fuel Obligation (RTFO) Certificates offer the potential for increased returns however it may prove difficult for smaller operators to access this income. Biodiesel from waste materials such as tallow receive double RTFC’s. Data on carbon and sustainability performance must be independently verified before RTFCs are awarded. The RTFO buy out price is currently 30p/litre and certificates could range in value from 0 to 30p/litre.
RENEWABLE ENERGY 330
Anaerobic Digestion
Anaerobic digestion (AD) uses bacteria to convert organic matter into methane and carbon dioxide (referred to as “biogas”), in the absence of oxygen. The biogas can be used to provide heat, generate electricity or upgraded to biomethane (carbon dioxide is removed) for injection into the gas grid. In addition AD can provide other benefits; utilising wastes, reducing emissions of methane, cutting odours and enhancing water quality.
Feedstock can be any biodegradable non woody plant, animal matter (manures/slurry), energy crops (grass, rye or maize silage, beet) and food waste. Food wastes are becoming less attractive due to falling gate fees for accepting them, complex licensing and regulation and higher capital costs of the plant for pasteurisation. It is important that the mix is kept relatively consistent and that the balance of carbon to nitrogen is suitable for the bacteria. Feedstock can comprise conventional grass silage, however, specialised energy crops are likely to perform better overall in an AD plant, as they are not selected for feed quality, just dry matter yield and nitrogen efficiency.
The high degree of automation and control in a modern biogas plant means that on-farm plant costs are high; in the region of £0.75/m
3 to
£1.50/m3 of biogas produced. Government incentives are essential for the viability of the sector, so any change to support payments and RHIs (see pages 315-319) should be closely monitored. For any proposed plant, the cost and availability of feed stock will be the main factors determining viability. If you do not have enough of your own land available to produce sufficient feedstock, securing long term contracts for off-farm feedstocks will be essential if you are seeking a bank loan. A thorough feasibility study is also recommended to assess the viability of any project being considered.
For larger scale AD plants, whether gas–to-grid or Combined Heat and Power, farmers are mainly involved as feedstock suppliers. The capital costs of gas-injection plants are higher due to the need to “scrub” the gas to meet grid standards (remove carbon dioxide). The location of these plants is also dependent on local gas grid capacity. Where feasible, gas to grid AD plants have a clear economic advantage, and this is reflected in the increasing number of new plants following this approach. For farmers supplying feedstock the principles are the same though there may be greater seasonality of pricing in gas to grid plant reflecting payment structures for wholesale gas (higher prices in the winter).
Farmers growing crops for AD feedstock will find that prices vary from plant to plant and will reflect the basis of the sale; standing crop or delivered plant. Typical feedstock payment rates are; £65 to £85/t Dry Matter standing and £85 to £105/t Dry Matter delivered. Prices will also

RENEWABLE ENERGY 331
reflect shared costs such as specialist machinery and the value assigned to digestate.
Based on recent prices AD energy crops had been attractive for many arable growers in part due to the low prices for conventional cereals. However, in the last couple of years feed wheat and barley prices have risen around £40/t and spring malting barley prices around £50/t depending on contract. This has made conventional cropping relatively more profitable for many growers. AD plant operators are unique in offering relatively long contracts of 5 to 10 years for feedstock crops. Therefore the best approach for most farmers is likely to be to include AD crops as part of mixed cropping system. This will deliver some security of income from long term AD contracts alongside flexibility to benefit from any rise in grain prices that may occur.
AD crops may also offer other potential benefits to the farm business including; spreading the workload, providing early entry for oilseed rape and enabling grass to be brought back profitably to all-arable rotations.
Farmers growing AD feedstock must now meet key sustainability standards to receive support. Ofgem require all RHI claimants to demonstrate their feedstocks meet sustainability criteria regarding land use change (rarely relevant in UK) and carbon emissions. For the RHI the carbon intensity of the feedstock must be less than 34.8 g CO2 equivalent per MJ of energy produced. In crop production the main source of greenhouse gases is inorganic nitrogen fertiliser, so usage needs to be minimised. In AD systems this is partly achieved by the application of digestate back to the crop. With careful planning it is likely that most crops grown for AD will be able to meet these carbon targets. Ofgem provide an online calculator and guidance though it is advised that expert advice is also sought when preparing this information especially for the first time. See www.ofgem.gov.uk for full details.

RENEWABLE ENERGY 332
Crop Costs for Anaerobic Digestion
PHYSICAL DATA
(a) Yield and harvest Yields are based on crops grown in southern and central Scotland
assuming average weather conditions and SRUC’s experience from recent trials. Actual yields will vary widely and are much less certain in the north with maize not recommended outwith south west Scotland. Trial results indicate that rye yields are more consistent year to year than beet, reflecting the crop’s longer growing period. Harvest of winter hybrid rye is typically around the middle to end of July with maize and energy beet harvests in late October.
(b) Seed Certified seed has been assumed for all crops and hybrid seed for
rye and maize.
(c) Fertiliser Full rates of artificial fertiliser have been calculated to match crop
offtake. Where digestate from an Anaerobic Digestion (AD) plant is applied fertiliser rates should be adjusted accordingly. In practice digestate use is likely to reduce but not entirely replace the requirement for artificial fertiliser due to mismatches in nutrient availability and timing between crops.
(d) Sprays Full rates based on current best practice have been assumed.
(e) Contract These include the cost of specialist contractors for harvesting and
transporting the roots or silage produced to a nearby (within 3 miles) AD plant. Transport costs should be adjusted accordingly to the distances involved.
(f) Output prices The price in the market for AD feedstock will be determined by local
feedstock supply and demand issues and the conditions of the contract. The contract price will reflect the basis of the sale; standing crop, ex-farm or delivered to plant. It will also reflect the method agreed to share other costs such as specialist machinery and the value and costs assigned to any digestate applied to the land (see previous pages).

RENEWABLE ENERGY 333
Crop Costs for Anaerobic Digestion
COST OF PRODUCTION DATA - LOCAL DELIVERED BASIS
Energy
beet
Hybrid
rye
Grass
silage
Maize
Yield: fresh (t/ha) 67.5 40.0 36.0 38.0
Dry matter (%) 22% 34% 29% 30%
Yield : dry matter (t/ha) 14.85 13.60 10.44 11.40
Methane yield (m3/fresh t) 99 108 95 106
Energy (MWhr TH/fresh t) 1.2 1.3 1.1 1.3
Energy (MWhr TH/ha) 79.7 51.5 40.9 48.0
COSTS
Seeds 194 154 22 173
Fertiliser 163 231 269 196
Sprays 181 56 13 60
Contract cultivation 282 226 56 248
Contract harvesting 321 142 352 140
TOTAL COSTS (£/ha) 1,141 809 712 817
TOTAL COSTS (£/t) 17 20 20 21
TOTAL COSTS (£/MWhr TH) 14 16 17 17
£/ha
Note: Contract costs include fuel. The above cost of production data exclude charges such as land rental, interest, management time and any margin requirements which will be important to include when considering any contract price agreement.

RENEWABLE ENERGY 334
Biomass Crops for Energy
Willow short rotation coppice Willow is a perennial biomass crop grown principally for energy production on a 15 to 20 year rotation with harvesting every 3 to 4 years once established. Returns from the crop are highly dependent on yield and woodchip price. The main market for the woodchip is on contract to power generators and large-scale thermal plants. The woodchip is not suitable for small-scale biomass heating schemes without significant grading and drying costs due to the high bark and moisture content and oversized chips. Given the limited markets, high costs of establishment, variable growth rates and lack of planting grants the crop is largely uneconomic.
Short rotation forestry This is a variation on conventional forestry based on early harvesting of fast growing species through coppicing and regrowth. In general, the most economic age to harvest conventional timber species is at maturity so the case for shorter rotations in most species remains unproven. A number of tree species capable of coppicing can be used for short rotation forestry (SRF), e.g. Alder, Notofagus, Poplar, Eucalyptus and Sycamore. Large- scale trials with a number of species and sites are currently being carried out by the Forestry Commission. As with conventional forestry, a wide range of sites will be suitable for cultivation of these species, including sites which have a lower nutrient status and a poorer land classification.
Trees are grown to butt size 15-20 cm for harvest at 8-20 years. Current advice is to plant at 2m square and apply broad spectrum herbicide to control weeds during establishment. Nitrogen application in the first year should be avoided as there is no benefit to growth. SRF has not been examined on a sufficiently extensive scale or time period to derive crop data as yet. Yields will vary from site to site, with average annual increments estimated at between 4 to 9 m
3/ha/yr or around 1.5 to 3.2
ODT/yr. Planting grants may be available as part of the forestry grant schemes being offered under Rural Development across the UK. See the Forestry Commission (https://scotland.forestry.gov.uk/) for updates on the energy forestry trials work underway.
Miscanthus Miscanthus is a perennial energy crop suited to the southern half of the UK with viability dependent on yields, contract prices and proximity to biomass power stations or other market outlets. The crop has also found a higher value outlet as poultry and horse bedding due to its high level of moisture absorbency and low dust levels. The miscanthus chips are also less favoured than woodchips for fuel due to low bulk density and high chlorine content. As a result growing the crop for bedding is becoming the preferred end use in many areas. The crop uses a C4 photosynthetic pathway, like maize, requiring high light intensities and temperatures.

RENEWABLE ENERGY 335
Yields at suitable sites south of a line from the Severn to the Wash are expected to be 12-15 ODT/ha. Lowground sites north of this may also be feasible but as with maize, yields and viability are likely to be reduced.
The crop is established using rhizomes, typically at 15,000 plants/ha. Like willow coppice, planting requires specialist equipment, considerable labour input and relatively costly planting material resulting in high establishment costs. After the first year the crop can be harvested annually and has a useful life of 15-20 years. Weed control is necessary in the establishment year and possibly in the first spring. Nutrient demand is low with typically an application of 40N:40P:40K kg/ha in year one. Most crops are unlikely to require further applications although up to 150 kg/ha N may be applied over the first 2 years in some situations. The need for pest and disease control is low.
Reed canary grass Reed canary grass is a perennial plant well suited to cultivation in northern and western parts of the UK and commonly grown in Scandinavia for fodder and increasingly for AD. In the UK the plant is widely used as a game cover crop. It grows well under marginal conditions, including upland areas and brownfield sites in northern and western areas. It is a perennial crop established from seed (unlike Miscanthus) leading to considerable cost advantages.
Establishment and cultivation are undertaken with existing farm equipment with the need for some nitrogen fertiliser to achieve maximum yield. Trial yields vary from 5 to 14 ODT/ha with the crop performing better at more northern sites where average yields of over 10 ODT/ha have been achieved. Further work is needed to determine viability but it has cost saving and land use flexibility advantages compared to other perennial crops and can utilise more marginal land. The crop also has useful flexibility in its end use; in the summer it can be cut for AD production or grazed by cattle; in the winter and spring it can be baled for biomass fuel or animal bedding.


Fuel
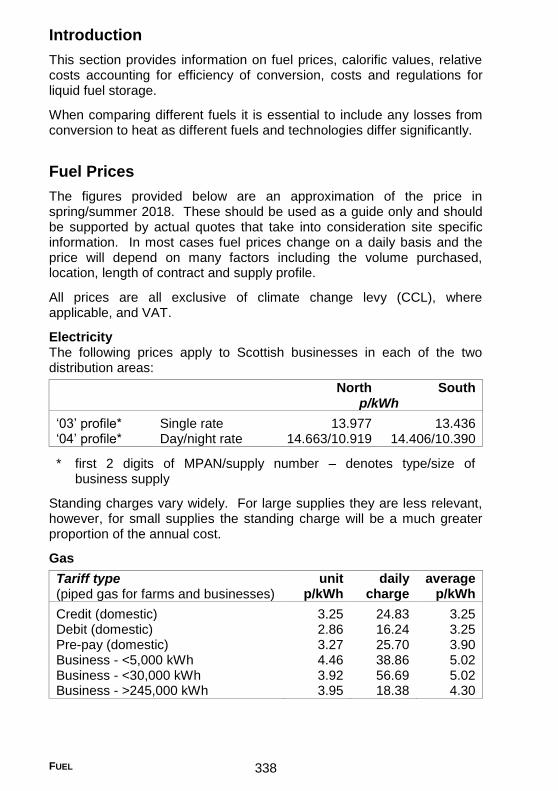
FUEL 338
Introduction
This section provides information on fuel prices, calorific values, relative costs accounting for efficiency of conversion, costs and regulations for liquid fuel storage.
When comparing different fuels it is essential to include any losses from conversion to heat as different fuels and technologies differ significantly.
Fuel Prices
The figures provided below are an approximation of the price in spring/summer 2018. These should be used as a guide only and should be supported by actual quotes that take into consideration site specific information. In most cases fuel prices change on a daily basis and the price will depend on many factors including the volume purchased, location, length of contract and supply profile.
All prices are all exclusive of climate change levy (CCL), where applicable, and VAT.
Electricity The following prices apply to Scottish businesses in each of the two distribution areas:
North South p/kWh
‘03’ profile* Single rate 13.977 13.436 ‘04’ profile* Day/night rate 14.663/10.919 14.406/10.390
* first 2 digits of MPAN/supply number – denotes type/size of business supply
Standing charges vary widely. For large supplies they are less relevant, however, for small supplies the standing charge will be a much greater proportion of the annual cost.
Gas
Tariff type (piped gas for farms and businesses)
unit p/kWh
daily charge
average p/kWh
Credit (domestic) 3.25 24.83 3.25 Debit (domestic) 2.86 16.24 3.25 Pre-pay (domestic) 3.27 25.70 3.90 Business - <5,000 kWh 4.46 38.86 5.02 Business - <30,000 kWh 3.92 56.69 5.02 Business - >245,000 kWh 3.95 18.38 4.30
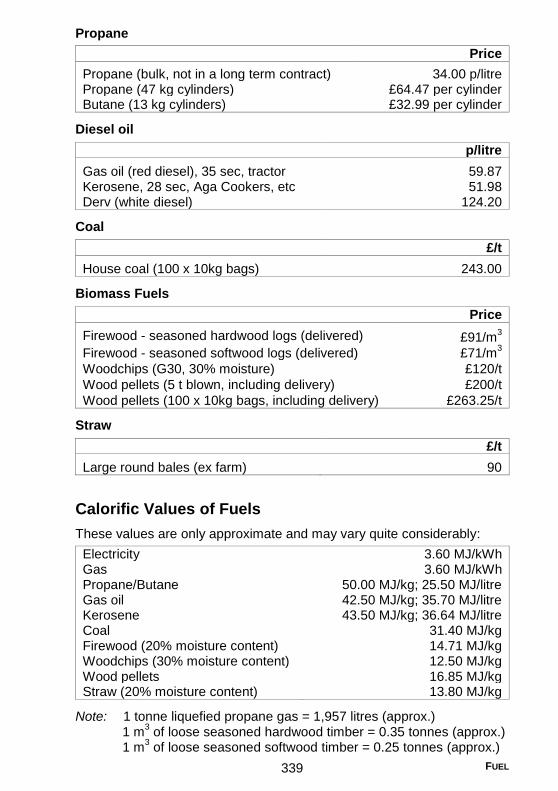
FUEL 339
Propane
Price
Propane (bulk, not in a long term contract) 34.00 p/litre Propane (47 kg cylinders) £64.47 per cylinder Butane (13 kg cylinders) £32.99 per cylinder
Diesel oil
p/litre
Gas oil (red diesel), 35 sec, tractor 59.87 Kerosene, 28 sec, Aga Cookers, etc 51.98 Derv (white diesel) 124.20
Coal
£/t
House coal (100 x 10kg bags) 243.00
Biomass Fuels
Price
Firewood - seasoned hardwood logs (delivered)
£91/m3
Firewood - seasoned softwood logs (delivered) £71/m3
Woodchips (G30, 30% moisture) £120/t
Wood pellets (5 t blown, including delivery) £200/t
Wood pellets (100 x 10kg bags, including delivery) £263.25/t
Straw
£/t
Large round bales (ex farm) 90
Calorific Values of Fuels
These values are only approximate and may vary quite considerably:
Electricity 3.60 MJ/kWh Gas 3.60 MJ/kWh Propane/Butane 50.00 MJ/kg; 25.50 MJ/litre Gas oil 42.50 MJ/kg; 35.70 MJ/litre Kerosene 43.50 MJ/kg; 36.64 MJ/litre Coal 31.40 MJ/kg Firewood (20% moisture content) 14.71 MJ/kg Woodchips (30% moisture content) 12.50 MJ/kg Wood pellets 16.85 MJ/kg Straw (20% moisture content) 13.80 MJ/kg
Note: 1 tonne liquefied propane gas = 1,957 litres (approx.) 1 m
3 of loose seasoned hardwood timber = 0.35 tonnes (approx.)
1 m3 of loose seasoned softwood timber = 0.25 tonnes (approx.)
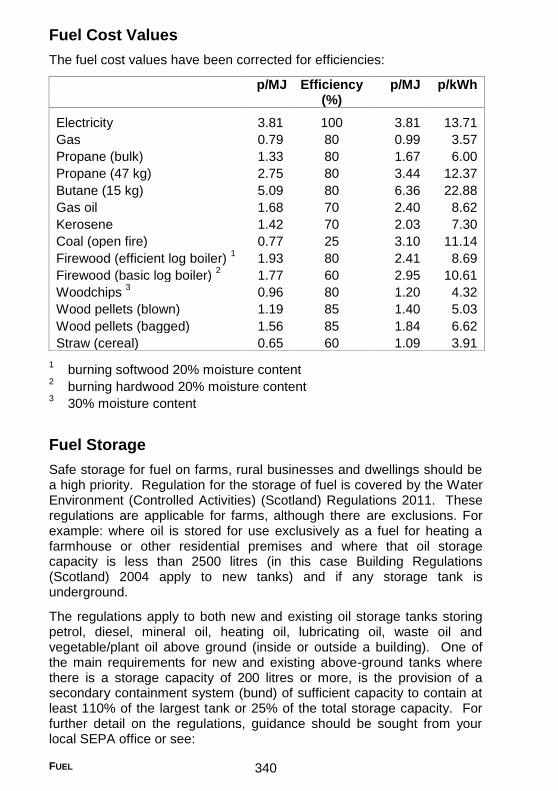
FUEL 340
Fuel Cost Values
The fuel cost values have been corrected for efficiencies:
p/MJ Efficiency (%)
p/MJ p/kWh
Electricity 3.81 100 3.81 13.71
Gas 0.79 80 0.99 3.57
Propane (bulk) 1.33 80 1.67 6.00
Propane (47 kg) 2.75 80 3.44 12.37
Butane (15 kg) 5.09 80 6.36 22.88
Gas oil 1.68 70 2.40 8.62
Kerosene 1.42 70 2.03 7.30
Coal (open fire) 0.77 25 3.10 11.14
Firewood (efficient log boiler) 1 1.93 80 2.41 8.69
Firewood (basic log boiler) 2 1.77 60 2.95 10.61
Woodchips 3 0.96 80 1.20 4.32
Wood pellets (blown) 1.19 85 1.40 5.03
Wood pellets (bagged) 1.56 85 1.84 6.62
Straw (cereal) 0.65 60 1.09 3.91
1 burning softwood 20% moisture content
2 burning hardwood 20% moisture content
3 30% moisture content
Fuel Storage
Safe storage for fuel on farms, rural businesses and dwellings should be a high priority. Regulation for the storage of fuel is covered by the Water Environment (Controlled Activities) (Scotland) Regulations 2011. These regulations are applicable for farms, although there are exclusions. For example: where oil is stored for use exclusively as a fuel for heating a farmhouse or other residential premises and where that oil storage capacity is less than 2500 litres (in this case Building Regulations (Scotland) 2004 apply to new tanks) and if any storage tank is underground. The regulations apply to both new and existing oil storage tanks storing petrol, diesel, mineral oil, heating oil, lubricating oil, waste oil and vegetable/plant oil above ground (inside or outside a building). One of the main requirements for new and existing above-ground tanks where there is a storage capacity of 200 litres or more, is the provision of a secondary containment system (bund) of sufficient capacity to contain at least 110% of the largest tank or 25% of the total storage capacity. For further detail on the regulations, guidance should be sought from your local SEPA office or see:

FUEL 341
https://www.sepa.org.uk/regulations/water/pollution-control/oil-storage-in-scotland/ or refer to NetRegs, more detail on page 399.
Fuel storage tanks come in various types, shapes and sizes. When choosing your fuel tank, siting should be taken into consideration. Guide prices for storage tanks are shown below:
Plastic tanks Capacity (litres) 1200 1500 2000 2500 5000
Single skin £345 £415 £625 550 - Bunded £939 £785 £1,109 £1,229 £2,495 Dispensing (bunded) - - - £1,744 £2,876
Underground £1,289 (1400 litres) £1,899 (3000 litres)
All tank prices are ex VAT and do not include delivery and, design and installation charges.


Labour and Machinery

LABOUR AND MACHINERY 344
Introduction
The largest component of fixed costs on farm is labour and machinery and this is also the most variable between farms. For these reasons it is essential to fully understand and manage both labour and machinery costs as they can have a large bearing on the financial viability of the farm business. This section details the key elements including standard labour requirements by enterprise, machinery operating data such as rates of work per hour, methods to calculate the cost of owned machinery, detailed contractors charges for a wide range of farm operations and regulations for on-road use. The final section details essential information on labour costs, regulation and health and safety requirements.
Standard Labour Requirements
Enterprise Hours/ annum
Enterprise Hours/ annum
CROPS (per hectare) LIVESTOCK (per animal)
Cereals 18 Dairy cows
Oilseeds 16 50 cows 42
Hops 60 100 cows 35
Sugar beet 33 150+ cows 28
Field beans and peas 16 Beef cows 26
Potatoes Other cattle 12
early 200 Sheep
main crop 110 ewes and rams (lowland) 5.2
Fodder crops 6 ewes and rams (LFA) 3.7
Miscanthus 16 other sheep (lowland) 2.9
Outdoor vegetables/salad 280 other sheep (LFA) 3.1
Other peas and beans 500 Pigs and poultry
Vining peas 12
sows 28
Top and soft fruit 425 finishing and rearing pigs 2.3
Hardy nursery stock 1,900 piglets (<20 kg) 0.2
Fruit/vegetables under cover 7,000 broilers 0.09
Flowers/plants under cover 13,000 laying hens 0.36
Mushrooms 7,220 growing pullets 0.24
Fallow 2.9 other poultry 0.10
Grassland 3.1 Goats 12
Silage (made by farm) Deer 15
1st cut 12 Horses* 40
2nd
cut 10
Rough grazing 1.5
Note: There are difficulties in standardising labour requirements and these figures represent ‘typical’ labour requirements under typical

LABOUR AND MACHINERY 345
conditions for enterprises of average size and performance. They are not necessarily reflective of economic viability.
If calculating farm labour demand, note that crop coefficients should be reduced proportionately for operations carried out by contractors. Livestock coefficients should be reduced pro rata if an animal is not on farm for a full year.
These figures relate to those published in a report of the UK Farm Classification Document (October 2014) and which recommends that 1900 hours of labour are equivalent to one standard annual labour unit. To reflect smaller field sizes, the standard labour requirements for field enterprises should be increased by 50% for Northern Ireland. * Detailed figures for horses can be found in the following publication: The Equine Business Guide, ABC, 6th Edition, 2015.
Machinery Operating Data
Rates of work The following figures are typical rates of work for conditions in northern UK. Actual rates of work can vary widely from these figures depending on the organisation of the system. Methods of calculating rates of work are shown later.
For ‘stand alone’ operations such as ploughing and cultivating, factors such as soil type and conditions, field size and shape, topography and operator experience will affect the overall work rate.
Rates of work for planting, drilling, spraying and fertilising operations will depend on application rates and external field factors such as ease and speed of refilling and location of materials (e.g. water, fertiliser, seed potatoes).
For other operations, which require a system approach, such as grain, silage and potato harvesting, additional factors such as crop yields, labour and transport availability can have a marked effect on work rate.
Typical rate of work (ha/8 h day)
Ploughing (reversible plough):
4 furrows 6.9
6 furrows 10.4
Cultivating:
heavy disc, 3 m, 100 mm deep 13.4
light tine, 3.5 m, 100 mm deep 15.7
harrows, 4.5 m 20.2
combination cultivator (for seedbed preparation), 3 m 13.6

LABOUR AND MACHINERY 346
Typical rate of work (ha/8 h day)
power harrow, 3 m, 150 mm deep 10.0
roller, 2.4 m, heavy 12.3
roller, 7.3 m, light 46.7
potatoes, bedforming, 1.83 m bed 6.0
potatoes, stone windrowing basic, 2 row (Reekie) 4.5
Fertilising:
twin disc, 1,000 kg capacity 24.0
lime spreader, 2 machines and 1 loader 32.0
slurry, 6,000 litre size, 0.8 km haul 29.6
Grain drilling: establishment (following ploughing)
3 m grain only drill 15.2
3 m grain/fertiliser drill 11.2
3 m combination power harrow/grain only drill 9.6
4 m combination power harrow/grain/fertiliser drill 11.3
4 m trailed machine/grain/fertiliser drill 32.5
Grass: seed sowing - drill 3.7 m wide 10.4
Roots: precision sowing, 2 row 2.4
Potatoes: planting, 2 row, cupped design (narrow spacing) 6.0
Potatoes: planting, 6 row, belt design (wide spacing) 15.0
Application rate
200 litres/ha 100 litres/ha
Spraying:
tractor mounted, 850 litre tank, 12 m boom, no bowser
33.6 40.0
tractor mounted, 800 litre tank + 600 litre on front, 18 m boom
52.0 64.0
tractor mounted, 800 litre tank + 600 litre on front, 18 m boom, with bowser
60.8 72.0
sprung LGP vehicle, 800 litres, 12 m boom, with bowser
68.0 87.2
self-propelled, 2,500 litres, 24 m boom, with bowser
144.0 176.0
Grain:
combine harvesting, drum width 1.05 m, typical cutter bar width 3-3.7 m
14.2
combine harvesting, drum width 1.30 m, typical cutter bar width 6.6 m
26.9
combine harvesting, drum width 1.6 m, typical cutter bar width 7.7 m
31.4
combine harvesting, drum width 1.7 m, typical cutter bar width 9.12-11.97 m
42.8

LABOUR AND MACHINERY 347
Typical rate of work (ha/8 h day)
Potatoes:
haulm pulverising: 1.8 m, 2 row 6.5
harvesting: two row trailed, elevator discharge 3.5
Turnip harvesting 1.6
Silage making:
(i) 5 men, 75 kW + precision chop harvester, 3 trailers, buckrake
800 m haul: 9.0
1,500 m haul: 7.4
(ii) 6 men, 90 kW + precision chop harvester, 3 trailers, buckrake
800 m haul: 16.0
1,500 m haul: 10.0
(iii) 6 men, self propelled harvester, 4 trailers, buckrake (will usually involve a rake operator at some point to ‘group’ the smaller mower bouts into a single larger bout)
40.8
(iv) 2 men, forage wagon, buckrake (depending on distance to pit)
15.0-20.0
Grass:
mowing, disc or drum, 2.4 m width of cut 15.4
mowing, disc or drum, 3.0 m width of cut 19.2
baling hay, conventional baler 6.4
baling straw, conventional baler 9.6
baling straw, round baler 16.0
Days available for field work (e.g. ploughing, cultivating, drilling, root harvesting) Calculated for Bush Estate, Midlothian, altitude 200 m.
Month Field work days for three soil types and two month probability levels
Light soil Medium soil Heavy soil 50% 75% 50% 75% 50% 75%
January 25 24 22 18 20 12 February 25 23 21 17 19 12 March 25 24 21 18 20 15 April 27 25 22 19 24 17 May 28 26 25 22 26 20 June 28 26 27 24 27 24 July 29 27 28 26 28 26 August 28 26 27 25 27 24 September 27 25 25 23 24 20 October 26 23 23 19 22 17 November 26 22 23 18 23 17 December 26 23 22 18 23 14

LABOUR AND MACHINERY 348
Probability levels of 75% (18 years out of 24) and 50% (12 years out of 24) are shown in the table so that different risk levels can be compared. The 75% probability level is recommended for machinery and labour planning.
If machinery and labour are adequate for 18 years out of 24, other facilities such as contractors, overtime and casual labour can be used during the remaining years. Alternatively the operation can be performed in wetter conditions.
Soils data used for the calculation of these figures are based on three drainage categories:
Light soils Freely drained sandy loan e.g. Darvel series
Medium soils Moderately drained loamy clay e.g. Macmerry series Heavy soils Imperfectly drained clay loam e.g. Winton series
Workday figures in the table are based on the daily fluctuations of soil moisture content, predicted from daily values of rainfall, sunshine hours and mean air temperature.
A day is assumed to be a work day if the soil moisture content at 9 am is below the lower plastic limit and the total rainfall during the same day does not exceed 10 mm.
Meteorological data spanning 24 years has been used.
The following example uses the figures in the previous table to help calculate the work rate of a tractor.
Example: A tractor has to be purchased to plough 120 ha of heavy soil between mid-August and mid-September. What work rate will be required?
From the preceding table, at 75% probability, the number of days available on a heavy soil during the months of August and September are 24 and 20 respectively.
Therefore, days available second half of August = 24/2 = 12
Therefore, days available first half of September = 20/2 = 10
22
Assuming an eight-hour working day, the total time available is 176 hr. In order to complete the work within the desired period the tractor should be capable of ploughing at least 0.68 ha/hr (calculated by dividing 120 ha by 176 hr).
Alternatively, if the lower probability of 50% is chosen for the same soil and area the tractor work rate would be calculated as:
Days available second half of August = 27/2 = 13.5 Days available first half of September = 24/2 = 12.0
25.5
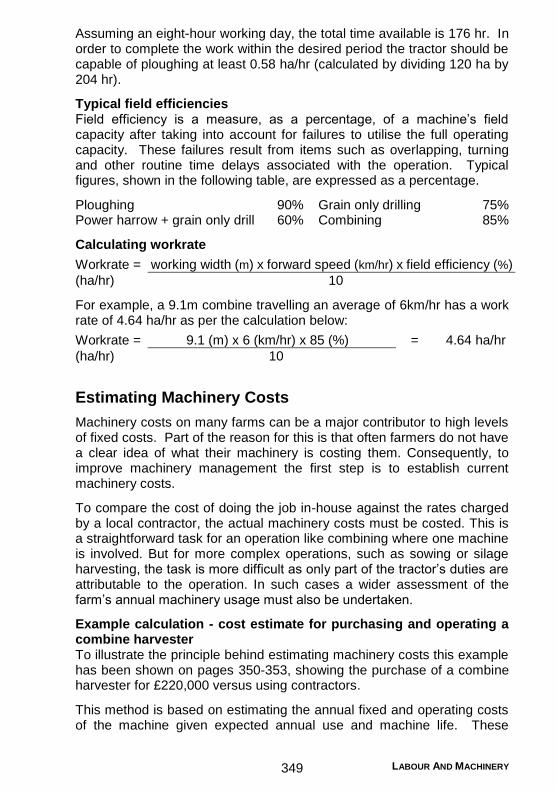
LABOUR AND MACHINERY 349
Assuming an eight-hour working day, the total time available is 176 hr. In order to complete the work within the desired period the tractor should be capable of ploughing at least 0.58 ha/hr (calculated by dividing 120 ha by 204 hr).
Typical field efficiencies Field efficiency is a measure, as a percentage, of a machine’s field capacity after taking into account for failures to utilise the full operating capacity. These failures result from items such as overlapping, turning and other routine time delays associated with the operation. Typical figures, shown in the following table, are expressed as a percentage. Ploughing 90% Grain only drilling 75% Power harrow + grain only drill 60% Combining 85%
Calculating workrate
Workrate = working width (m) x forward speed (km/hr) x field efficiency (%)
(ha/hr) 10
For example, a 9.1m combine travelling an average of 6km/hr has a work rate of 4.64 ha/hr as per the calculation below:
Workrate = 9.1 (m) x 6 (km/hr) x 85 (%) = 4.64 ha/hr
(ha/hr) 10
Estimating Machinery Costs
Machinery costs on many farms can be a major contributor to high levels of fixed costs. Part of the reason for this is that often farmers do not have a clear idea of what their machinery is costing them. Consequently, to improve machinery management the first step is to establish current machinery costs.
To compare the cost of doing the job in-house against the rates charged by a local contractor, the actual machinery costs must be costed. This is a straightforward task for an operation like combining where one machine is involved. But for more complex operations, such as sowing or silage harvesting, the task is more difficult as only part of the tractor’s duties are attributable to the operation. In such cases a wider assessment of the farm’s annual machinery usage must also be undertaken.
Example calculation - cost estimate for purchasing and operating a combine harvester To illustrate the principle behind estimating machinery costs this example has been shown on pages 350-353, showing the purchase of a combine harvester for £220,000 versus using contractors.
This method is based on estimating the annual fixed and operating costs of the machine given expected annual use and machine life. These

LABOUR AND MACHINERY 350
estimates can then be used in a partial budget for comparison with alternative policies such as the use of a contractor.
The following three tables provide the supporting information for the steps in the machinery calculation.
Table 1: Depreciation - average annual fall in value
Frequency
of renewal
(years)
1 34.0% 26.0% 19.0%
2 24.5% 19.5% 14.5%
3 20.0% 16.5% 12.5%
4 17.5% 14.5% 11.5%
5 15.0% 13.0% 10.5%
6 13.5% 12.0% 9.5%
7 12.0% 11.0% 9.0%
8 11.0% 10.0% 8.5%
9 10.0% 9.5% 8.0%
10 9.5% 8.5% 7.5%
Typical frequency of renewal with heavy use
Typical frequency of renewal average use
Typical frequency of renewal with light use
1
2
3
e.g. Potato Harvesters, Pea Viner
e.g. Tractors, Combines, Balers, Forage Harvesters
e.g. Ploughs, Trailers
Complex (high
depreciation
rate) 1
Established
(many moving
parts) 2
Simple (few
moving
parts) 3
Table 2: Fuel consumption Fuel is a significant cost for farming and rural businesses. Actual fuel consumption will vary depending on variables such as the power and size of machine used, depth of operation, correct calibration, appropriate maintenance of machinery, speed and care of operation. The table below gives an indication of the fuel cost of some farming operations based on red diesel costs of 58 p/l (Jun 2018).
Time taken
for operation
Diesel
usage
Diesel
cost(l/hour) (hours/ha) (l/ha) (£/ha)
Subsoiling 18.9 1.11 21.00 12.18
Ploughing (6 furrow) 26.8 1.11 29.75 17.26
Heavy Cultivation 26.8 0.71 19.13 11.09
Light Cultivation 8.6 0.47 4.02 2.33
Power harrow 26.8 1.00 26.78 15.53
Fertiliser spreading 8.6 0.18 1.57 0.91
Grain drilling 3m 18.9 0.53 9.95 5.77
Fuel
consumption

LABOUR AND MACHINERY 351
Time taken
for operation
Diesel
usage
Diesel
cost(l/hour) (hours/ha) (l/ha) (£/ha)
Rolling 7.3m light 8.6 0.33 2.88 1.67
Potato Planting 2 row 10.8 1.33 14.40 8.35
Mowing 3m 18.4 0.49 9.01 5.23
Baling straw, round bales 26.8 0.50 13.39 7.76
Forage harvesting 61.2 0.40 24.48 14.20
Spraying 24m 10.8 0.18 1.96 1.14
Towing (trailer) 16.2 0.40 6.48 3.76
Combine harvesting 7.7m 37.8 0.31 11.63 6.75
Potato harvesting 2 row 21.6 2.29 49.37 28.64
Fuel
consumption
Table 3: Estimated annual cost of spares and repairs (as a percentage of purchase price at various levels of use)
Approximate Annual Use (Hours)
500 750 1000 1500 + each
additional
100
Tractors 5.0% 6.7% 8.0% 10.5% 5.0%
Approximate Annual Use (Hours)
50 100 150 200 + each
additional
100
Harvesting machinery
Combine harvesters, balers,
potato harvesters
1.5% 2.5% 3.5% 4.5% 2.0%
Other implements
Ploughs, cultivators, toothed
harrows, hoes
4.5% 8.0% 11.0% 14.0% 6.0%
Rotary cultivators, mowers,
pea cutter windrowers
4.0% 7.0% 9.5% 12.0% 5.0%
Disc harrows, fertiliser
spreaders, FYM spreaders,
combine drills, potato planters
(with fertiliser), sprayers,
hedge cutters
3.0% 5.5% 7.5% 9.5% 4.0%
Swath turners, tedders, side
delivery rakes, unit drills,
forage harvesters, semi-
automatic potato planters
2.5% 4.5% 6.5% 8.5% 4.0%

LABOUR AND MACHINERY 352
Approximate Annual Use (Hours)
50 100 150 200 + each
additional
100
Corn drills, milking machines,
hydraulic loaders
2.0% 4.0% 5.5% 7.0% 3.0%
Grain driers, grain cleaners,
rolls, hammer mills
1.5% 2.0% 2.5% 3.0% 0.5%
Example calculation - Purchase of combine harvester versus using contractors
Cost element Value ref Factor Calculation
Area harvested (ha) 600 A - -
Work rate (ha/hr) 2.75 B - -
Annual hours worked (hr) 218 C - A / B
Machine life (yr) 6 D - -
Purchase price (£) 220,000 E - -
F'cast 5yr selling price (£) 26,400 F 12% E*depreciation%
(table 1)
Average value (£) 123,200 G - (E+F) / 2
Depreciation (£) 32,267 H - (E-F) / D
Interest (£) 6,160 I 5% G*interest rate (%)
Insurance (£) 1,848 J £15 G*£ per £1k
Annual fixed costs (£) 40,275 K - H+I+J
Fuel use (l/ha) 12 L - (table 2)
Fuel cost (£) 4,176 M £0.58 A*L*fuel price (£/l)
Spares and repairs (£) 9,900 N 4.5% E*% (table 3)
Labour (£) 2,727 O £12.50 labour (£/hr)*(A/B)
Annual operation costs (£) 16,803 P - M+N+O
Annual cost (£) 57,078 Q - K+P
Annual cost (£/ha) 95 R - Q / A
Contractor charge (£/ha) 96 (incl. fuel )
Based on these assumptions, owning a combine is cheaper (£95/ha) than average contractor’s charges (£96/ha) but other factors must be considered:
If the farmer increases the area harvested the overall cost of the combine increases to reflect higher fuel, repairs and depreciation costs. But this increase is spread over a much larger area and consequently reduces cost per ha.
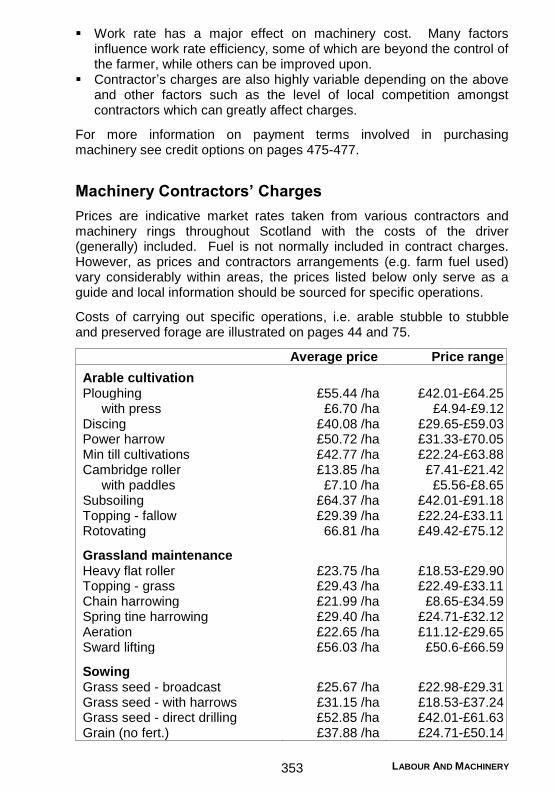
LABOUR AND MACHINERY 353
Work rate has a major effect on machinery cost. Many factors influence work rate efficiency, some of which are beyond the control of the farmer, while others can be improved upon.
Contractor’s charges are also highly variable depending on the above and other factors such as the level of local competition amongst contractors which can greatly affect charges.
For more information on payment terms involved in purchasing machinery see credit options on pages 475-477.
Machinery Contractors’ Charges
Prices are indicative market rates taken from various contractors and machinery rings throughout Scotland with the costs of the driver (generally) included. Fuel is not normally included in contract charges. However, as prices and contractors arrangements (e.g. farm fuel used) vary considerably within areas, the prices listed below only serve as a guide and local information should be sourced for specific operations.
Costs of carrying out specific operations, i.e. arable stubble to stubble and preserved forage are illustrated on pages 44 and 75.
Average price Price range
Arable cultivation Ploughing £55.44 /ha £42.01-£64.25
with press £6.70 /ha £4.94-£9.12 Discing £40.08 /ha £29.65-£59.03 Power harrow £50.72 /ha £31.33-£70.05 Min till cultivations £42.77 /ha £22.24-£63.88 Cambridge roller £13.85 /ha £7.41-£21.42
with paddles £7.10 /ha £5.56-£8.65 Subsoiling £64.37 /ha £42.01-£91.18 Topping - fallow £29.39 /ha £22.24-£33.11 Rotovating 66.81 /ha £49.42-£75.12
Grassland maintenance Heavy flat roller £23.75 /ha £18.53-£29.90 Topping - grass £29.43 /ha £22.49-£33.11 Chain harrowing £21.99 /ha £8.65-£34.59 Spring tine harrowing £29.40 /ha £24.71-£32.12 Aeration £22.65 /ha £11.12-£29.65 Sward lifting £56.03 /ha £50.6-£66.59
Sowing Grass seed - broadcast £25.67 /ha £22.98-£29.31 Grass seed - with harrows £31.15 /ha £18.53-£37.24 Grass seed - direct drilling £52.85 /ha £42.01-£61.63 Grain (no fert.) £37.88 /ha £24.71-£50.14

LABOUR AND MACHINERY 354
Average price Price range
Oilseed rape (no fert.) £52.42 /ha £18.53-£74.13 Turnips £64.25 /ha £44.48-£84.01 Beet £52.61 /ha £50.85-£54.36 One pass cultivation/drill (cereals, no fert.)
£54.43 /ha £42.01-£61.63
with fertiliser £5.35 /ha £3.71-£7.41 One pass cultivation/drill (OSR, no fert.)
£56.83 /ha £54.36-£59.30
with fertiliser £5.35 /ha £3.71-£7.41 Maize (without plastic) £61.64 /ha £46.55-£84.01 Maize (with plastic) £123.87 /ha -
Fertiliser spreading Spinner £10.16 /ha £7.41-£13.84
with variable rate £2.71 /ha £1.85-£3.71 Liquid fertiliser (surface) £14.07 /ha £12.36-£16.06 Irrigating (/25mm) £123.55 /ha -
Manure and lime Rotary - medium £36.91 /hr £30.00-£49.50 Rear discharge - medium £39.48 /hr £34.00-£47.00 Rear discharge - large £46.08 /hr £42.00-£51.20 Slurry - medium £33.15 /hr £30.00-£35.00 Slurry - large £39.63 /hr £34.75-£46.70 Lime £4.80 /t £3.50-£6.00
with gps £2.93 /t £2.00-£3.86 Umbilical - splash plate £75.00 /hr £70.00-£80.00 - injection £81.60 /hr £78.20-£85.00
with additional pumps £36.77 /hr £31.10-£40.05
Spraying Spraying £13.36 /ha £10.50-£17.99
with gps £2.47 /ha - Slug pellet application £7.71 /ha £6.18-£9.88
Combinable harvesting Cereals £88.88 /ha £74.13-£105.26
with yield mapping £4.94 /ha - with chopper £7.68 /ha £6.35-£9.88
Oilseed rape - direct £89.41 /ha £77.84-£104.10 Oilseed rape swathing £42.21 /ha £39.54-£44.48 Peas and beans £99.70 /ha £93.16-£106.25 Crimping/bruising grain/pulses £11.71 /t £8.60-£16.50 Straw chopping £34.59 /ha £27.18-£39.54
Forage Mower £23.05 /ha £18.53-£29.18 Mower and conditioner £29.74 /ha £21.00-£33.36

LABOUR AND MACHINERY 355
Average price Price range
Tedding/raking £15.87 /ha £9.88-£19.94 Precision chop - self-propelled £62.91 /ha £42.01-£80.31 Cutting, raking, chopping and carting £155.51 /ha £140.85-£164.32 Forage box £121.81 /hr £106.67-£161.56 Forage harvester (whole crop) £101.28 /ha £88.78-£111.20
with processor £12.36 /ha - Maize (including forager, 3 trailers and buckrake)
£167.50 /ha £160.00-£174.95
Baling and wrapping Silage/hay - 4x4 £2.42 /bale £1.90-£2.98
with processor £0.40 /bale £0.30-£0.50 Silage - 4x2.3 £3.55 /bale £3.50-£3.60 Hay - small square £0.57 /bale £0.43-£0.73 Straw - 4x4 £2.35 /bale £1.90-£2.98 Straw - 4x5 £3.32 /bale £3.05-£3.48 Straw - 8x4x2.3 £4.15 /bale £4.00-£4.30 Straw - 8x4x4 £7.15 /bale £6.50-£7.80 Straw - small square £0.57 /bale £0.43-£0.73 Wrapping - round £2.00 /bale £1.20-£2.60
incl. wrap (4 layers) £3.90/bale £3.20-£4.80 incl. wrap (6 layers) £5.14/bale £4.50-£5.49
Wrapping - square £2.65 /bale £2.40-£2.89 incl. wrap (4 layers) £5.34/bale £4.70-£5.66
Wrapping - tube-line, silage £2.23 /bale £1.75-£2.75 Wrapping - tube-line, straw £2.19 /bale £1.75-£2.55 Stacking £0.46 /bale £0.35-£0.52 Ag bagging £6.50 /t - Baling and wrapping incl. wrap (4 layers)
£6.67/bale £5.50-£7.80
Root and potato work Deep plough £63.60 /ha £53.13-£76.50 Deep ridge £62.19 /ha £37.07-£85.25 Bed tilling £137.14 /ha £84.01-£222.39 Destoning £236.86 /ha £177.91-£276.75 Bed forming £72.89 /ha £34.59-£111.20 Potato planting - without fertiliser £121.49 /ha £54.36-£222.39 Potato planting - with fertiliser £142.28 /ha £71.66-£234.75 Potato pulverising £55.19 /ha £39.54-£69.19 Potato harvesting - excl. pickers £460.02 /ha £358.30-£630.11 Turnip harvesting £40.00 /hr -
Tractor hire - including driver 4 WD up to 100 hp £27.08 /hr £20.00-£33.50 4 WD 101 - 150 hp £31.07 /hr £23.00-£37.29 4 WD 151 - 220 hp £34.90 /hr £25.00-£40.30

LABOUR AND MACHINERY 356
Average price Price range
4 WD 220 - 300 hp £43.10 /hr £27.00-£57.00 4 WD over 300 hp £59.30 /hr £30.00-£78.50 Tracked £53.00 /hr £50.00-£56.00
with loader £3.88 /hr - with trailer £6.00 /hr -
4 WD telehandler £31.41 /hr £25.00-£38.54 JCB type excavator £30.88 /hr £28.00-£33.50 Tracked excavator 15-25t £35.19 /hr £30.00-£40.00
with rock pecker £13.75 /hr £12.50-£15.00 Skidsteer £77.50 /day £60.00-£100.00 Tractor with post chapper (+ man) £35.42 /hr £28.00-£40.25
Labour Casual £10.10 /hr £8.50-£11.50 Experienced/skilled
1 (weekdays) £14.19 /hr £11.75-£17.50
Cereal/potato roguing £13.25 /hr £11.50-£15.00 Secretarial £13.50 /hr £10.00-£17.00
Livestock services
Sheep shearing - Blackface 2 £1.00 /hd £1.00-£1.10
- Crossbred ewe 2 £1.25 /hd £1.20-£1.40
- Tups 2 £2.50 /hd £2.40-£2.80
Rolling and packing wool £0.20 /hd -
Sheep dipping £0.93 /hd £0.25-£1.45
Sheep showers £0.98 /hd -
Crutching sheep £0.70 /hd -
Scanning - sheep 2 £0.70 /hd £0.65-£1.05
Scanning - cattle 2 £2.05 /hd -
Foot trimming - sheep £1.05 /hd -
Foot trimming - cows £11.00 /hd -
Foot trimming - bulls £24.50 /hd -
Haulage - sheep 3 £2.30 /hd £1.50-£35.00
Haulage - cattle 3 £20.00 /hd £5.00-£70.00
Automatic handler for sheep £100 /day or £20 /hr -
Miscellaneous
Strimming £17.75 /hr £17.50-£18.00
Hedge cutter £35.98 /hr £28.00-£42.50
Log splitter £33.00 /hr £31.00-£35.00
Snow plough £48.25 /hr £46.50-£50.00
Road brush £32.50 /hr £30.00-£35.00
Feed mixing/processing (mobile) £19.50 /t -
Haulage - forage (hay and straw) 2 £20.00 /t £10.00-£35.00
Haulage - concentrates 2 £20.00 /t £10.00-£40.00
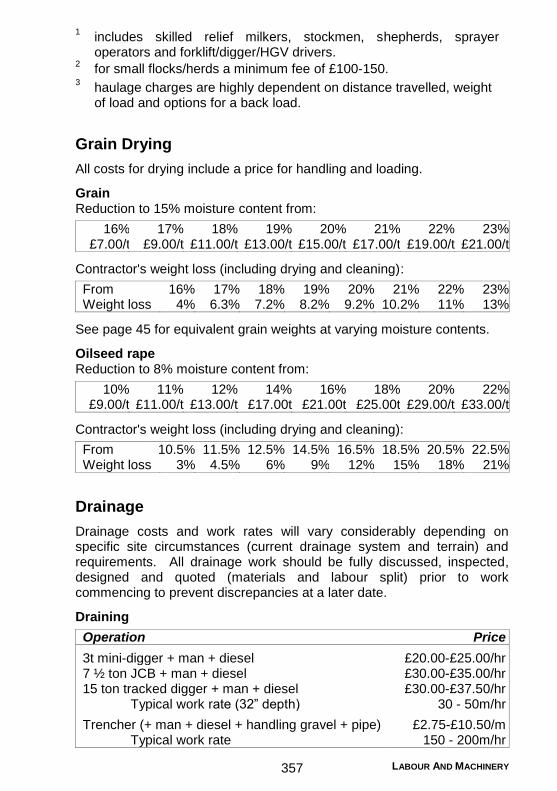
LABOUR AND MACHINERY 357
1
includes skilled relief milkers, stockmen, shepherds, sprayer operators and forklift/digger/HGV drivers.
2 for small flocks/herds a minimum fee of £100-150.
3
haulage charges are highly dependent on distance travelled, weight of load and options for a back load.
Grain Drying
All costs for drying include a price for handling and loading.
Grain Reduction to 15% moisture content from:
16% 17% 18% 19% 20% 21% 22% 23% £7.00/t £9.00/t £11.00/t £13.00/t £15.00/t £17.00/t £19.00/t £21.00/t
Contractor's weight loss (including drying and cleaning):
From 16% 17% 18% 19% 20% 21% 22% 23% Weight loss 4% 6.3% 7.2% 8.2% 9.2% 10.2% 11% 13%
See page 45 for equivalent grain weights at varying moisture contents.
Oilseed rape Reduction to 8% moisture content from:
10% 11% 12% 14% 16% 18% 20% 22% £9.00/t £11.00/t £13.00/t £17.00t £21.00t £25.00t £29.00/t £33.00/t
Contractor's weight loss (including drying and cleaning):
From 10.5% 11.5% 12.5% 14.5% 16.5% 18.5% 20.5% 22.5% Weight loss 3% 4.5% 6% 9% 12% 15% 18% 21%
Drainage
Drainage costs and work rates will vary considerably depending on specific site circumstances (current drainage system and terrain) and requirements. All drainage work should be fully discussed, inspected, designed and quoted (materials and labour split) prior to work commencing to prevent discrepancies at a later date.
Draining
Operation Price
3t mini-digger + man + diesel £20.00-£25.00/hr 7 ½ ton JCB + man + diesel £30.00-£35.00/hr 15 ton tracked digger + man + diesel £30.00-£37.50/hr
Typical work rate (32” depth) 30 - 50m/hr
Trencher (+ man + diesel + handling gravel + pipe) £2.75-£10.50/m Typical work rate 150 - 200m/hr
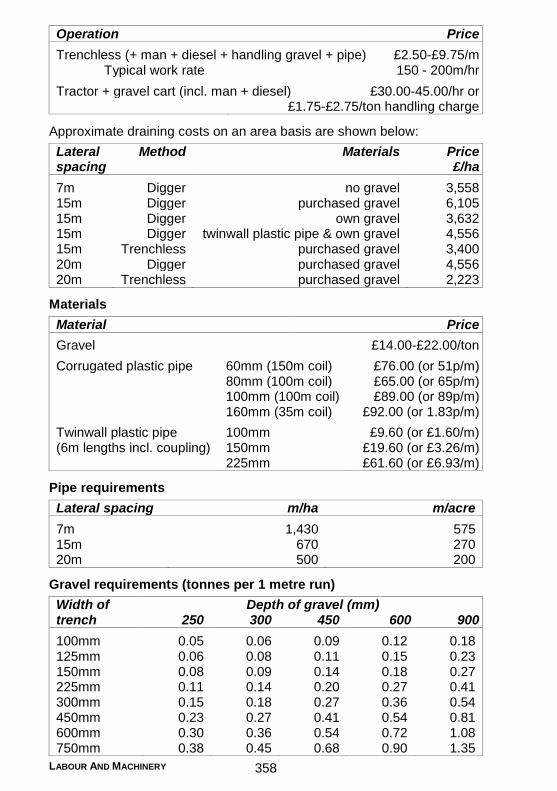
LABOUR AND MACHINERY 358
Operation Price
Trenchless (+ man + diesel + handling gravel + pipe) £2.50-£9.75/m Typical work rate 150 - 200m/hr
Tractor + gravel cart (incl. man + diesel) £30.00-45.00/hr or £1.75-£2.75/ton handling charge
Approximate draining costs on an area basis are shown below:
Lateral spacing
Method Materials Price £/ha
7m Digger no gravel 3,558 15m Digger purchased gravel 6,105 15m Digger own gravel 3,632 15m Digger twinwall plastic pipe & own gravel 4,556 15m Trenchless purchased gravel 3,400 20m Digger purchased gravel 4,556 20m Trenchless purchased gravel 2,223
Materials
Material Price
Gravel £14.00-£22.00/ton
Corrugated plastic pipe 60mm (150m coil) £76.00 (or 51p/m) 80mm (100m coil) £65.00 (or 65p/m) 100mm (100m coil) £89.00 (or 89p/m) 160mm (35m coil) £92.00 (or 1.83p/m)
Twinwall plastic pipe 100mm £9.60 (or £1.60/m) (6m lengths incl. coupling) 150mm £19.60 (or £3.26/m) 225mm £61.60 (or £6.93/m)
Pipe requirements
Lateral spacing m/ha m/acre
7m 1,430 575 15m 670 270 20m 500 200
Gravel requirements (tonnes per 1 metre run)
Width of trench
Depth of gravel (mm) 250 300 450 600 900
100mm 0.05 0.06 0.09 0.12 0.18 125mm 0.06 0.08 0.11 0.15 0.23 150mm 0.08 0.09 0.14 0.18 0.27 225mm 0.11 0.14 0.20 0.27 0.41 300mm 0.15 0.18 0.27 0.36 0.54 450mm 0.23 0.27 0.41 0.54 0.81 600mm 0.30 0.36 0.54 0.72 1.08 750mm 0.38 0.45 0.68 0.90 1.35

LABOUR AND MACHINERY 359
Secondary drainage treatments
Operation £/hr £/acre
Subsoiling (1-3 acres/hr) 65.00-115.00 22.00-39.00 Moling (1-3 acres/hr) 65.00-115.00 22.00-39.00 Flat lifter (1-3 acres/hr) 75.00-120.00 20.50-27.00 Aerator (5-7 acres/hr) 23.00-84.00 4.50-12.00
Drain jetting
Price
Drain jetter with tractor £35.00-£54.00/hr Drain jetter with tractor (incl. digger + tractor + bowser) £700-£800/day
Ditch cleaning
Price
Ditch cleaning (20-125m/hr) £1.75 - £2.25/m or £38.00-£48.00/hr
Fencing
The costs in the following table will vary considerably depending on fence purpose, fence length, site difficulty (such as access, ground conditions, presence of rock, and number of turns) and, type and quality of materials.
Net fences £/m
Mild steel netting, 2 mild steel plain wires, 1 mild steel barb wire assuming stobs every 2m, a strainer at either end, a turning post every 50m and 8 gripples every 200m
3.34
High tensile netting, 3 high tensile plain wires, 1 barb wire assuming stobs every 3m, a strainer at either end, a turning post every 50m and 8 gripples every 200m
3.03
High tensile steel netting, 2 high tensile plain wires, 1 high tensile barb wire assuming steepleless steel posts every 4.5m, a steepleless steel strainer with stay kit at either end, a steepleless steel turning post every 50m and 8 gripples every 200m
3.98
Plain wire fence £/m
8 hi tensile plain wire, 1 barb wire assuming stobs every 2m, a strainer at either end and a turning post every 50m
3.12
Scare fence £/m
2 barb wire assuming stobs every 5m, a strainer at either end and a turning post every 50m
1.74
Electric fences (energisers not included) £/m
Hi tensile netting, 4 hi tensile plain wires assuming stobs every 3m, a strainer at either end, a turning post every 50m and 8 gripples every 200m
3.26

LABOUR AND MACHINERY 360
Electric fences (energisers not included) £/m
8 hi tensile plain wires assuming stobs every 2m, a strainer at either end and a turning post every 50m
3.52
2 hi tensile plain wires, assuming stobs every 5m, a strainer at either end and a turning post every 50m
2.01
Deer fence £/m
Deer netting, rabbit netting, 3 mild steel plain wires assuming stobs every 3m, a strainer at either end and a turning post every 50m
5.37
Post and rail fence £/m
5 rails assuming stobs every 2m, a strainer at either end 9.97
Hedges £/m
Hedge laying 15.00
There are regional and contractor variances on fence types. It is important to ensure the materials are chosen with purpose in mind, e.g. net fencing for sheep can differ from that suitable for cattle so as to help prevent loss of sheep ear tags. All fencing work should be fully discussed, inspected and quoted (materials and labour split) prior to work commencing to prevent discrepancies at a later date.
Labour costs for fencing will vary between £10.00-16.50/hr. Chapping costs are £25.00-38.00/hr and for strainers, £15/post. Dismantling existing fencing, site preparation and fence disposal are added charges.
Dry Stone Walling
Excluding provision of material
£25-50 /m2
Stone £60-100 /t
Regional and contractual variations will apply in terms of the price of dry stone walling, in part depending on ease of access to site, availability of stone and nature and size of the wall. In general terms the price quoted for labour will be based on a metre square rate and will include the building of both sides of the wall, where a free-standing structure is required. Prices will vary for retaining walls. It is good practice to discuss and inspect the work with the dry stone waller beforehand, which will help identify whether additional stone is required. As a rough guideline, 1t of stone will be required for every linear metre of a free-standing wall approximately 1.3m high. Specialist stones, such as throughbands, quoins or copes may need to be sourced separately.
The Dry Stone Walling Association (www.dswa.org.uk) has a list of current professional members available on its website.

LABOUR AND MACHINERY 361
Agricultural Vehicles on the Road
Below are some key points that should be adhered to when agricultural vehicles are to go on the public road. Vehicles must be used for ‘agricultural purposes’ before it can be licenced as an agricultural vehicle.
Drivers licence – Usually a full car licence will include the ‘F’ category which is the tractor section. For some vehicles (combines etc) category ‘B’ will also be required. Vehicles fitted with tracks depending on the steering arrangement may require the ‘H’ category on the drivers licence. Farm ATV’s can be registered as light agricultural vehicles and driven on the road provided they have the full road legal kit.
Drivers ages – After passing the ‘tractor’ test a 16 year old can drive an agricultural vehicle on the road provided it is mounted on wheels, is no wider than 2.45m and is not pulling a trailer exceeding a single or double axle close coupled design which is also below 2.45 m wide. Once over 17 years old they can then operate most agricultural machines apart from tracked machines which is over 21 years of age. You must sit a separate test, category H, for tracked vehicles. Drivers aged 17-20 will be restricted to a Maximum Authorised Mass (MAM) of no more than 3,500kg. Anyone wishing to tow a trailer behind a car, van or 4x4 and has passed their driving test after the 1st January 1997 is required to sit a separate B + E trailer test.
Speed limits – The majority of agricultural tractors may travel at 25mph. Some tractors are built to higher specifications and are permitted to travel at up to 40mph. The higher speed limit applies to tractors that have (among other requirements) all-wheel suspension, braking efficiency of 50%, pneumatic tyres, a speedometer and a horn. The exact requirements are contained in the Construction and Use Regulations 1986 (as amended). Wider tractors (falling into the special type agricultural vehicle category) have lower speed limits as follows:
Vehicles 2.55m - 3.5m wide are limited to 20 mph. Vehicles 3.5m - 4.3m wide are limited to 12 mph.
For more information, see: https://www.gov.uk/government/publications/tractors-regulations-on-use/tractors-and-regulatory-requirements-a-brief-guide-september-2017
Trailer brakes – If a vehicle is travelling up to 25mph then hydraulic brakes are sufficient. Over 25mph then progressive brakes should be fitted along with ABS and a failsafe system.
Vehicle weights – Depending on axle spread the maximum authorised mass (MAM) should not exceed 31,000kg (tractor and implements attached). The trailer on its own again depending on axle load limits should not exceed 18,290kg. The additional axle load on the rear axle of the tractor imposed from the trailer should not exceed 3,000kg.

LABOUR AND MACHINERY 362
Vehicle widths – Up to 3m wide no notification is required. 3.0m - 3.5m, the police have to be notified, max speed 20mph. 3.5m - 4.3m, notification to police, attendant vehicle and lights fitted in reduced visibility, max speed 12mph. Over 4.3m, notification to secretary of state, attendant vehicle and lights fitted in reduced visibility. In all cases any projections must be marked and lights fitted when required.
Pick up hook rings – Ensure the gap between the top of the hook and the upper part of the hitch does not exceed 10mm gap when locked. The minimum thickness of the trailer ring should be no less than 30mm.
Tyre condition – Up to 20mph the tyres have to be in a safe condition and roadworthy. Over 20mph and there can be no cuts exceeding 25mm in length, have a minimum of 1mm tread depth and no obvious damage or wear and tear.
Lights – All lights when fitted must be visible, working and correctly positioned. Amber beacons are only required on unrestricted dual carriageways unless used as a warning for wide vehicle etc. No rear facing white lights are allowed.
Registration plates – Plates fitted to towing vehicles must match the vehicle and the registered keeper of the vehicle.
Fuel – Red diesel is permitted only if the vehicle is registered as an agricultural vehicle and being used for an agricultural related purpose.
MOT testing – Most agricultural vehicles will be MOT test exempt but must still meet the construction and use regulations when on the public road.
Labour Legislation and Policy
National hourly wage rates From 1 April 2016 the UK Government introduced the mandatory National Living Wage (NLW) as an upper tier to the National Minimum Wage (NMW). The following table shows the NLW and the NMW hourly rates for age categories.
NMW and NLW hourly rates (£/hr) Age 2018 2017 2016
a 2016
b
25 + 7.83* 7.50* 7.20*
7.20*
21-24 7.38 7.05 6.95 6.70 18-20 5.90 5.60 5.55 5.30 16-17 4.20 4.05 4.00 3.87 Apprentice 3.70 3.50 3.40 3.30
* NLW a
October 2016 to March 2017 b April 2016 to September 2016
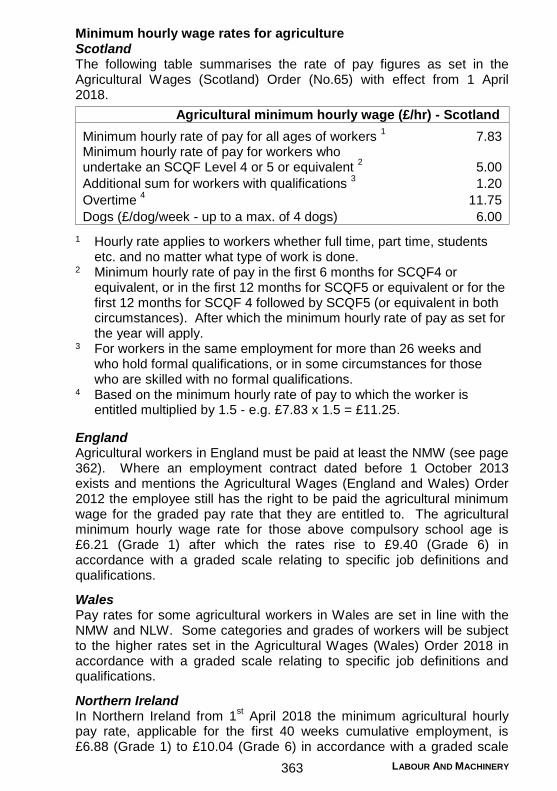
LABOUR AND MACHINERY 363
Minimum hourly wage rates for agriculture Scotland The following table summarises the rate of pay figures as set in the Agricultural Wages (Scotland) Order (No.65) with effect from 1 April 2018.
Agricultural minimum hourly wage (£/hr) - Scotland
Minimum hourly rate of pay for all ages of workers 1 7.83
Minimum hourly rate of pay for workers who undertake an SCQF Level 4 or 5 or equivalent
2 5.00
Additional sum for workers with qualifications 3 1.20
Overtime 4 11.75
Dogs (£/dog/week - up to a max. of 4 dogs) 6.00
1 Hourly rate applies to workers whether full time, part time, students etc. and no matter what type of work is done.
2 Minimum hourly rate of pay in the first 6 months for SCQF4 or equivalent, or in the first 12 months for SCQF5 or equivalent or for the first 12 months for SCQF 4 followed by SCQF5 (or equivalent in both circumstances). After which the minimum hourly rate of pay as set for the year will apply.
3 For workers in the same employment for more than 26 weeks and who hold formal qualifications, or in some circumstances for those who are skilled with no formal qualifications.
4 Based on the minimum hourly rate of pay to which the worker is entitled multiplied by 1.5 - e.g. £7.83 x 1.5 = £11.25.
England Agricultural workers in England must be paid at least the NMW (see page 362). Where an employment contract dated before 1 October 2013 exists and mentions the Agricultural Wages (England and Wales) Order 2012 the employee still has the right to be paid the agricultural minimum wage for the graded pay rate that they are entitled to. The agricultural minimum hourly wage rate for those above compulsory school age is £6.21 (Grade 1) after which the rates rise to £9.40 (Grade 6) in accordance with a graded scale relating to specific job definitions and qualifications.
Wales Pay rates for some agricultural workers in Wales are set in line with the NMW and NLW. Some categories and grades of workers will be subject to the higher rates set in the Agricultural Wages (Wales) Order 2018 in accordance with a graded scale relating to specific job definitions and qualifications.
Northern Ireland In Northern Ireland from 1
st April 2018 the minimum agricultural hourly
pay rate, applicable for the first 40 weeks cumulative employment, is £6.88 (Grade 1) to £10.04 (Grade 6) in accordance with a graded scale

LABOUR AND MACHINERY 364
relating to specific job definitions and qualifications. Where at any time the NMW and NLW becomes higher than the agricultural hourly rate set out above, then the minimum rate shall be equal to the NMW and the NLW.
Estimated annual labour costs The following example calculates the estimated annual labour costs to an employer based in Scotland. The earnings of the worker, based on the same assumptions, are also shown.
Assumptions:
Employee in employment for over 26 weeks 39 hr/wk, 5 days/wk, 52 wk/yr less 30 days holidays Minimum hourly rate - £7.83 10 hr/wk overtime Employers National Insurance Contributions (NIC) @ 13.8% Employers liability insurance @ 1% Overtime rate - £11.75 £11,850 personal allowance
Labour cost to employer Annual Weekly Hourly
Minimum wage for employee £15,879.24 £305.37 £7.83
Employers NIC £280.94 £5.40 £1.08
Employers liability insurance £114.00 £2.19 £0.08
£16,274.19 £312.97 £8.99
Overtime £5,452.00 £11.75
Employers NIC £752.38 £1.62
Employers liability insurance £54.52 £0.12
£6,258.90 £120.36 £13.49
Total labour cost incl. overtime £22,533.08 £433.33 £9.91
Employees earnings Annual Weekly Hourly
Workers earnings (gross) £21,331.24 £410.22 £9.38
Less tax £1,896.25 £36.47 £0.83
Workers earnings (after tax) £19,434.99 £373.75 £8.55
For more information on National Insurance Contributions and Income Tax, see pages 480-482 and 495).
Redundancy An employee having worked for an employer for 2 years or more will normally be entitled to Statutory Redundancy Pay. The following table lays out the basis of calculating a redundancy pay amount:
Employee Age No. weeks pay for each full year worked
under 22 years old 0.5 22-41 years old 1.0 over 41 years old 1.5

LABOUR AND MACHINERY 365
An upper limit on weekly pay is set at £508 per week for redundancy pays on or after 6 April 2018. The maximum statutory redundancy pay that can be received is £15,240. Different rates apply prior to 6 April 2018.
Length of service is capped at 20 years with service over this period having only the last 20 years of employment taken in to account. Only complete years are counted.
There is no upper age limit for an employee receiving redundancy pay.
For example, a 50 year old having worked for their employer for 25 years earning £650/week is made redundant on 7 April 2018. The employee would be entitled to 24.5 weeks pay (11 years @ 1.0 plus 9 years @ 1.5). This equates to a redundancy pay of £12,446.
Higher levels of redundancy pay can be agreed between employees and employers. Redundancy pay less than £30,000 is tax free.
Rates above do not apply in Northern Ireland.
Maternity/paternity Maternity leave arrangements will differ according to specific job arrangements. Statutory leave is 52 weeks with the first 26 weeks as ordinary leave and the last 26 weeks as additional leave. You do not have to take 52 weeks but must take 2 weeks following the birth of the baby. The earliest time to start leave is 11 weeks before the expected birth of the baby.
Maternity pay is paid up to 39 weeks with 90% of average weekly earnings (before tax) for the first 6 weeks and £145.18 or 90% of average weekly earnings (whichever is lower) for the next 33 weeks.
For paternity leave, the entitlement is, either, 1 or 2 weeks. This leave must be taken in one go, not odd days. Paternity pay is £145.18 or 90% of average weekly earnings (whichever is lower).
Labour arrangements When employing staff the following should be considered at the outset of employment:
Holidays and holiday pay. Sick pay. Maternity and paternity arrangements and pay. Pension provision. Provision of appropriate PPE (personal protective equipment). Dog allowance (where necessary). Other benefits, e.g. accommodation, vehicles, bonuses, subsistence. Dismissal. Redundancy.

LABOUR AND MACHINERY 366
The options for labour on farm include casual/irregular workers, self employed contractors (with or without machinery) or hiring permanent staff/employees.
Self employed contractors are generally hired to carry out a specific task, i.e. harvest work, shearing, fencing, rather than being available at all times to carry out general farm work. Contracting rates are summarised on pages 353-356. Self employed contractors will invoice for work done and it is their responsibility to pay all income tax and national insurance contributions unless other arrangements are made. It will be important to consider farm insurance implications of hiring in contractors.
More formal arrangements with contractors exist that would see all or most of the physical farm labour being carried out by the contractor. In this case the contractor would also, in most circumstances, provide machinery and additional labour requirement. The farmer/land owner would provide the land, capital and fixed infrastructure. These arrangements include contract farming and share farming. The agreements can be devised to suit each circumstance specifically but the main theme is that the farmer/landowner retains an active interest in the business both from a management point of view and financially. For more details, see pages 408-411.
Other labour opportunities would involve hiring employees on a full-time or part-time basis and the following aspects should be considered as part of the decision making process:
Job requirements. Qualifications required/training provision. Provision of a house and vehicle. Payment terms (see minimum hourly wage rates on page 362-364). Employment contracts. Performance related employment incentives. Legality of a person being hired. Employment insurance. Health and safety. Registration with HM Revenue and Customs (HMRC).
Sources of information Full and specific details of agricultural wage arrangements and conditions across the UK can be found at the following websites:
UK: https://www.gov.uk/national-minimum-wage-rates Scottish Government:
http://www.gov.scot/Topics/farmingrural/Rural/business/18107 England: https://www.gov.uk/agricultural-workers-rights Wales: http://www.legislation.gov.uk/wsi/2018/433/ Northern Ireland: https://www.daera-ni.gov.uk/articles/agricultural-
wages-board-northern-ireland-awb

LABOUR AND MACHINERY 367
Further information on labour suppliers, training, pensions, redundancy and other statutory obligations can be found at the following websites:
Gangmasters Licensing Authority (GLA): http://www.gla.gov.uk/ LANTRA: http://www.lantra.co.uk/ Department for Work and Pensions (DWP): www.dwp.gov.uk HM Revenue and Customs:
https://www.gov.uk/government/organisations/department-for-work-pensions
Health and Safety
Health and safety should be regarded as an essential part of farm business management. Along with the construction industry, agriculture has the worst safety record of any sector. The Health and Safety Executive (HSE) is responsible for ensuring compliance with legislation and also provides a source of advice and guidance for businesses (see www.hse.gov.uk).
The Health and Safety at Work Act 1974 and the Management of Health and Safety at Work Regulations (MHSW) 2003 place duties on businesses and individuals to ensure that adequate provision is made for health and safety at work. Employers must ensure, so far as is reasonably practicable, the health, safety and welfare of employees and any others who may be affected by what they do.
Every business should have a health and safety policy. The policy should identify the aims for the employees’ health and safety and outline the various responsibilities, systems and communication to ensure that health and safety objectives are fully met. This should be in writing if five or more people are employed. Guidance on this is available from the HSE (www.hse.gov.uk/pubns/indg275.pdf).
The MHSW Regulations place duties on employers and the self-employed to make a suitable and sufficient assessment of the risk to their own health and safety and that of others from the work they do. This includes employees, any casual workers, part-timers, trainees, customers or contractors. It will also include those who may be affected by work activities, e.g. neighbours, sales people and members of the public. The assessment can be conducted by the business itself, or can be contracted out to a specialist. The people carrying out the risk assessments must be competent, it is not essential to hold a qualification in health and safety. The HSE provide useful guidance on conducting a risk assessment – 5 Steps to Risk Assessment (www.hse.gov.uk/pubns/indg163.pdf). The 5 steps are:
1. Identify the Hazards. 2. Decide who might be harmed and how. 3. Evaluate the risks and decide on precautions. 4. Record your findings and implement them.

LABOUR AND MACHINERY 368
5. Review the risk assessment and update if necessary.
Health and safety within the business - there must be a clear chain of command on who is responsible for each area of work and equipment. The final responsibility generally lies with the business owner.
It is good practice to produce a written risk assessment and it is a statutory requirement if five or more people are employed by the business. The risk assessments must be communicated to staff and all relevant people.
A further assessment should be made for Control of Substances Hazardous to Health (COSHH). This is similar to a risk assessment but considers the risks from substances such as dust, gases, fumes, pesticides and zoonoses.
If an accident or near miss occurs it should be reported to the HSE in accordance with the Reporting of Injuries Diseases & Dangerous Occurrences Regs (RIDDOR).
When carrying out risk assessments for an agricultural related business be aware that one of the biggest causes of death in agriculture is falls from height. Given that most workers spend probably less than 1% of their time working at height this represents the most dangerous part of the year. Every business should examine what tasks are being carried out at height and try to eliminate these or find safer methods.
Many deaths and injuries are caused by transport and machinery. One of the most important pieces of relevant legislation is the Provision and Use of Work Equipment Regulations 1998 (PUWER) which states that:
All equipment must be fit for purpose. All equipment must be properly maintained. All equipment must be properly commissioned. Equipment must be inspected after difficult conditions. Operators and maintenance mechanic must be sufficiently trained. Guards over all dangerous parts. Safety features all working. Lighting sufficient to operate machinery.
All staff have a legal obligation to co-operate with their employers and follow safe procedures.
Particular care should be taken to ensure the safety of children on farms, and the minimum ages for operating or travelling in certain vehicles and machines must be observed.
There are many other pieces of relevant legislation relating to health and safety at work that agricultural businesses should comply with. In some instances training and certification is required.

LABOUR AND MACHINERY 369
A useful source of information for farmers is the HSE publication “Farmwise” (http://www.hse.gov.uk/pubns/books/hsg270.htm) which provides practical advice and guidance on health and safety.
For specific health and safety on farm advice, contact SAC Consulting on 01334 654 055. The NFU and independent safety consultants can also assist.


Land and Buildings
LAND AND BUILDINGS 372
Introduction
This section gives detail on the main legislative, technical and finances related to land and buildings.
Land tenure remains a topical subject as the Land Reform Act (2016) is implemented and the detail that follows gives brief descriptions. Specialist legal advice should be sought for specific tenure related circumstances.
Building spaces guidance and costs are laid out to allow users to budget space requirements and capital requirements for existing and new buildings.
Property operating costs for different types of farms can be found in the Whole Farm Data section on page 415.
Land Tenure
There are four types of agricultural tenancy currently available for use in Scotland, although this will change with the implementation of the Land Reform (Scotland) Act 2016.
To establish what law applies to any agricultural tenancy, it is necessary to determine which type of tenancy is involved. There are currently three core pieces of legislation which govern agricultural tenancies in Scotland. These are:
Agricultural Holdings (Scotland) Act 1991: ‘1991 Act’ tenancies (secure heritable tenancies)
Agricultural Holdings (Scotland) Act 2003: Grazing or mowing leases, Short Limited Duration Tenancies (SLDT) and Limited Duration Tenancies (LDT)
Land Reform (Scotland) Act 2016: Modern Limited Duration Tenancies (MLDT) and Repairing Tenancies (this provision has not yet come into effect)
Agricultural Holdings (Scotland) Act 1991 All tenancies entered into prior to 27th November 2003 are 1991 Act Tenancies.
Tenancies granted under this act give security of tenure to the tenant for unlimited successive generations (i.e. a secure tenancy). The act sets out how rents should be calculated; how improvements should be compensated; how fixed equipment should be maintained and how disputes should be settled.
In order to circumvent the security of tenure granted by a full 1991 Act Tenancy, “Limited Partnerships” were developed.

LAND AND BUILDINGS 373
A Limited Partnership is a 1991 Act Tenancy and all the legislation that governs this type of tenancy applies, however the tenancy is granted to a partnership comprising the landowner or ‘Limited Partner’, and farmer ‘General Partner’. If the landowner dissolves the partnership then the tenant technically no longer exists and by this means the tenancy is ended. These partnerships were normally agreed to last for a defined period (often 15-20 years) and thereafter on a year to year basis (tacit relocation). Once the initial term has run its course the tenancy can be ended by the landowner withdrawing from the partnership. This can be done by serving notice on the General Partner.
Agricultural Holdings (Scotland) Act 2003 The 2003 Act came into force on 27 November 2003.
Grazing or mowing tenancies (grass lets) These are agricultural tenancies where the land is let for grazing or mowing only and for a specific period of the year not exceeding 364 days.
When a Grazing or Mowing Tenancy has ended, the land may only be let again for the same purpose to the same tenant provided one clear day has elapsed between tenancies.
If, with the landowner’s agreement (actual or assumed), the tenant continues to occupy the land after the tenancy period has ended, the tenancy is automatically converted to a Short Limited Duration Tenancy (SLDT).
Short Limited Duration Tenancies (SLDT) These are agricultural tenancies where the letting is for not more than 5 years. There are no statutory rent provisions for a SLDT. SLDT’s cannot be assigned to 3
rd parties, but relatives can succeed to the tenancy.
Statutory rules on fixed equipment and compensation for improvements at the end of tenancy apply. If the tenant continues in occupation at the end of a 5-year SLDT then a Modern Limited Duration Tenancy (MLDT) is automatically created. Where this happened before 30 November 2017 an LDT was created.
Limited Duration Tenancies (LDT) These are agricultural tenancies where the letting is for a minimum term of 10 years - with no upper limit (the older LDT’s were for a minimum of 15 years).
To end a LDT a Notice to Quit needs to be served by the landlord (this is a 2-staged process over three years). If the LDT is not terminated by notice at the expiry of the lease, there is instead a cycle of continuations. The tenant may terminate an LDT at the expiry of the contractual term or the expiry of a continuation by written notice given not less than one year and not more than two years notice.
The rules regarding repairs, improvements and rent reviews for LDT’s are similar to those for 1991 Act Tenancies. LDT’s can be assigned to a third

LAND AND BUILDINGS 374
party, subject to landlords consent (landlords can only object on the grounds of the ability, finance or character of the assignee). Landlords can also pre-empt an assignation by matching the highest offer. A LDT also gives the tenant the ability to use land for a non-agricultural purpose (diversification). Since 30 November 2017 a new ‘Modern Limited Duration Tenancy’ has replaced the LDT (for new agreements – see overleaf).
Changes to Agricultural Holdings (Scotland) Act 1991 The 2003 Act made the following changes to the 1991 Act:
Fixed Equipment – Post Lease Agreements (PLA) can be removed by the tenant giving notice to the landlord following a rent review; writing-down agreements for tenants improvements are no longer valid (there is some debate to whether improvements fully written-down before 2003 are included in this); record of condition no longer required to be completed by a Recorder appointed by Government.
Rent – Various instructions on how to set rents were included, for which recent court cases have provided legal interpretation.
Diversification – now allowed on agricultural holdings. The landlord has the right to object. The tenant is able to appeal to the Land Court
Compensation for Vacant Possession - compensation may be payable to a tenant where a tenant voluntarily gives up possession of a holding.
Assignation – details in following sections. Miscellaneous – leases can no longer be terminated on grounds of
non-residency; Consent from the Land Court is required on a Notice to Quit in most circumstances; the definition of good husbandry now extended to include conservation activities and diversification, as permitted under the 2003 Act.
Tenants Right to Buy – provides a pre-emptive right of a tenant (under a 1991 act tenancy) to buy land tenanted by him if the landlord intends to sell i.e. the tenant has the right of first refusal, provided the tenant has registered his interest. Registration is required with the Register of Community Interests and needs to be renewed every 5 years.
Land Reform (Scotland) Act 2016 The Land Reform (Scotland) Act 2016 received Royal Assent on 22
nd
April 2016. Much of the detail is being dealt with through “Secondary Regulation”, which will take place over the next couple of years.
Modern LDT A new tenancy has been created known as a Modern Limited Duration Tenancy (MLDT). The tenancy is for a minimum of 10 years and has many of the same features as an LDT. For new entrants (regulations have been made to define a “New Entrant”) there is a clause where the tenancy may be broken after 5 years.
LAND AND BUILDINGS 375
Assignation A tenant has the right to assign the interest in the tenancy to any one of the persons mentioned in a new subsection of the 1991 Act: any person who would, or would in any circumstances have been, entitled to succeed to the tenant’s estate on intestacy by virtue of the Succession (Scotland) Act 1964. The landlord’s right to withhold consent, if there are reasonable grounds for doing so, continues to remain in force, unless the person to whom the assignation is being made is a near relative. The following list shows who qualifies as a near relative:
A parent of the tenant. A spouse or civil partner of the tenant. A child of the tenant. A grandchild of the tenant. A brother or sister of the tenant. A spouse or civil partner of such a brother or sister. A child of a brother or sister of the tenant. A grandchild of a brother or sister of the tenant. A brother or sister of the tenant’s spouse or civil partner. A spouse or civil partner of such a brother or sister. A child of such a brother or sister. A grandchild of such a brother or sister.
Where the assignee to a tenancy is a near relative the grounds upon which the landlord can object are restricted to the following:
That the person is not of good character. That the person does not have sufficient resources to enable the
person to farm the holding with reasonable efficiency. That the person has neither sufficient training in agriculture nor
sufficient experience in the farming of land to enable the person to farm the holding with reasonable efficiency.
The provisions in relation to limited duration tenancies (LDT’s) and Modern Limited Duration Tenancies (MLDT’s) have been amended so that where the assignee is a near relative the grounds for objection are restricted to those mentioned above.
Succession The succession provisions in relation to 1991 Act tenancies, repairing leases, LDT’s and MLDT’s are also made uniform.
The existing time limits to notify the landlord that a tenancy has been inherited remain in place. Where the lease permits a bequest of the tenant’s interest, the tenancy must be accepted within 21 days of the death. In the case of intestate transfers, the deceased tenant’s executors must transfer the tenancy to a suitable beneficiary within a year of the death. The beneficiary then has 21 days to notify the landlord that the acquisition has taken place. Where the successor, whether by bequest or on intestacy, is a near relative, the landlord has one month to object to the succession. However, the grounds of objection are limited to these to
LAND AND BUILDINGS 376
those listed in the previous section (character, resources and experience).
The 2016 Act abolishes the viable unit test in relation to the unit that is being inherited and it also removes the specific challenge that the successor is already in occupation of an independent viable unit elsewhere.
Landlord’s Improvements Tenants now have the right to object to improvements proposed by their landlord. The landlord has the right of appeal to the Land Court.
Diversification There are new rules regarding the ability of a landlord to object to a tenant’s diversification notice.
Amnesty for tenant’s improvements The tenant’s improvements amnesty came into effect on 13 June 2017. This provides a 3 year window for tenants with 1991 Act Tenancies, SLDTs, LDTs and MLDTs. The tenant will be required to serve an “amnesty notice” on the landlord detailing improvements carried out by the tenant, prior to the legislation coming into force. The landlord will have certain grounds to object. Correctly registered improvements should be taken into account for way-go compensation. The amnesty could also prove important in determining the “Productive Capacity” of the farm for rent negotiations under the proposed new rent test.
The rules allow landlords and tenants to enter into amnesty agreements without following the procedures set out in the Act. The Scottish Land Commission has issued a code of practice to guide landlords and tenants through this process, please see: http://landcommission.gov.scot/tenant-farming/codes-of-practice/
Irritancy for non-payment of rent Irritancy Notices (a notice to quit) cannot be served for non-payment of rent on SLDT, LDT, MLDT & Repairing Tenancies unless a demand for payment within 2 months has been issued in writing by the landlord. This is not the case for 1991 Act Tenancies. For 1991 Act Tenancies, if rent is not paid, an Incontestable Notice to Quit can be served by the landowner (no rent demand is required).
Land Reform (Scotland) Act 2016 reforms that have not commenced (at the time of writing)
Repairing Tenancies A Repairing Tenancy has a minimum term of 35 years. The lease requires the tenant during the “repairing period” to improve the land into a state capable of being farmed. The repairing period will last 5 years, or longer if agreement between landlord and tenant or it can be extended by the Land Court.

LAND AND BUILDINGS 377
Tenants’ rights to buy The requirement for a 1991 Act Tenant to register a right to buy has been removed. Tenants will now have a pre-emptive right to buy if a landlord “proposes to transfer the land or any part of it to another person”. Until this section becomes live, the requirement for tenants to register their right with the Registers of Scotland continues. For more information see: https://www.ros.gov.uk/
Sale where landlord in breach This provision allows a tenant to apply to the Land Court for an “Order of Sale” if a landlord fails to comply with an order or award of the Land Court, regarding a material breach of the landlord’s obligations in relation to the tenant. The “order of sale” gives the tenant the right to buy the land comprised in the lease through the tenant’s pre-emptive right.
Rent review (1991 Act Tenancies) The rent is to be a “fair rent”, which is to be a move away from the “open market” rent which has operated over recent years. The “fair rent” is to take account of the productive capacity of the holding; the open market rent of any surplus residential accommodation provided by the landlord; and the open market rent of any fixed equipment provided by the landlord or any land forming part of the holding not used for agriculture.
In the absence of agreement on rents, either party may apply to the Land Court to determine the rent.
The Scottish Government has appointed a group to carry out rent modelling. The favoured model will then undergo “road-testing” prior to being implemented. In the interim period, the industry has agreed to hold rents to inflationary rises only, this is been overseen by the Tenant Farming Commissioner. This is a voluntary agreement, supported by the industry stakeholders. Rent review (LDT’s, Modern LDT’s and Repairing Tenancies) The rent is to be set under the same guidance as the 1991 Act Tenancies. If there is no rent review provision in the lease, or the lease stipulates upward or landlord only initiated rent reviews, the statutory alternative applies.
Relinquishing and assignation of 1991 Act Tenancies This part of the Act allows a tenant to assign their tenancy for value to a person “who is progressing in farming” or a “new entrant”. The landlord has a right of pre-emption. If a tenant wants to go down this route, they must offer to relinquish the tenancy to the land owner in the first instance (it is independently valued). If the landlord does not accept the tenants notice to relinquish, the tenant may then assign the tenancy.

LAND AND BUILDINGS 378
Tenanted agricultural land rental figures (Scotland) The following tables show median rental values for agricultural land by farm type, by region and by tenancy agreement in Scotland for 2015-2017.
Rents for sub regions of Scotland (all agreements excluding crofts and seasonal lets):
2015 2016 2017 £/ha £/ac £/ha £/ac £/ha £/ac
North West 40 16 40 16 38 15 North East 99 40 99 40 98 40 South East 130 53 130 53 118 48 South West 72 29 72 29 71 29
Rents for farm type (all agreements excluding crofts and seasonal lets):
2015 2016 2017 £/ha £/ac £/ha £/ac £/ha £/ac
Cereals 133 54 133 54 133 54 General Cropping 146 59 146 59 136 55 Dairy 127 51 127 51 124 53 C&S Lowland 123 50 123 50 131 53 C&S LFA 44 19 44 19 49 20 Mixed 113 46 113 46 114 46 Pigs & Poultry 148 60 148 60 149 60
Rents for tenancy agreement types:
2015 2016 2017 £/ha £/ac £/ha £/ac £/ha £/ac
Crofts/Small L’holdings 3 1 3 1 3 1 1991 Act LFA 50 20 53 21 52 21
nLFA 129 50 135 55 130 53 P’ship 80 35 94 38 79 32
SLDT 114 46 112 45 115 47 LDT 94 38 94 38 93 38 Seasonal LFA 120 49 129 52 117 47 Seasonal nLFA 138 56 166 67 167 68
It must be noted that there will be a wide variation in rental values within each category illustrated above. Variables will include topology of the land, remoteness, length of tenancy, age of tenancy, facilities (e.g. houses, farm-buildings and equipment) included, and the amount of land rented. More detail can be sourced from the “Tenanted Agricultural Land in Scotland” publications produced by RESAS and the December Agricultural Survey.

LAND AND BUILDINGS 379
Charges for Short-Term Lets and Services
Short-term let charges for arable crops, grass and buildings across Scotland vary greatly from year to year and area to area. The price will also be dependent on local practice, quality of facilities, season, market and land being offered.
Typically, for short-term lets of grassland, the period of let would be from 1 May until 31 October.
The prices shown below should be used only as a general guide and local advice should be taken for specific circumstances.
Range Average
£/ha (£/ac)
Grass park lets: rotational grass 75 - 740 (30 - 306) 262 (116)
permanent pasture 50 - 494 (20 - 283) 176 (65)
Rough grazing 25 - 123 (5 - 50) 54 (23)
Barley land let (unploughed) 100 - 494 (40 - 200) 203 (82)
Potato land let (seed and ware) 500 - 1,500 (202 - 607) 826 (335)
Vegetables - human consumption 1 220 - 1,750 (120 - 708) 893 (370)
£/head/week
Sheep winter grazing 0.30 - 0.90 0.49
Sheep grazing forage crops 0.35 - 0.70 0.50
£/head/week
Cattle grazing - improved pasture 2 2.60 - 7.00 4.45
Cattle grazing - rough grazing 2 1.00 - 5.00 3.10
Letting courts 2, 3 5.00 - 16.00 9.34
Letting courts only 2 0.50 - 3.00 1.55
£/t/week
Grain storage 4 0.15 - 0.25 0.20
£/tonne/month
Potato storage (ambient air) 4, 5 1.00 - 2.00 1.33
Potato storage (refrigerated) 4, 5 4.00 - 6.40 5.24
1 Including vining peas and beans, salads, brassicas, carrots/parsnips.
2
Price range covers the type of stock grazed/housed, e.g. store calves, dry cows, cows with calves at foot.
3
Inclusive of bedding, silage and labour. Concentrates and vet/med additional.
4 Handling charges may be charged above base price.
5 In addition, £1.00 - 1.50/t box/month where potato boxes provided.
Basis of data: limited survey

LAND AND BUILDINGS 380
Space Requirements for Livestock and Storage
The following space requirements are included here as a guide (minimum area required) only. For livestock, appropriate welfare codes and quality assurance regulations should be referred to in all cases.
Cattle space requirements
Total floor area (m2/hd) Liveweight (kg) 200 300 400 500 600 700 800
Beef cattle - solid floors 3.00 3.95 4.90 5.85 6.80 7.75 8.70 Beef cattle - slatted courts 1.10 1.50 1.80 2.10 2.30 2.50 - Cow and calf - straw * - - - 5.00 6.00 6.50 7.30 Cow and calf - slats * - - - 2.50 2.75 3.00 3.25 Dairy cows - solid floors 3.00 3.95 4.90 5.85 6.80 7.75 8.70
* excluding creep area
Total floor area (m2/hd) Liveweight (kg) 60 85 140 200 250 400
Calves - loose housed 1.10 1.80 2.40 3.00 - -
Cubicle/pen dimensions (m) Calve pens Cow cubicles Liveweight (kg) < 60 60-80 400 500 600 700 800
Long 1.50 1.80 2.05 2.35 2.40 2.50 2.55 Wide 0.75 1.00 1.05 1.12 1.15 1.18 1.20
Trough/access length requirements (mm/hd) Liveweight (kg) 100 200 300 400 500 600 700 800
Simultaneous feeding 350 400 500 550 600 670 700 870 Ad-lib feeding 150 150 150 190 240 280 320 340
Sheep space requirements
Total floor area (m2/hd) Hoggs Pregnant ewes Ewes w/ lambs
Sheep - bedded courts 0.75 - 0.90 1.00 - 1.40 1.80 - 2.20 Sheep - slatted courts 0.40 - 0.60 0.80 - 1.10 1.00 - 1.70
Trough/access length requirements (mm/hd) Hoggs (45-65kg) Ewes (60-90kg)
Simultaneous feeding 300 450 - 500 Ad-lib feeding 100 - 125 120 - 225
Pig space requirements
Total floor area (m2/hd) Liveweight (kg) <10 10-20 20-30 30-50 50-85 85-110 >110
Group loose housed 0.15 0.20 0.30 0.40 0.55 0.65 1.00

LAND AND BUILDINGS 381
Trough/access length requirements (mm/hd) Liveweight (kg) 5 10 15 35 60 90 120
Restricted feeding 100 130 150 200 230 280 300
Poultry space requirements
Laying Hens
Enriched Cages Stocking density
750 cm2
(approximately 13 birds/m2)
Nest/perch length 150 mm/bird Feed trough length 120 mm/bird
Barn or free range Stocking density
9 birds/m2
Minimum litter area 0.025 m2/bird Nest/perch length 150 mm/bird Feed trough length 100 mm/bird
Nest space (only)
120 birds/m2
Free range Range area <2500 birds/ha
Broiler Chickens
Conventional Stocking density <33 kg/m2
Possible with permission >33 - <39 kg/m2
Free range Stocking density 27.5 kg/m2 Range area 1 m2/bird
Organic fixed housing Stocking density 21 kg/m2 Range area 4 m2/bird
Organic mobile housing Stocking density 30 kg/m2 Range area 2.5 m2/bird
Storage space requirements for crops, feeds and manures
Product Space requirement
Wheat - whole grain 1.35 m3 / t
Barley - whole grain 1.45 m3 / t
Oats - whole grain 1.95 m3 / t
Oilseed rape 1.45 m3 / t
Beans and peas (combined) 1.16-1.19 m3 / t
Distillers dark grains 1.82 m3 / t
Draff (highly variable) 0.95-1.25 m3 / t
Potatoes - bulk 1.42-1.59 m3 / t
Potatoes - boxes 2.00-2.30 m3 / t
Turnips/swedes 1.80 m3 / t
Farm yard manure 1.1 m3 / t
Weight and dimensions of hay, straw and silage bales The weight of baled forages can vary a lot depending on the material being baled, type of baler and packing density, so weighing a selection of
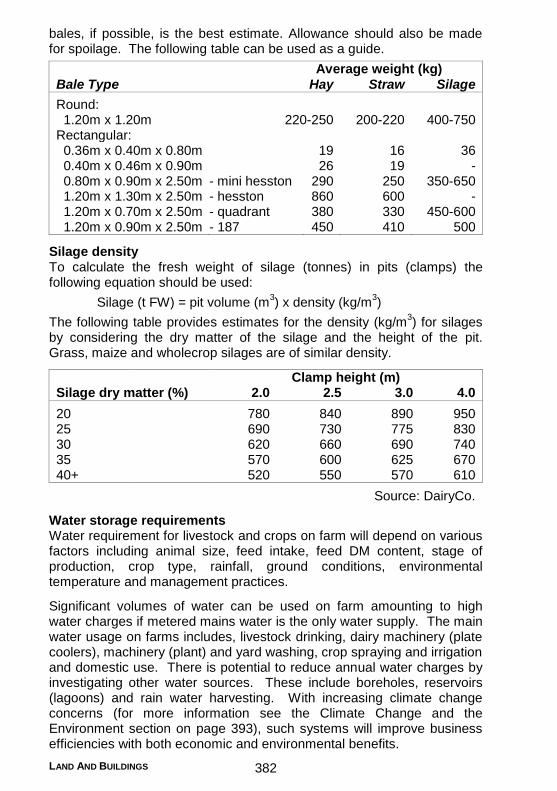
LAND AND BUILDINGS 382
bales, if possible, is the best estimate. Allowance should also be made for spoilage. The following table can be used as a guide.
Average weight (kg) Bale Type Hay Straw Silage
Round: 1.20m x 1.20m 220-250 200-220 400-750 Rectangular: 0.36m x 0.40m x 0.80m 19 16 36 0.40m x 0.46m x 0.90m 26 19 - 0.80m x 0.90m x 2.50m - mini hesston 290 250 350-650 1.20m x 1.30m x 2.50m - hesston 860 600 - 1.20m x 0.70m x 2.50m - quadrant 380 330 450-600 1.20m x 0.90m x 2.50m - 187 450 410 500
Silage density To calculate the fresh weight of silage (tonnes) in pits (clamps) the following equation should be used:
Silage (t FW) = pit volume (m3) x density (kg/m
3)
The following table provides estimates for the density (kg/m3) for silages
by considering the dry matter of the silage and the height of the pit. Grass, maize and wholecrop silages are of similar density.
Clamp height (m) Silage dry matter (%) 2.0 2.5 3.0 4.0
20 780 840 890 950 25 690 730 775 830 30 620 660 690 740 35 570 600 625 670 40+ 520 550 570 610
Source: DairyCo.
Water storage requirements Water requirement for livestock and crops on farm will depend on various factors including animal size, feed intake, feed DM content, stage of production, crop type, rainfall, ground conditions, environmental temperature and management practices.
Significant volumes of water can be used on farm amounting to high water charges if metered mains water is the only water supply. The main water usage on farms includes, livestock drinking, dairy machinery (plate coolers), machinery (plant) and yard washing, crop spraying and irrigation and domestic use. There is potential to reduce annual water charges by investigating other water sources. These include boreholes, reservoirs (lagoons) and rain water harvesting. With increasing climate change concerns (for more information see the Climate Change and the Environment section on page 393), such systems will improve business efficiencies with both economic and environmental benefits.

LAND AND BUILDINGS 383
There are pros and cons to alternative water sources and planning and preparation is important when investigating new systems. Monitoring water use and ensuring there are no ‘leaks’ in the system (wastage, e.g. broken pipes, entry into slurry systems) is a key starting point. For further information on water use and for saving water on farms, see the following resources:
https://dairy.ahdb.org.uk/technical-information/buildings/housing/water-provision/#.WbK61P6WyM8
http://beefandlamb.ahdb.org.uk/wp/wp-content/uploads/2016/03/BRP-plus-Rainwater-factsheet-080316.pdf
http://www.ukia.org/
Simple water storage tanks up to 10,000 litres cost in the region of £1,000 while a rain water harvesting system will be up to £2,600 for a large tank. These costs are ex VAT and do not include delivery and installation. For costs for reservoirs/lagoons see page 391. For all the systems it is important to source specialist advice on storage requirements, regulation (local council, SEPA and quality assurance), design specifications (including water filters and treatment equipment) and installation.
The data below may be useful to help calculate water storage requirements on farm. All livestock figures are given as the volume of drinking water for one animal of the type described.
Cattle
Dairy cow (in milk) 75-125 litres/day Dairy cow (dry) 40-75 litres/day Suckler cow (spring calving) 14-40 litres/day (autumn calving) 40-70 litres/day Calves 5 litres/day Store cattle 15-50 litres/day Finishing cattle 25-75 litres/day Bulls 30-80 litres/day
Sheep
Pregnant ewe 3-6 litres/day Rams 3-6 litres/day Intensively finished lamb 2 litres/day
Pigs
Newly weaned 1.0-1.5 litres/day Up to 20kg 1.0-2.0 litres/day 20-40kg 2.0-5.0 litres/day Finishing pigs up to 100kg 5.0-6.0 litres/day Sows and gilts (pre-serve and in-pig) 5.0-8.0 litres/day Sows and gilts (in lactation) 15.0-30.0 litres/day Boars 5.0-8.0 litres/day
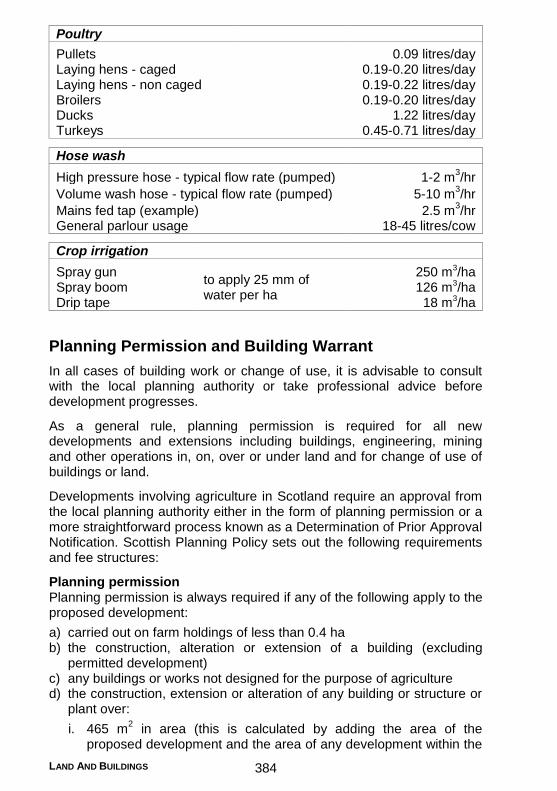
LAND AND BUILDINGS 384
Poultry
Pullets 0.09 litres/day Laying hens - caged 0.19-0.20 litres/day Laying hens - non caged 0.19-0.22 litres/day Broilers 0.19-0.20 litres/day Ducks 1.22 litres/day Turkeys 0.45-0.71 litres/day
Hose wash
High pressure hose - typical flow rate (pumped) 1-2 m3/hr
Volume wash hose - typical flow rate (pumped) 5-10 m3/hr
Mains fed tap (example) 2.5 m3/hr
General parlour usage 18-45 litres/cow
Crop irrigation
Spray gun to apply 25 mm of water per ha
250 m3/ha Spray boom 126 m3/ha Drip tape 18 m3/ha
Planning Permission and Building Warrant
In all cases of building work or change of use, it is advisable to consult with the local planning authority or take professional advice before development progresses.
As a general rule, planning permission is required for all new developments and extensions including buildings, engineering, mining and other operations in, on, over or under land and for change of use of buildings or land.
Developments involving agriculture in Scotland require an approval from the local planning authority either in the form of planning permission or a more straightforward process known as a Determination of Prior Approval Notification. Scottish Planning Policy sets out the following requirements and fee structures:
Planning permission Planning permission is always required if any of the following apply to the proposed development:
a) carried out on farm holdings of less than 0.4 ha b) the construction, alteration or extension of a building (excluding
permitted development) c) any buildings or works not designed for the purpose of agriculture d) the construction, extension or alteration of any building or structure or
plant over:
i. 465 m2 in area (this is calculated by adding the area of the
proposed development and the area of any development within the
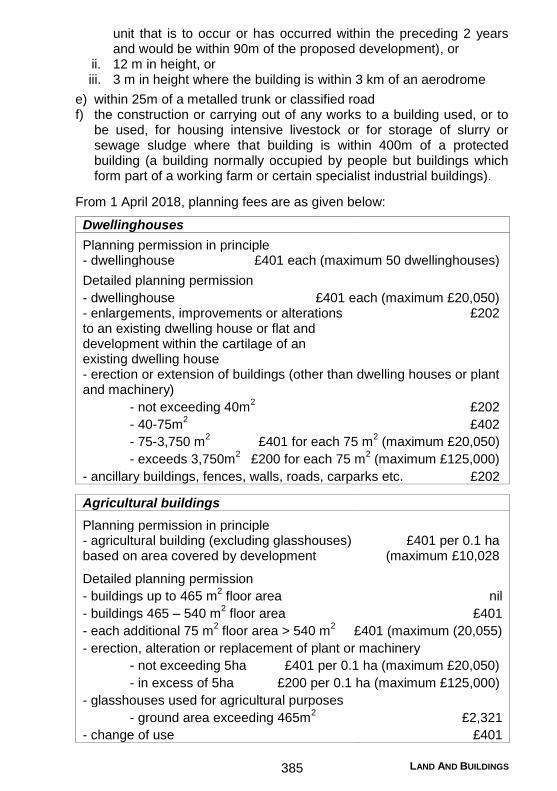
LAND AND BUILDINGS 385
unit that is to occur or has occurred within the preceding 2 years and would be within 90m of the proposed development), or
ii. 12 m in height, or iii. 3 m in height where the building is within 3 km of an aerodrome
e) within 25m of a metalled trunk or classified road f) the construction or carrying out of any works to a building used, or to
be used, for housing intensive livestock or for storage of slurry or sewage sludge where that building is within 400m of a protected building (a building normally occupied by people but buildings which form part of a working farm or certain specialist industrial buildings).
From 1 April 2018, planning fees are as given below:
Dwellinghouses
Planning permission in principle - dwellinghouse £401 each (maximum 50 dwellinghouses)
Detailed planning permission
- dwellinghouse £401 each (maximum £20,050) - enlargements, improvements or alterations to an existing dwelling house or flat and development within the cartilage of an existing dwelling house
£202
- erection or extension of buildings (other than dwelling houses or plant and machinery) - not exceeding 40m
2 £202
- 40-75m2
£402 - 75-3,750 m
2 £401 for each 75 m
2 (maximum £20,050)
- exceeds 3,750m2
£200 for each 75 m2 (maximum £125,000)
- ancillary buildings, fences, walls, roads, carparks etc. £202
Agricultural buildings
Planning permission in principle
- agricultural building (excluding glasshouses) based on area covered by development
£401 per 0.1 ha (maximum £10,028
Detailed planning permission
- buildings up to 465 m2 floor area nil
- buildings 465 – 540 m2 floor area £401
- each additional 75 m2 floor area > 540 m
2 £401 (maximum (20,055)
- erection, alteration or replacement of plant or machinery - not exceeding 5ha £401 per 0.1 ha (maximum £20,050) - in excess of 5ha £200 per 0.1 ha (maximum £125,000)
- glasshouses used for agricultural purposes
- ground area exceeding 465m2 £2,321
- change of use £401

LAND AND BUILDINGS 386
Land
Winning, working or storage of minerals and waste disposal - site area not exceeding
15ha £202 per 0.1 ha (maximum £30,240)
- site area exceeds 15ha £30,240 plus £100 for each 0.1ha (maximum £125,000)
Winning and working of peat £202 per 0.1 ha (maximum £3,024)
Vehicular access, car parks, service roads for existing uses £202
Other engineering or operations on land e.g. installation of floodlights, car parks, roads etc. not serving existing uses
£202 per 0.1 ha (maximum £2,016 for
1 ha or more)
Determination of Prior Approval Notification The Town and Country Planning (General Permitted Development) (Scotland) Amendment (No. 2) Order 2014, grants permitted development rights for some developments subject to conditions. In order to determine if these rights apply an applicant must submit a Determination of Prior Approval Notification (DPA) to the planning authority who, within 28 working days, can ask for a full planning application to be made if it considers that the development is likely to have a significant impact on the surroundings.
Prior Approval Notification fee: £78.
Determination of DPA is required if any of the following apply:
a) build or significantly alter/extend agricultural or forestry buildings. A significant alteration or extension is one which would result in:
the cubic content of the original building being increased by more than 10%, or
the height of the building exceeding the height of the original building
b) form or alter a private way c) carry out excavation or engineering operations in relation to a farm or
forestry undertaking
Prior Notification and Approval in relation to Agricultural and Forestry Private Ways The Town & Country Planning (General Permitted Development) (Scotland) Amendment (No.2) Order 2014 require that, prior to the formation, or alteration, of agricultural or forestry private ways the applicant must apply to the relevant planning authority for a decision on whether prior approval is needed before development begins.
No fee applicable.
Building warrant A building warrant is a legal permit to protect people’s health, safety and welfare. The requirements are set by the Building (Scotland) Regulations

LAND AND BUILDINGS 387
2004. A building warrant is required before commencing most types of building and alteration work.
All agricultural buildings on agricultural land in Scotland are exempt from the need for a building warrant except for the following: buildings for retail purposes (including storage of goods or exhibiting); buildings over 280m
2
in area; buildings within 6m (or the equivalent of its height whichever is less) of a boundary, a dwelling, residential building, office, canteen, or visitor centre and a dungstead, slurry or farm effluent tank. Some non-agricultural buildings and extensions such as small garages and porches do not require a building warrant (refer to the Scottish Governments Non-Domestic Technical Handbook 2016 for further guidance, see http://www.scotland.gov.uk/Topics/Built-Environment/Building/Building-standards/publications/pubtech).
In general terms, there is no building warrant requirement for agricultural buildings in England and Wales. There is a responsibility to check whether the development is compliant with building regulations which falls under Building Control Bodies. For further information, refer to online guidance found in: www.planningportal.gov.uk.
Fees payable with applications for building warrants depend on the estimated cost of the building. As from 1 April 2018, the fees are:
Building cost (£) Fee
Up to 5,000 £150 5,001-20,000 £169 + £19 per every £500 thereafter 20,001-100,000 £593 + £63 per every £10,000 thereafter 100,001-500,000 £1,137 + £103 per every £50,000 thereafter 500,001-1,000,000 £3,272 + £178 per every £50,000 thereafter 1,000,001+ + £253 for every additional £100,000 or part thereof
Amendment of warrant (if additional cost is less than original or increases by no more than £5,000)
£100
Extension to warrant £100 Conversion only £150 Demolition only £150 Amendment of warrant for demolition or conversion only £100 Application for late building warrant (where work has already started)
200% of the fees above
Application for late building warrant (demolitions only) £200 Submission of a completion certificate (where no building warrant has been obtained)
300% of the fees above
Submission of completion certificate (demolitions or conversion only)
£300
It is worth considering that the fees above may be reduced where certificates from approved certifiers of design and construction are presented with a warrant application. Discount for each certificate that

LAND AND BUILDINGS 388
covers the whole of any section of the functional standards i.e. SER, BRE, RIAS and is provided with the warrant application:
Value of Work Fee
Up to £5,000 £30 £5,001 - £9,000 £40 £9,001 - £15,000 £50 £15,001 - £20,000 £60 £20,001 - £50,000 £80 £50,001 - £100,000 £100 Over £100,001 10%
1% for each certificate covering a single item in any such section, all subject to a maximum discount of 60%.
Discount where certificate is provided with the completion certificate: 3% for each certificate covering an approved scheme i.e. electrical installation scheme or drainage, heating and plumbing scheme.
Value of Work Fee
Up to £10,000 £15 £10,001 - £15,000 £20 £15,001 - £20,000 £25 £20,001 - £50,000 £30 £50,001 - £100,000 £35 Over £100,001 3%
20% for a single certificate covering the construction of the entire building, all subject to a maximum discount of 20%.
Wayleaves and Easements
What is a Wayleave?
In general terms, it is a contractual licence which gives operators the right to install, use and maintain its equipment and the owner/ occupier is compensated by annual payments to cover the financial impact of having equipment on their land.
A Wayleave is a temporary right for the operators to use a portion of land, including the right of ingress and egress across the property/ land to reach the parcel of land.
A Wayleave does not automatically transfer to a new owner or occupier.
Landowners/occupiers are restricted from building or growing anything which may adversely impede access to the installed equipment and it may mean the parcel of land is not eligible for BPS (Basic Payment Scheme).
It is recommended to seek advice from an experienced professional to negotiate and agree the payment rates. Landowners/occupiers affected should be paid for the losses incurred when any operations
LAND AND BUILDINGS 389
are carried out on their land including construction or ongoing maintenance, typical losses include loss of crops; reinstatement costs; general disturbance and damage; and extra costs incurred working around the site.
What is an Easement/Deed of Grant?
An Easement is a permanent wayleave which provides operators rights over land which they do not own, providing greater security than a wayleave for the operator.
A single capital payment is paid to the owner/occupier providing permanent access.
Once granted an Easement cannot be rescinded by the landowner/occupier.
An Easement can be registered in the Title Deeds at the Land Registry.
As with Wayleaves, landowners/occupiers are restricted from building or growing anything which may adversely impede access to the installed equipment and it may mean the parcel of land is not eligible for BPS (Basic Payment Scheme).
It is recommended to seek advice from an experienced agricultural professional who can advise on the implications of the easement in terms of farming operations to help negotiate and agree capital payment.
Landowners can ask for previously agreed Wayleave agreements to be replaced with a one-off payment by processing an Easement, but not the reverse.
Guide to Building Costs
This section gives estimated costs for buildings erected by contractors to BS 5502. Costs are gross before deduction of any grant that may be payable. In practice, builders’ estimates vary according to:
site location, conditions and access area of the country specification and standard of finish of the building how familiar the contractor is with the type of work the contractor’s current workload changes in steel prices - there is considerable fluctuation in steel
prices at present due to uncertainty over import/export tariffs and suppliers may only be willing to hold quotes for a short period of time.
Considerable savings can be made by ‘do-it-yourself’ work using farm staff or, in some cases, by using second-hand materials.
Building prices quoted by suppliers for ’Kits’ or ‘Packages’ can refer to the superstructure only. This may account for only 40-60% of the total cost when substructure, services and site works are included. The ‘kit’ costs
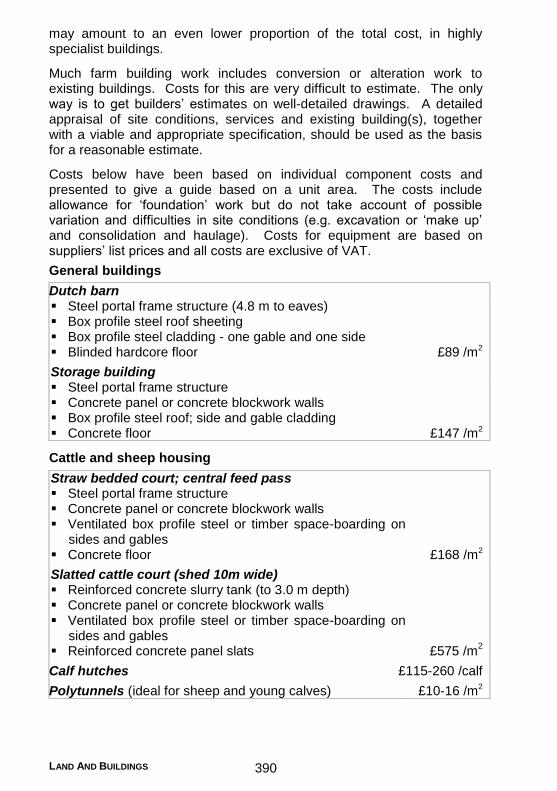
LAND AND BUILDINGS 390
may amount to an even lower proportion of the total cost, in highly specialist buildings.
Much farm building work includes conversion or alteration work to existing buildings. Costs for this are very difficult to estimate. The only way is to get builders’ estimates on well-detailed drawings. A detailed appraisal of site conditions, services and existing building(s), together with a viable and appropriate specification, should be used as the basis for a reasonable estimate.
Costs below have been based on individual component costs and presented to give a guide based on a unit area. The costs include allowance for ‘foundation’ work but do not take account of possible variation and difficulties in site conditions (e.g. excavation or ‘make up’ and consolidation and haulage). Costs for equipment are based on suppliers’ list prices and all costs are exclusive of VAT.
General buildings
Dutch barn Steel portal frame structure (4.8 m to eaves) Box profile steel roof sheeting Box profile steel cladding - one gable and one side Blinded hardcore floor £89 /m2
Storage building Steel portal frame structure Concrete panel or concrete blockwork walls Box profile steel roof; side and gable cladding Concrete floor £147 /m2
Cattle and sheep housing
Straw bedded court; central feed pass Steel portal frame structure Concrete panel or concrete blockwork walls Ventilated box profile steel or timber space-boarding on
sides and gables Concrete floor £168 /m2
Slatted cattle court (shed 10m wide) Reinforced concrete slurry tank (to 3.0 m depth) Concrete panel or concrete blockwork walls Ventilated box profile steel or timber space-boarding on
sides and gables Reinforced concrete panel slats £575 /m
2
Calf hutches £115-260 /calf
Polytunnels (ideal for sheep and young calves) £10-16 /m2

LAND AND BUILDINGS 391
Slurry storage
Above ground circular storage (steel and concrete)
Stores less than 1,000m3
Stores 1,500m to 2,500m
3
Stores above 2,500m3
£65 /m3 £50 /m3 £45 /m3
Above/below ground rectangular concrete stores £80-130 /m3
Lagoons (not including earth lined)
£12-20 /m3 Total installed storage including fencing and gating but
not slurry handling equipment
Silage clamps
Earth walls 3.0 m high, 1,000 t capacity, 1,400 m3 Reinforced concrete floor with effluent collection system
and tank (In England and Wales, earth walled clamps are not permitted.) £80 /t
Pre-cast concrete panel walls 3.0 m high, 1,000 t capacity, 1,400 m3 Reinforced concrete floor with effluent collection system
and tank £90-120 /t
Cast in situ reinforced concrete walls 3.0 m high, 1,000 t capacity, 1,400 m3 Reinforced concrete floor with effluent collection
system £90-130 /t
Roofed silage clamp as above £125-160 /t
Grain storage
1,000/1,200 t capacity Steel portal frame structure 3.0 m high precast concrete panel wall Box profile steel roof, side and gable cladding Reinforced concrete floor Excludes ducts or grain handling equipment
£157 /m2
Potato storage
1,000/1,200 t capacity, box storage system Steel portal frame structure Insulated box profile steel composite panel roof and
wall cladding; reinforced concrete floor Environmental control equipment, fans etc. Excludes power connection costs which can be
substantial £310-385 /m2


Climate Change and the Environment

CLIMATE CHANGE AND THE ENVIRONMENT 394
Introduction
The UK and Scottish Governments have long standing commitments to reduce greenhouse gas emissions and it is essential that agriculture plays its part. Emissions from Scottish agriculture have declined steadily in recent years and farmers have contributed to recent emissions reduction initiatives including the Farming for a Better Climate programme supported by the Scottish Government.
With the public support system for agriculture expected to change significantly following the UK’s planned departure from the EU in 2019, there is the potential for agricultural support to be more closely linked to environmental improvement. This further supports making continued progress on reducing the farming sector’s carbon emissions.
This section provides information on; agriculture and forestry and climate change, the Farming for a Better Climate programme and pollution and the environment.
Agriculture and Climate Change
Mitigating climate change is a key component of the Scottish Government’s aim to create a growing, sustainable and inclusive economy and is reflected in the targets set. The Climate Change (Scotland) Act 2009 set world leading greenhouse gas (GHG) emissions reduction targets, including a target to reduce emissions by 80% by 2050. Although deemed to be ambitious at the time, the Scottish Government has made headway to meeting this target and in its recent draft Climate Change Bill has proposed increasing the 2050 target to 90%.
With around 26% of GHG emissions in Scotland attributed to agriculture and related land use, the rural sector has an important role to play in helping Scotland achieve its targets. The challenge for the industry is therefore to produce more food with lower emissions.
The three main GHGs produced by agriculture and their sources include:
Nitrous oxide (N2O) which is released during the application of synthetic and organic fertilisers to the soil, from urine deposition by grazing animals, cultivations of soils and changes in land use and vegetation.
Methane (CH4) is produced as a natural by-product of enteric fermentation during ruminant digestion and, to a lesser extent from management of organic manure.
Carbon dioxide (CO2) is produced by burning fossil fuels such as coal, oil and diesel to produce energy.
The above emissions are typically displayed in terms of CO2e (CO2
equivalents) based on their relative global warming potential (GWP) over a 100 year period, see following table.

CLIMATE CHANGE AND THE ENVIRONMENT 395
Expressing emissions as CO2e allows bundles of GHGs to be quantified as a single number allowing year-on-year results to be easily compared.
GHG GWP multiplying factor /kg gas emitted
Carbon dioxide x1per kg emitted Methane x25 per kg emitted Nitrous oxide x298 per kg emitted
PAS 2050 (Source: IPCC 2007)
The following chart shows Greenhouse Gas Emissions from Agriculture and Related Land Use in Scotland between 1990 and 2016 and includes net emissions from cropland and grassland and emissions from livestock, agricultural soils, stationary combustion sources and off-road machinery.
In 2016 Scottish agriculture and related land use was estimated to contribute 10.0 MtCO2e to Scotland’s total net GHG emissions, a reduction of 0.11 MtCO2e (-3.9%) compared to 2015 and a 3.87 MtCO2e (27.8%) fall since 1990.
The gradual decline in emissions between 1998 and 2016 is attributed to improvements in practices on agricultural soils, reduced rate by which land has been converted to cropland and a decline in cattle and sheep numbers (particularly between 2015 and 2016).
At present steps by the industry to reduce GHG emissions from on-farm agricultural sources mainly focus on education and voluntary measures via initiatives such as Farming for a Better Climate (see pages 396-397). Several UK supermarkets and other commodity buyers request that their suppliers deliver lower carbon produce and the preparation of farm carbon audits is now incorporated into some of Scotland’s Rural Development Programme Schemes (see pages 446-452). At the farm level, making more efficient use of resources (inputs) by managing animals, soils, waste and fertiliser better will reduce GHG emissions and save money.

CLIMATE CHANGE AND THE ENVIRONMENT 396
Carbon foot-printing for farms The amount of GHG emissions produced on-farm in a year can be determined using a carbon calculator. This measure of emissions is known as a carbon footprint, also referred to as a carbon audit or resource use efficiency audit and can be prepared for the whole farm, individual enterprises or products. Carbon calculators typically calculate total emissions and emission intensities (i.e. CO2e per unit of output). Presenting emissions as an intensity allows changes in production to be taken into account as well as changes in total emissions.
Benchmarking the quantity and source of GHG emissions produced with similar livestock enterprises and crops highlights areas where mitigation actions could be targeted. As well as reducing emissions and benefiting the environment, mitigation can also present cost savings to the farmer. AgRE Calc©, SAC Consulting’s Agricultural Resource Efficiency Calculator (www.agrecalc.com) is an available tool that will calculate emissions and benchmark the results against similar enterprises.
Farming for a Better Climate
Based on work with farmers, industry specialists and consultants, Farming for a Better Climate suggests practical tips and ideas to improve business efficiency, reduce GHG losses from the farm and help farmers and land managers adapt to a changing climate.
Practical ideas, which can be easily developed and adapted to suit most farms, are grouped into five key action areas:
1. Optimise livestock management - improve livestock productivity through better grazing management and nutrition.
2. Optimise the application of fertilisers and manures - save through better utilisation of nutrients.
3. Locking carbon into soils and vegetation - protect soils and improve soil quality for future generations.
4. Using energy and fuels efficiently - reduce your spend on fuel and power.
5. Developing renewable energy - save on purchased energy and earn from surplus energy sold to the national grid and from renewable heat production incentives (pages 313-321).
As part of the Farming for a Better Climate initiative, SAC Consulting are working with volunteer Climate Change Focus Farms, forming farmer discussion groups across Scotland to trial and develop a range of practical solutions to reduce emissions and improve farm profitability. The Climate Change Focus Farms host on-farm meetings around four times a year to highlight practical measures and/or new technologies to improve both efficiency on the farm and reduce the farm carbon footprint.

CLIMATE CHANGE AND THE ENVIRONMENT 397
For more information, including practical guides, farmer case studies, details of forthcoming meetings or to register for the free e-newsletter highlighting what other farmers are doing, email [email protected], visit www.farmingforabetterclimate.org, find Farming for a Better Climate on Facebook or follow on Twitter @SACfarm4climate.
Farming for a Better Climate is managed by SAC Consulting as part of the Farm Advisory Service (www.fas.scot). The Climate Change Focus Farms are funded by Scottish Government as part of their VAS (Veterinary and Advisory Services) legacy activities.
Forestry and Climate Change
Afforestation is one of the methods by which climate change reduction targets can be achieved. The Scottish Government’s expectation is to see forestry expand to 25% of Scotland’s land area by 2050.
Growing trees act as a carbon sink, sequestrating carbon dioxide from the atmosphere and converting it to wood. This carbon remains locked away as long as the timber is used in construction, fencing or other wood products.
The following chart shows the net Greenhouse Gas Emissions from Forestry in Scotland between 1990 and 2016 and includes changes in net emissions relating mainly to stock changes resulting from afforestation, deforestation and harvested wood products.
In 2016 Scottish forestry resulted in a net removal of 12.7 MtCO2e, 4.8 MtCO2e (61.8%) more than in 1990 and is due to an increasing sink of forest land remaining forest land.
The permanent planting of trees (not Christmas trees) on agricultural land will result in net sequestration of carbon. Deep peats (greater than 50cm

CLIMATE CHANGE AND THE ENVIRONMENT 398
deep) should not be planted as peat itself sequesters carbon, and planting it with trees would cease its function as such.
For more information on forestry and woodlands see pages 294-310.
Carbon value Tree planting on agricultural land will contribute to reducing a farm’s carbon-footprint, where:
It is a permanent change in land use. The planting conforms to the UK Forestry Standard. The risks to the planting and the accuracy of sequestration predictions
are considered.
New woodland may qualify for payments under a carbon brokerage scheme (the Woodland Carbon Code – WCC), as long as additionality can be proven whereby it can be demonstrated that the creation of the woodland would not have happened without the assistance of the WCC.
Current payments for new planting range from £350 to £1,000/ha net dependent on species, contract period, location and management regime.
Wood fuel Wood can be used as a renewable heat source and is usually sold to the customer as logs, chips or pellets. Woodland owners can sell smaller sized roundwood as logs. Values vary according to whether the wood is soft wood (conifer) or hard wood (broadleaf); for log prices see page 297.
Standing and lying deadwood can be of considerable ecological value, it may also have a lower calorific value than ‘live’ wood. Where it is safe to do so, deadwood should be left in the forest.
Short Rotation Forestry (SRF) is a system for producing woody biomass for renewable energy projects. For more information on this system and biomass heating, see pages 334 and 327-329.
Woodland as pollution control Native riparian woodland can provide an effective buffer against diffuse pollution. Woodland acts as a buffer reducing the risk of surface run-off, leaching, spray pesticide drift and fertilisers entering the watercourse. Trees can reduce the risk of erosion and when fenced can secure stock from entering the water courses.
Pollution and the Environment
If mis-managed, our activities can have a number of negative impacts on the environment. A range of legislative requirements are in place across all sectors to help to protect the environment.

CLIMATE CHANGE AND THE ENVIRONMENT 399
A useful starting point for all businesses is NetRegs (www.netregs.org.uk), an initiative to help small businesses reduce pollution risks and improve their environmental performance. NetRegs has a section specific to agriculture providing free, clear guidance on environmental legislation. Issues covered in NetRegs include: agricultural waste, disposal of animal carcasses and oil storage.
Diffuse pollution Scotland’s water quality is generally good and water management has led to huge improvements in water quality over the last 50 years. However, diffuse pollution is now the largest source of pollution affecting Scotland’s waters.
The Water Environment (Diffuse Pollution) (Scotland) Regulations are referred to as the Diffuse Pollution General Binding Rules (DP GBRs). These DP GBRs focus on rural land use activities and aim to protect and improve Scotland’s water quality.
The DP GBRs state minimum working distances for activities bordering watercourses, such as, application of manures and slurry or in-field cultivation practices. More detail can be found on page 502-503.
The DP GBRs are the focus of a ‘Know the Rules’ pocket size guide and ‘Mind the Gap’ tractor sticker, available free from SAC Consulting offices. Alternatively you can request free copies or download the information via www.farmingandwaterscotland.org
Further information on funding, environmental policies, statutory requirements and good practice guides can be found at the following websites:
Agri-Environment Climate Scheme (AECS) includes information on funding for diffuse pollution and greenhouse gas mitigation measures: https://www.ruralpayments.org/publicsite/futures/topics/all-schemes/agri-environment-climate-scheme/
DARDNI: www.dardni.gov.uk/index/farming/countryside-management.htm
Diffuse Pollution Priority Catchments: www.sepa.org.uk/environment/water/river-basin-management-planning/actions-to-deliver-rbmp/priority-catchments/
Farming and Water Scotland; information to protect water quality and reduce pollution risks from routine practices: www.farmingandwaterscotland.org
Pollution Prevention and Control (PPC) Regulations. Large pig and poultry units are covered by the PPC Regulations: www.sepa.org.uk/regulations/pollution-prevention-and-control/
PLANET Scotland, free nutrient management computer software: www.planet4farmers.co.uk
CLIMATE CHANGE AND THE ENVIRONMENT 400
Prevention of Environmental Pollution from Agricultural Activity (The PEPFAA Code): Under development. For details see www.farmingandwaterscotland.org
SEPA: www.sepa.org.uk

New Entrants
NEW ENTRANTS 402
Introduction
New entrants to farming and the ideas and energy they bring are essential if the agricultural and rural sector is to adapt and thrive in the uncertain years that lie ahead. This section provides some vital information for those looking to get started in farming including; starting an agricultural business, business planning, financial planning and farming opportunities (such as share and contract farming). There are also links and sign posts to further information resources and initiatives supported by the Scottish Government’s SRDP programme, the NFUS and Forest Enterprise Scotland.
Starting Up an Agricultural Business
There are various and specific rules and regulations that must be adhered to when keeping farm livestock and managing land. The following information provides key points of contact and measures that need to be considered when starting up an agricultural business at any level.
Business registration A new agricultural business should be registered with the Scottish Government Rural Payments and Inspections Division (SGRPID). This can be done online (https://www.ruralpayments.org), by completing a registering a business form or by contacting the local SGRPID office (https://www.ruralpayments.org/publicsite/futures/topics/contact-us/). To register a business the following information is required:
Business details. Responsible person. Other personnel involved in the business. Intention to keep livestock. Land associated with the business. Feed business details - for council/trading standards purposes.
On completion and submission of the above information, the business will be allocated a unique Business Reference Number (BRN).
The land associated with the business will either have or be allocated a Main Location Code (MLC) which is a unique identification which encompasses numbers associated with the county, parish and holding location of the land.
Both the BRN and MLC are important identifiers when corresponding with various regulatory bodies.
Registering to keep livestock When keeping livestock or if intending to keep livestock, the business must also register with the Animal and Plant Health Agency (APHA) (https://www.gov.uk/government/organisations/animal-and-plant-health-

NEW ENTRANTS 403
agency). This requires details about the keeper, the business, the type of animals and the land. The MLC of the business is required when registering with APHA, so the above SGRPID registration process needs to have been completed first. Registering with APHA allows for a unique flock/herd mark to be allocated. The flock/herd mark is required, by law, for animal identification and traceability. For more information on livestock traceability see pages 113-115.
Other registrations Registering for tax, national insurance, PAYE, VAT with HM Revenue & Customs will also need to be considered. Advice from an accountant should be sought while some information can be found in the Taxation section on page 479 or at: www.hmrc.gov.uk/courses/syob/farm/index.htm
Registering with industry bodies such as quality assurance schemes, health schemes for livestock or farmers associations should be considered as part of good farming practice as well as helping to keep informed of regulation.
Compliance measures Farmers and land managers must comply with various regulatory measures which are related to the environment, public health, animal health and welfare and plant health. There are two main measures of cross compliance which include Statutory Management Requirements (SMRs) and Good Agricultural and Environmental Conditions (GAECs). Linked to these requirements, the following records should be held and/or submitted:
Integrated Administration and Control System (IACS) Single Application Form (SAF)
Nitrate Vulnerable Zone (NVZ) records Livestock registers Spray records Livestock medicine records Sheep annual inventory Agricultural survey and census returns
In addition and depending on the nature of the business, there may be other statutory requirements to consider including:
HMRC - business annual taxation accounts, personal tax returns, VAT returns
Employment - national insurance (NI), pay as you earn (PAYE), pensions
Insurance - personal, employers, public Health and safety Quality assurance
NEW ENTRANTS 404
Record keeping Land managers and/or keepers of livestock are encouraged to keep records to, not only comply with regulation, but for management purposes to help monitor and improve business performance.
Additional records you may need to keep as a livestock keeper/land manager are:
Nutrient management plan Farm waste management plan Crop records Livestock feed use records Property repairs inventory SEPA licences e.g. sheep dipping, waste disposal, water
abstraction/irrigation Enterprise financial records
Business Planning
The most common reason for developing a business plan is to detail the financial viability of a business. For new entrants, business plans are commonly required when tendering for tenancies and/or seeking finance. Developing a business plan provides a potential landlord or lender with the knowledge that operational, personnel, marketing and financial aspects of the business have been considered thoroughly in order to make the business succeed.
A comprehensive business plan will address the financial viability of the proposed business, as well as describing how the other aspects of the business will operate. The financial section of a business plan should document current and expected income and expenses, along with the ability to repay any debts such as borrowings.
New entrants, or even well established farmers proposing a new enterprise, will find preparing and presenting a business plan very beneficial, as they communicate their ideas to lenders. Farmers now face the commercial reality of having to sell their produce into a market place that is linked into world supply and demand trends. This has shifted risk and potential reward onto farmers, who must now ensure they are producing a product the consumer wants and be able to negotiate a price above their cost of production, in order to secure a successful future.
Uncertainty will always be a feature of farming businesses. There are simply too many factors that are out with control of the business. With this in mind, factoring sensitivity into the financial aspects of the business will show initiative. The impact of weather on livestock and crop yields and performance and the price of inputs and outputs are obvious factors to make note of.
NEW ENTRANTS 405
A business plan should contain the following:
An overview of the business - a description of the farm (land and buildings) and the enterprises practiced/planned.
Information about the management team and staff – ownership, skills, experience, capabilities.
Business objectives - short and long-term. Financial position and forecasts - likely profitability when fully
established (worthwhileness) and annual budgets detailing expected cash flow, profitability and changes in equity in the years taken to establish the business (feasibility). A lender will also require a clear statement of capital provided at the outset alongside funding required.
Marketing and sales strategy - planned approach of marketing and selling your chosen product(s).
SWOT analysis - Strengths, Weaknesses, Opportunities and Threats that show an awareness of internal, external, personal, physical or financial influences and risks on the business.
Financial Planning
Financial analysis and planning is a key aspect of any agricultural business no matter what size. The finances help to provide an overview of what has happened over the period of analysis or when budgeting what is going to happen.
The key points to consider are:
Profit (loss) - this is used to express annual financial performance as part of the profit and loss account at one point in the financial year showing trading output (adjusted for valuations) less inputs (adjusted for valuation changes). The profit before depreciation is available to cover drawings, tax, and capital investment (the “cash needs” of the business).
Capital - the net worth is shown on the balance sheet giving a snapshot of the assets and the liabilities of the business at one point in the financial year. Assets should be based on market values to provide a true estimate of net worth.
Cash - cashflow gives a clear indication, on an ongoing basis throughout the year, of the business bank account and, unlike the profit statement, includes VAT and is not adjusted for valuation changes, debtors, creditors, personal and capital transactions.
Whole farm budgeting Taking into account farm enterprise information (either historical or predicted using the Farm Management Handbook), a business can benchmark both technically and financially. This information in conjunction with the financial descriptions for profit, capital and cash should help a business to prepare a whole farm budget.

NEW ENTRANTS 406
A whole farm budget acts as a model of the business predicting income and expenditure over a period (usually the 12 months of the financial year of the business) and this can be monitored against actual income/expenditure during the year. This information allows the business to analyse performance and to make decisions about future strategies.
Some basic budgeting features are shown in the following text. Any figures that are presented in a budget must be supported by clear assumptions adjusted for sensitivities where applicable.
Profit (loss) The trading profit and loss account of a business is often expressed in the following format:
OUTPUT
less
VARIABLE COSTS
equals
GROSS MARGIN
less
FIXED COSTS
equals
NET PROFIT/LOSS
Monetary values under the above headings do not necessarily represent all or exact cash transactions through the bank. The profit and loss account also includes adjustments for valuations, debtors, creditors, depreciation, personal income or expense, and capital transactions. Further definitions can be found on pages 1 and 2 while financial data for particular farm types can be found in the Whole Farm Data section on page 415.
Capital The capital position of the business is shown by the balance sheet in the following format:
ASSETS (e.g. land/buildings/machinery valuations, cash at hand, stocks, debtors)
less
LIABILITIES Long/medium term and Current
(e.g. loans/mortgages, overdraft, hire purchase, other creditors)
equals
NET WORTH or OWNER EQUITY
The net worth of the business is essentially the value of assets available to the business after all liabilities have been cleared. When the net worth

NEW ENTRANTS 407
is valued against the total assets as a percentage, the resultant figure gives a clear indication of the business’ capital position.
Cash It is vital to know the cash position of the business as this relates to the bank balance. The cashflow considers the cash values of sales and expenses that would appear in the profit and loss account. In addition, the cashflow also takes into account cash items such as personal drawings, tax payments, and capital repayments for loans and hire purchases. The opportunity to save for future reinvestment can be identified by taking account of the cash needs of the business.
Financial targets and benchmarks As well as technical enterprise performance targets/benchmarks, such as yield and lambing/calving percentages, a farm business will have financial targets/benchmarks that it should consider while analysing performance or planning. Analysis of the profit and loss account is an ideal starting point to prepare business figures to allow comparison to industry benchmarks. Businesses should analyse and present their accounts in a similar format to that presented below allowing an easy comparison. The whole figures under each analysis heading, e.g. variable costs, can then be converted to a Gross Output Analysis (GOA) which takes output at 100% and each analysis heading is divided by the output and multiplied by 100 to get a percentage. Current GOA targets are:
Dairy General (excl. pigs
and poultry)
Output 100% 100%
Variable costs < 40% < 30%
Gross margin > 60% > 70%
Fixed costs < 30% < 45%
Profit > 30% > 25%
Pig and poultry farms are similar to dairy farms in that they typically generate high output, high variable costs (because of feed costs) and relatively low fixed costs owing to high output or turnover.
The Whole Farm Data figures on pages 420-435 are industry figures based on real farms thus provide an ideal starting point for benchmarking. A business should consider the average to high performing categories as the main goal. Nevertheless, due to the nature of farming and the varying characteristics (e.g. geography, land quality, local climate, type of stock, etc.) that influence performance, a flexible approach should be taken when benchmarking. Once a farm is up and running and has its own data, benchmarking internally will provide additional information to help assess performance.
NEW ENTRANTS 408
Other benchmarks used to ascertain business performance and sustainability are related to the capital aspects of the business such as:
Percentage owned/owner equity:
- owner occupier > 60% - tenant > 50%
Lenders, such as banks and mortgage companies, will consider, in addition to those described above, several other factors and benchmarks when analysing business performance and assessing ability to service loan funding.
Business Structure
The most appropriate business structure for a new rural business depends on the plans for the business, the people involved and issue of land tenure. This will result in different legal and taxation implications, meaning professional advice is recommended from the outset.
There are three common types of business structure:
Sole trader - This is the simplest form of business since it can be established without legal formality. However, the business of a sole trader is not distinguished from the proprietor's personal affairs.
Partnership - A partnership is similar in nature to a sole trader but because more people are involved it is advisable to draw up a written agreement and for all partners to be aware of the terms of the partnership. As for a sole trader, the business and personal affairs of the partners are not legally separate. A further possibility is to use what is known as a Limited Liability Partnership (LLP).
Company - The business affairs are separate from the personal affairs of the owners, but this entails compliance with greater regulations.
The appropriate structure will depend on a number of factors, including consideration of taxation implications, the legal entity, ownership and liability.
Farming Opportunities
Availability of land is often mentioned as one of the main hurdles for new entrants entering farming. There are numerous routes to land availability if purchasing land is not a feasible option. The following paragraphs describe these routes.
Tenancies This is the most common route for new entrants to access land. It involves a landowner letting an area of land (often including sheds and a dwelling house) to a tenant for an agreed period of time and rent. The types of tenancies available include the following
Short Limited Duration Tenancy (SLDT) Modern Limited Duration Tenancy (MLDT)

NEW ENTRANTS 409
Grazing or mowing tenancies
These are described in detail on pages 372-377.
Joint ventures Farmland tends to have a high asset value relative to its income earning potential. Land purchase can, therefore, be a substantial financial barrier to entry for aspiring farmers and expanding businesses alike.
There are various mechanisms currently available to facilitate a step onto the farming ladder including a range of rental arrangements and joint ventures. Traditional formal tenure arrangements (see pages 372-377) are covered by Scottish legislation, but there is growing interest in joint ventures as an alternative route to farming. These include:
Contract farming Share farming Business equity partnerships
A joint venture can be considered to be some form of co-operation, formed in a legal manner, between two or more parties to form a business relationship, other than as landlord and tenant. There are various benefits and reasons for the creation of these collaborative agreements including sharing risk, improving return on capital through combined resources and expertise and accelerated growth. They can also avoid the need to create a formal farm tenancy. Examples of common circumstances in which joint ventures can be beneficial include:
Land coming back in-hand after being let out. The owner may be inexperienced but wishes to retain vacant possession.
The farm may not be large enough to be a viable holding on its own. The farmer may wish to release equity. To obtain economies of scale through splitting the cost of farming with
others. The business may be in need of large capital investment. The owner may want to retire, not having a natural successor, but not
ready to sell. There may be a substantial tax advantage.
Genuine joint venture agreements work well but must be more than a written document. In practice, it is important for both parties to abide by the governing rules in order to retain the advantages (including tax benefits) and avoid it being construed as an alternative legal entity such as a tenancy, partnership, or employer/employee relationship. The foundation to success with joint venture farming is finding the right mix of people, regular communication and use of an independent advisor.
Contract farming A standard Contract Farming Agreement (CFA) is the terms of understanding between two parties. That is, a landowner/occupier (known as the “farmer”) who has engaged the services of another (known

NEW ENTRANTS 410
as the “contractor”) to undertake farming operations over a fixed period (typically 3 to 5 years) on pre-arranged terms – it may be more simply understood as farming with contractors.
The farmer normally provides the land, buildings, fixed equipment (if required or agreed), a dedicated bank account, pay the required bills, finance to administer the agreement, and any farm knowledge. For this, they will receive what is commonly termed a basic retention/fee. This is agreed with the contractor in advance of the start of the agreement.
The contractor provides the labour, machinery (including its incurred costs) and management expertise. The contractor could be a neighbouring farmer, large farming company or traditional contractor. For this, they receive a basic contractor’s fee (usually quarterly or half-yearly).
Either party, via a separate livestock hire agreement, can supply breeding livestock (if applicable). Both parties agree farming policy and the share of any divisible surplus in advance and meet regularly throughout the duration of the agreement to make management decisions and monitor progress.
For working examples of real contract farming case studies see https://www.fas.scot/new-entrants/case-studies/
Share farming Share farming is an arrangement between two independent businesses. It is often confused with contract farming but there are some differences, for example:
They are two entirely separate businesses working the same land. As separate businesses they share the value of the farms output
(typically sales) rather than a fee plus share of net profit.
There is no standard share farming agreement. The details are a matter for the parties involved but each party needs to bring complementary resources and skill sets. The share farming structure is not as popular as contract farming in the UK but is commonplace in New Zealand. It is possible to start as a share farmer with only a small share then progressively build equity share (within the terms of the agreement) until owning most or all of the stock and/or equipment. There are three conceivable paths for the agreement:
1. It may be a step towards farm succession. 2. If agreed, share farmer equity in livestock could be increased on
renewal of the agreement. 3. Terminate the agreement:
a. allowing the share owner to follow an alternative plan. b. to allow the share farmer to buy into another or larger farm. c. liquidate to enable the share farmer to purchase their own farm
and likely become a share owner.
NEW ENTRANTS 411
Typically, the share owner/occupier provides the land, buildings, fixed equipment, fixed machinery, major maintenance of buildings and expertise along with paying a certain percentage of certain input costs. The share farmer/operator will provide the working machinery, moveable equipment, and technical ability and pay the balancing cost of inputs. Livestock are usually held in undivided shares. Output and certain input costs (direct costs) are split using pre-agreed allocations. Equity partnerships An equity partnership is an alternative way to invest in farming for those who are unable to finance a farm tenancy or ownership as an individual. It can also be an opportunity for outside investors and for existing farmers to grow their business. It may also benefit those wanting to release capital from land for alternative investments or allow partial retirement as part of a structured succession, particularly with non-family members.
An equity partnership is most likely formed as a company, with potentially multiple investors. These shareholders will pool their capital (equity), and possibly skills or resources, in the aim of generating higher investment growth. The company will identify and assess an investment option, purchase the land, livestock plus necessary machinery and plant. This is funded through shareholder equity and bank debt, borrowed by the company. There are various structures and the most appropriate will depend on the type of investor. Often one of the partners is employed as the farm manager, known as an equity manager. The board of directors will run governance. Each partner normally appoints one director to the board. This works well provided directors have the necessary and complementary skills. This responsibility or process can be contracted out, particularly where investor(s) are time limited, remote from the operation or opt to be a ‘sleeping partner’.
For all joint ventures, clarity of the mechanics of the systems and all associated advantages and disadvantages to the parties involved must be made prior to delving into such agreements. Investment in advice from legal and financial specialists is highly recommended.
Finance
Sourcing finance to develop and grow a fledgling business can be challenging. There are various lenders who are especially supportive of new entrant businesses. It is essential that the business has a track record and credit history, setting up a bank account as soon as possible facilitates this. The lender will require a business plan and cash flows, demonstrating what the immediate and future plans are for the business as well as the cash requirements. The funding sought should match the requirements of the business, for short term working capital for seed, fertiliser, feed, etc. an overdraft should be requested, whereas capital for

NEW ENTRANTS 412
more permanent structures or machinery asset finance or loan funding should be investigated.
Finance can be sourced through various means including, overdraft, short and long term loans and hire purchase agreements (see pages 475-477). Finance can often be negotiated, e.g. longer payment terms for purchasing seed and fertiliser and market finance for purchasing livestock. Some livestock markets have special terms which favour new entrants.
The capital demand of a business can be minimised to reduce the reliance on borrowing. Such methods would include using machinery rings to hire in equipment when it is required, rather than purchasing. In return labour can be hired out to offset the payment.
New Entrants Initiatives
Forest Enterprise Scotland (FES) FES objective to integrate farming and forestry have created opportunities for new entrants to agriculture through their Starter Farms and Starter Business Units.
There are currently nine starter farms from Caithness to Dalbeattie on Scotland’s National Forest Estate. The units vary in size, but the model includes farms covering approximately 110 acres of agricultural land. These are leased out on 10-year LDT/MLDT agreements to the new entrants. The applicants undergo a rigorous competitive application process including completing a business plan with cash flow projections, completing a series of questions including motivation, income plans, health and safety, training, farming policy, etc. Shortlisted candidates are then called for interview and will face a panel of 5-6 people including a local FES employee, farmer and a Scottish Government representative.
There are also numerous starter business units. A starter unit provides agricultural grazing opportunities to new entrants. There is generally no house or buildings associated with them. The resources and conditions vary with site and will have a focus of enhancing the FES environmental objectives.
More details on the FES starter farm initiative can be found at: http://scotland.forestry.gov.uk/supporting/grants-and-regulations/farm-woodlands/starter-farms
NFU Scotland NFU Scotland runs a Next Generation committee. The group is composed of both new and young farmers from across Scotland. The committee provides a voice for people who are young and new to farming. The group champions getting new and young farmers into the sector. They hold four meetings a year around the country and have a

NEW ENTRANTS 413
regional structure, which elects representatives. For more information visit https://www.nfus.org.uk/policy/new-generation.aspx
Scottish Government assistance The Scottish Government is extremely supportive in encouraging the next generation to farming, and to overcome barriers.
The Scottish Rural Development Programme (SRDP) currently (summer 2018) includes a dedicated new entrant funding stream through the New Entrants Capital Grant. Eligible businesses can apply for 80% of approved costs (LFA) or 60% of approved costs (non LFA) up to £25,000 over a two year period. Eligible businesses are those whose head of the business is a new entrant farmer or crofter and have set up in the last five years, the business must be an active agricultural business.
More details on the scheme can be found at: https://www.ruralpayments.org/publicsite/futures/topics/all-schemes/new-entrants/ or in the Rural Aid Schemes section on pages 437.
New entrants and young farmers to agriculture can apply to the National Reserve for allocation of entitlements for the basic payment scheme. This can be done while submitting a single application form online, the deadline is 15
th May on the year of application. To be eligible new
entrants must have started agricultural activity in 2013 or later and not have had agricultural activity in their own name in the five years preceding the start of the activity. To apply as a young farmer, they must be under 41 years of age on the 31
st December on the year of
application, and be setting up as head of the agricultural holding for the first time.
Further details can be found at: https://www.ruralpayments.org/publicsite/futures/topics/all-schemes/national-reserve/national-reserve-full-scheme-guidance/
The SRDP Farm Advisory Service (FAS) has a dedicated site for new entrants. The FAS provides information and resources (local and national workshops, case studies and guidance notes, national conference, newsletter and a dedicated Facebook page) aimed specifically at new entrants to farming across Scotland as well as grant support for one-to-one mentoring and specialist advice from experienced peers. For details see page 451 or https://www.fas.scot/topic/new-entrants/.
The Scottish Government has formed a working group to develop and coordinate Farming Opportunities for New Entrants (FONE) aimed at identifying publically and privately owned land that could be released for new entrants to farming.
For more details see: http://www.gov.scot/Topics/farmingrural/Agriculture/NewEntrantsToFarming/meeting5a


Whole Farm Data

WHOLE FARM DATA 416
Introduction
This section provides whole farm benchmarking data for typical farm types in England and Scotland.
Benchmarking is a valuable tool to appraise the financial performance of a business year on year, or in relation to the wider industry. In addition, the benchmarks in the following pages, particularly the fixed costs, when used in conjunction with the livestock and crop gross margin budgets shown earlier in the Farm Management Handbook are useful to budget potential future business plans.
Source of Contents for 2018
The data for England and Scotland has been produced using information from the Farm Business Survey 2016/17 (conducted by six University Research Centres in England) and the Farm Accounts Survey 2016/17 (conducted by SRUC in Scotland).
Data has been sourced from the publications listed below:
Farm Accounts in England 2016/2017, December 2017 Farm Performance in Scotland 2016 Crop Year, April 2018
Full information can be found at:
https://www.gov.uk/government/statistics/farm-accounts-in-england https://www.fas.scot/topic/farm-business/
England Farms are allocated to performance bands according to the output and input values for farm type. The performance bands reported represent the top 25 per cent (higher) and bottom 25 per cent (lower) against the average for the farm type.
English data is expressed as Farm Business Income (FBI). FBI reflects actual incomes of farm businesses and is, in most cases, very similar to net profit. FBI is the gross margin less the sum of the fixed costs, less BPS and net margin from diversification enterprises that use farm resources.
The tables present the data on a £ per farm basis. In addition, FBI has been presented as £/ha or £/100 ewes.
Scotland The benchmark data for Scotland is shown in the following tables for the upper 25% performing farms per farm type.
The Scottish data is shown as a profit figure. This is based on management principles rather than those used for tax accountancy purposes.

WHOLE FARM DATA 417
The data is represented on a £ per farm, £ per 100 ewe equivalents, £ per adjusted hectare, and % per output basis.
Average benchmarks for each farm type as well as more detailed physical and technical data are published on the FAS website, see link on page 416.
Description of Farm Types
The farm types are characterised with reference to EC typology.
The data for the farm types in England is measured and represented by standard output (SO). The data for farm types in Scotland, shown in the following pages, are distinguished by standard gross margin (SGM).
Note: Scottish data excludes specialist pig, specialist poultry and horticulture. English data excludes specialist sheep and specialist beef.
England farm types LFA grazing livestock farms: Farms with 50% or more of total area in the less favoured area and with more than two-thirds of the total SO coming from sheep and beef cattle together.
Lowland grazing livestock farms: Farms with less than 50% of total area in the less favoured area and with more than two-thirds of the total SO coming from sheep and beef cattle together.
Dairy farms: Farms where more than two-thirds of the total SO comes from dairy cows, including followers. Cereal farms: Farms where cereals, oilseeds, peas and beans harvested dry and land set a side account for more than two-thirds of the total SO.
General cropping farms: Farms with more than two-thirds of the total SO coming from arable crops (including field scale vegetables) or a mixture of arable and horticulture crops; and where arable crops account for more than one third of total SO and no other group account for more than one third.
Pig farms: Farms with more than two-thirds of the total SO coming from pigs.
Poultry farms: Farms with more than two-thirds of the total SO coming from poultry.
Horticulture farms: Other farms where more than two-thirds of the total SO comes from fruit, hardy nursery stock, glasshouse flowers and vegetables, market-garden-scale vegetables and outdoor bulbs and flowers.

WHOLE FARM DATA 418
Mixed farms: Farms where no enterprise contributes more than two-thirds of the total SO and includes a mixture of cattle and sheep and pigs and poultry.
Scotland farm types Specialist sheep (mainly hard hill): Farms in the less favoured areas with more than two-thirds of the total SGM coming from sheep.
Specialist beef (LFA): Farms in the less favoured areas with more than two-thirds of the total SGM coming from beef cattle.
Cattle and sheep (LFA): Farms in the less favoured areas with more than two-thirds of the total SGM coming from beef cattle and sheep together.
Dairy: Farms where more than two-thirds of the total SGM comes from dairy cows.
Specialist cereals: Farms where more than two-thirds of the total SGM comes from cereals and oilseeds.
General cropping: Farms where more than two-thirds of the total SGM comes from all crops.
Mixed: Farms where no enterprise contributes more than two-thirds of the total SGM.
Definition of Terms
Enterprise output Returns for an enterprise plus transfers out and the value of produce used or consumed for which no cash is receivable (by the business) less expenditure on, and transfers in of livestock. Agri environmental payments have been detailed in the English data however this was not available for Scotland. Subsidy output and diversification surplus is shown separately from enterprise output.
Variable costs Those costs, which can both be readily allocated to a specific enterprise and will vary in approximately direct proportion to changes in the scale of that enterprise. Examples of variable costs are:
Seeds, fertilisers and lime Sprays and sundry crop expenses Concentrate feeding stuffs (purchased or home-grown) Sundry livestock expenses (purchases of livestock are not treated as
variable costs but deducted in the calculation of the appropriate enterprise outputs)
Gross margin Total farm output less the sum of variable costs of the enterprises comprising the business.

WHOLE FARM DATA 419
Fixed costs Examples of fixed costs include:
Labour - regular and casual labour. Power and machinery - repairs, fuel (including drying fuel), oil,
electricity, contracting, crop and livestock haulage and leasing and hire.
Overheads - property repairs, rates, insurance, and miscellaneous (e.g. office).
Depreciation * - machinery and property depreciation Rent and finance - interest (bank, HP and loans) and rent (excluding
keep)
*
Machinery depreciation is calculated on a replacement cost basis. Rates of depreciation are intended to reflect the degree of deterioration of the asset.

WHOLE FARM DATA 420
England - LFA Grazing Livestock Farms
Lower Average Higher
£/farm £/farm £/farm
25,200 69,300 90,600
1,500 4,100 1,700
2,400 8,800 33,700
700 4,300 3,011
29,800 86,500 129,011
13,800 30,900 37,000
2,500 6,500 5,600
3,000 3,700 5,000
1,000 1,700 2,600
- 209 154
20,300 43,009 50,354
9,500 43,491 78,657
300 2,300 12,300
10,133 17,264 19,600
15,200 23,300 26,100
25,633 42,864 58,000
-16,133 627 20,657
8,700 20,000 41,400
700 2,100 4,500
- 6,733 22,727 66,557
- 99 167 227
31 109 66
68 136 293
166 372 603
20 29 32 No. of breeding cows
FARM BUSINESS INCOME
Farm Business Income £/ha
No. of farms in sample
Average farm size (ha)
No. of ewes
FARM BUSINESS INCOME
(excl. BPS and diversification)
BPS
Diversification surplus
GROSS MARGIN
FIXED COSTS
Labour
Power and machinery
Overheads
Livestock specific costs
Crop specific costs
Contract costs
Casual labour
Sundry costs
OUTPUT
Livestock
Crops
Agri-environment
Other
VARIABLE COSTS

WHOLE FARM DATA 421
England - Lowland Grazing Livestock Farms
Lower Average Higher
£/farm £/farm £/farm
25,600 64,400 79,500
2,300 11,200 13,500
1,300 3,400 6,600
3,600 4,200 7,300
32,800 83,200 106,900
12,400 27,600 27,200
3,300 8,400 8,900
4,900 6,300 7,100
500 1,000 1,500
102 200 74
21,202 43,500 44,774
11,598 39,700 62,126
2,852 4,700 4,025
11,912 17,829 18,872
18,694 24,096 27,000
33,458 46,625 49,897
-21,860 - 6,925 12,229
8,100 15,100 22,600
1,900 4,000 16,100
-11,860 12,175 50,929
- 210 126 386
43 153 90
57 97 132
46 195 187
18 23 26 No. of breeding cows
FARM BUSINESS INCOME
Farm Business Income £/ha
No. of farms in sample
Average farm size (ha)
No. of ewes
FARM BUSINESS INCOME
(excl. BPS and diversification)
BPS
Diversification surplus
GROSS MARGIN
FIXED COSTS
Labour
Power and machinery
Overheads
Livestock specific costs
Crop specific costs
Contract costs
Casual labour
Sundry costs
OUTPUT
Livestock
Crops
Agri-environment
Other
VARIABLE COSTS

WHOLE FARM DATA 422
England - Dairy Farms
Lower Average Higher
£/farm £/farm £/farm
219,900 388,900 552,800
14,000 25,600 34,100
3,300 3,100 3,100
3,900 7,900 7,400
241,100 425,500 597,400
116,600 182,800 218,000
22,300 28,600 32,700
19,500 25,300 32,000
4,800 5,100 11,900
35 88 213
163,235 241,888 294,813
77,865 183,612 302,587
21,800 42,014 38,900
38,418 56,509 59,634
57,472 82,354 99,650
117,690 180,877 198,184
- 39,825 2,735 104,403
19,900 26,300 28,500
3,400 5,800 12,400
- 16,525 34,835 145,303
- 142 225 830
62 121 63
116 155 175
118 173 231
FARM BUSINESS INCOME
Farm Business Income £/ha
No. of farms in sample
Average farm size (ha)
No. dairy cows
FARM BUSINESS INCOME
(excl. BPS and diversification)
BPS
Diversification surplus
GROSS MARGIN
FIXED COSTS
Labour
Power and machinery
Overheads
Livestock specific costs
Crop specific costs
Contract costs
Casual labour
Sundry costs
OUTPUT
Livestock
Crops
Agri-environment
Other
VARIABLE COSTS

WHOLE FARM DATA 423
England - Cereal Farms
Lower Average Higher
£/farm £/farm £/farm
6,000 10,800 3,200
87,100 180,800 188,800
2,000 6,200 4,900
9,821 30,607 23,300
104,921 228,407 220,200
4,400 4,900 1,300
47,000 80,500 73,500
9,300 15,000 18,300
900 2,500 1,900
295 900 784
61,895 103,800 95,784
43,026 124,607 124,416
8,483 17,844 8,274
33,713 51,734 35,043
40,498 72,980 46,627
82,694 142,558 89,944
- 39,668 - 17,951 34,472
21,600 39,800 39,900
3,400 19,000 31,000
- 14,668 40,849 105,372
-114 182 492
76 192 85
129 224 214
70 115 109
No. of farms in sample
Average farm size (ha)
Cereals (ha)
Overheads
FARM BUSINESS INCOME
(excl. BPS and diversification)
BPS
FARM BUSINESS INCOME
Farm Business Income £/ha
Diversification surplus
Casual labour
Sundry costs
GROSS MARGIN
FIXED COSTS
Labour
Power and machinery
OUTPUT
Livestock
Crops
Agri-environment
Other
VARIABLE COSTS
Livestock specific costs
Crop specific costs
Contract costs

WHOLE FARM DATA 424
England - General Cropping Farms
Lower Average Higher
£/farm £/farm £/farm
2,200 23,400 10,900
109,700 343,900 423,600
2,600 6,300 11,900
5,700 28,800 34,400
120,200 402,400 480,800
1,900 10,800 5,900
48,700 132,800 132,500
6,500 29,200 37,600
7,000 12,200 9,000
43 2,500 1,100
64,143 187,500 186,100
56,057 214,900 294,700
13,901 44,593 40,600
34,015 73,630 67,700
38,500 99,100 108,032
86,416 217,323 216,332
- 30,359 - 2,423 78,368
17,800 45,900 56,800
5,400 15,200 34,100
- 7,159 58,677 169,268
- 70 219 527
21 87 45
Average farm size (ha) 102 268 321
Cereals (ha) 41 114 101
Potatoes (ha) 3 10 14
Other crops (ha) 36 90 110
FARM BUSINESS INCOME
Farm Business Income £/ha
No. of farms in sample
FARM BUSINESS INCOME
(excl. BPS and diversification)
BPS
Diversification surplus
GROSS MARGIN
FIXED COSTS
Labour
Power and machinery
Overheads
Livestock specific costs
Crop specific costs
Contract costs
Casual labour
Sundry costs
OUTPUT
Livestock
Crops
Agri-environment
Other
VARIABLE COSTS

WHOLE FARM DATA 425
England - Specialist Pig Farms
Lower Average Higher
£/farm £/farm £/farm
- 460,400 561,500
- 46,600 38,800
- 2,800 2,300
- 3,049 34,500
- 512,849 637,100
- 305,500 245,800
- 16,700 10,900
- 12,000 29,800
- 1,200 3,300
- 41 96
- 335,441 289,896
- 177,408 347,204
- 55,000 69,666
- 39,705 77,711
- 73,315 79,768
- 168,020 227,145
- 9,388 120,059
- 11,900 15,400
- 7,400 4,900
- 28,688 140,359
- 410 1,337
- 42 17
- 70 105
- 249 234
- 2,908 5,035 No. of other pigs
FARM BUSINESS INCOME
Farm Business Income £/ha
No. of farms in sample
Average farm size (ha)
No. of sows
FARM BUSINESS INCOME
(excl. BPS and diversification)
BPS
Diversification surplus
GROSS MARGIN
FIXED COSTS
Labour
Power and machinery
Overheads
Livestock specific costs
Crop specific costs
Contract costs
Casual labour
Sundry costs
OUTPUT
Livestock
Crops
Agri-environment
Other
VARIABLE COSTS
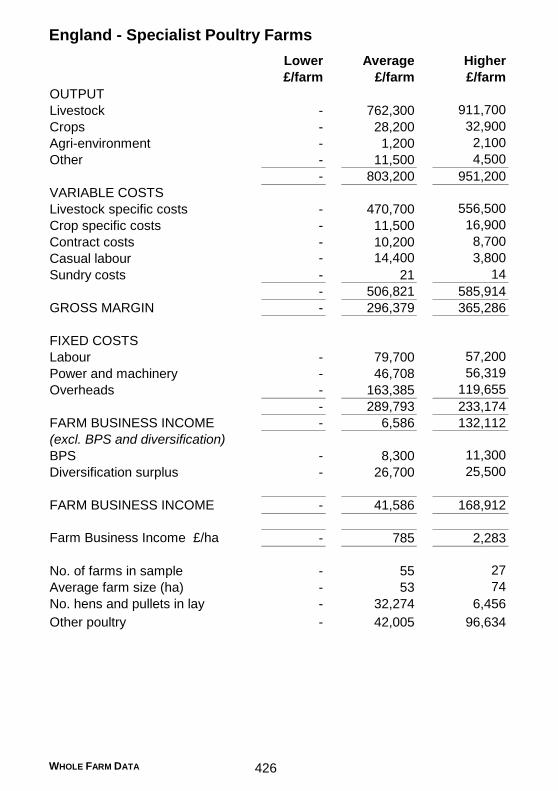
WHOLE FARM DATA 426
England - Specialist Poultry Farms
Lower Average Higher
£/farm £/farm £/farm
- 762,300 911,700
- 28,200 32,900
- 1,200 2,100
- 11,500 4,500
- 803,200 951,200
- 470,700 556,500
- 11,500 16,900
- 10,200 8,700
- 14,400 3,800
- 21 14
- 506,821 585,914
- 296,379 365,286
- 79,700 57,200
- 46,708 56,319
- 163,385 119,655
- 289,793 233,174
- 6,586 132,112
- 8,300 11,300
- 26,700 25,500
- 41,586 168,912
- 785 2,283
- 55 27
- 53 74
- 32,274 6,456
- 42,005 96,634 Other poultry
FARM BUSINESS INCOME
Farm Business Income £/ha
No. of farms in sample
Average farm size (ha)
No. hens and pullets in lay
FARM BUSINESS INCOME
(excl. BPS and diversification)
BPS
Diversification surplus
GROSS MARGIN
FIXED COSTS
Labour
Power and machinery
Overheads
Livestock specific costs
Crop specific costs
Contract costs
Casual labour
Sundry costs
OUTPUT
Livestock
Crops
Agri-environment
Other
VARIABLE COSTS

WHOLE FARM DATA 427
England - Horticulture Farms
Lower Average Higher
£/farm £/farm £/farm
1,700 300 3,100
36,100 375,800 564,100
200 1,200 800
2,200 26,017 14,800
40,200 403,317 582,800
1,000 100 900
13,000 167,500 181,500
1,300 5,600 15,700
6,000 48,700 79,100
100 200 400
21,400 222,100 277,600
18,800 181,217 305,200
7,400 81,000 78,006
10,901 24,688 40,505
11,921 73,646 72,062
30,222 179,334 190,573
-11,422 1,883 114,627
2,500 3,700 7,200
1,700 15,500 17,500
- 7,222 21,083 139,327
- 344 843 2,787
28 104 56
21 25 50
FARM BUSINESS INCOME
Farm Business Income £/ha
No. of farms in sample
Average farm size (ha)
FARM BUSINESS INCOME
(excl. BPS and diversification)
BPS
Diversification surplus
GROSS MARGIN
FIXED COSTS
Labour
Power and machinery
Overheads
Livestock specific costs
Crop specific costs
Contract costs
Casual labour
Sundry costs
OUTPUT
Livestock
Crops
Agri-environment
Other
VARIABLE COSTS

WHOLE FARM DATA 428
England - Mixed Farms
Lower Average Higher
£/farm £/farm £/farm
43,300 100,800 153,200
40,400 79,300 137,800
3,200 5,300 7,200
4,140 15,400 13,730
91,040 200,800 311,930
26,400 55,500 69,800
20,000 35,700 53,000
9,200 11,000 18,100
700 2,100 5,400
36 1,234 144
56,336 105,534 146,444
34,704 95,266 165,486
11,021 15,242 27,900
29,532 38,240 49,970
35,900 53,900 56,900
76,453 107,382 134,770
-41,749 - 12,116 30,716
18,500 25,800 40,600
3,400 9,600 14,300
-19,849 23,284 85,616
- 168 153 384
35 87 48
118 152 223
103 152 179
17 17 26
4 5 5
2 5 8
37 52 83
No. of breeding cows
No. of dairy cows
No. of sows
Cereals (ha)
FARM BUSINESS INCOME
Farm Business Income £/ha
No. of farms in sample
Average farm size (ha)
No. of ewes
FARM BUSINESS INCOME
(excl. BPS and diversification)
BPS
Diversification surplus
GROSS MARGIN
FIXED COSTS
Labour
Power and machinery
Overheads
Livestock specific costs
Crop specific costs
Contract costs
Casual labour
Sundry costs
OUTPUT
Livestock
Crops
Agri-environment
Other
VARIABLE COSTS

WHOLE FARM DATA 429
Scotland - Specialist Sheep (LFA) Farms
£/farm £/100 ee % output
35,989 5,499 38
2,806 429 3
46,411 7,091 49
3,120 477 3
6,211 949 7
94,538 14,444 100
14,542 2,222 16
1,715 261 2
16,257 2,482 17
78,281 11,960 83
Labour 2,867 438 3
7,764 1,186 8
Overheads 9,679 1,479 10
7,540 1,152 8
8,090 1,236 9
35,939 5,491 38
42,342 6,469 45
10
352
616
5
Subsidies
Diversification surplus
Power and machinery
Depreciation
Upper 25%
No. of breeding cows
No. of farms in sample
Average farm size (ha)
No. of ewes
Rent and finance
FARM PROFIT
Livestock expenses
Crop expenses
GROSS MARGIN
FIXED COSTS
OUTPUT
Livestock
Crops
Other
VARIABLE COSTS

WHOLE FARM DATA 430
Scotland - Specialist Beef (LFA) Farms
£/farm £/adj. ha % output
116,922 776 63
3,594 24 2
Subsidies 50,222 333 27
4,693 31 3
11,160 74 6
186,591 1,237 100
36,920 246 20
12,998 86 6
49,918 331 27
136,673 906 73
Labour 8,028 53 4
18,221 121 10
Overheads 16,956 112 9
24,463 162 13
6,248 41 3
73,916 490 40
62,758 416 34
26
151
185
104
Upper 25%
Diversification surplus
FARM PROFIT
OUTPUT
Livestock
Crops
Other
VARIABLE COSTS
Livestock expenses
Crop expenses
GROSS MARGIN
FIXED COSTS
Power and machinery
No. of ewes
No. of breeding cows
Depreciation
Rent and finance
No. of farms in sample
Average farm size (ha)

WHOLE FARM DATA 431
Scotland - Cattle and Sheep (LFA) Farms
£/farm £/100 ee % output
116,403 9,701 58
5,593 466 3
Subsidies 61,790 5,150 31
4,446 371 2
12,801 1,067 6
201,031 16,754 100
46,753 3,897 24
12,708 1,059 7
59,460 4,956 30
141,571 11,799 70
Labour 8,082 674 4
19,931 1,661 10
Overheads 19,280 1,607 10
21,319 1,777 11
7,913 660 4
76,524 6,378 38
65,047 5,421 32
19
235
778
56
81
Upper 25%
Diversification surplus
FARM PROFIT
No. of other cattle
No. of farms in sample
Average farm size (ha)
No. of ewes
No. of breeding cows
GROSS MARGIN
OUTPUT
Livestock
Crops
Other
VARIABLE COSTS
Livestock expenses
Crop expenses
FIXED COSTS
Power and machinery
Depreciation
Rent and finance

WHOLE FARM DATA 432
Scotland - Dairy Farms
£/farm £/adj. ha % output
422,791 2,367 86
11,559 65 3
Subsidies 39,787 222 8
3,992 22 1
16,101 90 3
494,229 2,766 100
161,715 905 32
26,480 148 4
188,194 1,053 38
306,035 1,713 62
Labour 33,080 185 7
46,055 258 9
Overheads 25,280 141 5
61,665 345 12
11,424 64 2
177,505 993 36
128,530 719 26
12
179
184
7,139
22.66
Upper 25%
Diversification surplus
FARM PROFIT
Output yield per dairy cow (lt)
Revenue value (ppl)
No. of dairy cows
Depreciation
Rent and finance
VARIABLE COSTS
Livestock expenses
FIXED COSTS
No. of farms in sample
Average farm size (ha)
Power and machinery
GROSS MARGIN
OUTPUT
Livestock
Crops
Other
Crop expenses
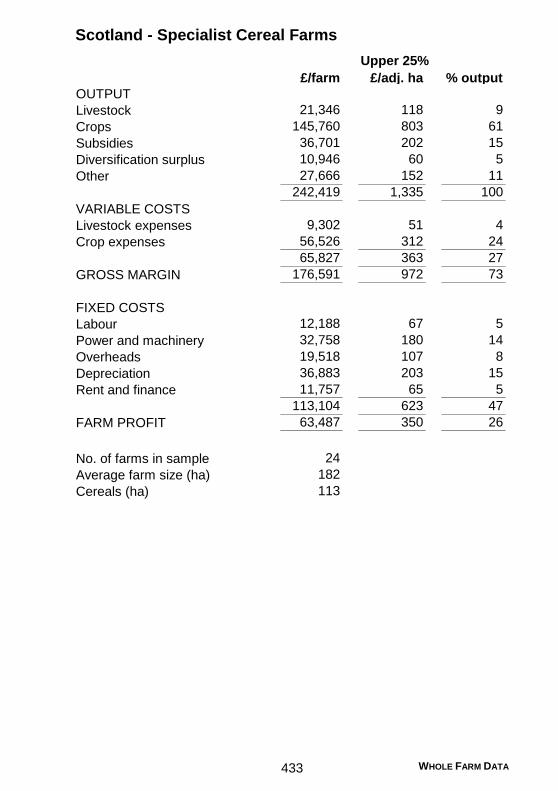
WHOLE FARM DATA 433
Scotland - Specialist Cereal Farms
£/farm £/adj. ha % output
21,346 118 9
145,760 803 61
Subsidies 36,701 202 15
10,946 60 5
27,666 152 11
242,419 1,335 100
9,302 51 4
56,526 312 24
65,827 363 27
176,591 972 73
Labour 12,188 67 5
32,758 180 14
Overheads 19,518 107 8
36,883 203 15
11,757 65 5
113,104 623 47
63,487 350 26
24
182
113
Upper 25%
Diversification surplus
FARM PROFIT
No. of farms in sample
Average farm size (ha)
Cereals (ha)
OUTPUT
Livestock
Crops
Other
VARIABLE COSTS
Livestock expenses
Crop expenses
GROSS MARGIN
FIXED COSTS
Power and machinery
Depreciation
Rent and finance
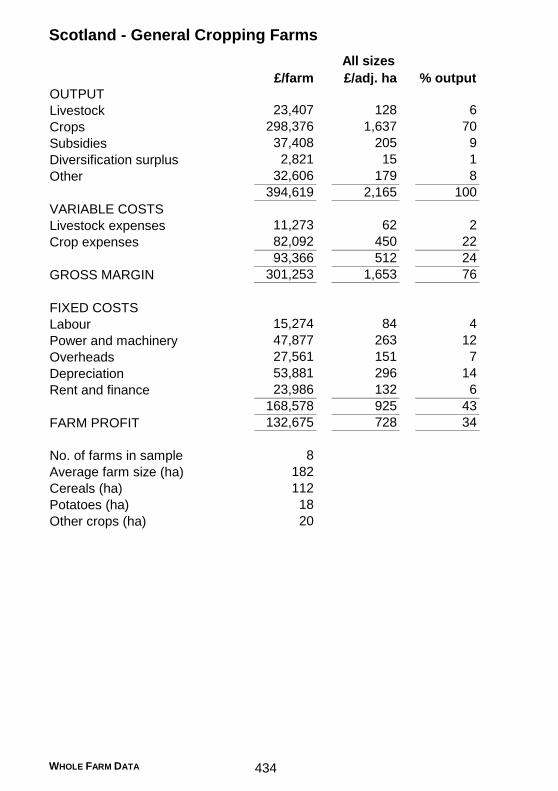
WHOLE FARM DATA 434
Scotland - General Cropping Farms
£/farm £/adj. ha % output
23,407 128 6
298,376 1,637 70
Subsidies 37,408 205 9
2,821 15 1
32,606 179 8
394,619 2,165 100
11,273 62 2
82,092 450 22
93,366 512 24
301,253 1,653 76
Labour 15,274 84 4
47,877 263 12
Overheads 27,561 151 7
53,881 296 14
23,986 132 6
168,578 925 43
132,675 728 34
8
182
112
Potatoes (ha) 18
Other crops (ha) 20
No. of farms in sample
Average farm size (ha)
Cereals (ha)
OUTPUT
Livestock
Crops
Other
FIXED COSTS
All sizes
Diversification surplus
FARM PROFIT
Power and machinery
Depreciation
Rent and finance
VARIABLE COSTS
Livestock expenses
Crop expenses
GROSS MARGIN

WHOLE FARM DATA 435
Scotland - Mixed Farms
£/farm £/adj. ha % output
119,053 620 46
74,741 390 29
Subsidies 49,251 257 19
5,074 26 2
10,465 55 4
258,585 1,348 100
39,742 208 15
36,817 191 13
76,557 399 30
182,027 949 70
Labour 10,355 54 4
29,700 155 11
Overheads 22,567 118 9
36,478 190 14
11,013 57 4
110,114 574 43
71,914 375 28
21
192
142
70
159
68
OUTPUT
Livestock
Crops
Other
Upper 25%
Diversification surplus
FARM PROFIT
No. of farms in sample
Average farm size (ha)
No.of ewes
FIXED COSTS
Power and machinery
No. of breeding cows
No. of other cattle
Cereals (ha)
Depreciation
Rent and finance
VARIABLE COSTS
Livestock expenses
Crop expenses
GROSS MARGIN


Rural Aid Schemes

RURAL AID SCHEMES 438
Introduction
The majority of support schemes available to UK farmers have their origins in the EU’s Common Agricultural Policy (CAP). Structured in two parts, Pillar 1 and Pillar II, CAP 2014-2020 provides funding to support environmental, economic and rural development.
The amount of CAP funds available from the EU was agreed within the Multi-annual Financial Framework (MFF) and for 2014-2020 is €387 billion. The funds are allocated to Member States, including the four UK devolved administrations, who have their own implementation models for delivering funding from both Pillar I and II.
In some years, if the expected Pillar I budget is likely to exceed the available funds, the European Commission implements a mechanism called Financial Discipline. This effectively reduces the total value of Pillar I payments across all Member States. In 2017 this reduction was 1.388419%.
The following sections provide an overview of the individual CAP schemes adopted in each UK administration. Relevant government websites should be viewed for more detailed information and up-to-date guidance.
Note: Although the UK’s referendum decision to leave the EU has created uncertainty over future CAP payments the UK Government has pledged to keep overall payments at the same level until 2022 or the end of the current parliament if this comes sooner.
Overview of CAP Schemes
CAP Pillar I (Direct Payments) A Basic Payment is made to eligible, active farmers and upon compliance with the EU’s three Greening requirements (detailed below) farmers also receive a Greening payment. Payments are also available to eligible farmers from the Young Farmer Scheme, National Reserve, Redistributive Payment Scheme and the Voluntary Coupled Support Schemes, subject to what was adopted by each UK administration.
Greening requirements Permanent Pasture - each UK administration’s area of permanent grassland must be maintained, i.e. the ratio of permanent grassland compared to the total agricultural area declared must not decrease by more than 5%; this is managed at a national level. At the individual farm level Environmentally Sensitive Grassland Areas must not be converted to arable production.
Crop Diversification - referred to as the “two” or “three” crop rules. If the business has 10ha or more of arable land and does not qualify for an exemption, crop diversification rules on the minimum number of crops

RURAL AID SCHEMES 439
grown and areas covered need to be followed. Exemptions are as follows:
Land certified as organic or in organic conversion. Businesses where more than 75% of the arable land is temporary
grassland, fallow, herbaceous forage or leguminous crops. Businesses where more than 75% of the eligible agricultural area is
permanent or temporary grassland or herbaceous forage, or is used for the production of crops under water for a significant part of the year or crop cycle.
If the business is not exempt and has between 10-30ha of arable land at least two different arable crops must be grown and the main crop must not cover more than 75% of the arable area.
If the business has more than 30ha of arable land at least three arable crops must be grown. The main crop must not cover more than 75% of the arable area and the two main crops together must not cover more than 95% of the arable area.
Ecological Focus Area (EFA) - businesses with arable land in excess of 15ha who do not qualify for an exemption need to ensure that 5% of this land is managed as EFA. Exemptions are as follows:
Land certified as organic or in organic conversion. Businesses where more than 75% of the arable land is used to grow
temporary grass, herbaceous forage, leguminous crops or fallow. Businesses where more than 75% of eligible agricultural area is
permanent or temporary grass or herbaceous forage, or is used for the production of crops under water for a significant part of the year or crop cycle.
A range of land uses and features can be used to meet the 5% EFA requirement, see the following sections for details of each UK administered region.
CAP Pillar II (Rural Development Programme) Overview The EU Rural Development policy is implemented through regional rural development programmes (RDPs) that deliver upon at least four of the six common EU priorities:
Fostering knowledge transfer and innovation in agriculture, forestry and rural areas.
Enhancing farm viability and competitiveness and sustainable management of forests.
Promoting food chain organisations. Restoring preserving and enhancing ecosystems. Promoting resource efficiency and supporting the shift towards a low
carbon and climate resilient economy. Promoting social inclusion, poverty reduction and economic
development in rural areas.
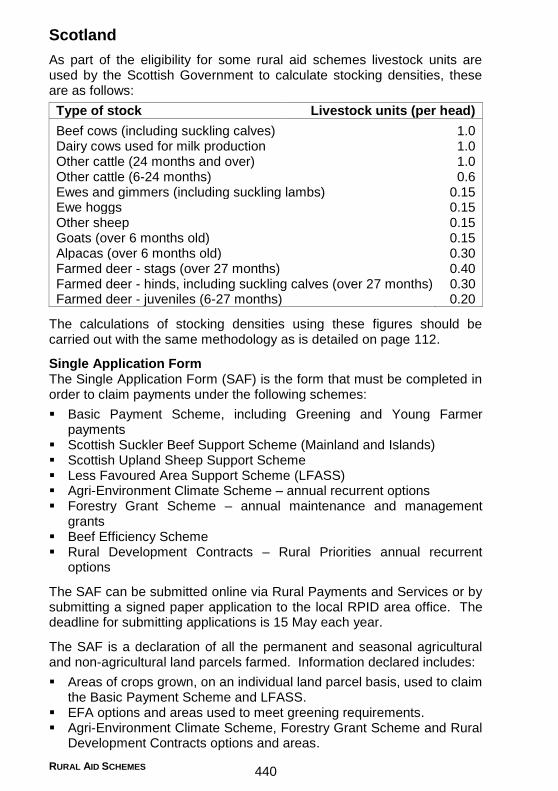
RURAL AID SCHEMES 440
Scotland
As part of the eligibility for some rural aid schemes livestock units are used by the Scottish Government to calculate stocking densities, these are as follows:
Type of stock Livestock units (per head)
Beef cows (including suckling calves) 1.0 Dairy cows used for milk production 1.0 Other cattle (24 months and over) 1.0 Other cattle (6-24 months) 0.6 Ewes and gimmers (including suckling lambs) 0.15 Ewe hoggs 0.15 Other sheep 0.15 Goats (over 6 months old) 0.15 Alpacas (over 6 months old) 0.30 Farmed deer - stags (over 27 months) 0.40 Farmed deer - hinds, including suckling calves (over 27 months) 0.30 Farmed deer - juveniles (6-27 months) 0.20
The calculations of stocking densities using these figures should be carried out with the same methodology as is detailed on page 112.
Single Application Form The Single Application Form (SAF) is the form that must be completed in order to claim payments under the following schemes:
Basic Payment Scheme, including Greening and Young Farmer payments
Scottish Suckler Beef Support Scheme (Mainland and Islands) Scottish Upland Sheep Support Scheme Less Favoured Area Support Scheme (LFASS) Agri-Environment Climate Scheme – annual recurrent options Forestry Grant Scheme – annual maintenance and management
grants Beef Efficiency Scheme Rural Development Contracts – Rural Priorities annual recurrent
options
The SAF can be submitted online via Rural Payments and Services or by submitting a signed paper application to the local RPID area office. The deadline for submitting applications is 15 May each year.
The SAF is a declaration of all the permanent and seasonal agricultural and non-agricultural land parcels farmed. Information declared includes:
Areas of crops grown, on an individual land parcel basis, used to claim the Basic Payment Scheme and LFASS.
EFA options and areas used to meet greening requirements. Agri-Environment Climate Scheme, Forestry Grant Scheme and Rural
Development Contracts options and areas.
RURAL AID SCHEMES 441
Livestock numbers on the holding on 1 March.
Within the SAF, there is also the option to claim for Young Farmer Payment, LFASS, National Reserve and the Beef Efficiency Scheme, and indicate Sterling or Euros as the chosen method of receiving funding for direct payment support.
Pillar I CAP Pillar 1 Direct Payment schemes implemented in Scotland include the Basic Payment Scheme (BPS), Young Farmer Scheme, National Reserve and Voluntary Coupled Support (i.e. Scottish Suckler Beef Support Scheme (Mainland and Islands) and Scottish Upland Sheep Support Scheme).
Basic Payment Scheme To take part in the BPS and receive funding farmers and crofters need to:
Be an active farmer and be involved in agricultural activity. Hold BPS entitlements. Submit a claim via a Single Application Form (SAF). Farm a minimum of 3ha of eligible land and have this land at their
disposal on 15 May of the claim year. Have one eligible hectare of land for each BPS entitlement. Comply with Greening and a range of Statutory Management
Requirements (SMRs) and standards on Good Agricultural and Environmental Condition (GAEC) i.e. Cross Compliance.
Keep comprehensive, accurate, and up-to-date records.
Active farming Applicants to the BPS must meet the definition of a ‘farmer’ i.e. be a natural or legal person (or a group of natural or legal persons) whose holding (production units) are situated within Scotland. They must also exercise an agricultural activity, for example the production, rearing or growing of agricultural products including harvesting, milking, breeding animals and keeping animals for farming purposes.
If the farmer or crofter has land that is naturally kept in a state suitable for cultivation and grazing there are rules on exercising a minimum activity which must also be met, see page 442-443.
Entitlements Based on the areas of eligible land claimed on the 2015 SAF, BPS Regions 1, 2 and 3 entitlements were allocated to eligible farmers and crofters. For Payment Regions 2 and 3 farmers were allocated 10% fewer entitlements than the area of land declared, this is due to a reduction co-efficient having been applied. Further information about the Payment Regions can be found in the following section.
All BPS entitlements must be used in at least one year out of two.
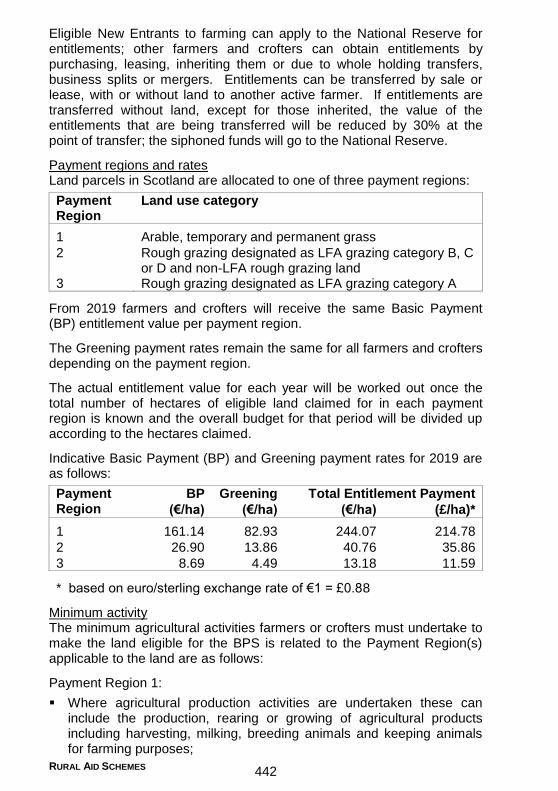
RURAL AID SCHEMES 442
Eligible New Entrants to farming can apply to the National Reserve for entitlements; other farmers and crofters can obtain entitlements by purchasing, leasing, inheriting them or due to whole holding transfers, business splits or mergers. Entitlements can be transferred by sale or lease, with or without land to another active farmer. If entitlements are transferred without land, except for those inherited, the value of the entitlements that are being transferred will be reduced by 30% at the point of transfer; the siphoned funds will go to the National Reserve.
Payment regions and rates Land parcels in Scotland are allocated to one of three payment regions:
Payment Region
Land use category
1 Arable, temporary and permanent grass
2 Rough grazing designated as LFA grazing category B, C or D and non-LFA rough grazing land
3 Rough grazing designated as LFA grazing category A
From 2019 farmers and crofters will receive the same Basic Payment (BP) entitlement value per payment region.
The Greening payment rates remain the same for all farmers and crofters depending on the payment region.
The actual entitlement value for each year will be worked out once the total number of hectares of eligible land claimed for in each payment region is known and the overall budget for that period will be divided up according to the hectares claimed.
Indicative Basic Payment (BP) and Greening payment rates for 2019 are as follows:
Payment Region
BP Greening Total Entitlement Payment
(€/ha) (€/ha) (€/ha) (£/ha)*
1 161.14 82.93 244.07 214.78
2 26.90 13.86 40.76 35.86
3 8.69 4.49 13.18 11.59
* based on euro/sterling exchange rate of €1 = £0.88
Minimum activity The minimum agricultural activities farmers or crofters must undertake to make the land eligible for the BPS is related to the Payment Region(s) applicable to the land are as follows:
Payment Region 1:
Where agricultural production activities are undertaken these can include the production, rearing or growing of agricultural products including harvesting, milking, breeding animals and keeping animals for farming purposes;

RURAL AID SCHEMES 443
Where no agricultural production activities are undertaken, the land must be maintained in a state suitable for grazing or cultivation, i.e. take action to control injurious weeds and maintain access for livestock or machinery. On permanent grassland, demonstrate the maintenance of existing stock-proof boundaries and water sources for livestock; whilst on arable land, take action to prevent encroachment of scrub.
Payment Regions 2 and 3:
The normal minimum agricultural activity is to undertake an average level of stocking of 0.05LU/ha on all hectares for 183 days in each scheme year, or where justified, a lower minimum stocking density, in terms of numbers or period, that is in line with the carrying capacity of the land or as a result of an environmental management agreement may be acceptable.
As an alternative to minimum stocking levels, an annual Environmental Assessment can be carried out.
Capping Capping is the reduction of payments above a certain level. All Basic Payment Scheme and Voluntary Coupled Support Scheme payments over €150,000 will be reduced by 5%.
Greening The three standard EU greening measures apply in Scotland as well as an additional requirement to prepare a Permanent Grassland Nitrogen Fertiliser and Lime Plan.
Permanent grassland - will be monitored across Scotland. The Nitrogen Fertiliser and Lime Plan must detail how much inorganic nitrogen fertiliser and lime that is intended to be applied to land parcels that contain permanent grassland (PGRS) or open grazed woodland (WDG). Parcels that also contain areas of arable and/or rough grazing do not need to be included. The plan must be prepared by 9 June each year, retained on the farm and made available on request to any inspector as part of the land inspection or validation of the SAF.
Crop diversification - farmers in Scotland are required, unless they are exempt, to follow the requirements as set out in the introduction on page 438-439.
Ecological Focus Areas (EFAs) - farmers in Scotland are required, unless they are exempt, to follow the requirements as set out in the introduction on page 439.
There are seven EFA options that can be used in Scotland to contribute to farmers or crofters EFA commitments. Each option must be located on, adjacent to, or within 5m of arable land and are weighted according to the level of environmental benefit they deliver, see the following table.

RURAL AID SCHEMES 444
EFA option
Location Weighting factor
EFA area
Fallow land (/ha) On arable land 1 1ha
Margins
(/ha)
On, adjacent to, or within 5m of arable land or contiguous to a claimed EFA option
1.5 1.5ha
Nitrogen-fixing crops (/ha) On arable land 0.7 0.7ha
Catch crop (/ha) On arable land 0.3 0.3ha
Green cover (/ha) On arable land 0.3 0.3ha
Agro-forestry land (/ha) Eligible land 1 1ha
Hedges – right to claim whole hedge
(/1m)
On, adjacent to or within 5m of arable land or contiguous to a claimed EFA option
10
10m2
Hedges – right to claim half hedge
(/1m)
On, adjacent to or within 5m of arable land or contiguous to a claimed EFA option
5
5m2
Full details on Scottish greening measures and requirements can be found at the following webpage: https://www.ruralpayments.org/publicsite/futures/topics/all-schemes/basic-payment-scheme/
Young Farmer Payment Young farmers are entitled to a top-up payment of 25% of the average value of BP entitlements.
To qualify the applicant must be:
A sole trader or head of the farm business and be less than 41 years of age on 31 December of the first year they apply to the BPS. For businesses where the young farmer is head of the business, this means that person is the main shareholder/partner in the business, takes the majority share of any profits and makes the key business decisions.
This payment is limited to 90ha and is payable until 2019.
The Young Farmer payment is applied for on the SAF and evidence of eligibility will also need to be submitted i.e. date of birth, % share of business profits.
National Reserve The National Reserve will be used to allocate BPS entitlements to eligible:

RURAL AID SCHEMES 445
Young farmers - farmers or crofters who are less than 41 years of age on 31 December of the year of application and are setting up for the first time an agricultural holding as head of the holding.
New entrants - farmers or crofters who started their farming activity in 2013 or later, who have not had any agricultural activity in their own name or at their own risk in the five years before the start of their current farming action.
There is no paper application for the National Reserve; applications must be completed online at the same time as the SAF. Successful applicants to the National Reserve in 2015, or subsequent years, will not be able to apply for any more BPS entitlements from the 2019 National Reserve.
BPS entitlements awarded from the National Reserve must, over a two year period be used in at least one year.
Voluntary Coupled Support The Scottish Government use coupled payments to support the beef and sheep sectors. To claim for coupled payments applicants must complete a SAF each year; the Main Location Code used in the coupled payments claim forms must be the same as the one on the SAF.
Scottish Suckler Beef Support Scheme - Mainland and Islands (SSBSS) Payments are made on owned or leased homebred calves that are at least 75% beef bred. The calves must be born on or after 2 December in the year before the claim is made and remain on the holding of birth for at least 30 days. Payment rates for the 2015 to 2017 scheme years were as follows:
£/calf Mainland Islands
2015 1 74.63 90.80
2016 2 90.80 138.80
2017 3 98.11 142.22
1
based on financial discipline rate of 1.393041 and euro/sterling exchange rate of 0.73129
2
based on financial discipline rate of 1.35391 and euro/sterling exchange rate of 0.85228
3
based on financial discipline rate of 1.388419 and euro/sterling exchange rate of 0.89470
Actual payment rates for 2018 will depend on the total number of eligible calves claimed.
Claims can be made online or by post until 31 December each year.
Scottish Upland Sheep Support Scheme (SUSSS) To qualify for the scheme, 80% or more of the agricultural land must be in Payment Region 3 and less than 200ha of the agricultural land must be in Payment Region 1. Payments are made on homebred ewe hoggs that

RURAL AID SCHEMES 446
are retained on the holding (including away winterings) from 17 October in the year claimed to 31 March the following year. Ewe hoggs must be less than 12 months old at the start of the retention period. Payment rates for the 2015 to 2017scheme years were as follows:
£/hogg
2015 1 56.33
2016 2 64.80
2017 3 62.35
1
based on financial discipline rate of 1.393041 and euro/sterling exchange rate of 0.73129
2
based on financial discipline rate of 1.35391 and euro/sterling exchange rate of 0.85228
3
based on financial discipline rate of 1.388419 and euro/sterling exchange rate of 0.89470
Actual payment rates for 2018 will depend on the total number of eligible hoggs claimed.
Claims can be made online or by post between 1 September and 16 October each year.
Pillar II The Scottish Rural Development Programme (SRDP) 2014-2020 will be used to deliver on the following priorities:
Enhancing the rural economy. Supporting agricultural businesses. Protecting and improving the natural environment. Addressing the impact of climate change. Supporting rural communities.
Support that is available under the SRDP is detailed in the following pages. Full details of the schemes, including further information on payments rates and application deadlines can be found at: https://www.ruralpayments.org/publicsite/futures/topics/all-schemes/
Less Favoured Area Support Scheme (LFASS) This scheme provides essential support to fragile farming businesses in remote and constrained rural areas. For 2019 the current scheme will continue but hill farmers and crofters in the most fragile and remote areas will receive a payment of 80% of their current LFASS payment rates, which is the maximum that EU rules allow.
LFASS is an area based scheme claimed for on the SAF at the same time as claiming for the BPS and is paid to applicants who actively farm forage land in the LFA area which has been given a grazing category. The main eligibility criteria include:
Declaring at least 3ha of eligible land on the SAF.
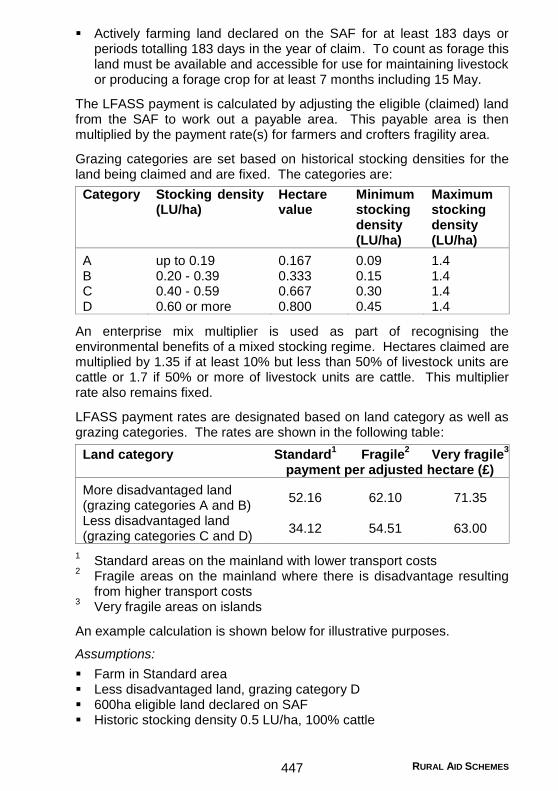
RURAL AID SCHEMES 447
Actively farming land declared on the SAF for at least 183 days or periods totalling 183 days in the year of claim. To count as forage this land must be available and accessible for use for maintaining livestock or producing a forage crop for at least 7 months including 15 May.
The LFASS payment is calculated by adjusting the eligible (claimed) land from the SAF to work out a payable area. This payable area is then multiplied by the payment rate(s) for farmers and crofters fragility area.
Grazing categories are set based on historical stocking densities for the land being claimed and are fixed. The categories are:
Category Stocking density (LU/ha)
Hectare value
Minimum stocking density (LU/ha)
Maximum stocking density (LU/ha)
A up to 0.19 0.167 0.09 1.4 B 0.20 - 0.39 0.333 0.15 1.4 C 0.40 - 0.59 0.667 0.30 1.4 D 0.60 or more 0.800 0.45 1.4
An enterprise mix multiplier is used as part of recognising the environmental benefits of a mixed stocking regime. Hectares claimed are multiplied by 1.35 if at least 10% but less than 50% of livestock units are cattle or 1.7 if 50% or more of livestock units are cattle. This multiplier rate also remains fixed.
LFASS payment rates are designated based on land category as well as grazing categories. The rates are shown in the following table:
Land category Standard1 Fragile
2 Very fragile
3
payment per adjusted hectare (£)
More disadvantaged land (grazing categories A and B)
52.16 62.10 71.35
Less disadvantaged land (grazing categories C and D)
34.12 54.51 63.00
1 Standard areas on the mainland with lower transport costs
2 Fragile areas on the mainland where there is disadvantage resulting from higher transport costs
3 Very fragile areas on islands
An example calculation is shown below for illustrative purposes.
Assumptions:
Farm in Standard area Less disadvantaged land, grazing category D 600ha eligible land declared on SAF Historic stocking density 0.5 LU/ha, 100% cattle
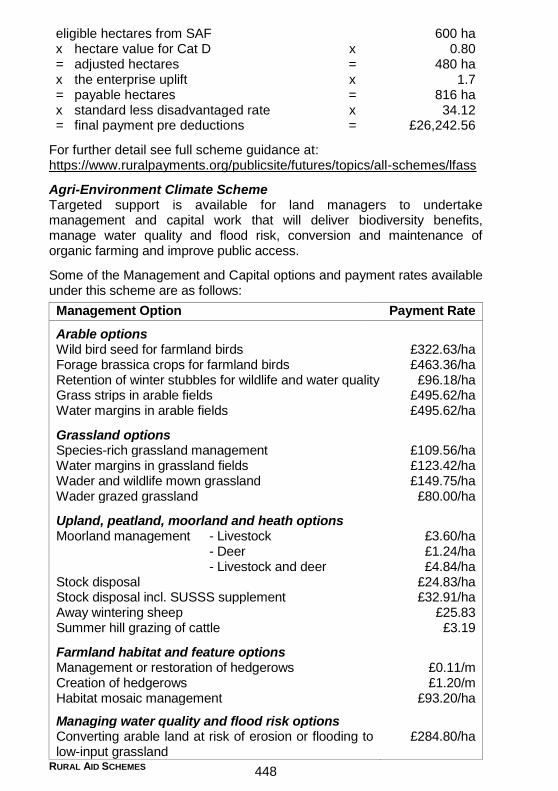
RURAL AID SCHEMES 448
eligible hectares from SAF 600 ha x hectare value for Cat D x 0.80 = adjusted hectares = 480 ha x the enterprise uplift x 1.7 = payable hectares = 816 ha x standard less disadvantaged rate x 34.12 = final payment pre deductions = £26,242.56
For further detail see full scheme guidance at: https://www.ruralpayments.org/publicsite/futures/topics/all-schemes/lfass
Agri-Environment Climate Scheme Targeted support is available for land managers to undertake management and capital work that will deliver biodiversity benefits, manage water quality and flood risk, conversion and maintenance of organic farming and improve public access.
Some of the Management and Capital options and payment rates available under this scheme are as follows:
Management Option Payment Rate
Arable options Wild bird seed for farmland birds £322.63/ha Forage brassica crops for farmland birds £463.36/ha Retention of winter stubbles for wildlife and water quality £96.18/ha Grass strips in arable fields £495.62/ha Water margins in arable fields £495.62/ha
Grassland options Species-rich grassland management £109.56/ha Water margins in grassland fields £123.42/ha Wader and wildlife mown grassland £149.75/ha Wader grazed grassland £80.00/ha
Upland, peatland, moorland and heath options Moorland management - Livestock £3.60/ha - Deer £1.24/ha - Livestock and deer £4.84/ha Stock disposal £24.83/ha Stock disposal incl. SUSSS supplement £32.91/ha Away wintering sheep £25.83 Summer hill grazing of cattle £3.19
Farmland habitat and feature options Management or restoration of hedgerows £0.11/m Creation of hedgerows £1.20/m Habitat mosaic management £93.20/ha
Managing water quality and flood risk options Converting arable land at risk of erosion or flooding to low-input grassland
£284.80/ha

RURAL AID SCHEMES 449
Capital Option Payment Rate
Stock fence £5.50/m Gate for stock fence £170/gate Deer fence £8.50/m Gate for deer fence £215/gate Planting or replanting of hedges £5.40/m Rabbit proofing an existing or new stock or deer fence £2.00/m Creation of species-rich grassland £754.52/ha Creation of low input grassland £333.51/ha Creation of grass strips & water margins in arable fields £333.51/ha Creation of wild bird seed for farmland birds £232.24/ha Cutting of rush pasture £8.45/ha
Creation of wader scrapes
£56/scrape (20-40m2)
£93.33/scrape (>40m
2)
Livestock crossings
£222/bridge (<2.6m) £880/bridge (>2.6m)
Livestock tracks £11/m2
The above list is not exhaustive. For farm holding specific and/or a full list of management options and capital items see https://www.ruralpayments.org/publicsite/futures/topics/all-schemes/agri-environment-climate-scheme/
Forestry Grant Scheme Funding is available for woodland creation, agroforestry, tree health, woodland improvement, sustainable management of forests, harvesting, and processing of forest products, forest infrastructure and co-operation (see Forestry and Farm Woodlands section on page 293 for more details).
New Entrants Support Schemes Three schemes available to help new entrants are the Young Farmers Start-up Grant Scheme, the New Entrant Start-up Grant Scheme and the New Entrants Capital Grant Scheme. These schemes are all closed.
The Young Farmers Start-up Grant Scheme is aimed at those who are starting an agricultural business for the first time or who are taking over an existing agricultural business. The grant available is €70,000 paid in two instalments; an initial payment of €63,000 and a second payment of €7,000 when the milestones in the business plan are reached.
The New Entrant Start-up Grant Scheme is aimed at those who started their agricultural business in the last 12 months. The grant available is €15,000, paid in two instalments; an initial payment of €12,000 and a second payment of €3,000 when the milestones in the business plan are reached.

RURAL AID SCHEMES 450
Funding from the above two schemes will be paid in sterling at the appropriate exchange rate and can be used to help with the costs associated with starting up an agricultural business, for example purchasing land, equipment, machinery or livestock, or constructing buildings or infrastructure.
The New Entrants Capital Grant Scheme provides grant for those that are new to farming to make improvements to their agricultural business and to help promote sustainable development. Funding of up to £25,000 for individuals and £125,000 for groups can be used for construction or improvements of agricultural buildings, investment in land management and drainage, slurry stores, equipment, infrastructure, amenities and electrical equipment.
Beef Efficiency Scheme The Beef Efficiency Scheme is a climate change scheme that aims to help beef breeders improve the efficiency, sustainability and quality of their beef herd. The scheme will deliver a range of improvements by focusing on cattle genetics and management practice. In return for keeping calving records, taking tissue samples of 20% of the calves born and preparing a farm carbon audit payments equivalent to £32/calf will be paid for the first three years. Payments will be made on an area basis of £48/ha. Farmers and crofters are also required to engage with a free advisory service to help identify farm improvements. This scheme is closed to new applicants.
Crofting Agricultural Grant Scheme This scheme provides grants for crofters to make improvements to their crofts and help to sustain their businesses. Funds of up to £25,000 for individual crofters and £125,000 for groups of crofters can be used for capital projects, such as the construction or improvement of agricultural buildings and for the establishment of Common Grazings Committees. Funding for eligible capital projects can cover all aspects of the project, including the cost of materials, transportation of materials, costs of contractors and own labour. See pages 260-261 for more detail.
Croft House Grant Scheme This scheme provides grants for crofters to improve and maintain the standards of crofter housing, with the aim of attracting and retaining people within the crofting areas of Scotland. Funding of 40% of the costs up to a maximum of £38,000 in high priority areas and up to £28,000 in standard priority areas can be used for major repairs, internal improvements and rebuilding work. See pages 261-262 for more detail.
Small Farms Support Scheme This scheme provides support to eligible farmers or crofters for investments related to development, modernisation or adaptation of small farms, i.e. holdings that have between 3 and 30ha of eligible agricultural area. To be eligible total gross income for sole traders should be no more than £30,700 and £41,000 for partnerships or groups. Funds of up to £25,000 for

RURAL AID SCHEMES 451
individuals and £125,000 for groups can be used to erect or improve agricultural buildings, provision of slurry stores, field drainage, handling facilities, shelter belts, electrical equipment and for access. See page 262 for more detail.
Food Processing, Marketing and Co-operation Scheme Start-up grants for new enterprises and business development grants for existing businesses are available for Small and Medium-Sized Enterprises (SMEs). Funding can be used to help development or creation of food processing facilities, including buildings and equipment, marketing of products, running co-operative ventures and improving supply-chain efficiency. Capital and non-capital grant rates of up to 70% are available depending on the size of the business and the activity or products the business produces.
Knowledge Transfer and Innovation Fund This scheme aims to promote skills development and knowledge transfer in the primary agricultural sector and deliver on-the-ground improvements in agricultural competitiveness, resource efficiency, environmental performance and sustainability. Funding is available to organisations to deliver vocational training, coaching, workshops, courses and farm visits designed to develop skills and transfer knowledge, and for the running of operational groups who are working collaboratively.
SRDP Farm Advisory Service The Farm Advisory Service (FAS) provides one-to-one and one-to-many advice and support, aimed at increasing the profitability and sustainability of farms and crofts.
The one-to-one component comprises of:
Integrated land Management Plans (ILMPs) and specialist advice Mentoring of new entrants Carbon audits
Funding of 80% (up to a maximum of £1,200) is available to help cover the costs of the preparation of an ILMP. Additional funds of up to £1,800 are also available for two specialist advice plans and up to £500 for the preparation of a carbon audit.
The one-to-many component of the FAS delivers innovative and integrated advice to crofters and farmers via:
Scotland wide events i.e. workshops, network farm meetings, conferences and training courses.
Publications i.e. technical notes, newsletters. Crofts and small farms subscription service. A national advice line which operates between 9am and 5pm Monday to
Friday (tel: 0300 323 0161).

RURAL AID SCHEMES 452
LEADER LEADER supports multi-sectoral community-based development. It helps individuals, communities and businesses to come together to design and implement Local Development Strategies. These strategies include actions focussed on climate change, enhancement of rural services and facilities (including transport initiatives), enhancement of natural/cultural heritage, tourism and leisure, and food and drink initiatives (for example, short supply chains, community food). The funding is focussed on objectives specific to local areas as set out in a Local Action Group strategy.
Broadband This scheme is aimed at helping communities across rural Scotland to co-ordinate demand for broadband access by joining together with other community groups to deliver a broadband solution for their area. This scheme is administered by Community Broadband Scotland.
England
Pillar I CAP Pillar I Direct Payment Schemes implemented in England include the Basic Payment Scheme (BPS), Young Farmer Scheme and the National Reserve.
Basic Payment Scheme To apply to the BPS and receive funding eligible farmers need to:
Submit a BPS application either online using the Rural Payments service or on paper using a BP5 application form.
Have at least 5ha of eligible land at their disposal on 15 May of the claim year.
Declare one eligible hectare of land for each BPS entitlement. Qualify as ‘active farmers’. Follow Greening and Cross Compliance rules.
Entitlements BPS entitlements were allocated to eligible farmers in 2015 and must be used at least once in every 2 years.
Entitlements can be transferred by sale or gift, by lease or sub lease, through inheritance or as part of a business merger or split.
New and young farmers who do not have BPS entitlements will be able to apply to the National Reserve or lease or purchase entitlements.
Payment regions and rates England has three payment regions:
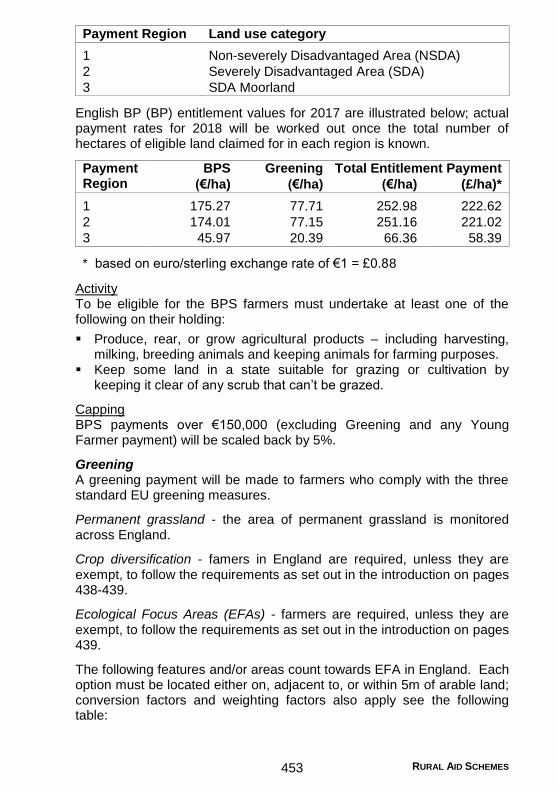
RURAL AID SCHEMES 453
Payment Region Land use category
1 Non-severely Disadvantaged Area (NSDA)
2 Severely Disadvantaged Area (SDA)
3 SDA Moorland
English BP (BP) entitlement values for 2017 are illustrated below; actual payment rates for 2018 will be worked out once the total number of hectares of eligible land claimed for in each region is known.
Payment Region
BPS Greening Total Entitlement Payment
(€/ha) (€/ha) (€/ha) (£/ha)*
1 175.27 77.71 252.98 222.62
2 174.01 77.15 251.16 221.02
3 45.97 20.39 66.36 58.39
* based on euro/sterling exchange rate of €1 = £0.88
Activity To be eligible for the BPS farmers must undertake at least one of the following on their holding:
Produce, rear, or grow agricultural products – including harvesting, milking, breeding animals and keeping animals for farming purposes.
Keep some land in a state suitable for grazing or cultivation by keeping it clear of any scrub that can’t be grazed.
Capping BPS payments over €150,000 (excluding Greening and any Young Farmer payment) will be scaled back by 5%.
Greening A greening payment will be made to farmers who comply with the three standard EU greening measures.
Permanent grassland - the area of permanent grassland is monitored across England.
Crop diversification - famers in England are required, unless they are exempt, to follow the requirements as set out in the introduction on pages 438-439.
Ecological Focus Areas (EFAs) - farmers are required, unless they are exempt, to follow the requirements as set out in the introduction on pages 439.
The following features and/or areas count towards EFA in England. Each option must be located either on, adjacent to, or within 5m of arable land; conversion factors and weighting factors also apply see the following table:
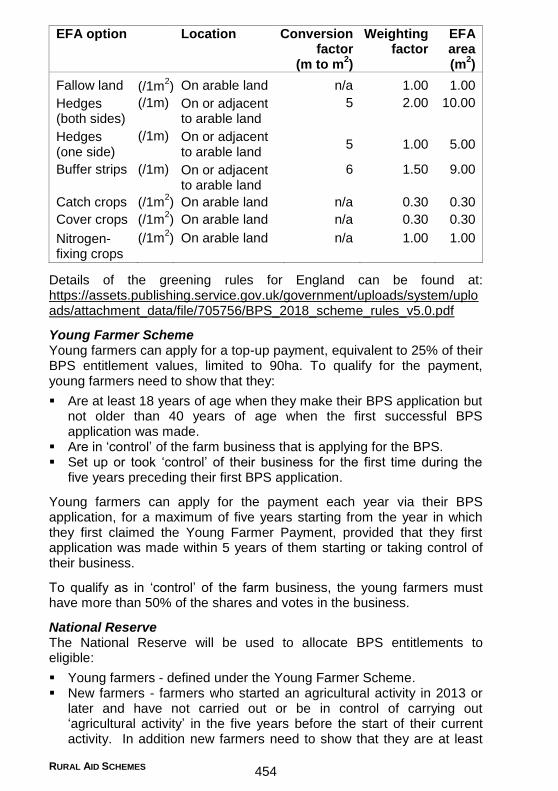
RURAL AID SCHEMES 454
EFA option Location Conversion factor
(m to m2)
Weighting factor
EFA area (m
2)
Fallow land (/1m2) On arable land n/a 1.00 1.00
Hedges (both sides)
(/1m)
On or adjacent to arable land
5
2.00
10.00
Hedges (one side)
(/1m)
On or adjacent to arable land
5 1.00 5.00
Buffer strips
(/1m)
On or adjacent to arable land
6
1.50
9.00
Catch crops (/1m2) On arable land n/a 0.30 0.30
Cover crops (/1m2) On arable land n/a 0.30 0.30
Nitrogen-fixing crops
(/1m2)
On arable land
n/a
1.00
1.00
Details of the greening rules for England can be found at: https://assets.publishing.service.gov.uk/government/uploads/system/uploads/attachment_data/file/705756/BPS_2018_scheme_rules_v5.0.pdf
Young Farmer Scheme Young farmers can apply for a top-up payment, equivalent to 25% of their BPS entitlement values, limited to 90ha. To qualify for the payment, young farmers need to show that they:
Are at least 18 years of age when they make their BPS application but not older than 40 years of age when the first successful BPS application was made.
Are in ‘control’ of the farm business that is applying for the BPS. Set up or took ‘control’ of their business for the first time during the
five years preceding their first BPS application.
Young farmers can apply for the payment each year via their BPS application, for a maximum of five years starting from the year in which they first claimed the Young Farmer Payment, provided that they first application was made within 5 years of them starting or taking control of their business.
To qualify as in ‘control’ of the farm business, the young farmers must have more than 50% of the shares and votes in the business.
National Reserve The National Reserve will be used to allocate BPS entitlements to eligible:
Young farmers - defined under the Young Farmer Scheme. New farmers - farmers who started an agricultural activity in 2013 or
later and have not carried out or be in control of carrying out ‘agricultural activity’ in the five years before the start of their current activity. In addition new farmers need to show that they are at least

RURAL AID SCHEMES 455
18 years old when they make their BPS application and are in ‘control’ of the business.
Further details of the Young Farmer Scheme and the National Reserve can be found at: https://assets.publishing.service.gov.uk/government/uploads/system/uploads/attachment_data/file/705756/BPS_2018_scheme_rules_v5.0.pdf
Pillar II The Rural Development Programme for England 2014-2020 provides funds to:
Improve the environment. Increase the productivity of farming and forestry. Grow the rural economy.
Support available under England’s Rural Development Programme includes the following:
Countryside Stewardship Funding and capital grants are available for farmers and land managers to undertake targeted management actions to support biodiversity, forestry and water quality. The Country Stewardship has 3 main elements, mid tier, higher tier and capital grants.
Mid Tier The Mid Tier offers options and capital items to achieve simple environmental benefits, for example reducing diffuse water pollution and improving the farmed environment for farmland birds and pollinators. There are no options or capital items for woodland or educational access in the Mid Tier.
Higher Tier The Higher Tier provides funding for a full range of options and capital grants for the most environmentally important site, commons and woodlands. One-to-one advice and support from Natural England and/or Forestry Commission advisers is available to help farmers with their agreements.
Capital Grants Capital grants that benefit the environment are available such as funding for hedgerows and boundaries, woodland support, historic building restoration and planning for more complex Higher Tier agreements, including feasibility studies and implementation plans.
Free advice and training to reduce diffuse pollution from agriculture in selected areas in England is also provided via Catchment Sensitive Farming (CSF). The aim of the advice is to improve the environmental performance of farms. Water quality capital grants are also available in target areas through the Countryside Stewardship Mid Tier application process.

RURAL AID SCHEMES 456
Water Environment Grant Funding is available for organisations and land managers to improve the water environment in rural England. Project proposals must help to achieve the objectives of the River Basin Management Plans and/or sites that are referred to as ‘water dependent designated sites’.
Countryside Productivity Scheme The Countryside Productivity Scheme provides funding for projects that improve productivity in the farming and forestry sectors and help create jobs and growth in the rural economy. Support is available for water resource management and reservoirs, improving forestry productivity, adding value to Agri-food, improving farm productivity and small grants.
England Coast Path Establishment Fund (ECPEF) Funding is available to land owners, land managers and access authorities to help with ‘establishment work’ for the England Coast Path. The grant will cover 100% of the establishment costs and will pay for items such as signs, gates and access management i.e. drainage, surfacing works, cutting, and planting.
Growth Programme Funding is available for business development, food processing and rural tourism infrastructure. To be eligible projects will need to create jobs or bring more money into the rural economy.
LEADER Funding is available to local businesses, communities, farmers, foresters and land managers for projects that create jobs, increase business growth and benefit the rural economy. LEADER funding is delivered through Local Action Groups (LAGs); projects must support one or more of the following - support micro and small businesses and farm diversification, boost rural tourism, increase farm productivity, increase forestry productivity, provide rural services and/or provide cultural and heritage activities.
Full details of the scheme rules, grant funding rates and application windows can be found at: https://www.gov.uk/topic/farming-food-grants-payments/rural-grants-payments
Wales
Pillar I CAP Pillar 1 Direct Payment schemes implemented in Wales are the Basic Payment Scheme (BPS), Redistributive Payment Scheme, Young Farmer Scheme and the National Reserve.
Basic Payment Scheme To apply to the BPS and receive funding farmers need to:

RURAL AID SCHEMES 457
Submit an on-line Single Application Form before the 15 May deadline.
Have at least 5ha of eligible land at their disposal on 15 May of the claim year.
Have one eligible hectare of land for each BPS entitlement. Be an ‘active farmer’. Follow Greening and Cross Compliance rules.
Entitlements BPS entitlements were allocated in 2015 to eligible farmers and can be transferred by sale or lease but only to another ‘active’ farmer. All BPS entitlements must be used in at least one year out of two.
New entrants and young farmers who do not have BPS entitlements will be able to apply to the National Reserve, or lease, or purchase entitlements.
Payment regions and rates Wales has a single payment region. Indicative BPS payments for 2019 are as follows:
Payment Region
Land use category Estimated Payment
(€/ha) (£/ha)*
1 n/a - single region 176 154.88
* based on euro/sterling exchange rate of €1 = £0.88
Activity To be eligible for the BPS farmers must exercise agricultural activity by one or more of the following:
Producing, rearing or growing agricultural products including harvesting, milking, breeding animals and keeping animals for farming purposes.
Maintaining an agricultural area in a state which makes it suitable for grazing or cultivation i.e. control non-native invasive weeds and scrub, ensure land has stock proof boundaries and a water source for livestock.
Carry out ‘minimum activity’ in areas that are ‘naturally’ kept in a suitable state for grazing or cultivation i.e. on saltmarsh and coastal sand dunes either adhere to an average annual stocking density of 0.01-0.05 LU/ha or control non-native invasive weeds and scrub.
Capping BPS payments are capped as illustrated in the table below:
Annual BPS payment (€) Capping (%)
150,000 - 200,000 15 200,000 - 250,000 30 250,000 - 300,000 55 300,000 + 100

RURAL AID SCHEMES 458
Greening payments and payments under the Young Farmers Scheme will not be subject to capping. Wage related costs will not be deducted prior to calculating the deduction.
Greening A greening payment will be made to farmers who comply with the three standard EU greening measures.
Permanent grassland - the area of permanent grassland will be monitored across Wales.
Crop diversification - farmers in Wales will be required, unless they are exempt, to follow the requirements as set out in the introduction on pages 438-439.
Ecological Focus Area (EFA) - farmers will be required, unless they are exempt, to follow the requirements as set out in the introduction on pages 439.
The following land uses and features count towards EFA in Wales. Each option, with the exception of short rotation coppice and afforested areas must be located either on or adjacent to arable land. Conversion and weighting factors also apply as illustrated in the following table:
EFA option Location Conversion factor
(m to m2)
Weighting factor
EFA area (m
2)
Fallow land (/1m2) On arable land n/a 1.00 1.00
Hedges or wooded strips
(/1m)
On or adjacent to arable land
5
2.00
10.00
Traditional stone walls
(/1m)
On or adjacent to arable land
1
1.00
1.00
Short rotation coppice
(/1m2)
Eligible land
n/a
0.30
0.30
Afforested land
(/1m2)
Eligible land
n/a
1.00
1.00
Nitrogen-fixing crops
(/1m2)
On arable land
n/a
1.00
1.00
Redistributive Payment A ‘top-up’ payment covering the first 54ha is made to eligible farmers.
Young Farmer Scheme Qualifying young farmers receive a Young Farmer payment on up to 25ha. The payment is available to sole traders and members of partnerships or limited companies who are no more than 40 years of age in the year they apply and:
Are setting up for the first time as head of the holding, or
RURAL AID SCHEMES 459
Have taken control (i.e. set up a new business or taken over an existing business) of a Partnership or Limited Company during the 5 years before submitting their first BPS application.
National Reserve The National Reserve is available to ensure new entrants to agriculture and young farmers receive entitlements.
To qualify as a New Entrant, farmers:
Cannot have had any agricultural activity in their own name or at their own risk in the 5 years before the start of their current agricultural activity.
Must have started their current agricultural activity in 2016 or a later year.
To qualify as a Young Farmer, farmers must be:
40 years of age or less in 2018 (and at least 18 years old for partnerships or sole traders or 16 years old for a Limited Company).
Setting up for the first time as head of holding or have control of a Partnership or Limited Company for the first time on 1 January 2014 or later. This could be setting up a new business or taking over an existing business.
Full details can be found at: https://beta.gov.wales/rural-grants-payments
Pillar II The Welsh Government Rural Communities - Rural Development Programme 2014-2020 focuses on:
Competitiveness (on farm and through the supply-chain). The Environment (agri-environmental work, woodland, renewable
energy). Community (access to service and the LEADER approach).
Schemes available under the Welsh RDP include:
Glastir Glastir is the Welsh Government’s main sustainable land management scheme and includes provisions for capital works supporting sustainable uplands, woodland management, creation and restoration, targeted environmental intervention, organic conversion and maintenance, and effective engagement with land managers.
Farm Business Grant The Farm Business Grant (FBG) helps farmers in Wales to improve the economic and environmental performance of their agricultural holdings. Up to a maximum of £12,000 per business is available towards capital investments in equipment and machinery that have been identified as having clear and quantifiable benefits to the farm business.

RURAL AID SCHEMES 460
Sustainable Production Grant The Sustainable Production Grant provides farmers funding for capital investments to help improve the economic and environmental performance of their agricultural holdings. Grants can be used to invest in facilities and equipment that relate to animal health and welfare, crop storage, production housing and handling, renewable energy production and soil and crop management. The maximum grant rate for any individual investment project is 40% of the total investment cost, regardless of the size of the enterprise and location.
Timber Business Investment Scheme This scheme provides financial assistance to private forest owners, local authorities and small/medium sized enterprises (SMEs), community organisations or forestry contractors for capital investments that add value to forests. The grant can be used to improve harvesting, processing and marketing of wood products.
Co-operation and Supply Chain Development Scheme This scheme provides support for groups of co-operating entities to undertake new joint projects. It provides support for the full scope of a project. The grant can be used to support the development of new products, practices, processes and technologies in the agriculture, forestry and food sectors.
Rural Community Development Fund Support is available primarily for community-based organisations to support projects in key rural priority sectors. Supported projects include drawing up of community and village development plans, investments in small scale infrastructure including renewable energy, investments in ICT including broadband and digital inclusion, improving access to services such as childcare, rural transport and financial advice, investments in recreational, tourist infrastructure and activities to improve health and quality of life.
Knowledge Transfer and Innovation Scheme This scheme is an integrated programme of knowledge transfer, innovation and advisory services delivered by Farming Connect. It aims to supply farming and forestry businesses with focussed support and advice to help them develop their business. The scheme funds demonstration activities, information actions, workshops, training, coaching and mentoring. Advice through the farm advisory service is also available on a one-to-one or group basis.
Sustainable Management Scheme This scheme provides financial support for activities that improve the management of natural resources and contributes to the well-being of rural communities. It offers grants of £10,000 to £5,000,000 to help start up and facilitate new collaborations through to landscape-scale ambition co-ordinating actions that will improve natural resources, reduce
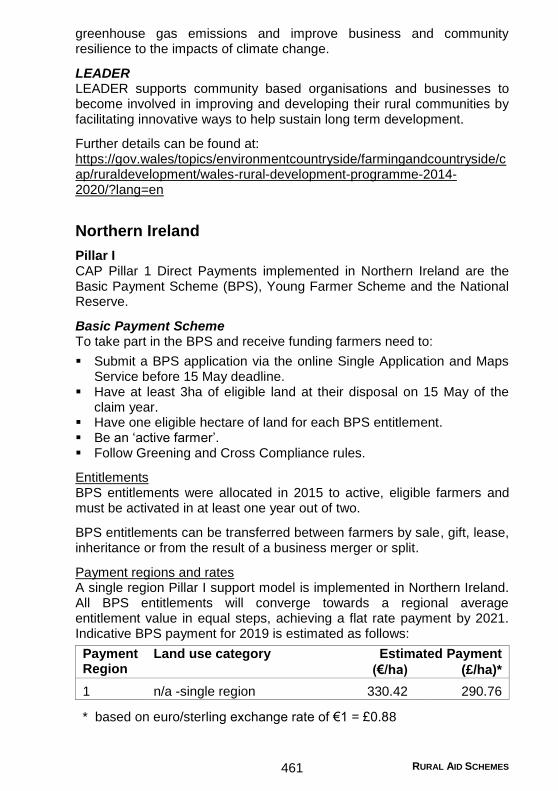
RURAL AID SCHEMES 461
greenhouse gas emissions and improve business and community resilience to the impacts of climate change.
LEADER LEADER supports community based organisations and businesses to become involved in improving and developing their rural communities by facilitating innovative ways to help sustain long term development.
Further details can be found at: https://gov.wales/topics/environmentcountryside/farmingandcountryside/cap/ruraldevelopment/wales-rural-development-programme-2014-2020/?lang=en
Northern Ireland
Pillar I CAP Pillar 1 Direct Payments implemented in Northern Ireland are the Basic Payment Scheme (BPS), Young Farmer Scheme and the National Reserve.
Basic Payment Scheme To take part in the BPS and receive funding farmers need to:
Submit a BPS application via the online Single Application and Maps Service before 15 May deadline.
Have at least 3ha of eligible land at their disposal on 15 May of the claim year.
Have one eligible hectare of land for each BPS entitlement. Be an ‘active farmer’. Follow Greening and Cross Compliance rules.
Entitlements BPS entitlements were allocated in 2015 to active, eligible farmers and must be activated in at least one year out of two.
BPS entitlements can be transferred between farmers by sale, gift, lease, inheritance or from the result of a business merger or split.
Payment regions and rates A single region Pillar I support model is implemented in Northern Ireland. All BPS entitlements will converge towards a regional average entitlement value in equal steps, achieving a flat rate payment by 2021. Indicative BPS payment for 2019 is estimated as follows:
Payment Region
Land use category Estimated Payment
(€/ha) (£/ha)*
1 n/a -single region 330.42 290.76
* based on euro/sterling exchange rate of €1 = £0.88

RURAL AID SCHEMES 462
Actual payment rates for 2018 will be worked out once the total number of hectares of eligible land claimed for in 2018 is known.
Activity To be eligible for the BPS farmers must exercise agricultural activity by:
Producing, rearing or growing agricultural products, including harvesting, milking, breeding animals, and keeping animals for farming purposes.
Maintaining an agricultural area in a state which makes it suitable for grazing or cultivation.
Capping BPS payments, excluding the Greening payment and payments under the Young Farmer’s Scheme are capped at €150,000.
Greening Payment A greening payment is made to farmers who comply with the three standard EU greening measures.
Permanent grassland - is monitored across Northern Ireland.
Crop diversification - farmers in Northern Ireland are required, unless they are exempt, to follow the requirements as set out in the introduction on pages 438-439.
Ecological Focus Areas (EFAs) - farmers in Northern Ireland are required, unless they are exempt, to follow the requirements as set out in the introduction on pages 439.
The following land uses and features, as illustrated in the table, count towards EFA in Northern Ireland. Each option, with the exception of short rotation coppice and afforested areas must be located either on or adjacent to arable land. Conversion and weighting factors also apply.
EFA option Location Conversion factor
(m to m2)
Weighting factor
EFA area (m
2)
Fallow land (/1m2) On arable land n/a 1.00 1.00
Hedges
(/1m)
On or adjacent to arable land
5
2.00
10.00
Sheughs
(/1m)
On or adjacent to arable land
5
2.00
10.00
Dry stone walls
(/1m)
On or adjacent to arable land
1
1.00
1.00
Archaeological features
(/1m2)
On or adjacent to arable land
n/a
1.00
1.00
Earth banks
(/1m2)
On or adjacent to arable land
n/a
1.00
1.00
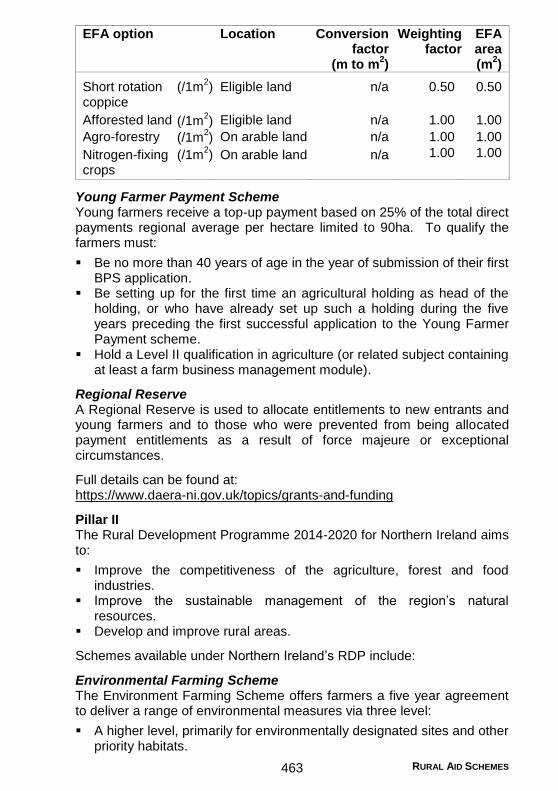
RURAL AID SCHEMES 463
EFA option Location Conversion factor
(m to m2)
Weighting factor
EFA area (m
2)
Short rotation coppice
(/1m2)
Eligible land
n/a
0.50
0.50
Afforested land (/1m2) Eligible land n/a 1.00 1.00
Agro-forestry (/1m2) On arable land n/a 1.00 1.00
Nitrogen-fixing crops
(/1m2)
On arable land
n/a
1.00 1.00
Young Farmer Payment Scheme Young farmers receive a top-up payment based on 25% of the total direct payments regional average per hectare limited to 90ha. To qualify the farmers must:
Be no more than 40 years of age in the year of submission of their first BPS application.
Be setting up for the first time an agricultural holding as head of the holding, or who have already set up such a holding during the five years preceding the first successful application to the Young Farmer Payment scheme.
Hold a Level II qualification in agriculture (or related subject containing at least a farm business management module).
Regional Reserve A Regional Reserve is used to allocate entitlements to new entrants and young farmers and to those who were prevented from being allocated payment entitlements as a result of force majeure or exceptional circumstances.
Full details can be found at: https://www.daera-ni.gov.uk/topics/grants-and-funding
Pillar II The Rural Development Programme 2014-2020 for Northern Ireland aims to:
Improve the competitiveness of the agriculture, forest and food industries.
Improve the sustainable management of the region’s natural resources.
Develop and improve rural areas.
Schemes available under Northern Ireland’s RDP include:
Environmental Farming Scheme The Environment Farming Scheme offers farmers a five year agreement to deliver a range of environmental measures via three level:
A higher level, primarily for environmentally designated sites and other priority habitats.

RURAL AID SCHEMES 464
A wider level to deliver benefits across the countryside, outside of environmentally designated areas.
A group level to support co-operative action by farmers in specific areas such as a river catchment.
Business Development Groups The scheme uses a group approach to improve efficiency of farm businesses and offers participants the opportunity to gain a level 3 qualification. Farmers participating in the scheme benchmark their business to identify areas that have the potential to be improved. A business development plan is then created to identify the actions to be taken to improve the technical efficiency of the business and improve the sustainability of the farm.
Forestry Grant Schemes Three schemes are available, Forest Expansion Scheme, Forest Protection Scheme and Woodland Investment Grant that provide support for the expansion or creation of woodland or forestry, preventing and restoring pest and disease damage to forests and to improve resilience and environmental value of woodlands.
Farm Business Improvement Scheme The Farm Business Improvement Scheme is a package of measures aimed at improving the competitiveness and sustainability of the farming sector. Funds have previously been available to construct new farm buildings and refurbishment of existing buildings, purchase machinery, equipment to improve nutrient management, investments to improve resource efficiency and renewable energy feasibility studies.
Agri-food Processing Investment Scheme This scheme helps to add more value to agriculture produce by encouraging better production methods to achieve premium prices on quality products and to improve promotion and labelling. Support is available for new technology, creation and modernisation of the supply chain, food safety management systems and feasibility studies for renewable energy.
Agri-Food Co-operation Scheme This scheme aims to reduce fragmentation and improve competitiveness and sustainability within the agri-food sector via facilitation, mentoring, training, study visits, market research and information and the provision of business tools.
Areas of Natural Constraint (ANC) Scheme The ANC Scheme provides a payment to farmers with land in the severely disadvantaged area (SDA) to compensate for all or part of the additional costs and income forgone related to the constraints of agricultural production in the area.
RURAL AID SCHEMES 465
LEADER The aim of the Leader approach is to increase the capacity of local rural community and business networks to build knowledge and skills, innovate and co-operate in order to tackle local development objectives. Funding can be used to invest in the creation and development of micro and small businesses in rural areas for non-agricultural activities (including farm diversification), small broadband projects, basic services and small rural tourism projects.
Rural Tourism This scheme invests in natural and built heritage projects that can act as a key driver for encouraging rural tourism and particularly out of state visitors whilst preserving the natural assets of the rural community. The scheme is open to Local Authorities and should align with the objectives of Tourism NI.
Further details of the Rural Development Programme can be found at: https://www.daera-ni.gov.uk/articles/2014-2020-rural-development-programme
Cross Compliance
In order to receive CAP support payments based on European and Scottish legislation, Statutory Management Requirements (SMRs) and Good Agricultural and Environmental Condition (GAEC) standards must be met; together they are known as “Cross Compliance”.
Under the current CAP the following SMRs apply in Scotland:
Environment and climate change
SMR 1 Nitrate Vulnerable Zones SMR 2 Conservation of wild birds SMR 3 Conservation of flora and fauna
Public health, animal health and plant health
SMR 4 Food and feed law SMR 5 Restrictions on the use of substances having hormonal or
thyrostatic action and beta-agonists in farm animals SMR 6 Pig identification and registration SMR 7 Cattle identification and registration SMR 8 Sheep and goat identification SMR 9 Prevention and control of transmissible spongiform
encephalopathies (TSEs) SMR 10 Restriction on the use of plant protection products
Animal welfare
SMR 11 Welfare of calves SMR 12 Welfare of pigs SMR 13 Welfare of farmed animals
RURAL AID SCHEMES 466
The GAEC requirements are as follows:
GAEC 1 Buffer strips along watercourses GAEC 2 Abstraction of water for irrigation GAEC 3 Protection of groundwater against pollution GAEC 4 Minimum soil cover GAEC 5 Minimum land management reflecting site specific condition
to limit erosion GAEC 6 Maintenance of soil organic matter GAEC 7 Retention of landscape features
See page 502 for specific details on some of these GAEC requirements.
Rules in England, Wales and Northern Ireland may differ. To ensure compliance with current SMRs and GAEC in each region, more information can be found at:
Scotland: https://www.ruralpayments.org/publicsite/futures/topics/inspections/all-inspections/cross-compliance
https://www.fas.scot/publications/
England: https://www.gov.uk/guidance/cross-compliance-2018
Wales: https://gov.wales/topics/environmentcountryside/farmingandcountryside/farming/crosscompliance/cross-compliance-rules-guidance-2018/?lang=en
Northern Ireland: https://www.daera-ni.gov.uk/publications/cross-compliance-2018

Credit

CREDIT 468
Amortisation Table
The table below can be used to estimate the annual charge to service the repayment of loan capital and interest per £1,000 borrowed.
Years 2 3 4 5 6 7 8 9 10
1 1,020 1,030 1,040 1,050 1,060 1,070 1,080 1,090 1,100
2 515 523 530 538 545 553 561 568 576
3 347 354 360 367 374 381 388 395 402
4 263 269 275 282 289 295 302 309 315
5 212 218 225 231 237 244 250 257 264
6 179 185 191 197 203 210 216 223 230
7 155 161 167 173 179 186 192 199 205
8 137 142 149 155 161 167 174 181 187
9 123 128 134 141 147 153 160 167 174
10 111 117 123 130 136 142 149 156 163
11 102 108 114 120 127 133 140 147 154
12 95 100 107 113 119 126 133 140 147
13 88 94 100 106 113 120 127 134 141
14 83 89 95 101 108 114 121 128 136
15 78 84 90 96 103 110 117 124 131
20 61 67 74 80 87 94 102 110 117
25 51 57 64 71 78 86 94 102 110
30 45 51 58 65 73 81 89 97 106
40 37 43 51 58 66 75 84 93 102
Percentage rate of interest
Example: The annual charge to service the interest and capital repayments on £8,000 repayable over 10 years at 5% would be £130 x 8 = £1,040. The payment at 6% would be £136 x 8 = £1,088.
The annual charge is given by:
C x ( r (1 + r)
n
) (1 + r)
n - 1
where: C r n
= capital investment = rate of interest (to 2 decimal places) = years of repayment
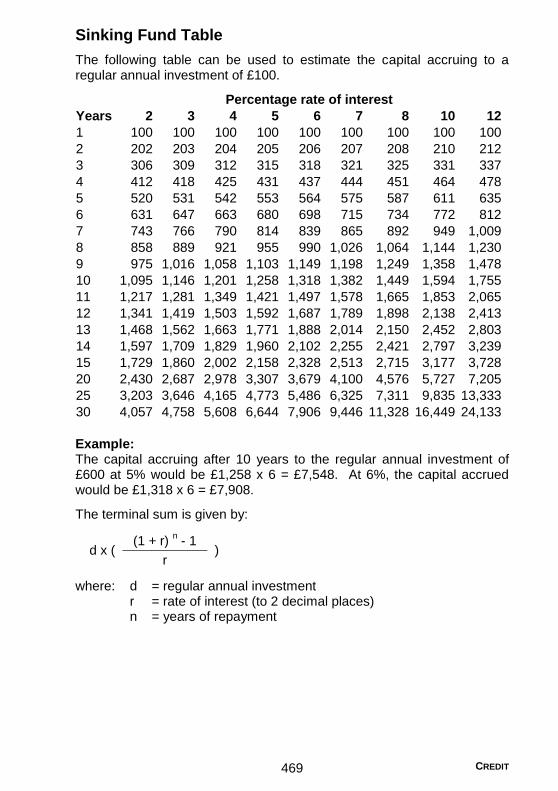
CREDIT 469
Sinking Fund Table
The following table can be used to estimate the capital accruing to a regular annual investment of £100.
Years 2 3 4 5 6 7 8 10 12
1 100 100 100 100 100 100 100 100 100
2 202 203 204 205 206 207 208 210 212
3 306 309 312 315 318 321 325 331 337
4 412 418 425 431 437 444 451 464 478
5 520 531 542 553 564 575 587 611 635
6 631 647 663 680 698 715 734 772 812
7 743 766 790 814 839 865 892 949 1,009
8 858 889 921 955 990 1,026 1,064 1,144 1,230
9 975 1,016 1,058 1,103 1,149 1,198 1,249 1,358 1,478
10 1,095 1,146 1,201 1,258 1,318 1,382 1,449 1,594 1,755
11 1,217 1,281 1,349 1,421 1,497 1,578 1,665 1,853 2,065
12 1,341 1,419 1,503 1,592 1,687 1,789 1,898 2,138 2,413
13 1,468 1,562 1,663 1,771 1,888 2,014 2,150 2,452 2,803
14 1,597 1,709 1,829 1,960 2,102 2,255 2,421 2,797 3,239
15 1,729 1,860 2,002 2,158 2,328 2,513 2,715 3,177 3,728
20 2,430 2,687 2,978 3,307 3,679 4,100 4,576 5,727 7,205
25 3,203 3,646 4,165 4,773 5,486 6,325 7,311 9,835 13,333
30 4,057 4,758 5,608 6,644 7,906 9,446 11,328 16,449 24,133
Percentage rate of interest
Example: The capital accruing after 10 years to the regular annual investment of £600 at 5% would be £1,258 x 6 = £7,548. At 6%, the capital accrued would be £1,318 x 6 = £7,908.
The terminal sum is given by:
d x ( (1 + r)
n - 1
) r
where: d r n
= regular annual investment = rate of interest (to 2 decimal places) = years of repayment

CREDIT 470
Approximate Annual Percentage Rates of Annual Nominal Rates
As an aid to assessing finance deals, the following table estimates the equivalent annual percentage interest rates (APR’s) for a range of nominal annual rates (e.g. 2% above base rate of 1% = 3%) and various charging regimes.
Approximate annual percentage rate equivalent (%)
Annual nominal Monthly Quarterly Half-yearly
rate (%) charging charging charging
2 2.0 2.0 2.0
3 3.0 3.0 3.0
4 4.1 4.1 4.0
5 5.1 5.1 5.1
6 6.2 6.1 6.1
7 7.2 7.2 7.1
8 8.3 8.2 8.2
9 9.4 9.3 9.2
10 10.5 10.4 10.3
11 11.6 11.5 11.3
12 12.7 12.6 12.4
13 13.8 13.6 13.4
14 14.9 14.8 14.5
15 16.1 15.9 15.6 Example: A nominal interest rate of 5% with monthly charging gives an approximate annual percentage rate of 5.1%. A nominal rate of 6%, gives an annual percentage rate (APR) of 6.2%.
The approximate annual percentage rate is given by:
[(1 +
n )
p – 1] x 100
p
where: n p
= nominal interest rate (expressed as a decimal) = number of instalments per year

CREDIT 471
Approximate Annual Percentage Rates of Annual Flat Rates
Where interest on finance is quoted as flat rate on the original amount borrowed, the following table can be used to estimate the equivalent annual percentage rate (APR) for equal monthly repayments of interest and capital.
Annual flat
rate (%) 1 year 5 years 10 years 15 years
4 7.5 7.6 7.3 7.0
5 9.4 9.5 9.0 8.6
6 11.4 11.4 10.7 10.1
7 13.4 13.2 12.3 11.6
8 15.4 15.0 13.9 13.0
9 17.4 16.8 15.5 14.4
10 19.5 18.7 17.0 15.8
11 21.6 20.5 18.6 17.2
12 23.6 22.3 20.1 18.6
Approximate annual percentage rate
equivalent (%) for loans over:
Example: The APR for a loan at an annual flat rate of 6% repaid by monthly instalments over 5 years will be 11.4%.

CREDIT 472
Compounding Table
This table estimates the future monetary value of £100 after n years at various interest rates.
Years 3 4 5 6 7 8 10 12 14 16
1 103 104 105 106 107 108 110 112 114 116
2 106 108 110 112 114 117 121 125 130 135
3 109 112 116 119 123 126 133 140 148 156
4 113 117 122 126 131 136 146 157 169 181
5 116 122 128 134 140 147 161 176 193 210
6 119 127 134 142 150 159 177 197 219 244
7 123 132 141 150 161 171 195 221 250 283
8 127 137 148 159 172 185 214 248 285 328
9 130 142 155 169 184 200 236 277 325 380
10 134 148 163 179 197 216 259 311 371 441
11 138 154 171 190 210 233 285 348 423 512
12 143 160 180 201 225 252 314 390 482 594
13 147 167 189 213 241 272 345 436 549 689
14 151 173 198 226 258 294 380 489 626 799
15 156 180 208 240 276 317 418 547 714 927
20 181 219 265 321 387 466 673 965 1,374 1,946
25 209 267 339 429 543 685 1,083 1,700 2,646 4,087
30 243 324 432 574 761 1,006 1,745 2,996 5,095 8,585
Percentage rate of interest
Example: The value of £1,200 at 5% after 8 years would be £148 x 12 = £1,776. At 6%, it would be £159 x 12 = £1,908.
The compounding factor is given by: (1 + r)n
where: r n
= rate of interest (expressed as a decimal) = number of years
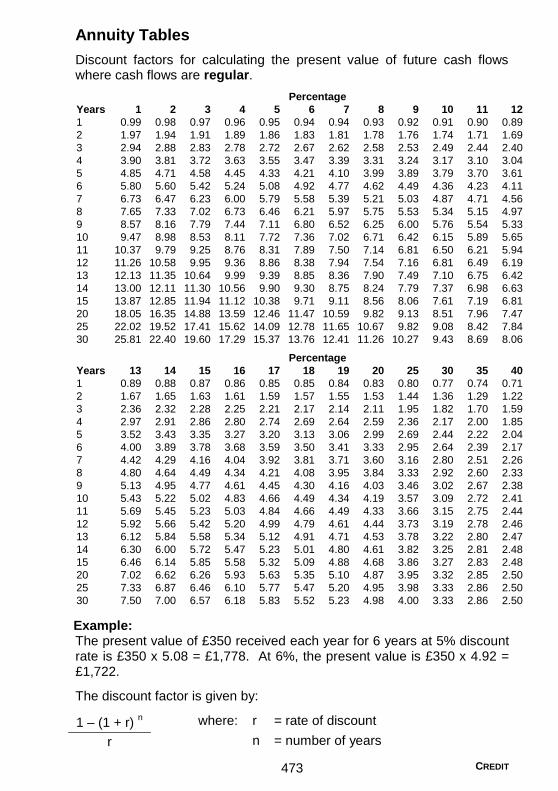
CREDIT 473
Annuity Tables
Discount factors for calculating the present value of future cash flows where cash flows are regular.
Years 1 2 3 4 5 6 7 8 9 10 11 12
1 0.99 0.98 0.97 0.96 0.95 0.94 0.94 0.93 0.92 0.91 0.90 0.89
2 1.97 1.94 1.91 1.89 1.86 1.83 1.81 1.78 1.76 1.74 1.71 1.69
3 2.94 2.88 2.83 2.78 2.72 2.67 2.62 2.58 2.53 2.49 2.44 2.40
4 3.90 3.81 3.72 3.63 3.55 3.47 3.39 3.31 3.24 3.17 3.10 3.04
5 4.85 4.71 4.58 4.45 4.33 4.21 4.10 3.99 3.89 3.79 3.70 3.61
6 5.80 5.60 5.42 5.24 5.08 4.92 4.77 4.62 4.49 4.36 4.23 4.11
7 6.73 6.47 6.23 6.00 5.79 5.58 5.39 5.21 5.03 4.87 4.71 4.56
8 7.65 7.33 7.02 6.73 6.46 6.21 5.97 5.75 5.53 5.34 5.15 4.97
9 8.57 8.16 7.79 7.44 7.11 6.80 6.52 6.25 6.00 5.76 5.54 5.33
10 9.47 8.98 8.53 8.11 7.72 7.36 7.02 6.71 6.42 6.15 5.89 5.65
11 10.37 9.79 9.25 8.76 8.31 7.89 7.50 7.14 6.81 6.50 6.21 5.94
12 11.26 10.58 9.95 9.36 8.86 8.38 7.94 7.54 7.16 6.81 6.49 6.19
13 12.13 11.35 10.64 9.99 9.39 8.85 8.36 7.90 7.49 7.10 6.75 6.42
14 13.00 12.11 11.30 10.56 9.90 9.30 8.75 8.24 7.79 7.37 6.98 6.63
15 13.87 12.85 11.94 11.12 10.38 9.71 9.11 8.56 8.06 7.61 7.19 6.81
20 18.05 16.35 14.88 13.59 12.46 11.47 10.59 9.82 9.13 8.51 7.96 7.47
25 22.02 19.52 17.41 15.62 14.09 12.78 11.65 10.67 9.82 9.08 8.42 7.84
30 25.81 22.40 19.60 17.29 15.37 13.76 12.41 11.26 10.27 9.43 8.69 8.06
Years 13 14 15 16 17 18 19 20 25 30 35 40
1 0.89 0.88 0.87 0.86 0.85 0.85 0.84 0.83 0.80 0.77 0.74 0.71
2 1.67 1.65 1.63 1.61 1.59 1.57 1.55 1.53 1.44 1.36 1.29 1.22
3 2.36 2.32 2.28 2.25 2.21 2.17 2.14 2.11 1.95 1.82 1.70 1.59
4 2.97 2.91 2.86 2.80 2.74 2.69 2.64 2.59 2.36 2.17 2.00 1.85
5 3.52 3.43 3.35 3.27 3.20 3.13 3.06 2.99 2.69 2.44 2.22 2.04
6 4.00 3.89 3.78 3.68 3.59 3.50 3.41 3.33 2.95 2.64 2.39 2.17
7 4.42 4.29 4.16 4.04 3.92 3.81 3.71 3.60 3.16 2.80 2.51 2.26
8 4.80 4.64 4.49 4.34 4.21 4.08 3.95 3.84 3.33 2.92 2.60 2.33
9 5.13 4.95 4.77 4.61 4.45 4.30 4.16 4.03 3.46 3.02 2.67 2.38
10 5.43 5.22 5.02 4.83 4.66 4.49 4.34 4.19 3.57 3.09 2.72 2.41
11 5.69 5.45 5.23 5.03 4.84 4.66 4.49 4.33 3.66 3.15 2.75 2.44
12 5.92 5.66 5.42 5.20 4.99 4.79 4.61 4.44 3.73 3.19 2.78 2.46
13 6.12 5.84 5.58 5.34 5.12 4.91 4.71 4.53 3.78 3.22 2.80 2.47
14 6.30 6.00 5.72 5.47 5.23 5.01 4.80 4.61 3.82 3.25 2.81 2.48
15 6.46 6.14 5.85 5.58 5.32 5.09 4.88 4.68 3.86 3.27 2.83 2.48
20 7.02 6.62 6.26 5.93 5.63 5.35 5.10 4.87 3.95 3.32 2.85 2.50
25 7.33 6.87 6.46 6.10 5.77 5.47 5.20 4.95 3.98 3.33 2.86 2.50
30 7.50 7.00 6.57 6.18 5.83 5.52 5.23 4.98 4.00 3.33 2.86 2.50
Percentage
Percentage
Example:
The present value of £350 received each year for 6 years at 5% discount rate is £350 x 5.08 = £1,778. At 6%, the present value is £350 x 4.92 = £1,722.
The discount factor is given by:
1 – (1 + r) n where: r = rate of discount
r n = number of years

CREDIT 474
Discount Tables
Discount factors for calculating the present value of future cash flows where cash flows are irregular.
Years 1 2 3 4 5 6 7 8 9 10 11 12
1 0.990 0.980 0.971 0.962 0.952 0.943 0.935 0.926 0.917 0.909 0.901 0.893
2 0.980 0.961 0.943 0.925 0.907 0.890 0.873 0.857 0.842 0.826 0.812 0.797
3 0.971 0.942 0.915 0.889 0.864 0.840 0.816 0.794 0.772 0.751 0.731 0.712
4 0.961 0.924 0.888 0.855 0.823 0.792 0.763 0.735 0.708 0.683 0.659 0.636
5 0.951 0.906 0.863 0.822 0.784 0.747 0.713 0.681 0.650 0.621 0.593 0.567
6 0.942 0.888 0.837 0.790 0.746 0.705 0.666 0.630 0.596 0.564 0.535 0.507
7 0.933 0.871 0.813 0.760 0.711 0.665 0.623 0.583 0.547 0.513 0.482 0.452
8 0.923 0.853 0.789 0.731 0.677 0.627 0.582 0.540 0.502 0.467 0.434 0.404
9 0.914 0.837 0.766 0.703 0.645 0.592 0.544 0.500 0.460 0.424 0.391 0.361
10 0.905 0.820 0.744 0.676 0.614 0.558 0.508 0.463 0.422 0.386 0.352 0.322
11 0.896 0.804 0.722 0.650 0.585 0.527 0.475 0.429 0.388 0.350 0.317 0.287
12 0.887 0.788 0.701 0.625 0.557 0.497 0.444 0.397 0.356 0.319 0.286 0.257
13 0.879 0.773 0.681 0.601 0.530 0.469 0.415 0.368 0.326 0.290 0.258 0.229
14 0.870 0.758 0.661 0.577 0.505 0.442 0.388 0.340 0.299 0.263 0.232 0.205
15 0.861 0.743 0.642 0.555 0.481 0.417 0.362 0.315 0.275 0.239 0.209 0.183
20 0.820 0.673 0.554 0.456 0.377 0.312 0.258 0.215 0.178 0.149 0.124 0.104
25 0.780 0.610 0.478 0.375 0.295 0.233 0.184 0.146 0.116 0.092 0.074 0.059
Years 13 14 15 16 17 18 19 20 25 30 35 40
1 0.885 0.877 0.870 0.862 0.855 0.847 0.840 0.833 0.800 0.769 0.741 0.714
2 0.783 0.769 0.756 0.743 0.731 0.718 0.706 0.694 0.640 0.592 0.549 0.510
3 0.693 0.675 0.658 0.641 0.624 0.609 0.593 0.579 0.512 0.455 0.406 0.364
4 0.613 0.592 0.572 0.552 0.534 0.516 0.499 0.482 0.410 0.350 0.301 0.260
5 0.543 0.519 0.497 0.476 0.456 0.437 0.419 0.402 0.328 0.269 0.223 0.186
6 0.480 0.456 0.432 0.410 0.390 0.370 0.352 0.335 0.262 0.207 0.165 0.133
7 0.425 0.400 0.376 0.354 0.333 0.314 0.296 0.279 0.210 0.159 0.122 0.095
8 0.376 0.351 0.327 0.305 0.285 0.266 0.249 0.233 0.168 0.123 0.091 0.068
9 0.333 0.308 0.284 0.263 0.243 0.225 0.209 0.194 0.134 0.094 0.067 0.048
10 0.295 0.270 0.247 0.227 0.208 0.191 0.176 0.162 0.107 0.073 0.050 0.035
11 0.261 0.237 0.215 0.195 0.178 0.162 0.148 0.135 0.086 0.056 0.037 0.025
12 0.231 0.208 0.187 0.168 0.152 0.137 0.124 0.112 0.069 0.043 0.027 0.018
13 0.204 0.182 0.163 0.145 0.130 0.116 0.104 0.093 0.055 0.033 0.020 0.013
14 0.181 0.160 0.141 0.125 0.111 0.099 0.088 0.078 0.044 0.025 0.015 0.009
15 0.160 0.140 0.123 0.108 0.095 0.084 0.074 0.065 0.035 0.020 0.011 0.006
20 0.087 0.073 0.061 0.051 0.043 0.037 0.031 0.026 0.012 0.005 0.002 0.001
25 0.047 0.038 0.030 0.024 0.020 0.016 0.013 0.010 0.004 0.001 0.001 0.000
Percentage
Percentage
Example: To find the present value of the following cash flows at 5% discount rate of interest.
Year Cash flow (£) Discount factor Present value (£)
1 250 0.952 238
2 300 0.907 272
3 180 0.864 155
4 400 0.823 329
The Present Value of
this series of cash
flows is £995
The discount factor is given by
1 where: r = rate of discount
(1 + r) n n = number of years

CREDIT 475
Long-Term Loans
Long-term finance might be obtained from banks, mortgage providers, insurance companies, finance companies, solicitors, or by private arrangement. These loans are generally secured against the value of existing property and other business assets.
Long-term loans tend to be used for purchasing fixed assets and are structured as an agricultural mortgage or secured loans typically extending between 5 and 25 years at fixed and/or variable interest. Interest payments can be arranged to tie in with cashflow but would usually be charged monthly or quarterly, however, there are alternative options e.g. of paying interest in half-yearly or annual instalments although this tends to be more expensive. Interest only periods are potentially available prior to moving to capital repayments. Frequency of capital repayments will be subject to negotiation with the lender. Capital repayments are generally packaged together with accrued interest in monthly payments. It maybe agreeable with the lender to defer capital repayment or repay a lump sum on a fixed date each year.
It is necessary for the business borrowing the money to be deemed financially secure and demonstrate the ability to service the loan. This will be determined based on past financial performance, an updated balance sheet, cash flow budgets and perceived risk of the proposed venture.
Long-term loans can typically pass from generation to generation. In other words a loan is not repayable on the death of a borrower and cannot be recalled for the term of the loan provided that obligations continue to be met.
Medium-Term and Short-Term Credit
Banks Banks, the primary source of medium and short-term capital, may agree to grant farmers an overdraft to meet business financial requirements.
Overdrafts are reviewed annually; the interest rate, subject to the security available, is competitive, and interest is charged daily only on the daily balance outstanding. Generally, an arrangement fee will be charged and, in some cases, a renewal fee.
In terms of medium term loans, 10-year term loans are most common. Interest is related to commercial and market factors but have historically been lower than overdraft rates (particularly if adjusted for any overdraft rearrangement fees).
Merchants and tradesmen A popular form of short-term financing. Finance is often in the form of credit allowed by merchants, auctioneers, tradesmen and dealers over a
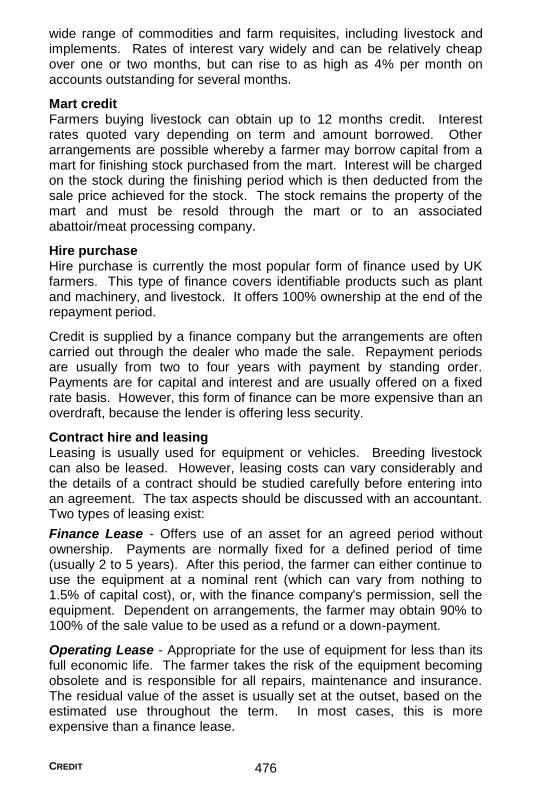
CREDIT 476
wide range of commodities and farm requisites, including livestock and implements. Rates of interest vary widely and can be relatively cheap over one or two months, but can rise to as high as 4% per month on accounts outstanding for several months.
Mart credit Farmers buying livestock can obtain up to 12 months credit. Interest rates quoted vary depending on term and amount borrowed. Other arrangements are possible whereby a farmer may borrow capital from a mart for finishing stock purchased from the mart. Interest will be charged on the stock during the finishing period which is then deducted from the sale price achieved for the stock. The stock remains the property of the mart and must be resold through the mart or to an associated abattoir/meat processing company.
Hire purchase Hire purchase is currently the most popular form of finance used by UK farmers. This type of finance covers identifiable products such as plant and machinery, and livestock. It offers 100% ownership at the end of the repayment period.
Credit is supplied by a finance company but the arrangements are often carried out through the dealer who made the sale. Repayment periods are usually from two to four years with payment by standing order. Payments are for capital and interest and are usually offered on a fixed rate basis. However, this form of finance can be more expensive than an overdraft, because the lender is offering less security.
Contract hire and leasing Leasing is usually used for equipment or vehicles. Breeding livestock can also be leased. However, leasing costs can vary considerably and the details of a contract should be studied carefully before entering into an agreement. The tax aspects should be discussed with an accountant. Two types of leasing exist:
Finance Lease - Offers use of an asset for an agreed period without ownership. Payments are normally fixed for a defined period of time (usually 2 to 5 years). After this period, the farmer can either continue to use the equipment at a nominal rent (which can vary from nothing to 1.5% of capital cost), or, with the finance company's permission, sell the equipment. Dependent on arrangements, the farmer may obtain 90% to 100% of the sale value to be used as a refund or a down-payment.
Operating Lease - Appropriate for the use of equipment for less than its full economic life. The farmer takes the risk of the equipment becoming obsolete and is responsible for all repairs, maintenance and insurance. The residual value of the asset is usually set at the outset, based on the estimated use throughout the term. In most cases, this is more expensive than a finance lease.

CREDIT 477
The advantages of leasing schemes (machinery and livestock) depend on the individual’s circumstances. Leasing is a complex subject and it is advisable to seek professional advice to assess the best financial alternative.


Taxation

TAXATION 480
Introduction
This section is designed to provide background information on how tax may affect the farm business and contains a summary of how the system operates. Tax is an increasingly complex subject and there are thirteen tax rates that could apply to income and capital gains of a Scottish Taxpayer.
The tax year which started on 6 April 2018 is the first year where the Scottish Government’s devolved powers have been used to any significant impact. Before now, despite some tinkering with rate bands, the Scottish Rate of Income Tax (SRIT) has been kept the same as the rest of the UK (RUK). Now we have five specific rates/bands imposed by the Scottish Government and the table shown on page 499 illustrates the complexities involved.
Although every effort has been made to provide accurate details, no responsibility can be taken for any omissions that may have occurred in the treatment of this specialised field.
The Taxation section of the Handbook has been updated by Chiene + Tait LLP. Chiene + Tait is a large independent accountancy firm based in Edinburgh. Chiene + Tait offers an extensive range of personal, business and advisory services to a wide range of clients and has a significant agricultural practice. If you would like to discuss the range of services provided by Chiene + Tait please contact Helen Mackenzie or Rory Kennedy (0131 558 5800).
Income Tax
Income tax is calculated by applying the appropriate rates to taxable income. The amount of a person’s income chargeable to tax in any year is calculated according to the specific rules applicable to the various types of income. Farming profits are assessed as trading income.
The net profit in the accounts usually requires adjustment because some costs may appear in the accounts which are not allowable for tax purposes (e.g. depreciation) and some income may not be subject to income tax at all, or not taxed as trading income.
With effect from 6 April 2017, all taxpayers are entitled to £1,000 allowances for both property income and trading income. This means that the first £1,000 gross of property income and/or trading income is exempt from income tax. If gross income exceeds £1,000, then the taxpayer can either deduct the £1,000 allowance or deduct allowable expenses.

TAXATION 481
Main Income Tax reliefs
Allowed at top rate of tax 2018/19 2017/18
Personal Allowance 1
£11,850 £11,500
Blind Person’s Allowance £2,390 £2,320
Marriage Allowance 2 £1,190 £1,150
Dividend Tax Allowance (DTA) 3 £2,000 £5,000
Personal Savings Allowance (PSA) 4
- Basic Rate Taxpayer £1,000 £1,000
- Higher Rate Taxpayer £500 £500
Allowed only at 10%
Married Couple’s Allowance (MCA) 5 £8,695 £8,445
Income limit for age-related allowances £28,900 £28,000
1
The personal allowance is withdrawn at £1 for every £2 by which total income exceeds £100,000 such that allowances become nil at income of £123,700.
2
Up to 10% of the personal allowance can be transferred to a spouse who is no more than a basic rate taxpayer. Not available if the married couple’s allowance is being claimed.
3 The DTA taxes the first £2,000 of dividend income at 0%. 4 The PSA operates as a nil rate band for interest income. 5 Only available if born before 6th April 1935.
UK Income Tax bands and rates
2018/19 2017/18
Basic rate band £34,500 £33,500 Higher rate band £34,501 - £150,000 £33,501 - £150,000 Additional rate band over £150,000 over £150,000
The tax rates differ for General income (G - salary, pensions, business profits, rent), Savings income (S - interest) and Dividend income (D).
2018/19 2017/18 G S D G S D
Basic rate 20% 20% 7.5% 20% 20% 7.5% Higher rate 40% 40% 32.5% 40% 40% 32.5% Additional rate 45% 45% 38.1% 45% 45% 38.1%
Scottish Rate of Income Tax (SRIT) From April 2017, the Scottish Parliament has the authority to vary the rate bands as well as the actual tax rates. The SRIT will apply to General Income belonging to a “Scottish Taxpayer” regardless of where that income arises. The rules for defining a “Scottish Taxpayer” can be complicated but will broadly apply where the individual’s main family home is in Scotland.
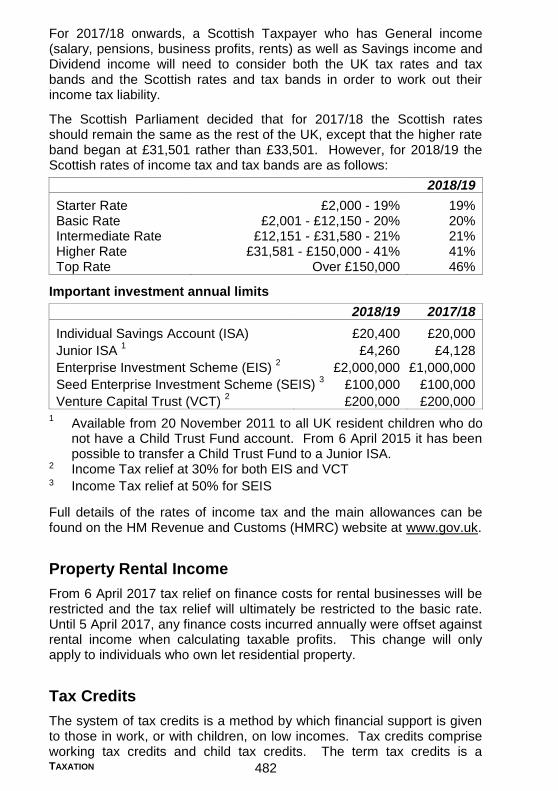
TAXATION 482
For 2017/18 onwards, a Scottish Taxpayer who has General income (salary, pensions, business profits, rents) as well as Savings income and Dividend income will need to consider both the UK tax rates and tax bands and the Scottish rates and tax bands in order to work out their income tax liability.
The Scottish Parliament decided that for 2017/18 the Scottish rates should remain the same as the rest of the UK, except that the higher rate band began at £31,501 rather than £33,501. However, for 2018/19 the Scottish rates of income tax and tax bands are as follows:
2018/19
Starter Rate £2,000 - 19% 19% Basic Rate £2,001 - £12,150 - 20% 20% Intermediate Rate £12,151 - £31,580 - 21% 21% Higher Rate £31,581 - £150,000 - 41% 41% Top Rate Over £150,000 46%
Important investment annual limits
2018/19 2017/18
Individual Savings Account (ISA) £20,400 £20,000
Junior ISA 1 £4,260 £4,128
Enterprise Investment Scheme (EIS) 2 £2,000,000 £1,000,000
Seed Enterprise Investment Scheme (SEIS) 3 £100,000 £100,000
Venture Capital Trust (VCT) 2 £200,000 £200,000
1 Available from 20 November 2011 to all UK resident children who do not have a Child Trust Fund account. From 6 April 2015 it has been possible to transfer a Child Trust Fund to a Junior ISA.
2 Income Tax relief at 30% for both EIS and VCT 3 Income Tax relief at 50% for SEIS
Full details of the rates of income tax and the main allowances can be found on the HM Revenue and Customs (HMRC) website at www.gov.uk.
Property Rental Income
From 6 April 2017 tax relief on finance costs for rental businesses will be restricted and the tax relief will ultimately be restricted to the basic rate. Until 5 April 2017, any finance costs incurred annually were offset against rental income when calculating taxable profits. This change will only apply to individuals who own let residential property.
Tax Credits
The system of tax credits is a method by which financial support is given to those in work, or with children, on low incomes. Tax credits comprise working tax credits and child tax credits. The term tax credits is a

TAXATION 483
misnomer: tax credits are a form of financial support, and they are administered by HMRC. The financial support (itself tax-free) consists of payments to claimants, and not offsets against tax liabilities. The income tax system treats members of a family independently. By contrast, tax credits are based, where appropriate, on the circumstances of couples living together, whether married or not.
Further information on tax credits can be found on the tax credit website at www.gov.uk.
Pensions
It is recognised that state pensions do not provide an adequate income in old age and it is for this reason that individuals may wish to contribute to pensions other than under the state pension scheme. Pension contributions attract tax relief up to set limits and the contributions are accumulated in a fund that is free of income tax and capital gains.
The rules for tax relief on pension contributions have undergone significant changes over the years with a view to simplification. Complications remain with rules for the carry forward of unused relief and advice should be taken on the tax implications before a pension contribution is made. Broadly, however, anyone can contribute up to £3,600 (gross) each year, regardless of earnings. Pension payments are made net of basic rate tax relief so the individual would pay £2,880 and the government would add £720 to the pension fund to bring the total up to the £3,600 figure. Higher rate tax relief if applicable is then given through the individual’s self assessment tax return or PAYE code. For 2018/19, the maximum tax-efficient contribution will generally be £40,000 (gross) or 100% of current earnings unless there is unused pension relief available to carry forward from the previous tax years. With effect from 6 April 2016 the maximum contribution is tapered where ‘adjusted income’ (i.e. including pension contributions) is more than £150,000. The reduction is £1 for every £2 of income over £150,000 and the minimum allowance will be £10,000.
There is also a lifetime limit to the value an individual can contribute to a pension fund tax efficiently. For 2018/19, the “lifetime allowance” is £1,030,000.
Occupational schemes are available to employees who have an employer offering such a scheme and the Pensions Act 2008 included provisions requiring employers to set up pension arrangements for all employees. The rules for compulsory work pensions include a government “auto-enrolment” scheme called the National Employment Savings Trust (NEST). There are now alternative private pension providers offering auto-enrolment scheme options in addition to the government NEST scheme. The implementation date for compulsory pensions is phased according to the number of employees. Staging

TAXATION 484
dates started in the final quarter of 2012 for the largest employers and all existing employers should now be complying.
From 6 April 2015, those with a money purchase pension (i.e. not final salary schemes) will be able to have unrestricted access to the full value of their pension fund. Any withdrawals above the level of the tax free amount (currently 25%) will be taxed at the individual’s marginal rate of income tax. To prevent recycling funds into another pension to increase the tax relief available, a Money Purchase Annual Allowance (MPAA) was introduced. Until 5 April 2017 the MPAA was £10,000, however, with effect from 6 April 2017 it was reduced to £4,000.
Recent changes to the punitive 55% tax charge on death have resulted in pensions becoming increasingly beneficial for inheritance tax planning matters.
Capital Allowances
Main capital allowances - plant and machinery Allowance %
Annual Investment allowance: £200,000 (from 1 Jan 2016) 100 Certain energy and water efficient equipment, cars CO2 75g/km or less
100
Writing down allowance: general pool* 18 Writing down allowance: special rate pool* 8
* The special rate pool includes long life assets, integral plant in buildings, thermal insulation, solar shading and cars with CO2 emissions over 130g/km. The general pool contains other plant and machinery.
In the accounts it is normal practice to write-off part of the cost of plant, machinery, vehicles and buildings as depreciation each year. In calculating taxable income, this depreciation is added back to profit, and capital allowances are deducted.
Since 6 April 2008, it has been possible to claim a new 100% Annual Investment Allowance (AIA) for plant and machinery (excluding cars). The AIA is currently £200,000.
For new cars bought from 6 April 2009 onwards, allowances will be related to the CO2 rating of the car. New cars with a rating below 75g/km will enjoy a 100% first year allowance. Cars with a rating up to 130g/km will go into the general pool and receive 18% allowances (restricted to £3,000 per annum if the car cost more than £3,000). Cars with higher ratings will go into the special rate pool and only receive 8% allowances. From April 2018 the CO2 threshold will be reduced to 110g/km.
Capital allowances can no longer be claimed for expenditure on agricultural buildings or works.
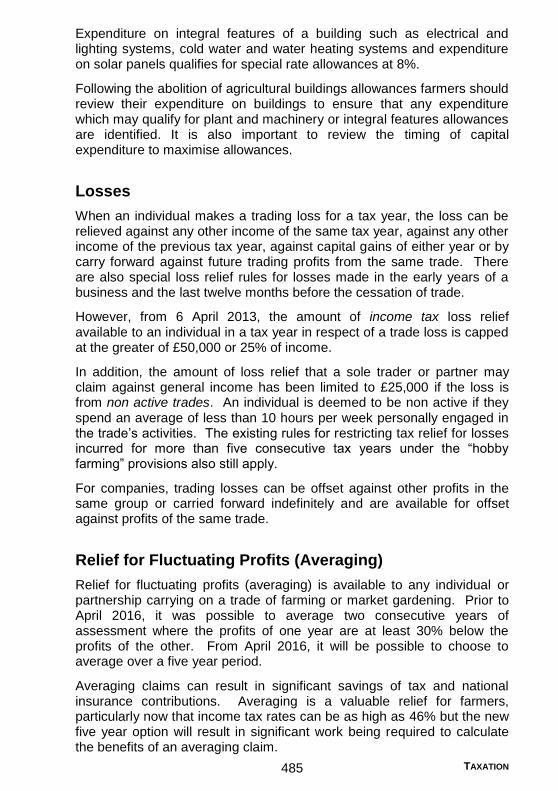
TAXATION 485
Expenditure on integral features of a building such as electrical and lighting systems, cold water and water heating systems and expenditure on solar panels qualifies for special rate allowances at 8%.
Following the abolition of agricultural buildings allowances farmers should review their expenditure on buildings to ensure that any expenditure which may qualify for plant and machinery or integral features allowances are identified. It is also important to review the timing of capital expenditure to maximise allowances.
Losses
When an individual makes a trading loss for a tax year, the loss can be relieved against any other income of the same tax year, against any other income of the previous tax year, against capital gains of either year or by carry forward against future trading profits from the same trade. There are also special loss relief rules for losses made in the early years of a business and the last twelve months before the cessation of trade.
However, from 6 April 2013, the amount of income tax loss relief available to an individual in a tax year in respect of a trade loss is capped at the greater of £50,000 or 25% of income.
In addition, the amount of loss relief that a sole trader or partner may claim against general income has been limited to £25,000 if the loss is from non active trades. An individual is deemed to be non active if they spend an average of less than 10 hours per week personally engaged in the trade’s activities. The existing rules for restricting tax relief for losses incurred for more than five consecutive tax years under the “hobby farming” provisions also still apply.
For companies, trading losses can be offset against other profits in the same group or carried forward indefinitely and are available for offset against profits of the same trade.
Relief for Fluctuating Profits (Averaging)
Relief for fluctuating profits (averaging) is available to any individual or partnership carrying on a trade of farming or market gardening. Prior to April 2016, it was possible to average two consecutive years of assessment where the profits of one year are at least 30% below the profits of the other. From April 2016, it will be possible to choose to average over a five year period.
Averaging claims can result in significant savings of tax and national insurance contributions. Averaging is a valuable relief for farmers, particularly now that income tax rates can be as high as 46% but the new five year option will result in significant work being required to calculate the benefits of an averaging claim.

TAXATION 486
Herd Basis of Livestock Valuation
Under the herd basis of livestock valuation, fluctuations in the value of production animals are not taken into account in computing profits, nor is the cost of the original herd or flock deductible. The values of the original production stock numbers are held constant throughout the period that the herd is in existence.
An election to adopt the herd basis of livestock valuation can normally only be made at a time when a production herd is first kept and provided that a herd of that class has not been kept in the preceding five years. Once made, an election is irrevocable and will come to an end only on ceasing to keep a production herd of the particular class for a period of five years or on a change of business structure, e.g. when a sole trader introduces a partner to the business. The time limit for making an election to adopt the herd basis of valuation is two years after the end of the first tax year affected by the purchase of the herd.
The advantage of the herd basis is the exclusion from taxable profit of changes in value of production animals. In addition, when a whole herd or a substantial part of it (over 20%) is sold without replacement, any difference between sale value and book value is not taxable for income tax or capital gains tax purposes.
Self Assessment Procedures
Every personal tax return carries a self assessment section in which the taxpayer is normally expected to calculate his or her own income tax and capital gains tax liability. The submission deadline for paper tax returns is 31 October following the end of the tax year. The submission deadline for tax returns delivered electronically is 31 January following the end of the tax year. Penalties are imposed for the late submissions of tax returns.
Tax liabilities are settled via two interim payments on account and a final balancing payment. The two interim payments on account are payable on 31 January during the tax year and 31 July following the end of the tax year. The balance of any income tax due and the full amount of any capital gains tax due is payable on 31 January following the end of the tax year. Interest and surcharges will be due on tax paid late.
Records of personal income, such as bank interest and dividend income should be retained for a period of one year and ten months following the year of assessment to which they relate unless the taxpayer also has a business or let property in which case all records must be kept for five years and ten months.

TAXATION 487
Corporation Tax Procedures
Companies have 12 months from the end of the accounting period to file their tax return. For most companies, tax payments are due nine months and 1 day after the end of the accounting period and large companies pay tax in instalments.
Corporation Tax Rates
Year to 31 March 2019
Main rate 19%
All companies now pay the same rate of tax on profits regardless of the level of profits generated.
If the farm trade is carried on through the medium of a company, corporation tax on the profits has to be paid by the company.
Corporation tax is charged on the trading profits, capital gains and other income of an accounting period. Directors’ salaries and fees are a charge against profit. Capital allowances are deducted where expenditure is incurred on the acquisition of qualifying plant and machinery.
Annual Tax on Enveloped Dwellings
From 1 April 2013 an annual tax charge has been imposed on certain “non-natural persons” (broadly, companies, partnerships with a corporate partner and collective investment schemes) which hold UK residential dwellings. From 1 April 2016 properties valued at more than £500,000 on specific valuation dates are subject to the charge. For 20181/19 the charge is determined as follows:
Property Value Annual Tax Charge
£500,000 - £1,000,000 £3,600 £1,000,001 - £2,000,000 £7,250 £2,000,001 - £5,000,000 £24,250 £5,000,001 - £10,000,000 £56,550 £10,000,001 - £20,000,000 £113,400 More than £20,000,000 £226,950
A capital gains tax charge may also arise on disposal of such properties and a 15% SDLT or LBTT charge may arise on the acquisition of such properties (see page 488 for further details).

TAXATION 488
Capital Gains Tax
Annual exempt amount 2018/19: individuals £11,700, most trustees £5,850. The Capital Gains Tax (CGT) rates for 2018/19 are 10% (for the element within the basic rate band) and 20%. Gains on residential property attract the higher 18%/28% rates.
CGT is a tax on the increase in value of certain property which is sold or given away in a lifetime. It applies to the sale or gift of assets such as land, shares, or other capital assets. CGT does not apply to transfers of cash or the disposal of trading stock. Lifetime gifts between spouses do not give rise to a chargeable gain.
Capital losses are set against other capital gains of the same year or carried forward to reduce gains in excess of the annual exemption in future years. Capital losses cannot be carried back unless they arise in the year of death.
From, 1 April 2013, CGT is payable at 28% in respect of any gain arising from the disposal of residential property owned by UK resident or non-UK resident “non-natural persons”.
From 6 April 2015, CGT is payable on the disposal of UK residential property by non-resident individuals. On sale, there are two options. The property value can be rebased at 5 April 2015 and the chargeable gain arising on disposal will be the difference between the 5 April 2015 valuation and the value at date of sale. Alternatively, the gain arising over the whole period of ownership can be calculated and apportioned, with only the element of the gain arising after 6 April 2015 being liable to capital gains tax.
Entrepreneurs’ Relief applies to disposals of a sole trade or interest in a partnership trade, or shares in a trading company where the shareholder owns at least 5% of the ordinary share capital and has at least 5% of the voting rights and is an officer or employee of the company. There is a requirement to meet the qualifying criteria for a minimum period of 12 months. Qualifying gains are taxed at 10% up to a lifetime maximum of £10m.
Principal Private Residence Relief (PPR) will generally exempt the gain arising on the sale of the farmhouse and up to half a hectare of grounds. The relief will be restricted if any part of the residence is used solely for business purposes. Where a property had been occupied as the owner’s only or main residence, the last 18 months of ownership will qualify for PPR even if the property was no longer occupied.
Gift Relief is available on the gift of assets used in a trade carried on by the transferor, agricultural property (including tenanted land) or shares in an unquoted company. The capital gain is calculated as normal, but does not become chargeable if both the transferor and the transferee agree to “hold over” the gain. If an election is made, the transferee will

TAXATION 489
be deemed to acquire the asset at its open market value less the gain held over. In this way the tax charge is deferred until the transferee sells the asset at arms length. Gift relief is restricted if there has been any non business use of the asset. Previously only agricultural land in the UK qualified for relief, however, from 22 April 2009 land anywhere in the European Economic Area can qualify.
Roll Over Relief can be claimed when a capital asset which has been used for trade purposes (e.g. a building) is sold at a gain and the whole of the sales proceeds are invested in other qualifying assets to be used for trade purposes. The value of the new asset is deemed to be reduced by the amount of the gain arising on the sale of the first asset. The sale proceeds must be reinvested in the period commencing twelve months before and three years after the sale of the original asset. If the entire proceeds of the sale are not reinvested, only partial roll-over relief is available.
Inheritance Tax
Nil Rate Band (NRB) 1 £325,000
Rate above NRB 40% 2
Lifetime transfers to certain trusts 20% Annual exemption for lifetime gifts £3,000 Small gifts - annual amount per donee £250
1
Frozen until 2018/19 2
There is a reduced rate of 36% for an estate leaving 10% or more to charity on or after 6 April 2012
Tapering relief applies to reduce the tax on transfers within 7 years of death. The reduction in tax is 20% for survivorship of 3-4 years, 40% for 4-5, 60% for 5-6 and 80% for 6-7 years.
It should be noted that it is now possible for a nil rate band which is unused on a person’s death to be transferred to the estate of their spouse or civil partner. Chargeable transfers at death are subject to IHT, but there is no IHT charged on lifetime gifts to individuals. Such transfers are known as potentially exempt transfers (PETs). Where the donor dies within seven years of making a PET, the transfer is taxed on its value at the date of the gift, using the death rate scale applicable at the date of death.
A new tax free band worth £175,000 per individual (£350,000 per married couple) is being phased in from 2017 in respect of the transfer of an individual’s main home on death. The £350,000 allowance applies where the property is passed between spouses on first death and then on to children or grandchildren.

TAXATION 490
Combining the new allowance with the existing IHT Nil Rate Band of £325,000 per individual means that by 2020 a married couple will effectively have a combined NRB of £1millon. However, this new allowance is only available in full where the value of the deceased estate is under £2million. In deceased estates with a value of over £2million, the allowance is reduced by £1 for every £2 over £2million. So by 2020 (when the allowance is £175,000) deceased estates with a value of more than £2.35million will not benefit from the allowance.
A number of transfers are left out of account in arriving at the cumulative total on which a person is chargeable. These include transfers between spouses, lifetime transfers made in a year up to a value of £3,000 and transfers to charities.
Wide ranging changes to IHT were announced in 2006 which have had a significant impact on UK estate planning using trusts. As a result of the scope and complexity of these trust rules it is not possible to consider the detail here. Farmers would be advised to consult their tax advisers to review the terms of existing trusts and their wills.
Agricultural and business property relief can in some circumstances reduce the value of the chargeable transfer to Nil.
Agricultural Property Relief (APR)
Nature of property Rate of Relief
Vacant possession or right to obtain vacant possession within 12 months
100%
Agricultural land let after 1 September 1995 100% Any other circumstances * 50%
* The 100% relief can apply in certain circumstances where land has been owned and let since before 10 March 1981 and by Extra Statutory Concession F17.
Agricultural Property Relief (APR) only applies to the agricultural value of farmland. Where the farm has additional development value this may qualify for Business Property Relief (BPR).
Agricultural property includes “such cottages, farm buildings and farmhouses, together with the land occupied with them, as are of a character appropriate to the property”. To qualify for APR, the transferor must either have farmed the agricultural property for two years before the transfer or have owned it for seven years before the transfer, during the whole of which time it has been occupied for the purposes of agriculture. As with gift relief, land anywhere within the EEA will qualify.
In order to obtain APR for a farmhouse it is necessary to show that the farmhouse is of a character and size appropriate to the property and the requirements of the farming activities conducted on the agricultural land. Relief may therefore be denied where the farmhouse is excessively large

TAXATION 491
in relation to the farm. The definition of farmhouses and other agricultural property has been considered in a number of cases. HMRC will review APR claims more or less as a matter of course and specialist advice may be needed now, i.e. on a proactive basis, or in the event of an HMRC challenge.
Business Property Relief (BPR)
Nature of property Rate of Relief
Business or interest in a business 100% Controlling shareholding in quoted company 50% Shareholding in unquoted company 100% Controlling holding in unquoted securities 100% Settled property used in the business of a life tenant 100%/50%* Land, buildings, plant used in company or partnership 50%
* 100% relief is available where the property is transferred with the business on death otherwise the 50% rate applies.
BPR is a relief against IHT on business assets, including a tenant’s capital items such as machinery and livestock. To qualify for BPR, the property should have been owned by the claimant for two years before the transfer (or it must have replaced other qualifying assets owned for at least two out of the five years before the transfer). BPR is not available if the business or company is one of “wholly or mainly” dealing in securities, stocks or shares, land or buildings or in the making or holding of investments. Some business activities are borderline and particular care will be needed for mixed estates comprising farming and letting activities.
Value Added Tax
Standard rate (1/6 of VAT-inclusive price) 20.0% Registration level from 1 April 2018 £85,000 per annum Deregistration level from 1 April 2018 £83,000 per annum
Value added tax (VAT) is an indirect tax on sales of goods and services. In general, a taxable business pays VAT on its purchases (input tax) and charges VAT on its sales (output tax). Taxable businesses are required to pass on the output tax to HMRC and may reclaim input tax. From 1 April 2018 businesses with an annual turnover of taxable goods and services of more than £85,000 are required to register for VAT. Businesses with a turnover of less than £83,000 may elect to deregister. It is also possible to voluntarily register for VAT where turnover is below £85,000 if this is seen to be beneficial. Once registered VAT returns are normally submitted to HMRC quarterly (although it is possible to apply for monthly VAT returns subject to certain conditions - see below).

TAXATION 492
There are three rates of VAT applicable to taxable income: a standard rate, a reduced rate of 5% and a 0% rate. The standard rate is currently 20% and has been at this level since 4 January 2011.
Some income streams are not taxable, and are exempt from VAT. This can include supplies made in connection with land, i.e. renting or selling land or property. It is possible to ‘opt to tax’ land or property so that you can make the lease, licence or sale taxable. This is beneficial if there is input VAT to claim on expenditure connected with the property. The option to tax does not apply to residential accommodation.
Since farm businesses often have zero rated taxable income they can often be in a position where VAT being reclaimed from HMRC exceeds output VAT paid. In such situations, it is advisable to apply to HMRC to submit monthly rather than quarterly returns to aid cashflow. This can be done online.
Farmers may deregister for VAT and elect to use the “flat rate” farmers’ scheme. A “flat rate” farmer cannot reclaim VAT on inputs, but charges and retains a flat rate addition of 4% on designated farming activities. This applies even if some of the goods would otherwise be zero rated. If the farmer is involved in other non-farming activities (e.g. bed and breakfast) which have a turnover above the VAT threshold, the flat rate scheme may not be available.
The following is a brief summary of the VAT rates as they apply to typical farming activities and expenditure.
VAT - exempt Items Banking Certain subscriptions Cottage rents other than for holiday purposes Granting of credit and loans Instalment credit finance charges on a hire-purchase Insurances Land let for growing grain, etc* Postal services Purchase or sale of land and existing buildings* Rent* Easements, Wayleaves, Servitudes, Rights of Way*
* The grant of a lease, licence or sale of land and property is exempt from VAT. Therefore the above activities marked with a * are exempt from VAT unless an option to tax is in place. If an option to tax is in place these supplies are standard rated.
VAT - standard rated goods and services Accountants’ fees Artificial insemination Binder twine
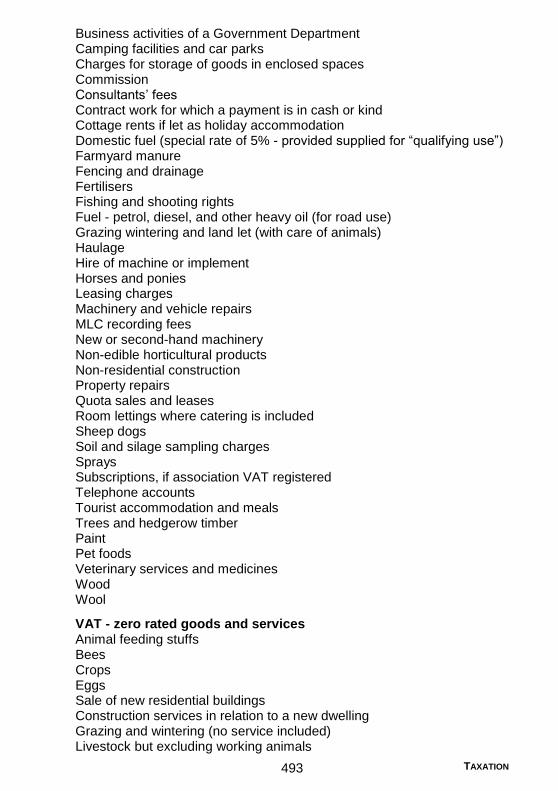
TAXATION 493
Business activities of a Government Department Camping facilities and car parks Charges for storage of goods in enclosed spaces Commission Consultants’ fees Contract work for which a payment is in cash or kind Cottage rents if let as holiday accommodation Domestic fuel (special rate of 5% - provided supplied for “qualifying use”) Farmyard manure Fencing and drainage Fertilisers Fishing and shooting rights Fuel - petrol, diesel, and other heavy oil (for road use) Grazing wintering and land let (with care of animals) Haulage Hire of machine or implement Horses and ponies Leasing charges Machinery and vehicle repairs MLC recording fees New or second-hand machinery Non-edible horticultural products Non-residential construction Property repairs Quota sales and leases Room lettings where catering is included Sheep dogs Soil and silage sampling charges Sprays Subscriptions, if association VAT registered Telephone accounts Tourist accommodation and meals Trees and hedgerow timber Paint Pet foods Veterinary services and medicines Wood Wool
VAT - zero rated goods and services Animal feeding stuffs Bees Crops Eggs Sale of new residential buildings Construction services in relation to a new dwelling Grazing and wintering (no service included) Livestock but excluding working animals

TAXATION 494
Milk Newspapers and periodicals Seeds of food and seed plants Trees and bushes if used for production of edible fruit
Outside the scope of VAT Grants Compensation Insurance Claims Dilapidation payments
Car fuel scale charges Other than farm vehicles, where fuel is purchased for vehicles which are used for private and business purposes, VAT is only partially recoverable. To make things simpler businesses can use the VAT Fuel Scale Charge. When using this system the business reclaims all VAT incurred on fuel and then accounts for the private use using the fuel scale charge. Alternatively, the business can elect to not recover any VAT incurred on fuel.
The VAT road fuel scale charges are based on the emissions rating of the vehicle and were updated with effect from 1 May 2018. These figures should be used only from the start of the next VAT accounting period beginning on or after that date. These figures along with previous years can be found on the HMRC website at https://www.gov.uk/government/publications/vat-road-fuel-scale-charges-table
Basic Payment Scheme Entitlements The receipt of BPS from the EU is outside the scope of VAT.
The sale or lease of BPS entitlements by a VAT registered business is treated as a supply. This means that the purchase price would be subject to VAT at the standard rate and farmers would be looking to recover this input VAT.
Brexit The UK will leave the European Union on 29 March 2019 which will be followed by a 21 month transition period to 31 December 2020. VAT is an EU tax and is governed by an EU Directive, however, it is unlikely that there will be any significant changes to the VAT system before 31 December 2020 that will impact on farm and estate businesses. The UK is expected to retain a VAT system after 31 December 2020 and beyond.
Businesses who currently trade with EU suppliers and customers should consider their position following exit from the EU. Measures can be taken such as applying for AEO (“Authorised Economic Operator”) status and duty deferment schemes to better facilitate trade.

TAXATION 495
National Insurance Contributions (NICs)
Class 1 (employees) Main rate
Employee contributions - on earnings £162.00 - £892.00 pw 12.0% - on earnings above £892.00 pw 2.0%
Employer contributions - on all earnings above £162.00 pw 13.8%
Employer contributions (at 13.8%) are also due on most benefits in kind and on tax paid on an employee’s behalf under a PAYE settlement agreement.
Class 2 (self-employed)
Flat rate per week £2.95 Small earnings exception: profits per annum £6,205
Class 3 (voluntary)
Flat rate per week £14.65
Class 4 (self-employed)
On profits £8,424 - £46,350 9.0% On profits over £46,350 2.0%
From 6 April 2014, every business or charity in the UK is entitled to benefit from an “allowance” in respect of their employer Class 1 NIC liability. This “allowance” was £2,000 from 6 April 2014 to 5 April 2016 and £3,000 from 6 April 2016.
Self-employed individuals will pay both Class 2 and Class 4 NICs and these will be collected through the Self Assessment tax return. No NIC is levied if the individual is over state pension age.
Stamp Duty (SD)
% of Total Consideration
Shares and marketable securities (nil if value up to £1,000)
0.5%
Stamp Duty Land Tax (SDLT)/Land Building Transaction Tax (LBTT) in Scotland
Commercial Property LBTT SDLT
Up to £150,000 0% Up to £150,000 0% Over £150,000 to £350,000 3% Over £150,000 to £250,000 2% Over £350,000 4.5% Over £250,000 5%
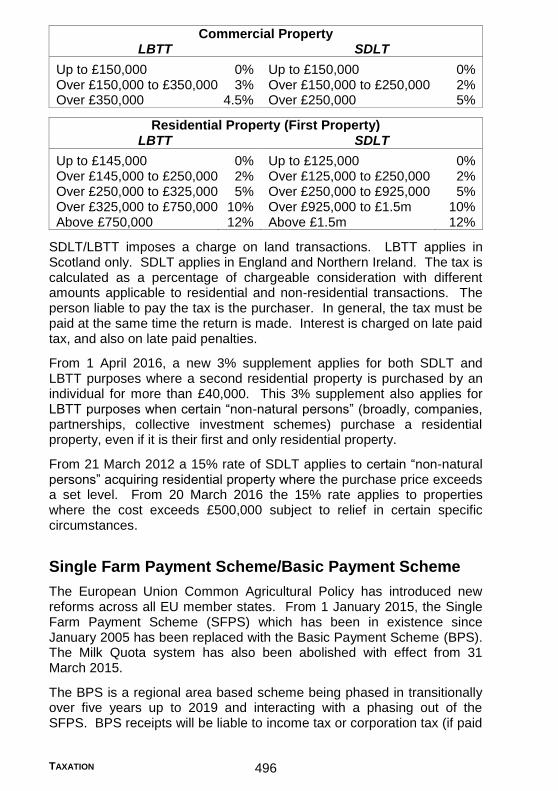
TAXATION 496
Commercial Property LBTT SDLT
Up to £150,000 0% Up to £150,000 0% Over £150,000 to £350,000 3% Over £150,000 to £250,000 2% Over £350,000 4.5% Over £250,000 5%
Residential Property (First Property) LBTT SDLT
Up to £145,000 0% Up to £125,000 0% Over £145,000 to £250,000 2% Over £125,000 to £250,000 2% Over £250,000 to £325,000 5% Over £250,000 to £925,000 5% Over £325,000 to £750,000 10% Over £925,000 to £1.5m 10% Above £750,000 12% Above £1.5m 12%
SDLT/LBTT imposes a charge on land transactions. LBTT applies in Scotland only. SDLT applies in England and Northern Ireland. The tax is calculated as a percentage of chargeable consideration with different amounts applicable to residential and non-residential transactions. The person liable to pay the tax is the purchaser. In general, the tax must be paid at the same time the return is made. Interest is charged on late paid tax, and also on late paid penalties.
From 1 April 2016, a new 3% supplement applies for both SDLT and LBTT purposes where a second residential property is purchased by an individual for more than £40,000. This 3% supplement also applies for LBTT purposes when certain “non-natural persons” (broadly, companies, partnerships, collective investment schemes) purchase a residential property, even if it is their first and only residential property.
From 21 March 2012 a 15% rate of SDLT applies to certain “non-natural persons” acquiring residential property where the purchase price exceeds a set level. From 20 March 2016 the 15% rate applies to properties where the cost exceeds £500,000 subject to relief in certain specific circumstances.
Single Farm Payment Scheme/Basic Payment Scheme
The European Union Common Agricultural Policy has introduced new reforms across all EU member states. From 1 January 2015, the Single Farm Payment Scheme (SFPS) which has been in existence since January 2005 has been replaced with the Basic Payment Scheme (BPS). The Milk Quota system has also been abolished with effect from 31 March 2015.
The BPS is a regional area based scheme being phased in transitionally over five years up to 2019 and interacting with a phasing out of the SFPS. BPS receipts will be liable to income tax or corporation tax (if paid
TAXATION 497
to a company) and should be included in the taxable trading income in the relevant accounting period.
For more information on CAP Reform and the BPS, see pages 438-466.
Single Farm Payment Scheme Payment Entitlement The SFPS entitlement has been agreed by HMRC as an asset for CGT purposes. In most cases, the base cost for the asset will be nil where the entitlement was received in 2005 at the outset of the scheme and no CGT issue will arise. However, in some cases the entitlement will have been acquired at a later date. In these cases the acquisition cost is the base cost for CGT purposes.
In Scotland, Wales and Northern Ireland, HMRC have agreed that a capital loss arises on the date at which the SFPS entitlement ceased. This will be between 16 May 2014 and 31 December 2014 and therefore the capital loss claim should have been made on the 2014/15 self assessment tax return. Capital losses for 2014/15 can be claimed at any time up to 5 April 2019 so it is not too late to claim now.
HMRC have confirmed that no correlative position exists in England and any loss claims in respect of Single Farm Scheme Payment Entitlements made in respect of English farming operations will be rejected.
Commercial Woodlands
Commercial woodlands enjoy a tax favoured status.
For income tax purposes, sales of timber from commercial woodland can be outside the scope of income tax. However, in circumstances where land is predominantly occupied for another purpose, receipts from the sale of timber may fall outside the exemption. For example, receipts from the sale of trees planted on a farm should be included as part of farming profits. An owner of commercial woodlands who simply lets the land will receive income in the form of rent and this would be classed as profits from a rental business.
In relation to capital gains tax, profits from the sale of trees are exempt, but there may be a charge to capital gains tax on a profit on the sale of land (i.e. the solum). Furthermore, the occupation of commercial woodlands is a qualifying activity for roll-over and hold-over reliefs.
Inheritance tax exemption is potentially available through 100% Business Property Relief once a two year period of ownership of commercial woodlands has been established. Agricultural Property Relief would potentially be available on woodlands whose occupation is ancillary to the agricultural land. An example of this would be a woodland shelter belt. For more information see the Forestry and Farm Woodlands section on pages 293.

TAXATION 498
Anti-Avoidance
The “General Anti-Abuse Rule” (“GAAR”) came into force with the enactment of the Finance Act 2013 on 17 July 2013. The rule counteracts abusive tax avoidance schemes and applies to income tax, national insurance contributions, corporation tax, capital gains tax, inheritance tax, petroleum revenue tax and stamp duty land tax.
The measure supports the Government's objective of promoting fairness in the tax system by deterring taxpayers from entering into abusive schemes that might succeed under current law. The GAAR provides that tax advantages arising from such arrangements are counteracted on a just and reasonable basis.
The UK GAAR legislation has a 'safety net' arrangement in that there is a requirement for HM Revenue & Customs to seek opinion from an independent panel before invoking the GAAR legislation. There is now a separate Scottish GAAR which initially will only apply to the two devolved taxes (Land and Buildings transaction tax (LBTT) and Scottish landfill tax). The Scottish GAAR has no requirement to bring in an independent perspective and, therefore, gives much more power to Revenue Scotland. It is intended that the Scottish GAAR will extend to all devolved taxes in the future.
Making Tax Digital
In the March 2015 Budget, the Government announced its vision for a new digital tax administration and there was much publicity about this being the death of the annual self-assessment tax return. The transformation of the tax system, to be fully in place by April 2020, was hailed by HMRC as being simpler, more effective and more efficient.
Under Making Tax Digital (MTD) there will be a requirement to keep accounting records in a digital format and to submit income details, expenditure details and tax computations to HMRC using MTD compatible software on at least a quarterly basis. The new system will have a fundamental impact on record-keeping and businesses/landlords will be required to use digital tools such as cloud software or apps, which will have the ability to upload information to HMRC. Each taxpayer will have an online ‘digital account’ where they will be able to view their payments.
The intended timetable for MTD has changed and in July 2017 HMRC confirmed that MTD reporting will not start until April 2019, and then only for VAT purposes. Businesses will not need to provide a quarterly update to HMRC for other taxes until at least 2020 at the earliest to enable a reappraisal of the plans. Businesses with a turnover below £85,000 will have the option to provide digital records voluntarily via MTD.

TAXATION 499
Eventually all businesses and organisations will have to comply with MTD. Quarterly MTD returns will replace the annual corporation tax return and the business pages of self-assessment tax returns. A quarterly return will need to be made for each tax a business pays. Therefore, there will eventually be a requirement to submit a quarterly VAT return, as well as a quarterly corporation tax or income tax return.
Summary of Income Tax and Capital Gains Tax Rates
7.5% Basic Rate for Dividend Income 10% Capital Gains Tax Rate for gains attracting Entrepreneurs
Relief 10% Capital Gains Tax Rate for gains up to Basic Rate limit 18% Capital Gains Tax Rate for gains on Residential Property up
to Basic Rate limit 19% Starter Rate for Scottish NSND (non-savings/non-dividend)
Income 20% Capital Gains Tax Rate for gains above Basic Rate limit 20% Basic Rate for Scottish NSND Income 20% Basic Rate for RUK NSND income 20% Basic Rate for Savings Income 21% Intermediate Rate for Scottish NSND Income 28% Capital Gains Tax Rate for gains on Residential Property
above Basic Rate limit 32.5% Higher Rate for Dividend Income 38.1% Top Rate for Dividend Income 40% Higher Rate for RUK NSND Income 40% Higher Rate for Savings Income 41% Higher Rate for Scottish NSND Income 45% Top Rate for RUK NSND Income 45% Top Rate for Savings Income 46% Top Rate for Scottish NSND Income
Notes The Scottish Rate of Income Tax (SRIT) only applies to certain types of income. This is non-savings/non-dividend income (NSND) which is broadly salaries, self-employment profits, pension income and rental income.
Rates applying to NSND for Scottish Taxpayers. Rates applying to NSND for the rest of the UK (RUK). Rates for other income sources such as dividends and
bank, etc. interest are taxed at the same rate throughout the UK. Capital gains are also taxed at the same rate throughout the UK.


Miscellaneous

MISCELLANEOUS 502
Summary of Farm Management Practices (including useful dates and timings)
Good Agricultural and Environmental Conditions (GAEC) - Scotland
Buffer strips (GAEC 1) no cultivations and application of pesticides within
2m of the top of the bank of watercourses
1 Jan - 31 Dec
Water abstraction (GAEC 2) submit annual data return
by 31 Dec
Muirburn (GAEC 6) permitted between and inclusive
1 Oct - 15 Apr
(or 30 Apr with the landowner’s permission)
Hedges and trees (GAEC 7) no trimming between and inclusive
1 Mar - 31 Aug
(or 31 Jul if hedge/tree in field to be sown with WOSR or TGRS) no cultivations and application of fertilisers and
pesticides within 2m from the centre line of hedges 1 Jan - 31 Dec
Greening
Permanent grassland Nitrogen fertiliser and lime plan prepared by 9 Jun
Ecological Focus Areas (EFAs) EFA fallow period 15 Jan - 15 Jul Establish EFA green cover by 1 Nov Maintain EFA green cover until 31 Dec Establish EFA catch crop in ‘spring’ Maintain EFA catch crop until 31 Dec Harvest of EFA nitrogen fixing crops after 1 Aug Cut or graze EFA margins (buffers; cut only, not graze) after 15 Jul EFA map submit by 15 May
Diffuse Pollution General Binding Rules (DP GBRs) - Scotland
Minimum legal working distances from watercourses:
Within 2m of a watercourse no application of inorganic fertiliser no application of pesticides no cultivation (from top of bank)
Within 5m of a watercourse prevent significant poaching
Within 5m of spring, well or borehole no fertiliser application no cultivation no livestock

MISCELLANEOUS 503
Within 10m of a watercourse no slurry or manure application no storage of fertiliser (including temporary field middens) no livestock feeders
Within 50m of spring, well or borehole no storage of fertilisers (including temporary field middens) no slurry or manure application
NVZ - Scotland (SMR 1)
NVZ fertiliser and manure management plan prepared before 1 Mar
NVZ closed periods (organic manures with a high available N content):
Grassland Other land Shallow or sandy soils 1 Sep - 31 Dec 1 Aug - 31 Dec All other soil types 15 Oct - 31 Jan 1 Oct - 31 Jan
NVZ closed periods (manufactured nitrogen fertiliser):
Grassland Other land Moray, Aberdeenshire, Banff & Buchan NVZ
15 Sep - 20 Feb
1 Sep - 20 Feb
All other Scottish NVZ areas 15 Sep - 15 Feb 1 Sep - 15 Feb
NVZ - England, Wales and Northern Ireland
NVZ closed periods (organic manures with a high available N content):
Grassland Other land Shallow or sandy soils 1 Sep - 31 Dec 1 Aug - 31 Dec All other soil types 15 Oct - 31 Jan* 1 Oct - 31 Jan* *(15 Oct - 31 Jan NI)
NVZ closed periods (manufactured nitrogen fertiliser):
Grassland Other land England and Wales 15 Sep - 15 Jan 1 Sep - 15 Jan Northern Ireland 15 Sep - 31 Jan 15 Sep - 31 Jan
Business Management
Tax Return paper forms online
submit by 31 Oct submit by 31 Jan
IACS forms (Scotland) submit by 15 May
AECS annual management options claim submit by 15 May
Scottish Suckler Beef Support Scheme claim submit by 31 Dec
Scottish Upland Sheep Support Scheme claim submit 1 Sep - 30 Nov
Beef Efficiency Scheme - data recording calves born 1 Jan - 1 Jun calves born 2 June - 31 Dec
submit by 15 July submit by 7 Feb
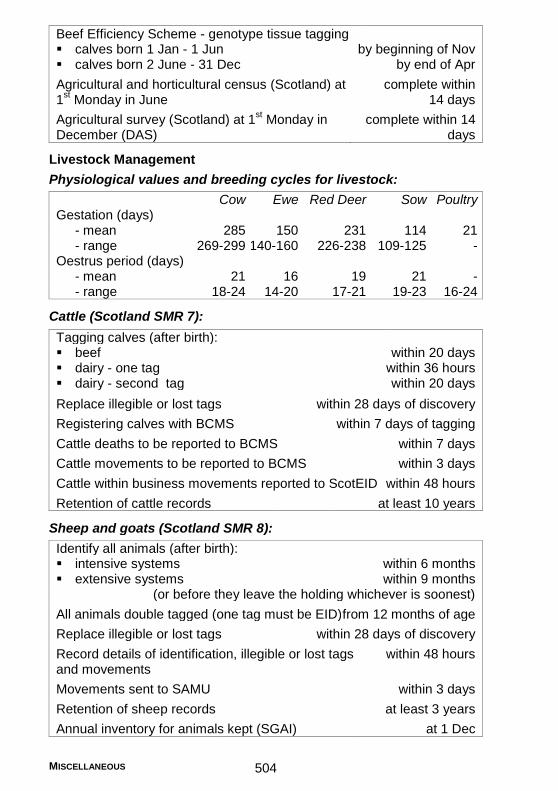
MISCELLANEOUS 504
Beef Efficiency Scheme - genotype tissue tagging calves born 1 Jan - 1 Jun calves born 2 June - 31 Dec
by beginning of Nov by end of Apr
Agricultural and horticultural census (Scotland) at 1
st Monday in June
complete within 14 days
Agricultural survey (Scotland) at 1st Monday in
December (DAS) complete within 14
days
Livestock Management
Physiological values and breeding cycles for livestock:
Cow Ewe Red Deer Sow Poultry Gestation (days)
- mean 285 150 231 114 21 - range 269-299 140-160 226-238 109-125 -
Oestrus period (days) - mean 21 16 19 21 - - range 18-24 14-20 17-21 19-23 16-24
Cattle (Scotland SMR 7):
Tagging calves (after birth): beef dairy - one tag dairy - second tag
within 20 days within 36 hours within 20 days
Replace illegible or lost tags within 28 days of discovery
Registering calves with BCMS within 7 days of tagging
Cattle deaths to be reported to BCMS within 7 days
Cattle movements to be reported to BCMS within 3 days
Cattle within business movements reported to ScotEID within 48 hours
Retention of cattle records at least 10 years
Sheep and goats (Scotland SMR 8):
Identify all animals (after birth): intensive systems extensive systems
within 6 months within 9 months
(or before they leave the holding whichever is soonest)
All animals double tagged (one tag must be EID) from 12 months of age
Replace illegible or lost tags within 28 days of discovery
Record details of identification, illegible or lost tags and movements
within 48 hours
Movements sent to SAMU within 3 days
Retention of sheep records at least 3 years
Annual inventory for animals kept (SGAI) at 1 Dec
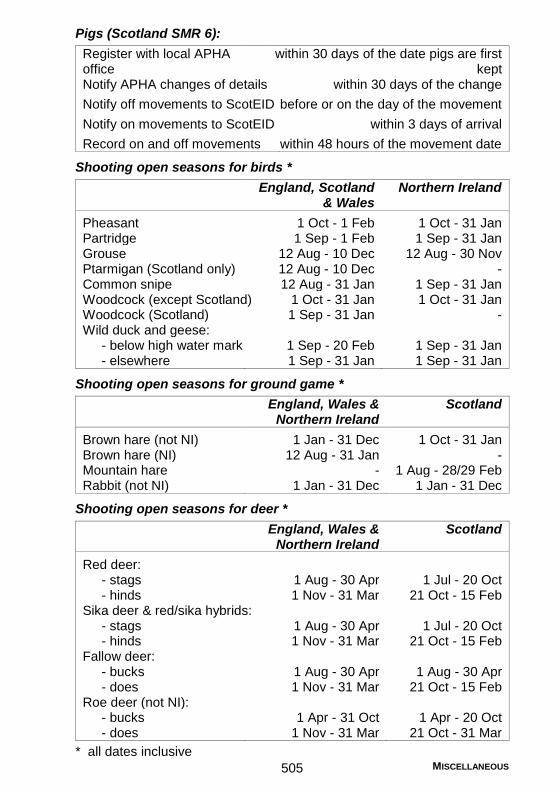
MISCELLANEOUS 505
Pigs (Scotland SMR 6):
Register with local APHA office
within 30 days of the date pigs are first kept
Notify APHA changes of details within 30 days of the change
Notify off movements to ScotEID before or on the day of the movement
Notify on movements to ScotEID within 3 days of arrival
Record on and off movements within 48 hours of the movement date
Shooting open seasons for birds *
England, Scotland & Wales
Northern Ireland
Pheasant 1 Oct - 1 Feb 1 Oct - 31 Jan Partridge 1 Sep - 1 Feb 1 Sep - 31 Jan Grouse 12 Aug - 10 Dec 12 Aug - 30 Nov Ptarmigan (Scotland only) 12 Aug - 10 Dec - Common snipe 12 Aug - 31 Jan 1 Sep - 31 Jan Woodcock (except Scotland) 1 Oct - 31 Jan 1 Oct - 31 Jan Woodcock (Scotland) 1 Sep - 31 Jan - Wild duck and geese:
- below high water mark 1 Sep - 20 Feb 1 Sep - 31 Jan - elsewhere 1 Sep - 31 Jan 1 Sep - 31 Jan
Shooting open seasons for ground game *
England, Wales & Northern Ireland
Scotland
Brown hare (not NI) 1 Jan - 31 Dec 1 Oct - 31 Jan Brown hare (NI) 12 Aug - 31 Jan - Mountain hare - 1 Aug - 28/29 Feb Rabbit (not NI) 1 Jan - 31 Dec 1 Jan - 31 Dec
Shooting open seasons for deer *
England, Wales & Northern Ireland
Scotland
Red deer: - stags 1 Aug - 30 Apr 1 Jul - 20 Oct - hinds 1 Nov - 31 Mar 21 Oct - 15 Feb
Sika deer & red/sika hybrids: - stags 1 Aug - 30 Apr 1 Jul - 20 Oct - hinds 1 Nov - 31 Mar 21 Oct - 15 Feb
Fallow deer: - bucks 1 Aug - 30 Apr 1 Aug - 30 Apr - does 1 Nov - 31 Mar 21 Oct - 15 Feb
Roe deer (not NI): - bucks 1 Apr - 31 Oct 1 Apr - 20 Oct - does 1 Nov - 31 Mar 21 Oct - 31 Mar
* all dates inclusive
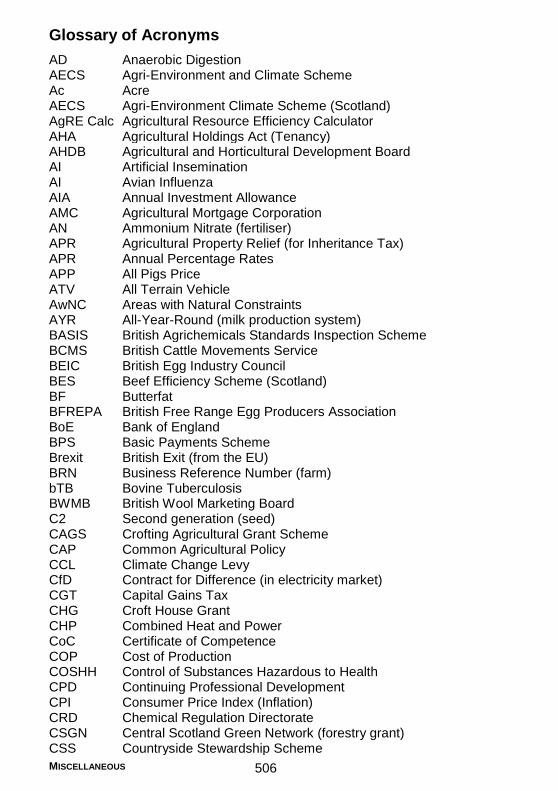
MISCELLANEOUS 506
Glossary of Acronyms
AD Anaerobic Digestion AECS Agri-Environment and Climate Scheme Ac Acre AECS Agri-Environment Climate Scheme (Scotland) AgRE Calc Agricultural Resource Efficiency Calculator AHA Agricultural Holdings Act (Tenancy) AHDB Agricultural and Horticultural Development Board AI Artificial Insemination AI Avian Influenza AIA Annual Investment Allowance AMC Agricultural Mortgage Corporation AN Ammonium Nitrate (fertiliser) APR Agricultural Property Relief (for Inheritance Tax) APR Annual Percentage Rates APP All Pigs Price ATV All Terrain Vehicle AwNC Areas with Natural Constraints AYR All-Year-Round (milk production system) BASIS British Agrichemicals Standards Inspection Scheme BCMS British Cattle Movements Service BEIC British Egg Industry Council BES Beef Efficiency Scheme (Scotland) BF Butterfat BFREPA British Free Range Egg Producers Association BoE Bank of England BPS Basic Payments Scheme Brexit British Exit (from the EU) BRN Business Reference Number (farm) bTB Bovine Tuberculosis BWMB British Wool Marketing Board C2 Second generation (seed) CAGS Crofting Agricultural Grant Scheme CAP Common Agricultural Policy CCL Climate Change Levy CfD Contract for Difference (in electricity market) CGT Capital Gains Tax CHG Croft House Grant CHP Combined Heat and Power CoC Certificate of Competence COP Cost of Production COSHH Control of Substances Hazardous to Health CPD Continuing Professional Development CPI Consumer Price Index (Inflation) CRD Chemical Regulation Directorate CSGN Central Scotland Green Network (forestry grant) CSS Countryside Stewardship Scheme

MISCELLANEOUS 507
CP Crude Protein CTS Cattle Tracing System CU Customs Union DA Disadvantaged Area DAP Diammonium Phosphate (fertiliser) DAERA Department of Agriculture, Environment and Rural Affairs
(Northern Ireland) DCP Dicalcium Phosphate DEFRA Department for Environment Food & Rural Affairs DUP Digestible Undegradable Protein DM Dry Matter DWT Dead-weight EAMU Extension of Authorisation for Minor Use EC European Commission ECA European Communities Act (1972) ECB European Central Bank ECJ European Court of Justice EEA European Economic Area EFA Ecological Focus Areas EFTA European Free Trade Association EIA Environmental Impact Assessment EID Electronic Identifier ELS Entry Level Stewardship Scheme EOI Expression of Interest EP European Parliament EPC Energy Performance Certificate ERDF European Rural Development Fund ES Environmental Stewardship EU European Union FACTS Fertiliser Advisers Certification and Training Scheme FAO Food & Agriculture Organisation of the United Nations FBI Farm Business Income FBS Farm Business Survey FBT Farm Business Tenancy FD Financial Discipline FGS Forestry Grant Scheme FIT Feed-In Tariff FT Full Time FTA Free Trade Agreement FW Fresh Weight FYM FarmYard Manure GAEC Good Agricultural & Environmental Condition GB Great Britain GDP Gross Domestic Product GHGs Greenhouse Gases GLA Gangmasters Licensinig Authority GLU Grazing Livestock Unit GM Genetically Modified
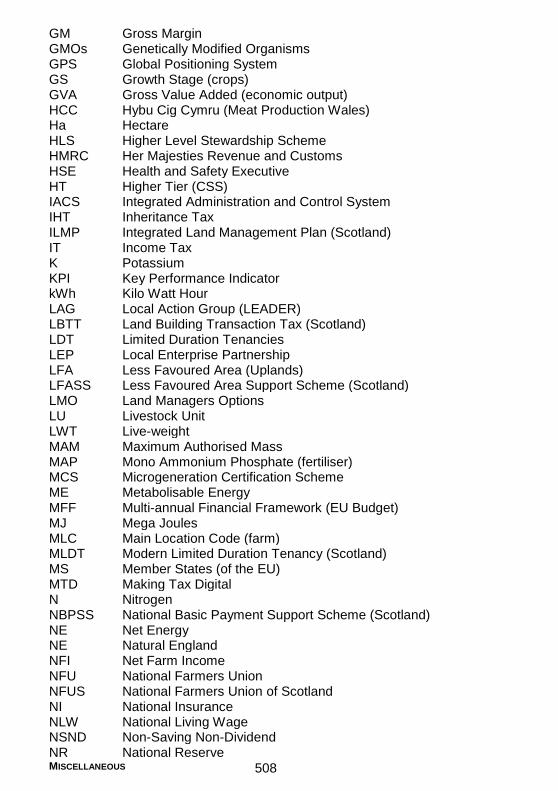
MISCELLANEOUS 508
GM Gross Margin GMOs Genetically Modified Organisms GPS Global Positioning System GS Growth Stage (crops) GVA Gross Value Added (economic output) HCC Hybu Cig Cymru (Meat Production Wales) Ha Hectare HLS Higher Level Stewardship Scheme HMRC Her Majesties Revenue and Customs HSE Health and Safety Executive HT Higher Tier (CSS) IACS Integrated Administration and Control System IHT Inheritance Tax ILMP Integrated Land Management Plan (Scotland) IT Income Tax K Potassium KPI Key Performance Indicator kWh Kilo Watt Hour LAG Local Action Group (LEADER) LBTT Land Building Transaction Tax (Scotland) LDT Limited Duration Tenancies LEP Local Enterprise Partnership LFA Less Favoured Area (Uplands) LFASS Less Favoured Area Support Scheme (Scotland) LMO Land Managers Options LU Livestock Unit LWT Live-weight MAM Maximum Authorised Mass MAP Mono Ammonium Phosphate (fertiliser) MCS Microgeneration Certification Scheme ME Metabolisable Energy MFF Multi-annual Financial Framework (EU Budget) MJ Mega Joules MLC Main Location Code (farm) MLDT Modern Limited Duration Tenancy (Scotland) MS Member States (of the EU) MTD Making Tax Digital N Nitrogen NBPSS National Basic Payment Support Scheme (Scotland) NE Net Energy NE Natural England NFI Net Farm Income NFU National Farmers Union NFUS National Farmers Union of Scotland NI National Insurance NLW National Living Wage NSND Non-Saving Non-Dividend NR National Reserve

MISCELLANEOUS 509
NRoSO National Register of Spray Operators NVZ Nitrate Vulnerable Zone OECD Organisation for Economic Co-operation & Development ONS Office of National Statistics OSR Oilseed Rape P Phosphorous P Protein PA Pesticide Application PAS Pot Ale Syrup PAYE Pay As You Earn PCHS Premium Cattle Health Scheme PLANET Planning Land Applications of Nutrients for Efficiency PPE Personal Protective Equipment PSGHS Premium Sheep and Goat Health Scheme PO Producer Organisation PLCD Proactive Land Change Detection (BPS mapping update) ppl Pence per litre PRG Perennial Rye Grass PV Photovoltaic (Solar) QMS Quality Meat Scotland RD Rural Development RDC Rural Development Contracts RDPE Rural Development Programme for England RHI Renewable Heat Incentive RICS Royal Institute of Chartered Surveyors RLR Rural Land Register RoC Return on Capital ROC Renewable Obligation Certificate RoI Return on Investment RPA Rural Payments Agency RPID Rural Payments and Inspection Directorate (Scotland) RPW Rural Payments Wales RPI Retail Price Index (Inflation) RUK Rest of UK RTFO Renewable Transport Fuel Obligation SACAPP SAC Association of Potato Producers SAF Single Application Form (for BPS) SAHPS Scottish Animal Health Planning System SAMU Scottish Animal Movements Unit SAW Seasonal Agricultural Workers SDA Severely Disadvantaged Area SDLT Stamp Duty Land Tax (Scotland) SEPA Scottish Environmental Protection Agency SFBS Scottish Farm Business Survey SFPS Single Farm Payment Scheme SGRPID Scottish Government Rural Payments and Inspection
Directorate SLDT Short Limited Duration Tenancy (Scotland)

MISCELLANEOUS 510
SME Small and Medium-Sized Enterprise SMR Statutory Management Requirement SMP Skimmed Milk Powder SNH Scottish Natural Heritage SOPA Scottish Organic Producers Association SP Single Payment SPP Standard Pig Price SPR Soil Protection Review SPS Single Farm Payment SQC Scottish Quality Crops SQQ Standard Quality Quotation (sheep price) SRDP Scottish Rural Development Programme SRIT Scottish Rate of Income Tax SSBSS Scottish Suckled Beef Support Scheme SSSI Site of Special Scientific Interest SUSSS Scottish Upland Sheep Support Scheme TB (Bovine) Tuberculosis TIFF Total Income From Farming TFP Total Factor Productivity TRQ Tariff Rate Quotas TTIP Transatlantic Trade and Investment Partnership UAA Utilisable Agricultural Area UELS Uplands Entry Level Scheme UKFS UK Forest Standard UKMFE UK Milk Futures Equivalent USDA United States Department of Agriculture USP Unique Selling Point WG Welsh Government WFD Water Framework Directive WHO World Health Organisation WIG Woodland Improvement Grant (Scotland) WMP Whole Milk Powder WRDP Welsh Rural Development Programme WTO World Trade Organisation YC Yield Class (timber) YESS Young Entrants Support Scheme YFP Young Farmers Payment YFS Young Farmers Scheme

MISCELLANEOUS 511
Imperial-Metric Conversion
Conversion factors
Imperial A Metric B
Length inch 25.4 mm 0.03937
foot 0.3048 m 3.281
yard 0.9144 m 1.094
chain 20.12 m 0.04971
mile 1.609 km 0.6214
Area acre 0.4047 ha 2.471
ft2 0.0929 m
2 10.76
yd2 0.8361 m
2 1.196
Volume ft3 0.02832 m
3 35.31
yd3 0.7646 m
3 1.308
pint 0.5682 litre 1.76
gal 4.546 litre 0.22
gal 0.004546 m3 219.969
fl oz 28.41 ml 0.0352
Weight oz 28.35 g 0.03527
lb 0.4536 kg 2.205
cwt 50.8 kg 0.01968
ton 1.016 t 0.9842
Energy therm 105.5 MJ 0.009478
kWh 3.6 MJ 0.2778
btu 1.055 KJ 0.9478
hp 745.7 W 0.001341
Temperature oF (
oF-32)
oC (
oCx1.8)
x0.5556 +32
Rate of use lb/ac 1.121 kg/ha 0.8922
cwt/ac 125.5 kg/ha 0.007966
ton/ac 2511 kg/ha 0.0003983
lb/gal 99.78 g/litre 0.01002
gal/ac 11.23 litre/ha 0.08902
units (fert)/ac 1.25 kg/ha 0.8
Unit cost £/ft2 10.76 £/m
2 0.0929
£/yd2 1.196 £/m
2 0.8361
£/ac 2.471 £/ha 0.4047
£/yd3 1.308 £/m
3 0.7646
£/gal 0.220 £/litre 4.546
£/ton 0.9842 £/t 1.016
£/cwt 0.01968 £/kg 50.8
£/lb 2.205 £/kg 0.4536
Note: Imperial unit x A = Metric unit
Metric unit x B = Imperial unit

MISCELLANEOUS 512
Imperial Metric
Length foot = 12 inches cm = 10 mm
yard = 3 feet m = 100 cm
mile = 1,760 yards km = 1,000 m
Area ft2 = 144 inches
2 m
2 = 10,000 cm
2
yd2 = 9 ft
2 km
2 = 1,000,000 m
2
acre = 4,840 yd2 km
2 = 100 ha
mile2 = 640 acres ha = 10,000 m
2
Volume pint = 20 fluid ounces litre = 1,000 ml
gallon = 8 pints
fluid ounce = 1.734 inches3
pint = 34.6774 inches3
gallon = 277.42 inches3
foot3 = 1,728 inches
3 cm
3 = 1,000 mm
3
yard3 = 46,656 inches
3 m
3 = 1,000,000 cm
3
Weight lb = 16 oz kg = 1,000 g
stone = 14 lb tonne = 1,000 kg
cwt = 112 lb
ton = 2,240 lb
Milk 1litre = 1.03 kg 1 kg = 0.971 litre
Irrigation 1 inch/acre = 102.75 m3
25 mm/ha = 250 m3
Energy hp = 550 ft lb force/sec hp = 75 m kg force /sec
Velocity mph = 1.609 km/hr km/hr = 0.6214 mph
m/sec = 3.281 ft/sec
Volume ft3/second = 0.02832 m
3/sec m
3/sec = 35.31 ft
3/sec
Flow rate gallon/min = 0.07577 litres/sec litre/sec = 13.2 gallons/min Specific volume rate ft
3/ton min = 0.02787 m
3/t min m
3/t min = 35.88 ft
3/ton min
Mass flow rate ton/hr = 0.2822 kg/sec kg/sec= 3.543 ton/hr

Contacts

CONTACTS 514
SAC Contact Details
SAC Consulting Area Offices
Ayr John F Niven Building, Auchincruive, Ayr KA6 5HW Tel: 01292 525252
E-mail: [email protected]
Balivanich Balivanich, Isle of Benbecula HS7 5LA Tel: 01870 602336
E-mail: [email protected]
Campbeltown 12 Burnside Street, Campbeltown, Argyll PA28 6JE Tel: 01586 552502
E-mail: [email protected]
Cupar Elmwood Campus, Carslogie Road, Cupar, Fife KY15 4JB Tel: 01334 654055
E-mail: [email protected]
Dumfries First Floor, Hestan House, Crichton Estate, Dumfries DG1 4TA
Tel: 01387 261172 E-mail: [email protected]
Edinburgh 2 Technopole Centre, Bush Estate, Penicuik, Midlothian EH26 0PJ
Tel: 0131 603 7520 E-mail: [email protected]
Elgin 15 Hay Street, Elgin, Morayshire IV30 1NQ Tel: 01343 548787
E-mail: [email protected]
Forfar 77 North Street, Forfar, Angus DD8 3BL
Tel: 01307 464033 E-mail: [email protected]
Inverness An Lochran, Plot 10 Inverness Campus, Inverness IV2 5NA Tel: 01463 233266
E-mail: [email protected]
Kendal J36, Rural Auction Centre, Crooklands, Milnthorpe Cumbria LA7 7FP
Tel: 01539 769059 E-mail: [email protected]
Kirkwall Martside, Grainshore Road, Hatston, Kirkwall, Orkney KW15 1FL
Tel: 01856 872698 E-mail: [email protected]

CONTACTS 515
Lanark 57 High Street, Lanark ML11 7LF Tel: 01555 662562
E-mail: [email protected]
Lerwick Agricultural Marketing Centre, Staney Hill, Lerwick Shetland ZE1 0NA Tel: 01595 693520
E-mail: [email protected]
Oban Glencruitten Road, Oban, Argyll PA34 4DW Tel: 01631 563093
E-mail: [email protected]
Perth Sandpiper House, Ruthvenfield Road Inveralmond Industrial Estate, Perth PH1 3EE
Tel: 01738 636611 E-mail: [email protected]
Portree Unit 3, 6 Leasgeary Place, Portree IV51 9BE Tel: 01478 612993
E-mail: [email protected]
St Boswells Greycrook, St Boswells, Roxburghshire TD6 0EU Tel: 01835 823322
E-mail: [email protected]
Stirling Caledonian Marts, Millhall, Stirling FK7 7LS Tel: 01786 450964
E-mail: [email protected]
Stonehaven Arduthie Business Centre, Kirkton Road, Stonehaven Kincardineshire AB39 2NQ
Tel: 01569 762305 E-mail: [email protected]
Stornoway 52 Bayhead, Stornoway, Isle of Lewis HS1 2DZ Tel: 01851 703103
E-mail: [email protected]
Stranraer 99 George Street, Stranraer, Wigtownshire DG9 7JP Tel: 01776 702649
E-mail: [email protected]
Thainstone Thainstone Agricultural Centre, Inverurie, Aberdeenshire AB51 5WU
Tel: 01467 625385 E-mail: [email protected]
Thurso Industrial Estate, Janetstown, Thurso, Caithness KW14 7XF
Tel: 01847 892602 E-mail: [email protected]
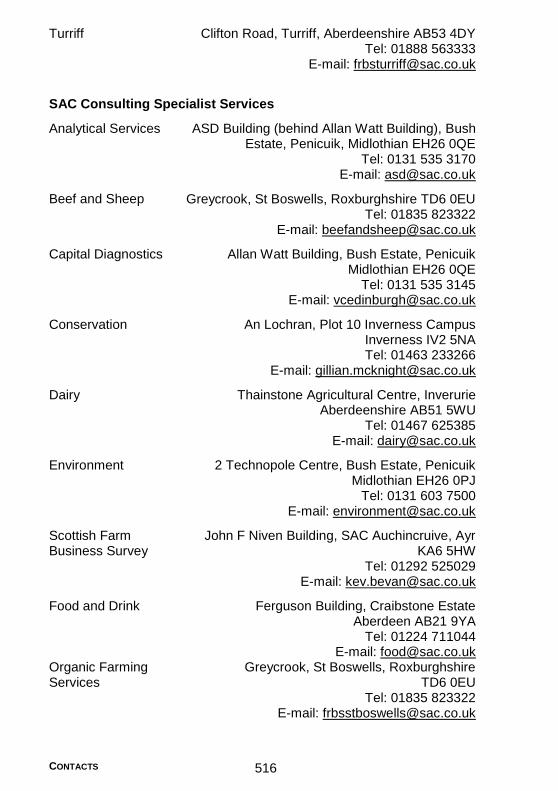
CONTACTS 516
Turriff Clifton Road, Turriff, Aberdeenshire AB53 4DY Tel: 01888 563333
E-mail: [email protected]
SAC Consulting Specialist Services
Analytical Services ASD Building (behind Allan Watt Building), Bush Estate, Penicuik, Midlothian EH26 0QE
Tel: 0131 535 3170 E-mail: [email protected]
Beef and Sheep Greycrook, St Boswells, Roxburghshire TD6 0EU Tel: 01835 823322
E-mail: [email protected]
Capital Diagnostics Allan Watt Building, Bush Estate, Penicuik Midlothian EH26 0QE
Tel: 0131 535 3145 E-mail: [email protected]
Conservation An Lochran, Plot 10 Inverness Campus Inverness IV2 5NA Tel: 01463 233266
E-mail: [email protected]
Dairy Thainstone Agricultural Centre, Inverurie Aberdeenshire AB51 5WU
Tel: 01467 625385 E-mail: [email protected]
Environment
2 Technopole Centre, Bush Estate, Penicuik Midlothian EH26 0PJ
Tel: 0131 603 7500 E-mail: [email protected]
Scottish Farm Business Survey
John F Niven Building, SAC Auchincruive, Ayr KA6 5HW
Tel: 01292 525029 E-mail: [email protected]
Food and Drink Ferguson Building, Craibstone Estate Aberdeen AB21 9YA
Tel: 01224 711044 E-mail: [email protected]
Organic Farming Services
Greycrook, St Boswells, Roxburghshire TD6 0EU
Tel: 01835 823322 E-mail: [email protected]

CONTACTS 517
Potatoes Ferguson Building, Craibstone Estate Aberdeen AB21 9YA
Tel: 01224 711215 E-mail: [email protected]
Premium Cattle Health Scheme
SAC Consulting Veterinary Services, Greycrook St Boswells, Roxburghshire TD6 0EQ
Tel: 01835 822456 E-mail: [email protected]
Premium Sheep and Goat Health Schemes
SAC Consulting Veterinary Services, Greycrook St Boswells, Roxburghshire TD6 0EQ
Tel: 01835 822456 E-mail: [email protected]
Rural Business Unit 2 Technopole Centre, Bush Estate, Penicuik Midlothian EH26 0PJ
Tel: 0131 603 7525 E-mail: [email protected]
Woodlands Caledonian Marts, Millhall, Stirling FK7 7LS Tel: 01786 450964
E-mail: [email protected]
SAC Consulting Disease Surveillance Centres
Aberdeen Mill of Craibstone, Bucksburn, Aberdeen AB21 9TB
Tel: 01224 711177 E-mail: [email protected]
Ayr Auchincruive, Ayr KA6 5AE
Tel: 01292 520318 E-mail: [email protected]
Dumfries St Mary's Industrial Estate, Dumfries DG1 1DX Tel: 01387 267260
E-mail: [email protected]
Edinburgh Allan Watt Building, Bush Estate, Penicuik Midlothian EH26 0QE
Tel: 0131 535 3130 E-mail: [email protected]
Inverness Drummondhill, Stratherrick Road, Inverness IV2 4JZ
Tel: 01463 243030 E-mail: [email protected]

CONTACTS 518
Perth 5 Bertha Park View, Perth PH1 3FZ Tel: 01738 629167
E-mail: [email protected]
St Boswells Greycrook, St Boswells, Roxburghshire TD6 0EQ
Tel: 01835 822456 E-mail: [email protected]
Thurso Janetstown, Thurso Caithness, KW14 7XF Tel: 01847 892602
E-mail: [email protected]
SRUC Specialist Units
Crop Clinic King’s Buildings, West Mains Road, Edinburgh EH9 3JG
Tel: 0131 535 4090 E-mail: [email protected]
Rural Policy Centre King’s Buildings, West Mains Road, Edinburgh EH9 3JG
Tel: 0131 535 4256 E-mail: [email protected]
SRUC Campuses
Barony Campus Parkgate, Dumfries DG1 3NE Tel: 01387 860251
E-mail: [email protected]
Elmwood Campus Carslogie Road, Cupar, Fife KY15 4JB Tel: 01334 658800
E-mail: [email protected]
Craibstone Campus Craibstone Estate, Aberdeen AB21 9YA Tel: 01224 711000
E-mail: [email protected]
King's Buildings Campus
Peter Wilson Building, King's Buildings, West Mains Road, Edinburgh EH9 3JG
Tel: 0131 535 4000 E-mail: [email protected]
Oatridge Campus
Ecclesmachan, Broxburn, West Lothian EH52 6NH
Tel: 01506 864800 E-mail: [email protected]

CONTACTS 519
Riverside Campus University Avenue, Ayr, Ayrshire KA8 0SX Tel: 01292 886200
E-mail: [email protected]
Machinery Ring Contact Details
ARGYLL AND ISLANDS RURAL BUSINESS RING LTD Glaikmore, North Kessock, Inverness IV1 3UD Tel: 01463 811603 Fax: 01463 811084 E-mail: [email protected] Website: www.hbsring.co.uk
BORDERS MACHINERY RING LTD Leader House, Mill Road, Earlston TD4 6DG Tel: 01896 758091 Fax: 01896 757036 E-mail: [email protected] Website: www.bordersmachineryring.co.uk
CAITHNESS MACHINERY RING LTD Quarrycrook, 7 Hoy, Halkirk KW12 6UU Tel: 01847 831378 E-mail: [email protected] Website: www.caithnessmachineryring.co.uk
HBS RING LTD Glaikmore, North Kessock, Inverness IV1 3UD Tel: 01463 811603 Fax: 01463 811084 E-mail: [email protected] Website: www.hbsring.co.uk
LOTHIAN MACHINERY RING LTD Overgogar House, Gogarbank, Edinburgh EH12 9DD. Tel: 0131 339 8730 Fax: 0131 317 8148 E-mail: [email protected] Website: www.lothianmachineryring.co.uk
ORKNEY BUSINESS RING LTD. Unit 1, Orkney Auction Mart, Grainshore Road, Kirkwall, Orkney KW15 1FL Tel: 01856 879080 Fax: 01856 879081 E-mail: [email protected]
RINGLINK (SCOTLAND) LTD. Cargill Centre Business Park, Aberdeen Road, Laurencekirk Aberdeenshire AB30 1EY Tel: 01561 377790 Fax: 01561 378231 E-mail: [email protected] Website: www.ringlinkscotland.co.uk
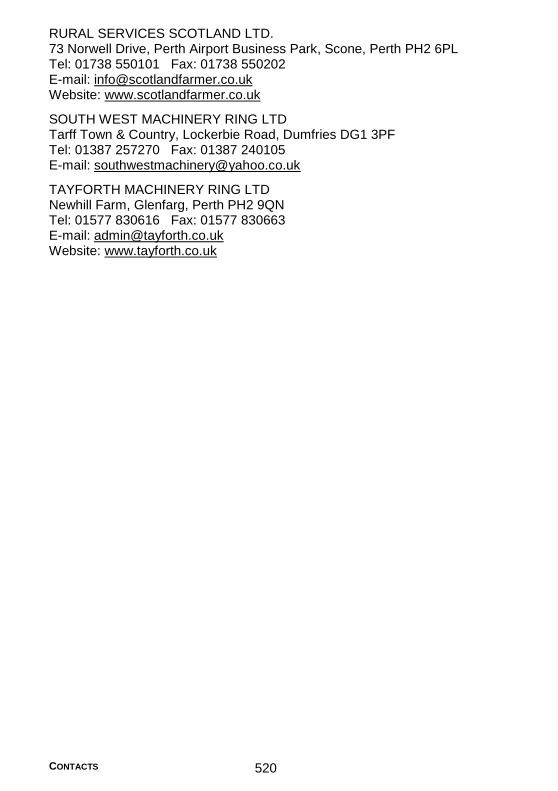
CONTACTS 520
RURAL SERVICES SCOTLAND LTD. 73 Norwell Drive, Perth Airport Business Park, Scone, Perth PH2 6PL Tel: 01738 550101 Fax: 01738 550202 E-mail: [email protected] Website: www.scotlandfarmer.co.uk
SOUTH WEST MACHINERY RING LTD Tarff Town & Country, Lockerbie Road, Dumfries DG1 3PF Tel: 01387 257270 Fax: 01387 240105 E-mail: [email protected]
TAYFORTH MACHINERY RING LTD Newhill Farm, Glenfarg, Perth PH2 9QN Tel: 01577 830616 Fax: 01577 830663 E-mail: [email protected] Website: www.tayforth.co.uk
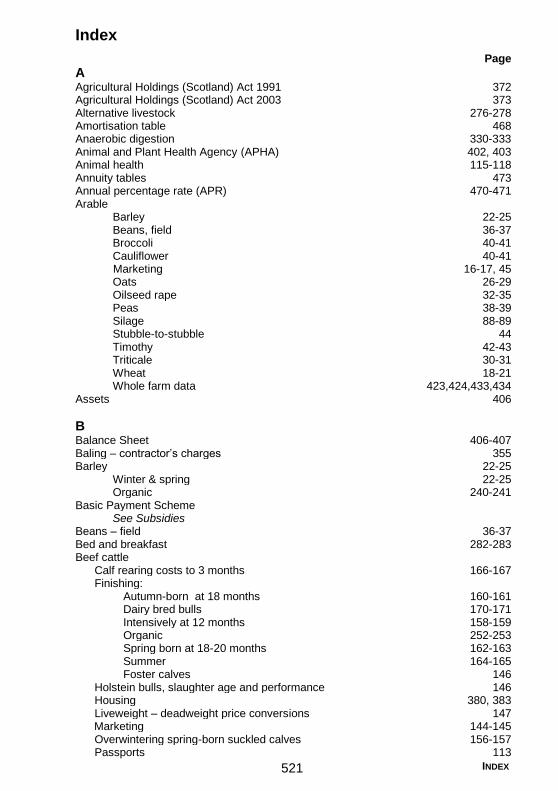
INDEX 521
Index Page
A
Agricultural Holdings (Scotland) Act 1991 372 Agricultural Holdings (Scotland) Act 2003 373 Alternative livestock 276-278 Amortisation table 468 Anaerobic digestion 330-333 Animal and Plant Health Agency (APHA) 402, 403 Animal health 115-118 Annuity tables 473 Annual percentage rate (APR) 470-471 Arable Barley 22-25 Beans, field 36-37
Broccoli 40-41 Cauliflower 40-41 Marketing 16-17, 45
Oats 26-29 Oilseed rape 32-35 Peas 38-39 Silage 88-89
Stubble-to-stubble 44 Timothy 42-43 Triticale 30-31 Wheat 18-21 Whole farm data 423,424,433,434 Assets 406
B
Balance Sheet 406-407 Baling – contractor’s charges 355 Barley 22-25
Winter & spring 22-25 Organic 240-241
Basic Payment Scheme See Subsidies
Beans – field 36-37 Bed and breakfast 282-283 Beef cattle Calf rearing costs to 3 months 166-167 Finishing: Autumn-born at 18 months 160-161 Dairy bred bulls 170-171 Intensively at 12 months 158-159 Organic 252-253 Spring born at 18-20 months 162-163 Summer 164-165
Foster calves 146 Holstein bulls, slaughter age and performance 146 Housing 380, 383 Liveweight – deadweight price conversions 147
Marketing 144-145 Overwintering spring-born suckled calves 156-157 Passports 113

INDEX 522
Scottish Suckler Beef Support Scheme 145-146, 445 Store cattle valuations 146
Suckler cows: Crofts and small farms 264-265
Hill 148-149 Lowground 152-153 Organic 250-251 Upland 150-151 Whole farm data 420, 421, 430, 431 Bio diesel 329 Biomass 327-329 Broccoli 40-41 Budgeting 1-2, 405-408 Buildings Building warrant 386-388
Costs 389-391 Feed space requirements 381-382 Grain storage 381, 391 Livestock space requirements 380-381 Planning permission 384-386 Potato storage 381, 391 Silage clamps 382, 391 Slurry storage 391 Water requirements 382-383 Business Reference Number 402
C
Calf rearing costs to 3 months 166-167 Calorific values of fuels 339 CAP Reform
see Subsidies Capital 406-407 Capital allowances 484-485 Capital gains tax 488-489 Cash 407 Cattle see Beef cattle, Dairying, Livestock or Organic Farming Cauliflower 40-41 Cereals see Arable Whole farm data 423, 424, 433, 434 Chicory 104-106 Christmas trees 297-300 Climate change 394-398 Combining 354 Compounding table 472 Contact details 514-520 Contract farming 409-410 Contractors’ charges Drainage 357-359 Dry stone walling 360 Fencing 359-360 Grain and oilseed rape drying 357 Labour 356 Machinery 353-356 Scanning 356

INDEX 523
Shearing 356 Corporation tax 487 Credit Amortisation table 468 Annuity tables 473 Annual percentage rate (APR) 470-471 Compounding table 472 Discount tables 474 Hire purchase 476 Loans 475 Sinking fund table 469 Crofting 258-260 Crossbred ewes 184-185 Cross compliance 465-466 Cultivating Contractors’ charges 353
Fuel Consumption 350 Rates of work 345-346
D
Dairying Gross Margins: Low input spring calving 128-129 7,000 litres 130-131 8,500 litres 132-133 Heifer rearing 136-138 High output housed year round 134-135 Housing 380 Lactation curves 126 Milk marketing 125 Milk prices 124-125, 127 Organic dairy cows 246-249 Replacement heifer rearing 136-140 Whole farm data 422, 432 Days available for field work 347-349 Deer
see Red Deer Discount tables 474 Diversification Alternative livestock 276-278 Bed and breakfast 283-283
Crops 274-276 Deer farming 202-209 Eco-tourism 281-282 Equestrian 284-291
Farmers’ markets 279-280 Farm shops 280-281 Glamping pods 283 Leisure 284
On-farm diversification 272-274 Part time work off the farm 272
Pet boarding 291 Retailing 278-279 Self catering 282
Vending machines 281 Wedding 291

INDEX 524
Drainage – contractor’s charges 357-359 Dry stone walling – contractor’s charges 360 Dutch turnips 100-101
E
Easement 389 Eco-tourism 281-282 Eggs Egg grading 223 Free range egg production 222-224 Lion egg quality standard 223 Prices 223 Electricity prices 338 Energy efficiency 312 Entrepreneurs’ relief 488 Equity partnerships 411 Equivalent grain weights and prices 45 Ewes see Sheep
F
Farmers’ markets 279-280 Farm storage Fuel 340-341 Grain 379, 381, 391 Potatoes 379, 381, 391 Silage 379, 382, 391 Slurry 391 Farming for a better climate 396-397 Feedingstuffs Nutritive and relative values 118-120 Felling licences 294 Fencing 359-360 Fertiliser Costs 4 Residual values 10-11 Slurries and organic manures 4-12 Fertilising Contractors’ charges 354 Rates of work 346 Field beans 36-37, 242-243 Field drainage 357-359 Finishing cattle see Beef Flax 276 Fodder beet 106-107 Forage Arable (pea/cereal mixtures) silage 88-89 Chicory 104-105 Contractor charges 354-355 Dutch/Stubble turnips 100-101 Fodder beet 106-107 Forage maize 90-91
for AD 332-333 Forage peas 88-89 Forage rape 98-99
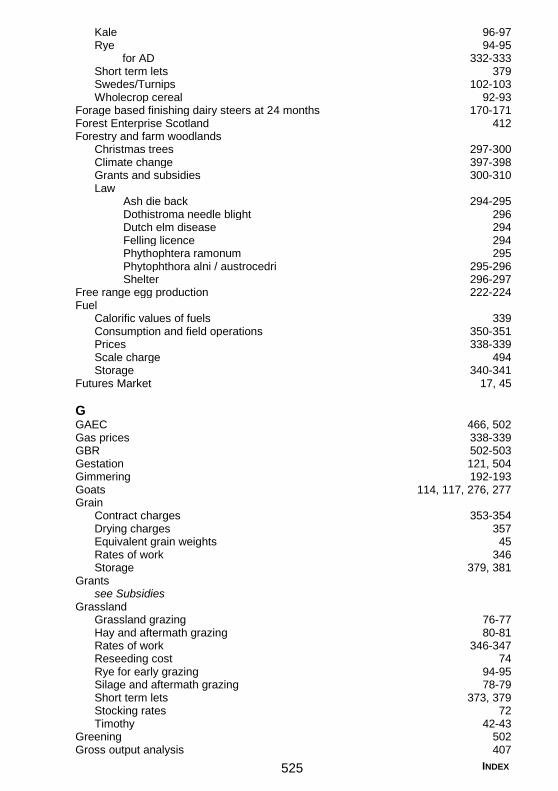
INDEX 525
Kale 96-97 Rye 94-95
for AD 332-333 Short term lets 379 Swedes/Turnips 102-103 Wholecrop cereal 92-93 Forage based finishing dairy steers at 24 months 170-171 Forest Enterprise Scotland 412 Forestry and farm woodlands
Christmas trees 297-300 Climate change 397-398 Grants and subsidies 300-310 Law
Ash die back 294-295 Dothistroma needle blight 296
Dutch elm disease 294 Felling licence 294
Phythophtera ramonum 295 Phytophthora alni / austrocedri 295-296 Shelter 296-297
Free range egg production 222-224 Fuel Calorific values of fuels 339 Consumption and field operations 350-351 Prices 338-339
Scale charge 494 Storage 340-341 Futures Market 17, 45
G
GAEC 466, 502 Gas prices 338-339 GBR 502-503 Gestation 121, 504 Gimmering 192-193 Goats 114, 117, 276, 277 Grain
Contract charges 353-354 Drying charges 357 Equivalent grain weights 45 Rates of work 346 Storage 379, 381 Grants see Subsidies Grassland Grassland grazing 76-77 Hay and aftermath grazing 80-81 Rates of work 346-347 Reseeding cost 74 Rye for early grazing 94-95 Silage and aftermath grazing 78-79 Short term lets 373, 379
Stocking rates 72 Timothy 42-43 Greening 502 Gross output analysis 407

INDEX 526
H
Harvesting, contractors’ charges 354-355 Hay Timothy 42-43 And aftermath grazing 80-81 Contractors’ charges 354-355 Health and Safety 367-369 Hedge cutting 356 Heifers - dairy 136-140 Hemp 276 Herd basis 486 Hire purchase 476 Horse livery 287-288 Horticulture – whole farm data 427 Hydro power 323-325
I
Integrated Administration and Control System (IACS) 403, 503 Single application form (SAF) 440-441
Imperial-metric conversion 511-512 Income tax 480-482 Inheritance tax 489-491
J
Joint ventures 409-411
K
Kale 96-97
L
Labour Contractors’ charges 353-356 Legislation 362-367 Standard labour requirements 344-345 Lactation curves 126 Lamb see Sheep Land Reform (Scotland) Act 2016 374-377 Land - short term lets 379 Less Favoured Area Support Scheme 446-448 Liabilities 406 Lime Contractors’ charges 354 Cost of lime 4 Residual values 11-12 Limited duration tenancies 373-374 Linseed 275 Lion quality code of practice 223 Livery, horse 287-288 Livestock housing 380-381 Livestock units 112, 440 Liveweight-deadweight price conversion – beef 147 Loans 475

INDEX 527
M
Machinery Contractors’ charges 353-357 Days available for field work 347-349 Rates of work 345-347 Machinery ring contact details 519-520 Main location code 402 Maize, forage 90-91 Making tax digital 498-499 Manure Fertiliser value 4 Contractors’ charges 354 Residual values 8-11 Metric – imperial conversion 511-512 Milk Marketing 125 Prices 124-125, 127 Miscanthus 334-335
N
National insurance contributions 495 NetRegs 399 Net worth 406, 408 New entrants 402-413 Nitrogen application and utilisation – grassland 72 NFU 412 Nutritive values of feedingstuffs 118-120 Nutrient planning 6-7 NVZ 503
O
Oats Organic 238-239 Winter & spring 26-29 Oilseed Rape Drying charges 357
Speciality crops 274-276 Winter & spring 32-35 Organic farming Barley 240-241
Beans 242-243 Breeding ewes 254-255 Certification 234-235 Contacts 235 Dairy cows 246-249 Finishing cattle 252-253 Grants 232-233 Oats 238-239
Potatoes - maincrop 244-245 Suckler cows – mainly silage diets 250-251 Winter Wheat 236-237 Owner Equity 406, 408
P
Part Time Work 272

INDEX 528
Passports 113 Peas Cereal mixtures 88-89 Forage 88-89 Spring 38-39 PEPFAA Code 400 Pensions 483-484 Pesticide use 12-13 Pigs
Buildings 380-381 Finishing 218-219 Indoor units 214-215 Outdoor units 216-217
Traceability 115 Whole farm data 425 Planet Scotland 7 Planning permission 384-386 Ploughing Contractors’ charges 353 Rates of work 345 Pollution Environmental guidelines 398-400 Planet Scotland 7 Potatoes Baby new 52-53 Contractors’ charges 355 Dual purpose (seed and ware) 68-69 Early set skin prepack bakers (covered and open) 54-55 Loose new (covered and open) 50-51 Maincrop ware (prepack bakers) 58-59 Maincrop ware (prepack premium varieties) 60-61 Maincrop ware (processing – chips) 62-63 Maincrop ware (processing – crisps) 64-65
Organic - maincrop 244-245 Prepack salads 56-57 Rates of work 346, 347 Seed (low and high tuber number varieties) 66-67 Storage 379, 381, 391 Poultry Broilers 224, 228-229 Egg price indicators 223 Egg production 222-224, 263 Laying hens – free range 226-227, 268-269
Space requirements 381 Traceability 115
Whole farm data 426 Premium health schemes 117 Protein crops see Arable
R
Rape, forage 98-99 Rates of work – machinery 345-347 Red deer
Deer farming 202-203 Finishing stags 208-209

INDEX 529
Lowground breeding and feeding 204-205 Upland breeding selling calves 206-207
Reed canary grass 335 Relative values of fertilisers, manures and lime 8-12 Renewable energy Anaerobic digestion 330-333 Biodiesel (farm scale production) 329 Biomass heating 327-329 Energy crops 334-335 Grants and incentives 313-321 Hydro power 323-325
Miscanthus 334-335 Reed canary grass 335
Short rotation forestry 334 Solar 325-326
Willow short rotation coppice 334 Wind power 321-323 Renewable heat incentive (RHI) 313-319 Rent 378, 379 Reseeding, costs 74 Residual values of fertilisers, manures and lime 8-12 Riding School 289 Root and potato work Contractors’ charges 355 Rural Development Programme
Diversification 272 England 455-456
Forestry and farm woodlands 300-310 Northern Ireland 463-465
Organic 232-233 Scotland 446-452 Wales 459-461 Rye for early grazing 94-95
S
SAC Consulting/SRUC contacts 514-519 Scanning – contract costs 356 ScotMoves 113 ScotEID 114 Scottish Suckler Beef Support Scheme 145-146, 445 Self Catering 282, 283 SGRPID 402 Share farming 410 Shearing – contract costs 356 Sheep Contract work 356 Ewes
Sheep flock – croft and small farm 266-267 Cross bred ewes 184-185 Draft blackface 182-183 Early finished lamb production 188-189 Easy care (wool shedding) 190-191 Extensive hill 178-179 Improved hill 180-181 Organic breeding ewes 254-255 Pure bred flock 186-187

INDEX 530
Feeding 176-177 Gimmering 192-193 Lambs Long keep lambs – finishing on swedes 198-199 Short keep lambs – indoor finishing on concentrates 196-197 Short keep lambs – winter finishing on rape 194-195
Marketing 174-175 Scottish Upland Sheep Support Scheme 175-176, 445-446
Tagging 113-114 Whole farm data 420, 421, 429, 431 Wool 177 Shooting 505 Short Limited Duration Tenancies (SLDT) 372 Short term lets 379 Silage And aftermath grazing 78-79 Arable 88-89
Contract charges 354-355 Rates of work 347 Maize, forage 90-91
Production 75 Storage 382, 391 Wholecrop cereal, winter wheat 92-93 Single Farm Payment Scheme 496-497 Sinking fund table 469 Slurry
Fertiliser value 4-5 Contractors’ charges 354 Residual value 10-11 Small Farms 260 Soil workdays 347-349 Sowing/planting Contractors’ charges 353, 355
Rates of work 346 Sprayers Contractors’ charges 354 Rates of work 346 Stamp duty 495-496 Standard labour requirements 344-345 Stubble-to-stubble contracting 44 Stubble turnips 100-101 Subsidies, agricultural
Basic payment scheme 441-443, 452-454, 456-457, 461-462 Crop diversification 443, 453, 458, 462 Cross compliance 465-466 Ecological focus area 443-444, 453-454, 458, 462 Forestry and farm woodlands 300-310 GAEC 466 Greening 443-444, 453-454, 458, 462-463 Less favoured area support scheme 446-448 National reserve 444-445, 454-455, 459, 463 Rural Aid Schemes 438-466 Rural development programme 446-452, 455-456, 459-461, 463-465
Scottish Suckler Beef Support Scheme 445 Scottish Upland Sheep Support Scheme 445-446 Voluntary coupled support 445-446
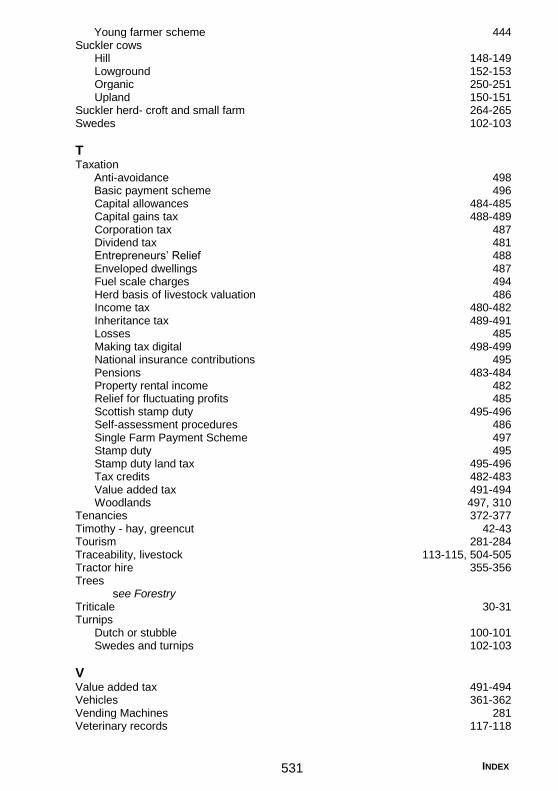
INDEX 531
Young farmer scheme 444 Suckler cows Hill 148-149 Lowground 152-153 Organic 250-251 Upland 150-151 Suckler herd- croft and small farm 264-265 Swedes 102-103
T
Taxation Anti-avoidance 498
Basic payment scheme 496 Capital allowances 484-485 Capital gains tax 488-489 Corporation tax 487
Dividend tax 481 Entrepreneurs’ Relief 488 Enveloped dwellings 487 Fuel scale charges 494 Herd basis of livestock valuation 486
Income tax 480-482 Inheritance tax 489-491
Losses 485 Making tax digital 498-499
National insurance contributions 495 Pensions 483-484 Property rental income 482 Relief for fluctuating profits 485 Scottish stamp duty 495-496
Self-assessment procedures 486 Single Farm Payment Scheme 497
Stamp duty 495 Stamp duty land tax 495-496
Tax credits 482-483 Value added tax 491-494 Woodlands 497, 310
Tenancies 372-377 Timothy - hay, greencut 42-43 Tourism 281-284 Traceability, livestock 113-115, 504-505 Tractor hire 355-356 Trees see Forestry Triticale 30-31 Turnips Dutch or stubble 100-101 Swedes and turnips 102-103
V
Value added tax 491-494 Vehicles 361-362 Vending Machines 281 Veterinary records 117-118
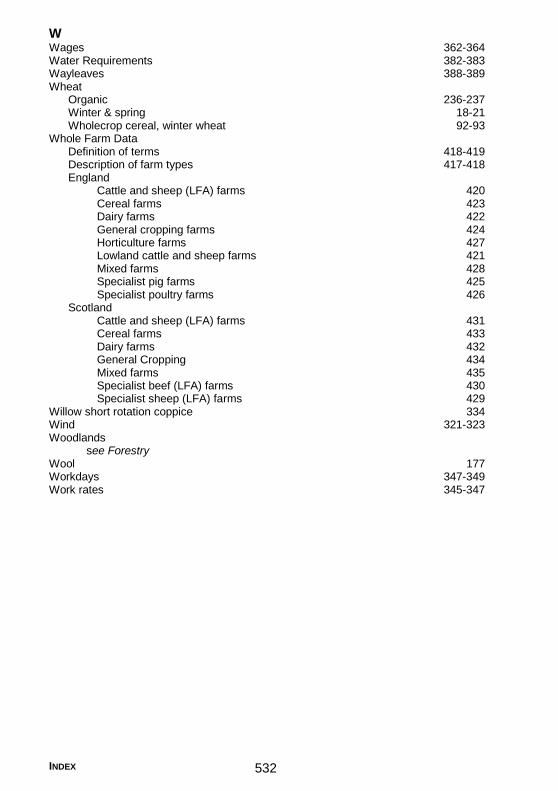
INDEX 532
W
Wages 362-364 Water Requirements 382-383 Wayleaves 388-389 Wheat Organic 236-237 Winter & spring 18-21 Wholecrop cereal, winter wheat 92-93 Whole Farm Data
Definition of terms 418-419 Description of farm types 417-418
England Cattle and sheep (LFA) farms 420 Cereal farms 423 Dairy farms 422 General cropping farms 424 Horticulture farms 427 Lowland cattle and sheep farms 421 Mixed farms 428 Specialist pig farms 425 Specialist poultry farms 426 Scotland Cattle and sheep (LFA) farms 431 Cereal farms 433 Dairy farms 432 General Cropping 434 Mixed farms 435 Specialist beef (LFA) farms 430 Specialist sheep (LFA) farms 429 Willow short rotation coppice 334 Wind 321-323 Woodlands see Forestry Wool 177 Workdays 347-349 Work rates 345-347