farm population estimates 1940
DESCRIPTION
United States. Dept. of Agriculture. Economic Research Service. Economic Development Division. United States. Agricultural Marketing Service. United States. Dept. of Agriculture. Economic Research Service. United States. Dept. of Agriculture. Farm Population Branch. United States. Dept. of Agriculture. Economic Research Service. Human Resources Branch.TRANSCRIPT

<« TOUTED STATES DEPARTIIEMT OF AGRICULTURE
<^^Bureau of Agricultural Economics
WashingtonReleased July, 1940
FARM POPULATION ESTIMTES
January 1, 1940
On Januaiy 1, 1940 there were 32,245,000 persons living on farms,
according to the estimates of the Bureau of Agricultural Economics. This
figure is close to the all-tiriie high record of 1915 when the farm popula-
tion consisted of 32,530,000 persons. The 1940 estimate shows an increase
of 186,000 over last year, and brought the total increase for the last
10 years to 2,076,000. There has been an increase every year since 1929,
with the exception of 1936 whsS5 ith-erc v/as a decrease of approximately 80,000,
The increase in farm population during the 1930' s follows a decrease
of 1,445,000 during the 1920»s and a net loss of 463,000 between 1910 and
1920. By 1910 most of the fai-m land of the country had been occupied, and
though there vrere some increases during the early years of the War of
1914-1918, there were rapid decreases after the entry of the United States
into that War, with the resulting mobilization of manpower and large
demands for workers in rapidly exp^anding industries vdiich were no longer
able to secure needed new workers from Europe. The decreases during the
latter part of that decade vfere so large that there was a net loss for
the entire period. In the years immc'diately folloi;\ring the War, fann
population was rapidly drained off into expanding industrial and other
employment. By 1927 thero was some slowing down of the migration from
farms to cities, and after the 1929 crash there was a further reduction
in migration from farms. I'Jhereas the net migration during the 1920' s was
approximately 6,000,000 and that for the preceding decade was about the
same, the net migration from farms during the 1950' s was only 2,3 79,000
persons*
_ 2 -
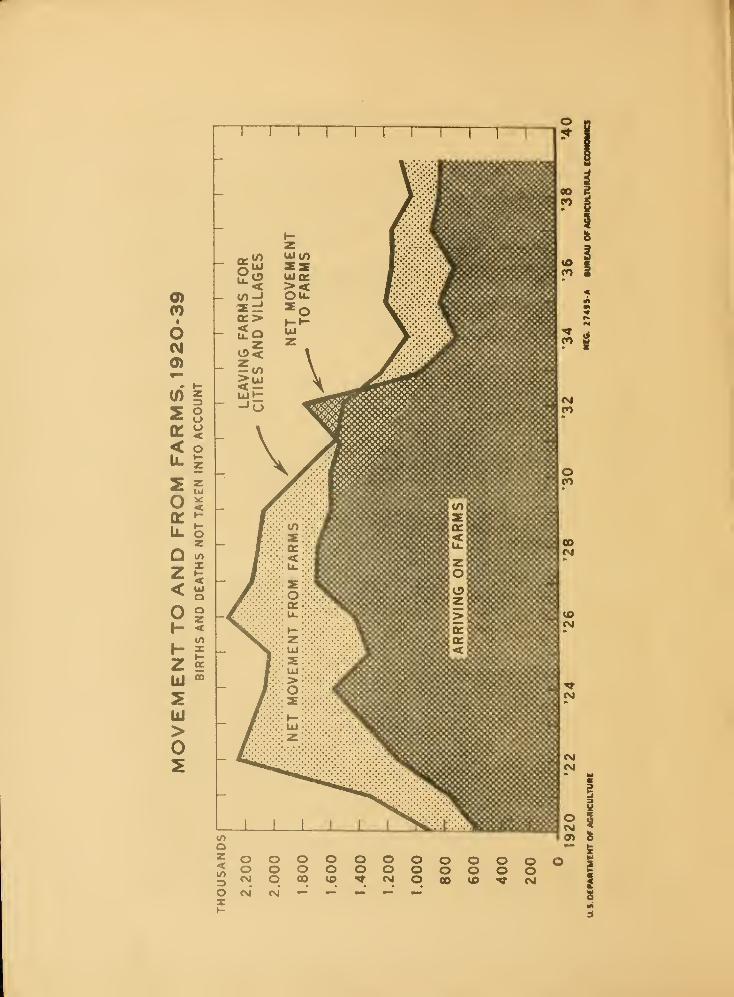
This difference is not due primarily to an unprecedentedly
large back-to-the-land movement resulting from the depression, but
to the fact that vhen urban jobs were difficult to get the farm
appeared more attractive to the young men and women reaching ma-
turity in the 1930 's. The Bui'oau's estimates show more people
moving both to and from farms between 1920 and 1930 than between
1930 and 1940. The total number of moves to farms decreased from
13,100,000 to 10,600,000, and the total number of moves away fron
farms decreased even more sharply in the latter decade, dropping
from 19,400,000 to 12,800,000.
The decrease in migration away from farms is due in large
measure to the decrease in employment opportunities for rural youth
during a period vihcn jobs were scarce. The number of young people
reaching the age when migration is normally at its height did not
decrease during the decade. Instead it incroasod, and the Bureau
believes that this increase v.lll continue for several years more,
as the effects of the peak in births of 1921 to 1924 are fblt in
a correspondingly large nuiTibcr of young people currently reach-
ing the age v.'hcn they ordinarily start out for themselves. But
as a result of the decrease in migration, there are between 3g-
and 4 million more persons on farms than vyould be there if mi-
gration liad been at the sane rate as during the 1920 's. Young
adulthood, *.ich is the time of greatest migration, vras especially
affected by this reduction in migration - at least 2 million of
this total are young people between 15 and 30 years of age.
Changes in farm population throughout the country vrere by
no means uniform. Some areas vrere affected by severe droughts
which forced readjustments in farming organization and a net re-
duction in the population. Other areas were affected by rapid
increases in the use of ncclianical power for some farm operations
or the development of improved strains of plants or animals or
improved practices with the result that less manpower was required
per unit of production. And in some areas there vrere important
repercussions from changed domestic and foreign demands for our
agricultural products and the attempts to adjust acreage to these
demands. On the other hand, some areas served as havens of refuge
for persons no longer required in urban industry, providing an
opportunity whereby persons vdth little or no capital might assure
themselves at least of subsistence, or perhaps offering the oppor-
tunity of rcduci^-g living costs. In some areas the number of young
people reaching r^Lturity was especially large, but the training
which these ycv_".-'; people had received v.as net. sufficient to enable
them to compete in an overcrov/ded labor market. The result ivas
they remained near their homes v/here they knew conditions and wore
able to secure subsistence rather than venture into an unknown
distant spotv;herc the prospects appeared very uninviting. In
some areas a demand for seasonal agricultural workers, coupled
with the belief that opportunity lay in tho Vvcst or the belief that
under favorable climatic conditions one could certainly get along.
\
- 3 -
brought about an increase in fann populationt
In general, it may be said that in the areas best adaptedto commercial farming there v.-as enough migration away from farmsto have brought about a reduction in farm population, but inthese areas less well adapted to commercial farming there vrere
increases t Among the major geographic divisions, the largestpercentage increases during the last ten years were reported bythe New England and the pacific Coast States, with the MiddleAtlantic, East South Central, South Atlantic, and East NorthCentral States also shovfing increases. The West Korth CentralStates reported a decrease and the increases in the Vvest SouthCentral and tho Mountain States were very small, only ^- of 1 per-cent and 2^ percent, respectively.
One result of these different rates of change was to in-crease the differences in tho number of people living on the farmsof the several m.ajor divisions. In 1950, the Vi'est ITor th Centralwith a farm population of 5,030,000, tho East South Central with5,052,000, and the Yj'est South Central mth 5,275,000, were allbunched together. But by 1340, the number of people living onfarms in the East South Central States had increased to 5,624,000,that of tho West South Central States had increased to only
5,303,000, while that of the H'est North Central States had de-creased to 4,840,000. Tho m.aximum. difference among those threedivisions v;as less thr.n 250,000 in 1930, but in 1940 it had be-come nearly 800,000.
An increase in farm, population at the present time meansgrowing pressure of population on natui'al resources, especiallyin the poorer agricultural areas. Technological clianges in agri-culture have kept pace mth those in industry, and the labor re-
quirem.ents for agricultural production have been decreased. Normalrequirements in farm production for both domestic :;aid foreign out-lets can now bo m.et with approximately 1,600,000 fev/er virorkers
on farms than in 1929 - w}iich, with their dependents, means about
3,500,000 fewer persons. TJic estimates of employment on fa.rras
show a decrease of more tlmn 300,000 taetv;-een tiae beginjiing of 1930and of 1940. Although tho number of persons working on farms whoare not effectively employed or \Ai.o v/ork only a small portion ofthe year is not kno-v^n., it is probably quite large for already in
1929 nearly half of the farms produced only about 10 percent of
all the crops that were sold or traded. Unomiployment on farms,
which s eened an anomaly prior to the present period, has increased,
and the fact that the Census of Unem.ploynent in 1937 reported971,000 males living on farms -/.ho wore totally unemployed or work-ing on emergency projects, and an additional 576,000 who wore clas-sified as only partly em.ployod is directly a result of the reducedrndgraticn avjay from farm.s.

Differences between 1930-34 and 1935-39 reflect the differ-ences in the level of business conditions during those tr/ro periods.The total farm population increased by 1,632,000 persons during thefirst 5 years, with the largest increase caning in 1932 when itamomited to more than 700,000. During the second 5-year period,how ever, the net increase was only 444,000 persons, and norethan nine-tenths of this total is accounted for by the increasesduring 1938 and 1939. Conversely, the net loss by migration frcci
farns vra.s about tvro and one-half tines as large during 1935-40 as
during the preceding 5 years - 1,581,000 as conpared v/ith 598,000.During each of the 3 years 1937, 1938, and 1939, the net migrationfroa farris vfas between 200,000 and 300,000. These losses are muchless than those reported in the 1920's; in no year betvroen 1920and 1930 ivas the not nigration fron farms as low as 3 00,000 andin the peak year, 1922, it reached more than 1,000,000. i\rot onlywas the not migration fron farns during the 1930*s less than duringthe 1920 's, but the gross movcnont, both that to farms and thatfron farns, was also gna llcr during the latter period. There v/as
loss novcncnt in cither direction during the 5 years, 1935-39,than during the preceding 5 years, or during 1925-29, or 1920-24.Apparently diuring a period of urban prosperity, yo-ong people on
farms are nore ready to take a chance and nove, even though theyhave no assurance that they will be able to get a job there. Fieldstudies have shown that after 1930 there was a somewhat greatertendency on the part of prospective migrants to nove only if therewas some assurance of placonont at the destination, though it is
well known that there is still a large volume of migration to
destinations about which the migrants have little advance informa-tion and at which they remain only a short time.
The largest absolute gain during the 10-year period was in
the South Atlantic States, the group consisting of the Statesalong the Atlantic Coast from Maryland and Delaware to Florida.The next largest gain was in the East South Central States, in-cluding Kentucky, Tennessee, Alabana, and Mississippi, where the
gain during the second 5 years vro.s slightly greater than that dur-ing the first 5 years. The only other division in which the gainin 1935-39 exceeded that of 1930-34 was that including the threePacific Coast States, where the farm population shovired net in-creases of 69,000 in the first half and 165,000 in the second halfof the decade. In the Kovf England, the Middle Atlantic, and theEast North Central States, the increases during the first 5-yearperiod were approximately 4 to 6 times as groat as those during
the second 5 years. On the other hand, the throe groups of States,
which include the areas most severely affected by the drouglits of
1934 and 1936 - tho West North Central, Y«'est South Central, andthe Mountain States, report increases before 1935 and decreasesthereafter. The difference was especially narked in the Vv'est
North Central States, where the increase was 78,000 for the first5 years, but tho decrease vra.3 268,000 for the second 5 years of
the 1930' s.

- 6 -
Chanf;es During 1939
The increase of 186,000 in the farm popiilation dui-ing
1939, follows an increase of 240,000 in 1938. As in each ofthe 6 preceding years, more persons moved from farms to vil-lages, tomis, and cities than moved to faiTts during 1939, Ac-cording to these estimates, 1,063,000 persons moved from farms
to villages, tovns, and cities, ar!.d 805,000 persons moved tofarms. The net loss by this migration wa-s 258,000. But thiswas more than offset by the excess of births over deaths. There^vere 753,000 births and 309,000 deaths.
With the exception of the West South Central States, inwhich the farm population remained about the same during the
year, each of tho major geographic divisions reported an in-
crease. As in the preceding year, there vjas a net movement to
farms in both the Mew England and the Pacific Coast States, Inall of the other geographic divisions, the not movement was av;ay
from farms. The South Atlantic States contributed 64,000 tothis not movement J the West South Central States, 63,000; thoEast South Central Str.tcs, 61,000; and the West North CentralStates, 57,000, As in p'revious years, there v/as an excess of
births over deaths in each division, wil th the South Atlanticand the East South Central Divisions ecch adding more than100,000 persons, a nd the West South Central States contribut-ing 85,000. These tlireo groups of States, all in the South,
contributed tivo-thirds of the total excess of births over deaths,although tjiey include only about one-half of the total farm popu-lation.
The estimates for 1939 are based upon reports from 13,609farmers in all parts of the coimtry, supplying information for
78,544 farms.

- -7 -
Tables
Note: Except as otherrd.se indicatsd, th-3 estlTiates given below are by theBureau of Agricultural Economics and are a.djustc?d to Census figures. Fit^ures
for I93O-I9/+O are subject to revision v&ien 19 'iO Census data are released.Estimates for years since 1920 a.re based on returns from questionnairesmailed to farmers.
Table 1. - Farm PoDulaticn in the United States
Year Nimiber of personson farms January 1
Year Number of personson farms January 1
1910 A 32,076,9601911 32, 110, 0001912 32, 210, 0001913 32,270,000191/. 32,320,0001915 32,^^0,0001916 32, 530, 0001917 32, 34c, 000191s 31, 770, 0001919 30,930,0001920 /2 31,6U,2691921 31,763,0001922 31,749,0001923 31, 130, 000
192A 30, 817, 0001925 30, 830, 000
192619271928192919301931193219331934193519361937193819391940
Z2
30,
30,
30,
30,
30,
30,
30,
31,
31,
31,
31,
31,
31,
32,
32,
619, 000170, 000188,000220, 000169,000497, 000
971, 000693,000770, 000800,907809, 000
729,000819, 000059,000245, 000
/l Estimated, U. S. Bureau of the Census/2 Enumerated, U. S. Bureau of the Census
- 8 -
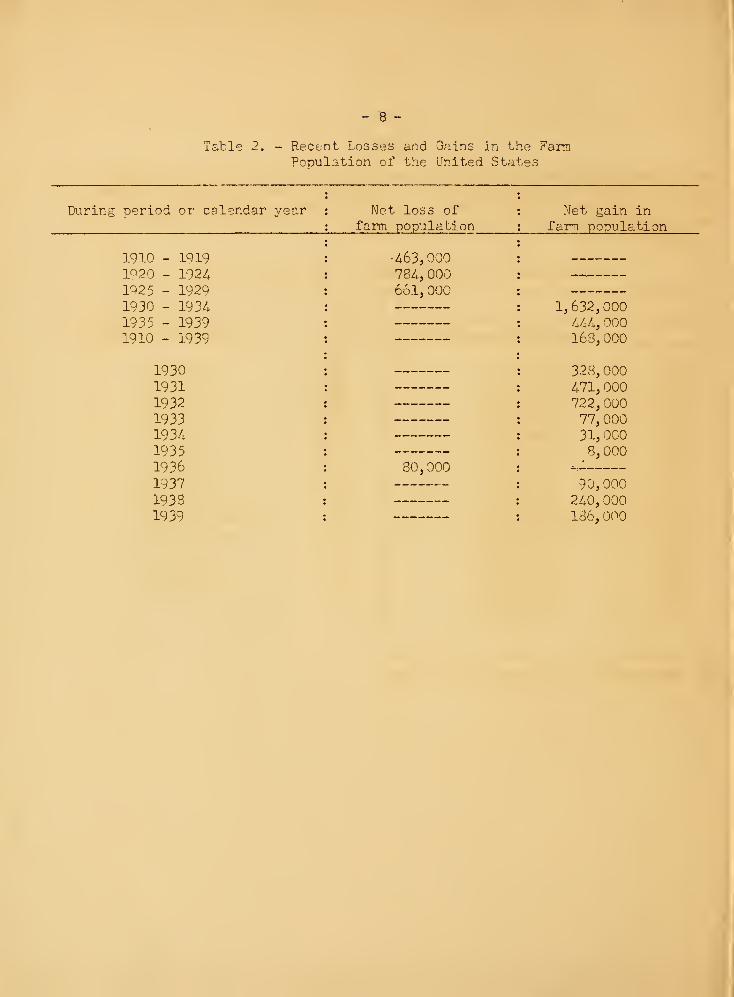
Table 2. - Recent Losses and Gains in the FarmPopulation of the United States
During period or calendar year : Net loss of : Net gain in: farm population : farm population
1910 _ IQIO : '463,0001Q20 - 1924 : 784, 0001Q25 - 1929 661, 0001930 - 193/i 1,632,0001935 - 1939 444, 0001910 - 1939 168,000
1930 328, 0001931 471, 0001932 722, 0001933 77, 000193/. 31, 0001935 8,0001936 ! 80, 000 i,_
1937 90,000193S : 240, 0001939 : 186, 000

- 9 -
Table 3. - Movement To and From Farms
: Persons: arriving at
: farms: from cities,: to?ms, and; villages
: Pnrsons: leaving
farms forcities,
towns, andvillages
Net movement from
Year
Cities,to-vms, andvillages
tofarms
Farmsto cities,
tovms,and
villages1
19201921192219231924
19251926192719281929
.... 19301931
• 193219331934
19351936193719381939
1920 - 19241925 - 19291930 - 19341935 - 1939
r
560,000759,000
1,115,0001,355,000
. 1,581,000
1,336,0001,427,0001,705,0001,698,0001,604,000
1,611,0001,546,0001,777,000
944,000700,000
825,000719,000872,000823,000805,000
5,370,0007,770,0006,573,0004,044,000
896,0001,323,0002,252,0002,162,0002,068,000
2,038,0002,334,0002,162,0002,120,0002,031,000
1,823,0001,566,0001,511,0001,225,0001,051,000
1,211,0001,166,0001,160,0001,025,0001,063,000
8,701,00010,735,0007,176,0005,625,000
336,000564,000
1,137,000807,000487,000
702,000907,000457,000422,000477,000
212,00020,000
281,000351,000
386,000447,000288,000202,000258,000
3,331,0002,965,000
598,0001,581,000
266,000
- 10 -
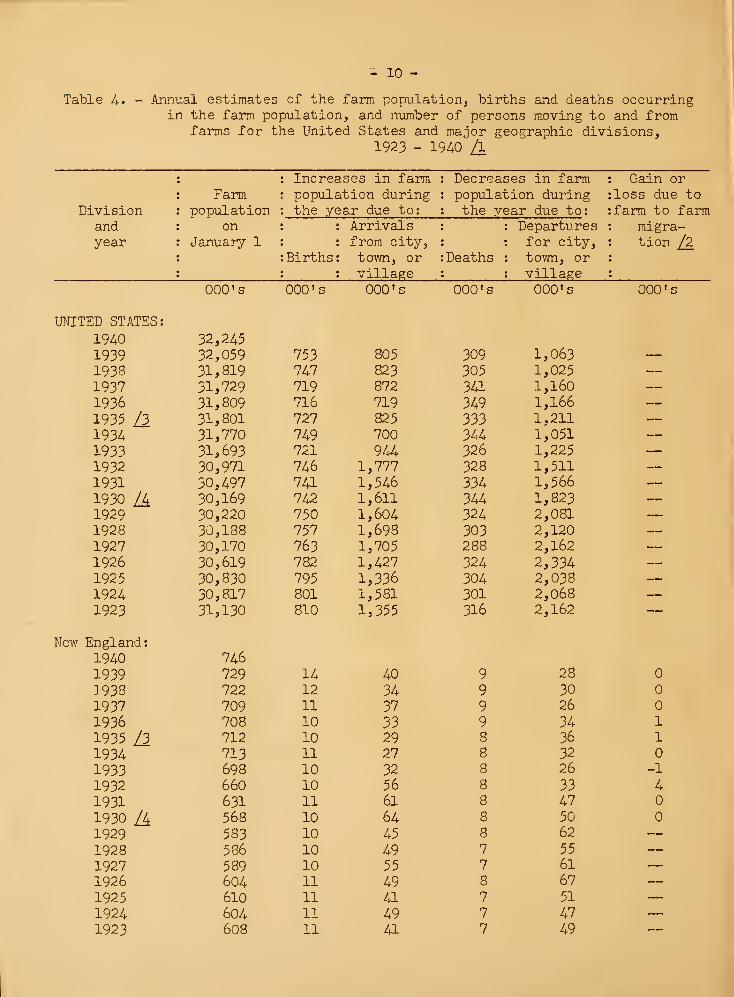
Table 4-. - Aiinual estimates of the farm population, births and deaths occurringin the farm population, and number of persons moving to and from
farms for the United States and major geographic divisions,1923 - 1940 !\
Increases in farm Decreases in farm Gain orFarm population during population during loss due to
Division populationon
the ye;ir due to: the year due to: farm to farmand Arrj.vals Departures migra-year January 1 from city, for city, tion /2
Births
:
town, or Deaths town, orvillage village
000 's 000 's 000 's 000 's 000 's 000 's
UNITED STATES:
1940 32,2451939 32,059 753 805 309 1,063 —1938 31,819 747 823 305 1,0251937 31,729 719 872 3a 1,1601936 31,809 716 719 349 1,166 —1935 Zl 31,801 727 825 333 1,211 —1934 31,770 749 700 344 1,051 —1933 31,693 721 944 326 1,225
1932 30,971 746 1,777 328 1,511 —1931 30,497 741 1,546 334 1,5661930 /4 30,169 742 1,611 344 1,823 —1929 30,220 750 1,604 324 2,081 —1928 30,188 757 1,698 303 2,120 —1927 30,170 763 1,705 288 2,162 —
—
1926 30,619 782 1,427 324 2,334 —1925 30,830 795 1,336 304 2,038 —1924 30,817 801 1,581 301 2,068 —1923 31,130 810 1,355 316 2,162 —
New England:1940 7461939 729 14 40 9 28
1938 722 12 34 9 30
1937 7.09 11 37 9 26
1936 708 10 33 9 34 11935 /3 712 10 29 8 36 1
1934 713 11 27 8 32
1933 698 10 32 3 26 -1
1932 660 10 56 8 33 41931 631 11 61 8 47
1930 /4 568 10 64 8 50
1929 583 10 45 8 62 —1928 586 10 49 7 55
1927 589 10 55 7 61 —1926 604 11 49 8 67 —1925 610 11 41 7 51 —1924 604 11 49 7 47 —1923 608 11 41 7 49 —
- 11 -
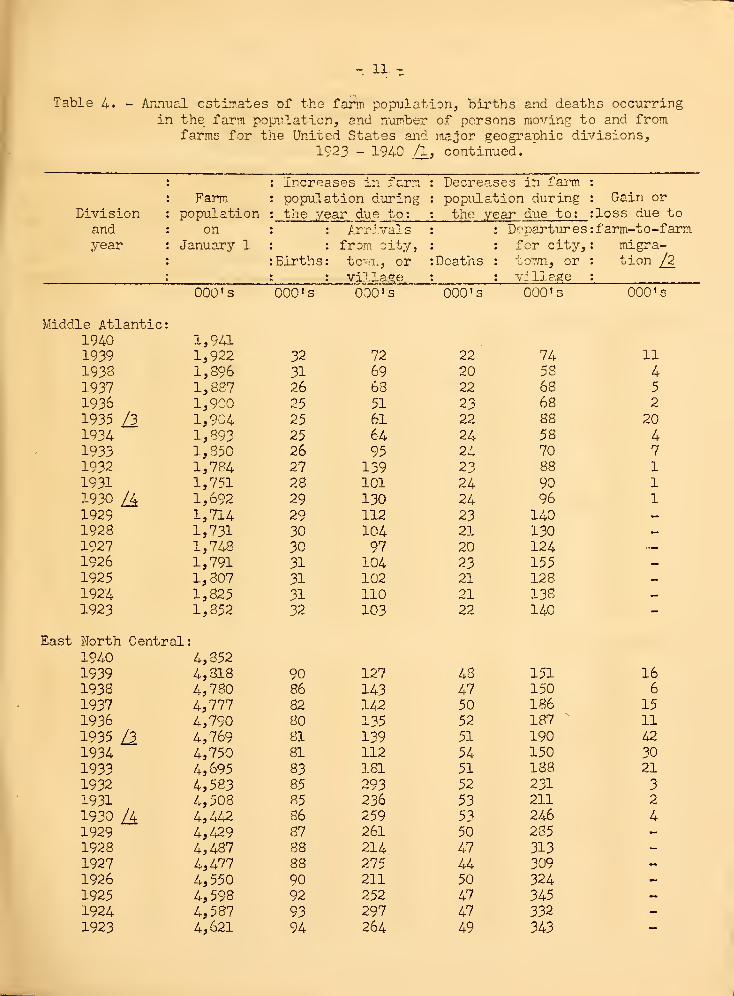
Table U. - Annual estLTates of the farm population, births and deaths occurringin the farm popiilation, and n-omber of persons movinF^ to and from
farms for the United States and major geographic divisions,1923 - 194c A, continued.
I
: Increases in far-p. Decreases in farm.
Farm : populjition during populal/ion during : Gain or
Division populationon
: the year due to: the year due to: :loss due to
and Arr.-vals Dc-partures : farm-to-farmyear January 1 from city, for city. : migra-
: Births to"'."!:, or Deaths toTvn, or : tion /2
village. v: 11age000 's 000 's 000 's 000 's COO'S 000 '5
Middle Atlantic:1940 1,9411939 1,922 32 72 22
'
74 11
1938 1,896 31 69 20 58 41937 1, 887 26 68 22 68 5
1936 1,900 25 51 23 68 2
1935 /3 1,904 25 61 22 88 201^34 1,893 25 64 24 58 41933 1,850 26 95 24 70 71932 1,7P4 27 159 23 88 11931 1,751 28 101 24 90 11930 /4 1,692 29 130 24 96 1
1929 1,714 29 112 23 140 —1928 1,731 30 104 21 130 —
1927 1,748 30 97 20 124 —1926 1,791 31 104 23 155 —1925 1,807 31 102 21 128 —
1924 1,825 31 110 21 13s —
1923 1,852 32 103 22 140 -
East North Centr al:
1940 4,3521939 4,318 90 127 48 151 161938 4,780 86 143 47 150 6
1937 4,777 82 142 50 186 15
1936 4,790 80 135 52 187-
11
1935 /3 4,769 81 139 51 190 42
1934 4,750 81 112 54 150 30
1933 4,695 83 181 51 188 21
1932 4,583 85 293 52 231 31931 4,508 85 236 53 211 2
1930 /4 4,442 86 259 53 246 41929 4,429 37 261 50 285 —
1928 4,487 88 214 47 313 -
1927 4,477 88 275 44 309 -1926 4,550 90 211 50 324 -
1925 4,598 92 252 47 345 —1924 4,587 93 297 47 332 -
1923 4,621 94 264 49 343 -

- 12 "
Table /4. - Annual estimates of the farrti' population, births and deaths occurringin the larrA population j and number of persons moving to and fromfarms for the United States and major geographic divisions,
1923 - 19^0 Aj continued.
Increases in farm Decrea:3es in farm: Farm population during populal;ion during : Gain or
Division populationon
the yf?ar d.ue to: the year due to: : loss due toand Arrivals DepartLIT as :farm to farmyear Januarj'- 1 from city. for city. : mdgra-
Births toim, or Deaths toTOi, or : tion /2village village
COO'S 000 's 000 's 000 ' e 000 's 000 ' s
West North Central.. •
19^0 4,8401939 4,323 94 94 36 151 16
1933 4,827 96 110 36 178 4
1937 4,940 98 96 45 231 -31
1936 5,041 102 90 49 217 -27
1935 /3 5,108 104 108 45 212 -22
1934 5,162 111 90 49 204 - 2
1933 5,149 109 125 46 1751932 5,069 112 306 46 291 - 41931 5,005 114 300 46 298 - 7
1930 A 5,030 116 283 47 375 -10
1929 5,034 117 294 44 371 —1928 5,019 118 311 • 41 373 —1927 5,055 119 301 39 417 —1926 5,098 122 249 44 370 —1925 5,134 124 242 41 361 —1924 5,133 125 278 41 361 —1923 5,163 127 238 43 352 —
South Atlantic:1940 6,4321939 6,415 177 106 64 170 -32
1938 6,376 173 117 64 168 -19
1937 6,314 168 128 72 151 -11
1936 6,275 164 98 75 174 26
1935 /3 6,204 164 139 72 162 2
1934 6,140 169 109 73 151 20
1933 6,131 157 13s 66 207 8
1932 6.038 164 178 68 180 - 9
1931 5,947 159 170 70 196
1930 /4 5,864 160 172 72 207
1929 5,900 162 185 68 3151928 5,910 163 198 63 308 —1927 5,880 165 215 60 290 —1926 6,013 I6S 155 6S 388 —1925 6,136 171 170 63 401 —1924 6,125 173 219 63 318 —1923 6,242 174 185 66 ao —
- 13 -
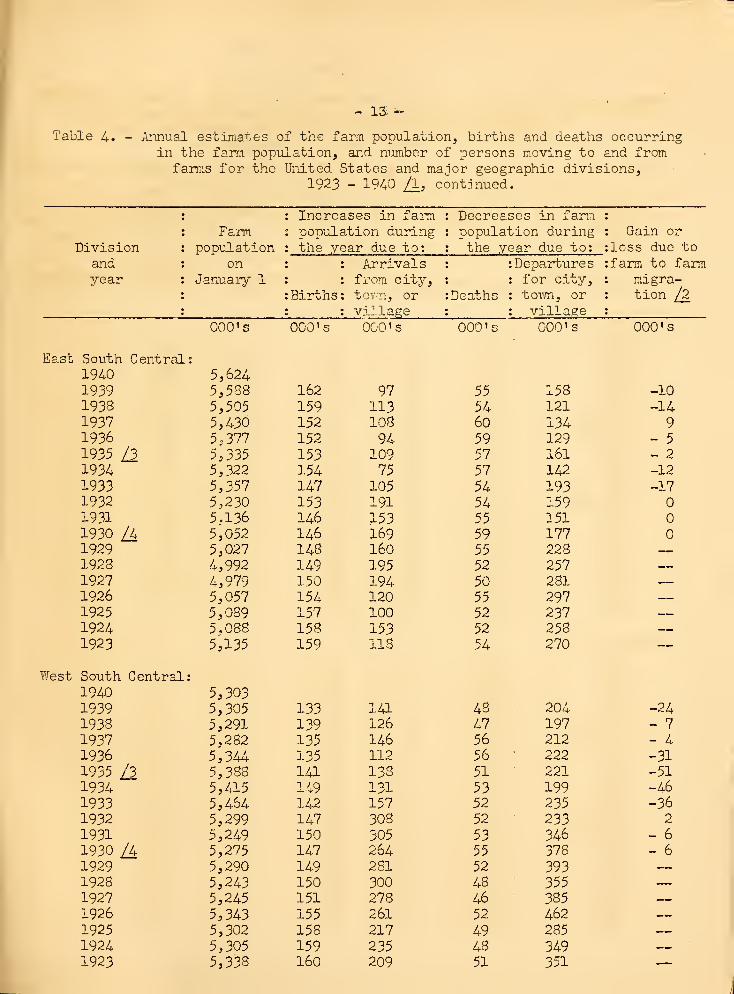
Table 4. - Annual estimates of the farm populatiorij births and deaths occurringin the farm population, and number of persons moving to and fromfarms for the United States and major geographic divisions,
1923 - 1940 /I3 continued.
• Increases in fai-^ Decreases in farm: Farm : population during copulation during Gain or
Division popiilation
on: the year due to: 'the year due to: loss due to
and Arrivals : Departures farm to farmyear January 1 from city. : for city. migra-
Births tovm, orvi]lage
Deaths : tovm, or: village
tion /2
000 's 000 's 000 's 000 's 000 's 000 's
East South Central .
19^0 5,6241939 5,538 162 97 55 158 -10
1938 5,505 159 113 54 121 -141937 5,430 152 108 60 134 91936 5,377 152 94 59 129 - 5
1935 /3 5,335 153 109 57 161 - 2
193A 5,322 154 75 57 142 -12
1933 5,357 147 105 54 193 -171932 5,230 153 191 54 1591931 5.136 146 153 55 1511930 /4 5,052 146 169 59 1771929 5,027 148 160 55 228 —
_
1923 4,992 149 195 52 257 —1927 4,979 150 194 50 281 —1926 5,057 154 120 55 297 —1925 5,089 157 100 52 237 —1924 5,088 158 153 52 258 —
—
1923 5,135 159 118 54 270 —
I'/est South Central •
1940 5,3031939 5,305 133 141 48 204 -241933 5,291 139 126 47 197 - 7
1937 5,282 135 146 56 212 - 41936 5,344 135 112 56 222 -31
1955 /3 5,388 141 138 51 221 -51
1934 5,415 149 131 53 199 -46
1933 5,464 142 157 52 235 -361932 5,299 147 308 52 233 2
1931 5,249 150 305 53 346 - 6
1930 /4 5,275 147 264 55 378 - 6
1929 5,290 149 2SI 52 393 —1928 5,243 150 300 48 355 —1927 5,245 151 278 46 385 —1926 5,343 155 261 52 462 —1925 5,302 158 217 49 285 —1924 5,305 159 235 48 349 _—
1923 5,3:38 160 209 51 351 —
= 14 =
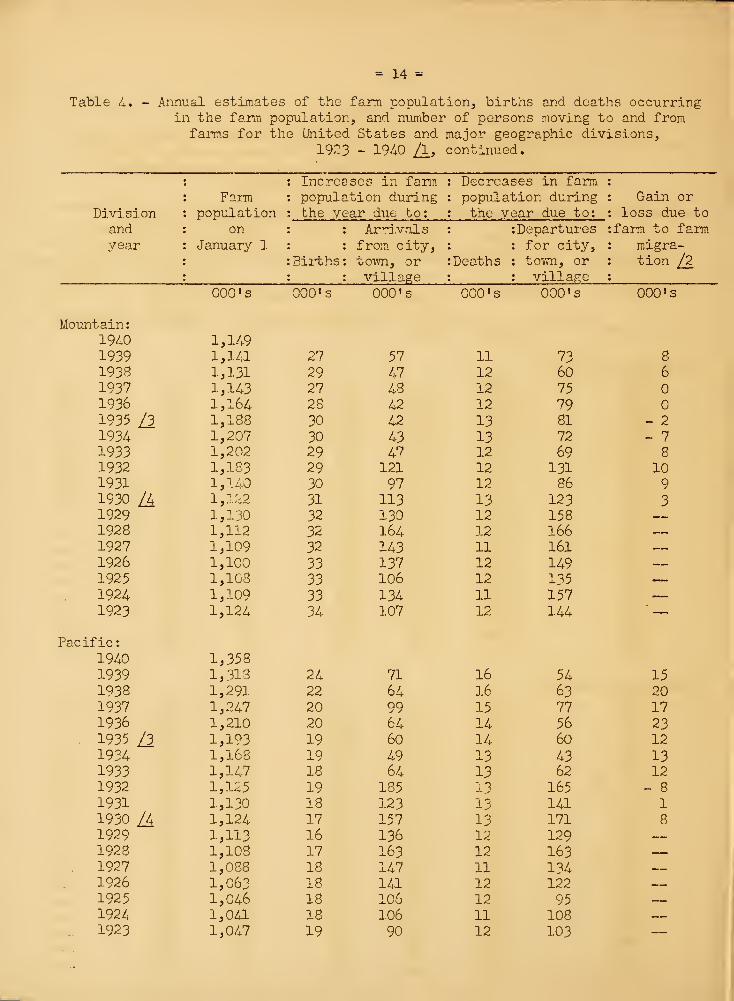
Table 4. - Annual estimates of the farm population, births and deaths occurringin the farm population, and number of persons moving to and fromfarms for the United States and major geographic divisions,
1923 - 1940 J\i continued.
Incrcc3ses in farm Decreases in farmFarm popul?ition during population during Gain or
Division populationon
the year due to: the year due to: loss due to
and Arrivals : Departures farm to farmyear January 1 from city. : for city. migra-
Bii-ths town, orvillage
Deaths : town, or: village
tion /2
000 's 000 's 000 's 000 's 000 's OOO's
Mountain:19A0 1,1491939 1,141 27 57 11 73 8
1938 1,131 29 47 12 60 6
1937 1,143 27 48 12 751936 1,164 28 42 12 791935 /3 1,188 30 42 13 81 - 2
1934 1,207 30 43 13 72 - 71933 1,202 29 47 12 69 8
1932 1,183 29 121 12 131 101931 1,140 30 97 12 86 91930 A 1,122 31 113 13 123 31929 1,130 32 130 12 158 —1928 1,112 32 164 12 166 —1927 1,109 32 143 11 161 —1926 1,100 33 137 12 149 —1925 1,103 33 106 12 135 —
—
1924 1,109 33 134 11 157 —1923 1,124 34 107 12 144 ' —
Pacific:1940 1,3581939 1,313 24 71 16 54 151938 1,291 22 64 16 63 201937 1,247 20 99 15 77 171936 1,210 20 64 14 56 23
. 1935 /3 1,193 19 60 14 60 121934 1,168 19 49 13 43 131933 1,147 18 64 13 62 121932 1,125 19 185 i? 165 - 8
1931 1,130 18 123 13 141 1
1930 /4 1,124 17 157 13 171 8
1929 1,113 16 136 12 129 —1928 1,108 17 163 12 163
. . 1927 1,088 18 147 11 134 —1926 1,063 18 141 12 122 _.
1925 1,046 18 106 12 95 —1924 1,041 18 106 11 108 —1923 1,047 19 90 12 103 —
- 15 =
A Preliminary' figures^ subject to correction when Census data becomeavailable. The fam population at the beginning of one year is
equal to the farm population at the bepinninp: of the prex'ious yearplus the births and arrivals at farms, minus deaths and departuresfrom farms, p3.us or minus the gain or loss due to farm to farm migra-tion. For the years 1930 to 193U, inclusive, certain allowancesare included, though not shcA-n in the table. These allowances aredue to (a) changes to or from farming without change in residenceand (b) changes in interpretation of Census instmctions. It is
not possible to separate the effects of these two factors.
/2 Persons who move from far^.s in one geographic division to farmsin another division,. For the United States total these must bal-ance. The figu-res on fam to farm m.ovemient were not tabulatedseparately before 1930.
/3 Farm Population January 1, as enumerated by United States Bureau ofthe Census.
/a Farm Population January 1, as estimated on the basis of Censusenumeration of April 1, 1930.

UNIVERSITY OF FLORIDA
llliilllllll3 1262 08589 8046
a