farm size as a factor in hydrodynamic transmission of pathogens in … · farm size as a factor in...
TRANSCRIPT

AQUACULTURE ENVIRONMENT INTERACTIONSAquacult Environ Interact
Vol. 2: 61–74, 2011doi: 10.3354/aei00030
Published online October 20
Inter-Research 2011 · www.int-res.com*Email: [email protected]
Farm size as a factor in hydrodynamic transmissionof pathogens in aquaculture fish production
Nabeil K. G. Salama*, Alexander G. Murray
Marine Scotland Science, Marine Laboratory, 375 Victoria Road, Aberdeen AB11 9DB, UK
ABSTRACT: Global aquaculture production has rapidly increased over recent decades, primarilythrough the increase in production per farm unit. However, size (biomass) may be a factor in thetransmission of infectious diseases between hydrodynamically linked fish farms. A combined epi-demiological–simplified hydrodynamic model is used to demonstrate that as farm units increasethey experience higher numbers of infections caused by a range of pathogen characteristics. Themodel demonstrates that as farm size increases in areas where faster currents prevail, there is aneed to increase the separation distance between farms to prevent pathogen transmission. A com-parison of production regimes demonstrates, however, that fewer, highly separated, larger farmsreduce overall losses compared to numerous smaller farms in close proximity to each other.
KEY WORDS: Farm size · Pathogen transmission · Hydrodynamics
Resale or republication not permitted without written consent of the publisher
INTRODUCTION
Infectious disease dynamics in aquaculture areregulated by host population size (Ögüt 2001,Krkošek 2010) because larger populations haveincreased contact between infectious and susceptibleindividuals. Herd size has been identified as a dis-ease transmission risk factor for terrestrial animalproduction (Sørensen et al. 2000, Humblet et al.2009). In aquaculture, host density has been shownto be a factor in transmission of infectious pancreaticnecrosis virus (IPNV) (Bebak-Williams et al. 2002)and infectious hematopoietic necrosis virus (IHNV)(Ögüt & Reno 2004) in salmonids. Sensitivity analysisof susceptible-infected-recovered (SIR) models havedemonstrated that host density alters the transmis-sion rate of disease within a host fish population(Ögüt et al. 2005), indicating that population sizecould also have an impact on the transmission of dis-ease between host populations. Pathogen concentra-tion can increase in the surrounding environmentwith increased numbers of infected fish on a farm,irrespective of density (Murray 2009).
Aquaculture production continues to increase glo -bally (Food and Agriculture Organisation of theUnited Nations [FAO] 2008) and is predicted to sur-pass fisheries as the major source of fish for humanconsumption (FAO 2010). Global production is fore-cast to increase by 6% per annum to 130 million t by2020 (FAO 2009), and to fulfil this demand aqua -culture sites need to become more abundant andincrease the level of production per site. The aqua-culture industry in China accounts for 2/3 of globalproduction (FAO 2007) and has doubled the areaused for aquaculture whilst having a 6-fold increasein production during 1979 to 1996 (FAO 1997), indi-cating that on average size per production unit hasincreased. For production to further increase, indus-tries must become more efficient by minimising stockloss due to infectious disease, as it is estimated thatthis costs 3 billion USD globally (Subasingh et al. 2001).
Salmon accounts for approximately a tenth of globalaquaculture production by value, and the size of theindustry continues to grow (FAO 2008). Within theEuropean Union, Scotland is the largest aquacultureproducer of Atlantic salmon Salmo salar. Since 1988
OPENPEN ACCESSCCESS

Aquacult Environ Interact 2: 61–74, 2011
production has increased to the current level of144 000 t and is expected to continue to grow (Walker2010). However, since 1998, the number of farm siteshas decreased (Walker 2010); thus, production perfarm is increasing. The largest Scottish farms cur-rently have biomass consents to stock up to 2500 t(available from the Scottish Environment ProtectionAgency [SEPA] production database upon request),while salmon farms over 5000 t exist in Norway (Fis -keridirektoratet 2011); therefore, it is possible thatScottish production could increase production throughgreater stocking densities. The economic value ofcurrent production is reported to be over £500 millionyr–1 (Scottish Salmon Producers’ Organisation 2010)and the industy provides valuable employment inrural communities; therefore, aquaculture is an im -portant contributor to the economy of Scotland. How-ever, pathogenic diseases have significant impactsdue to production losses through mortality (Murray &Peeler 2005), and this subsequently has an economiceffect, as demonstrated by the estimated £20 millioncost of an infectious salmon anaemia (ISA) outbreakin Scotland in 1998/1999 (Hastings et al. 1999), whilstthe costs of the recent 2008/2009 outbreak (Murrayet al. 2010) are still to be established. Due to the neg-ative impact of pathogenic disease transmission, it isimportant to ascertain methods of assessing pathogentransmission pathways in order to reduce the impacton farmed fish production.
An important concept in disease progression is thatof a dose threshold that initiates the disease symp-toms and is commonly termed the minimum infectivedose (Ward & Akin 1984). This threshold is oftenobtained by measuring the minimum detectable levels of pathogens that cause an infection response.Below this threshold no symptoms occur because theinnate immune system is able to eliminate or mitigateagainst low levels of pathogen exposure (Watts etal. 2001); above the threshold an individual has a certainty of becoming infected. Such minimum infectious doses have been identified for salmonidpathogens causing ISA (Raynard et al. 2001, Gregoryet al. 2009), IPN (Urquhart et al. 2008) and amoebicgill disease (Morrison et al. 2004).
Infectious disease dynamics are controlled by char-acteristics associated with host and pathogen bio -logy. Host population size often plays a role in thetransmission, persistence and also the dynamic tra-jectories of the epidemic (Anderson & May 1979,May & Anderson 1979, Grenfell & Dobson 1995) dueto increased contact between infectious and suscep-tible individuals. Within terrestrial systems it is oftenthe case that a diseased individual enters a suscepti-
ble population, possibly initiating an epidemic. How-ever, in aquaculture systems, water is able to trans-mit free-moving pathogenic agents between hydro-dynamically connected discrete fish farms (Amund -rud & Murray 2009, Frazer 2009) and infection canbe initiated without the presence of an infectedhost within a naïve population. Hydrodynamic trans -mission between farms has been demonstrated forISA (Gustafson et al. 2007) and pancreas disease(PD) (Viljugrein et al. 2009) and has been attributedto the spread of ISA (e.g. McClure et al. 2005, Aldrinet al. 2010), sea lice (e.g. Amundrud & Murray 2009)and PD (e.g. Kristoffersen et al. 2009, Aldrin et al.2010). The importance of hydrodynamic diseasemovements has been demonstrated by the introduc-tion of disease management areas (DMAs) to preventthe spread of ISA (Scottish Executive 2000) basedon tidal excursions surrounding producing farms(Marine Scotland 2010). The recent (2008/2009) out-break of ISA in the southwest Shetland mainlanddemonstrates how hydrodynamically linked farmsled to infection in 6 nearby farms (Murray et al.2010). In Norway, proximity is described as a risk fac-tor in the spread of ISA (Lyngstad et al. 2008); like-wise, the Chilean ISA outbreak (2007/2008) demon-strated spatial clustering of infectious farms surround -ing an initial outbreak farm (Mardones et al. 2009).
This paper presents the use of an adapted discrete-time susceptible-exposed-infected-recovered (SEIR)-type model (Diekmann & Heesterbeek 2000), repre-senting farm units linked by a simplified hydro -dynamic model which allows for between-farmtransmission. An example use of the model is pro-vided by identifying the characteristics of examplesalmo nid pathogens and then deriving the separation distances between farm units that are necessary inorder to prevent the transmission of disease betweensites, for farms of varying sizes.
METHODS
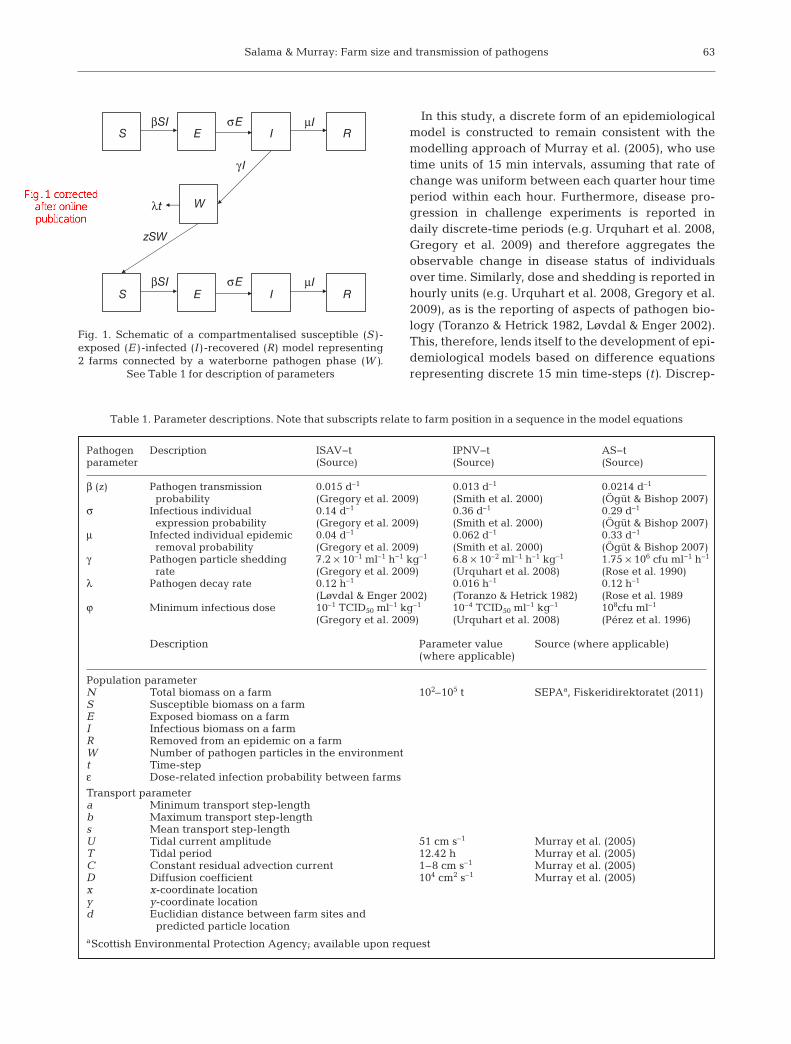
Fig. 1 shows a schematic of the model frameworkused within this paper. It is similar to the standardSEIR frameworks but with an additional reservoircompartment for waterborne pathogens (W) whichexpose other farms. It is assumed that, due to tidalmovements, these particles pose no additional risk tothe source farm as direct transmission dominatesinfection risk within a farm. A constant farm popula-tion size (N) and a closed system without populationsize change are assumed. The parameters used in themodel are described in Table 1.
62
Salama & Murray: Farm size and transmission of pathogens
In this study, a discrete form of an epidemiologicalmodel is constructed to remain consistent with themodelling approach of Murray et al. (2005), who usetime units of 15 min intervals, assuming that rate ofchange was uniform between each quarter hour timeperiod within each hour. Furthermore, disease pro-gression in challenge experiments is reported indaily discrete-time periods (e.g. Urquhart et al. 2008,Gregory et al. 2009) and therefore aggregates theobservable change in disease status of individualsover time. Similarly, dose and shedding is reported inhourly units (e.g. Urquhart et al. 2008, Gregory et al.2009), as is the reporting of aspects of pathogen bio -logy (Toranzo & Hetrick 1982, Løvdal & Enger 2002).This, therefore, lends itself to the development of epi-demiological models based on difference equationsrepresenting discrete 15 min time-steps (t). Discrep-
63
SβSI σE μI
βSI σE μI
γ I
E I R
Wλt
zSW
S E I R
Fig. 1. Schematic of a compartmentalised susceptible (S)-exposed (E)-infected (I)-recovered (R) model representing2 farms connected by a waterborne pathogen phase (W).
See Table 1 for description of parameters
Pathogen Description ISAV−t IPNV−t AS−tparameter (Source) (Source) (Source)
β (z) Pathogen transmission 0.015 d–1 0.013 d–1 0.0214 d–1
probability (Gregory et al. 2009) (Smith et al. 2000) (Ögüt & Bishop 2007)σ Infectious individual 0.14 d–1 0.36 d–1 0.29 d–1
expression probability (Gregory et al. 2009) (Smith et al. 2000) (Ögüt & Bishop 2007)μ Infected individual epidemic 0.04 d–1 0.062 d–1 0.33 d−1
removal probability (Gregory et al. 2009) (Smith et al. 2000) (Ögüt & Bishop 2007)γ Pathogen particle shedding 7.2 × 10⁻¹ ml–1 h−1 kg–1 6.8 × 10⁻² ml–1 h–1 kg–1 1.75 × 10⁶ cfu ml−1 h–1
rate (Gregory et al. 2009) (Urquhart et al. 2008) (Rose et al. 1990)λ Pathogen decay rate 0.12 h–1 0.016 h–1 0.12 h–1
(Løvdal & Enger 2002) (Toranzo & Hetrick 1982) (Rose et al. 1989ϕ Minimum infectious dose 10–1 TCID50 ml–1 kg–1 10–4 TCID50 ml–1 kg–1 108cfu ml–1
(Gregory et al. 2009) (Urquhart et al. 2008) (Pérez et al. 1996)
Description Parameter value Source (where applicable)(where applicable)
Population parameterN Total biomass on a farm 102–105 t SEPAa, Fiskeridirektoratet (2011)S Susceptible biomass on a farmE Exposed biomass on a farmI Infectious biomass on a farmR Removed from an epidemic on a farmW Number of pathogen particles in the environmentt Time-stepε Dose-related infection probability between farms
Transport parametera Minimum transport step-lengthb Maximum transport step-lengths Mean transport step-lengthU Tidal current amplitude 51 cm s–1 Murray et al. (2005)T Tidal period 12.42 h Murray et al. (2005)C Constant residual advection current 1–8 cm s–1 Murray et al. (2005)D Diffusion coefficient 104 cm2 s–1 Murray et al. (2005)x x-coordinate locationy y-coordinate locationd Euclidian distance between farm sites and
predicted particle locationaScottish Environmental Protection Agency; available upon request
Table 1. Parameter descriptions. Note that subscripts relate to farm position in a sequence in the model equations

Aquacult Environ Interact 2: 61–74, 2011
ancies between continual and discrete forms of SEIRare minimised, as the scale of the time-step is rela-tively small compared to the disease progressionobserved over some 3 mo in challenge experiments(Urquhart et al. 2008, Gregory et al. 2009).
An initial infected fish farm (Farm 1) is described asa closed population which has no mortality or re -cruitment and the transition with discrete-time-stepsbetween: susceptible (S); exposed (E); infected ( I)and recovered (R) hosts and can be expressed by anadapted discrete-time SEIR model (Eqs. 1 to 4):
(1)
(2)
(3)
(4)
where β is the transmission rate, σ is the infective rateand μ the removal rate. N1 is the total farm biomass(S1+E1+I1+R1) of Farm 1.
In order for disease to persist within an infectedpopulation, R0, the net rate of secondary infectioncaused by an infected individual (Anderson & May1979), is represented in Eq. (5) as:
(5)
For infection to persist in Farm 1, R0 must begreater than or equal to one. For this system Eq. (6)represents the critical population size (Nc) and is:
(6)
When considering the spread of infective particlesto a secondary, susceptible farm, the initiation of theinfection is caused by free-moving infective particleswhich pose a risk probability (ε) to the secondaryfarm. This risk value is a summation of factors such asdistance between farms, pathogen decay, pathogentidal-movement speeds and the number or dose ofinfective agents the susceptible farm is exposed to.
The SEIR model for the secondary farm is repre-sented by Eqs. (7) to (10), and the remaining numberof the particles in the water surrounding the sec-ondary farm is expressed by Eq. (11), demonstratingthe decay of particles shed from infective individuals.
(7)
(8)
(9)
(10)
(11)
ƒ(t) is the time taken for a particle cohort to be trans-mitted between sites which varies dependent on thecurrent speeds. The risk to a secondary naïve farm ata given time point is related to the number of particlesfrom in fected individuals shed at a rate (γ) that sur -vive a decay function related to time, and bio logicalde cay rate (λ) from infected individuals in the firstfarm, at a point in time determined by the separationdistances. The infection rate (z) determines the propor -tional rate of infection for an individual exposed to theminimum infective dose of pathogen within the water.
Each individual requires a minimum dose (φ) inorder to become infected. Should the remaining dosebe sufficient to saturate the population with infection,all individuals in the population then instantaneouslybecome infected.
(12)
Should the dose be sufficient to infect a proportionof the population, then this proportion becomes in -fected whilst the proportion 1− εt remains susceptible.
(13)
When the dose is below the minimum infectionthreshold, the population remains disease free.
(14)
The threshold for infection to occur on a secondfarm can be expressed as:
(15)
where the secondary farm is completely susceptible,
i.e. S2 = N2, the invasion condition is , and
therefore independent of secondary farm size. Thisexpression does not account for the ability of in -fection to persist within a farm, which is depen -dent on farm size (Eq. 5). The proportion of suscep -tible individuals within Farm 2 that become infectedis the product of the invasion condition and the number of susceptible individuals within the farm,
i.e. , indicating that the resulting number
of fish which become infected is greater in largerfarms.
R R It t t1 1 1 1, , ,+ = + μ
R N0 1= βμσ
N1c = μσβ
S SI
Nt t tt t
2 1 22
2
11
, ,,
+ = − −−( )⎛
⎝⎞⎠ε
β ε
E E SI
Nt t t tt t
2 1 2 22
2
11
, , ,,
+ = −( ) + +−( )⎡
⎣⎢⎤⎦⎥
σ εβ ε
I I Et t t2 1 2 21, , ,+ = −( ) +μ σ
R R It t t2 1 2 2, , ,+ = + μ
W It t tt
2 1, , ƒ( )= −[ ]−γ λe
zW
Nt
t2
2
1 1, ,φ
ε≥ =
φ φ εφ
< < =zW NzW
Nt tt
2 22
2,
,,
zW t t2 0, ,< =φ ε
I Sz W
t tt
2 1 2 12 1, ,,
+ += ≥σ
φ
z W tσφ
2,
I I Et t t1 1 1 11, , ,( )+ = − +μ σ
S SS I
Nt tt t
1 1 11 1
1, ,
, ,+ = −
β
E ES I
Nt tt t
1 1 11 1
1
1, ,, ,
+ = −( ) +σβ
z W St tσφ2 2, ,
64

Salama & Murray: Farm size and transmission of pathogens
Therefore, there are 2 mechanisms to avoid a farmepidemic: being sufficiently separated from an infec-tion source so as to not to become exposed, or beingsufficiently separated that the exposure dose is toolow to infect and support a self-sustaining infectiouspopulation.
There is a disease-free equilibrium when W2,t < φ,(S2,E2,I2,R2) = (N 2,0,0,0) and there is an unstableendemic equilibrium when R0 ≥ 1 (not expanded inthis paper).
Combining Eqs. (6) and (11) with the invasion con-dition (Appendix 1) produces a term for the criticalmaximum number of time-steps (tc) a particle cohortcan survive to cause sustained infection in a sec-ondary farm of varying size:
(16)
In order to provide representative outputs of thedispersal distance of a cohort of particles, γI1,[t−ƒ(t)] isassigned either the peak shed, half of peak shed or aquarter of the peak shed value derived from a sourcefarm.
Within a given time the mean distance travelled bya particle undertaking a random walk, with random-sized steps of uniform distribution of variance, witha minimum step-length of a and a maximum step-length of b, has a mean step-length s where:
(17)
The maximum step length for a particle at eachtime−step moving without random movements canbe approximated to the size of movement due toadditive constant movement and sinusoidal tidal current:
(18)
where U is the tidal current, T is the tidal period andC is the constant residual advection current, and forsimplification (and maximisation of variance) it isassumed that a negative movement is equally likely,i.e. a = –b; therefore:
(19)
By manipulating the hydrodynamic expressions formovement in the x- and y-axis presented by Murrayet al. (2005), it is possible to provide a discreteexpression for the mean distance travelled by a parti-cle in a given time that has the remaining infectiouscapability of infecting a secondary farm:
(20)
(21)
With standard deviations for both x and y dimensionsof:
(22)
where x is the position along the x-axis of the hori-zontal plane, y is the y-axis position in the horizontalplane and D is the diffusion coefficient. An exampleof the mean distances travelled by a cohort of parti-cles over a 2 wk period is shown in Fig. 2.
Therefore, it is possible to provide an expressionfor the maximum location reached by an infectiousparticle (and its standard deviations) as a function offarm size by replacing t with Eq. (16) in Eqs. (20) and(21).
To demonstrate the exposure distances for the ex -ample pathogens, characteristic parameters usedwithin the presented model were obtained from thepublished literature for infectious pancreatic necrosisvirus type (IPNV-t), infectious salmon anaemia virustype (ISAV-t) and Aeromonas salmonicida type (AS-t)pathogens (Table 1). Physical parameters used arethe same as found in Murray et al. (2005) such that:D is 104 cm2 s–1, U is the maximum spring tide currentof 51 cm s–1, T is 12.42 h, C ranges between 1 and8 cm s–1 and fish production unit size between 102
and 105 t of fish (SEPA, Fiskeridirektoratet 2011; seeTable 1). It is assumed that z = β for simplicity. Biolog-
tS I z
c =− ⎡
⎣⎢⎤⎦⎥
lnμφγ β
λ2 1
sb a= −
12
b Ut
TC= ⎡
⎣⎢⎤⎦⎥
+sin2π
sU
tT
C=
⎡⎣⎢
⎤⎦⎥
+⎡⎣⎢
⎤⎦⎥
sin2
3
π
x xst
st
D
Tst t= + +−1 3
y yst
st
D
Tt t= +−1
±s t
65
Fig. 2. Mean distances travelled by a cohort of particles over a 2 wk period

Aquacult Environ Interact 2: 61–74, 2011
ical parameters were obtained from Smith et al.(2000) with the following mean daily rates of IPNV-tper fish: β = 0.013; σ = 0.36; and μ = 0.062. For IPNV-t λ = 1.6% h–1 (Toranzo & Hetrick 1982). The ISAV-tparameter of λ = 12% h–1 was obtained from Løvdal& Enger (2002); mean daily rates of ISAV-t per fishwere derived from Gregory et al. (2009): β = 0.015(rate of mean cumulative mortality over the studyperiod for immersion-challenged fish), σ = 0.14(mean cumulative daily rate from intraperitoneal[i.p.]-injected fish to express viral particles) and μ =0.04 (mean cumu lative time for i.p.-injected fish whounderwent no mortality over the study period). Ögüt& Bishop (2007) provided parameter estimates forAS-t in Chinook salmon Oncorhynchus tshawytscha:β = 0.0214, and μ = 0.29, σ = 0.33. The parameter esti-mate of λ = 12% h–1 for AS-t was derived from Roseet al. (1989).
The exposure risk posed by one infectious particlefor a farm (ε) located at (x,y) at a given time pointdiminishes the further it is located from the meanlocation reached for that given time pointbased on the Euclidean distance (d) between thefarm site and the mean resting location such that:
(23)
This is scaled by the numbers of particles located at(xt,yt) such that γIt, the particles resting at location(xt,yt), are equal to: γIt−(t – 1); this allows for the incom-ing risk for a single cohort of particles at (xt,yt) to bedefined as:
(24)
For any farm at a given location in this hypotheticalsystem it is possible to predict the epidemic trajectorywithin that farm by including εt in Eqs. (7) to (10).
For ease and maximum transmission, the maximumrisk distance from a farm with the mean Scottish con-sented biomass of 1400 t (Walker 2010) containinginfected fish at reported prevalences is assumed tohave the peak shedding rates (γ) of 6.8 × 10³ TCID50
ml–1 h–1 kg–1 for IPNV-t particles (Urquhart et al.2008) and 7 × 101 ml–1 h–1 kg–1 for ISAV-t particles(Gregory et al. 2009). The minimum infectious doses(φ) are 10–1 TCID50 ml–1 kg–1 for IPNV-t (Urquhart etal. 2008) and 101 TCID50 ml–1 kg–1 for ISAV-t (Gre-gory et al. 2009). For rainbow trout Oncorhynchusmykiss challenged with Aeromonas salmonicida(Pérez et al. 1996) there was an associated minimuminfective dose of 108 cfu ml–1 over 12 h exposure anda shedding rate of 1.75 × 10⁶ cfu ml–1 h–1 (Rose et al.1990). The prevalence for each pathogen is reported
as 12.5% for IPNV-t in Scottish salmon (Bruno 2004)and 75% for AS-t from experimental infection of Chi-nook salmon (Ögüt & Reno 2005). For ISAV-t a pre -valence of 30% is determined because it has beenreported as ranging between 28 and 40% for Cana-dian farmed Atlantic salmon (McClure et al. 2005)whilst the recent ISA occurrence in the Shetland Islesdemonstrated a prevalence of 30% (M. Hall pers.comm.). To demonstrate the change in the safe sepa-ration distances with variable dose responses simula-tions are produced with peak, half peak and quarterpeak shedding. As it would be too time consumingto consider all time steps throughout a disease out-break, these shedding points provide a general de -scription of the influence of shedding intensity ontransmission with peak being a worse case scenario.These shedding values are also akin to varying thesize of the farm or the proportion of infected individ-uals on the farm. Although the number of particlesshed would be similar under these scenarios, to avoidinconstancies due to internal disease transmissionwithin farms of varying size (Krkošek 2010) it is ben-eficial to consider a range of conditions in farmsof equal size. Likewise, considering many permuta-tions of farm sizes and separation distances becomesintensive. Therefore, units are used representingsmaller sized (500 t) farms and moderately sized(1250 t) farms currently present in Scotland and Nor-way, and larger farms of 2500 and 5000 t, which arecurrently found in Norway.
The separation distance scale used is for descriptivepurposes and is based on the assumption that scalingof farm size produces the same scaled in crease inshed particle cohort number. Thus, for the cohort toexhibit the same dose it requires the same scaled in-crease in time. For example, a doubling of farm size isassumed to produce double the number of particlesshed, and thus a secondary farm is assumed to requiredouble the separation distance in order to be exposedto the same dose as a source farm half its size.
Shed particles are moved by persistent currents atspeeds, experienced in Scottish inshore waters (Lee& Ramster 1981), ranging from 1 to 8 cm s–1 at 1 cms–1 intervals. The production units used represent thesmaller farms (102 t) in Scotland, increasing to mod-erate−sized farms (102.5 t) and to larger farms (103 t).In recent years production has been administered ata DMA level where farms are clustered together andconsidered as one production unit; it is, therefore,possible to consider these DMA units as large farms.Hence, DMA production scenarios with ‘farm units’greater than single farms are considered to be thosefrom 103.5 up to 105 t, therefore providing possible
εγ β
φ
λ
( , ), ƒ( )
( )
x yt t
d t
t t
I= −
− −1
1e
d x x y y= − + −( ) ( )2 2
( ),x yt t
66

Salama & Murray: Farm size and transmission of pathogens 67
separation distances required to avoid transmissionbetween DMAs.
Simulations were conducted in R 2.8.1 (R Develop-ment Core Team 2008) in order to ascertain separationdistances in a range of simulations representing vary-ing tidal speeds, farm sizes and pathogen characteristics.
RESULTS
The mean distances covered by all particles (Fig. 2)over a 2 wk period demonstrate that there is consid-erably more movement in the x-dimension compared
to the y-dimension within the simulation hydro -dynamic model. Therefore, safe distance calcula-tions can be made based on the movement in the x-dimension.
The mean simulated safe distances needed to avoidpersistent infection for farms exposed to the peak,half peak and one-quarter peak shed of IPNV-t,ISAV-t and AS-t pathogens from an infected 1400 tfarm are shown in Fig. 3. As secondary farm size,shedding dose from a source farm, and residual tidalcurrent speed increase for each of the pathogen types,the separation distance required to avoid infectionalso increases.
20 20 40 40 40
60
80
100 120
140
8
7
6
5
4
3
2
1
8
7
6
5
4
3
2
1
8
7
6
5
4
3
2
1
a)
Log10 farm size (t)
Res
idua
l sp
eed
(cm
s–1
)
60
60
80
100 120
120
b) 20
80
100
c)
10
40 40
40 50
60 70
d) 20 20
30 30
60
60
70 80 80
e) 10 10
20
30
50 50
70
f)
200
400
600 800
2.0 2.5 3.0 3.5 5.04.0 4.5 2.0 2.5 3.0 3.5 5.04.0 4.5 2.0 2.5 3.0 3.5 5.04.0 4.5
g)
200
400 600
h)
100
200
300
400 500
600 700
i)
Fig. 3. Mean distances (km) at which a farm of a given size in varying current speeds avoids having a persisting epidemicwhen exposed to a 1400 t farm infected with reported prevalence of: Aeromonas salmonicida type (AS-t) at (a) peak shed, (b)half peak shed, (c) a quarter peak shed; infectious salmon anaemia type virus (ISAV-t) at (d) peak shed, (e) half peak shed, (f) aquarter peak shed; or infectious pancreatic necrosis virus type (IPNV-t) at (g) peak shed, (h) half peak shed, (i) a quarter
peak shed

Aquacult Environ Interact 2: 61–74, 201168
0e+
00
2e+
06
4e+
06 a)
0.0e
+0
06.
0e+
06
1.2e
+07
b)
0 200 600 10000.0e
+0
01.
0e+
072.
0e+
07
Time (15 min steps)
c)
0 200 600 1000
0e+
00
2e+
074e
+07
d)
Farm
mas
s (k
g)
0e+
00
2e+
06
4e+
06
a)
0 200 600 1000 0 200 600 1000
0.0e
+0
06.
0e+
06
1.2e
+07
b)
0.0e
+0
01.
0e+
072.
0e+
07
Farm
mas
s (k
g)
c)
0e+
00
2e+
074e
+07
d)
Time (15 min steps)
Fig. 4. Epidemic trajectory over a 2 wk period of varying farms infected by the peak shed of infectious salmon anaemia typevirus (ISAV-t) particles from a 5 t infected farm located at varying distances: (a) a 5 × 10² t farm separated by 1 km, (b) a 12.5 ×10² t farm separated by 2.5 km, (c) a 2.5 × 10³ t farm located 5 km from the origin, and (d) a 5 × 10³ t farm located 10 km away.
Solid line: susceptible, S; dashed: exposed, E; dotted: infected, I; dot-dash: recovered, R
Fig. 5. Epidemic trajectory over a 2 wk period of varying farms infected by the peak shed of infectious pancreatic necrosis virustype (IPNV-t) particles from a 5 t infected farm located at varying distances: (a) a 5 × 10² t farm separated by 1 km, (b) a 12.5 ×10² t farm separated by 2.5 km, (c) a 2.5 × 10³ t farm located 5 km from the origin, and (d) a 5 × 10³ t farm located 10 km away.
Solid line: susceptible, S; dashed: exposed, E; dotted: infected, I; dot-dash: recovered, R

Salama & Murray: Farm size and transmission of pathogens 69
0.0e
+0
01.
5e+
07
Farm
mas
s (k
g)a)
0 200 400 600 800 1000 12000e+
00
3e+
07
b)
Time (15 min steps)Fig. 6. Epidemic trajectory of (a) a 2.5 × 10³ t farm separated by 5 km from a same size farm with 5% prevalence ISAV-tpathogen (infection causing complete infection) and (b) a 5 × 10³ t farm separated by 10 km from another farm of the same sizewith 5% infection of an ISAV-t pathogen causing ~88% infection. Solid line: susceptible, S; dashed: exposed, E; dotted:
infected, I; dot-dash: recovered, R
a)
b)
c)
d)
Fig. 7. Disease progression over a2 wk period from a 1% prevalenceinfectious salmon anaemia typevirus (ISAV-t) initially infected sitebetween farms in sequence: (a) 5 ×10⁶ t at 1 km intervals; (b) 1.25 × 10⁷ tat 2.5 km intervals; (c) 2.5 × 10⁷ t at5 km intervals; (d) 5 × 10⁷ t at 10 kmintervals. Axis scale is removed sothat comparison in total disease inci-dence across sites can be compared.Solid line: susceptible, S; dashed:exposed, E; dotted: infected, I; dot-
dash: recovered, R

Aquacult Environ Interact 2: 61–74, 2011
The simulation model provides an example (Fig. 4)of smaller farms close to the source of infection whichhave larger infection numbers than larger farmswhich are further away when exposed to ISAV-t. A5 × 102 t farm located 1 km downstream experiencescomplete infection (Fig. 4a), a 12.5 × 10² t farmlocated 2.5 km downstream experiences ~95% infec-tion (Fig. 4b), a 2.5 × 10³ t farm located 5 km from theorigin experiences some 36% infection (Fig. 4c), andFig. 4d demonstrates a 5 × 10³ t farm located 10 kmaway causing some 393 kg of infected production.Fig. 5 demonstrates that, irrespective of separationdistance within the simulation and of farm produc-tion, a highly conserved pathogen such as IPNV-twill lead to complete infection for farms even whenseparated by 10 km.
An example comparison of production strategiesis considered in order to produce 5 × 10³ t fish. Theepidemic trajectory of two 2.5 × 10³ t farms separatedby 5 km from a same size farm with 5% ISAV-t path -ogen (Fig. 6a) causes complete infection whereas a5 × 103 t farm separated by 10 km from another farmof the same size with 5% prevalence of an ISAV-tpathogen causes ~88% infection (Fig. 6b).
Fig. 7 shows a sequence of 4 equal-sized farms sep-arated by equal distances allowing for pathogens tobe transmitted from a source farm to the fourth farmvia intermediate farms. More of the total productionbecomes infected when smaller farms are locatedcloser together compared to when larger farms arehighly separated.
DISCUSSION
This paper demonstrates a model which combinesa SEIR model, a reservoir-SEIR model and a simpli-fied hydrodynamic transport model in order to pro-duce a framework to assess the impact of farm size onthe transmission of pathogens within aquaculture.
A SEIR model in discrete-time represents the ini-tially infected farm. Similar discrete forms of epi-demic models have been used in a variety of studies,such as the description of rabies in predator pop -ulations (Allen et al. 2002) and gene frequency anddisease spread in plant populations (Kesinger et al.2001). By modelling in a discrete time format, it ispossible to replicate systems where there are non-continuous generations or production cohorts, suchas the case in salmonid aquaculture. This aspect ofthe model acts as a source of infectious particleswhich are then transported towards a secondarynaïve farm through hydrodynamic pathways.
The hydrodynamic model is a modified version ofthat presented by Murray et al. (2005) which ac -counts for the mean location reached by each cohortof particles derived from a source farm. This processremoves the need for multiple hydrodynamic simula-tions in order to capture stochastic variability. Themodel is essentially a 2D dispersion model which isdominated by horizontal movements away fromfarms along the x-axis.
As the cohort of particles are transported predomi-nantly along the x-axis with little movement on they-axis (Fig. 2), they decay as a function of time andbiological decay and therefore the effective numberof particles for each cohort of particle reservoir isdiminished. Infection occurs when the number ofparticles in the reservoir and the infection probabilityis greater than the minimum infective dose. The rateof infection is assumed to spread equally amongst thesusceptible individuals within the naïve farm. Theinvasion condition and persistence condition usedwithin this paper indicate that farm size is not a factorin a farms’ susceptibility to infection. However, per-sistence is conditional on a critical population size, asis the rate of epidemic development. For simplicity,the model assumes that, should the dose exceed theminimum infective dose, then infection will occur.This infectious class will then propagate the diseasethrough internal contact with susceptible individuals.The secondary SEIR phase has unstable endemicstates in this model as shown for the basic SEIRmodel (Li & Muldowney 1995), but this is furthercomplicated by the external influx of disease-inducing particles. The analysis of such states is notconsidered here. Due to this complication, assess-ment of separation distances is conducted using thepeak shedding rate, as this will cause the largestnumber of pathogen particles. Here, we demonstratethat safe separation distances in crease for IPNV-t,ISAV-t and AS-t pathogens exposing farms thatincrease in size in increasing residual current flows.The more rapidly the pathogens decay, the less sepa-ration distance is required. Likewise, when farms areexposed to half and quarter maximum doses (repre-senting a reduction in infected individuals in the initial farm), the separation distance required to pre-vent risk of infection is reduced. Reducing farm sizedecreases the number of shed pathogens; therefore,farms could be located closer together. However,when farms are closer together, they obtain a largerincoming particle reservoir and therefore experiencegreater infection numbers.
As production is concentrated in larger farms,there are fewer of these and therefore separation dis-
70

Salama & Murray: Farm size and transmission of pathogens
tances can be increased. In order to assess the dis-ease dynamics of differing production systems themodel is considered with farms producing 5 × 10³ t in4 production methods:
(1) Ten farms stocked with 5 × 10² t, located 1 kmfrom an initial source,
(2) Four farms stocked with 1.25 × 10³ t located2.5 km from an initial source,
(3) Two farms stocked with 2.5 × 10³ t located 5 kmfrom an initial source,
(4) One farm stocked with 5 × 10³ t located 10 kmfrom the initial source.
The closer the farms are together, the higherthe percentage infection per farm (Fig. 4) by labilepathogens. However, when exposed to highly con-served pathogens, a complete infection of the farmoccurs (Fig. 5). This demonstrates that the optimalaquaculture production strategy to avoid infection ofindividuals on a farm is to have larger separation dis-tances and larger farms, compared to many smallfarms in close proximity. Fig. 6 presents infectionfrom an initial 5 t infected source. When consideringthe effect of many small and nearby farms versus afew separated and larger farms on additional farmsdownstream, simulations indicate that 2 farms sepa-rated by 5 km and stocked with 2.5 × 10³ t leads tomore infected individuals compared to a situationwhere a larger 5 × 10³ t stocked farm is separated by10 km. Furthermore, the rate of infection within thelarger, more separated farms is decreased, whereasin smaller nearby farms the spread of infectionthroughout the individuals within the farm is almostinstantaneous. This is an important factor in monitor-ing and mitigation strategies which can be imple-mented by farm operators. With lower rates of infec-tion the farm operators may be able to act before theepidemic peaks, thus preventing spread to down-stream farms, whereas infection in a smaller farmsystem requires immediate response and may stilllead to substantial infection in downstream farms.When considering farms in sequence (Fig. 7), smallerfarms clustered together experience disease inci-dence, whereas larger farms separated further apartdo not demonstrate infection. For smaller farms insequence there is a time lag before incidence of dis-ease based on distance away from the source, withthose further away becoming infected later thanthose nearby. This is a similar pattern to the recentISA outbreak in Shetland, where incidence reportingoccurred later with increased distance from the initially infected site (Murray et al. 2010).
Separation distances for large farms may lead to arequirement for greater separation distances for MA-
based production. Here, production unit size variesrepresenting moderate- to large-sized farms up toand through the DMA scale. Current ISAV DMAs arebased on tidal excursion distances of 7.2 km for main-land Scotland and 3.6 km for the Shetland Islands.These were developed using simple yet robust tidalmodels (Scottish Executive 2000); DMAs are continu-ous over the area in which adjacent farms overlap, soa separation distance of greater than 14.4 (or 7.2 kmin Shetland) is required for a DMA boundary.Fig. 3d–f indicate that these DMAs are likely to beappropriate for current production levels in mainlandScotland and the Shetland Islands for ISAV-typepathogens when farms are located in low residualcurrent areas. However, they become unsuitable formore robust patho gens. Should farms be increased insize or be situated in faster current locations, such asoffshore, it is possible that the DMAs will need to bereconsidered. However, even DMAs with imperfectboundaries can be useful for the management of disease (Werkman et al. 2011).
For this work a simplified discrete model that pro-vides uniform transmission from source farm to naïvesite was used in order to assess the role of farm sizein the transmission of pathogenic diseases betweenhydrodynamically connected farms. Previous workby Scheel et al. (2007) developed a stochastic proba-bilistic model of ISA transmission based on empiricalinformation relating to individual farms, including abiomass parameter, seaways separation distance, aswell as local contact networks. Aldrin et al. (2010)amended Scheel et al.’s model to include a time-constrained measure of cohort size and previous farminfection status and applied parameter estimates forheart and skeletal muscle inflammation (HSMI) andPD in addition to ISA. Although this model can not bedirectly validated, as it would be unethical to allowpathogenic disease to progress within a farm, nordoes this study include estimations of network-basedrisk, it is demonstrated that risk avoidance distancesare comparable to previous work. The relative infec-tion rate from ISAV is radically reduced for farmsseparated by more than 11 km (Aldrin et al. 2010),which is consistent with earlier assertions that muchof the ISA risk is concentrated within 5 km (Scheel etal. 2007) of a farm and that no significant risk existsbeyond 10 km (Scottish Executive 2000). Addition-ally, Green (2010) argues that localised clusters offarms (akin to a large farm unit in the present study)separated by increased distances slow the spread ofa disease within a production system.
For robust pathogens, risk may exist over verylarge hydrographic distances similar to transmission
71

Aquacult Environ Interact 2: 61–74, 2011
distances for airborne pathogens in terrestrial sys-tems of 300 km (Sørensen et al. 2000) with recordedtransmission up to 200 km (Schley et al. 2009). However, the risk in aquaculture could be consid-ered as a worse case scenario as it is dependent onpersistent, reasonably high velocity currents for prolonged periods without deposition or non-lineardispersion, and without sufficient turbulent mixing.An example where potential and observed long-distance dis persal differs is provided by the invasiveMediterranean mussel Mytilus galloprovincialis inSouth Africa (McQuaid & Phillips 2000). Although itwas expected that larval dispersal could occur up to220 km, 90% of the larvae were sampled within5 km, and due to changing wind directions, maxi-mum dispersal distances ranged between 54 and165 km. Likewise, although pathogens could dis-perse over long distances, it is probable that exist-ing separation distances between DMAs, while farsmaller than potential transfer distance, could still berea sonably helpful for disease control of even robustpathogens. Furthermore, it must also be noted thatthe existence of the pathogens near farms does notnecessarily mean infection will occur (Murray 2009).
The framework in the present study is limited bythe use of simplified assumptions for both the bio -logical and hydro dynamic components. The condi-tional expression for transmission based on minimuminfectious doses is likely to have a functional re -sponse (e.g. Joh et al. 2009) as opposed to simply sat-uration, proportional or disease avoidance. However,the minimum infectious doses presented in the literature describe discrete thresholds as opposed todose responses. In the environment, pathogens have variable decay rates when exposed to different con-ditions in e.g. salinity, pH and temperature (e.g.Toranzo & Hetrick 1982, Rose et al. 1990). In ourstudy, the physical environment is assumed to behomogenous, allowing extended pathogen survivalfor possible further transmission. Our model takes noaccount of bathymetry, topo graphy or the presenceof obstacles that prevent long-distance transmission.Persistent currents are unlikely to occur over suchdistances demonstrated in our model, whilst at thesame time infrequent, stochastic transmission eventscould still occur beyond distances presented here.Therefore, the simplified structure allows for a trade-off between transmission events. In order to provideaccurate dispersal models, 3D oceanographic circu-lation models are required (e.g. Venayagamoorthy etal. 2011). This would greatly increase the complexityand limit the general applications of the model; asthey are site specific, this makes them inapplicable
for assessing issues regarding dispersal scale be -tween farms of varying size. Amundrud & Murray(2009) combined fish disease agent characteristicswith system-specific par ticle dispersal models for sealice dispersal in Loch Torridon; however, this re -quired high levels of computational processing andmodel validation and only provided characteristicsfor one individual system.
The present study is concerned with the alterationof disease transmission by varying farm size and sep-aration distance and does not consider environmen-tal impacts. However, recent work by Mayor et al.(2010) suggests that overall environmental efficiencymay be improved by locating larger farms in fastercurrents. They demonstrate that a critical thresholdexists between 800 and 1000 t where there is no addi-tional rate of benthic biology degradation for farmslocated in increased currents. Likewise, a similarfarm size threshold occurs for minimal changes inbenthic chemistry measurements derived from fish-farm waste (Mayor & Solan 2011).
Our paper only addresses the role of farm size indisease transmission through hydrodynamic path-ways. It must be noted that farm size may have a rolein disease transmission through alternative routes,such as fish movement networks (Green et al. 2009,Munro & Gregory 2009), whereby larger farms mayhave more sources of smolt inputs. Larger farmsmay also have altered biosecurity practices, whichchanges their susceptibility to disease outbreaks. Forexample, increased wellboat movements betweenlarger sites may transmit pathogens more frequentlywhilst larger farms may be able to implement morestringent disease monitoring practices. Clearly, therole of farm size in alternative methods of diseasetransmission needs additional consideration.
Although this is a simple model system, it high-lights the fact that, as unit size increases, farms experience higher numbers of infections. In order toimprove production efficiency larger farms locatedfurther apart experience fewer infections comparedto many smaller farms closer together with similaroverall stocking levels. Furthermore, not only dolarger, more separated farms experience fewer infective individuals, the rate at which the populationbecomes infected is reduced, thus allowing for disease monitoring and intervention management totake place to prevent further transmission.
Acknowledgements. This work was funded by the ScottishGovernment under project FC11103. The authors thank the4 anonymous reviewers and I. S. Wallace for suggestionstowards improving this manuscript.
72

Salama & Murray: Farm size and transmission of pathogens
LITERATURE CITED
Aldrin M, Storvik B, Frigessi A, Viljugrein H, Jansen PA(2010) A stochastic model for the assessment of the trans-mission pathways of heart and skeleton muscle inflam-mation, pancreas disease and infectious salmon anaemiain marine fish farms in Norway. Prev Vet Med 93: 51–61
Allen LJS, Flores DA, Ratnayake RK, Herbold JR (2002) Dis-crete-time deterministic and stochastic models for thespread of rabies. Appl Math Comput 132: 271–292
Amundrud TL, Murray AG (2009) Modelling sea lice disper-sion under varying environmental forcing in a Scottishsea loch. J Fish Dis 32: 27–44
Anderson RM, May RM (1979) Population biology of infec-tious disease. Part I. Nature 280: 361–367
Bebak−Williams J, McAllister PE, Smith G, Boston R (2002)Effect of fish density and number of infectious fish onthe survival of rainbow trout fry, Oncorhynchus mykiss (Walbaum), during epidemics of infectious pancreaticnecrosis. J Fish Dis 25: 715–726
Bruno DW (2004) Changes in prevalence of clinical infec-tious pancreatic necrosis among farmed Scottish Atlanticsalmon, Salmo salar L. between 1990 and 2002. Aqua -culture 235: 13–26
Diekmann O, Heesterbeek JAP (2000) Mathematical epi-demiology of infectious diseases: model building, analy-sis and interpretation. John Wiley & Son, Chichester
FAO (1997) A review of aquaculture extension services inthe People’s Republic of China. FAO, Rome
FAO (2007) Aquaculture in China and Asia: media factsheet. FAO, Rome
FAO (2008) World review of fisheries and aquaculture. FAO,Rome
FAO (2009) The state of world fisheries and aquaculture2008. FAO, Rome
FAO (2010) Aquaculture production 1950–2008. FishStatPlus − Universal software for fishery statistical timeseries www.fao.org/fishery/statistics/software/fishstat/en.(accessed 24 February 2011)
Fiskeridirektoratet (2011) Registre knyttet til akvakultur.www.fiskeridir.no/fiskeridir/akvakultur/registre (accessed21 October 2011)
Frazer LN (2009) Sea cage aquaculture, sea lice, anddeclines of wild fish. Conserv Biol 23: 599–607
Green DM (2010) A strategic model for epidemic control inaquaculture. Prev Vet Med 94: 119–127
Green DM, Gregory A, Munro LA (2009) Small- and large-scale network structure of lice fish movements in Scot-land. Prev Vet Med 91: 261–269
Gregory A, Munro LA, Snow M, Urquhart KL, Murray AG,Raynard RS (2009) An experimental investigation onaspects of infectious salmon anaemia virus (ISAV) infec-tion dynamics in seawater Atlantic salmon, Salmo salarL. J Fish Dis 32: 481–489
Grenfell BT, Dobson AP (1995) Ecology of infectious dis-eases in natural populations. Cambridge UniversityPress, Cambridge
Gustafson LL, Ellis SK, Beattie MJ, Chang BD and others(2007) Hydrographics and the timing of infectioussalmon anemia outbreaks among Atlantic salmon (Salmosalar L.) farms in the Quoddy region of Maine, USA andNew Brunswick, Canada. Prev Vet Med 78: 35–56
Hastings T, Olivier G, Cusack R, Bricknell I, Nylund Å,Binde M (1999) Infectious salmon anaemia. Bull EurAssoc Fish Pathol 19: 286–288
Humblet MF, Boschiroli ML, Saegerman C (2009) Classifica-tion of worldwide bovine tuberculosis risk factors in
cattle: a stratified approach. Vet Res 40: 50–73Joh RI, Wang H, Weiss H, Weitz JS (2009) Dynamics of
indirectly transmitted infectious diseases with immuno -logical threshold. Bull Math Biol 71: 845–862
Kesinger J, Allen LJS, Strauss RE (2001) Discrete-time mod-els for gene frequencies and population densities in plantpathosystems. Nonlinear Anal 47: 1489–1500
Kristoffersen AB, Viljugrein H, Kongtorp RT, Brun E, JansenPA (2009) Risk factors associated with pancreas disease(PD) outbreaks in farmed Atlantic salmon and rainbowtrout in Norway during 2003–2007. Prev Vet Med 90: 127–136
Krkošek M (2010) Host density thresholds and disease con-trol for fisheries and aquaculture. Aquacult EnvironInteract 1: 21–31
Lee AJ, Ramster JW (1981) Atlas of the seas around theBritish Isles. MAFF, Lowestoft
Li MY, Muldowney JS (1995) Global stability for the SEIRmodel in epidemiology. Math Biosci 125: 155–164
Løvdal T, Enger Ø (2002) Detection of infectious salmonanemia virus in sea water by nested RT−PCR. Dis AquatOrg 49: 123–128
Lyngstad TM, Jansen PA, Brun E, Sindre H (2008) Epidemi-ological investigations of infectious salmon anaemia(ISA) outbreaks in Norway 2003–2005. Prev Vet Med 84:213–227
Mardones FO, Perez AM, Carpenter TE (2009) Epidemio-logic investigation of the re-emergence of infectioussalmon anemia virus in Chile. Dis Aquat Org 84: 105–114
Marine Scotland (2010) Management area maps: April 2010.www.scotland.gov.uk/Topics/marine/FishShellfish/FHI/managementagreement (accessed 2 December 2010)
May RM, Anderson RM (1979) Population biology of infec-tious disease. Part II. Nature 280: 455–461
Mayor DJ, Solan M (2011) Complex interactions mediate theeffects of fish farming on benthic chemistry within aregion of Scotland. Environ Res 111: 635–642
Mayor DJ, Zuur AF, Solan M, Paton GI, Killham K (2010)Factors affecting benthic impacts at Scottish fish farms.Environ Sci Technol 44: 2079–2084
McClure CA, Hammell KL, Dohoo IR (2005) Risk factors foroutbreaks of infectious salmon anemia in farmed Atlanticsalmon, Salmo salar. Prev Vet Med 72: 263–280
McQuaid CD, Phillips TE (2000) Limited wind-driven dis-persal of intertidal mussel larvae: in situ evidence fromthe plankton and the spread of the invasive speciesMytilus galloprovincialis in South Africa. Mar Ecol ProgSer 201: 211–220
Morrison RN, Crosbie PBB, Nowak BF (2004) The inductionof laboratory-based amoebic gill disease revisited. J FisDis 27: 445–449
Munro LA, Gregory A (2009) Application of network analy-sis to farmed salmonid movement data from Scotland.J Fish Dis 32: 641–644
Murray AG (2009) Using simple models to review the appli-cation and implications of different approaches usedto simulate transmission of pathogens among aquatic animals. Prev Vet Med 88: 167–177
Murray AG, Peeler EJ (2005) A framework for understand-ing the potential for emerging diseases in aquaculture.Prev Vet Med 67: 223–235
Murray AG, Amundrud TL, Gillibrand PA (2005) Models ofhydrodynamic pathogen dispersal affecting Scottishsalmon production: modelling shows how Scotland eradicated ISA, but not IPN. Bull Aquacult Assoc Can105: 79–86
Murray AG, Munro LA, Wallace IS, Berx B, Pendrey D,
73

Aquacult Environ Interact 2: 61–74, 2011
Fraser DI, Raynard RS (2010) Epidemiological investiga-tion into the re-emergence and control of an outbreakof infectious salmon anaemia in the Shetland Islands,Scotland. Dis Aquat Org 91: 189–200
Ögüt H (2001) Modeling of fish disease dynamics: a newapproach to an old problem. Turk J Fish Aquat Sci 1: 67–74
Ögüt H, Bishop SC (2007) A stochastic modelling approachto describing the dynamics of an experimental fu -runculosis epidemic in Chinook salmon, Oncorhynchustshawytscha (Walbaum). J Fish Dis 30: 93–100
Ögüt H, Reno P (2004) Density dependent spread of infec-tious hematopoietic necrosis virus (IHNV) in rainbowtrout, Oncorhynchus mykiss. Isr J Aquacult 56: 218–225
Ögüt H, Reno PW (2005) Evaluation of an experimentalAeromonas salmonicida epidemic in Chinook salmon,Oncorhynchus tshawytscha. J Fish Dis 28: 263–269
Ögüt H, LaPetra SE, Reno PW (2005) Effects of host densityon furunculosis epidemics determined by the simple SIRmodel. Prev Vet Med 71: 83–90
Pérez MJ, Fernández AIG, Rodríguez LA, Nieto TP (1996)Differential susceptibility to furunculosis of turbot andrainbow trout and release of the furunculosis agent fromfurunculosis-affected fish. Dis Aquat Org 26: 133–137
R Development Core Team (2008) R: a language and envi-ronment for statistical computing. The R Foundation forStatistical Computing, Vienna www.r-project.org/
Raynard RS, Snow M, Bruno DW (2001) Experimental infec-tion models and susceptibility of Atlantic salmon Salmosalar to a Scottish isolate of infectious salmon anaemiavirus. Dis Aquat Org 47: 169–174
Rose AS, Ellis AE, Munro ALS (1989) The infectivity by dif-ferent routes of exposure and shedding rates of Aero mo -nas salmonicida subsp. salmonicida in Atlantic sal mon,Salmo salar L., held in sea water. J Fish Dis 12: 573–578
Rose AS, Ellis AE, Munro ALS (1990) The survival of Aero -monas salmonicida subsp. salmonicida in sea water.J Fish Dis 13: 205–214
Scheel I, Aldrin M, Frigessi A, Jansen PA (2007) A stochasticmodel for infectious salmon anaemia (ISA) in Atlanticsalmon farming. J R Soc Interface 4: 699–706
Schley D, Burgin L, Gloster J (2009) Predicting infection riskof airborne foot-and-mouth disease. J R Soc Interface 6: 455–462
Scottish Executive (2000) Final report of the joint govern-ment/industry working group on ISA. Scottish Executive,
AberdeenScottish Salmon Producers’ Organisation (2010) Scottish
salmon farming industry research report. www.scottish-salmon.co.uk/userFiles/886/Salmon_survey_2010(2).pdf(accessed 30 September 2011)
Smith G, Bebak J, McAllister PE (2000) Experimental in -fectious pancreatic necrosis infections: propagative orpoint−source epidemic. Prev Vet Med 47: 221–241
Sørensen JH, Mackay DK, Jensen CO, Donaldson AI (2000)An integrated model to predict the atmospheric spreadof foot−and−mouth disease virus. Epidemiol Infect 124: 577–590
Subasingh RP, Bondad-Reantaso MG, McGladdery SE (2001)Aquaculture development, health and wealth. In: Suba -singhe RP, Bueno P, Phillips MJ, Hough C, McGladderySE, Arthur JR (eds) Aquaculture in the Third Millennium.Technical Proceedings of the Conference on Aquacul-ture in the Third Millennium. NACA, Bangkok and FAO,Rome
Toranzo AE, Hetrick FM (1982) Comparative stability of twosalmonid viruses and polioviruses in fresh estuarine andmarine waters. J Fish Dis 5: 223–231
Urquhart K, Murray AG, Gregory A, O’Dea M and others(2008) Estimation of infectious dose and viral sheddingrates for infectious pancreatic necrosis virus in Atlanticsalmon, Salmo salar L., post-smolts. J Fish Dis 31: 879–887
Venayagamoorthy SK, Ku H, Fringer OB, Chiu A, NaylorRL, Koseff JR (2011) Numerical modeling of aquaculturedissolved waste transport in a coastal embayment. Envi-ron Fluid Mech 11: 329–352
Viljugrein H, Staalstrom A, Mplvaer J, Urke HA, Jansen PA(2009) Integration of hydrodynamics into a statisticalmodel on the spread of pancreas disease (PD) in salmonfarming. Dis Aquat Org 88: 35–44
Walker A (2010) Scottish farms annual production survey2009.www.scotland.gov.uk/Resource/Doc/295194/ 0106192.pdf (accessed 2 December 2010)
Ward LR, Akin EW (1984) Minimum infective dose of animalviruses. Crit Rev Environ Control 14: 297–310
Watts M, Munday BL, Burke CM (2001) Immune responsesof teleost fish. Aust Vet J 79: 570–574
Werkman M, Green DM, Murray AG, Turnbull JF (2011)The effectiveness of fallowing strategies in disease con-trol in salmon aquaculture assessed with an SIS model.Prev Vet Med 98: 64–73
74
Appendix 1
The derivation of the critical time for a cohort to lead tosustained infection is:
(6)
(11)
Simplify for time delay between sites and insert Eq. (11)into Eq. (15):
(11a)
Insert the critical number of infectious individualsneeded to sustain an infection without further externalinputs into Eq. (6):
(11b)0
Rearrange (11b):(16)0
N1c = μσβ
W Itt
2 1, = −γ λe
I Sz I t
2 21=
−σγφ
λe
Sz I t
21σγφ
μσβ
λe−=
tS I z
c =− ⎡
⎣⎢⎤⎦⎥
lnμφγ β
λ2 1
Editorial responsibility: Tim Dempster, Trondheim, Norway
Submitted: February 28, 2011; Accepted: August 15, 2011Proofs received from author(s): September 30, 2011