farmer participation futures markets final report v3b73f
TRANSCRIPT

FARMERS’ PARTICIPATION IN
INDIA’S FUTURES MARKETS: POTENTIAL, EXPERIENCE, AND
CONSTRAINTSKushankur Dey
Vasant P. Gandhi Kanish Debnath
Centre for Management in Agriculture Indian Institute of Management Ahmedabad
Supported by Ministry of Agriculture and Farmers Welfare, Government of India
February 2019
Final Report
Farmers’ Participation in India’s Futures Markets:
Potential, Experience, and Constraints
Kushankur Dey Vasant P. Gandhi Kanish Debnath
Centre for Management in Agriculture Indian Institute of Management Ahmedabad
Supported by Ministry of Agriculture and Farmers Welfare, Government of India
February 2019

ii Farmers’ Participation in India’s Futures Markets: Potential, Experience, and Constraints
iii
Table of Contents
Chapter Page No.
- Executive Summary xi
CHAPTER 1: INTRODUCTION 1
1.1. Institution, Technology, and Farmer Access 3
1.1.1. On Farm Support 4
1.1.2. Off-Farm Support 4
1.2. Farmer Group, Institution, and Interaction 5
1.2.1. Group Attributes 5
1.2.2. Institutional Arrangements 6
1.2.3. Product and External Environment – State and Markets 6
1.3. Objectives of the Study 7
1.4. Data and Methodology 7
1.5. Scope of the Study 8
1.6. Organization of Chapters 8
CHAPTER 2: DEVELOPMENT OF INDIA’S COMMODITY FUTURES MARKETS 9
2.1. Trading and Futures Market Growth 10
2.2. Liquidity in Agricultural Futures Markets 12
2.3. Futures Market Awareness and Membership with Exchange 14
CHAPTER 3: LITERATURE ON FARMERS’ PARTICIPATION IN FUTURES 17
3.1. Past Efforts 18
3.2. Current Scenario 19
3.3. Enablers to Farmer Participation in Derivative Markets 20
3.3.1. Empowering and Orchestrating the Roles of Regulator and Market Agencies 21
3.3.2. Co-existence of Futures and Spot Exchanges 21
3.3.3. Devising a Liquid Market Microstructure 22
CHAPTER 4: FUTURES MARKET EFFICIENCY IN PRICE DISCOVERY AND DISSEMINATION 23
4.1. Related work 24
4.2. Data and Estimation 25
4.3. Findings and Discussion 28
iv Farmers’ Participation in India’s Futures Markets: Potential, Experience, and Constraints
Chapter Page No.
4.3.1. Spread Analysis Findings 28
4.3.2. Findings of Futures-Spot Price Relationships 29
CHAPTER 5: FIELD SURVEY, OBSERVATION AND FARMER PROFILE 37
5.1. Survey Background & Data Collection 37
5.2. Field Data and Farmer Profile 39
CHAPTER 6: INSTITUTION IN AGGREGATION EFFORT AND FARMER PARTICIPATION 45
6.1. Case Studies – Global View 46
6.2. Cases from India – Intervention of NGOs and PCs in Forward/Futures 47
6.3. Demand, Supply and Distribution of Futures Trading Services 51
CHAPTER 7: CONSTRAINTS, BENEFITS AND SCOPE OF FARMER PARTICIPATION 57
7.1. Futures Market Awareness, Benefits, and Issues of Concern 57
7.1.1. Factors Inhibiting Farmer Participation 58
7.1.2. Factors Inducing Farmer Participation 60
7.2. Farmer Participation (Likelihood) Explored: Model and Estimation 62
7.2.1. Model Estimation 64
7.2.2. Findings and Discussion 65
CHAPTER 8: FACTORS AFFECTING FARMERS’ PARTICIPATION 69
8.1. Association with Farmer Bodies Bring Awareness but not Participation 69
8.2. Size of Farmer’s Landholding is Unrelated to Effective Demand 72
8.3. Marginal Farmers have Less Accessibility to Trading 74
8.4. Marginal Farmers have Less Support from Trading and Delivery Centres 76
8.5. Problems Encountered by Farmers in Futures Markets 78
8.6. Factors that May Influence Farmers to Join 81
8.7. Findings and Discussion 85
CHAPTER 9: SUMMARY, CONCLUSION, AND POLICY RECOMMENDATIONS 87
9.1. Summary and Concluding Remarks 87
9.2. Policy Recommendations 91
- References 95
- Annexure – 1 101
- Annexure – 2 107
- Annexure – 3 108
- Annexure – 4 a 109
- Annexure – 4 b 109
- Annexure – 4 c 110
- Annexure – 5 110

v
List of Tables
Table No. Table Name Page No.
CHAPTER 2: DEVELOPMENT OF INDIA’S COMMODITY FUTURES MARKETS 9
Table 2.1 Reform phases in India’s commodity futures markets 10
Table 2.2 Exchange-wise traded value and growth 11
Table 2.3 Commodity shares in total traded volume 11
Table 2.4 Major agricultural commodities traded volume and value 13
Table 2.5 Commodity’s futures traded volume, availability, trade multiplier (2014-15) 13
Table 2.6 Awareness/capacity building programmes: Institution and stakeholder-wise 15
CHAPTER 4: FUTURES MARKET EFFICIENCY IN PRICE DISCOVERY AND DISSEMINATION 23
Table 4.1 Analytic framework 26
Table 4.2 Commodity futures historical bid-ask spread analysis 30
Table 4.3 Long-run spot and futures price co-integration: Co-integrating vector & error correction coefficients 32
Table 4.4 Comparative analysis of selected futures and spot markets 35
CHAPTER 5: FIELD SURVEY, OBSERVATION AND FARMER PROFILE 37
Table 5.1 Sample farmers’ distribution 41
Table 5.2 Socio-economic/demographic profile of sample farmers 41
Table 5.3 Farmer’s profile based on the market awareness and participation 42
Table 5.4A Farmer association with institutions – Panel A 42
Table 5.4B Farmer satisfaction level with institutions – Panel B 42
Table 5.5 Descriptive statistics of farmers’ degree of association and satisfaction level 43
Chapter 6: Institution in Aggregation Effort and Farmer Participation 45
Table 6.1 Correlations between the factors explaining demand environment 52
Table 6.2 Factors’ scores and model statistics 52
Table 6.3 Correlations between factors affecting the supply-side of farmer participation 53
Table 6.4 Factors’ score and model statistics 53

vi Farmers’ Participation in India’s Futures Markets: Potential, Experience, and Constraints
Table No. Table Name Page No.
Table 6.5 Correlations between factors explaining distribution of futures trading services 53
Table 6.6 Factors’ scores and model statistics 54
CHAPTER 7: CONSTRAINTS, AND BENEFITS, AND SCOPE OF FARMER PARTICIPATION 57
Table 7.1 Farmers’ opinion on futures market attributes 58
Table 7.2 Factors constraining farmer entry or participation in forward/futures 59
Table 7.3 Factors inducing farmer participation in forward/futures 60
Table 7.4 Cash-n-carry arbitrage trading: Investment and returns to farmer organization 61
Table 7.5 Inclusion of variables/factors for analysis and their attributes 61
Table 7.6 Frequency distribution of categorical variables/factors 64
Table 7.7A Independent factors/variables’ estimates, standard errors, and odds-ratios 66
Table 7.7B Logit model’s goodness of fit statistics 67
CHAPTER 8: FACTORS AFFECTING FARMERS’ PARTICIPATION 69
Table 8.1 Association for both aware and unaware farmers in Gujarat 70
Table 8.2 Association for both aware and unaware farmers in Madhya Pradesh 71
Table 8.3 Association for participating and non-participating farmers in Gujarat 71
Table 8.4 Association with farmer bodies for farmers in Madhya Pradesh 72
Table 8.5 Gauging effective demand among farmers of different landholding sizes 73
Table 8.6 Gauging effective demand among farmers of different states 74
Table 8.7 Gauging aggregate supply among farmers of different landholding sizes 75
Table 8.8 Gauging aggregate supply among farmers of different states 76
Table 8.9 Assessing support from trading and delivery centres 77
Table 8.10 Assessing support from trading and delivery centres in different states 78
Table 8.11 Correlation between the top 5 problems and number of crops, land-size 78
Table 8.12 Comparison of farmers’ participation problems by Education 79
Table 8.13 Comparison of farmers’ participation problems by Participation 80
Table 8.14 Comparison of farmers’ participation problems by State 81
Table 8.15 Correlation between the top 5 factors and number of crops, land-size 82
Table 8.16 Comparison of factors influencing farmer participation by Education 83
Table 8.17 Comparison of factors influencing farmer participation by Participation 84
Table 8.18 Comparison of factors influencing farmer participation by State 85

vii
Figure No. Figure Name Page No.
CHAPTER 3: LITERATURE ON FARMERS’ PARTICIPATION IN FUTURES 17
Figure 3.1 Schematic presentation of farmer participation (direct and indirect) in futures 19
CHAPTER 5: FIELD SURVEY, OBSERVATION AND FARMER PROFILE 37
Figure 5.1, 5.2, and 5.3 Study areas in Gujarat, Rajasthan, and Madhya Pradesh 39
CHAPTER 6: INSTITUTION IN AGGREGATION EFFORT AND FARMER PARTICIPATION 45
Figure 6.1 Factors explained demand for participation, supply and distribution of futures trading services 55
CHAPTER 8: FACTORS AFFECTING FARMERS’ PARTICIPATION 69
Figure 8.1 Association with farmer bodies for farmers in Gujarat 70
Figure 8.2 Association with farmer bodies for farmers in Madhya Pradesh 70
Figure 8.3 Association with farmer bodies for farmers in Gujarat 71
Figure 8.4 Association with farmer bodies for farmers in Madhya Pradesh 72
Figure 8.5 Gauging effective demand among farmers of different landholding sizes 73
Figure 8.6 Gauging effective demand among farmers of different states 74
Figure 8.7 Gauging aggregate supply among farmers of different landholding sizes 75
Figure 8.8 Gauging aggregate supply among farmers of different states 75
Figure 8.9 Assessing support from trading and delivery centres 76
Figure 8.10 Assessing support from trading and delivery centres in different states 77
Figure 8.11 Comparison of farmers’ participation problems by Education 79
Figure 8.12 Comparison of farmers’ participation problems by Participation 80
Figure 8.13 Comparison of farmers’ participation problems by State 81
Figure 8.14 Comparison of factors influencing farmer participation by Education 82
Figure 8.15 Comparison of factors influencing farmer participation by Participation 83
Figure 8.16 Comparison of factors influencing farmer participation by State 84
List of Figures

viii Farmers’ Participation in India’s Futures Markets: Potential, Experience, and Constraints
ACE – ACE Kotak Commodity Derivative Exchange
ADF – Augmented Dickey Fuller
AKRSP (I) – Aga Khan Rural Support Programme (India)
APMC – Agricultural Produce Market Committee
APOP – Agricultural Products Option Programme
ASERCA - Support and Services for Agricultural Trading
ATMA – Agricultural Technology Management Agency
CMA – Collateral Management Agency
FMC – Forward Markets Commission
FPC/PC – Farmer Producer Company
FTA – Farm Tele Advisors
GSK – Grameen Suvidha Kendra
HAFED – Haryana Agricultural Cooperative Marketing Federation
ICAR – India Council of Agricultural Research
ICEX – India Commodity Exchange
IFFCO – Indian Farmers’ Fertilizer Cooperative Society
IFMR – Institute of Financial and Management Research Trust
KCC – Kisan Call Centre
KVK – Krishi Vigyan Kendra
MANAGE – National Institute of Agricultural Extension Management (Management of Agricultural Extension)
MCX – Multi Commodity Exchange
MoA – Ministry of Agriculture
List of Abbreviations
ix
MTM – Mark-to-Market
NABARD – National Bank for Agriculture and Rural Development
NAM – National Agricultural Market
NAP – National Agriculture Policy
NCDEX – National Commodity & Derivative Exchange
NIAM – National Institute of Agricultural Marketing
NMCE – National Multi Commodity Exchange
PP – Phillips-Perron
RBI – Reserve Bank of India
RML – Reuters Market Light
SAMB – State Agricultural Marketing Board
SEBI – Securities and Exchange Board of India
SEWA – Self-Employed Women’s Association
SFAC – Small Farmers’ Agribusiness Consortium
UCX – Universal Commodity Exchange
UNCTAD – United Nations Conference on Trade and Development
VAR – Vector Auto Regression
VECM – Vector Error Correction Model
WB – World Bank

xi
Improving agricultural marketing and reducing price risk for India’s small and marginal farmers has been an important policy agenda for several decades (Chand 2012; Sahadevan, 2012). Though the government has made considerable efforts through seeking to improve the market linkages for smallholders and offering support prices, the benefits from these especially in price risk management have remained somewhat inadequate. Though the government policy has aimed at protecting small farmers from market and other failures, this has often not worked due to various reasons including ‘elite capture’, power inequity and ‘social exclusion’ such as in cooperatives and other institutions (Feder et al., 2011). Since 2000s, there has been increased policy thrust on improving smallholder market access and risk management (Acharya, 2004; Ranjan, 2005). Development of commodity futures and forward markets is one outcome of this market-oriented approach. Futures trading in India has seen various structural improvisations in the recent years and there has been effort to improve the performance of commodity exchanges, thereby enhancing trading and market efficiency. However, futures trading in agricultural commodities has not yet attracted significant participation especially of producers. While the futures markets should help in price discovery and risk management, there is considerable debate in India on its usefulness and impact. The Forward Markets Commission (FMC) has recently been replaced by the Securities and Exchange Board of India (SEBI) as the commodity derivative market regulator. This may offer a new scope for improving participation in agricultural commodity derivative markets (Ghosh and Dey, 2015).
The broad objective of the study is to examine important factors that influence farmers participation in India’s futures markets. This includes factors such as the efficiency of futures market price discovery, the spot and futures price relationship, price dissemination, understanding the socio-economic and exchange-related issues affecting farmer participation in futures markets, factors affecting demand and supply of participation, and the access to futures trading services. Through this, it seeks to identify issues that constrain or can enhance farmer participation in the futures markets including institutional, socio-economic factors, and the behavior of farmer participation (direct and indirect).
Participation, direct or indirect, of a good number of small holders in the derivative markets is important for inclusive benefits and impact (Ali and Gupta, 2011; Dey and Maitra, 2016).
Executive Summary

xii Farmers’ Participation in India’s Futures Markets: Potential, Experience, and Constraints
However, small farmers are often reluctant to engage in activities perceived as risky or entrepreneurial in the absence of effective risk mitigation measures. Though the International Task Force on Commodity risk Management of the World Bank recommended the formation of farmer organizations to bring about participation of small farmers in derivative markets, this did progress much (Asokan and Arya, 2008). The aggregator model, though attractive, appears to have various constraints in India. However, even indirect participation can help price discovery and be useful for crop sowing, marketing and agricultural investment decisions.
Literature indicates that the institutional push for aggregation during 2007-2008 had encouraged farmer participation by Gujarat farmers in cotton futures market. Also, the futures price information helped many farmers to develop better spot price expectations for cotton, castor, and guar seed in pockets of Gujarat. However, most initiatives did not continue and the initiative was largely pilot in nature. Two development organizations, Aga Khan Rural Support Programme (India) (AKRSP) and Self-Employed Women’s Association (SEWA) facilitated farmer price information access or participation in hedging the price risk. In 2002-2003, a new form of farmer organization was introduced, called the Farmer Producer Organization (FPO) or Producer Company which had elements of a corporate and a cooperative. The number of these entities relatively more in the states of Madhya Pradesh (about 90), Gujarat (20) and Rajasthan (36). The objective of Producer Companies was to infuse entrepreneurial/business skills in small farmers’ collectives and make the cooperatives competitive, thereby attempting to link small farmers better with the market. They have exploited the scope of newly promoted exchange-traded forward contract in certain commodities.
Given the backdrop of interventions of such development organizations and producer companies as aggregators in the forward/futures market, the study attempts to explore farmer participation in the exchange-traded derivative markets, and the direct and indirect benefits accruing to them. The study also examines the futures market efficiency in price discovery and price dissemination applying Johansen’s co-integration test and error correction model, especially in cumin, castor, wheat, rapeseed-mustard, guar seed, cotton, and coriander futures contracts traded on the NCDEX futures platform for considerable period. Except the wheat futures contract launched in 2009, other commodities have not had any suspension in the trading since the contracts started. The contracts are not identical in their frequency/period of contract and have different contract specifications such as trading unit, delivery unit, order size, margin, delivery logic, quality parameters, price limit, and position limit, among others (as presented in Annexure 3). Before testing for the futures market efficiency, the liquidity and bid-ask spread analysis has been done for agricultural futures contracts. Then, a few futures contracts that can be meaningful for farmer participation are selected and their efficiency in price formation is tested. Findings indicate an important role of select futures in price discovery and suggest that farmers can use futures prices of these to form their spot price expectation even if the direct participation is infeasible. An exception is coriander futures contract where irregular delivery due to operational problems, and a non-stable large correction in coriander futures and spot price (basis) have raised concerns about the long-run equilibrium price-relationship or the convergence between its futures and spot price. Furthermore, wheat contracts show liquidity with futures and spot price being co-integrated in the long-run. Castor seed, cumin,

xiii
and rapeseed-mustard futures appear to be efficient in price discovery and dissemination. Guar seed and cotton (raw) futures are not found efficient and have contained speculative intent in futures pricing. Therefore, farmers need to be cautious while participating in these markets. However, cottonseed oilcake futures are better and could be utilized to realize a positive payoff using a cash-n-carry arbitrage trading strategy.
Second, the study aims to understand the socio-economic and exchange-related issues of farmer participation in the market. Six rounds of field survey were undertaken between December, 2014 and August, 2015 and data from 199 farmers were collected and tabulated. Gujarat (56 percent) has contributed maximum to the sample followed by Madhya Pradesh (26%), and Rajasthan (18%). Among various categories/strata of farmers based on their landholdings and other socio-economic variables, small and medium farmers account for a largest share in the pie. The purpose for interviewing the farmers through a survey instrument (schedule) was to examine their association with various market agencies involved in spot and futures markets. The experience of either direct or indirect participation in the interventions of aggregators and Producer Companies in futures and forward markets is examined. It is found that about 41% of sample farmers are aware of futures trading, while the rest do not show acquaintance with futures markets. Though they are aware of price information boards installed in the regulated market yards, they show inability to interpret the information well and understand the relevance. The study included cell phone usage as an explanatory variable for farmer participation. It is found that about 50% farmers own a mobile and 30% of them access futures and spot price information through the Reuters Market Light SMS/in-calls service. Similarly, farmer profile including landholding, education level, farm income, ownership of livestock and farm machinery, among others are examined in the context of futures markets. Important observations are noted on their market awareness, that is a surrogate measure of financial literacy used in the study. This helps to assess the impact of mobile phone on farmer marketing decision. Their degree of association and level of satisfaction with agencies/institutions are also taken into consideration. It is evident that while most of the farmers have similar degree of association with development organizations and cooperatives/Producer Companies, regulated market officials and traders, they have shown a high level of satisfaction with farmer organization – cooperatives and producer companies in related to patronage and services rendered. Brokers, warehousing companies, financial institutions are yet to enhance their reach or service delivery in rural areas. It is worth noting that all the sample farmers grow at least one cash crop either in kharif season or rabi season, say cotton, soybean, rapeseed-mustard, coriander, and guar seed and market their produce through various channels of intermediation. Nonetheless, their access to storage or pledge financing has been minimal. Also, there may be some heterogeneity in their market participation (Pennings and Leuthold, 2001; Garcia and Leuthold, 2004).
Third, the study examines the institutional roles in aggregation efforts. A case study approach has been adopted to understand the intervention of aggregators in the forward/futures market. As earlier effort has not assessed the demand environment, supply and distribution of futures trading services, the study attempts to capture a few factors contributing to the economics of farmer participation in the derivative market. This would offer some future direction to the regulator and policy makers to initiate major reforms for improving the market structure,

xiv Farmers’ Participation in India’s Futures Markets: Potential, Experience, and Constraints
conduct, and performance. Demand related factors are, namely market awareness (financial literacy), risk preference, futures trading know-how, among others. Supply-side factors include (futures) trading terminal, broker service, futures contract information board, while the proximity of broker office, awareness camp, exchange official’s training and visit, trading account opening service account for the distribution of futures trading services.
Fourth, the study explores the key factors inhibiting and promoting farmer participation in the market. Before the extraction of statistically significant factors through an exploratory factor analysis, farmer responses on futures market attributes and its benefits are recorded with a description. It is found that a major proportion of sample farmers have not been aware of the market in depth, but they are of the view that futures can play a role in price discovery and reduce income variability. However, they are apprehensive of bearing the risks of losses in trading that might outweigh the futures market direct benefits, such as securing profits or payoffs. Factors constraining farmer participation include namely market instability (price volatility), mark-to-market settlement risk, and membership fee and margin money, lack of physical delivery, and frequency and severity of off-market trades. In other words, insufficient trading platform and exchange-accredited warehouse, low adoption rate of negotiable warehouse receipt by banks for commodity structured financing also inhibit their participation. However, there may be some scope for augmenting their participation and factors inducing their participation are futures role in price discovery, trading (arbitrage) opportunities, commodity financing, and multiple contracts for a single commodity, among others. Field surveys reveal the opinion of traders, processors, and oil millers that although the market is efficient in price formation, it is not amenable to risk management or hedging. Delivery from forward/futures trading may not be preferable if the commodity is readily available in the physical or spot market. Interestingly, the responses from farmers do vary for the state (sampled) and the magnitude of participation, but not on educational attainment (passed matriculate exams). This result supports the notion that farmer awareness camps will be useful to enhance their direct or indirect participation in the futures market.
Fifth, the study examines the likelihood of farmer participation that is conditional upon farmer financial literacy, farm income, landholdings, education level, and cell phone use, among other economic resources. Findings suggest that farmer risk-aversion, loan/warehouse receipt financing facility, futures contract information (display) reach, training and visit by exchange officials, significantly explain the likelihood of farmer participation. A negative impact of cell phone usage and poor market awareness on the likelihood of farmer participation is reported. Survey also revealed that a majority of sample farmers are apprehensive of bearing the risks of losses in the trading that could outweigh direct benefits like secured payoff or reduced income variability. In other words, they might develop future spot price expectation on planned or standing crops and moderate their agricultural investment and marketing risks indirectly through efficient futures markets. Heterogeneity in risk preference and effectuation of collective investment can impact farmer market access and influence the nature of participation (Francesconi and Wouterse, 2015).
Liquidity and participation are important attributes of the futures market performance from a market microstructure point of view (Mattos and Garcia, 2004). Since distribution of income
xv
or/and returns has been skewed in agricultural commodity markets, government intervention cannot be brushed aside either. To this end, market monitoring beneath a robust regulatory architecture seems important. Since the participants in agricultural markets are diverse and discursive, researchers need to be careful while drawing any inference about the futures market efficiency and its role in price discovery. A robust surveillance mechanism under a prudent regulatory architecture, if put in place, might insulate growers from any untoward market moves or bail them out from market externalities.
Futures market efficiency needs to be interpreted succinctly considering a few instrumental factors, viz. liquidity, heterogeneity in participation, delivery logic of the contract, among others. To this end, the regulator needs to strengthen the settlement and delivery processes of the contract that might curb in speculative behavior of agents. This would benefit the growers and sustain a healthy trade environment. For a desired impact of the price dissemination project, theoretically, futures market a priori needs to be efficient to make the price dissemination faster than the spot. This can improve the functioning of underlying spot market by impounding available information and reflecting an economic value of the commodity. However, information access is a costly affair to farmers that entails a robust market microstructure to improve a seamless interaction between the futures and spot. Thus, the futures market may rationalize its existence on account of a legitimate price expectation for growers.
This study can be extended to other parts of India to improve the reliability and external validity. The study might be scaled up considering representative farmer organizations which have obtained an institutional membership in the forward/futures trading need to be considered a priori for further research. Exploring an inter-regional disparity in farmer participation and their attitude to the adoption of insurance or/and exchange-traded derivative instrument can be a potential avenue for future research. Also, some psychometric variables, namely risk aversion, market orientation, entrepreneurial attitude, among others can be taken into account to assess inter-regional farmer risk management behaviour.
The study has several policy implications. However, the following points as way forward may help enhance farmer awareness and the participation.
1) Dissemination of real-time futures and spot price information is very important - through installation of more number of electronic price-ticker boards under the price dissemination project of the Commission/competent authorities. Directorate of Marketing and Inspection, Agricultural Technology Management Agency, the Ministry of Agriculture need to work in-sync with other actors to enable the display of price information of prices & major-crop arrivals in principal and sub-yards of Agricultural Produce Market Committee (APMCs);
2) Commodity exchanges can make producers aware of the utility of exchange-traded products. It may, however, be noted that most of the producers are small and marginal, and only a little produce goes to the market as marketable surplus. Farmer producer organizations beneath a local institutional arrangement may thus pool member produce on a lot basis, grade, and deliver to exchange notified delivery centers. They can also draw indirect benefits from the derivative market if the direct participation is not feasible at all.
xvi Farmers’ Participation in India’s Futures Markets: Potential, Experience, and Constraints
3) Mandi modernization programme needs to be implemented or scaled up for integrating both regulated spot and futures markets. To this end, setting up of a national-level common/unified agricultural market coupled with speedy implementation of price dissemination project might reduce information asymmetry across the primary and secondary markets. Authentic price pooling and reliable data management could strengthen farmer crop choice and sowing decisions, agricultural investments, and marketing strategies;
4) Exchanges need to redesign contract specifications of forward/futures instrument with respect to position limit, contract/lot size, delivery order, price band, price limit, tick size, basis variety, and basis centre, margining and delivery schedule along with single/multi-product hedge contract design to enhance the degree of participation. While these efforts on the part of exchnages and their members could asses the demand and supply environment for trading, distribution of traidng and associated services should receive considerable attention from the regulator.
5) Artificial hoarding and off-market trades sometimes defeats the very purpose of the trading in commodities. A prudent regulatory architecture may, therefore, introduce necessary amendments to the code of conduct of exchanges and brokers and curb in the speculative intent of market agents. The SEBI-FMC merger may address this concern and instil buoyancy in the market functioning.
6) Support of government machineries, namely Food and Civil Supplies Corporation, State Agricultural Marketing Board, and Small Farmers’ Agribusiness Consortium is essential to promote several pro-growers programmes on how to market their produce and optimize their risk-return metrics.
7) Resource institutions, such as voluntary/development organizations and financial institutions might facilitate a relational or bilateral contracting between producer organizations and market agencies/bulk buyers in physical markets and assist them in forward/futures trading using various types of trading strategies, cash-n-carry arbitrage or calendar spread for instance. National Institute of Agricultural Marketing can impart training to these entities and make them understand the trading nuances. Market infrastructure institutions, such as warehousing and collateral management agencies may promote pledge/commodity-based financing against the negotiable warehouse receipt issued against stored commodities.
8) Exchange regulation and surveillance can be an area of concern for the regulator to accommodate a larger section of producers or commercial users of commodities in the trade. Exchanges need to adopt good governance practices to strengthen their operations by formalizing performance goals in alignment with their mission and vision. A diversified board, through a proper succession planning, may resolve inherent conflicts between the regulator, exchange, promoters, and members. Reports by the Working Groups on call auction for determining final settlement price and setting up of an independent clearing corporation, coupled with the liquidity enhancement scheme can be instrumental to instil rationality in the trade and efficiency in the market.

1
Improving agricultural marketing and reducing price risk for India’s small and marginal farmers has been a significant policy agenda for several decades (Chand 2012; Sahadevan, 2012). Although the government has made considerable efforts to improve the marketing linkages for smallholders, the direct benefits especially in price risk management, except for support prices, has remained limited. The major problems include small quantities of produce/ marketed surplus, large numbers, and low financial capacity and literacy of small and marginal farmers. National Agriculture Policy (NAP) in 2000, for instance, is aimed at protecting small farmers from market risks and externalities, and bringing smallholders together and linking them efficiently with the agricultural value chain was an important goal of the policy (Ton, 2008; Trebbin and Hassler, 2012). The policy envisaged promotion of the producer participation in the commodities markets through various formats. The aggregation efforts through officially sponsored projects1, could be seen as an outcome (for more details, see Cole and Fernando, 2008; Multi Commodity Exchange, 2008; Cole and Hunt, 2010). .However, futures markets have already generated considerable policy debate in the context of price discovery and dissemination, and price risk management (O’ Hara, 1995; Kolamkar et al. 2014).
Other than a few efforts and activities, farmer participation in commodity forward/futures markets in India has remained minimal and the aggregator model has often failed to sustain. This is often attributed to factors such as high membership fees, high margin money, large lot or contract size, poor technology and scalability (Asokan and Arya, 2008; Fernades and Mor, 2009). However, these few experiments have helped in the realization that for benefits to accrue to the farmers, a more nuanced approach is required and that access to real-time price information is critical in dealing with price uncertainty (Larson et al., 1998 and Kang, 2005). If the futures market is efficient, the farmers may also use it as a reference for their ready cash or spot market transactions. A few studies have examined the futures market efficiency as a legitimate ground of farmer participation (Ranjan, 2005; Berg, 2007 and Paul, 2011). Pennings and Leuthold (2000) and Garcia and Leuthold (2004) captured several farmer behavioural (psychometric) factors, viz. market orientation, risk exposure, market performance, and entrepreneurial behaviour
1 Though exchanges, such as MCX and NCDEX made modest attempts in implementing the model, this has failed to withstand the test of time due to scale problem and the lack of technical expertise of the aggregator/farmer producer groups (for more details, see the report of MCX, 2008)
CHAPTER 1
Introduction
2 Farmers’ Participation in India’s Futures Markets: Potential, Experience, and Constraints
to assess their impact on farmer futures market adoption and collective participation towards enhancing the bargaining power, improve market access, and better price realization (Coe, 2006). However, Collins (1997), and Pannell et al. (2007) observed that adoption of futures by small growers (even in advanced economies) is abysmally low. Lence (2003) conducted a simulation to test whether futures market benefits farmers and concludes, in contrast, that irrespective of their shares (no of contracts taken in futures relative to size of the exposure) the market improves their income and the size of welfare gains is rather significant (Zant, 2001). Also, farm marketing advisory services relating to commodity prices and market information can enhance indirect producer participation (Kostov and Davidova, 2013). Cole and Hunt (2010), using a Randomized Control Trial, studied that cotton, guar, and castor seed futures markets in India are instrumental in moderating the growers’ price expectation on standing crops that enable them to adjust to the price signals emanating from the underlying futures markets. Notwithstanding their methodological congruence, the study could not explore the market efficiency or examine inter-temporal futures and spot price relationships adequately. They also failed to escape the limitations of selection bias and replicability.
NAP helped lay the foundation for organized forward/futures markets in India by promoting a new class of national-level electronic commodity exchanges, viz. Multi Commodity Exchange (MCX), National Commodity and Derivative Exchange (NCDEX), National Multi Commodity Exchange (NMCE) in 2003. Later, another three exchanges were promoted during the period, 2009-2012. To help in the market integration, a few national spot exchanges were also set up. Electronic futures exchanges replaced the open outcry or ‘pit’/floor trading of commodity specific regional exchanges. Technology-enabled trading architecture did lead to enhanced the trade volume, liquidity, and market participation (Sen et al., 2008). However, futures trading mechanics has become sophisticated as the participants need to comply with the exchange notified futures contract specification. They need to offer a ‘right lot’ or contract size conforming to quality or/and grade, specifications as per the contract novation and open trading account and deposit margin money upfront (Pavaskar, 2008). This standardized contract is yet to see the momentum of the farmer direct participation in the exchange platform. Even though some commodity exchanges have introduced an alternate settlement mechanism with a provision of staggered delivery in a few futures contracts, and also recently introduced exchange-traded forward contracts (see, the contract note in NCDEX, 2014) with a provision of nominal margin amount and membership fee, smallholders are still staying away from significant participation. To address the structural and exchange-related issues, the aggregator model (co-operatives or not-for-profit agencies) had been proposed to enhance grower participation. Nevertheless, the developing countries including India have little experience with the intervention of aggregation effort (Cole and Hunt, 2010). Having observed variations in the market and after some consideration, the then regulator, Forward Markets Commission (FMC) launched the ‘price dissemination project’ in the 11th Five Year Plan (2007-12). The project aimed at enabling the farmers to access real-time futures prices of notified commodities traded on the exchange platform. The impact of this project is yet to be assessed for example in terms of changes in the degree of futures market adoption, and in growers’ cropping pattern and their income realization. If these perform well, then the futures markets may become informationally efficient and perhaps an unbiased predictor of expected future
3
spot prices. Nonetheless, mixed results have been reported on the efficiency front perhaps because commodity futures are more nuanced compared to other derivatives with regard to standardization of the contract, trading mechanics and delivery logic (Kumar and Pandey, 2009; Ali and Gupta, 2011; Dey and Maitra, 2012, 2016). While a few studies have reported an illiquid futures compared to the spot, other research showed mixed results mainly because of traded volume, degree of participation, and liquidity (Mattos and Garcia, 2004). Besides, in India, unorganized and fragmented spot markets remain a significant ‘stumbling block’ for developing liquid futures markets (Nair, 2004). The observations of the expert committee on futures trading in major agricultural commodities (commissioned by the then regulator FMC in 2007-08) motivated us to explore the potential, experience and constraints of farmer participation in the commodity futures market. To quote:
“The survey revealed that awareness about the futures trading among the farmers is negligible. With the existing marketing infrastructure and the farmers merely accepting the offered price, information on futures prices could become a potent tool for bargaining. However, for this to happen the average farmers should be made aware of organized and most importantly create warehousing…Infrastructure development such as storages would be a key requirement in improving performance of markets… the quality specifications, delivery norms, margin and lot sizes…make it difficult for the average farmers to directly participate in exchange trading as hedgers. So, there is a need to properly introduce ‘aggregators’ where hedging in the exchanges is done by them and can unbundle the contract to farmers (Sen, Sinha, Joshi, Apte, and Ram 2008).”
The study aims to assess the participation and the direct and indirect benefits of futures markets benefits that accrue to small-scale growers, if any. The study is an empirical examination of the following research questions: (i) are select commodities futures markets amenable to price discovery and do they help farmers secure payoffs and mitigate price risks?; (ii) are aggregators or farmer organizations aware of futures market benefits and how do they mobilize their member participation and enhance the market awareness?; (iii) what are the sources or types of aggregation possible at the farm gate or collection/procurement centre and how do aggregators perform these activities for farmers?; (iv) what are the factors attributing to demand, supply, and distribution of exchange notified members/brokers and trading terminal in rural areas?; (v) does existing barrier for accessing futures markets by individual farmers also apply to aggregators and what induces or inhibits farmers’ direct participation?
1.1. Institution, Technology, and Farmer AccessFarmer participation in the futures market can be facilitated substantially by information technology (IT). While financial literacy is important for the participation, market awareness plays a very significant role in the participation – direct and indirect – in the market. Technology, innovation, and institutions may have a positive impact on farmer’s market orientation and participation. The intervention can be production centric and market-oriented as discussed below.
Digitization and the adoption of internet and mobile technologies is often called the internet-of-things. While a concerted effort of IT firms and private agencies has influenced the working of agribusiness, the government intervention in the provisioning of technology-enabled
Chapter 1: Introduction

4 Farmers’ Participation in India’s Futures Markets: Potential, Experience, and Constraints
services to farmers is important. Besides economic motives of agencies in technology transfer and commercialization, public institutions may be important to a large section of smallholders in so far as service inclusiveness and their wellbeing are concerned. Though technology has arguably reduced the information search costs of agents, the efficacy in distributing technology-based services depends on the types and mandates of the institutions that assist farmers’ in production and off-farm market-oriented activities.
1.1.1. On Farm SupportThere are many public and quasi-government agricultural agencies/institutions imparting education and training to farmers using both digital and information technologies. For example, Kisan Call Centers (KCCs) are set up to connect farmers and offer customized solutions using a dedicated telecommunication network under Government of India. These have been operating through Farm Tele Advisors (FTAs) interacting with the farmers. Farmer queries related to crop production, pest-disease infestation, application of fertilizers and chemicals, among others are addressed by the FTAs. The number of registered calls in 2014/2015 reported is 48 lakh, and some 452 FTAs have handled queries with an average success of 29 calls per day per FTA. While the distribution of calls is skewed towards a few progressive states, enhanced operation through domain-expert franchisee might address the concerns of inadequate distribution and low call rate.
Krishi Vigyan Kendras (KVKs) have been in existence for many decades. They undertake a slew of activities, such as frontline demonstrations, seed production, farmer training, mobile agro-advisory services, among others. With some 639 KVKs were reported between 2011 and 2014, the government has approved 100 additional KVKs in a recent fiscal. 12th Five-Year-Plan (2012-2017) earmarked some Indian Rupees (INR) 11.46 crore to 382 KVKs for ‘e-linkage facility’ and INR 94 lakh to 375 KVKs for ‘e-farmers’ under a new initiative.
Agricultural Technology and Management Agency (ATMA) is a quasi-government structure operating under the auspices of Government of India since 2003/2004. ATMA could be seen as a replacement of earlier extension systems to enhance farmer awareness and technology embedded services. Some successful technology interventions by the agency can be seen in Maharashtra, Telangana, Punjab, and Gujarat.
Educating farmers to understand technology use remains a concern to Indian Council of Agricultural Research. ICAR in collaboration with the State Agricultural Universities conducts awareness camp and training on pre-and post-harvest management. For example, between 2009/2010 and 2011/2012, the institution reported 5.18 lakh awareness programmes with a participation of 44 lakh farmers. In 2014/2015, ICAR launched a nation-wide network project on Market Intelligence to benefit farmers too.
1.1.2. Off-farm SupportAs securing off-farm support or searching for a market is often a costly affair to farmers, private

5
agencies come to the fore. Agri Clinics and Agri-Business Centers might also provide off-farm technology support to farmers as these are widely owned by farming communities and rural youth. Technology firms can partner non-profit/private agencies to share their internet services and promote the adoption of software devices among farmers. For instance, farmer identity card needs to be digitized and shared with the national informatics center/state data centers that could reduce a potential leakage during the transaction between merchants and farmers.
Technology-enabled warehousing service can augment farmer confidence in storage and preservation. Adoption of CCTV & Dictaphone installed inside warehouses, and negotiable electronic warehouse receipt can reduce storage losses or occurrence of untoward events and streamline the process of commodity financing, respectively.
Electronic farmer market – e-Kisan mandi is a welcome move by the Small Farmers’ Agribusiness Consortium (SFAC) to connect Producer Companies and buyers from far-off places in recent times. Through this initiative, farmers can obtain crop arrival information, prevailing market prices and compare price quotes with the distant markets (Sharma, 2013).
Accessibility of price information is of crucial relevance to inform farmer cash price expectation. Pooled information could be reliable, trusted and understandable, and the cost of information should be within the capacity of farmers. Information should improve their marketing decisions, negotiation, and price realization (Tadesse and Bahiigwa, 2015). As physical barriers, such as road condition and vehicle arrangement for transporting the produce might deter their access to the right place, they need to be market-oriented and skilled in calculating returns for risks they take. Civil society and development organization in association with Agricultural Produce Market Committee’s (APMC) officials, commodity exchanges, and technology service providers could take the initiative of real-time price dissemination through in-call or SMS-based services at a reasonable price. Reuters Market Light (RML) service has been available to farmers in selected pockets since 2012-2013. SFAC has launched ‘Krishidoot’ in collaboration with the RML to connect farmer producer organizations with the market. The electronic market, as a result, may bridge the digital divide between urban traders and rural peasants. Creation of an electronic National Agricultural Market would enhance business and technology convergence that might make farmers aware of the economic environment and agricultural policies and induce crop diversification. However, producer inclusion in a technology-driven market is critical to generate positive outcome of this project (Dey, 2015a).
1.2. Farmer Group, Institution, and Interaction
1.2.1. Group AttributesStudies show that small groups show higher internal cohesion, but larger groups may help to attain economies of scale. To manage a large group, a federal structure can be created to enhance efficiency in resource management and marketing the produce. Farmer Producer Organizations or PCs which have been formed are an example. However, group boundary restrictions which may trade-off between inclusiveness and strict membership rules could
Chapter 1: Introduction

6 Farmers’ Participation in India’s Futures Markets: Potential, Experience, and Constraints
exclude small growers but may bring greater effectiveness and efficiency (Barham and Chitemi, 2009).
Shared norms and social capital help collective action and sustainability and therefore better functioning of a producer company. One needs to bear in mind that the external pressures, such as government schemes may push marketing activities but may affect the vitality of social capital in collective action. Groups should as far as possible be independent and enjoy autonomy in decision making. Heterogeneity sometimes constrains collective action depending on the nature of the business of a producer company, for example, processing or/and marketing (Bernard and Spielman, 2009).
Leadership plays a significant role in the performance of a producer company. Leaders should be preferably elected by the groups, and external interference may affect the leader-follower relationship. Therefore, producer companies need to cautious while selecting/nominating their leader (Meinzen-Dick, 2009).
1.2.2. Institutional ArrangementsOrganizational structure is very important in determining the success of farmers organizations and the span of control is affected by the vertical or horizontal structure. Vertical line and staff structures may offer functional efficiency whereas horizontal divisional structures improves coordination. Sometimes, matrix structure combining functional and divisional structures in a federal organization may provide optimal coordination and span of control.
Rules need to be framed as simple and understandable that should easily be monitored for compliance. Graduated sanctions and low-cost adjudication need to be imposed along with a quotient of accountability of the leaders to the members of the organization.
Provisions for monitoring and enforcement need to be introduced for better functioning of the organization. However, external management and accounting standards may need to be gradually introduced and adopted so that producer companies can withstand the test of time (Bernard and Spielman, 2009).
1.2.3. Product and External Environment – State and MarketsFactors such as resources, mobility, available technologies and predictability affect the likelihood of success of a producer company. Relationships with markets and the state, and good governance practices can help in better management of resources. Local “ownership” may be promoted through local participation and institutional arrangements that may be supportive of local conditions, such as human capabilities and technology, producer’s skills, financial capacity and managerial experience.
For support and incentives to help economic viability are important. Recognition of PCs/farmer organizations by the state and central government for provision of incentives/support
7
may help in sustaining the business in the long-run. Access to credit and the capital markets for capital resource sourcing may help in scaling up the business, and a favorable legal environment is also important. Enhancing market access and improving market orientation is also of great importance (Hellin et al., 2009).
1.3. Objectives of the StudyThe broad objective of the study is to examine important issues related to farmers’ participation in India’s futures markets. The specific objectives that are sought to be addressed include:
1) Examine efficiency of futures market in price discovery, the implication for spot and futures inter-temporal price relationship and price dissemination in relation to farmer participation.
2) Understand the socio-economic and exchange-related issues of farmer participation in the exchange-traded derivative market;
3) Identify the factors related to demand and supply of participation, and distribution of futures trading services;
4) Identify important factors constraining and enhancing farmer participation in the market and the benefits accrued;
5) Explain the behavior of farmer (direct and indirect) participation with respect to institutional, socio-economic, and other variables/factors.
1.4. Data and MethodologyThe study aims to address the research objectives mentioned above using secondary and primary data. Secondary data include commodity futures and spot prices, contract bid-ask spread, trade multiplier, basis, and other indicators - collected and collated from Thomson Reuters Eikon, and Centre for Monitoring of Indian Economy databases available at the Indian Institute of Management, Ahmedabad. The time span covered varies by commodity from 7 to 8 years of daily observations. The agricultural commodity futures included are based on the scope and nature of the study. Besides secondary data, primary data were also collected through surveys of farmers/ participants and this included farmers’ profile related to landholdings, education, and income from farming, number of family members, age, usage of cell phone, farm machinery, and livestock holding. Importantly, their responses on the association with futures and spot market agencies were also recorded in the survey instrument (Annexure 1). The field survey also captured the farmer responses on factors affecting the demand and supply of participation, and availability distribution of exchange members and trading terminal in rating or rank-order scales. Factors related to inducing or inhibiting farmer participation in futures market were also included.
Standard econometric methods such as Error Correction and Co-integration models are used for the analysis of the data, including spread analysis, and price discovery in the futures market. The rationale for this exercise was to explore futures market informational efficiency
Chapter 1: Introduction

8 Farmers’ Participation in India’s Futures Markets: Potential, Experience, and Constraints
in price formation and price transmission that can improve farmers’ spot price expectation, crop choice, and agricultural investment. Farmer participation was modeled using a linear conditional expectation model called logit model to predict the probability or likelihood of farmer market participation based on the given observations. Exploratory factor analysis was also used to identify significant factors in the demand and supply environment, and the distribution of futures trading terminals in promoting the participation.
1.5. Scope of the StudyThe study was conducted in the three states, namely Gujarat, Rajasthan, and Madhya Pradesh. The selection of these states is justified as follows. Three states are reported to have relatively mature spot markets for the commodities of rapeseed-mustard, castor, coriander, cumin/jeera, cotton, guar seed, soybean, chana, wheat, among others. These commodities except for cotton and guar complex, also have liquid futures markets. It may also be noted that some aggregation efforts have also taken place in Gujarat, Madhya Pradesh and Rajasthan, and farmer producer organizations (PCs) have also emerged and are facilitating the producers in the exchange-traded markets since the early 2015.
1.6. Organization of ChaptersThe study consists of 9 chapters. Chapter 1 introduces the topic that highlights important developments of institutions and technology in the context of farmer market access and key enablers for their market access. Chapter 2 presents an overview of India’s commodity futures markets. Chapter 3 reviews the empirical studies of farmer participation in futures market. Chapter 4 discusses the role of futures in price discovery and market efficiency. Chapter 5 describes the sampling plan and farmer profile for the primary survey. Chapter 6 examines the role and effectiveness of institutions involved in the aggregation efforts. Chapter 7 models the farmer participation and factors affecting the demand and supply of farmer participation, and the distribution of futures trading terminals. The chapter also highlights the problems, opportunities and scope for enhanced farmer participation in the exchange-traded derivative markets. Chapter 8 examines and reports on the factors affecting farmer participation in the futures market. Finally, Chapter 9 summarizes and concludes, and provided policy implications.

9
Despite its potential, commodity futures trading has remained controversial in India for long, especially for major agricultural commodities. This is substantially because of the sensitivity regarding food commodity prices, and concerns regarding their price volatility and price rise, especially in the context of poverty and underdevelopment. Various Committees have examined the issues, including Dantwala Committee (1966), Khusro Committee (1980), Kabra Committee (1994), Shankarlal Guru Committee (2001) and Habibullah Committee (2003), and some have proposed measures for operation and better functioning of the futures markets. The history continues to be chequered with many policy reversals. Several challenges including liquidity and participation have poised problems. The effects of commodity transaction taxes and National Spot Exchange crisis in particular have sapped the investor confidence and affected the overall market rating. Ambivalence regarding the utility of the markets remains of concern for the regulators and policy makers (Kabra, 2007; Sabnavis and Jain, 2007; Lingareddy, 2008; Nair, 2011).
Regulatory supervision on aspects of the economic behavior of agents perhaps needs to be increased many-fold before a strong role of exchanges in price discovery and price risk management is acheived. The new regulator, Securities Exchange Board of India is expected to strengthen the regulatory architecture of commodity derivative markets akin to capital markets – surveillance and monitoring (Ghosh and Dey, 2015). The regulation should closely relate with the market and product design to really improve the liquidity and participation. This should also include financial literacy of market participants and improvement of trust in settlement guarantee mechanisms in order to achieve the true economic motive of exchanges.
In volume, China continues to dominate in derivatives trading, in agriculture, metals and soft commodities, but India is emerging as important in derivatives trading in metals and energy products. The 113 commodities being regulated under the Section 15 of the Forward Contract (Regulation) Act, 1952 are traded in 6 national exchanges and 13 commodity specific regional exchanges under a federal structure2. Bullion (gold, silver), energy products and base
2Federal structure comprises three layers in the hierarchy of a regulatory structure, for example, the Ministry of Finance as an apex body being in helm of affairs, Forward Markets Commission as the Regulator and Commodity Exchanges as Self-Regulatory Organizations are in middle and base, respectively. FMC enjoys autonomy in monitoring and surveillance of commodity exchanges and their members
CHAPTER 2
Development of India’s Commodity Futures Markets
10 Farmers’ Participation in India’s Futures Markets: Potential, Experience, and Constraints
metals account for 35.5 percent, 26.7 percent and 20.7 percent respectively, while agricultural commodities account for only 17.2 percent of the traded volume in 2014-2015 (Lingareddy, 2015).
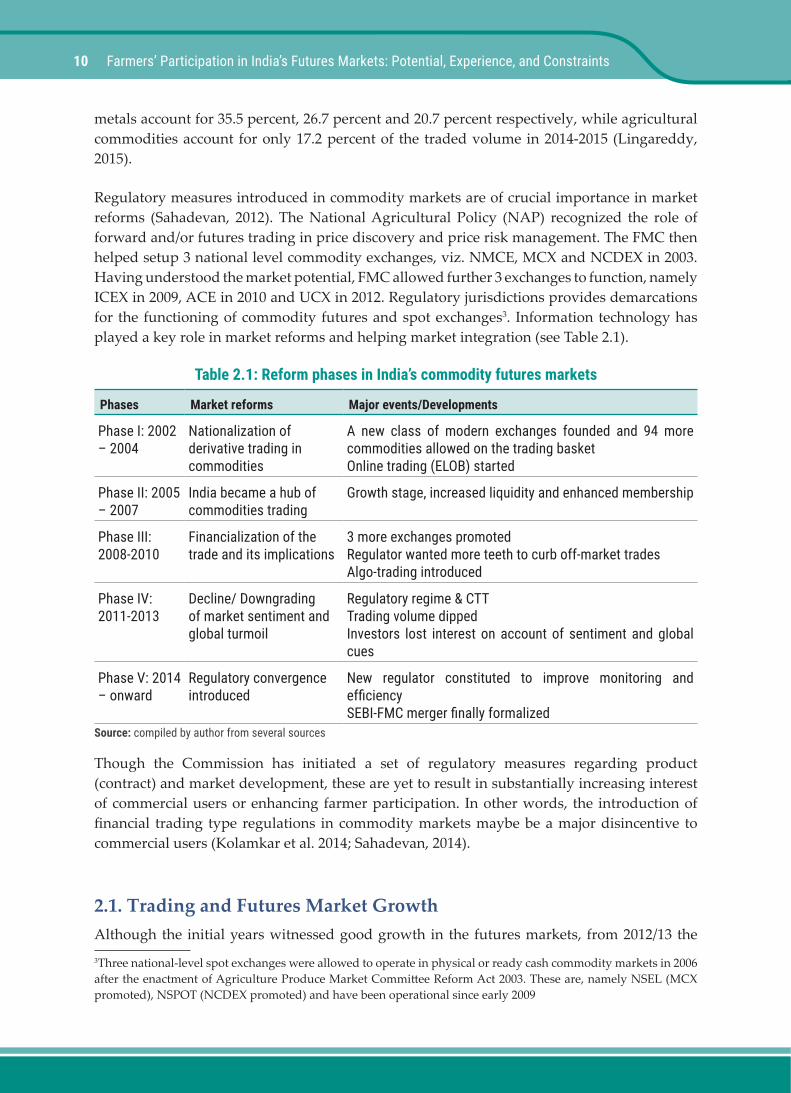
Regulatory measures introduced in commodity markets are of crucial importance in market reforms (Sahadevan, 2012). The National Agricultural Policy (NAP) recognized the role of forward and/or futures trading in price discovery and price risk management. The FMC then helped setup 3 national level commodity exchanges, viz. NMCE, MCX and NCDEX in 2003. Having understood the market potential, FMC allowed further 3 exchanges to function, namely ICEX in 2009, ACE in 2010 and UCX in 2012. Regulatory jurisdictions provides demarcations for the functioning of commodity futures and spot exchanges3. Information technology has played a key role in market reforms and helping market integration (see Table 2.1).
Table 2.1: Reform phases in India’s commodity futures markets
Phases Market reforms Major events/Developments
Phase I: 2002 – 2004
Nationalization of derivative trading in commodities
A new class of modern exchanges founded and 94 more commodities allowed on the trading basketOnline trading (ELOB) started
Phase II: 2005 – 2007
India became a hub of commodities trading
Growth stage, increased liquidity and enhanced membership
Phase III: 2008-2010
Financialization of the trade and its implications
3 more exchanges promotedRegulator wanted more teeth to curb off-market tradesAlgo-trading introduced
Phase IV: 2011-2013
Decline/ Downgrading of market sentiment and global turmoil
Regulatory regime & CTTTrading volume dippedInvestors lost interest on account of sentiment and global cues
Phase V: 2014 – onward
Regulatory convergence introduced
New regulator constituted to improve monitoring and efficiencySEBI-FMC merger finally formalized
Source: compiled by author from several sources
Though the Commission has initiated a set of regulatory measures regarding product (contract) and market development, these are yet to result in substantially increasing interest of commercial users or enhancing farmer participation. In other words, the introduction of financial trading type regulations in commodity markets maybe be a major disincentive to commercial users (Kolamkar et al. 2014; Sahadevan, 2014).
2.1. Trading and Futures Market GrowthAlthough the initial years witnessed good growth in the futures markets, from 2012/13 the 3Three national-level spot exchanges were allowed to operate in physical or ready cash commodity markets in 2006 after the enactment of Agriculture Produce Market Committee Reform Act 2003. These are, namely NSEL (MCX promoted), NSPOT (NCDEX promoted) and have been operational since early 2009

11
growth rate abruptly declined. For example, in 2011/2012, the growth rate pegged at 53.9 per cent with a value traded of INR 181 lakh crore. From 2012/2013 onward, the growth rate has further dropped to 6 percent and saw a steep fall of 39.2 percent in 2014/2015 with only INR 61.7 lakh crore of traded value reported (see Table 2.2).
Table 2.2: Exchange-wise traded value and growth(INR in lakh crore)
MCX NCDEX Others Total Growth (%)
2004-05 1.7 (29.0) 2.7 (46.5) 1.4 (24.5) 5.7 342.0
2005-06 9.5 (44.2) 10.9 (50.6) 1.1 (5.2) 21.6 273.7
2006-07 22.9 (62.4) 11.6 (31.7) 2.2 (5.9) 38.8 72.3
2007-08 31.3 (76.9) 7.7 (19.0) 1.7 (4.1) 40.7 10.6
2008-09 45.9 (87.4) 5.3 (10.2) 1.3 (2.4) 52.5 29.1
2009-10 63.9 (82.3) 9.2 (11.8) 4.5 (5.9) 77.7 47.9
2010-11 98.4 (82.4) 14.1 (11.8) 7.0 (5.8) 119.5 53.9
2011-12 156.0 (86.0) 18.1 (10.0) 7.2 (4.0) 181.3 51.7
2012-13 148.8 (87.3) 16.0 (9.4) 5.7 (3.3) 170.5 -6.0
2013-14 86.1 (84.9) 11.5 (11.3) 3.9 (3.8) 101.4 -40.5
2014-15 51.8 (84.0) 9.0 (14.7) 0.8 (1.3) 61.7 -39.2Note: Figures in brackets refer to percentage share in total. Source: Adapted from Lingareddy, 2015, p. 113
Table 2.3: Commodity shares in total traded volume (%)
Agricultural Commodities Bullion Metals Energy Others
2004-05 68.3 31.5 NA NA 0.4
2005-06 55.9 36.5 NA NA 8.5
2006-07 35.8 57.9 NA NA 6.3
2007-08 23.2 42.5 NA NA 34.4
2008-09 12.0 56.7 11.8 19.6 0.1
2009-10 15.7 40.8 23.2 20.3 0.0
2010-11 12.2 46.0 22.5 19.3 0.0
2011-12 12.1 56.2 16.0 15.7 0.0
2012-13 12.7 46.1 19.1 22.1 0.0
2013-14 15.8 42.5 17.4 24.4 0.0
2014-15 17.2 35.5 20.7 26.7 0.0Note: Data on metals and energy products are not available separately and included under others till 2007-08. Source: Lingareddy (2015), p.114
Chapter 2: Overview of India’s Commodity Futures Markets
12 Farmers’ Participation in India’s Futures Markets: Potential, Experience, and Constraints
MCX – the leading bourse in metals, bullion and energy products experienced a setback in the market share and reported a loss of some INR 34 crore in recent times. In 2014/2015, it accounted for 84 percent of market shares while NCDEX and other exchanges together reported only 15 percent of the share (See Table 2.3). Commodity group-wise trade shows that the proportion of agricultural products in the basket has marginally increased from 15.8 percent in 2013-14 to 17.2 percent in 2014/15, while the share of bullion has fallen by more than 6 percent. However, metals and energy products report an upward trend.
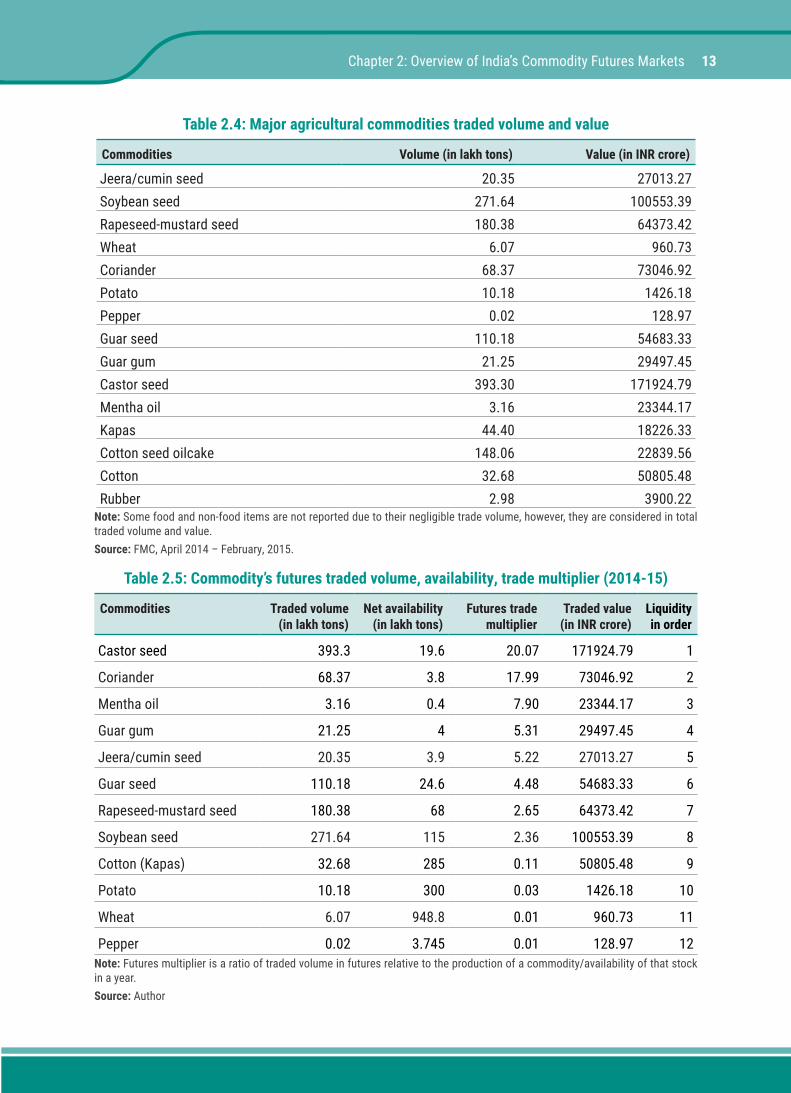
2.2. Liquidity in Agricultural Futures MarketsFutures multiplier is an important indicator of liquidity that is a relative measure of traded volume to stock availability of a commodity in a particular period. It is a reciprocal of stock-to-use ratio. Traded volumes in ascending order are extracted from a reliable database for the fiscal year, 2014/15. Similarly, production, usage, and stock availability are sourced to ascertain the futures multiplier of respective commodities. Major agricultural commodities futures traded volume and value are reported in Table 2.4. It is evident that among the basket of 32 agricultrual futures, soybean seed, rapeseed-mustard seed, guar seed, castor seed, cumin, cotton seed oilcake have observed major shares in the commodity basket. The demand-supply gap in local market and global slump in the trading of non-agricultural commodities might have induced the trading quantum in India’s market.
Analysis shows that only five agricultural futures contracts, namely castor seed (20.07), coriander (17.99), mentha oil (7.90), guar gum (5.31), and jeera/cumin seed (5.22) are quite liquid. In other words, these may be treated as thickly traded futures markets with a higher speculator ratio. In contrast, guar seed (4.48), rapeseed-mustard (2.65), and soybean seed (2.36) futures could have improved the liquidity if the participation of commercial users goes up (see Table 2.5).
Economic fundamentals of agricultural commodities generally influence the estimation of liquidity. But in the absence of domestic spot markets of metals and energy products, liquidity estimation remains cumbersome or unreliable and often depends on the “reference markets” of Asia, Middle East and Asia-Pacific. This difficulty in the estimation also leads to pricing anomaly and therefore should be observed with caution.
The liquidity gives an idea of current market trends, the heterogeneity in participation seems to be pervasive in the market. Thus, it is very difficult to determine the actual number of hedgers and speculators at a point of time until the regular disclosure at periodic intervals. Furthermore, the impact of financialization in commodities has blurred the boundary of derivative markets, say between commodities and stocks. In other words, a wave of migration from one market to the other has been observed since 2008/2009.
13
Table 2.4: Major agricultural commodities traded volume and value
Commodities Volume (in lakh tons) Value (in INR crore)
Jeera/cumin seed 20.35 27013.27Soybean seed 271.64 100553.39Rapeseed-mustard seed 180.38 64373.42Wheat 6.07 960.73Coriander 68.37 73046.92Potato 10.18 1426.18Pepper 0.02 128.97Guar seed 110.18 54683.33Guar gum 21.25 29497.45Castor seed 393.30 171924.79Mentha oil 3.16 23344.17Kapas 44.40 18226.33Cotton seed oilcake 148.06 22839.56Cotton 32.68 50805.48Rubber 2.98 3900.22
Note: Some food and non-food items are not reported due to their negligible trade volume, however, they are considered in total traded volume and value.Source: FMC, April 2014 – February, 2015.
Table 2.5: Commodity’s futures traded volume, availability, trade multiplier (2014-15)
Commodities Traded volume (in lakh tons)
Net availability (in lakh tons)
Futures trade multiplier
Traded value (in INR crore)
Liquidity in order
Castor seed 393.3 19.6 20.07 171924.79 1
Coriander 68.37 3.8 17.99 73046.92 2
Mentha oil 3.16 0.4 7.90 23344.17 3
Guar gum 21.25 4 5.31 29497.45 4
Jeera/cumin seed 20.35 3.9 5.22 27013.27 5
Guar seed 110.18 24.6 4.48 54683.33 6
Rapeseed-mustard seed 180.38 68 2.65 64373.42 7
Soybean seed 271.64 115 2.36 100553.39 8
Cotton (Kapas) 32.68 285 0.11 50805.48 9
Potato 10.18 300 0.03 1426.18 10
Wheat 6.07 948.8 0.01 960.73 11
Pepper 0.02 3.745 0.01 128.97 12Note: Futures multiplier is a ratio of traded volume in futures relative to the production of a commodity/availability of that stock in a year.Source: Author
Chapter 2: Overview of India’s Commodity Futures Markets
14 Farmers’ Participation in India’s Futures Markets: Potential, Experience, and Constraints
Findings from trading pattern and liquidity give an impression that a large section of investors may have lost their confidence in the market due to many reasons including the tax imposition on non-agricultural commodities, downturn in trans-national markets in general, and polarization among market participants for paper-based transaction in non-agricultural commodities. This may also have far reaching implications for economic viability and sustainability of ill-managed commodity exchanges in India.
To study the direct and indirect participation across primary and secondary stakeholders in agricultural commodity futures markets, socio-economic variables of the participants need to be considered. In addition to this, aggregate supply of futures contracts including hedge-limits, and effective demand for participation should be examined along with the distribution of services such as trading terminal, price portal, brokerage firm, assayer and warehouse service availability in rural and semi-urban areas or their proximity to farmers.
2.3. Futures Market Awareness and Membership with ExchangeThe exchange-traded derivative in commodities is not a recent introduction. Rather a conscious effort of the principal and agents in a phased manner has enabled the market to function under a designated regulatory architecture. Now, the new regulator, SEBI needs to put a concerted effort in association with FMC to offer a legitimate platform for a broad-based yet effective participation from actors along the commodity value chain.
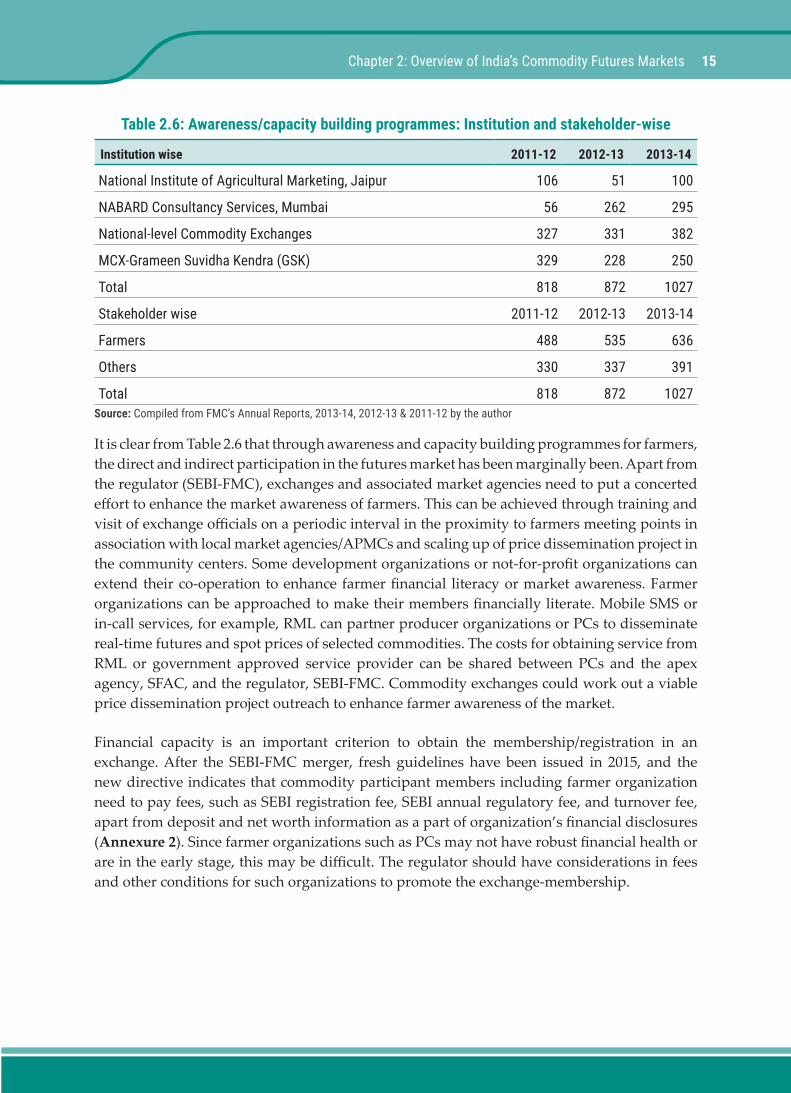
It may be noted that The FMC has adopted a number of measures towards market development and financial literacy of the participants after the establishment of a new class of modern exchanges in 2003. For instance, during the period, 2011-2014, the Commission organized several awareness programmes in association with the institutions, market agencies, and exchanges for farmer and other stakeholders along the value chain in addition to capacity building programmes conducted for institutions and stakeholders (refer Table 2.6). It is worth noting that the of awareness and training programmes has witnessed 16.36 percent growth in 2013-14. The number of farmer awareness programme has been increased to 636 in 2013-14 from 488 in 2011-12. FMC has also extended the project to post offices, rural branches of banks, warehouses, co-operatives, and remote areas to cover producer groups. The Commission had launched a price dissemination project for real-time price information of agricultural commodities installing some 1,863 price ticker boards in different parts of India during 2012-13. As the development of commodity derivative markets has introduced disruptive technology innovations, the interest of farmer organizations need to be protected through welfare approaches.
15
Table 2.6: Awareness/capacity building programmes: Institution and stakeholder-wise
Institution wise 2011-12 2012-13 2013-14
National Institute of Agricultural Marketing, Jaipur 106 51 100
NABARD Consultancy Services, Mumbai 56 262 295
National-level Commodity Exchanges 327 331 382
MCX-Grameen Suvidha Kendra (GSK) 329 228 250
Total 818 872 1027
Stakeholder wise 2011-12 2012-13 2013-14
Farmers 488 535 636
Others 330 337 391
Total 818 872 1027Source: Compiled from FMC’s Annual Reports, 2013-14, 2012-13 & 2011-12 by the author
It is clear from Table 2.6 that through awareness and capacity building programmes for farmers, the direct and indirect participation in the futures market has been marginally been. Apart from the regulator (SEBI-FMC), exchanges and associated market agencies need to put a concerted effort to enhance the market awareness of farmers. This can be achieved through training and visit of exchange officials on a periodic interval in the proximity to farmers meeting points in association with local market agencies/APMCs and scaling up of price dissemination project in the community centers. Some development organizations or not-for-profit organizations can extend their co-operation to enhance farmer financial literacy or market awareness. Farmer organizations can be approached to make their members financially literate. Mobile SMS or in-call services, for example, RML can partner producer organizations or PCs to disseminate real-time futures and spot prices of selected commodities. The costs for obtaining service from RML or government approved service provider can be shared between PCs and the apex agency, SFAC, and the regulator, SEBI-FMC. Commodity exchanges could work out a viable price dissemination project outreach to enhance farmer awareness of the market.
Financial capacity is an important criterion to obtain the membership/registration in an exchange. After the SEBI-FMC merger, fresh guidelines have been issued in 2015, and the new directive indicates that commodity participant members including farmer organization need to pay fees, such as SEBI registration fee, SEBI annual regulatory fee, and turnover fee, apart from deposit and net worth information as a part of organization’s financial disclosures (Annexure 2). Since farmer organizations such as PCs may not have robust financial health or are in the early stage, this may be difficult. The regulator should have considerations in fees and other conditions for such organizations to promote the exchange-membership.
Chapter 2: Overview of India’s Commodity Futures Markets

16 Farmers’ Participation in India’s Futures Markets: Potential, Experience, and Constraints

17
There are very few empirical studies regarding farmers participation in futures markets especially in developing countries. United Nations Conference on Trade and Development (UNCTAD) documents a few cases of the aggregator model, for instance, Guatemalan Coffee Growers Association (ANACAFE) – a non-government organization which introduced a credit system for small coffee growers in 1980s. Having linked producers with banks for securing the credit, ANACAFE utilizes the futures market-based instruments to hedge the price risk of farmer produce (UNCTAD 1997). In 1994, Agricultural Products Option Programme was introduced in cotton in Mexico and further extended to wheat, corn etc. The Support and Services for Agricultural Trading, (ASERCA), a decentralized administrative part of the Ministry of Agriculture, Livestock, Rural Development, Fisheries and Alimentary, acts as an intermediary between the producers and the exchanges such as Chicago Board of Trade (acquired by Chicago Mercantile Exchange Group in 2009) and New York Cotton Exchange to promote this for risk management. ASERCA cooperates with the producers in aggregation and participation in the exchange base by shorting (selling) in the option contract (UNCTAD, 2006).
In India, farmers’ access to forward/futures markets for managing price risk appears to be very minimal despite the aggregation efforts through officially sponsored projects piloted in the selected pockets (see, a schema of farmers’ futures market participation through the aggregator in Figure 3.1). This can be partly attributed to the lack of financial literacy among farmers and liquidity or/and depth of the market, in general. Promoting indirect participation through providing access to real time futures price from price ticker boards or online price portal or through mobile service is an alternative to expose farmers towards this risk management, but low level of awareness on the part of farmers and the market regulating authority comes in the way of realising the benefits. However, with a renewed interest in Small Farmers’ Agribusiness Consortium (SFAC) and the Ministry of Agriculture on mobilization of collective action and market access of smallholders following the emergence of Producer Companies (PCs), direct and indirect participation of farmer groups may gain ground (Dey, 2015b).
If farmers do not want to hedge their exposure, then they can at least use the futures price as a reference price to develop their spot price expectation in the local market. Theoretically,
CHAPTER 3
Literature on Farmers’ Participation in Futures
18 Farmers’ Participation in India’s Futures Markets: Potential, Experience, and Constraints
futures price above or below the expected future spot price presents the probable supply-demand scenarios of a commodity for which the futures contract is being floated. Futures price could be greater or less than the spot price depending on the magnitude of the net (of storage costs) marginal convenience yield. Besides this, Pennings and Leuthold (2001) argue that other factors influencing the use of forward/futures instrument include psychometric variables such as perceived performance, risk attitude, perceived risk exposure, market orientation, among others. Patrick, Musser and Eckman (1998) establish that experience, education, enterprise size, expected income change from hedging - influence the use of derivative contracts in general.
3.1. Past EffortsThe Multi Commodity Exchange (MCX) and the National Commodity and Derivative Exchange (NCDEX) made efforts to connect farmers with the exchanges through the intervention of development/not-for-profit organizations or cooperatives and farmer collectives. For example, HAFED – an apex producer agricultural cooperative in Haryana – participated in the NCDEX wheat futures during 2006-2007 to hedge the member-producer risks. A combination of the closing out or offsetting and short hedging strategy helped the cooperative realize profits of INR 108 a quintal (Berg, 2007). MCX took the initiative in 2007-2008 to promote awareness among cotton growers in Saurashtra region of Gujarat. In collaboration with the Cardinal Edge Managemetn Services, a consulting firm and Aga Khan Rural Support Programme (India), an aggregator, Nabard funded the project; opening of a trading (demat) account was facilitated by Kotak Securities. However, the initiative was short-lived due to the mark-to-market loss in the daily settlement or Mark-to-Market loss. Some sixty-seven farmers at Chotila block of Surendranagar district were mobilized to participate in the futures market through a federation of cotton farmers. NCDEX also made a similar effort in association with the Institute of Financial and Management Research and the aggregator, Self-employed Women’s Association in Gujarat. The project aimed to assess the impact of futures price access on the spot price expectation; it observed a significance of futures price dissemination using SMS-service between the farmers of treatment and control villages (Cole and Fernando, 2008; Cole and Hunt, 2010). However, the initiative did not last. While the direct participation of farmers or through their collectives in the exchange-traded derivative markets is yet to take off, some cooperatives in Kerala and Karnataka are likely to continue their participation, especially in plantations (Dey and Maitra, 2016). Despite the efforts of MCX to accommodate a group of farmers in mentha oil and potato futures during 2007-2008, the speculative intent of the market agents prohibited them from participation (Sahadevan, 2008).
There have been concerns regarding promotion and facilitation of commodity exchanges in the developing countries by the donors and national governments (Sitko and Jayne 2012) since efficient futures markets seek to reduce the transaction costs by providing a wide range of trading patterns and surveillance mechanisms resolves the conflict between traded parties. Meijerink et al (2014) explore the impact of Ethiopian Commodity Exchange on social capital and trust in sesame value chain. They opine that better monitoring and enforcement of the exchange compels the traders broaden their trading network and break up the informal relationship with local traders that results in creating a formal trading system.
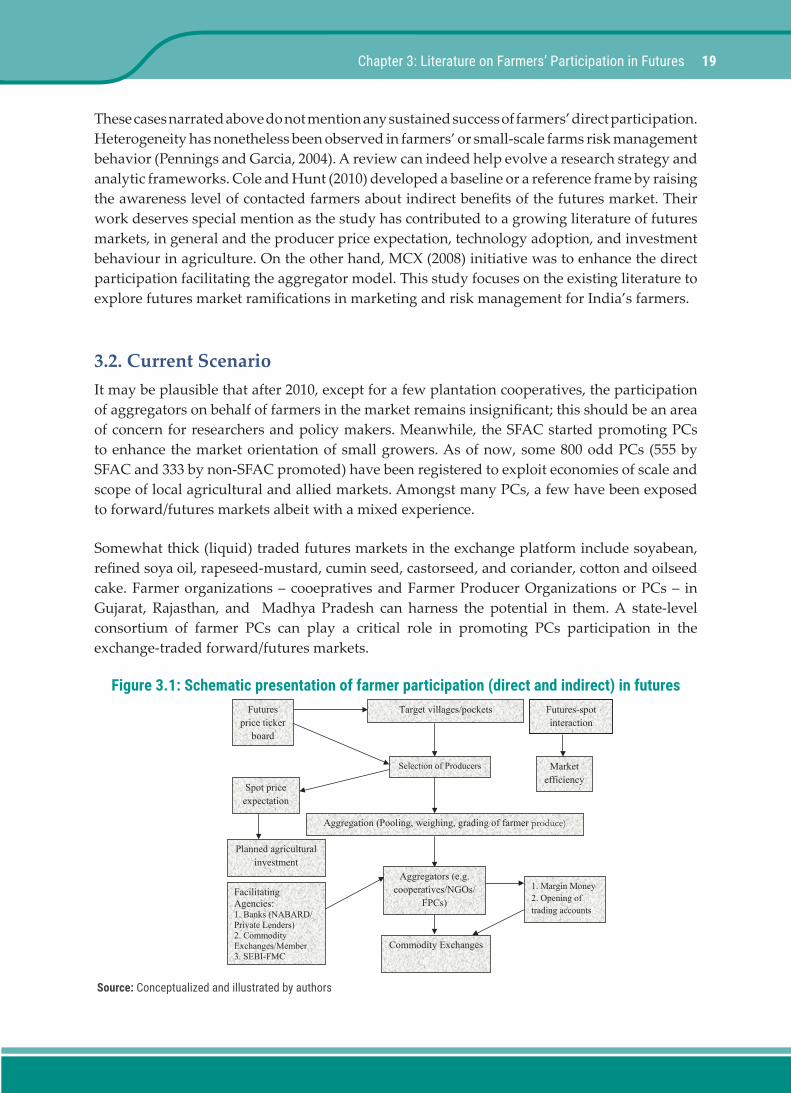
19
These cases narrated above do not mention any sustained success of farmers’ direct participation. Heterogeneity has nonetheless been observed in farmers’ or small-scale farms risk management behavior (Pennings and Garcia, 2004). A review can indeed help evolve a research strategy and analytic frameworks. Cole and Hunt (2010) developed a baseline or a reference frame by raising the awareness level of contacted farmers about indirect benefits of the futures market. Their work deserves special mention as the study has contributed to a growing literature of futures markets, in general and the producer price expectation, technology adoption, and investment behaviour in agriculture. On the other hand, MCX (2008) initiative was to enhance the direct participation facilitating the aggregator model. This study focuses on the existing literature to explore futures market ramifications in marketing and risk management for India’s farmers.
3.2. Current ScenarioIt may be plausible that after 2010, except for a few plantation cooperatives, the participation of aggregators on behalf of farmers in the market remains insignificant; this should be an area of concern for researchers and policy makers. Meanwhile, the SFAC started promoting PCs to enhance the market orientation of small growers. As of now, some 800 odd PCs (555 by SFAC and 333 by non-SFAC promoted) have been registered to exploit economies of scale and scope of local agricultural and allied markets. Amongst many PCs, a few have been exposed to forward/futures markets albeit with a mixed experience.
Somewhat thick (liquid) traded futures markets in the exchange platform include soyabean, refined soya oil, rapeseed-mustard, cumin seed, castorseed, and coriander, cotton and oilseed cake. Farmer organizations – cooepratives and Farmer Producer Organizations or PCs – in Gujarat, Rajasthan, and Madhya Pradesh can harness the potential in them. A state-level consortium of farmer PCs can play a critical role in promoting PCs participation in the exchange-traded forward/futures markets.
Figure 3.1: Schematic presentation of farmer participation (direct and indirect) in futures
21
or PCs – in Gujarat, Rajasthan, and Madhya Pradesh can harness the market potential. A
state-level consortium of farmer PCs can play a critical role in promoting PCs participation in
the exchange-traded forward/futures markets.
Figure 3.1: Schematic presentation of farmer participation (direct and indirect) in futures
Source: Conceptualized and illustrated by authors
Moreover, the traded commodities in the exchange have mature physical or spot markets in
and around these states. For example, Ram Rahim Pragati PC in Dewas of Madhya Pradesh
promoted in 2011 has become an institutional member of NCDEX- forward trading (the
Exchange launched forward contract in agricultural commodities in December, 2014). The
organization took a short position in forward soya trade, although inappropriate order
matching could not materialize it. However, they obtained an indigenous forward contract in
(non-pesticide managed) organic wheat with a Bangalore-based firm known Safe Harvest.
Samarth Kishan PC is another example that has been leverged on seed production and
certification business since 2006 in Agar-Malwa region of Madhya Pradesh, with a member-
Target villages/pockets
Selection of Producers
Commodity Exchanges
Aggregation (Pooling, weighing, grading of farmer produce)
Aggregators (e.g. cooperatives/NGOs/
FPCs)
1. Margin Money 2. Opening of trading accounts
Facilitating Agencies: 1. Banks (NABARD/ Private Lenders) 2. Commodity Exchanges/Member 3. SEBI-FMC
Futures price ticker
board
Spot price expectation
Planned agricultural investment
Futures-spot interaction
Market efficiency
Source: Conceptualized and illustrated by authors
Chapter 3: Literature on Farmers’ Participation in Futures
20 Farmers’ Participation in India’s Futures Markets: Potential, Experience, and Constraints
Moreover, the traded commodities in the exchange have mature physical or spot markets in and around these states. For example, Ram Rahim Pragati PC in Dewas of Madhya Pradesh promoted in 2011 has become an institutional member of NCDEX- forward trading (the Exchange launched forward contract in agricultural commodities in December, 2014). The organization took a short position in forward soya trade, although inappropriate order matching could not materialize it. However, they obtained an indigenous forward contract in (non-pesticide managed) organic wheat with a Bangalore-based firm known Safe Harvest.
Samarth Kishan PC is another example that has been leverged on seed production and certification business since 2006 in Agar-Malwa region of Madhya Pradesh, with a member-base of more than 5,500 and a surplus fund of INR 2.5 million. This collective enterprise is yet to be exposed to forward trading and commodity-based financing. Responsible soy programme financed by a donor agency called Solidaridad helped the PCs expose to Good Agricultural Practices in the early stages of their operation. Thus, SKPC has acquired domain expertise in seed production business. Moreover, the local market condition and farmers’ awareness of quality seed material could be another reason for the PC’s foray into the seed business. A few PCs promoted by the joint efforts of development organizations/resource institutions, namely Indian Grammen Services, Action for Social Advancement, among others and SFAC in Dewas and Ujjain districts of Madhya Pradesh have been partnering Samarth PC for seed production and distribution. Ajaymeru Kisan Samruddhi PC of Ajmer in Rajasthan might draw a parallel strand as it has also become an institutional member of NCDEX forward trading and intends to participate in the current fiscal, 2015-2016. Development Support Centre and Sajjata Sangh of Gujarat have also made efforts to mobilize PCs’ participation in castor seed and cumin forward contracts. Gujarat Agribusiness Consortium Producer Company Limited – a state level consortium of PCs in Gujarat has initiated marketing of farmer produce in a technology-enabled trading environment.
It is worth noting that Aranyak Agri Producer Company Limited, Purnia (Bihar) became a first mover in India to enter the forward (now futures) contract on a long-period horizon (60 days) on the NCDEX platform. The company sold 490 metric tons of maize at INR 1440 a quintal. In total, they sold 1,014 mt of maize and realized a net profit of some INR 11.31 lakh in 2014-2015. So, the participation of Aranyak in commodity derivative market ushers in that commodity exchanges could make the PCs more aware of the utility of exchange-traded risk instruments. A robust regulatory architecture put in place could protect the interests of farmer collectives in the long-run.
3.3. Enablers to Farmer Participation in Derivative MarketsFarmer participation in futures market relies upon several factors, namely market orientation, risk exposure, market performance, and entrepreneurial behaviour (Pennings and Leuthold, 2000, 2001). Expected utility and behavioural (psychometric) risk measures can be useful for predicting farmer risk mitigation behaviour (Pennings and Garcia, 2004). While farmer association in the hedging activity depends on hedging costs and associated risks for their welfare gains (Zant, 2001), the role of exchange appears to be crucial in managing and
21
marketing the futures contract for hedger participation (Pennings and Egelkraut, 2003). To this end, evaluation of farmer marketing strategies for revenue and risk management can be useful to the exchanges (Tomek and Peterson, 2001). The following pointers might help the regulator and exchange functionaries to adopt many prudent measures.
3.3.1. Empowering and Orchestrating the Roles of Regulator and Market AgenciesCommodity futures market regulator needs to work scrupulously to develop the markets and ensure that benefits are realized and accrued equitably among the stakeholders. While futures contracts need to be aligned with physical market conditions, the FMC might empower and entrust its stakeholders to send periodic reports or feedback. Besides the stakeholder’s feedback, the regulator might issue the disclosure on the participation of commercial traders or hedgers and non-commercial traders/non-users along with their open interest positions at regular interval. Other apex institutions and market agencies, viz. Food Corporation of India, National Agricultural Co-operative Marketing Federation, Directotate of Marketing and Inspection, Council of State Agriculture Marketing Boards, and Spice/Plantation Boards can extend their co-operation to enhance market transparency in price formation and dissemination that might help restore the co-movement of future and spot prices in a given period. Installation of price ticker boards and mandi modernization programme might help increase the awareness level of producers, traders, and general public on the role of exchanges in liquidity, leverage, and transparency. Since the heterogeneity in participation has been observed in commodity markets, the regulator and commodity exchanges need to protect commercial users from unscrupulous off-market trading activities (Kumar, 2010). It may be a viable proposition that minimum guaranteed/support price under Price Support Scheme offered as an options contract for plantation crops might help the producers to hedge them from distress selling (Raipuria, 2003). Exchanges may consider these prices to avoid anomalies in pricing exercises for floated futures and spot contracts in similar commodities and eventually, enhance the legitimacy in the market functioning (Mor and Fernandes, 2009). Since commodity markets are nuanced in comparison to financial markets, the regulators and agencies should orchestrate for delivering their roles (Pavaskar, 2005).
3.3.2. Co-existence of Futures and Spot ExchangesThough spot exchanges came into existence quite a few years ago, these are yet to complement the functioning of futures exchanges in many instances. While trading in futures exchanges is executed in a software-enabled environment, functioning of the spot exchange depends on several factors, namely state government clearance for the trade-order, earmarking market yard, standardising auctioning process and arrangement of facilities like weighing machine, trading terminal and storage premises, among others. Therefore, the regulators at central- and state-level need to make some concerted efforts for real-time price formation and dissemination. This information may be useful to futures exchanges and their members/brokers to curb in any speculative intent in price discovery and dissemination. And this might be attainable if futures and spot exchanges facilitate trading in identical commodities, for instance castor seed spot and futures contracts offered by the NMCE. Similarly, NCDEX spot exchange has been
Chapter 3: Literature on Farmers’ Participation in Futures

22 Farmers’ Participation in India’s Futures Markets: Potential, Experience, and Constraints
initiated spot trading in pulses, cereals and other high value agricultural produce in many parts of India. This insight might stimulate agriculture policy makers to focus on the market design and regulatory framework (Ramaseshan, 2012).
3.3.3. Devising a Liquid Market MicrostructureMarket microstructure4 raises a few issues; one is what should be the goal of market design and the other one, how do the properties of markets contribute to these goals (O’ Hara, 1995). While the goal of a market depends on whose perspective is being considered, hedgers as fundamental users of commodities need to receive undeniably more attention. Exchanges in consultation with the regulators and market participants need to devise broad-based contracts for hedge-limit users considering time-varying margin rule, position limit, price band, contract size, tick size, price limit, hedging horizon, and delivery logic. In addition, basis variety for selecting hedge and asset storability should be taken into consideration. Given the unique nature of commodities, a robust microstructure can enhance liquidity and participation in commodity markets. Nonetheless, certain parameters relating to production, trade volume and futures multiplier or/and speculator ratio need to be authentic at source for a better policy prescription.
4Microstructure may be defined as a process by which participant’s belief and expectation can be translated into financial market transactions and this can be factored into bid-ask spread, order selection, and inventory costs, trading pattern, among others (for more details, see O’ Hara, 1995). A robust microstructure can augment market efficiency
23
The futures markets seek to help and be instrumental in price discovery and risk management. These markets seek to ensure the payoff against the abnormal price movement, either an upward or downward. The reduction in income variability seems to be an important function rendered by the exchange-traded futures instrument. In this chapter, the role of the futures markets in price discovery is examined. This would address the first objective of the study that whether select commodities futures markets are informationally efficient and can be instrumental in reliable price discovery and broad-based price dissemination. Active futures market can moderate farmers’ spot price expectation or help in giving better marketing strategies those have still been excluded from the ambit of direct participation. Hedging is a scientific risk management activity that ensures the income stability of market agents. However, India’s commodity futures markets are often not amenable to hedging in general (Sahadevan, 2014). One can argue logically that if the futures market is proved to be hedge-effective then it must be informationally efficient (O’ Hara, 1995). This study draws upon the same logical strand and has not investigated the hedging effectiveness. Nevertheless, Sen et al. (2008) reported hedging-effectiveness of a few commodities futures, viz. guar seed (58%), tur (44%), urad (44%), chana (36%), sugar (32%) and wheat (15%) although tur and urad are no more traded in the futures and guar has seen temporary suspension after 2012/2013.
Price discovery and market efficiency are linked. Both the concepts are inextricably linked in forward/futures and other derivative markets context. However, there is a thin-line of demarcation between the two. The former is a process that impounds all available information into the price of an asset, say commodity. The latter refers to the rationality and risk neutrality of market agents that result in reflecting a fundamental or economic value of the asset (Mohan and Love, 2004). In this chapter, price discovery and market efficiency are used together for a comprehensive understanding in the context.
The present study drew on sample farmers from the three states, namely Gujarat, Rajasthan and Madhya Pradesh using a non-probabilistic (purposive) sampling. The sample design and data collection approach are discussed in Chapter 5. Commodities actively traded in the futures markets have a mature spot or ready cash market in the mentioned states relatively. These include, namely castor seed, cumin seed or jeera, cotton and its derivatives (Gujarat),
CHAPTER 4
Futures Market Efficiency in Price Discovery and Dissemination
24 Farmers’ Participation in India’s Futures Markets: Potential, Experience, and Constraints
guar seed and its derivative, rapeseed-mustard seed, coriander (Rajasthan), and wheat, chana, soybean seed and its derivative (Madhya Pradesh). Analysis of commodities fundamentals, viz. liquidity, buy-sell price gap or spread, co-movement of futures and spot markets, etc. may be useful for the farmer organizations. In India, NCDEX appears to be a leading exchange, facilitating agricultural commodities futures trading since 2004-2005. The scope of member/client participation in the floated futures contracts can be available from the exchange portal. Farmer organizations can access to informationally efficient futures market either for hedging/offsetting their price risks or obtaining reliable price information. There is also indisputable evidence to suggest that participation in the futures market can potentially reduce income variability. However, efficiency in price discovery may come to the fore for establishing a causal relation between futures market participation and hedging against income variability. Thus, the efficiency testing can be imperative before the direct involvement. Exchanges and analyst organizations can perform an acid test of market efficiency especially for producers and commercial users, especially farmers at a reasonable price. Furthermore, price and non-price factors need to be considered for a comprehensive understanding of the market.
4.1. Related WorkInternationally, several studies have shown empirically that trading in futures reduces cash price volatility (Darrat and Rahman, 1995; Yang et al., 2001; Zapata et al., 2005). Analysing the interactivity of Chinese cotton markets with the U.S. market, Ge et al. (2008) observed that futures prices of cotton in China and the U.S. move in tandem and a long-run equilibrium has been found between the New York Board of Trade (NYBOT) and Zhengzhou Commodity Exchange. These two markets efficiently share price transmissions. Yang and Leatham (1999) analyzed the price discovery of U.S. wheat futures and cash market separately. They noted that while wheat futures market achieves long-run price equilibrium, no equilibrium relation of prices across the wheat cash market has been found. Karande (2006) studied price discovery in castor seed futures and spot markets. The study indicated that price, as well as market linkages between the futures market at Mumbai and Ahmedabad, has strengthened overtime. This may be plausible that all the studies seem to infer the existence of unidirectional causality in price formation and transmission from futures to spot. Roy (2008) argued that Indian wheat futures markets are well co-integrated with their spot markets. The study concluded that there is a bidirectional causality observed in selected (thirty-two) contracts during the period, 2004-2007. A lead-lag relation has been found between the two markets. Also, the study attempted to determine the convenience yield of wheat futures for explaining hedging efficiency and the rate of convergence between futures and spot markets. As opposed to this, Ghosh (2010) obtained entirely different results. The study put forward the evidence on the ineffectiveness of the futures markets in price discovery. It is also evident in his study that both futures and physical markets are not exchanging the information. Even futures market does not follow any information on the arrival, prices, and so on in the physical markets, nor does the physical market take any information of futures market into account. Though Roy’s (2008) study indicated that the market efficiency is not entirely reflected in the price and achieved in all wheat markets, especially, in intra-state market structure, yet his conclusions are contradictory that both the markets, intra-state and inter-state are co-integrated in the

25
short run. The imperfections prevailing in markets could be due to poor transportation, higher transaction costs, and inadequate storage facilities.
However, the situation is different for thin markets, though. Thin markets, devoid of liquidity, are usually perceived as inefficient, and the low trading volumes of thinly traded futures markets may generate small amounts of information, which are qualitatively inferior (Mattos and Garcia, 2004). Nonetheless, the inconclusive debate on futures and spot price relation continues, and many attempts have been made to assess or examine the inter-temporal price relationships between futures and spot markets (Mattos and Garcia, 2004; Dey and Alur, 2012; Sahadevan, 2014; Dey and Maitra, 2016).
4.2. Data and EstimationFutures market efficiency can be assessed using co-integration and causality tests. The rationale for using the standard econometric techniques is to assess the impact of futures price adoption on farmer spot price expectation and moderated behavior in agricultural investment (Cole and Hunt, 2010). Also, spread analysis can be a useful exercise for understanding the market movement. Therefore, spread determination and price discovery model of selected commodities is described followed by their implications for farmer participation.
Futures trading data of agricultural commodities are considered here. Commodities having a significant share in the futures trade with considerable trading frequency are chosen for the analysis. For example, daily closing futures prices of castor seed (2007-2015); cumin/jeera (2008-2015); wheat (2009-2015); coriander (2010-2015); rapeseed-mustard (2010-2015); soybean (2010-2015) are extracted from a reliable data source, that is, Thomson Reuters Eikon licensed database. Cotton and guar seed are excluded due to the issue of trading-synchronization. Spread calculation considers the foundation work of Roll (1984) and Kyle (1985) that appears to be reliable in most cases to spread determination (see Hull, 2007). In the case of price discovery, the sample period is different, and five commodities, namely castor seed, cumin seed, wheat, rapeseed-mustard seed and coriander are considered for the analysis (see contract specification in Annexure 3). It may be noted that cotton, soybean seed, guar complex are excluded from the sample, especially for price discovery and efficiency testing due to the convergence issue or the absence of long-run futures and spot price equilibrium relationship. Except the cotton seed oilcake, kapas (Shanker/V-797) futures contract has been illiquid since 2010. Moreover, the mismatch between the basis variety (Shankar 6/10 traded on NCDEX or V797/Kalyan traded on MCX) and cultivable variety (Bt cotton) remains an issue of concern to the exchanges. Guar complex has also been in the discussion since 2009 due to abnormal price movement and downgraded market sentiment. In case of soybean and its derivative, lack of consistency in the reported data can be a potential problem in the analysis.
For selected commodities, time series plotting, diagnostic checks like unit root problem, and normality, heteroscedasticity, and autocorrelation had been performed before the estimation. We reported at least one co-integrating vector in VECM, impacting the futures and spot price co-movement. While the methodological advancement has been observed in financial economics,
Chapter 4: Futures Market Efficiency in Price Discovery and Dissemination
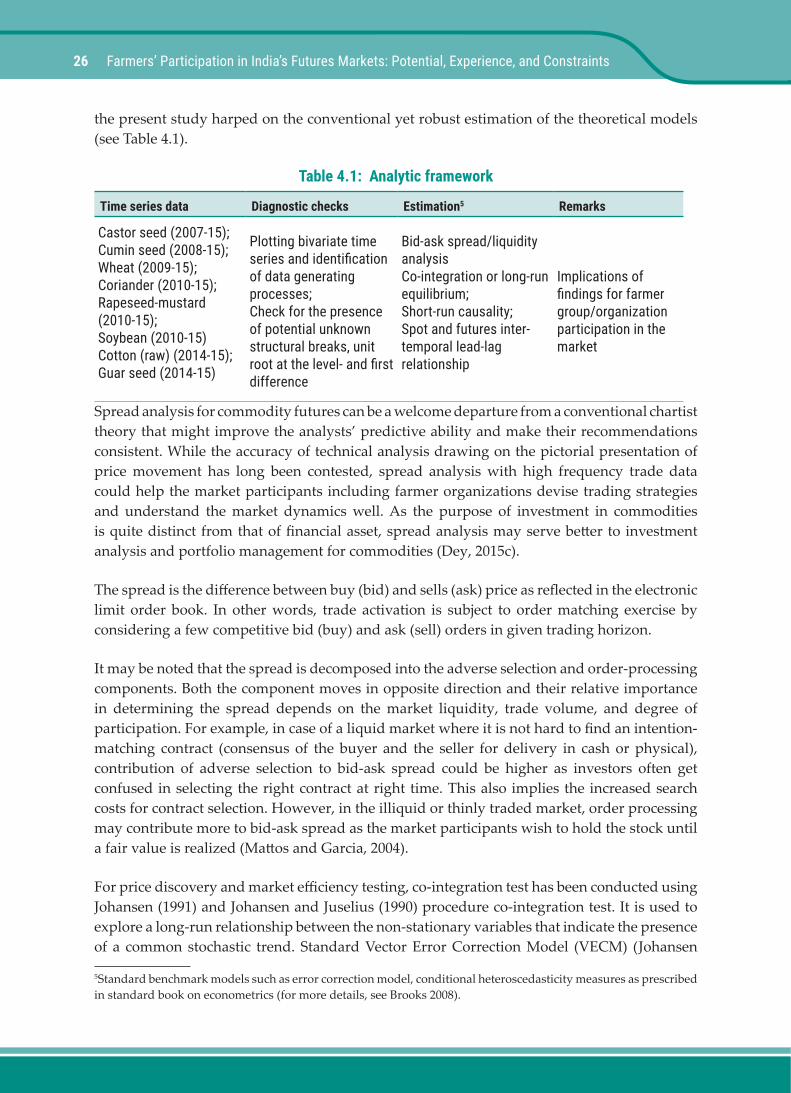
26 Farmers’ Participation in India’s Futures Markets: Potential, Experience, and Constraints
the present study harped on the conventional yet robust estimation of the theoretical models (see Table 4.1).
Table 4.1: Analytic framework
Time series data Diagnostic checks Estimation5 Remarks
Castor seed (2007-15);Cumin seed (2008-15);Wheat (2009-15);Coriander (2010-15);Rapeseed-mustard (2010-15);Soybean (2010-15)Cotton (raw) (2014-15);Guar seed (2014-15)
Plotting bivariate time series and identification of data generating processes;Check for the presence of potential unknown structural breaks, unit root at the level- and first difference
Bid-ask spread/liquidity analysisCo-integration or long-run equilibrium;Short-run causality;Spot and futures inter-temporal lead-lag relationship
Implications of findings for farmer group/organization participation in the market
Spread analysis for commodity futures can be a welcome departure from a conventional chartist theory that might improve the analysts’ predictive ability and make their recommendations consistent. While the accuracy of technical analysis drawing on the pictorial presentation of price movement has long been contested, spread analysis with high frequency trade data could help the market participants including farmer organizations devise trading strategies and understand the market dynamics well. As the purpose of investment in commodities is quite distinct from that of financial asset, spread analysis may serve better to investment analysis and portfolio management for commodities (Dey, 2015c).
The spread is the difference between buy (bid) and sells (ask) price as reflected in the electronic limit order book. In other words, trade activation is subject to order matching exercise by considering a few competitive bid (buy) and ask (sell) orders in given trading horizon.
It may be noted that the spread is decomposed into the adverse selection and order-processing components. Both the component moves in opposite direction and their relative importance in determining the spread depends on the market liquidity, trade volume, and degree of participation. For example, in case of a liquid market where it is not hard to find an intention-matching contract (consensus of the buyer and the seller for delivery in cash or physical), contribution of adverse selection to bid-ask spread could be higher as investors often get confused in selecting the right contract at right time. This also implies the increased search costs for contract selection. However, in the illiquid or thinly traded market, order processing may contribute more to bid-ask spread as the market participants wish to hold the stock until a fair value is realized (Mattos and Garcia, 2004).
For price discovery and market efficiency testing, co-integration test has been conducted using Johansen (1991) and Johansen and Juselius (1990) procedure co-integration test. It is used to explore a long-run relationship between the non-stationary variables that indicate the presence of a common stochastic trend. Standard Vector Error Correction Model (VECM) (Johansen
5Standard benchmark models such as error correction model, conditional heteroscedasticity measures as prescribed in standard book on econometrics (for more details, see Brooks 2008).

27
1991) is to be estimated from the following set of equations.
, 1..., ..............[1](0, )
Xt i Xt i Xt i i it t i t
π ε ρε∆ = ∑Γ ∆ − + − + =Ω − ∈ Ξ
Here Xt is a 2 X 1 vector (St, Ft)’ of the spot and futures prices respectively, ∆ denotes the first difference operator, εt is 2 x 1 vector of residuals (εSt, εFt )’ follow an as-yet-unspecified conditionally distributed with mean zero and time varying covariance matrix, Ht. The characteristic roots of the n x n matrix Π are the values of λ, which satisfy the following equation (Π- λIn) = 0 where In is an n x n identity matrix. Johansen (1988) proposes the following two statistics for testing the rank of Π:
( ) ln(1 ), 1, 2,3,..., ...............[2]max( , 1) ln(1 1).........................[3]trace r T i i n
r r T iλ λλ λ
= − ∑ − =+ = − ∑ − +
λ’ are the Eigen values to be obtained from the estimate of the Π matrix and T is the number of usable observations. The λtrace tests the null that there are at most r co-integrating vectors, against the alternative that the number of co-integrating vectors is greater than r (H0<0; H1≥0) and the λmax tests the null that the number of co-integrating vectors is r, against the alternative of r + 1 (H0<1; H1≥1).
It is worth noting that co-integration test is sensitive to assumptions about deterministic components (of both intercept and trend) of any times series. Hansen and Juselius (1995) suggest a method known as ‘pantula principle’ for simultaneously determining matrix rank and deterministic (endogenous) components of the co-integration system. The five different cases based on the two deterministic components of the co-integration system are as follows:
i. no intercepts and no trends;
ii. restricted intercepts and no trends;
iii. unrestricted intercepts and no trends;
iv. unrestricted intercepts and restricted trends;
v. unrestricted intercepts and unrestricted trends
The five cases are nested so that case (i) is contained in case (ii) which is contained in case (iii) and so on. Hjelm and Johansson (2005) however show that ‘pantula principle’ suffers from a major drawback. They observe that it is heavily biased towards choosing case (iii) when the correct data generating process is given by case (iv). They, therefore, propose to use ‘modified pantula principle.’ It improves the probability of choosing the correct model significantly.
Stationarity (Dickey and Fuller, 1979; Phillips and Perron, 1988); break point; and normality tests (Brooks, 2008) preceded the co-integration test. Due to serial correlation, the distribution might be non-independent and identical (niid) except the residuals. Then VECM is used in the presence of potential unknown structural breaks following the Newey and West truncation (Engle and Granger, 1987; Peri et al., 2013). VECM specification contains information on short-
Chapter 4: Futures Market Efficiency in Price Discovery and Dissemination
28 Farmers’ Participation in India’s Futures Markets: Potential, Experience, and Constraints
and long-run adjustments to changes in non-stationary time series. Sometimes ‘Granger’ causality is conducted to check short-run causality between both return series followed by VECM. It also checks block exogeneity problem in the Vector Auto-regression or VAR system. VECM is specified below.
1 1 ,
2 1
............ [4]
............ [5]st s t si s t i fj ft j st
ft f t fi ft i sj st j ft
R ect R R
R ect R R
α α β γ ε
α α β γ ε− − −
− − −
= + + + +
= + + + +∑ ∑∑ ∑
Rst or ∆St is spot return and RFt is futures return, βsi, γsj, βFi, γfj are the short-run coefficients, Ω (St-1-Ft-1) is the error correction term (ECT), and εs,t and εF,t are residuals as explained above. The magnitude of the coefficients αs and αf determines the speed of adjustment back to the log-run equilibrium following a market shock or ‘unit shock’ that is from spot to futures, within spot, within futures, and from futures to spot through Impulse Response Analysis. When these coefficients are large, the adjustment is quick, and so Ω will be highly stationary and reversion to the long-run equilibrium will be rapid, where ζ is error coefficient adjusted through ECT that is Ω.
4.3. Findings and Discussion
4.3.1. Spread Analysis FindingsSpread analysis for selected commodities shows that castor seed futures bid-ask spread lies between -2.15 (lower bound) and 6.6 percent (upper bound) with an average spread of 0.58 percent (Table 4.2). This implies that castor seed futures price may range between INR 3914 and INR 4264 a quintal with an average of INR 4023 a quintal in the near-month contract if the current rate stands at INR 4000 a quintal. The spread dispersion from the mean could be 0.78 percent. In case of cumin, the average spread is 0.27 percent with a lower bound of -2.08 and upper bound of 5.68 percent. It means that cumin futures can ideally be traded between INR 18115 and INR 19552 a quintal in near-month contract period assuming the current price of INR 18500 a quintal. The spread dispersion is found to be 0.57 percent that is relatively less than that of castor seed. Wheat futures contract resumed in 2009 after the suspension of trading had revoked. So, the analysis considers only new contract data in that calculated average spread is 0.39 percent with a lower bound of zero and upper bound of 4.84 percent. The spread dispersion is 0.67 percent. Intuitively, wheat futures market is yet to regain the market sentiment with an improved liquidity. Coriander futures contract remains liquid throughout the sample period although the spread dispersion is relatively higher than that of castor seed and cumin futures. With a range between -1.65 and 5.83 percent, the estimated average spread is 0.78 percent, and the spread dispersion is 1.02 percent. The deviation indicates the concentration of speculators from 2010 onward that could enhance the likelihood of adverse selection component in the spread. While the average spread of rapeseed-mustard is 0.34 percent with a lower bound of -1.59 and upper bound of 5.50 percent, soybean futures spread varies between -0.95 and 5.51 percent with an average of 0.41percent. However, the spread dispersion in both the cases lies between 0.56 and 0.62 percent.

29
These findings could help market participants devise trading strategies and improve market timing ability. As futures trading in commodities is expected to offer a potential avenue for risk management, spread analysis remains imperative with implications for trading economics and market efficiency. First, spread impacts the liquidity that simultaneous buying and selling are possible with an incremental effect of transaction costs. Second, this may serve as criteria for hedging as the higher spread (than expected) could induce the basis risk. Third, as the spread is akin to impact trading costs, this may help commercial users/producers to limit their position and correct the analyst recommendations.
Spread analysis offers an incisive understanding of the market functioning through the realization of traded volume, liquidity, and participation. It is a fact that futures price evolves from the interaction of bids and offers (ask) emanating from various corners of geography. The bid and offer prices are based on the expectations of prices on the maturity date (Bose, 2008). Mattos and Garcia (2004) argue that bid-ask spread decomposition can indeed be useful to conclude whether the futures market is thickly or thinly traded factoring in a few attributes such as traded volume and liquidity6. So, it can be conclusive that “thin markets, devoid of liquidity, are usually perceived as inefficient, and low trading volumes of thinly traded futures markets may generate small amount of information, which are qualitatively poor” (Dey and Maitra, 2012: p. 26).
Drawing parallel from the empirical research as mentioned above, spread analysis especially for the near-month futures contract can have implication to liquidity, trading volume, and participation before conducting any econometric analysis such as co-integration and causality between the futures price and spot price. Though there is no prescribed limit of spread tolerance, commodity exchanges estimate and disclose an indicative list of historical bid-ask spreads for active futures contracts at periodic interval. Intuitively, a larger spread makes the market illiquid and market observes the reduced magnitude of participation. The larger spread can be a result of adverse selection of a futures contract or increased order processing or inventory holding costs on the part of the broker or member.
4.3.2. Findings of Futures-Spot Price RelationshipsPrice discovery results are discussed here. It is evdient from Table 4.3 that castor seed spot and futures prices are co-integrated in the long-run, but futures price responds to error correction (basis) faster than the spot price.There is bi-directional causality observed between the spot andf futures return while in the short-run, futures and spot do respond to their return at the first lag. The error-correction coefficient implies that the average speed of news adjustement by interaction of castor spot and futures prices leading to convergence. In other words, if the market is efficient, natural convergence occurs at the time of expiry of the contract.
6Black (1975), Roll (1984) and Kyle (1985) works fall in support of this argument.
Chapter 4: Futures Market Efficiency in Price Discovery and Dissemination

30 Farmers’ Participation in India’s Futures Markets: Potential, Experience, and Constraints
Table 4.2: Commodity futures historical bid-ask spread analysis
Commodity PeriodFutures bid-ask spread (%)
Dispersion (%)Average Upper bound Lower bound
Castor seed 2007-15 0.58 6.60 -2.14 0.78
Cumin seed 2008-15 0.27 5.68 -2.08 0.53
Wheat 2009-15 0.39 4.84 0.00 0.67
Coriander 2010-15 0.78 5.83 -1.65 1.02
Rapeseed-mustard 2010-15 0.34 5.50 -1.59 0.56
Soybean 2010-15 0.41 5.51 -0.95 0.62
Cotton (Kapas) bale 2014-15 0.40 6.71 0.00 1.03
Guar seed 2014-15 0.69 5.91 -0.36 1.35Source: Extracted from Thomson Reuter’s Eikon and compiled by the author
Cumin spot and futures prices respond to the error correction (through basis) instantaneously. Spot follows the futures or futures leads the spot. In the short-run, futures response to the spot has been pronounced. The co-integrating equation indicates a strong dependence between spot and futures prices with bi-directionally a price information flow. Wheat futures and spot prices respond to error correction and price information flows from spot to futures and futures to spot. The traidng has been suspended in 2007-2008, matured spot marketscould have helped stabilise the futures after the ban period. In the short-run, information spilled from spot to futures return and futures to spot return has been pronounced at their first lag. Rapeseed-mustard futures has been launched in December 2004 and seemed to have active from 2005 onward. In Janaury 2011, futures prices have escalated about 1.5 times from the opening price of 2004 to INR 2934 a quintal. Both futures and spot prices are found to be co-integrated in the long-run in that futures appears to lead the spot as can be seen from the coeffcients of error correction term and their respective sign. In the short-run, information spillover from futures to spot retrun has been pronounced (see the coefficients and p-values in Table 4.3). Nonetheless, there could be the presence of a potential (unknown) structural break that might lead futures to go up, and spot prices responded to that development. Coriander futures price movement has shown an erratic behaviour, started with above INR 9000 a quintal then moved to the price band of INR 3000-4000 a quintal and further increased above INR 10000 a quintal. It is clear that futures price attempted to follow the spot price evolution and spot price behaviour has been internalized within futures. Though both the price series are co-integrated, the positive sign of error correction coefficients indicates an explosive non-stable correction. In other words, the price series may be away from a long-run equilibrium relationship or the natural convergence is unlikely to occur. In the short-run, both futures and spot returns respond to each other, however, individually, they hardly respond to their information innovation/shock at the respective lag-order.
Price discovery in selected futures markets has been examined using VECM and modified Co-integration models. Castor and cumin seed futures markets and spot markets have attained a
31Chapter 4: Futures Market Efficiency in Price Discovery and Dissemination
long-run price relationship. In other words, convergence is likely to occur between the futures and spot prices in these commodities. Therefore, farmers’ organizations (PCs) can leverage these markets either for risk reduction or moderating spot price expectation. Since castor and cumin seed futures markets have exhibited an expected market condition what is called ‘contango,’ direct or indirect participation could benefit the farmers in general. Similarly, wheat, rapeseed-mustard complex futures and spot markets in Madhya Pradesh and Rajasthan appear to co-move and converge in the long-run. Hence, their futures can provide a liquid yet effective platform for the participation. However, coriander futures and spot market shows a departure from an expected outcome as futures and spot price co-integration has not been observed.

32 Farmers’ Participation in India’s Futures Markets: Potential, Experience, and Constraints
Tabl
e 4.
3: L
ong-
run
spot
and
futu
res
pric
e co
-inte
grat
ion:
Co-
inte
grat
ing
vect
or &
erro
r cor
rect
ion
coef
ficie
nts
Com
mod
itySa
mpl
e pe
riod
(no
of o
bser
vatio
ns)
Info
rmat
ion
spill
-ove
r bet
ween
spo
t and
futu
res
retu
rn in
the
shor
t-ru
nS t c
asto
r = α s,
f, t – 0.
8698
18* F t c
asto
r + ε
t(0
.081
53),
[t-st
at: -
10.6
688]
Cast
or s
eed
May
200
9 –
Augu
st 2
014
(151
5)
α s EC
T-0
.006
860**
(0.0
0411
)Pa
ram
eter
sSp
ot re
turn
(R
st)
Para
met
ers
Futu
res
retu
rn (R
ft)
α f, EC
T0.
0187
04* (0
.006
15)
α s,t-1
0.08
6404
* (0
.028
21)
α f,t-1
0.03
0832
(0
.028
51)
α f,t-1
0.19
1750
* (0.0
1903
)α s,t
-1α f,t
-2-0
.009
881
(0.0
1955
)α s,t
-2
α s,t-2
-0.1
4516
4*
(0.0
2717
)α f,t
-2-0
.037
708
(0.0
2929
)
0.19
4700
* (0.0
4227
)
-0.0
2836
8 (0
.040
70)
Cum
in
Febr
uary
200
5 –
Augu
st
2014
(282
8)
S Cum
in =
αs,f
, t – 1.
0026
23* F tc
umin +
αt
(0.0
1075
), [t-
stat
: -93
.304
4]Pa
ram
eter
sSp
ot re
turn
Para
met
ers
Futu
res
retu
rn
α sECT
-0.0
3492
2* (0.0
0391
)α s,t
-1-0
.081
356*
(0.0
2162
)α f,t
-10.
0566
40*
(0.0
2250
)
α f,ECT
0.03
5130
* (0.0
0944
)α s,t
-20.
0445
22*
(0.0
1978
)α f,t
-2-0
.021
646
(0.0
2361
)
α f,t-2
0.00
2742
(0.0
0978
)α s,t
-2
α f,t-1
0.17
7490
*
(0.0
0932
)α s,t
-10.
0588
51*
(0.0
5218
)
0.07
5487
(0.0
4773
)

33
Com
mod
itySa
mpl
e pe
riod
(no
of o
bser
vatio
ns)
Info
rmat
ion
spill
-ove
r bet
ween
spo
t and
futu
res
retu
rn in
the
shor
t-ru
nS t c
asto
r = α s,
f, t – 0.
8698
18* F t c
asto
r + ε
t(0
.081
53),
[t-st
at: -
10.6
688]
Whe
atJu
ne 2
005
– Ju
ly 20
13
(186
2)
S Whe
at= α s,f
, t – 0.
9942
80* F t,W
heat
+εt
(0.0
2230
), [t-
stat
: -44
.582
4]Pa
ram
eter
sSp
ot re
turn
Para
met
ers
Futu
res
retu
rn
α sECT
-0.0
3710
3* (0
.006
05)
α s,t-1
0.15
7187
* (0
.246
0)α f,t
-1-0
.073
741*
(0.0
2557
)
α f, EC
T0.
0199
06*
(0.0
0907
)α s,t
-2-0
.045
539
(0.0
2423
)α f,t
-2-0
.012
852
(0.0
2539
)
α f,t-2
0.03
0320
(0.0
1694
)α s,t
-2
α f,t-1
0.04
7761
* (0
.017
06)
α s,t-1
0.09
7410
* (0
.036
86)
0.02
7235
(0.0
3630
)
Rape
seed
-Mus
tard
De
cem
ber,
2004
– J
anua
ry
2015
(2
491)
S RM= α s,f
, t – 1.
0243
24* F t,N
R+ α t
(0.0
0180
)Pa
ram
eter
sSp
ot re
turn
Para
met
ers
Futu
res
retu
rn
α sECT
-0
.266
686*
(0.0
0864
)α s,t
-10.
0531
90*
(0.0
1508
)α f,t
-10.
0232
65
(0.0
2107
)
α f,ECT
0.01
5834
(0
.011
05)
α s,t-2
0.00
0976
(0
.015
01)
α f,t-2
0.03
9085
(0.0
2075
)
α f,t-1
-0.1
5479
5* (0
.015
47)
α s,t-1
0.00
5168
(0
.020
57)
α f,t-2
-0.2
1303
4* (0
.015
22)
α s,t-2
0.00
2252
(0
.020
48)
Chapter 4: Futures Market Efficiency in Price Discovery and Dissemination
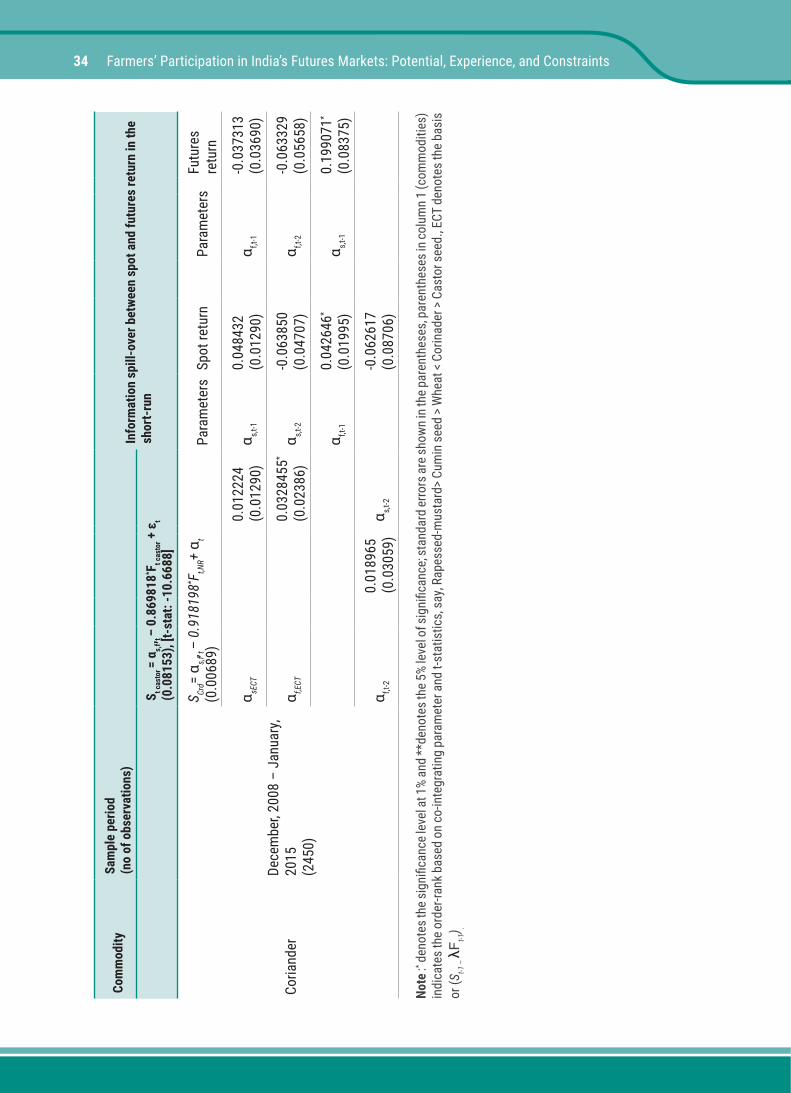
34 Farmers’ Participation in India’s Futures Markets: Potential, Experience, and Constraints
Com
mod
itySa
mpl
e pe
riod
(no
of o
bser
vatio
ns)
Info
rmat
ion
spill
-ove
r bet
ween
spo
t and
futu
res
retu
rn in
the
shor
t-ru
nS t c
asto
r = α s,
f, t – 0.
8698
18* F t c
asto
r + ε
t(0
.081
53),
[t-st
at: -
10.6
688]
Coria
nder
Dece
mbe
r, 20
08 –
Jan
uary
, 20
15(2
450)
S Crd= α s,f
, t – 0.
9181
98* F t,N
R+ α t
(0.0
0689
)Pa
ram
eter
sSp
ot re
turn
Para
met
ers
Futu
res
retu
rn
α sECT
0.
0122
24
(0.0
1290
)α s,t
-10.
0484
32
(0.0
1290
)α f,t
-1-0
.037
313
(0.0
3690
)
α f,ECT
0.03
2845
5* (0
.023
86)
α s,t-2
-0.0
6385
0 (0
.047
07)
α f,t-2
-0.0
6332
9 (0
.056
58)
α f,t-1
0.04
2646
* (0
.019
95)
α s,t-1
0.19
9071
* (0
.083
75)
α f,t-2
0.01
8965
(0
.030
59)
α s,t-2
-0.0
6261
7 (0
.087
06)
Note
:* den
otes
the s
igni
fican
ce le
vel a
t 1%
and
**de
note
s the
5%
leve
l of s
igni
fican
ce; s
tand
ard
erro
rs ar
e sho
wn in
the p
aren
thes
es, p
aren
thes
es in
colu
mn 1
(com
mod
ities
) in
dica
tes t
he o
rder
-rank
bas
ed o
n co
-inte
grat
ing
para
met
er a
nd t-
stat
istic
s, sa
y, Ra
pess
ed-m
usta
rd> C
umin
seed
> W
heat
< Co
rinad
er >
Cast
or se
ed., E
CT d
enot
es th
e ba
sis
or (S
t-1 –
λFt-1
) .
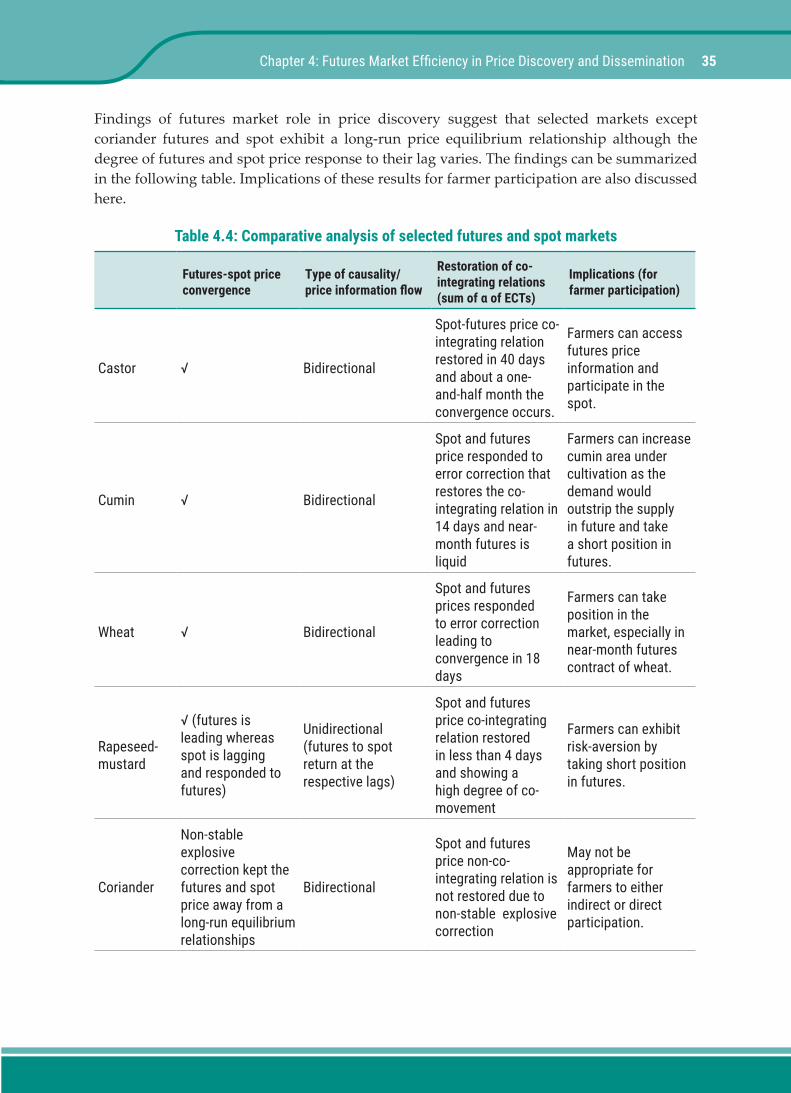
35
Findings of futures market role in price discovery suggest that selected markets except coriander futures and spot exhibit a long-run price equilibrium relationship although the degree of futures and spot price response to their lag varies. The findings can be summarized in the following table. Implications of these results for farmer participation are also discussed here.
Table 4.4: Comparative analysis of selected futures and spot markets
Futures-spot price convergence
Type of causality/price information flow
Restoration of co-integrating relations (sum of α of ECTs)
Implications (for farmer participation)
Castor √ Bidirectional
Spot-futures price co-integrating relation restored in 40 days and about a one-and-half month the convergence occurs.
Farmers can access futures price information and participate in the spot.
Cumin √ Bidirectional
Spot and futures price responded to error correction that restores the co-integrating relation in 14 days and near-month futures is liquid
Farmers can increase cumin area under cultivation as the demand would outstrip the supply in future and take a short position in futures.
Wheat √ Bidirectional
Spot and futures prices responded to error correction leading to convergence in 18 days
Farmers can take position in the market, especially in near-month futures contract of wheat.
Rapeseed-mustard
√ (futures is leading whereas spot is lagging and responded to futures)
Unidirectional (futures to spot return at the respective lags)
Spot and futures price co-integrating relation restored in less than 4 days and showing a high degree of co-movement
Farmers can exhibit risk-aversion by taking short position in futures.
Coriander
Non-stable explosive correction kept the futures and spot price away from a long-run equilibrium relationships
Bidirectional
Spot and futures price non-co-integrating relation is not restored due to non-stable explosive correction
May not be appropriate for farmers to either indirect or direct participation.
Chapter 4: Futures Market Efficiency in Price Discovery and Dissemination

37
Futures market’s role in price discovery has been examined in the previous chapter, and the analysis has thrown some light on the market efficiency, especially for castor seed, cumin, wheat, rapeseed-mustard complex, and coriander futures markets. The discussion here centers on the futures market inclusion for farmer direct and indirect participation. Now, the analysis of the secondary data necessitated the sampling plan for field survey and interactions with farmers and various formats of farmer organizations and market agencies, viz. development organizations, Producer Companies (PCs), spot and futures market traders, processors including flour miller, oil processor and ginning mill, APMC officials including auction writer, auctioneer, market Secretary and Chairman, commodity exchange officials and futures market broker or member, warehousing companies and collateral management agencies. The first field survey had been initiated in December, 2014 and ended in the first week of September, 2015 with a total of six waves. The survey was a blend of convenience and purposive sampling that had drawn near about two hundred sample farmers of various categories. States selected for the survey were Gujarat, Rajasthan, and Madhya Pradesh. Before the field data collection, some discussions were held with some officials of the nodal agency for agricultural marketing like National Institute of Agricultural Marketing and views on the scope for and nature of farmer participation in futures had been considered. The rationale for a survey design and sampling plan is elaborated in the following section.
5.1. Survey Background and Data CollectionSix waves of field survey had been conducted in three states, namely Gujarat, Rajasthan and Madhya Pradesh. The rationale for selecting these states is explained here. There were some aggregation efforts by development orgnaizations, for example, Aga Khan Rural Support Programme (India) and Self-Employed Women’s Association in Gujarat (already mentioned in literature) to mobilize a group of farmers in the commodity exchanges, National Commodity & Derivative Exchange and Multi Commodity Exchange during the perid 2008-2010. Also, some institutions have spurred up the aggregation efforts for farmer participation, for example, Development Finance/Microfinance arm of Institute of Financial and Management Research
CHAPTER 5
Field Survey, Observation and Farmer Profile
38 Farmers’ Participation in India’s Futures Markets: Potential, Experience, and Constraints
and Cardinal Edge, a consulting firm. Though the initiative had not sustained, interaction with farmers and NGOs offered a ground for contextual familiarity, that is, how the aggregator mobilized farmers in the market and what impact it had on farmer income and socio-economic wellbeing, among other indicators. In 2008, sixty-seven farmers had been trained to participate in the cotton futures market of MCX. AKRSP (I) and cotton farmer federation catalyzed this initiative. Sajjata Sangh, a network of Non-Government Organizations (NGOs) conceptualized the idea of farmer participation in 2005. Each group comprised of three-four farmers having different landholdings, assets including the usage of cell phone, however, homogeneity was maintained insofar as risk preference attitude and crop sowing decision was concerned. Farmer took a combination of short and long positions in twenty-six cotton futures lots of 4 metric tons each. The average futures price was in the range of INR 471.35 (sell position) - INR 495.08 a lot equivalent to 20 kg. National Bank for Agriculture and Rural Development (NABARD) had been associated with the project as a financial intermediary and reimbursed the margin loss of INR 123, 480 to farmer federation. However, due to lack of training or skill enhancement initiatives and inappropriate market timing coupled with global factors, the effort remained short-lived. So, the direct participation of farmers in India can only be understood from a few isolated cases (mentioned in Chapter 3).
Similarly, SEWA’s involvement had been noted in futures market awareness of farmers in that usage of mobile phone for real-time price dissemination helped a group of farmers from Ahmedabad, Mehsana, Vadodara and Surendranagar areas of Gujarat form spot price expectations and moderate marketing strategies in castor, cotton and guar seed. In Madhya Pradesh and Rajasthan, no such initiative has taken place yet. However, the participation of farmer in the forward market (launched by NCDEX at the end of 2014) has been noted. PCs, an emerging trend of farmer organizations, have been taking such initiative in association with their resource institutions. For example, PCs in Madhya Pradesh have started participating in forward soybean market while PCs in Rajasthan mobilized their member in coriander and black and Bengal gram forward markets. Notwithstanding these efforts, assessing the impact of participation in the market entails a policy formulation and concerted efforts of resource institutions/promoting agencies and Small Farmers’ Agribusiness Consortium (SFAC).
Developments in the realm of farmer organizations, market access and institutional participation have given opportunities for the conduct of field-based initiatives of farmer participation in forward/futures market across many pockets of the sampled states. In Gujarat, Northern and western regions, including Mehsana, Unjha, Kadi, Palanpur, Rajkot, Junagarh, Jetpur, and Surendranagar districts were covered in the study. In Rajasthan, Ajmer and Tonk districts were surveyed while Malwa region spanning Dewas, Ujjain, Agar-Malwa, Shajapur, Sirohi was covered during the field surveys held in mid of 2015 (see, survey areas in Figure 5.1). One hundred ninety-nine farmers were interviewed, and their responses were recorded on a schedule. For example, a regional classification of respondents may be useful for appreciating the context. Meanwhile, an aggregate profile of sampled farmers may be necessary for a meaningful analysis. Therefore, despite a regional categorization of farmers, we classify based on the land holdings, market awareness, and nature of the market participation. Also, their proximity to market agencies and level of satisfaction was recorded and analyzed. The survey
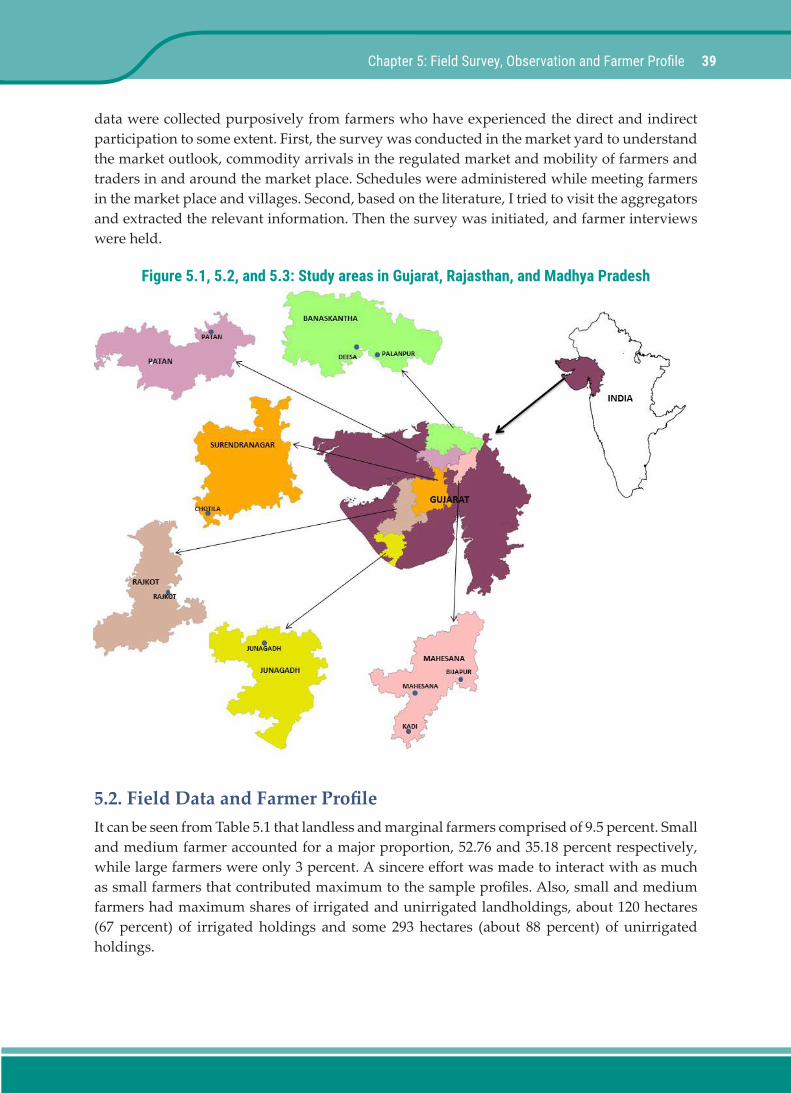
39
data were collected purposively from farmers who have experienced the direct and indirect participation to some extent. First, the survey was conducted in the market yard to understand the market outlook, commodity arrivals in the regulated market and mobility of farmers and traders in and around the market place. Schedules were administered while meeting farmers in the market place and villages. Second, based on the literature, I tried to visit the aggregators and extracted the relevant information. Then the survey was initiated, and farmer interviews were held.
Figure 5.1, 5.2, and 5.3: Study areas in Gujarat, Rajasthan, and Madhya Pradesh
5.2. Field Data and Farmer ProfileIt can be seen from Table 5.1 that landless and marginal farmers comprised of 9.5 percent. Small and medium farmer accounted for a major proportion, 52.76 and 35.18 percent respectively, while large farmers were only 3 percent. A sincere effort was made to interact with as much as small farmers that contributed maximum to the sample profiles. Also, small and medium farmers had maximum shares of irrigated and unirrigated landholdings, about 120 hectares (67 percent) of irrigated holdings and some 293 hectares (about 88 percent) of unirrigated holdings.
Chapter 5: Field Survey, Observation and Farmer Profile

40 Farmers’ Participation in India’s Futures Markets: Potential, Experience, and Constraints
While the distribution of unirrigated land is positively skewed to small and medium category of farmers, the distribution of irrigated holdings is positively skewed to only large farmers. For example, large farmers owned about 30 percent of irrigated and about 11 percent of unirrigated land.

41
Table 5.1: Sample farmers’ distribution
Farmer’s category(based on landholdings) Sample farmers Irrigated (ha) Unirrigated/rainfed
(ha)Total landholdings
(ha)
Landless & marginal (<1 ha) 9.05 5.07 (2.84) 6.03 (1.79) 11.10 (2.15)
Small (1-2 ha) 52.76 36.60 (20.47) 121.54 (36.12) 158.14 (30.69)
Medium (2-10 ha) 35.18 83.66 (46.78) 172.78 (51.35) 256.44 (49.77)
Large (>10 ha) 3.02 53.50 (29.92) 36.10 (10.73) 89.60 (17.39)
Total (N = 199) 100 178.83 (100) 336.45 (100) 515.28 (100)Note: The figures in parentheses indicate the proportion of the sample farmers and their landholdings as a percentage of total
Table 5.2: Socio-economic/demographic profile of sample farmers
Farmer’s category(based on landholdings)
Farm machinery ownership
Livestock ownership
Income level (from farming; in rupees)
Education levelpercent matriculate)
Landless & marginal (<1 ha) 6.90 7.14 30000-100000 14.93
Small (1-2 ha) 31.03 53.30 55000-250000 40.30
Medium (2-10 ha) 53.45 36.26 50000-1175000 38.81
Large (>10 ha) 8.62 3.30 435000-1575000 5.97
Total (N = 199) 100 100 100
Among the sample farmers, very few farmers were share croppers or cultivate leased land. Some large farmers lease out their land sometime, however, the incidence was not very significant. Apart from the land ownership, profiling of farmers considered some socio-economic variables, namely farm machinery and livestock ownership, income level, education level, among others. It is evident from Table 5.2 that only 7 percent farmers in the landless and marginal category owned tractor/power tiller and livestock while small and medium farmers held maximu shares of farm machinery and livestock, 84 percent and 90 percent, respectively. About 40 percent of small farmers had passed the matriculation or the above, whereas about 39 percent of medium farmers were literate. As the sample of large farmers is relatively low, the distribution of asset and income does not show any significant variability. Income level of farmers is an important economic variable in the study. 9 percent of landless and marginal farmers annually earned between INR 30,000 and INR 100,000 and about 53 percent small farmers observed a range of INR 55,000 to 250,000 a year. However, the income distribution is largely skewed to medium farmers, accounting for 35 percent in the samples. It is worth noting that farmer income is attributed to land management, cropping intensity, crop management, availability of family labour and crop marketing. Given the sample farmers, eighty-two (41.21%) had been directly taken part in forward/futures market whereas the remaining one hundred seventeen (about 59%) farmers indirectly participated. Indirect participation is akin to the usage of futures price information for developing marketing strategies and moderating agricultural investments. In other words, information access from the price ticker board or SMS-based service through a mobile service provider, for example, Reuters Market Light service has been available in some pockets of Gujarat. One hundred sixty-two farmers heard about the existence of futures
Chapter 5: Field Survey, Observation and Farmer Profile

42 Farmers’ Participation in India’s Futures Markets: Potential, Experience, and Constraints
market or accessed to real-time forward/futures price information through the available objects as mentioned. While ninety farmers (about 50%) adopted the mobile phone primarily for accessing price information, the rest is yet to acquire smart or android phone as can be seen from Table 5.3.
Table 5.3: Farmer’s profile based on the market awareness and participation (N =199)
Futures market participation by farmers (mobilized by NGOs/FPCs)
Observation (%)
Market awareness
(determinant of financial
literacy)
Observation(%)
Access to mobile phone
for price information
access
Observation(%)
Direct – trading/hedging 41.21 Yes 81.41 Holder 49.75
Indirect – futures price information access
58.79 No 18.59 Non-holder 50.25
Farmer association with the institutions/market agencies has been felt important to explore, in addition to their satisfaction level with the associated organizations. Their responses were recorded on a 1-5-point likert scale with 5 being “very high” or “very satisfied” and 1 being “very low” or “very dissatisfied”. The scale was administered in the schedule and filled during a face-to-face interview.
Table 5.4A: Farmer association with institutions – Panel A (N =199)
Degree of association NGOs/Coops/PCs APMC
officials Traders Input suppliers
Futures market Brokers
Warehousing Companies
Very high 25.63 6.03 10.05 0.50 0.50 1.01
High 51.76 57.29 47.74 12.06 2.01 2.51
Medium 11.56 31.16 34.67 46.23 5.53 6.53
Low 6.03 2.01 2.51 33.17 46.23 20.60
Very low 5.03 3.52 5.03 8.04 45.73 69.35Note: Responses recorded on a 1-5-point scale (in ascending order; very high=5, very low = 1)
Table 5.4B: Farmer satisfaction level with institutions – Panel B (N =199)
Degree of satisfaction
NGOs/Coops/PCs
APMC officials Traders Input
suppliersFutures Brokers
Warehousing Companies
Very satisfied 13.07 2.51 3.52 0.50 0.50 1.01
Satisfied 54.77 38.69 25.13 8.04 1.01 0.50
Indifferent 16.58 48.74 56.28 34.67 5.53 4.02
Dissatisfied 9.55 6.53 10.05 37.6 29.65 7.04
Very dissatisfied 6.03 3.52 5.30 19.10 63.32 87.44
Note: Responses recorded on a 1-5-point scale (in ascending order; very high=5, very low = 1)

43
It is apparent from Table 5.4A that farmer association with cooperatives or NGOs or PCs appeared to be significant, more than 75% of sample farmers’ response fall in favour of these organizations. However, about 57% farmers have shown a high degree of association with APMC/regulated market officials, namely Secretary, and Chairman and about 48% farmers used to visit APMCs to sell their produce through traders in the market. Sometime, farmers contact traders for credit and agricultural inputs and involve them in family occasions or any decision making. They had minimal association with agricultural input companies, brokers, and market infrastructure institutions. Therefore, farmer access to these agencies or institutions has been limited as their activities are central to urban places in most cases. Similarly, farmer level of satisfaction in terms of services rendered or attention to their queries, cooperatives/PCs appeared to gain salience as can be seen from Table 5.4B. About 55 percent sample farmers were satisfied while associating with the development organizations and cooperatives/PCs.
The degree of farmer association and the level of farmer satisfaction with producer organization or market agencies can be presented in a panel of descriptive statistics below (Table 5.5). The findings do corroborate with the contingency table 5.4A & 5.4B. In both cases, it is evident that farmers’ level of satisfaction increases when they continue to build trust in producer organization because of patronage and associated services they receive, for example, Dairy Cooperative Societies have cemented the association with farmers and exhibited a positive level of satisfaction reflected in the trust between members and the society (James and Sykuta, 2006).
Table 5.5: Descriptive statistics of farmers’ degree of association and satisfaction level
Farmer association (degree) Farmer satisfaction (level)
Mean Standard deviation Mean Standard
deviation
NGOs/Coops/PCs 3.87 0.126 3.593 0.229
APMC officials 3.60 0.783 3.301 0.778
Traders 3.55 0.897 3.120 0.826
Input suppliers 2.64 0.816 2.331 0.894
Futures market brokers 1.65 0.721 1.457 0.694
Warehosuing service providers 1.45 0.808 1.206 0.630Source: Computed by the author from survey data
The field observations of farmer profiles can be summarized to understand some pattern of their market access and mobility. Most of the sample farmers harped on a single cropping season as they do not have any access to irrigation system. The dry land or rainfed agriculture has been means for livelihood generation. As a cushion to the income shock, they reared livestock and sold the milk to private or co-operative dairy societies. For instance, dairy co-operative societies in Gujarat have been successful and protect farmers against the crop failure. It may be interesting to note some of previous filed studies conducted in Gujarat to draw a parallel strand to the present study. In 2007-2008, a pilot project was commissioned at Chotila taluka of Surendranagar district in Gujarat where cotton is grown as a cash crop. MCX took the initiative
Chapter 5: Field Survey, Observation and Farmer Profile
44 Farmers’ Participation in India’s Futures Markets: Potential, Experience, and Constraints
in association with AKRSP (I), NABARD, and Cardinal Edge to promote the participation of Farmers’ Federation in cotton futures market to hedging the price risk. The focus group for the pilot project comprised 67 farmers from five-six villages of the taluka. In the group, 76 percent were small and marginal and the remaining 24% were semi-medium farmers. 87% of the contact farmers grow only cotton (varieties of BT & Shankar 6/Kalyan V797) in the Kharif season, about 45% of the farmers keep their land fallow in the Rabi season while 49% of them sow wheat and cumin and fodder. A high degree dependence on cotton perhaps necessitated the adoption of financial risk instrument (MCX, 2008).
Access to cell phone played a role in improving the market access that several research studies claim (Aker and Ksoll, 2015). Though the claim may be empirically valid for Gujarat farmers, Rajasthan and Madhya Pradesh farmers are yet to exploit the economies of scale and scope using mobile technology. In general, they obtained price information from the local market or fellow farmer. While half-of-the sample had an access to mobile phone, the remaining fifty percent farmers relied on social media like TV, Radio, and local newspaper. Among the mobile users, thirty percent did not own a smartphone. So, this does not make a difference between have and have not in the mobile ownership. Smart phone penetration has been minimal yet in villages and the service provider, Reuters Market Light needs to transmit both futures and spot prices through an SMS-based service. A few farmers opined that price information access is often a costly affair. They need to visit the local market, but prices written on the information board sometimes are not legible or easy to understand. Very few APMCs or regulated markets installed an electronic price ticker board or sometimes the board was not operational due to lack of broadband service or VSAT facility in the market yard. This infrastructural problem might contribute to the reason for minimal presence of futures market brokers or members near villages or semi-urban places.
It is worth noting that though farmers had produced some amounts of marketable surplus, they did not have much access to storage or warehouses. The skewed distribution of storage structures has further worsened the situation. With private players entering the warehousing and logistics industry, government warehousing corporations need to renovate their old structures for an improved storage and preservation. Farmer organizations should be provided with adequate storage space for cotton, soybean, wheat, castor, cumin, coriander, among others. Provisions of silos and bag storage with scientific storage practices can link the farmers with financial institutions for commodity-based structured financing.
Farmers occasionally, approached KVKs or draw the support from Kisan Call Centers on crop management and marketing intelligence. While these facilities are primarily made for farmer benefits, their service delivery is yet to be effective. Agricultural Technology Management Agency in association with development organizations/NGOs and commodity exchanges can provide extension and technical support to farmer organizations and enhance their market access.

45
World Bank (WB) in association with the Reserve Bank of India (RBI) in early 2000s recognized the absence of risk mitigation measures in developing countries and proposed a roadmap for an institutional framework dealing with market infrastructure related to warehousing, commodity financing, and risk management products. The International Task Force on Commodity risk Management of the WB recommended for creating an international intermediary that would facilitate transactions between the service providers of price insurance instruments and potential users of such instruments in developing countries, especially farmer organizations, processors, traders.
From the recommendations, it was understood that farmers being a key stakeholder in the value chain remain excluded from utilizing the risk insurance products and their involvement in the risk management markets such as forward/futures markets has had necessitated the involvement of aggregator. In India, a few aggregation efforts were made to connect the farmers with the market although almost all the interventions had not been sustained. Some shortcomings of the intervention may be attributed to the skewed distribution or supply of risk management products and services, lack of adequacy in market timing and understanding of trading mechanics.
The importance of education and training for farmers and local intermediaries has to be emphasized. For instance, inadequate training and education of small farmers, extension offciers, and local bank managers explains why the Canadian Cattle Option Pilot Programme was not successful. Also, the small landholding coupled with inadequate quantity for the purpose of hedging on the exchange delimits the farmers’ capacity. These issues require a multi-stakeholder approach towards enabling the farmers to hedge their price risk through various instruments. The concept of aggregation can be utilized to overcome the shortcomings of quantity adequacy related to the financial instruments. In addition, the aggregation initiative can involve exchanges, brokers, volunary orgnaizations and financial institution for training and capacity building, financial arrangements, knowledge support and handholding to ensure effective hedging (MCX Report, 2008: 18-19).
A successful intervention of farmer participation in futures market entails the regulatory support, policy support, and institutional arrangements. This chapter draws on the experiences of aggregators in derivatives markets in general and presents a couple of case studies depicting the international and national scenarios in the context of farmer participation (MCX, 2008). This
CHAPTER 6
Institution in Aggregation Effort and Farmer Participation
46 Farmers’ Participation in India’s Futures Markets: Potential, Experience, and Constraints
chapter can help understand the exchange-related structural issues in aggregation efforts and feasibility of farmer participation in the market as mentioned in one of the research objectives.
6.1. Case Studies – Global ViewThe following isolated case studies cover a detailed description of the institutional structure adopted by aggregators to facilitate the farmer participation. The contracts on various commodity exchanges were utilized by farmer organizations and representatives to price risk management. In some areas, the coverage was more than 60 percent of the production area. For example, on Paris Bourse SA in France, contracts on rapeseed, introduced in 1994 have been utilized by co-operatives and processors and covered 60% of European production.
The experience of Guatemala’s and Nicaragua’s coffee sector demonstrated the viability of linking small farmers with derivative instruments. In 1994, the National Coffee Growers’ Federation called ANACAFE, a private not-profit organization, launched a coffee credit system to improve the access of coffee planters to institutional finance. The use of risk management instruments was necessary for participation in the credit programme. This provision reduced the credit and market risks for banks and allowed them to provide credit to coffee farmers at lower interest rates, equivalent to interest rate savings for farmers of over 10% of the loan value. ANACAFE was a facilitator in the credit linkage.
ANACAFE rendered training to farmers in various pockets related to the calculation of production costs, understanding of agricultural credit market mechanism, and interest rate risk management. It also provided market intelligence to farmers on a continuing basis – it distributed beepers for transmitting futures price signal to the farmers.
ANACAFE’s extension officials evaluated the production capacity potential of growers and assisted them with the documentation work for bank funding. The bank used to approve the loan but disbursed the finance after the farmer obtained a price risk mitigation measure such as fixed-payoff forward sale, the sale of a futures contract, purchase of put options, etc. Farmers associated with ANACAFE could participate in the programme and proportion of coffee farmers obtained hedging had been increased to 20% in the late nineties as a consequence of the said intervention.
In Nicaragua, the involvement of market authority in facilitating the market linkage between small farmers and coffee bulk buyers enhanced the farmer price realization (Coe, 2006).
In Canada, the Cattle Option Pilot Programme had offered a customized option contract to cattle ranchers/owners. The contract was available in smaller volumes than is usual in the option contract. The Farmer Credit Corporation initiated the programme, and Cargill Investors Services Limited exercised the option as a writer. The programme was aimed to cover the price risk and exchange rate risk. Notwithstanding this effort, low participation rate and lack of producer interest had discontinued the initiative.
47
In Mexico, an Agricultural Products Option Programme (APOP) on cotton was introduced in 1994 and later, was extended to corn, wheat, sorghum, and soybean. The programme allowed producers to offload their price risks using commodity options floated on the erstwhile Chicago Board of Trade and the New York Cotton Exchange. The implementing body, ASERCA, was instrumental in connecting the producers and US brokers, and subsidized part of the option premium. ASERCA paid 50% of premium charges, and the farmer had to bear 5 to 8% of the strike/exercise price of the option. Farmers were directed to deposit a proportion of option premium in a fund called FINCA and profits by exercising the option got accumulated in that fund. APOP functioned as price insurance to farmers, and the option contracts accounted for about 11% of total production of wheat and 1% of corn since many corn growers were small.
Under the FAIR Act of 1996, a Dairy Option Pilot Programme was launched in the US. It gave milk producers an opportunity to buy option contracts on a maximum of 0.60 million pounds of milk. Premium charges were shared between producers and the government, for example, USDA paid 80% of the premium of each option as well as broker fees of $30 per option.
In Ethiopia, the creation of commodity exchange and formal monitoring and enforcement has affected social relations and trust in sesame commodity value chain (Meijerink et al., 2014). Traders broaden trading network and seek to reduce the degree of association with the known trading entities. Farmer organizations get access to reliable price information to rationalize their marketing decisions (Sitko and Jayne, 2012).
6.2. Cases from India: Intervention of NGOs and PCs in Forward/Futures While the African and European countries experience the aggregations efforts in the early nineties, India has experienced the wave in late 2000s. Some of these interventions are elaborated in this section. It may be noted that the efforts were pronounced in forward/futures instrument as other instruments were not introduced till then, even option and exotic products are yet to be launched in India.
A multi-stakeholder pilot project was initiated in India during 2007-2008 to promote the farmer participation in the cotton futures market. The stakeholders were Sajjata Sangh (network of NGOs in Gujarat), AKRSP (I), MCX, NABARD, Cardinal Edge Management Services Limited, and Farmer’s Federation from Chotila taluka of Surendranagar district in Gujarat. The project was aimed to help the sample farmers (67) in market information access, awareness creation, exposure to hedging mechanism. With a robust institutional structure, this also attempted to link farmers with professional service providers and commodity exchange among others along the value chain. The project was initiated with a workshop on cotton futures organized by Sajjata Sangh in early 2007. Ten member NGOs attended the workshop. MCX officials introduced the concept of futures trading.
The initial queries and concerns were primarily related to non-availability of BT Cotton contract on the exchange. The farmer representatives demanded the introduction of BT cotton contract, to introduce the commodity futures among their farmers. To this effect, Cardinal Edge along with MCX alleviated their fears regarding the quality constraints. The correlation in spot prices of BT
Chapter 6: Institution in Aggregation Effort and Farmer Participation

48 Farmers’ Participation in India’s Futures Markets: Potential, Experience, and Constraints
cotton and futures prices of Kapas contract was shown to the farmer representative. Though, in the meeting it was decided to conduct a pilot while utilizing Kapas contract for understanding the efficacy of commodity futures for price risk management. Sajjata Sangh conceptualized a pilot with one its member NGOs to participate in the initiative. AKRSP (I) working with Surendranagar based cotton farmers assumed the role of the aggregator to implement the pilot. To introduce the initiative among its farmer member, AKRSP (I) along with MCX introduced the concept to 900 farmers in one of its general meetings. Subsequently, a pilot was discussed with AKRSP (I) promoted farmers’ federation at Chotila (MCX Report, 2008: 19).
AKRSP (I) took the initiative to pilot the project in association with exchange and consulting firm. The initiative was of unconventional in nature and did not fall within the regular scope of developmental intervention of the NGO. The intervention had sought to fund from a core development finance institution that can be instrumental in catalyzing an efficient and transparent price discovery mechanism for agricultural produce in India. With this proposition, AKRSP (I) in consultation with Cardinal Edge drafted a funding proposal to NABARD, and they discussed the initiative with NABARD in mid of 2007. The funding was released in November 2007, and the funds were transferred to the federation’s account in December 2007. A provision for recruiting a technical service provider for disseminating regular market research inputs was made in the proposal. However, the timely recruit had not taken place and therefore, MCX had agreed to plug the gap with its in-house Knowledge Management Group.
Though, considering the technical complexities involved and AKRSP (I)’s inability to undertake the necessary activities, Cardinal Edge agreed to offer technical and administrative assistance to the project. The technical knowledge was accessed from MCX and conveyed to AKRSP (I). To create awareness among the member farmers, MCX agreed to support AKRSP (I). A provision for four training workshops was made in the proposal to provide awareness of the functioning of the market and commodity futures. These workshops were held at Chotila (MCX Report, 2008: 21).
Opening the trading account (Demat) is necessary for trading. So, Cardinal Edge in consultation with MCX approached Religare and Kotak Securities to open the trading account. The initial attempt was to open the account in the name of AKRSP (I) though the legal status of the NGO could not allow them to engage in any profit-oriented activity. Because of that situation, farmers’ federation opened the trading account on behalf of the members. Lack of PAN card and address proof raised issues of concern, and the brokers had limited understanding in opening the account for farmer organizations. Due to lack of clarity among brokers, the process took one month. Kotak Securities facilitated the opening of the trading account at the end of 2007. Also, the workshop held in AKRSP (I)’s field office at Chotila aimed at educating farmers to do trade and render them market and trade information. Besides the farmer education, the workshop stressed the contract specification and reliability of contract performance and imposed social sanctions against the willful default in honoring the contract obligations.
The cotton (Kapas) futures contract on MCX was identified as a suitable contract for hedging the price risk of cotton. Adopting a homogenous-group based approach among 67 interested farmers, the initiative covered five villages of Chotila, namely Mokasar, Lukchukia, Rajavar, Kheridi, Kundhara, among others and one representative was selected from each village to decide on the contract position on the exchange at the behest of the associated members. The farmers were divided into sub-groups of 3-4 for meeting a minimum contract/lot size of 4 MT. In all the sample villages, information board was placed. AKRSP (I) field office collected the price and market information from the broker, Cardinal Edge, MCX, web-link like commodities

49
control and passed to the Federation for further dissemination. The quality of information and respective decision of the member was aggregate at Federation that communicated the necessary actions to the broker or the AKRSP (I) representative dealing with the broker firm.
Considering the volumes, open interest (number of contracts outstanding in end of every trading day) and contract specifications, the federation took a short (sell) position for 26 lots of Kapas V797 contract of MCX. To account for quality and price differences between the Shankar 6/10 cotton variety cultivated in the project area and the V-797 Kalyan variety, a hedge ratio (size of futures contract needed to hedge the exposure in spot) of 1.20 was determined7. Futures trading in Kapas contract started on August 16, 2007. The low and high trade price ranged between INR 403.90 and 501.03 a 20-kg lot with an overall dispersion of 25%. The volatility in cotton prices has been attributed to demand and supply in a global context.
Farmers’ Federation had taken short positions for 26 lots on MCX platform. The average price for the short position was INR 471.35 whereas the average price for long positions was INR 495.08. The deficit in mark-to-market margin is INR 123,480. The deficit is primarily due to the continuous rise in prices since December 2007. In the wake of those conditions, though the farmers had been able to lock in their demand price on the MCX platform, however, the rising prices have resulted in the net deficit (MCX Report, 2008: 26)
To evaluate the outcomes of the aggregation effort, Cardinal Edge conducted a survey and focus group discussion. The survey included required items to bring about the pre-post and with-without scenarios related to the intervention. The control group comprising 60 farmers of Amreli and Surendranagar districts was allowed for With-Without assessment. Findings of the impact assessment survey brought some important observations.
The average price realization of focus group farmers was INR 2541 a quintal which is around 3.1% more than the average price realization of INR 2460 a quintal of control group farmers…around 38% of the overall cotton produce of focus group farmers was sold after the month of November as compared to 27% of the overall cotton produce of control group farmers…one of the major benefits expressed by the focus group farmers was their better bargaining power with traders due to higher awareness of futures prices and cotton market developments (MCX Report, 2008: 3).
A similar type of intervention took place in four districts of Gujarat, namely Ahmedabad, Vadodara, Mehsana, and Surendranagar during the period 2007-2009. About 108 villages were selected for the intervention. However, the project was to elicit information about the farmers’ price expectation and attitude towards futures price adoption (Cole and Hunt, 2010. A multi-stakeholder project involved Centre for Microfinance of IFMR Trust, NCDEX, and SEWA to undertake the initiative. The intervention had two components: price information dissemination and farmers’ training. To provide price information, SEWA had installed boards with spot and futures price information in a prominent location within each village.
While it was intended that these boards were updated weekly, initial compliance was not perfect, as it provide difficult to organize and monitor price information in many of the remote villages. In the second year, phone-camera based monitoring increased compliance to over 90% of villages per week, and no villages had a persistent problem with prices not being posted (Cole and Hunt, 2010: 6).
7The ratio was calculated on the basis of MSP Prices declared by the Government of India for the 2006-07 (Kharif Marketing Season), INR 1665 for Kapas V-797 and INR 2005 for Shankar 6/10).
Chapter 6: Institution in Aggregation Effort and Farmer Participation

50 Farmers’ Participation in India’s Futures Markets: Potential, Experience, and Constraints
The second component involved a series of training sessions, conducted by NCDEX. The curriculum was jointly development by the stakeholders involved in the intervention.
Participants were invited to a training session lasting approximately two hours, during which farmers received training about futures contracts and how futures prices can be used to make sowing decisions. In 2008, an informational video was shown. ..the training material explained exactly what a futures contract is including the specification of the contract, the obligations of buyers and sellers, and the measures exchanges take to ensure that counterparties cannot default…Farmers were told that futures prices may be helpful in forming price expectations, but also that the actual spot price at harvest would not likely be the same as the futures price at planting time. They were also taught how to use price expectations to inform planting decisions for different crops. Trainers used a series of strategies to facilitate farmers’ understanding of futures contracts. They followed a script that illustrated ideas using crops the farmers are familiar with and that included an interactive game using historical futures prices from one of the regional exchanges whose existence predates NCDEX…This game underscored the importance of futures as a guide to predicting harvest time prices and making sowing decisions (Cole and Hunt, 2010: 6).
The intervention started in early 2007 when SEWA conducted a baseline survey in 74 villages. The sample selection focused on farmers growing multiple crops for which futures price information was available. Within each village, SEWA had identified smallholder households involved in one of the three local crops, such as cotton, castor, guar seed for which liquid futures contracts existed. Farmers that cultivated all three crops were chosen first, followed by households that grew at least two of the crops. In some cases, it was necessary to select farmers that farmed only one.
Treatment status was a random assignment, after stratifying villages at the district level by share of farmers in target crops and literacy level. A follow-up survey was conducted in August 2007 prior to harvest time. In 2008, the remaining 34 villages were added and randomized into treatment and control groups. While the training was voluntary, over 90% of those in the treatment group attended once. NCDEX provided training in 2007 and 2008. In 2007, 82% of the treated farmers attended the training session and in the subsequent year, 60% of the farmers attended the training session.
Cole and Hunt (2010) observed that the information boards changed the sources for price information reported by farmers. Households relied more on the price information board, 65% in the treatment village, zero percent in the control village, and much less on other social media like radio, television, newspaper, and traveling to regulated market. The intervention also observed that the value information from futures markets is substantially greater if farmers do not have access to reliable and high quality spot price information. In general, relatively a less costly and readily scaled intervention had a positive impact on contact farmers’ attitudes and behavior affecting price expectations and investment decisions.
In the above two case studies, it is plausible to infer that AKRSP (I) and SEWA as aggregators tried to make the farmers acquainted with the futures markets commodities. However, lack of continuous support of the exchanges and financial institutions has not made the intervention sustainable, nor the farmers’ financial literacy has been enhanced to repeat the nature of participation – direct and indirect. Although MCX tried to link the farmers with Mentha oil and potato futures markets, there was no such aggregation effort observed in Uttar Pradesh
51
(Sahadevan, 2008). HAFED, a Haryana-based co-operative hedged on NCDEX wheat futures and locked-in a reasonable amount of profits (Berg, 2007). In recent times, Producer Companies or FPCs have taken the initiative to participate in the exchange-traded forward markets. For example, Krushi Dhan PC in Gujarat took a short position in castor forward contract; The PC in 2014 aggregated 10 tonnees of castor seed in each of 10 villages to sell and had trained around 100 farmers on sorting and grading. They used to deposit the castor seed to fetch a good return on the NCDEX-forward market. Similarly, PCs from Rajasthan and Madhya Pradesh have initiated the member-participation in soybean and forward gram markets obtaining an institutional membership at a reasonable price. PCs being a new variant of farmer organizations have already received attention from the lead agency, SFAC. In 2002, the farmer company obtained a legal status as a fourth corporate entity through necessary amendments to India’s Companies Act, 1956 (See, Singh, 2008). Up until now, about 480 entities have been promoted, and some of them have harnessed the economies of scope and scale in local markets. It may thus be apparent that PCs can be an effective institutional channel to promote the member-producer participation in the exchange-traded forward/futures markets (Singh and Singh, 2014). However, adequate training is necessary to PCs for acquiring the required skill-sets or domain expertise for forward/futures market participation.
Institutional roles in aggregation efforts or mobilizing of farmer participation in the forward/futures market has been understood to some extent. As interventions were pilot in nature, the cases of aggregation efforts discussed above observed an isolated intervention in the selected commodities markets. Orientation, competencies, scale of operations, and interactions with the market and state could be a few determinants of aggregator that might sustain farmer participation in the market – be it direct or indirect. However, while interacting with several PCs during the field survey in the selected states, member – producers expressed their concern for the variety of contract, contract size, and margin money – that exchanges imposed. In many cases, contract remained illiquid, for example, cotton. The variety of cotton chosen for futures trading is Shankar or Kalyan on the concerned exchange, while Gujarat farmers grow Bt in large proportion and local variety in remaining land. They sell Bt at premium in local market (procured by Sumiter India Organics) and remain reluctant to enter the futures as local variety contract often yields poor realization. Similarly, in Madhya Pradesh, soya market has been well mature as compared to soya futures. PCs have been in search of liquid soy forward/futures contract that should be an area of concern to exchanges and regulatory authorities.
6.3. Demand, Supply and Distribution of Futures Trading ServicesWhile the intervention of institutions in aggregation efforts has not been significant yet in India, demand environment for farmer participation needs to be explored. Also, exchange related issues concerning supply or distribution of trading terminal and broker’s service should be considered. Therefore, the following section discusses the factors related to demand; supply and distribution of futures trading services (see Annexure 4).
In the questionnaire schedule, some items were generated to assess an effective demand for participation, similarly, items were considered for supply and distribution of trading services
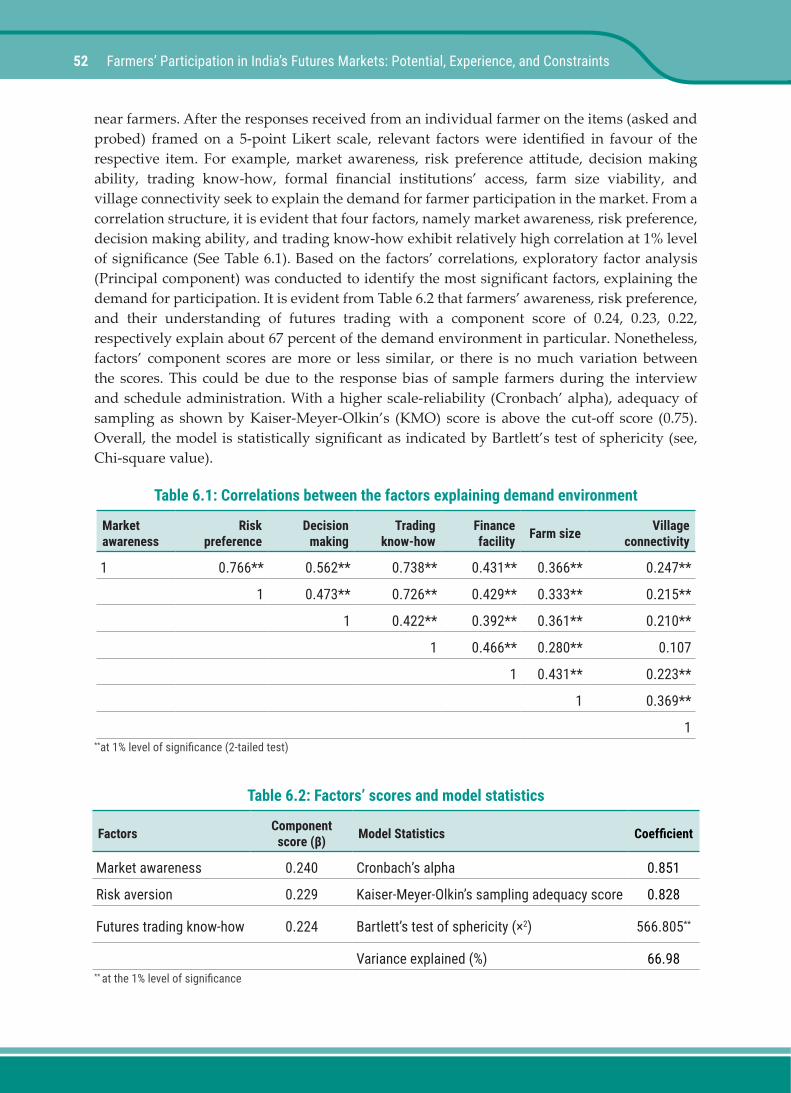
52 Farmers’ Participation in India’s Futures Markets: Potential, Experience, and Constraints
near farmers. After the responses received from an individual farmer on the items (asked and probed) framed on a 5-point Likert scale, relevant factors were identified in favour of the respective item. For example, market awareness, risk preference attitude, decision making ability, trading know-how, formal financial institutions’ access, farm size viability, and village connectivity seek to explain the demand for farmer participation in the market. From a correlation structure, it is evident that four factors, namely market awareness, risk preference, decision making ability, and trading know-how exhibit relatively high correlation at 1% level of significance (See Table 6.1). Based on the factors’ correlations, exploratory factor analysis (Principal component) was conducted to identify the most significant factors, explaining the demand for participation. It is evident from Table 6.2 that farmers’ awareness, risk preference, and their understanding of futures trading with a component score of 0.24, 0.23, 0.22, respectively explain about 67 percent of the demand environment in particular. Nonetheless, factors’ component scores are more or less similar, or there is no much variation between the scores. This could be due to the response bias of sample farmers during the interview and schedule administration. With a higher scale-reliability (Cronbach’ alpha), adequacy of sampling as shown by Kaiser-Meyer-Olkin’s (KMO) score is above the cut-off score (0.75). Overall, the model is statistically significant as indicated by Bartlett’s test of sphericity (see, Chi-square value).
Table 6.1: Correlations between the factors explaining demand environment
Market awareness
Risk preference
Decision making
Trading know-how
Finance facility Farm size Village
connectivity
1 0.766** 0.562** 0.738** 0.431** 0.366** 0.247**
1 0.473** 0.726** 0.429** 0.333** 0.215**
1 0.422** 0.392** 0.361** 0.210**
1 0.466** 0.280** 0.107
1 0.431** 0.223**
1 0.369**
1**at 1% level of significance (2-tailed test)
Table 6.2: Factors’ scores and model statistics
Factors Component score (β) Model Statistics Coefficient
Market awareness 0.240 Cronbach’s alpha 0.851
Risk aversion 0.229 Kaiser-Meyer-Olkin’s sampling adequacy score 0.828
Futures trading know-how 0.224 Bartlett’s test of sphericity (×2) 566.805**
Variance explained (%) 66.98** at the 1% level of significance

53Chapter 6: Institution in Aggregation Effort and Farmer Participation
Supply-side factors include futures trading terminal, broker services, and futures contract information board. Correlations between these factors are same, that is, the correlation between the trading terminal and broker service is 0.55 whereas the correlation between the trading terminal and futures contract information is 0.56. Similarly, broker service and contract information has been 54.9% correlated with 1% level of significance (See Table 6.3). However, a factor analysis shows that futures contract information board (with a component score or β of 0.54) containing the specifications (NCDEX/MCX forward/futures contract) is likely to explain the supply side of farmer participation more than that of trading terminal and broker service (0.303 & 0.354). But the three factors in association seek to explain about 70% of the model variance. Scale reliability is moderate, and the sampling adequacy score (KMO’s) is slight below the cut-off score. Nonetheless, the model’s goodness of fit is statistically significant (See Table 6.4).
Table 6.3: Correlations between factors affecting the supply-side of farmer participation
Trading terminal Broker service Futures contract information board
1 0.553** 0.559**
1 0.549**
1 **at 1% level of significance (2-tailed test)
Table 6.4: Factors’ score and model statistics
Factors Component score (β) Model Description & Statistics Coefficient
Futures trading terminal availability 0.303 Cronbach’s alpha 0.773
Broker/dealer services and fees 0.354 KMO’s sampling adequacy score 0.701
Futures contract information board (display)/price display ticker board 0.538 Bartlett’s test of sphericity (×2) 163.987**
Variance explained (%) 69.94 ** at the 1% level of significance
Table 6.5: Correlations between factors explaining distribution of futures trading services
Broker offices
Awareness camp
Exchange official visit
Trading terminal
Regulated market officials
Trading account opening
Exchange-accredited warehouses
Loss recovery
1 0.706** 0.632** 0.524** 0.461** 0.543** 0.526** 0.173*
1 0.684** 0.592** 0.551** 0.601** 0.614** 0.095
1 0.649** 0.591** 0.582** 0.557** 0.017
1 0.459** 0.545** 0.557** 0.082
1 0.501** 0.532** 0.022

54 Farmers’ Participation in India’s Futures Markets: Potential, Experience, and Constraints
1 0.518** 0.033
1 0.288
1 **at 1% level of significance and * at 5% level of significance (2-tailed test)
Table 6.6: Factors’ scores and model statistics
Factors Component score (β) Model Description & Statistics Coefficient
Proximity to broker /dealer offices 0.795 Scale reliability (Cronbach’s alpha) 0.881
Awareness camp 0.840 KMO’s sampling adequacy score 0.897
Exchange officials training & visit 0.854 Bartlett’s test of sphericity (×2) 734.29**
Trading account opening/clearing services/access to post-harvest credit
0.800 Variance explained (%) 67.61
** at the 1% level of significance
Distribution of futures trading services is important for farmer participation (see Table 6.5). So, the factors were loaded from the items generated that are, namely broker offices, awareness camp, exchange official visit, trading terminal, regulated/APMC market officials intervention, trading account opening service and the broker’s role in the recovery of losses in extreme situation, exchange-accredited warehouses. Among these factors, broker offices, awareness camp, exchange and regulated market official’s intervention, trading account openings service, and exchange-accredited warehouses show relatively high correlation while the correlation between loss recovery and other factors is highly insignificant. It means that there is hardly any situation when farmer incurs a huge mark-to-market loss during the daily settlement. However, an exploratory factor analysis shows that broker offices (0.79), awareness camp (0.84), exchange official training and visit (0.85), and trading account opening service (0.80), among others significantly explain about 68% variance for distribution of futures trading service in general. With robust scale reliability (0.88), KMO’s sampling adequacy score is above the cut-off score, that is about 0.90.The m odel goodness of fit is statistically significant with Chi-square value of 734.3 as can be seen from Table 6.6.
The following pictorial presentation can establish a functional relationship between demand, supply and distribution and farmer participation in derivative markets. It can be inferred from findings that the intervention of aggregator or institutions should consider the extracted factors into account related to demand for participation, supply and distribution of futures trading services. A clear understanding of these determinants can help aggregators/farmer organizations establish a strong tie with the exchanges and regulatory authority for promoting farmer participation in the derivative markets. In other words, coupled with investigating futures market efficiency, an assessment of demand, supply, and distribution of risk management instruments could be necessary to sustain the intervention of producers and rationalize the institutional role in aggregation effort.

55Chapter 6: Institution in Aggregation Effort and Farmer Participation
Figure 6.1: Factors explained demand for participation, supply and distribution of futures trading services
58
awareness camp, exchange official visit, trading terminal, regulated/APMC market officials
intervention, trading account opening service and the broker’s role in the recovery of losses
in extreme situation, exchange-accredited warehouses. Among these factors, broker offices,
awareness camp, exchange and regulated market official’s intervention, trading account
openings service, and exchange-accredited warehouses show relatively high correlation while
the correlation between loss recovery and other factors is highly insignificant. It means that
there is hardly any situation when farmer incurs a huge mark-to-market loss during the daily
settlement. However, an exploratory factor analysis shows that broker offices (0.79),
awareness camp (0.84), exchange official training and visit (0.85), and trading account
opening service (0.80), among others significantly explain about 68% variance for
distribution of futures trading service in general. With robust scale reliability (0.88), KMO’s
sampling adequacy score is above the cut-off score, that is about 0.90.The m odel goodness
of fit is statistically significant with Chi-square value of 734.3 as can be seen from Table 6.6.
The following pictorial presentation can establish a functional relationship between
demand, supply and distribution and farmer participation in derivative markets. It can be
inferred from findings that the intervention of aggregator or institutions should consider the
extracted factors into account related to demand for participation, supply and distribution of
futures trading services. A clear understanding of these determinants can help
aggregators/farmer organizations establish a strong tie with the exchanges and regulatory
authority for promoting farmer participation in the derivative markets. In other words,
coupled with investigating futures market efficiency, an assessment of demand, supply, and
distribution of risk management instruments could be necessary to sustain the intervention of
producers and rationalize the institutional role in aggregation effort.
Figure 6.1: Factors explained demand for participation, supply and distribution of futures trading services
Farmer participation in forward/futures markets
Demand-side factors
Supply-side factors Distribution related
factors

57
Farmer participation in forward/futures markets has been minimal. However, the scope of participation can be of direct and indirect. The intervention of aggregator aimed to enhance a group-based participation, either through hedging or accessing futures price information from a reliable source. Chapter 6 elaborated on these efforts by considering a methodological advancement, for example, randomization and experimental trial design (Cole and Hunt, 2010) and pre-post and with-without analysis (MCX Report, 2008). Nevertheless, the likelihood or probability of farmer participation in the market that is linearly conditional on several exogenous or independent variables. The findings would help the practitioner and policy maker to understand how the demographic and techno-economic variables can explain the probability of farmer participation in the exchange-traded derivative markets. An institutional design of aggregation effort can indeed sustain the participation that might emerge from the analysis. This chapter throws some light on farmer responses of futures market adoption on a list of attributes and discusses some factors impeding and inducing their participation. A binary logit model is proposed and explained with regard to the endogenous and exogenous variables.
7.1. Futures Market Awareness, Benefits, and Issues of ConcernThe schedule recorded farmer responses in an administered 5-point scale (5 – highly significant and 1 – highly insignificant). The responses were collected in favour of some attributes associated with the futures market. These include, namely futures role in price discovery, profits/payoff, margin money requirement, nature of the contract, compliance issues related to participation, liquidity of the contract, risk of loss in trading, income variability reduction. It is evident from Table 7.1 that 45.23% of sample farmers agreed upon a significant role of futures in price discovery, while 49% farmers were indifferent or their responses were that futures role in price discovery is moderate. Futures market generates profits or payoffs significantly – 41% were concerned for whereas about 50% were indifferent. A majority of farmers, 60% of the samples were not aware of margin money requirement for entering the market. Nature of the futures contract can be standardized and customized – that 46% agreed and 34% did not agree. While most of sample farmers were not aware of “what is compliance” and “liquidity”, 43% of
CHAPTER 7
Constraints, Benefits and Scope of Farmer Participation
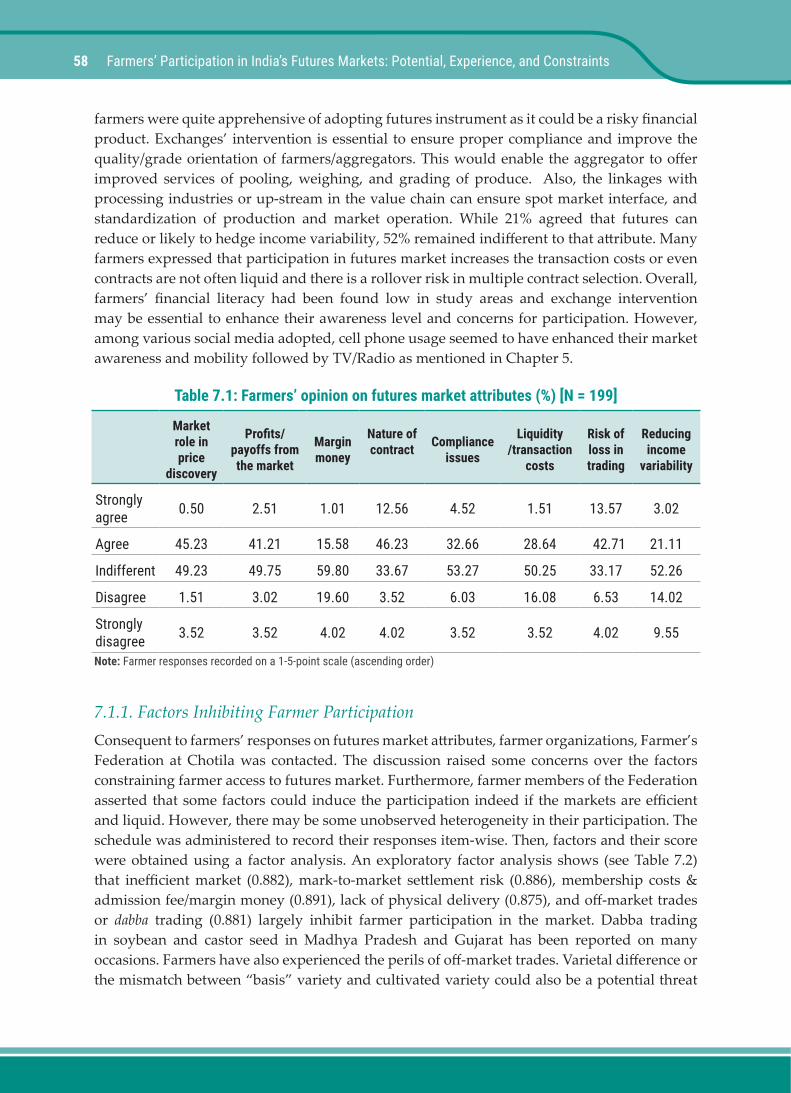
58 Farmers’ Participation in India’s Futures Markets: Potential, Experience, and Constraints
farmers were quite apprehensive of adopting futures instrument as it could be a risky financial product. Exchanges’ intervention is essential to ensure proper compliance and improve the quality/grade orientation of farmers/aggregators. This would enable the aggregator to offer improved services of pooling, weighing, and grading of produce. Also, the linkages with processing industries or up-stream in the value chain can ensure spot market interface, and standardization of production and market operation. While 21% agreed that futures can reduce or likely to hedge income variability, 52% remained indifferent to that attribute. Many farmers expressed that participation in futures market increases the transaction costs or even contracts are not often liquid and there is a rollover risk in multiple contract selection. Overall, farmers’ financial literacy had been found low in study areas and exchange intervention may be essential to enhance their awareness level and concerns for participation. However, among various social media adopted, cell phone usage seemed to have enhanced their market awareness and mobility followed by TV/Radio as mentioned in Chapter 5.
Table 7.1: Farmers’ opinion on futures market attributes (%) [N = 199]
Market role in price
discovery
Profits/payoffs from the market
Margin money
Nature of contract Compliance
issues
Liquidity/transaction
costs
Risk of loss in trading
Reducing income
variability
Strongly agree 0.50 2.51 1.01 12.56 4.52 1.51 13.57 3.02
Agree 45.23 41.21 15.58 46.23 32.66 28.64 42.71 21.11
Indifferent 49.23 49.75 59.80 33.67 53.27 50.25 33.17 52.26
Disagree 1.51 3.02 19.60 3.52 6.03 16.08 6.53 14.02
Strongly disagree 3.52 3.52 4.02 4.02 3.52 3.52 4.02 9.55
Note: Farmer responses recorded on a 1-5-point scale (ascending order)
7.1.1. Factors Inhibiting Farmer ParticipationConsequent to farmers’ responses on futures market attributes, farmer organizations, Farmer’s Federation at Chotila was contacted. The discussion raised some concerns over the factors constraining farmer access to futures market. Furthermore, farmer members of the Federation asserted that some factors could induce the participation indeed if the markets are efficient and liquid. However, there may be some unobserved heterogeneity in their participation. The schedule was administered to record their responses item-wise. Then, factors and their score were obtained using a factor analysis. An exploratory factor analysis shows (see Table 7.2) that inefficient market (0.882), mark-to-market settlement risk (0.886), membership costs & admission fee/margin money (0.891), lack of physical delivery (0.875), and off-market trades or dabba trading (0.881) largely inhibit farmer participation in the market. Dabba trading in soybean and castor seed in Madhya Pradesh and Gujarat has been reported on many occasions. Farmers have also experienced the perils of off-market trades. Varietal difference or the mismatch between “basis” variety and cultivated variety could also be a potential threat

59
to farmer participation that was a major problem in MCX-AKRSP (I) intervention in cotton futures market in 2007-2008. Membership/admission fee includes upfront registration fee (INR 25, 000), annual regulatory fee (Rs 50, 000) besides the disclosure of deposit of INR 50 lakh and net worth of INR 1 crore for commodity participant member. So, this is practically infeasible for an aggregator to become either an institutional member or trading member. However, this may be feasible for exchange-traded forward market where membership fee and margin money requirement has relatively been low. Factors loaded in the model have explained 75% of the variance of constraint to farmer participation with Cronbach’s alpha of 0.961, and sampling adequacy (KMO’s) score of 0.947. The goodness of fit is statistically significant with a large chi-square value of 2036.
Table 7.2: Factors constraining farmer entry or participation in forward/futures
Factors Component score (β) Explanation/probable reasons Model statistics Coefficient
Inefficient futures market 0.882
Price distortion, basis risk, unorganized spot, futures contract design issues
Scale reliability (Cronbach’s alpha)
0.961
Mark-to-market settlement risk/margin call
0.886 Volatility/erroneous futures pricing formulae adopted
KMO’s test of sampling adequacy score
0.947
High membership cost, admission fee 0.891
Depends on the regulator/exchange directives, incidence of settlement guarantee fund
Bartlett’s test of sphericity (×2) 2036.65**
Lack of physical delivery 0.875 Lack of recognized assayers/
accredited warehousesVariance explained (%) 74.88
Off-market trades/dabba trading 0.881
Pitfall in regulatory oversight (a case of soybean trading in Madhya Pradesh)
** at the 1% level of significance
Problems related to farmer participation, as mentioned above, also account for a host of issues as noted in the MCX Report (2008) in the context of cotton futures. For example, selection of NGOs as aggregators could be a major limiting factor to farmer participation. Voluntary organizations registered with not-for-profit mandate are not allowed to open trading account or discouraged to engage in any profit generating activity. Furthermore, these organizations do not have any domain expertise to understand the futures market nuances or can have ability to enter the market at right time. On the other hand, farmers cannot open trading accounts due to non-availability of PAN card or other supporting documents. Brokerage operations sometimes deter the progress of participation.
In the wake of low trade volumes, brokers do not have an incentive to serve the rural clientele. The small positions from a rural clientele could raise a problem of high transaction costs which undermine the viability of operations in rural areas with thin client coverage and small transactions. In addition, the brokers do not have clear guidelines or understanding about the rules pertaining to trading by voluntary organizations. Such lack of clarity results in delays and procedural hassles for the farmers (MCX, 2008: 9).
Chapter 7: Constraints, Benefits and Scope of Farmer Participation
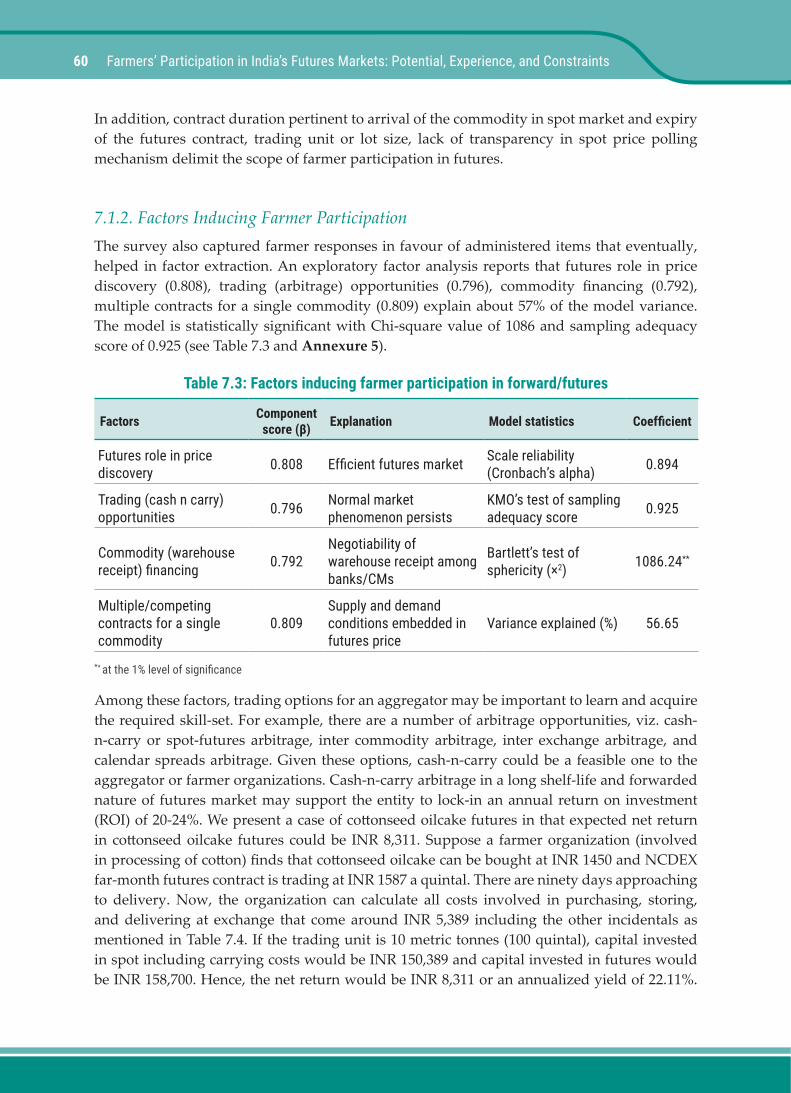
60 Farmers’ Participation in India’s Futures Markets: Potential, Experience, and Constraints
In addition, contract duration pertinent to arrival of the commodity in spot market and expiry of the futures contract, trading unit or lot size, lack of transparency in spot price polling mechanism delimit the scope of farmer participation in futures.
7.1.2. Factors Inducing Farmer ParticipationThe survey also captured farmer responses in favour of administered items that eventually, helped in factor extraction. An exploratory factor analysis reports that futures role in price discovery (0.808), trading (arbitrage) opportunities (0.796), commodity financing (0.792), multiple contracts for a single commodity (0.809) explain about 57% of the model variance. The model is statistically significant with Chi-square value of 1086 and sampling adequacy score of 0.925 (see Table 7.3 and Annexure 5).
Table 7.3: Factors inducing farmer participation in forward/futures
Factors Component score (β) Explanation Model statistics Coefficient
Futures role in price discovery 0.808 Efficient futures market Scale reliability
(Cronbach’s alpha) 0.894
Trading (cash n carry) opportunities 0.796 Normal market
phenomenon persistsKMO’s test of sampling adequacy score 0.925
Commodity (warehouse receipt) financing 0.792
Negotiability of warehouse receipt among banks/CMs
Bartlett’s test of sphericity (×2) 1086.24**
Multiple/competing contracts for a single commodity
0.809Supply and demand conditions embedded in futures price
Variance explained (%) 56.65
** at the 1% level of significance
Among these factors, trading options for an aggregator may be important to learn and acquire the required skill-set. For example, there are a number of arbitrage opportunities, viz. cash-n-carry or spot-futures arbitrage, inter commodity arbitrage, inter exchange arbitrage, and calendar spreads arbitrage. Given these options, cash-n-carry could be a feasible one to the aggregator or farmer organizations. Cash-n-carry arbitrage in a long shelf-life and forwarded nature of futures market may support the entity to lock-in an annual return on investment (ROI) of 20-24%. We present a case of cottonseed oilcake futures in that expected net return in cottonseed oilcake futures could be INR 8,311. Suppose a farmer organization (involved in processing of cotton) finds that cottonseed oilcake can be bought at INR 1450 and NCDEX far-month futures contract is trading at INR 1587 a quintal. There are ninety days approaching to delivery. Now, the organization can calculate all costs involved in purchasing, storing, and delivering at exchange that come around INR 5,389 including the other incidentals as mentioned in Table 7.4. If the trading unit is 10 metric tonnes (100 quintal), capital invested in spot including carrying costs would be INR 150,389 and capital invested in futures would be INR 158,700. Hence, the net return would be INR 8,311 or an annualized yield of 22.11%.
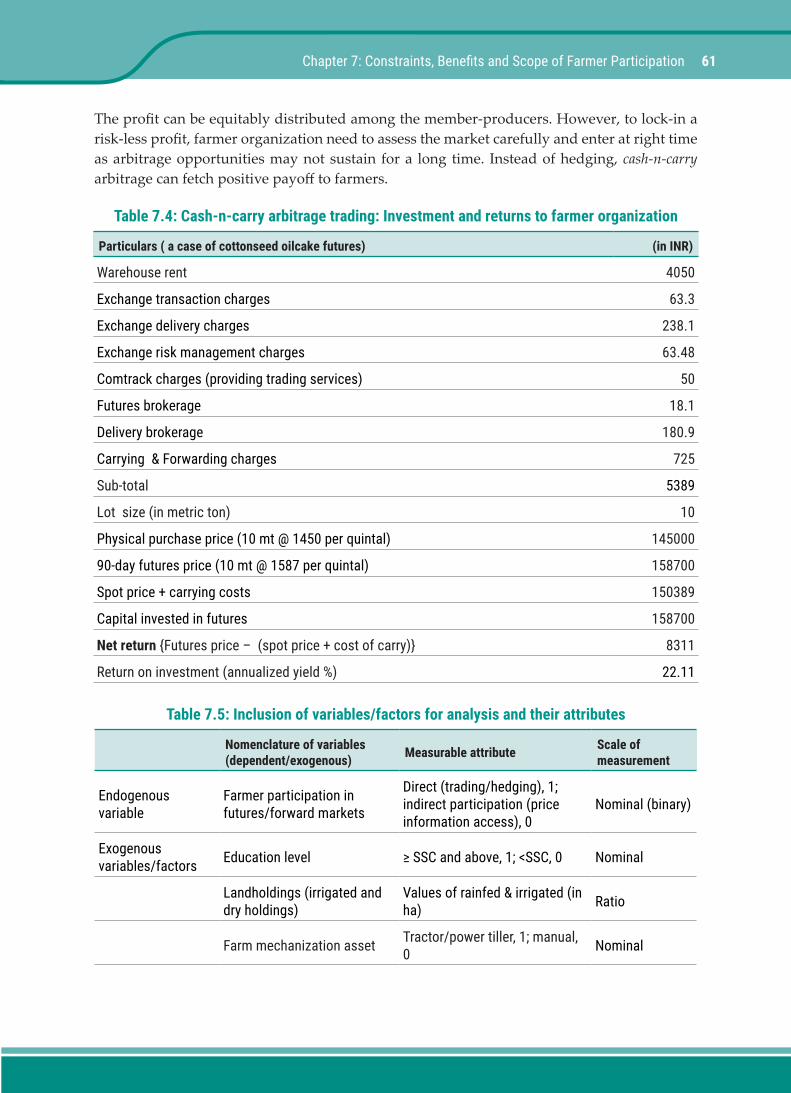
61
The profit can be equitably distributed among the member-producers. However, to lock-in a risk-less profit, farmer organization need to assess the market carefully and enter at right time as arbitrage opportunities may not sustain for a long time. Instead of hedging, cash-n-carry arbitrage can fetch positive payoff to farmers.
Table 7.4: Cash-n-carry arbitrage trading: Investment and returns to farmer organization
Particulars ( a case of cottonseed oilcake futures) (in INR)
Warehouse rent 4050
Exchange transaction charges 63.3
Exchange delivery charges 238.1
Exchange risk management charges 63.48
Comtrack charges (providing trading services) 50
Futures brokerage 18.1
Delivery brokerage 180.9
Carrying & Forwarding charges 725
Sub-total 5389
Lot size (in metric ton) 10
Physical purchase price (10 mt @ 1450 per quintal) 145000
90-day futures price (10 mt @ 1587 per quintal) 158700
Spot price + carrying costs 150389
Capital invested in futures 158700
Net return Futures price – (spot price + cost of carry) 8311
Return on investment (annualized yield %) 22.11
Table 7.5: Inclusion of variables/factors for analysis and their attributes
Nomenclature of variables (dependent/exogenous) Measurable attribute Scale of
measurement
Endogenous variable
Farmer participation in futures/forward markets
Direct (trading/hedging), 1; indirect participation (price information access), 0
Nominal (binary)
Exogenous variables/factors Education level ≥ SSC and above, 1; <SSC, 0 Nominal
Landholdings (irrigated and dry holdings)
Values of rainfed & irrigated (in ha) Ratio
Farm mechanization asset Tractor/power tiller, 1; manual, 0 Nominal
Chapter 7: Constraints, Benefits and Scope of Farmer Participation
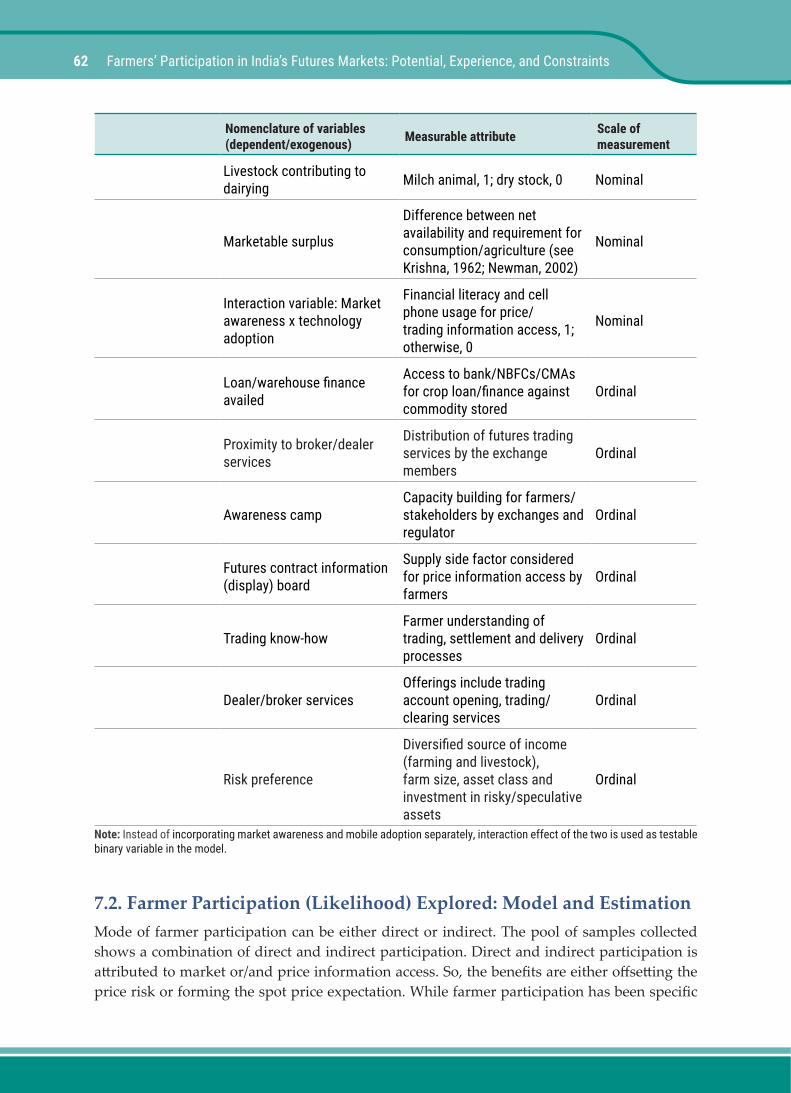
62 Farmers’ Participation in India’s Futures Markets: Potential, Experience, and Constraints
Nomenclature of variables (dependent/exogenous) Measurable attribute Scale of
measurement
Livestock contributing to dairying Milch animal, 1; dry stock, 0 Nominal
Marketable surplus
Difference between net availability and requirement for consumption/agriculture (see Krishna, 1962; Newman, 2002)
Nominal
Interaction variable: Market awareness x technology adoption
Financial literacy and cell phone usage for price/trading information access, 1; otherwise, 0
Nominal
Loan/warehouse finance availed
Access to bank/NBFCs/CMAs for crop loan/finance against commodity stored
Ordinal
Proximity to broker/dealer services
Distribution of futures trading services by the exchange members
Ordinal
Awareness campCapacity building for farmers/stakeholders by exchanges and regulator
Ordinal
Futures contract information (display) board
Supply side factor considered for price information access by farmers
Ordinal
Trading know-howFarmer understanding of trading, settlement and delivery processes
Ordinal
Dealer/broker servicesOfferings include trading account opening, trading/clearing services
Ordinal
Risk preference
Diversified source of income (farming and livestock), farm size, asset class and investment in risky/speculative assets
Ordinal
Note: Instead of incorporating market awareness and mobile adoption separately, interaction effect of the two is used as testable binary variable in the model.
7.2. Farmer Participation (Likelihood) Explored: Model and EstimationMode of farmer participation can be either direct or indirect. The pool of samples collected shows a combination of direct and indirect participation. Direct and indirect participation is attributed to market or/and price information access. So, the benefits are either offsetting the price risk or forming the spot price expectation. While farmer participation has been specific
63
to income variability reduction, techno-economic issues have often precluded them from that very nature of participation. So, keeping the sample size under consideration, the analysis was conducted at aggregate level (not across the state) using a set of economic, demographic, behavioural, and institutional variables/factors. Table 7.5 presents a description of variables, attributes and their scale of measurement. Some of the factors, namely risk preference, trading know-how, village connectivity (demand side factors), loan/pledge finance availed awareness camp, proximity to dealer/broker offices and their services, contract information display board (supply and distribution related factors) drawn from the exploratory factor analysis (as explained in the previous chapter) are incorporated in the binary logit model. In addition, economic (livestock and farm mechanization assets), demographic (education level) variables, and interaction effect (financial literacy as a surrogate measure to market awareness and technology adoption) are considered in the model. A stepwise backward (wald) regression helps identify the focal factors/variables and then, a functional relationship between the likelihood of farmer participation in futures/forward markets and significant factors/variables can empirically be established.
Table 7.6 presents frequency distribution (descriptive statistics) of categorical variables/factors with respect to farmer responses scaled. Farmer responses with respect to loan availed from bank/financial institutions are very low with a median of 17.59% that indicates low financial literacy among farmers or their organizations or lack of adequacy in financial services offered by financial institutions. Proximity to broker offices from villages/community centers according to sample farmers is reasonable (23.12%), while there is little effort on the part of exchanges/market agencies to organize awareness camp at regular interval (29.65%). Though the then regulator FMC initiated price dissemination project by installing price ticker board, many market yards/APMCs are yet to project the electronic price ticker board containing futures contract information (26.63%). However, farmers in selected pockets of Gujarat and Madhya Pradesh access price and market related information from social media such as mobile phone, TV & Radio, newspaper, among others. As dealer/broker services are limited to urban clientele (19.10%), farmers remain indifferent when acquaintance with trading is concerned (24.62%). Moreover, their risk preference factor towards risky investment or speculative intent is low as smallholders often harp on subsistence agriculture and are plagued by distress sale. However, Gujarat, Rajasthan, and Madhya Pradesh farmers exhibit some amount of risk preference (risk taking behaviour) when marketing and risk management of agricultural produce comes to the fore (evident from survey information).
Chapter 7: Constraints, Benefits and Scope of Farmer Participation
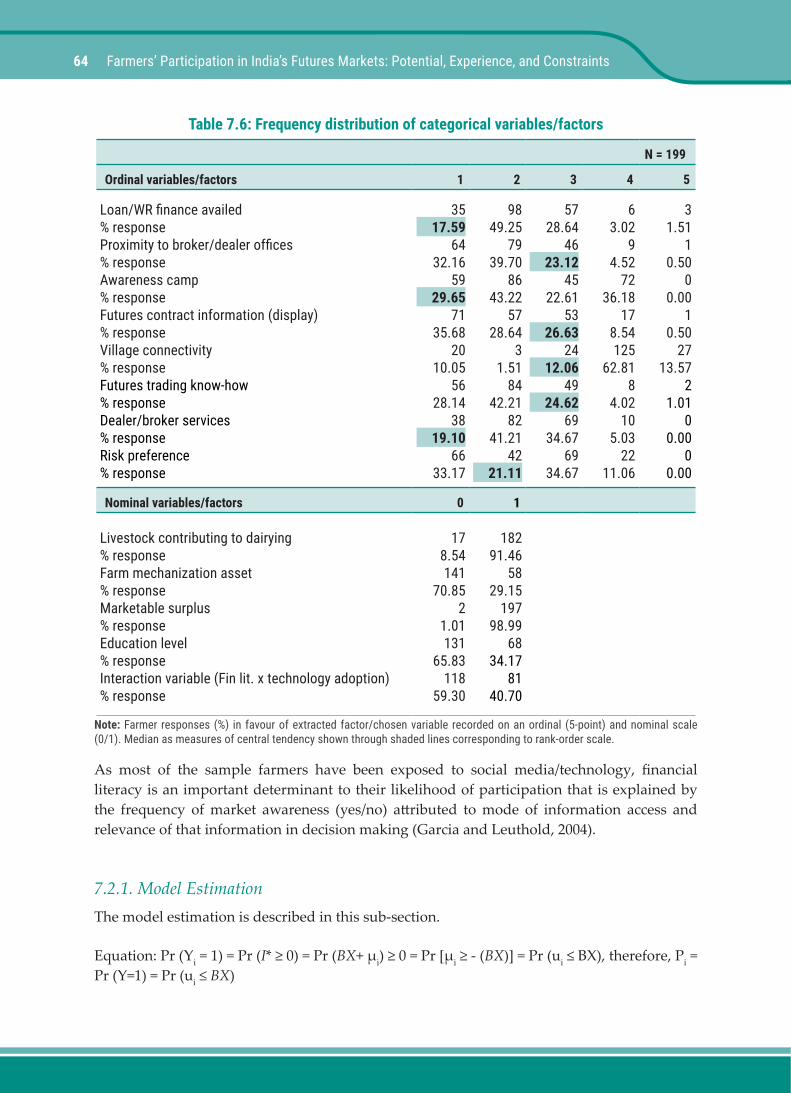
64 Farmers’ Participation in India’s Futures Markets: Potential, Experience, and Constraints
Table 7.6: Frequency distribution of categorical variables/factors
N = 199
Ordinal variables/factors 1 2 3 4 5
Loan/WR finance availed% responseProximity to broker/dealer offices% responseAwareness camp% responseFutures contract information (display) % responseVillage connectivity% responseFutures trading know-how% responseDealer/broker services% responseRisk preference % response
3517.59
6432.16
5929.65
7135.68
2010.05
5628.14
3819.10
6633.17
9849.25
7939.70
8643.22
5728.64
31.51
8442.21
8241.21
4221.11
5728.64
4623.12
4522.61
5326.63
2412.06
4924.62
6934.67
6934.67
63.02
94.52
7236.18
178.54125
62.818
4.0210
5.0322
11.06
31.51
10.50
00.00
10.50
2713.57
21.01
00.00
00.00
Nominal variables/factors 0 1
Livestock contributing to dairying% responseFarm mechanization asset % responseMarketable surplus % responseEducation level % responseInteraction variable (Fin lit. x technology adoption)% response
178.54141
70.852
1.01131
65.83118
59.30
18291.46
5829.15
19798.99
6834.17
8140.70
Note: Farmer responses (%) in favour of extracted factor/chosen variable recorded on an ordinal (5-point) and nominal scale (0/1). Median as measures of central tendency shown through shaded lines corresponding to rank-order scale.
As most of the sample farmers have been exposed to social media/technology, financial literacy is an important determinant to their likelihood of participation that is explained by the frequency of market awareness (yes/no) attributed to mode of information access and relevance of that information in decision making (Garcia and Leuthold, 2004).
7.2.1. Model EstimationThe model estimation is described in this sub-section.
Equation: Pr (Yi = 1) = Pr (I* ≥ 0) = Pr (BX+ µi) ≥ 0 = Pr [µi ≥ - (BX)] = Pr (ui ≤ BX), therefore, Pi = Pr (Y=1) = Pr (ui ≤ BX)

65
So, Probability of farmer participation in forward/futures market can be written as
Pi = Pr (YF = 1) = 1/1+ e –Z); where Zi = BX + µi (1)
And, the probability that YF = 0, that is, the farmer is not a direct participant in forward/futures market, is given by
1 – Pi = Pr (YF =0) = 1/1+ eZ (2)
It can be easily verified that as Zi ranges from -∞ to +∞, Pi ranges between 0 and 1 and that Pi is nonlinearly related to Zi (i.e., Xi). We can use a simple transformation to make the model linear, that is, taking the ratio of (1) & (2), we can mean that the probability that a farmer participates in the futures market against the likelihood that the farmer does not participate.
Pi/1 – Pi = 1 + eZi/1 + e-Zi = eZi (3)
Now, Pi / (1- Pi) is simple the odds ratio in favour of participation – the ratio of probability that a farmer does participate in futures market to the probability that the farmer does not.
Li = ln Pi/1-Pi = Zi = BXi + µi (4)
In words, the log of the odds ratio is a linear function of the Bs as well as the Xs. Li is known as the logit (log of the odds ratio).
The final equation used in the model fitting can be written as
Li = ln (PF/1-PF) = α + β1X1 + β2 X2 + β3X3+ β4X4 + β7D1 + µi (5)
where , Y = ln(Prfp/1 – Prfp): likelihood of farmer participation; X1: irrigated landholdings; X2: loan/WR finance availed; X3: risk preference; X4: training & visit by exchange officials; D1: Interaction variable (financial literacy and technology adoption)
7.2.2. Findings and DiscussionThe findings are elaborated in this sub-section that are drawn from Table 7.7A and B. The variables/factors extracted from the factor analysis related to demand, supply, and distribution of futures trading, namely risk aversion, training and visit by exchange officials, access to post-harvest loan or warehouse receipt finance are found to improve the predictive percentage of farmer participation in the futures market by 83.9%. Using a backward stepwise (wald) regression, model goodness of fit has been improved as indicated by Hosmer and Lemeshow test (Chi-square 24.33 at 1% level of significance). Mean estimate of risk aversion (1.316) is significant that can induce the propensity to enter a futures contract by three times than that of selling the produce in the physical market. It implies that a majority of sample farmers exhibit a high degree of risk aversion. Therefore, direct participation has to be promoted by offering futures trading services. In other words, due to high degree of risk aversion (hedging
Chapter 7: Constraints, Benefits and Scope of Farmer Participation
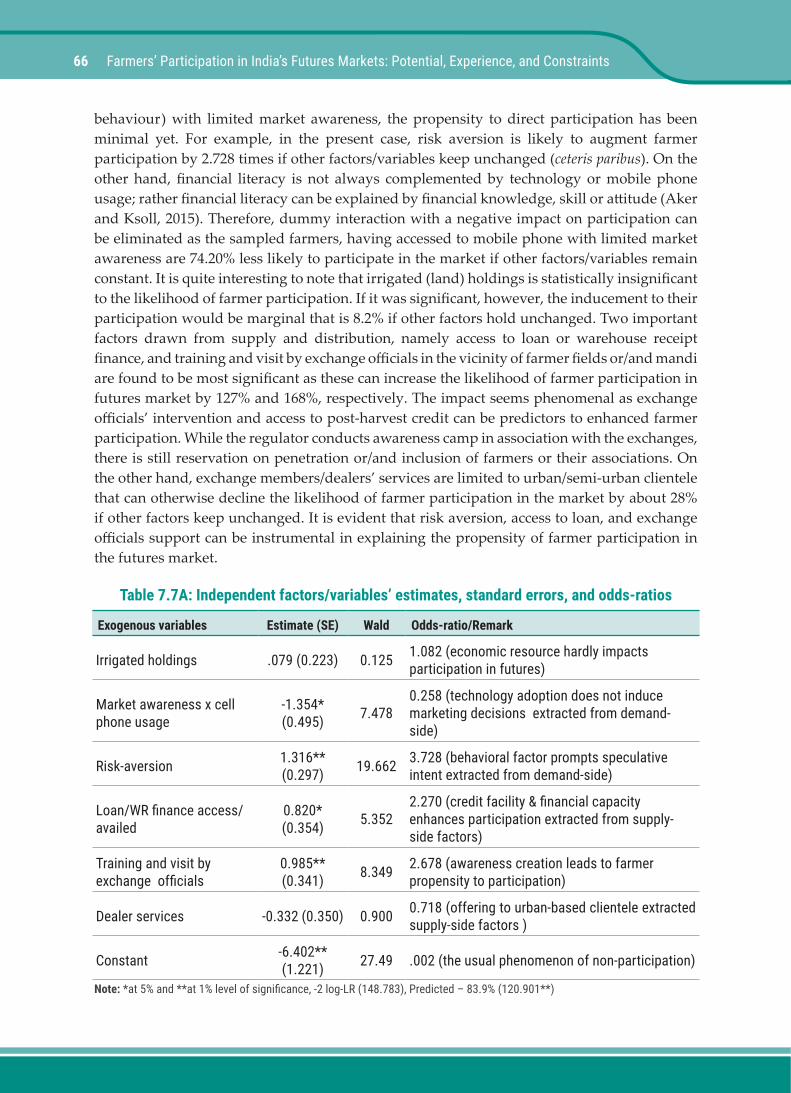
66 Farmers’ Participation in India’s Futures Markets: Potential, Experience, and Constraints
behaviour) with limited market awareness, the propensity to direct participation has been minimal yet. For example, in the present case, risk aversion is likely to augment farmer participation by 2.728 times if other factors/variables keep unchanged (ceteris paribus). On the other hand, financial literacy is not always complemented by technology or mobile phone usage; rather financial literacy can be explained by financial knowledge, skill or attitude (Aker and Ksoll, 2015). Therefore, dummy interaction with a negative impact on participation can be eliminated as the sampled farmers, having accessed to mobile phone with limited market awareness are 74.20% less likely to participate in the market if other factors/variables remain constant. It is quite interesting to note that irrigated (land) holdings is statistically insignificant to the likelihood of farmer participation. If it was significant, however, the inducement to their participation would be marginal that is 8.2% if other factors hold unchanged. Two important factors drawn from supply and distribution, namely access to loan or warehouse receipt finance, and training and visit by exchange officials in the vicinity of farmer fields or/and mandi are found to be most significant as these can increase the likelihood of farmer participation in futures market by 127% and 168%, respectively. The impact seems phenomenal as exchange officials’ intervention and access to post-harvest credit can be predictors to enhanced farmer participation. While the regulator conducts awareness camp in association with the exchanges, there is still reservation on penetration or/and inclusion of farmers or their associations. On the other hand, exchange members/dealers’ services are limited to urban/semi-urban clientele that can otherwise decline the likelihood of farmer participation in the market by about 28% if other factors keep unchanged. It is evident that risk aversion, access to loan, and exchange officials support can be instrumental in explaining the propensity of farmer participation in the futures market.
Table 7.7A: Independent factors/variables’ estimates, standard errors, and odds-ratios
Exogenous variables Estimate (SE) Wald Odds-ratio/Remark
Irrigated holdings .079 (0.223) 0.125 1.082 (economic resource hardly impacts participation in futures)
Market awareness x cell phone usage
-1.354* (0.495) 7.478
0.258 (technology adoption does not induce marketing decisions extracted from demand-side)
Risk-aversion 1.316** (0.297) 19.662 3.728 (behavioral factor prompts speculative
intent extracted from demand-side)
Loan/WR finance access/availed
0.820* (0.354) 5.352
2.270 (credit facility & financial capacity enhances participation extracted from supply-side factors)
Training and visit by exchange officials
0.985** (0.341) 8.349 2.678 (awareness creation leads to farmer
propensity to participation)
Dealer services -0.332 (0.350) 0.900 0.718 (offering to urban-based clientele extracted supply-side factors )
Constant -6.402** (1.221) 27.49 .002 (the usual phenomenon of non-participation)
Note: *at 5% and **at 1% level of significance, -2 log-LR (148.783), Predicted – 83.9% (120.901**)

67
Table 7.7B: Logit model’s goodness of fit statistics
Model – test statistics Values
Chi-square (×2) 120.901**
Hosmer & Lemeshow Goodness of Fit 24.33**
**-at 1% level of significance
It can be inferred from results none of the factors loading/exogenous variables suffers from multicollinearity (as standard error is note equal to or more than 2 as thumb rule) problem or the model goodness of fit is insignificant. Though some of exogenous factors/variables are found insignificant and negative, the model appears to be robust and parsimonious. Two supply and distribution related factors, loan/pledge finance availability and training and visit by exchange officials are important for consideration. However, farmers’ subjective judgment should be considered while modeling the relationship between these factors and likelihood of their participation.
Chapter 7: Constraints, Benefits and Scope of Farmer Participation

69
In this chapter, some further analysis on the factors affecting farmers’ participation in the commodity forward and futures markets is presented. Though there are definite advantages to be gained by farmers by participating in the NCDEX markets and by observing price data disseminated through television and mobile phones, there are still a lot of shortcomings that need to be ironed out to gain higher participation rates. The analysis in this regard is based on the survey dataset collected for the study as described in chapters 5 and 7. The survey dataset has responses from 199 farmers out of which 145 are from Gujarat, 53 are from Madhya Pradesh and 1 is from Rajasthan. Therefore, for lack of sample size, Rajasthan is excluded from inter-state comparative analysis. The analytical observations are mostly based on cross tabulations that are presented in the form of column charts and some simple statistical tests.
8.1. Association with Farmer Bodies Bring Awareness but not Participa-tionIt is observed that farmers who are aware of futures/forward markets are also likely to have stronger associations with farmer bodies (cooperatives, PACs, FPC), APMC officials and traders/dealers in both Gujarat and Madhya Pradesh. In the case of Gujarat, as the figure 8.1 and its related table 8.1 below show, farmers who are aware of the presence of futures/forward commodity markets also responded with higher degree of association (on a scale of 1-5) on average. The differences between their mean responses are also found to be significant for five types of organizations, though it is found to be much higher in the case of cooperatives, PACs, FPCs, APMC officials and agri. input companies.
CHAPTER 8
Factors Affecting Farmers’ Participation
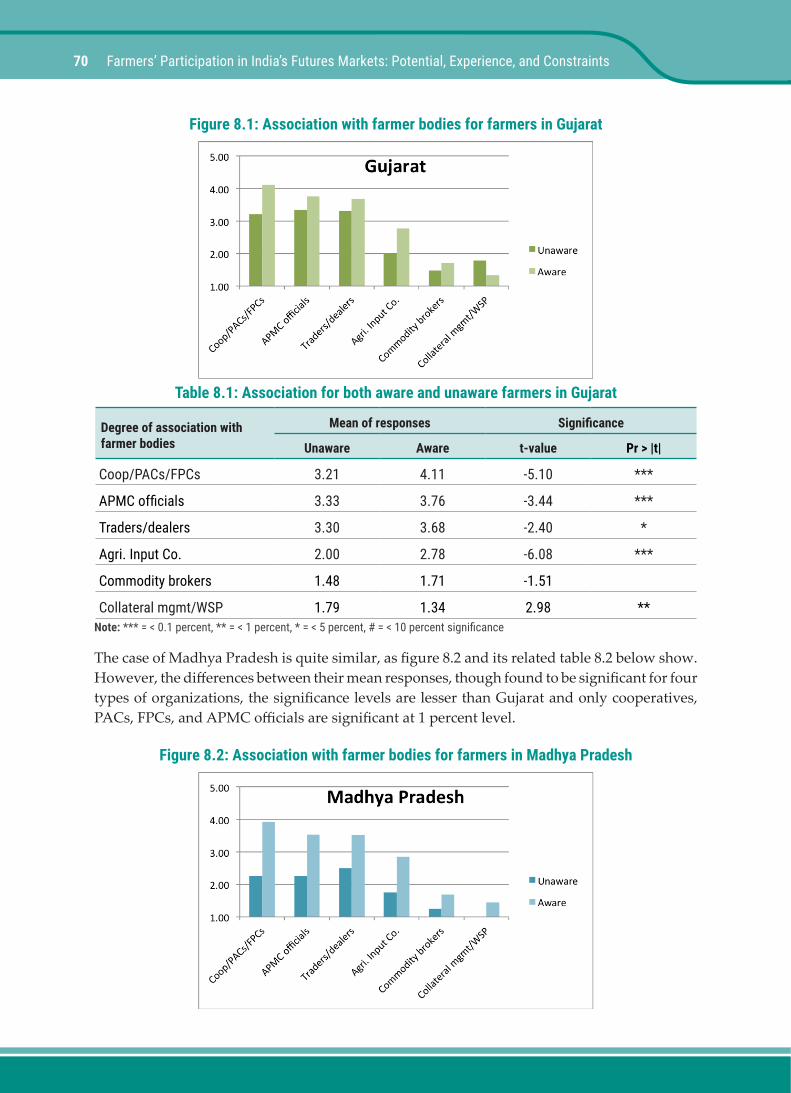
70 Farmers’ Participation in India’s Futures Markets: Potential, Experience, and Constraints
Figure 8.1: Association with farmer bodies for farmers in Gujarat
Table 8.1: Association for both aware and unaware farmers in Gujarat
Degree of association with farmer bodies
Mean of responses Significance
Unaware Aware t-value Pr > |t|
Coop/PACs/FPCs 3.21 4.11 -5.10 ***
APMC officials 3.33 3.76 -3.44 ***
Traders/dealers 3.30 3.68 -2.40 *
Agri. Input Co. 2.00 2.78 -6.08 ***
Commodity brokers 1.48 1.71 -1.51
Collateral mgmt/WSP 1.79 1.34 2.98 **Note: *** = < 0.1 percent, ** = < 1 percent, * = < 5 percent, # = < 10 percent significance
The case of Madhya Pradesh is quite similar, as figure 8.2 and its related table 8.2 below show. However, the differences between their mean responses, though found to be significant for four types of organizations, the significance levels are lesser than Gujarat and only cooperatives, PACs, FPCs, and APMC officials are significant at 1 percent level.
Figure 8.2: Association with farmer bodies for farmers in Madhya Pradesh
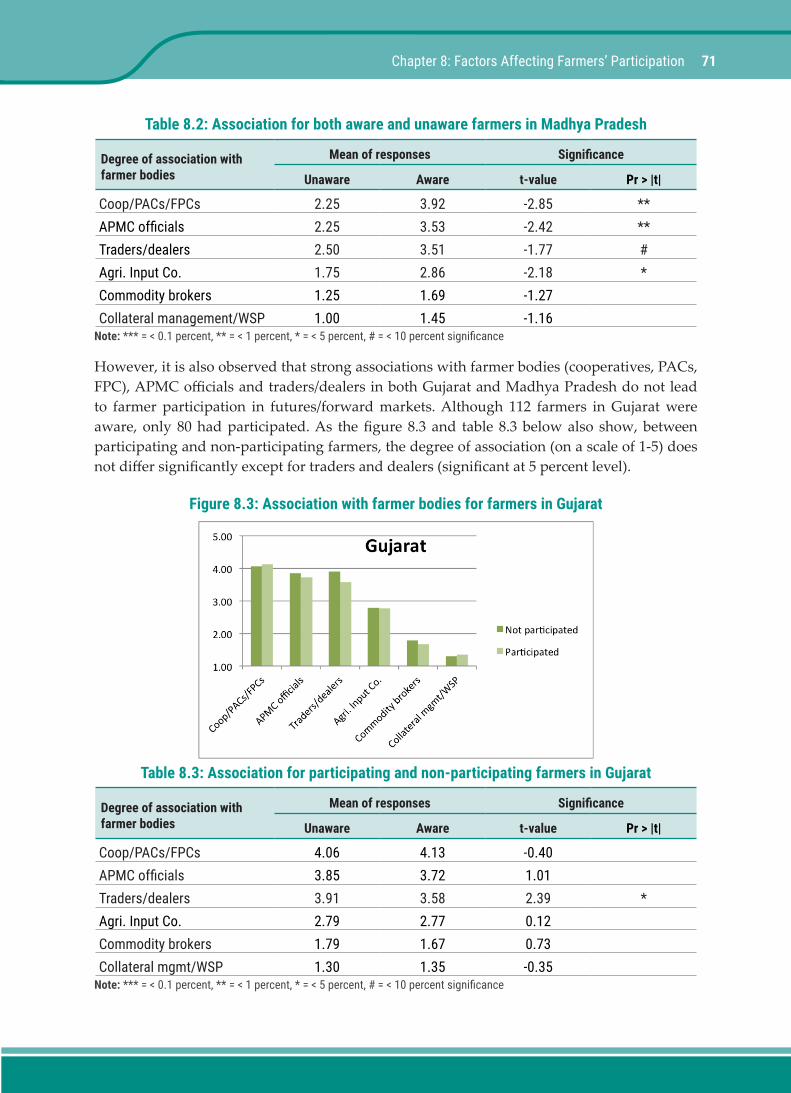
71
Table 8.2: Association for both aware and unaware farmers in Madhya Pradesh
Degree of association with farmer bodies
Mean of responses Significance
Unaware Aware t-value Pr > |t|
Coop/PACs/FPCs 2.25 3.92 -2.85 **APMC officials 2.25 3.53 -2.42 **Traders/dealers 2.50 3.51 -1.77 #Agri. Input Co. 1.75 2.86 -2.18 *Commodity brokers 1.25 1.69 -1.27Collateral management/WSP 1.00 1.45 -1.16
Note: *** = < 0.1 percent, ** = < 1 percent, * = < 5 percent, # = < 10 percent significance
However, it is also observed that strong associations with farmer bodies (cooperatives, PACs, FPC), APMC officials and traders/dealers in both Gujarat and Madhya Pradesh do not lead to farmer participation in futures/forward markets. Although 112 farmers in Gujarat were aware, only 80 had participated. As the figure 8.3 and table 8.3 below also show, between participating and non-participating farmers, the degree of association (on a scale of 1-5) does not differ significantly except for traders and dealers (significant at 5 percent level).
Figure 8.3: Association with farmer bodies for farmers in Gujarat
Table 8.3: Association for participating and non-participating farmers in Gujarat
Degree of association with farmer bodies
Mean of responses Significance
Unaware Aware t-value Pr > |t|
Coop/PACs/FPCs 4.06 4.13 -0.40APMC officials 3.85 3.72 1.01Traders/dealers 3.91 3.58 2.39 *Agri. Input Co. 2.79 2.77 0.12Commodity brokers 1.79 1.67 0.73Collateral mgmt/WSP 1.30 1.35 -0.35
Note: *** = < 0.1 percent, ** = < 1 percent, * = < 5 percent, # = < 10 percent significance
Chapter 8: Factors Affecting Farmers’ Participation

72 Farmers’ Participation in India’s Futures Markets: Potential, Experience, and Constraints
In the case of Madhya Pradesh, out of 49 farmers who are aware, only 2 had participated. Here, though it may appear from figure 8.4 that there are large differences in mean responses, the table 8.4 shows that there are no statistically significant differences for any of the farmer organizations. This can be also attributed to the unfortunate lack of sample size for one of the groups (of participating farmers), even after assuming equal variances for both samples. For all the other t-tests too, equality of variances are assumed, as the response set was small and bounded between the integer values of 1 to 5.
Figure 8.4: Association with farmer bodies for farmers in Madhya Pradesh
Table 8.4: Association with farmer bodies for farmers in Madhya Pradesh
Degree of association with farmer bodies
Mean of responses Significance
Unaware Aware t-value Pr > |t|
Coop/PACs/FPCs 3.87 5.00 -1.44
APMC officials 3.53 3.50 0.04
Traders/dealers 3.53 3.00 0.70
Agri. Input Co. 2.87 2.50 0.52
Commodity brokers 1.70 1.50 0.41
Collateral mgmt/WSP 1.47 1.00 0.84Note: *** = < 0.1 percent, ** = < 1 percent, * = < 5 percent, # = < 10 percent significance
8.2. Size of Farmer’s Landholding is Unrelated to Effective DemandAlthough farmers agree that their village is well connected to markets and farmers with bigger landholdings agree to be more viable, farmers (irrespective of size of their landholding) on average are unaware of benefits of futures markets or modus operandi of trading, and are unwilling to take risks or become an opinion leader.
The figure 8.5 and the corresponding table 8.5 below show mean responses (on a Likert scale of 1-5) for 199 farmers from three states – Gujarat, Madhya Pradesh and Rajasthan – combined

73
and classified according to their land sizes. Here both the figure and the corresponding table portray that unwillingness to participate in the forwards and futures markets is pervasive among farmers irrespective of their crop production capacity or viability. This clearly rejects prior notions that farmers might not be participating in these markets because of their need to sell most of their produce to repay loans or meet consumption needs.
Figure 8.5: Gauging effective demand among farmers of different landholding sizes
Table 8.5: Gauging effective demand among farmers of different landholding sizes
Effective demand determinationLand Size classification Significance
<1 HA 1-2 HA 2-10 HA >10 HA F Value Pr > F
Awareness of futures markets 1.50 2.29 2.16 2.17 3.35 *
Willing to take risk 1.61 2.41 2.14 2.17 3.50 *
Opinion leadership 2.22 2.30 1.97 2.50 1.85
Awareness of trading 1.83 2.17 2.00 2.00 1.05
Secured loan facility 2.11 2.15 2.26 3.17 3.14 *
Farm size viability 1.89 2.28 3.09 4.17 16.58 ***
Village connectivity 3.17 3.66 3.86 3.67 2.10Note: *** = < 0.1 percent, ** = < 1 percent, * = < 5 percent, # = < 10 percent significance
When farmers’ mean responses in Madhya Pradesh are compared to those in Gujarat in general it is seen that their farms are somewhat less viable for crops, and these farmers are more unaware of benefits of futures markets or modus operandi of trading, and more unwilling to take risks or become opinion leaders. The figure 8.6 and its related table 8.6 below shows the mean responses for 198 farmers (on a Likert scale of 1-5) classified according to state. As the sampling proportion of farmers belonging to different land-sizes is notably similar between the two states, the differences in effective demand arises from the infrastructural and organizational differences of futures markets in these states, and not from village connectivity
Chapter 8: Factors Affecting Farmers’ Participation

74 Farmers’ Participation in India’s Futures Markets: Potential, Experience, and Constraints
to these markets. Quite expectedly Gujarat does better than Madhya Pradesh because contract farming in Gujarat has been the modus operandi for many Gujarati farmers for the past several years.
Figure 8.6: Gauging effective demand among farmers of different states
Table 8.6: Gauging effective demand among farmers of different states
Effective demand determination
Mean of responses Significance
Gujarat MP t-value Pr > |t|
Awareness of futures markets 2.46 1.34 8.16 ***
Willing to take risk 2.55 1.40 8.00 ***
Opinion leadership 2.37 1.62 5.13 ***
Awareness of trading 2.26 1.60 4.87 ***
Secured loan facility 2.38 1.72 5.54 ***
Farm size viability 2.70 2.21 2.81 **
Village connectivity 3.73 3.53 1.19Note: *** = < 0.1 percent, ** = < 1 percent, * = < 5 percent, # = < 10 percent significance
8.3. Marginal Farmers have Less Accessibility to TradingWhile large farmers (>10 Ha) are neutral to presence of futures trading terminal nearby, others disagree to the same. On the issue of whether the registered members of Commodity Exchanges are offering needed services and futures contract related information being available in market yard or trader’s shop, all disagree on average.
In the case of marginal farmers (<1 Ha), their disagreement is significantly higher than others with larger land-sizes on both issue of having trading terminals nearby and contract
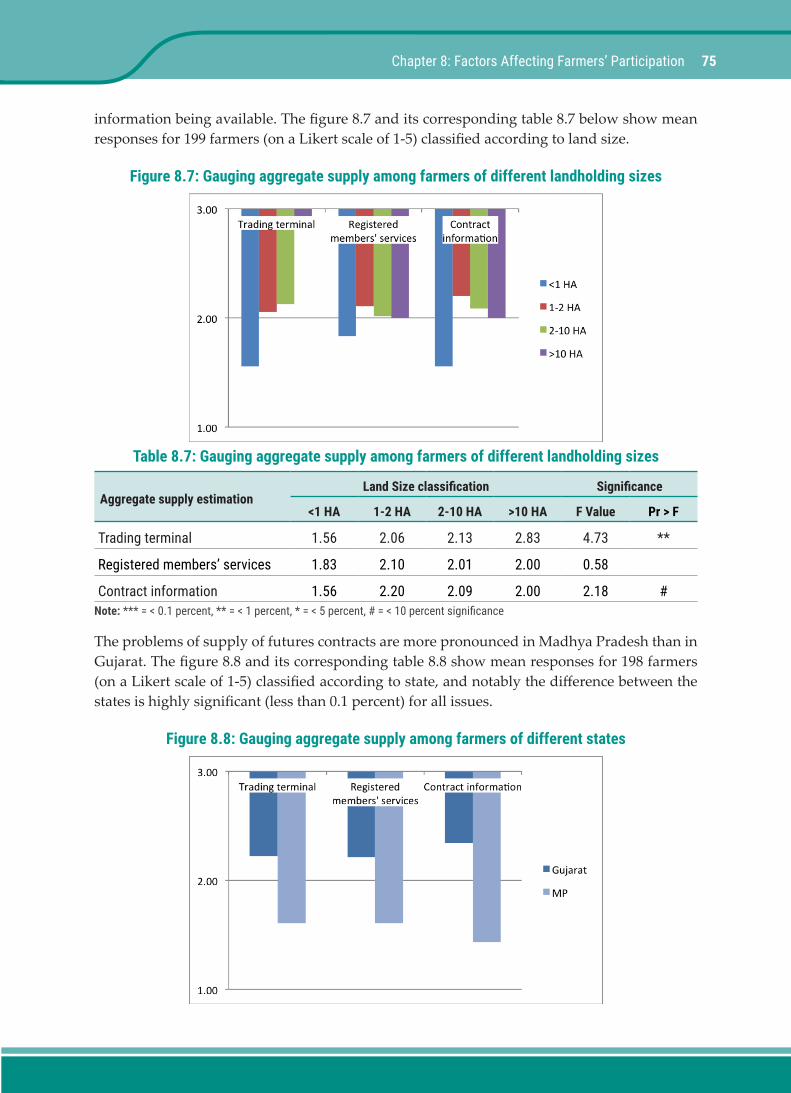
75
information being available. The figure 8.7 and its corresponding table 8.7 below show mean responses for 199 farmers (on a Likert scale of 1-5) classified according to land size.
Figure 8.7: Gauging aggregate supply among farmers of different landholding sizes
Table 8.7: Gauging aggregate supply among farmers of different landholding sizes
Aggregate supply estimationLand Size classification Significance
<1 HA 1-2 HA 2-10 HA >10 HA F Value Pr > F
Trading terminal 1.56 2.06 2.13 2.83 4.73 **
Registered members’ services 1.83 2.10 2.01 2.00 0.58
Contract information 1.56 2.20 2.09 2.00 2.18 #Note: *** = < 0.1 percent, ** = < 1 percent, * = < 5 percent, # = < 10 percent significance
The problems of supply of futures contracts are more pronounced in Madhya Pradesh than in Gujarat. The figure 8.8 and its corresponding table 8.8 show mean responses for 198 farmers (on a Likert scale of 1-5) classified according to state, and notably the difference between the states is highly significant (less than 0.1 percent) for all issues.
Figure 8.8: Gauging aggregate supply among farmers of different states
Chapter 8: Factors Affecting Farmers’ Participation

76 Farmers’ Participation in India’s Futures Markets: Potential, Experience, and Constraints
Table 8.8: Gauging aggregate supply among farmers of different states
Effective demand determinationMean of responses Significance
Gujarat MP t-value Pr > |t|
Trading terminal 2.22 1.60 5.14 ***
Registered members’ services 2.21 1.60 4.72 ***
Contract information 2.34 1.43 6.17 ***Note: *** = < 0.1 percent, ** = < 1 percent, * = < 5 percent, # = < 10 percent significance
8.4. Marginal Farmers have Less Support from Trading and Delivery CentresEven after all farmers’ responses on average show that trading and delivery centres are not working well (a majority of the farmer’s responses show moderate to high disagreement for these services from centres), farmers with marginal landholdings are the worst-off in receiving dealer services, participating in awareness camps or being visited by trade officials.
The figure 8.9 and table 8.9 below show the mean responses for 199 farmers (on a Likert scale of 1-5) classified according to land size. Both also show that the two major areas on which the farmers seldom get any support from the trading and delivery centres are that brokers / members almost never offset mark-to-market losses and brokers/members seldom explain the settlement process. Quite notably this is equally true for farmers of all land-holding sizes, except that marginal farmers again receive less settlement assistance.
Figure 8.9: Assessing support from trading and delivery centres

77
Table 8.9: Assessing support from trading and delivery centres
Trading and Delivery centre assessmentLand Size classification Significance
<1 Ha 1-2 Ha 2-10 Ha >10 Ha F Value Pr > F
Dealer services 1.78 2.28 2.31 2.67 2.74 *
Awareness camp 1.39 2.16 2.00 2.00 4.30 **
Exchange intervention 1.44 2.26 2.04 2.67 5.28 **
Brokerage fee 1.61 2.12 1.94 2.17 2.03
APMC assistance 1.94 2.47 2.33 2.17 2.14 #
Ease of trading account opening 1.72 2.36 2.27 2.17 3.31 *
Assistance in Settlement 1.39 2.04 1.86 1.83 3.54 *
Offsetting losses (MTM) by members 1.06 1.10 1.14 1.00 0.49Note: *** = < 0.1 percent, ** = < 1 percent, * = < 5 percent, # = < 10 percent significance
The trading and delivery centres in Madhya Pradesh are worse-off than Gujarat. The figure 8.10 and table 8.10 both show the mean responses for 198 farmers (on a Likert scale of 1-5) classified according to state. In Gujarat, since a large number of participating farmers were surveyed, it is evident that brokers / members mostly never offset the mark-to-market losses. Also there are significant differences between the two states that make evident how much Madhya Pradesh lags behind Gujarat in creating awareness and building the basic infrastructure for forwards and futures market transactions.
Figure 8.10: Assessing support from trading and delivery centres in different states
Chapter 8: Factors Affecting Farmers’ Participation

78 Farmers’ Participation in India’s Futures Markets: Potential, Experience, and Constraints
Table 8.10: Assessing support from trading and delivery centres in different states
Effective demand determinationMean of responses Significance
Gujarat MP t-value Pr > |t|
Dealer services 2.34 2.02 2.50 *
Awareness camp 2.18 1.64 4.00 ***
Exchange intervention 2.32 1.55 5.71 ***
Brokerage fee 2.19 1.55 4.80 ***
APMC assistance 2.50 2.00 3.74 ***
Ease of trading account opening 2.39 1.96 3.34 **
Assistance in Settlement 2.04 1.57 3.74 ***
Offseting losses (MTM) by members 1.07 1.23 -2.66 **Note: *** = < 0.1 percent, ** = < 1 percent, * = < 5 percent, # = < 10 percent significance
8.5. Problems Encountered by Farmers in Futures MarketsThe top 5 problems perceived by farmers for participating in futures markets are (ranked from major to minor; based on sum of farmers’ response scores) -
1. Mismatch between available expected future spot and reported futures prices
2. Complexity in mark-to-market settlement
3. Middlemen creating a significant barrier to entering futures markets
4. Speculative trade information from broker’s terminal
5. Preference for paper-based transactions or absence of physical delivery
Also, notably the above problems are highly positively correlated with the number of crops produced by the farmer and not correlated with the size of land owned. This means that the higher the number of different crops grown by a farmer, the higher is his perceived problems; possibly because contracts vary for different crops. The table 8.11 below shows the sum of responses for 199 farmers (on a scale of 1-5). The correlations are between the response averages and number of crops grown and hectares of land owned (rounded).
Table 8.11: Correlation between the top 5 problems and number of crops, land-size
No. Problem Score (out of 995)
Correlation with No. of Crops
Correlation with Size of Land
1 Price arbitrage 767 0.812 -0.160
2 Mark-to-market settlement 747 0.800 -0.130
3 Entry barrier 744 0.697 0.303
4 Speculative trade 741 0.832 0.106
5 Paper-based transactions 738 0.714 -0.135
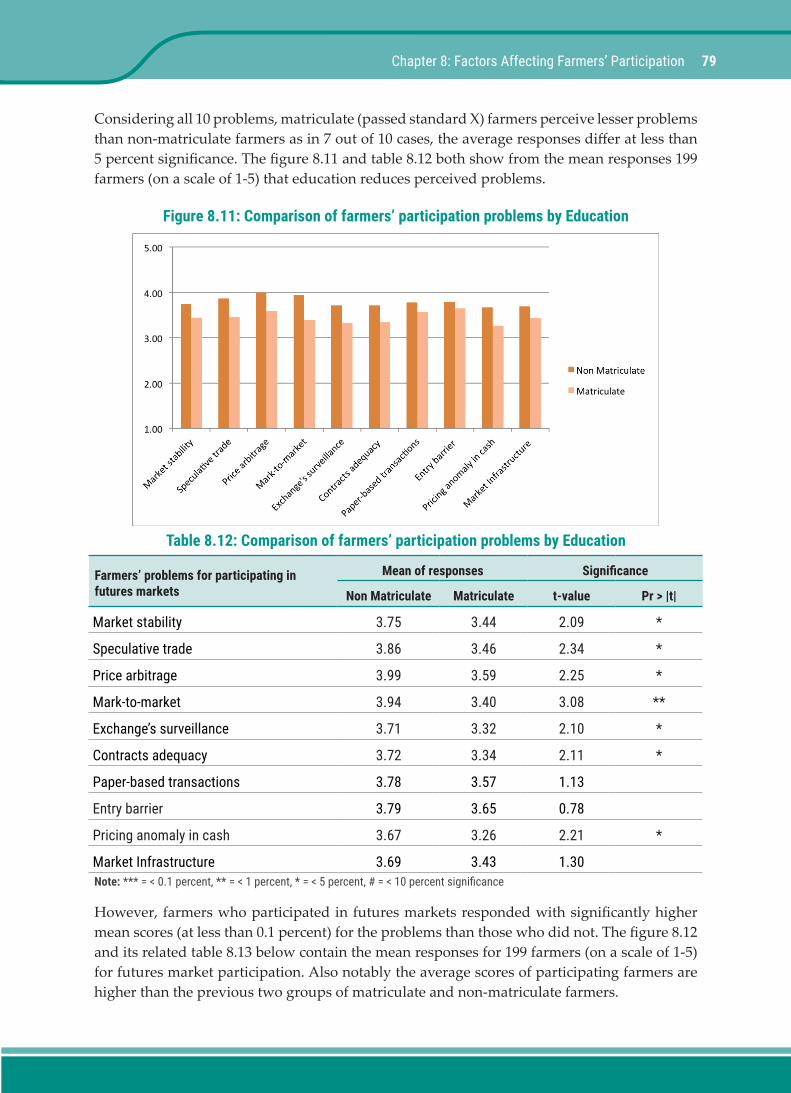
79
Considering all 10 problems, matriculate (passed standard X) farmers perceive lesser problems than non-matriculate farmers as in 7 out of 10 cases, the average responses differ at less than 5 percent significance. The figure 8.11 and table 8.12 both show from the mean responses 199 farmers (on a scale of 1-5) that education reduces perceived problems.
Figure 8.11: Comparison of farmers’ participation problems by Education
Table 8.12: Comparison of farmers’ participation problems by Education
Farmers’ problems for participating in futures markets
Mean of responses Significance
Non Matriculate Matriculate t-value Pr > |t|
Market stability 3.75 3.44 2.09 *
Speculative trade 3.86 3.46 2.34 *
Price arbitrage 3.99 3.59 2.25 *
Mark-to-market 3.94 3.40 3.08 **
Exchange’s surveillance 3.71 3.32 2.10 *
Contracts adequacy 3.72 3.34 2.11 *
Paper-based transactions 3.78 3.57 1.13
Entry barrier 3.79 3.65 0.78
Pricing anomaly in cash 3.67 3.26 2.21 *
Market Infrastructure 3.69 3.43 1.30Note: *** = < 0.1 percent, ** = < 1 percent, * = < 5 percent, # = < 10 percent significance
However, farmers who participated in futures markets responded with significantly higher mean scores (at less than 0.1 percent) for the problems than those who did not. The figure 8.12 and its related table 8.13 below contain the mean responses for 199 farmers (on a scale of 1-5) for futures market participation. Also notably the average scores of participating farmers are higher than the previous two groups of matriculate and non-matriculate farmers.
Chapter 8: Factors Affecting Farmers’ Participation

80 Farmers’ Participation in India’s Futures Markets: Potential, Experience, and Constraints
Figure 8.12: Comparison of farmers’ participation problems by Participation
Table 8.13: Comparison of farmers’ participation problems by Participation
Farmers’ problems for participating in futures markets
Mean of responses Significance
Not participated Participated t-value Pr > |t|
Market stability 3.32 4.11 -6.05 ***
Speculative trade 3.32 4.30 -6.40 ***
Price arbitrage 3.49 4.38 -5.44 ***
Mark-to-market 3.32 4.37 -6.62 ***
Exchange’s surveillance 3.15 4.20 -6.43 ***
Contracts adequacy 3.21 4.13 -5.74 ***
Paper-based transactions 3.32 4.26 -5.75 ***
Entry barrier 3.41 4.21 -4.88 ***
Pricing anomaly in cash 3.18 4.04 -5.08 ***
Market Infrastructure 3.33 3.98 -3.41 ***Note: *** = < 0.1 percent, ** = < 1 percent, * = < 5 percent, # = < 10 percent significance
On similar lines, farmers in Gujarat (where participation is higher) responded with significantly higher mean scores (at less than 0.1 percent) for the problems than those in Madhya Pradesh. The figure 8.13 and its related table 8.14 below contain mean responses for 198 farmers (on a scale of 1-5) belonging to states of Gujarat and Madhya Pradesh.

81
Figure 8.13: Comparison of farmers’ participation problems by State
Table 8.14: Comparison of farmers’ participation problems by State
Farmers’ problems for participating in futures markets
Mean of responses Significance
Gujarat MP t-value Pr > |t|
Market stability 3.81 3.17 4.19 ***
Speculative trade 4.00 2.98 5.82 ***
Price arbitrage 4.11 3.15 5.22 ***
Mark-to-market 3.97 3.17 4.29 ***
Exchange’s surveillance 3.90 2.74 6.38 ***
Contracts adequacy 3.85 2.91 5.17 ***
Paper-based transactions 3.99 2.91 6.08 ***
Entry barrier 3.90 3.32 3.05 **
Pricing anomaly in cash 3.81 2.75 5.71 ***
Market Infrastructure 3.86 2.87 4.84 ***Note: *** = < 0.1 percent, ** = < 1 percent, * = < 5 percent, # = < 10 percent significance
8.6. Factors that May Influence Farmers to JoinThe top 5 factors influencing farmers’ decision to participate in futures markets are (ranked from major to minor; based on sum of farmers’ response scores) -
1. Pooling, weighing, grading and standardization are essential to enhance farmer participation (value addition)
2. Availability of storage structures
Chapter 8: Factors Affecting Farmers’ Participation

82 Farmers’ Participation in India’s Futures Markets: Potential, Experience, and Constraints
3. More campaign to enhance awareness of futures markets
4. Access to pledge/commodity-based structured financing at reasonable rate of interest
5. Customized contracts for farmers: contract size, price band, and margining system
Also, notably the above factors are again highly positively correlated with the number of crops produced by the farmer and not correlated with the size of land owned. The table below shows the sum of responses for 199 farmers (on a scale of 1-5). The correlations are between the response averages and number of crops grown and hectares of land owned (rounded).
Table 8.15: Correlation between the top 5 factors and number of crops, land-size
No. Factors Score (out of 995)
Correlation with No. of Crops
Correlation with Size of Land
1 Value addition 831 0.858 0.220
2 Storage 827 0.707 0.173
3 Degree of awareness 818 0.695 0.282
4 Pledge - financing 806 0.630 0.383
5 Customized contract 801 0.846 0.118
Interestingly, non-matriculate (not passed standard X) farmers also perceive better opportunities than matriculate farmers. The figure 8.14 and corresponding table 8.16 below contains the mean responses for 199 farmers (on a scale of 1-5) based on their educational attainment. However, the differences in mean responses between the groups are not significant barring a few cases where it is significant at 5 and 10 percent levels. Since both groups of farmers elicit similar responses, education must not a qualifying criterion for market officials to bring in futures / forwards market awareness.
Figure 8.14: Comparison of factors influencing farmer participation by Education
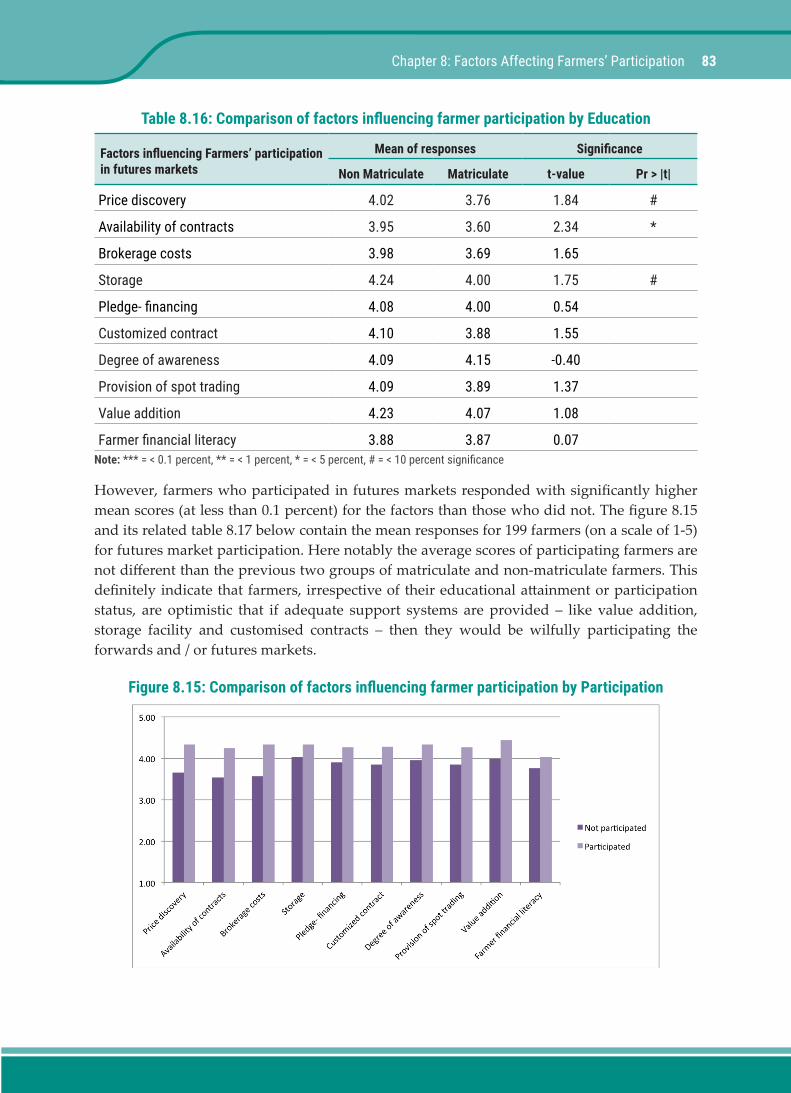
83Chapter 8: Factors Affecting Farmers’ Participation
Table 8.16: Comparison of factors influencing farmer participation by Education
Factors influencing Farmers’ participation in futures markets
Mean of responses Significance
Non Matriculate Matriculate t-value Pr > |t|
Price discovery 4.02 3.76 1.84 #
Availability of contracts 3.95 3.60 2.34 *
Brokerage costs 3.98 3.69 1.65
Storage 4.24 4.00 1.75 #
Pledge- financing 4.08 4.00 0.54
Customized contract 4.10 3.88 1.55
Degree of awareness 4.09 4.15 -0.40
Provision of spot trading 4.09 3.89 1.37
Value addition 4.23 4.07 1.08
Farmer financial literacy 3.88 3.87 0.07Note: *** = < 0.1 percent, ** = < 1 percent, * = < 5 percent, # = < 10 percent significance
However, farmers who participated in futures markets responded with significantly higher mean scores (at less than 0.1 percent) for the factors than those who did not. The figure 8.15 and its related table 8.17 below contain the mean responses for 199 farmers (on a scale of 1-5) for futures market participation. Here notably the average scores of participating farmers are not different than the previous two groups of matriculate and non-matriculate farmers. This definitely indicate that farmers, irrespective of their educational attainment or participation status, are optimistic that if adequate support systems are provided – like value addition, storage facility and customised contracts – then they would be wilfully participating the forwards and / or futures markets.
Figure 8.15: Comparison of factors influencing farmer participation by Participation

84 Farmers’ Participation in India’s Futures Markets: Potential, Experience, and Constraints
Table 8.17: Comparison of factors influencing farmer participation by Participation
Factors influencing Farmers’ participation in futures markets
Mean of responses Significance
Not participated Participated t-value Pr > |t|
Price discovery 3.65 4.33 -5.51 ***
Availability of contracts 3.54 4.24 -5.24 ***
Brokerage costs 3.56 4.33 -4.80 ***
Storage 4.03 4.33 -2.27 *
Pledge- financing 3.90 4.27 -2.76 **
Customized contract 3.85 4.28 -3.29 **
Degree of awareness 3.96 4.33 -2.84 **
Provision of spot trading 3.85 4.27 -3.08 **
Value addition 3.99 4.44 -3.30 **
Farmer financial literacy 3.76 4.04 -2.05 *Note: *** = < 0.1 percent, ** = < 1 percent, * = < 5 percent, # = < 10 percent significance
Finally and quite noticeably, farmers in Gujarat (where participation is higher) responded with similar mean scores for these 10 factors as those in Madhya Pradesh. Though on some factors where Gujarat has a higher score, the difference is statistically significant, but for others where scores from Madhya Pradesh is higher, the difference is not large or statistically significant. The figure 8.16 and its related table 8.18 below show the mean responses for 198 farmers (on a scale of 1-5) belonging to states of Gujarat and Madhya Pradesh.
Figure 8.16: Comparison of factors influencing farmer participation by State

85Chapter 8: Factors Affecting Farmers’ Participation
Table 8.18: Comparison of factors influencing farmer participation by State
Factors influencing Farmers’ participation in futures markets
Mean of responses Significance
Gujarat MP t-value Pr > |t|
Price discovery 4.10 3.45 4.62 ***
Availability of contracts 3.92 3.58 2.14 *
Brokerage costs 4.12 3.23 5.09 ***
Storage 4.17 4.13 0.23
Pledge- financing 3.99 4.23 -1.58
Customized contract 4.01 4.08 -0.45
Degree of awareness 4.09 4.17 -0.54
Provision of spot trading 4.01 4.08 -0.40
Value addition 4.20 4.11 0.56
Farmer financial literacy 3.94 3.68 1.72 #Note: *** = < 0.1 percent, ** = < 1 percent, * = < 5 percent, # = < 10 percent significance
8.7. Findings and DiscussionThis analysis was made to find the major reasons that are impeding adoption of futures / forwards markets by farmers and the possible avenues to bring in more awareness and participation. Though the NCDEX itself is trying its best to create awareness and knowledge of how such markets work and their benefits, the state governments too should try to reach out to the different farmer associations and dispel most of their concerns regarding the speculative and complex nature of futures markets. Given the farmer sample collected in this study, the major problems lie in the mismatch between available expected future spot and reported futures prices, complexity in mark-to-market settlements, entry barriers created by middlemen, speculative trade information from broker’s terminal and the absence of physical delivery. We see that the perception of problems to be higher (at 1 percent statistical significance) among those who participated in these markets and in Gujarati farmers.
The NCDEX has a customer testimonial page (National Commodity and Derivative Exchange, 2016) that has responses from farmers, traders and analysts. While the traders and analysts are all praising the exchange, the responses from farmers here are mixed. For example, Mr. Firoz Patel (possibly from Gujarat) says
“The beneficiaries are only 10-20% big farmers, who are also traders. Most of the farmers are not in position to hold their crop that much longer and they sell 70-80% of their produce within one month of harvesting.” (NCDEX, 2016)

86 Farmers’ Participation in India’s Futures Markets: Potential, Experience, and Constraints
Whereas Mr. Janki Prasad (from Madhya Pradesh) quips
“We had anticipated this kind of rise in coming months and so sold only 25% of my crop. I am from MP and the kind of crop I witnessed around gave me the confidence in predicting future prices and NCDEX prices also helped me in it. I am very happy and want prices to be like it always.” (NCDEX, 2016)
Therefore understandably the playing field is not fully levelled. While some farmers are reaping the benefits of price rises by being able to store produce themselves, the others are apprehensive of market fluctuations and do not participate. In this regards, the top factors that can influence farmers are value additions (Pooling, weighing, grading and standardization), availability of storage structures, access to pledge/commodity-based structured financing at reasonable rate of interest and finally customized contracts for farmers: contract size, price band, and margining system. Interestingly, the responses from farmers do vary for state and participation, but not on educational attainment (passed matriculate exams). This result supports the notion that farmer awareness camps will be useful for all.
Finally, the high positive correlation between the crops grown in number and mean responses to problems as well as the influencing factors show that probably these farmers may benefit the most from these markets if their problems are solved. Further, based on their multiple transactions in these markets, they can later become opinion leaders as well. Also not all commodities are traded equally in the futures markets that raise problems for farmers growing more than 2-3 crops, as they need to be associated with different markets – spot and futures for different crops. For such farmers, customized contracts may come in handy.

87
9.1. Summary and Concluding RemarksThe motivation for this study emerged from long-standing policy questions on marketing and managing risks for small farmers in India. Though National Agriculture Policy sought to protecting small farmers from market failures and externalities, often, they remain excluded from the service access and often under-represented in the beneficiaries (Feder et al., 2011). However, since the early 2000s, there has been a policy thrust on smallholder market access and risk management (Acharya, 2004; Ranjan, 2005). Commodity futures/ forward markets are an outcome of this market-oriented approach. Futures market in India has witnessed significant development and structural change in the recent past. The performance of commodity exchanges and the way they facilitate trading has helpd the development of the market in general. But they have not yet attracted the significant participation of producers and commercial users, especially in agricultural futures. While the futures market is expected to help substantially in price discovery and risk management, there has been considerable debate on its utility in academic and policy circles. FMC, the earlier commodity derivative market regulator, has recently been merged with SEBI in 2015. This development bringing regulatory convergence might offer better prospects for broad-based participation in the derivative markets in India (Ghosh and Dey, 2015).
The idea of promoting several national commodity exchanges in many Asian countries in late 90s or early 2000s may be at odds with the socialistic philosophy of pro-poor development and welfare. In India’s context, commodity futures trading has had a chequered history.
Commodity derivative trading in India is not of recent origin. While it has its mention in Kautilya’s Arthashastra, commodity derivative trading has flourished in Indian exchanges with high level of success ever since the mid-19th century till the 1960s, when it was eventually banned, as it was thought to be in contravention with the socialistic philosophy of development that the nation was committed to. In the new millennium, however, as commodity futures trading was resumed in regional and newly set up national commodity exchanges, the automated electronic demutualized trading system replaced the earlier jobber driven system (Dey and Maitra, 2012: p. 22).
The forecasting power of forward and futures prices to predict future spot prices is part of the social utility that may be attached to futures markets...regarding futures prices, they are the
CHAPTER 9
Summary, Conclusion and Policy Recommendations
88 Farmers’ Participation in India’s Futures Markets: Potential, Experience, and Constraints
result of open and competitive trading on the floors of exchanges and, as such, translate the underlying supply and demand or, rather, their expected values at various points in the future. Information about expected future spot prices is valuable for several reasons: in the case of storable commodities, there prices determine the storage decisions or commercial firms; higher futures prices signal the need for greater storage and lower futures prices point to a reduction in current inventory. Reflecting expectations about future supply and demand, futures prices trigger decisions about storage, production and consumption that relocate the supply and demand for a commodity over time. Social welfare is increased by the avoidance of disruption in the flow of goods and services (Geman, 2005: p. 24).
Unless the derivative markets have participation from many small-scale growers, the role of these markets cannot be realized from a socialistic viewpoint (Ali and Gupta, 2011; Dey and Maitra, 2016). It may be noted that small farmers are often reluctant to venture into risky entrepreneurial activities in the absence of effective risk mitigation measures. Their participation in futures trading could be a utopian proposition. Though the Task Force kept a provision of farmer organization to participate in trading, the intervention has failed to scale up (Asokan and Arya, 2008). The aggregator model, though an attractive proposition, has its own set of constraints. Farmer indirect participation in the market may also improve and/or moderate the expectations for crop sowing, marketing and agricultural investment decisions.
The literature shows that the institutional roles in aggregation efforts during 2007-2008 had encouraged Gujarat farmers’ participation in cotton futures market. Also, the futures price information helped several farmers develop spot price expectations for cotton, castor, and guar seed in some pockets of Gujarat. However, these efforts had ended abruptly as the initiative was pilot in nature. Two development organizations, Aga Khan Rural Support Programme (India) and Self-Employed Women’s Association were instrumental in farmer price information access or their participation to hedging the price risk. In 2002-2003, a new form of farmer organization came into existence, known as (Famer) Producer Company that is a hybrid corporate entity of a cooperative and limited company. The concentration of these entities has been more in Madhya Pradesh (90 odd in number), while Gujarat (20) and Rajasthan (36) have been showing these at a slower pace. As the objective is also to infuse entrepreneurial/business skills in small farmers’ collectives and make the cooperative competitive, Producer Companies have been attempting to link small farmers with the market. They have tried to exploit the scope of newly promoted exchange-traded forward contract in certain commodities.
Given these developments towards direct and indirect participation of farmers in futures markets, including development organizations and Producer Companies as aggregators in the forward/futures market, the study attempts to explore farmer participation in the exchange-traded derivative markets and the direct and indirect benefits accruing to them. The study examines the futures market efficiency in price discovery and price dissemination applying Johansen’s co-integration test and error correction model, especially in cumin, castor, wheat, rapeseed-mustard, guar seed, cotton, and coriander futures contracts traded on the NCDEX futures platform for considerable period. Unlike the new wheat futures contract launched in 2009, these commodities have not seen any suspension in trading since the floating of contracts started. The contracts are not identical and vary in their frequency/ period of contract, as well as specifications of trading unit, delivery unit, order size, margin, delivery logic, quality parameters, price limit, and position limit (as presented in Annexure 3). Before testing the futures

89
market efficiency, liquidity and bid-ask spread analysis has been conducted on agricultural futures contracts. Then, a few futures contracts are chosen and tested for efficiency in price formation as well as prospects for farmer participation in the market. Findings indicate that the selected futures played a strong role in price discovery, and suggests that farmers can use these futures prices to form their spot price expectation, especially if the direct participation remains infeasible. Coriander futures contract however had a problem of irregular delivery due to operational problems. A non-stable explosive correction in coriander futures and spot price (basis) raised concerns over the long-run equilibrium price-relationship or the (natural) convergence between its futures and spot price. But the new wheat contract showed good liquidity with futures and spot price being co-integrated in the long-run. Castor seed, cumin, rapeseed-mustard futures appeared to show efficient price discovery and price dissemination. Since guar seed and cotton (raw) futures are not found efficient or have contained some speculative intent in futures pricing, farmers need to be cautious while participating in these markets. Benefits depend on the nature of participation and farmer organization’s market timing ability. The cottonseed oilcake futures could be utilized to realize a positive payoff using a cash-n-carry arbitrage trading strategy.
The study next sought to understand the socio-economic and exchange-related issues in relation to farmer participation in the market. Six rounds of field surveys were undertaken between December 2014 and August 2015, and 199 farmers were covered. Gujarat (56 percent) contributed maximum to the sample pool followed by Madhya Pradesh (26%), and Rajasthan (18%). Among various strata of farmers based on their landholdings and other socio-economic variables, small and medium farmers accounted for a major share. The main objective for interviewing the farmers through a survey instrument (schedule) was to study their relationship with various market agencies involved in spot and futures markets. Aggregators and Producer Companies engaged in futures and forward markets helped in the identification and survey of farmers who had experience with either direct or indirect participation. About 41% of sample farmers were aware of futures trading, while the remaining were not familiar with the futures trading mechanics. Though they have been exposed to price information board installed at the regulated market yard, their showed inability to decode the information or its relevance for the use. Besides several socio-economic variables, the survey instrument has included cell phone usage as an instrumental variable to explain farmer participation. It is found that about 50% farmers own a mobile phone and 30% of them access futures and spot price information through the Reuters Market Light SMS/in-calls service. In the survey, information on farmer’s profile related to landholdings, education level, farm income, ownership of livestock and farm machinery, were also recorded. The survey also covered their market awareness which can be a measure of financial literacy. The impact of mobile phone on farmer marketing decision is examined through this. The degree of association and level of satisfaction with agencies/institutions was also recorded. It is evident that while most of the farmers have similar degrees of association with development organizations and cooperatives/Producer Companies, regulated market officials and traders, they show a higher level of satisfaction with farmers organizations – cooperatives and producer companies. This may be due to the patronage and the services rendered. It was found that brokers, warehousing companies, and financial institutions were yet to show substantial reach or service delivery in this context in the rural
Chapter 9: Summary, Conclusion, and Policy Recommendations

90 Farmers’ Participation in India’s Futures Markets: Potential, Experience, and Constraints
areas. All sample farmers were growing at least one cash crop either in the kharif season or the rabi season – such as cotton, soybean, rapeseed-mustard, coriander, and guar seed. They market their produce through various channels. But their access to storage or pledge financing has been minimal. There is substantial heterogeneity in their market participation (Pennings and Leuthold, 2001; Garcia and Leuthold, 2004).
Third, the study examines the institutional roles in aggregation efforts. A case study approach has been adopted to understand the intervention of aggregators in the forward/futures market. Most earlier studies have not examined the demand and supply environment, and the distribution of futures trading services. This study attempted to cover a number of factors contributing to the economics of farmer participation in the derivative market. This would offer some future direction to the regulator and policy makers to initiate reforms for improving the market structure, conduct, and performance. Demand related factors are, namely market awareness (financial literacy), risk preference, futures trading know-how, among others. Supply-side factors include (futures) trading terminal, broker service, futures contract information board. Besides, the proximity of broker office, awareness camp, exchange official’s training and visit, trading account opening service show the distribution of futures trading services.
Fourth, the study explores the key factors inhibiting and promoting farmer participation in the market. Before the identifying the statistically significant factors through an exploratory factor analysis, the study examined farmer responses on futures market attributes and their benefits. It is found that a major proportion of sample farmers were not fully aware of the futures markets, but they were of the view that futures can play a role in price discovery and reduce income variability. However, they were apprehensive of bearing the risks of losses in trading that might outweigh the direct benefits of futures market, such as securing profits or payoffs. Factors constraining farmer participation include market instability (price volatility), mark-to-market settlement risk, and membership fee and margin money, lack of physical delivery, and frequency and severity of off-market trades. Insufficient trading platforms, insufficient exchange-accredited warehouse, low adoption rate of negotiable warehouse receipt by banks for commodity structured financing also inhibited their participation. However, there is scope for increasing their participation. The factors enhancing their participation include futures role in price discovery, trading (arbitrage) opportunities, commodity financing, and multiple contracts for a single commodity. The field surveys reveals that in the opinion of traders, processors, and oil millers, although the market is efficient in price formation, it is not amenable to risk management or hedging. Delivery from forward/futures trading may not be preferable if the commodity is readily available in the physical or spot market.
Fifth, the study examines the likelihood of farmer participation that is conditional upon farmer financial literacy, farm income, landholdings, education level, and cell phone use, among other economic resources. Findings suggest that farmer risk-aversion, loan/warehouse receipt financing facility, training and visit by exchange officials, significantly explain the likelihood of farmer participation, while poor market awareness or low financial literacy complemented by cell phone usage have a negative impact on the likelihood of farmer particiaption in futures market. Survey also revealed that a majority of sample farmers are apprehensive of bearing

91
the risks of losses in the trading that could outweigh direct benefits such as secured payoff or reduced income variability. However, farmers may use future and spot price information indirectly for crop planning, and marketing of standing crops and for deciding on agricultural investment and marketing risks using information from efficient futures markets. Heterogeneity in risk preference and effectuation of collective investment impact farmer market access and influence the participation (Francesconi and Wouterse, 2015).
Liquidity and participation are important attributes of the futures market performance from a market microstructure point of view (Mattos and Garcia, 2004). Since distribution of income or/and returns has been skewed in agricultural commodity markets, government intervention cannot be brushed aside. To this end, market monitoring through a robust regulatory architecture is important. Since the participants in agricultural markets are diverse, researchers need to be careful in drawing inferences about the futures market efficiency and its role in price discovery. A robust surveillance mechanism under a prudent regulatory architecture, if put in place would go a long way in insulate growers from untoward market movements and adverse market externalities.
Futures market efficiency needs to be interpreted succinctly considering a few instrumental factors, viz. liquidity, heterogeneity in participation, delivery logic of the contract, among others. To this end, the regulator needs to strengthen the settlement and delivery processes of the contract that might curb in speculative behavior of agents. This would benefit the growers and sustain a healthy trade environment. For a good impact of the price dissemination project, theoretically, futures market needs to be efficient to make the price dissemination faster than the spot. This can improve the functioning of underlying spot market by providing available information and reflecting the economic value of the commodity. However, information access may be a costly affair for farmers. A robust market microstructure to improve a seamless interaction between the futures and spot would be very helpful. Thus, existence of futures markets is justified for providing legitimate price expectation to the growers.
This study can be extended to other parts of India to improve the reliability and validity. The study might be scaled up to cover representative farmer organizations and organizations which have obtained an institutional membership in the forward/futures trading. Exploring inter-regional disparity in farmer participation and their attitude to the adoption of insurance or/and exchange-traded derivative instrument can be a useful topics of future research. Also, some psychometric variables, namely risk aversion, market orientation, entrepreneurial attitude, among others can be considered to explain inter-regional differences in farmer risk management behaviour.
9.2. Policy RecommendationsThe study has several policy implications. However, the following suggestions may show a way forward to enhance growers’ market awareness and their participation.
• Real-time futures and spot price information dissemination is essential through installation
Chapter 9: Summary, Conclusion, and Policy Recommendations

92 Farmers’ Participation in India’s Futures Markets: Potential, Experience, and Constraints
of more number of electronic price-ticker boards under the price dissemination project of the Commission/competent authorities. Directorate of Marketing and Inspection, Agricultural Technology Management Agency, the Ministry of Agriculture need to work in-sync with other actors to enable the display of price information of major crop-arrivals in principal and sub-yards of Agricultural Produce Market Committee;
• Commodity exchanges can make producers aware of the utility of exchange-traded products. It may, however, be noted that most of the producers are small and marginal, and only a little goes to the market as marketable surplus. Farmer producer organizations through a local institutional arrangement may thus pool member produce on a lot basis, grade, and deliver to exchange notified delivery centers. They can draw indirect benefits from the derivative market if the direct participation is not feasible at all.
• Mandi modernization programme needs to be implemented or scaled up for integrating both regulated spot and futures markets. To this end, setting up of a national-level common agricultural market coupled with speedy implementation of price dissemination project might reduce information asymmetry across the primary and secondary markets. Authentic price pooling and reliable data management could strengthen farmer crop choice and sowing decisions, agricultural investments, and marketing strategies;
• Exchanges need to redesign contract specifications of forward/futures instrument with respect to position limit, contract/lot size, delivery order, price band, price limit, tick size, basis variety, and basis centre, margining and delivery schedule along with single/multi-product hedge contract design to enhance the degree of participation. While these efforts on the part of exchnages and their members could asses the demand and supply environment for trading, distribution of traidng and associated services should receive considerable attention from the regulator.
• Artificial hoarding and off-market trades sometimes defeats the very purpose of the trading in commodities. A prudent regulatory architecture may, therefore, introduce necessary amendments to the code of conduct of exchanges and brokers and curb in the speculative intent of market agents. The SEBI-FMC merger may address this concern and instil buoyancy in the market functioning.
• Support of government organizations such as Food and Civil Supplies Corporation, State Agricultural Marketing Board, and Small Farmers’ Agribusiness Consortium is essential to promote several pro-growers programmes on how to market their produce and optimize their risk-return metrics.
• Voluntary/development organizations, resource management organizations, and financial institutions might facilitate a relational or bilateral contracting between producer organizations and market agencies/bulk buyers in physical markets and assist them in forward/futures trading using various types of trading strategies, cash-n-carry arbitrage or calendar spread for instance. National Institute of Agricultural Marketing can impart training to these entities and make them understand the trading nuances. Market infrastructure institutions, such as warehousing and collateral management agencies may promote pledge/commodity-based financing against the negotiable warehouse receipt issued against stored commodities.

93
• Exchange regulation and surveillance can be an area of focus for the regulator to accommodate a larger section of producers or commercial users of commodities in the trade. Exchanges need to adopt good governance practices to strengthen their operations by formalizing performance goals in alignment with their mission and vision. A diversified board, through a proper succession planning, may resolve inherent conflicts between the regulator, exchange, promoters, and members. Reports by the Working Groups on call auction for determining final settlement price and setting up of an independent clearing corporation, coupled with the liquidity enhancement scheme can be instrumental to bring greater fairness and rationality in the trade and efficiency in the market.
Chapter 9: Summary, Conclusion, and Policy Recommendations

94 Farmers’ Participation in India’s Futures Markets: Potential, Experience, and Constraints
95
Acharya, S. S. (2004). State of the Indian Farmer – Agricultural Marketing. Vol. 17, Academic Foundation, New Delhi.
Aker, J.C. and Ksoll, C. (2015). Can mobile phones improve agricultural outcomes? Evidence from a randomized experiment in Niger, Food Policy (in-press).
Ali, J. and Gupta, K.B. (2011). Efficiency in agricultural commodity futures markets in India – Evidence from co-integration and causality test. Agricultural Finance Review, 71(2), 162-178.
Asokan, S. R. and Arya, A. (2008). Farmers’ participation in futures trading: Problems and prospects. Productivity, 48(4), 359-366.
Barham, J. and Chitemi, C. (2009). Collective action initiatives to improve marketing performance: Lessons from farmer groups in Tanzania. Food Policy, 34, 53 – 59.
Berg, A. E. (2007). The HAFED experience: Wheat hedging on the NCDEX. [Online] http://www.fmi-inc.net/news/pdfs/HAFEDExperience.pdf viewed on November 12, 2010.
Bernard, T. and Spielman, D. J. (2009). Reaching the rural poor through rural producer organizations? A study of agricultural marketing cooperatives in Ethiopia. Food Policy, 34, 60-69.
Brooks, C. (2008), Introductory Econometrics for Finance, Cambridge University Press, New York.
Chand, R. (2012). Development policies and agricultural markets. Economic and Political Weekly, 47(52), 53-63.
Coe, C. A. (2006). Farmer participation in market authorities of Coffee exporting countries”, World Development, 34(12), 2089 – 2115.
Cole, S., and Hunt, S. (2010). Information, expectations and agricultural investment: Evidence from a field experiment in India. Policy Research Working Paper, USAID/BASIS Grant Research, Harvard Business School, [online] http://mitsloan.mit.edu/neudc/papers/paper_311.pdf viewed on May 20, 2011.
Cole, S., and Fernando, N. (2008). Assessing the importance of financial literacy. Asian Development Bank - Finance for the Poor, 9(2), 1-6.
Collins, R. (1997). Toward a positive economic theory of hedging. American Journal of Agricultural
References
96 Farmers’ Participation in India’s Futures Markets: Potential, Experience, and Constraints
Economics, 79(2), 488-499.
Darrat, A.F. and Rahman, S. (1995). Has futures trading activity caused stock price volatility? Journal of Futures Market, 15, 347-353.
Dey, K. (2015a). Unified Market Platform: how can the benefits reach the needy? Hindu Business Line, April 10.
Dey, K. (2015b). How producer firms can help growers by taking part in futures, Hindu Business Line, June 9.
Dey, K. (2015c). Spread analysis can help improve analysts’ predictive ability. Hindu Business Line, June 24.
Dey, K., and Alur, S. (2012). Do futures benefit Indian coffee producers? Int. J. of Economic Policy in Emerging Economies, 5(4), 318-341.
Dey, K., and Maitra, D. (2012). Price discovery in Indian commodity futures market: An empirical exercise. Int. J. of Trade and Global Markets, 5(1), 68-87
Dey, K., and Maitra, D. (2016). Can futures markets accommodate Indian farmers?, Journal of Agribusiness in Developing and Emerging Economies, 6(2), 150-172.
Dickey, D.A. and Fuller, W.A. (1979). Distribution of the estimators for autoregressive time series with a unit root. Journal of American Statistical Association, 74(366), 427-431.
Engle, R.F. and Granger, C.W.J. (1987). Co-integration and error correction: Representation, estimation and testing. Econometrica, 55(2), 251-276.
Feder, G., Briner, R. and Anderson, J. R. (2011). The private sector’s role in agricultural extension systems: Potential and limitations. Journal of Agribusiness in Developing and Emerging Economies, 1(1), 31-54.
Fernandes, K. and Mor, N. (2009). ‘Risk management for the small farmer’ in Kaul, S. (Ed), India Commodity Year Book 2009, National Collateral Management Services Limited, Mumbai, pp. 68-73.
Francesconi, G. N. and Wouterse, F. (2015). The health of farmer-based organizations in Ghana: Organizational diagnostics and governance implications. Journal of Development Studies, 51(3), 262-273.
Garcia, P. and Leuthold, R. M. (2004). A selected review of agricultural commodity futures and options markets. European Review of Agricultural Economics, 31(3), 235 -272.
Geman, H. (2005). Commodities and Commodity Derivatives: Modelling, Pricing of Agricultural, Metals and Energy (1 ed.). John Wiley, London.
Ge, Y., Wang, H.H. and Ahn, S.K. (2008). Implication of cotton price behavior on market integration. Proceedings of the NCCC-134 Conference on Applied Commodity Price Analysis, Forecasting, and Market Risk Management, St. Louis, Missouri.
Ghosh, N. (2010). Role of thin commodity futures markets in physical market price making: An analysis of Wheat futures in India in the post-ban era. Working paper 6, Takshashila Academia of Economic Research (TAER), Mumbai.
Ghosh, N. and Dey, K. (2015). ‘Opportunities and challenges of regulatory convergence in
97
India’s financial sector: The case of the SEBI-FMC merger’ (special article), Economic and Political Weekly, 50(36), 64-70
Granger, C.W. J. (1981). Some properties of time series data and their use in econometric model specification. Journal of Econometrics, 16, 12-130.
Hansen, H. and Juselius, K. (1995), Cats in Rats: Co-Integration Analysis of Time Series, Evanston Illinois, Estima, USA.
Hellin, J., Lundy, M. and Meijer, M. (2009). Farmer organization, collective action and market access in meso-America. Food Policy, 36(3), 16-22.
Hjelm, G. and Johansson, M.W. (2005). A Monte Carlo study on the pitfalls in determining deterministic components in co-integrating models. Journal of Macroeconomics, 27, 691-703.
Hull, J. C. (2007). Options, Futures, and Other Derivatives (7th Edition), New Delhi, Prentice-Hall India.
James, H.S., Jr. and Sykuta,, M. E. (2006). Farmer trust in producer- and investor-owned firms: evidence from Missouri corn and soybean producers. Agribusiness, 22(1), 135-153.
Johansen, S. (1988). Statistical analysis of co-integration vectors. Journal of Economic Dynamics and Control, 12(2/3), 231-454.
Johansen, S. and Juselius, K. (1990). Maximum likelihood estimation and inference on co- integration with applications to the demand for money. Oxford Bulletin of Economics and Statistics, 52(2), 169-210.
Kabra, K.N. (2007). Commodity futures in India. Economic and Political Weekly, 42 (31), 1163-1169.
Kang, M.G. (2005). An introduction to market-based instruments for agriculture price risk management. Working Paper, Food and Agriculture Organization of the United Nations.
Karande, K. (2006). A Study of Castor Seed Futures Market in India, PhD Thesis, Indira Gandhi Institute of Development Research (IGIDR), Mumbai.
Karbuz, S. and Jumah, A. (1995). Co-integration and commodity arbitrage. Agribusiness, 11, 235-243.
Kolamkar, D.S., Thomas, S. Nair, C. K. G., Sahoo, M. S. and Suresh, U. (2014). Report of the Committee to suggest steps for fulfilling the objectives of price discovery and risk management of commodity derivatives markets. Forward Markets Commission, Mumbai, available at http://www.fmc.gov.in/WriteReadData/links/Comm_derivs_future_market_report-957964109.pdf (accessed on May 28, 2014).
Kostav, P. and Davidova, S. (2013). A quantile regression analysis of the effects of farmers’ attitudes and perceptions on market participation. Journal of Agricultural Economics, 64(1), 112-132.
Kumar, B. and Pandey, A. (2009). Role of indian commodity derivatives market in hedging price risk: Estimation of constant and dynamic hedge ratio and hedging effectiveness, available at http://papers.ssrn.com/sol3/papers.cfm?abstract_id=1452881 (accessed 20 January, 2011).
Kumar, Richa (2010). Mandi traders and the dabba: Online commodity futures markets in India. Economic and Political Weekly, 45(31), 63-70.Kyle, A.S. (1985). Continuous auctions and insider trading. Econometrica, 53, 1315-1336.
References

98 Farmers’ Participation in India’s Futures Markets: Potential, Experience, and Constraints
Larson, D., Varnagis, P. and Yabuki, N. (1998). Commodity risk management and development, Working paper – 1963, Research Group Rural Development, World Bank.
Lence, S.H. (2003). Do futures benefit farmers who adopt them? Working Paper – 03-20, Agricultural and Development Economics Division, Food and Agriculture Organization of United Nations.
Lingareddy, T. (2008). Expert Committee on commodity futures: Agreements and disagreements. Economic and Political Weekly, 43(34), 35-42.
Lingareddy, T. (2015). Commodity futures trading at the crossroads. Economic and Political Weekly, 50 (24),113-116.
Mattos, F. and Garcia, P. (2004). Price discovery in thinly traded markets: Cash and futures relationships in Brazilian agricultural futures markets. Proceedings of the NCR-134 Conference on Applied Commodity Price Analysis, Forecasting, and Market Risk Management at St. Louis, Missouri, April, 2004.
Meijerink, G. Bhulte, E. and Alemu, D. (2014). Formal institutions and social capital in value chains: The case of the Ethiopian commodity exchange. Food Policy, 49, 1-12.
Meinzen-Dick, R. S. (2009). Co-ordination in natural resource management. In J. F. Kirsten, A. R. Dorward, C. Poulton, & N. Vink (Eds.), Institutional economics: Perspectives on African agricultural development (pp. 319–342). Washington, DC: International Food Policy Research Institute.
Mohan, S. and Love, J. (2004). Coffee Futures: role in reducing coffee producers’ price risk. Journal of International Development, 16, 983 –1002.
Multi Commodity Exchange (2008). Enabling farmers to leverage commodity exchanges. Research Report, August issue, 2008, MCX, Mumbai.
Nair, C.K.G. (2004). Commodity futures markets in India: ready for take-off? in Newsletter of National Stock Exchange, available at http://www.nseindia.com/ content/press/jul2004a.pdf (accessed 21 February 2011).
Nair, C.K.G. (2011). Regulatory reforms in Indian commodity futures Mmarket – An analysis of commodity futures exchange as regulatory interface between State and the Market. PhD Thesis, Jawaharlal Nehru University, New Delhi.
National Commodity and Derivative Exchange (2015). Arbitrage trading in commodities, available at http://www.ncdex.com/Downloads/NCDEXImpact/PDF/ARBITRAGE_TRADING_IN_COMMODITIES.pdf (accessed on October 3, 2015).
National Commodity and Derivative Exchange (2016). Customer Testimonial, available at http://www.ncdex.com/NCDEXImpact/CustomerTestimonial.aspx (accessed on 10 April, 2016)
O’ Hara, M. (1995). Market Microstructure Theory, Blackwell Publishing House, United Kingdom.
Pannell, D., G. Hailu, A. Weersink and A. Burt (2007). More reasons why farmers have so little interest in futures markets, Working Paper – 0702, School of Agricultural and Resource Economics.
Pannell, D., Hailu, G., Weersink, A. and Burt, A. (2007). More reasons why farmers have so little interest in futures markets, Working paper – 0702, School of Agricultural and Resource
99
Economics.
Patrick, G. F., Musser, W. N. and Eckman, D. T. (1998). Forward marketing practices and attitudes of large-scale mid-Western grain producers. Review of Agricultural Economics, 20, 38-53.
Paul, I. (2011). An assessment of the opportunities and challenges of the Ethiopian commodity exchange. Journal of Sustainable Development in Africa, 13(1), 1–16.
Pavaskar, M. (2005). Death trap for commodity futures. Economic and Political Weekly, 40(1), 14-19.
Pavaskar, M. (2008). Ring system required for farm futures. Indian Journal of Agricultural Economics, 63(1), 108-115.
Pennings, J.M.E. and Egelkraut, T.M. (2003). Research in agricultural futures markets: integrating the finance and marketing approach. Agrawirtshaft, 52, 300-308.
Pennings, J.M.E. and Garcia, P. (2004). Hedging behaviour in small and medium-sized enterprises: The role of unobserved heterogeneity. Journal of Banking and Finance, 28, 951-978.
Pennings, J.M.E. and Leuthold, R.M. (2000). The role of farmers’ behavioural attitudes and heterogeneity in futures contract usage. American Journal of Agricultural Economics, 82(4), 908–919.
Pennings, J.M.E. and Leuthold, R.M. (2001). Introducing new futures contracts: reinforcement versus cannibalism. Journal of International Money and Finance, 20, 659 -675.
Peri, M., Baldi, L., and Vandone, D. (2013). Price discovery in commodity markets. Applied Economic Letters, 20, 397-403.
Phillips, P.C.B. and Perron, P. (1988). Testing for a unit root in time series regression. Biometrica, 75(2), 335-346.
Raipuria, K. (2003). Price stability and futures: Need for a macro-development framework. Economic and Political Weekly, 38 (51-52), 5330.
Ramaseshan, R. (2012). Market design- the forgotten key. Hindu Business Line, August 5.
Ranjan, N. (2005). Role of commodity exchanges, futures and options – a case study on soya oil, Occasional paper – 46, Department of Economic Analysis and Research, National Bank of Agriculture and Rural Development (NABARD).
Roll, R. (1984). A simple implicit measure of the effects of bid-ask spread in an efficient market. Journal of Finance, 23, 1127-1139.
Roy, A. (2008). Dynamics of Indian spot and futures wheat markets: Issues and implications, PhD Thesis (unpublished), Indian Institute of Management, Ahmedabad.
Sabnavis, M. and S. Jain (2007). Working of commodity futures markets. Economic and Political Weekly, 42(18), 1641-1643.
Sahadevan, K.G. (2014). Economic benefits of futures: Do speculators play spoilsport in agricultural commodity markets. Economic and Political Weekly, 49 (52), 45-53.
Sahavevan, K. G. (2012). Commodity futures and regulation. Economic and Political Weekly,
References
100 Farmers’ Participation in India’s Futures Markets: Potential, Experience, and Constraints
47(52), 106-112.
Sen, A., Joshi, S. Sinha, S. Apte, P. and Ram, K. (2008). Expert Committee to study the impact of futures trading on agricultural commodity prices. The Expert Committee Report, Ministry of Consumer Affairs, Food and Public Distribution, New Delhi, available at http://www.fmc.gov.in/htmldocs/Abhijit%20Sen%20Report.pdf (accessed on September 4, 2009).
Sharma, P. (2013). Leveraging farmer organizations to boost production, mitigate risk and strengthen food security: Lessons and challenges, Journal of Land and Rural Studies, 1(1), 41-48.
Singh, S. (2008). Producer Companies as New Generation Cooperatives. Economic and Political Weekly, 43(20), 22 – 24.
Singh, S. and Singh, T. (2014). Producer Companies in India – A study of Organization and Performance. CMA Monograph, Indian Institute of Management, Ahmedabad, Allied Publishers, New Delhi.
Sitko, N. and T. S. Jayne (2012). Why are African commodity exchanges are languishing: A case study of the Zambian agricultural commodity exchange. Food Policy, 37(3), 275-282.
Tadesse, G. and Bahiigwa, G. (2015). Mobile phones and farmers’ marketing decisions in Ethiopia. World Development, 68, 296-307.
Tomek, W.G. and Peterson, H.H. (2001). Risk management in agricultural markets: A review. Journal of Futures Markets, 21(10), 953-985.
Ton, G. (2008). Challenges for smallholder market access: A review of literature on institutional arrangements in collective marketing. Stewart Post-Harvest Review, 5(1), 1-6.
Trebbin, A. and Hassler, M. (2012). Farmers’ producer companies in India: A new concept for collective action? Environment and Planning A, 44, 411-427.
UNCTAD (2006). Trade and Development Report. Global partnership and national policies for development. United Nations. Accessed from http://unctad.org/en/Docs/tdr2006_en.pdf on September 16, 2015.
Yang, J. and Leatham, D. J. (1999). Price discovery in wheat futures markets. Journal of Agricultural and Applied Economics, 31(2), 359-370.
Yang, J., Bessler, D.A. and Leatham, D.J. (2001). Asset storability and price discovery in commodity futures markets: A new look. Journal of Futures Markets, 21(3), 279-300.
Zant, W. (2001). Hedging price risks of farmers by commodity boards: A simulation applied to the Indian natural rubber market. World Development, 29(4), 691-710.
Zapata, H. O., Fortenbery, T. R., and Armstrong, D. (2005). Price discovery in the world Sugar futures and cash markets: Implications for the Dominican Republic. Agricultural and Applied Economics Staff, Paper No. 469, Department of Agricultural and Applied Economics, University of Wisconsin-Madison.

101
Annexure 1Survey Questionnaire (CMA Project)
A Study of farmer participation in India’s futures markets, IIM Ahmedabad1. SURVEY LOCATION AND FARMER TYPE
Sl. No. Date Name of investigator Village Taluka/District
119
Respondent Type
Farmer Farmer + Trader/Aggregator Farmer + Miller Other
Large (>10 ha) Medium (2-10 ha) Small (1-2 ha)
Marginal (<1 ha) Landless2. FARMER PROFILE
Name of respondent: Contact No.
Age:
Head of household? Yes No No. of family members:
Education:
Source of income: Main Other:
Cattle owned: Yes No
Farm Machinery held: Yes No
Distance: Village to the nearest town
Total Annual Income of the family:
_____________________________
Total Annual Income from Farming:
_______________________________________
Soil type: a) Light/Medium/Heavy b) Alkaline/Normal/Acidic
Sources of irrigation Canal Tube well Bore Well Tank River Other____
Land holding (in____) Irrigated Unirrigated/rainfed Total
Owned
Leased in
Operated
Area under crops3. EXTENT OF FUTURES MARKET AWARENESS
Are you aware of futures markets? When did you first hear about it? Yes No
__________ years

102 Farmers’ Participation in India’s Futures Markets: Potential, Experience, and Constraints
Have you ever participated in futures markets? For how many years? When did you attend the first time?
Yes No
__________ years
Have you heard about “Price Dissemination Project”? Which year? Yes No
__________ years
Have you attended any workshop/training/seminar organized by Commodity Exchanges/State Agriculture Department? Yes No
If yes, what was its impact on your agronomic practices, agricultural marketing, and risk management approaches?
Description in brief:
4. CROPPING PATTERN
Season Crop Area (in_____) Irrigated/Rainfed Sold in market (Yes/No)
Kharif - 2014
Summer - 2014
Rabi-2013
Kharif-2013
Strongly agree Agree Indifferent Disagree Strongly disagree
5 4 3 2 1
Very satisfied Satisfied Indifferent Dissatisfied Very dissatisfied
5 4 3 2 1Note: Responses are to be captured on a likert-scale (1-5)
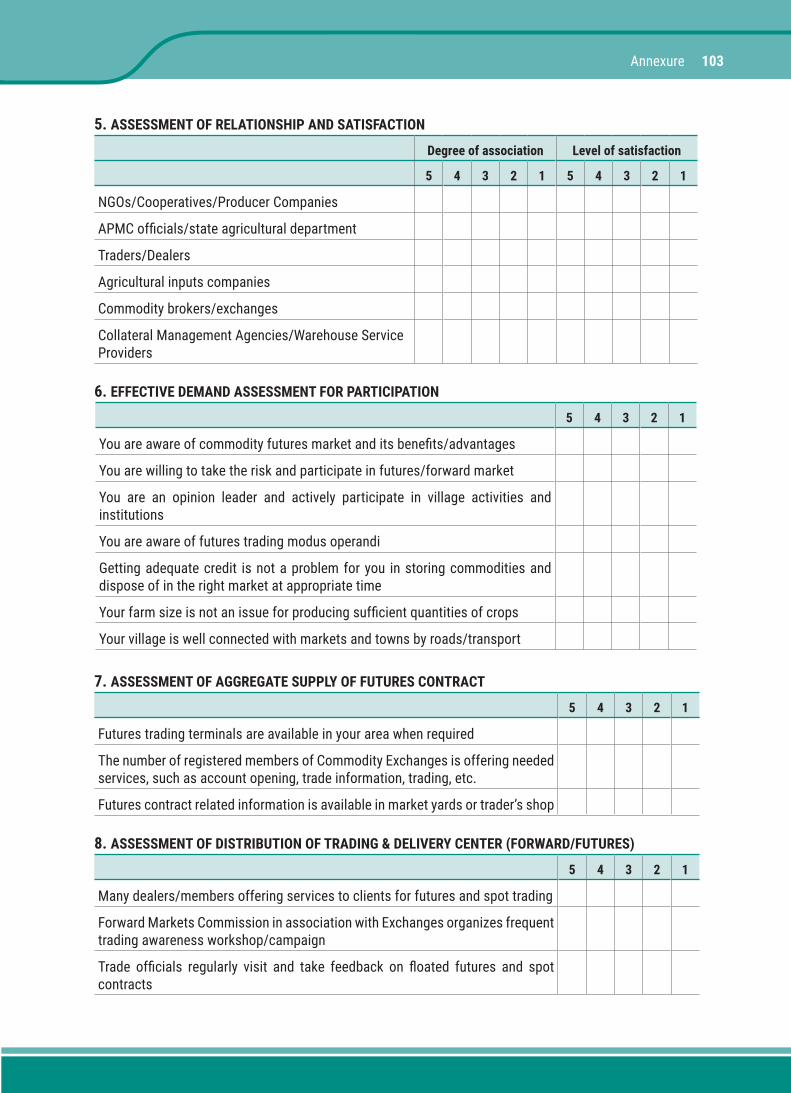
103
5. ASSESSMENT OF RELATIONSHIP AND SATISFACTION
Degree of association Level of satisfaction
5 4 3 2 1 5 4 3 2 1
NGOs/Cooperatives/Producer Companies
APMC officials/state agricultural department
Traders/Dealers
Agricultural inputs companies
Commodity brokers/exchanges
Collateral Management Agencies/Warehouse Service Providers
6. EFFECTIVE DEMAND ASSESSMENT FOR PARTICIPATION
5 4 3 2 1
You are aware of commodity futures market and its benefits/advantages
You are willing to take the risk and participate in futures/forward market
You are an opinion leader and actively participate in village activities and institutions
You are aware of futures trading modus operandi
Getting adequate credit is not a problem for you in storing commodities and dispose of in the right market at appropriate time
Your farm size is not an issue for producing sufficient quantities of crops
Your village is well connected with markets and towns by roads/transport
7. ASSESSMENT OF AGGREGATE SUPPLY OF FUTURES CONTRACT
5 4 3 2 1
Futures trading terminals are available in your area when required
The number of registered members of Commodity Exchanges is offering needed services, such as account opening, trade information, trading, etc.
Futures contract related information is available in market yards or trader’s shop
8. ASSESSMENT OF DISTRIBUTION OF TRADING & DELIVERY CENTER (FORWARD/FUTURES)
5 4 3 2 1
Many dealers/members offering services to clients for futures and spot trading
Forward Markets Commission in association with Exchanges organizes frequent trading awareness workshop/campaign
Trade officials regularly visit and take feedback on floated futures and spot contracts
Annexure
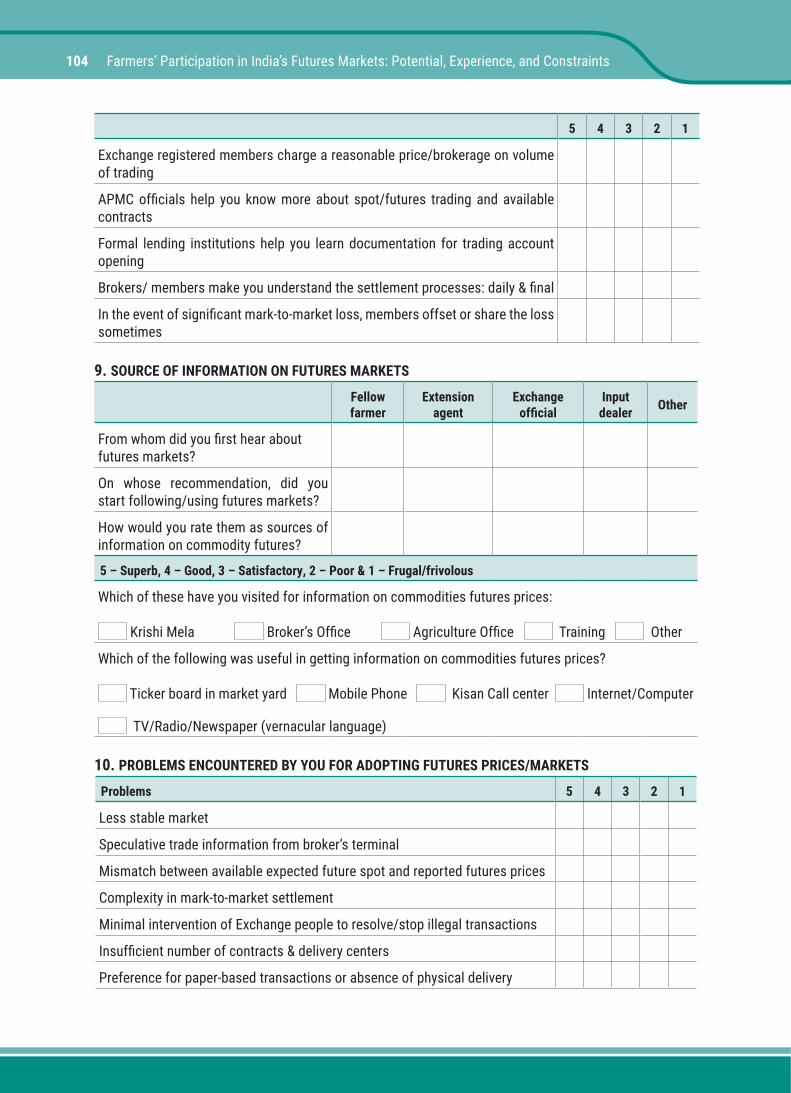
104 Farmers’ Participation in India’s Futures Markets: Potential, Experience, and Constraints
5 4 3 2 1
Exchange registered members charge a reasonable price/brokerage on volume of trading
APMC officials help you know more about spot/futures trading and available contracts
Formal lending institutions help you learn documentation for trading account opening
Brokers/ members make you understand the settlement processes: daily & final
In the event of significant mark-to-market loss, members offset or share the loss sometimes
9. SOURCE OF INFORMATION ON FUTURES MARKETS
Fellow farmer
Extension agent
Exchange official
Input dealer Other
From whom did you first hear about futures markets?
On whose recommendation, did you start following/using futures markets?
How would you rate them as sources of information on commodity futures?
5 – Superb, 4 – Good, 3 – Satisfactory, 2 – Poor & 1 – Frugal/frivolous
Which of these have you visited for information on commodities futures prices:
Krishi Mela Broker’s Office Agriculture Office Training Other
Which of the following was useful in getting information on commodities futures prices?
Ticker board in market yard Mobile Phone Kisan Call center Internet/Computer
TV/Radio/Newspaper (vernacular language)
10. PROBLEMS ENCOUNTERED BY YOU FOR ADOPTING FUTURES PRICES/MARKETS
Problems 5 4 3 2 1
Less stable market
Speculative trade information from broker’s terminal
Mismatch between available expected future spot and reported futures prices
Complexity in mark-to-market settlement
Minimal intervention of Exchange people to resolve/stop illegal transactions
Insufficient number of contracts & delivery centers
Preference for paper-based transactions or absence of physical delivery

105
Problems 5 4 3 2 1
Middlemen create a significant barrier to entering futures markets
Price anomaly is vibrant even in cash/spot markets
Services and infrastructure are not “up to the mark” in most market places
Other_______________________________Note: 5 – Extremely dangerous, 4 – Dangerous, 3 – Moderate, 2 – Nonsevere/light, 1 - None
11. FACTORS INFLUENCING YOUR CHOICE OF ENTERING FUTURES MARKETS
5 4 3 2 1
Stable futures markets for price discovery & risk management
Available/floating futures contracts for commodities having spot markets
Low transaction and Brokerage/commissions
Availability of storage structures
Access to pledge/commodity-based structured financing at reasonable rate of interest
Customized contracts for farmers: contract size, price band, and margining system
More campaign to enhance awareness of futures markets
There is a need to promote more spot exchanges in region-specific commodities
Pooling, weighing, grading and standardization are essential to enhance farmer participation
Formal credit institutions/banks and exchanges can educate farmers on the functioning of commodity markets
Other________________________________ Note: 5 – Highly significant, 4 – Significant, 3 – Somewhat important, 2 – Insignificant, 1 – Highly insignificant
12. Are there any other issues with the functioning of futures markets?
____________________________________________________________________________________________________________________________________________________________________________________________________________________________________________________________________________________________________________
13. Overall assessment of commodity futures markets with respect to non-derivative markets
5 4 3 2 1
Futures market is instrumental in price discovery, and risk management compared to non-derivative or spot markets
Understanding the market well can enhance payoff compared to non-derivative markets
Annexure

106 Farmers’ Participation in India’s Futures Markets: Potential, Experience, and Constraints
5 4 3 2 1
Futures markets require less margin money to trade compared to non-derivative markets
Standardized futures contract increase the barrier to farmers’ entry compared to non-derivative markets
Compliance issues related to risk management is robust in futures markets compared to non-derivative/spot markets
Futures trading brings in more liqudity than the spot
You can burn your fingers in futures unless you study the market in-depth
Futures markets can reduce income variability compared to non-derivative/spot markets
Note: 5 – Strongly agree, 4 – Agree, 3 – Partially agree/indifferent, 2 – Disagree, 1 – Strongly disagree
14. Describe up to 3 main advantages of/reasons for choosing futures prices/markets.
a. ______________________________________________________________________
b. ______________________________________________________________________
c. ______________________________________________________________________
15. Describe up to 3 main disadvantages of/reasons for not choosing futures prices/markets.
a. _____________________________________________________________________
b. _____________________________________________________________________
c. _____________________________________________________________________
16. What according to you needs to be done to improve the functioning of the futures market and its adoption by farmers?
____________________________________________________________________________________________________________________________________________________________________________________________________________________________________________________________________________________________________________
17. Any other comments or suggestions?
____________________________________________________________________________________________________________________________________________________________________________________________________________________________________________________________________________________________________________
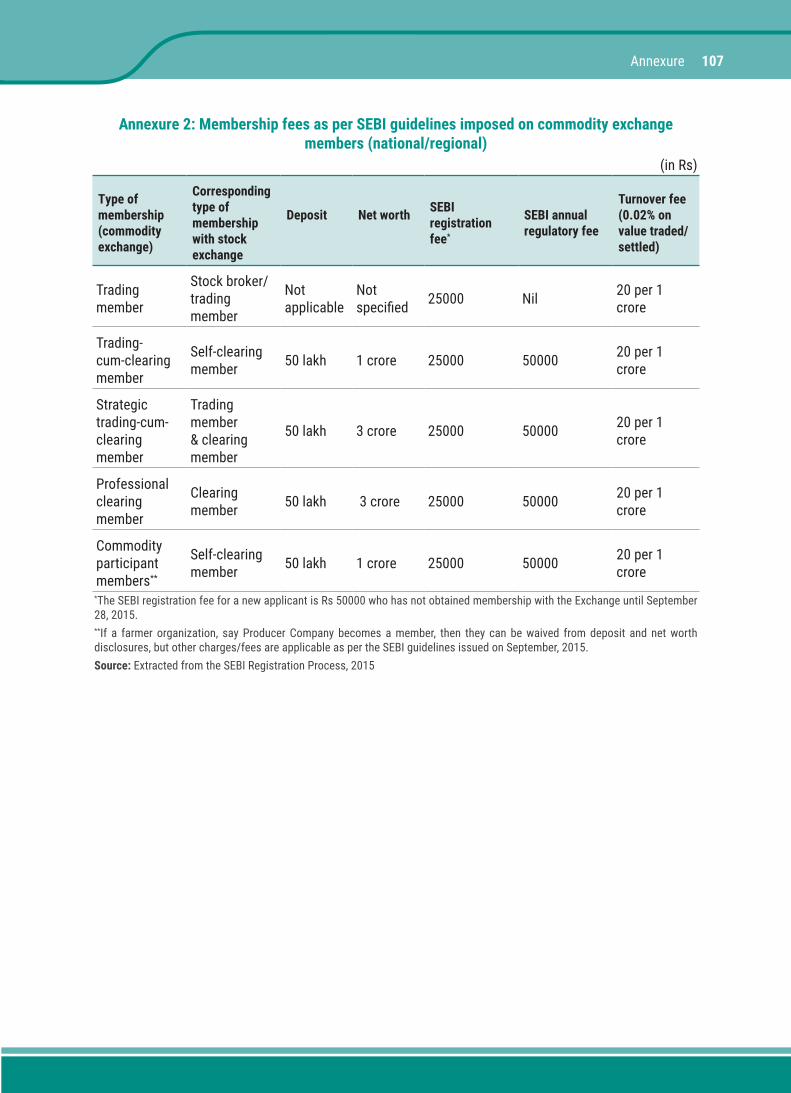
107
Annexure 2: Membership fees as per SEBI guidelines imposed on commodity exchange members (national/regional)
(in Rs)
Type of membership (commodity exchange)
Corresponding type of membership with stock exchange
Deposit Net worth SEBI registration fee*
SEBI annual regulatory fee
Turnover fee (0.02% on value traded/settled)
Trading member
Stock broker/trading member
Not applicable
Not specified 25000 Nil 20 per 1
crore
Trading-cum-clearing member
Self-clearing member 50 lakh 1 crore 25000 50000 20 per 1
crore
Strategic trading-cum-clearing member
Trading member & clearing member
50 lakh 3 crore 25000 50000 20 per 1 crore
Professional clearing member
Clearing member 50 lakh 3 crore 25000 50000 20 per 1
crore
Commodity participant members**
Self-clearing member 50 lakh 1 crore 25000 50000 20 per 1
crore*The SEBI registration fee for a new applicant is Rs 50000 who has not obtained membership with the Exchange until September 28, 2015.**If a farmer organization, say Producer Company becomes a member, then they can be waived from deposit and net worth disclosures, but other charges/fees are applicable as per the SEBI guidelines issued on September, 2015.Source: Extracted from the SEBI Registration Process, 2015
Annexure
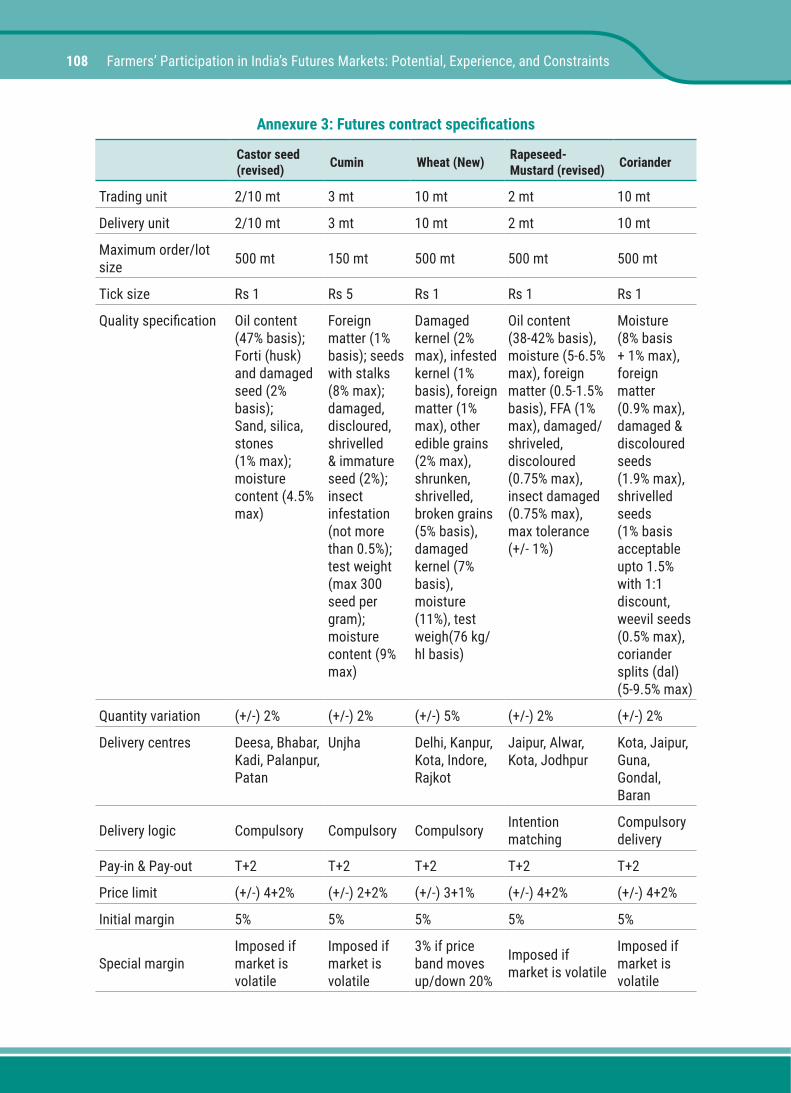
108 Farmers’ Participation in India’s Futures Markets: Potential, Experience, and Constraints
Annexure 3: Futures contract specifications
Castor seed (revised) Cumin Wheat (New) Rapeseed-
Mustard (revised) Coriander
Trading unit 2/10 mt 3 mt 10 mt 2 mt 10 mt
Delivery unit 2/10 mt 3 mt 10 mt 2 mt 10 mt
Maximum order/lot size 500 mt 150 mt 500 mt 500 mt 500 mt
Tick size Rs 1 Rs 5 Rs 1 Rs 1 Rs 1
Quality specification Oil content (47% basis);Forti (husk) and damaged seed (2% basis);Sand, silica, stones (1% max); moisture content (4.5% max)
Foreign matter (1% basis); seeds with stalks (8% max); damaged, discloured, shrivelled & immature seed (2%); insect infestation (not more than 0.5%); test weight (max 300 seed per gram); moisture content (9% max)
Damaged kernel (2% max), infested kernel (1% basis), foreign matter (1% max), other edible grains (2% max), shrunken, shrivelled, broken grains (5% basis), damaged kernel (7% basis), moisture (11%), test weigh(76 kg/hl basis)
Oil content (38-42% basis), moisture (5-6.5% max), foreign matter (0.5-1.5% basis), FFA (1% max), damaged/shriveled, discoloured (0.75% max), insect damaged (0.75% max), max tolerance (+/- 1%)
Moisture (8% basis + 1% max), foreign matter (0.9% max), damaged & discoloured seeds (1.9% max), shrivelled seeds (1% basis acceptable upto 1.5% with 1:1 discount, weevil seeds (0.5% max), coriander splits (dal) (5-9.5% max)
Quantity variation (+/-) 2% (+/-) 2% (+/-) 5% (+/-) 2% (+/-) 2%
Delivery centres Deesa, Bhabar, Kadi, Palanpur, Patan
Unjha Delhi, Kanpur, Kota, Indore, Rajkot
Jaipur, Alwar, Kota, Jodhpur
Kota, Jaipur, Guna, Gondal, Baran
Delivery logic Compulsory Compulsory Compulsory Intention matching
Compulsory delivery
Pay-in & Pay-out T+2 T+2 T+2 T+2 T+2
Price limit (+/-) 4+2% (+/-) 2+2% (+/-) 3+1% (+/-) 4+2% (+/-) 4+2%
Initial margin 5% 5% 5% 5% 5%
Special marginImposed if market is volatile
Imposed if market is volatile
3% if price band moves up/down 20%
Imposed if market is volatile
Imposed if market is volatile

109
Castor seed (revised) Cumin Wheat (New) Rapeseed-
Mustard (revised) Coriander
Position limit
Member: 120000 mt or 20% of market wide open positionClient: 12000 mt or 5% OI
Member: 3000 mt or 15% of OI, Client: 500 mt
Member: 100000 mt or 15% of OI, Client: 20000 mt
Member: 300000 mt or 20% of OI, Client: 30000 mt or 5% of OI
Member: 20000 mt or 20% of OI, Client: 2000 mt or 5% of OI
No of contracts a year 7 4 3 3 12 Source: Contract specifications adapted from NCDEX and compiled by the author
Annexure 4a: Farmer responses towards demand assessment for participation in futures/forward markets
(%)
High
ly
disa
gree
Disa
gree
Parti
ally
ag
ree
Agre
e
High
ly
agre
e
Mea
n
N =
199
Awareness of futures markets and their benefits 33.17 25.13 34.17 7.04 0.50 2.64
Willingness to take risk and participate 33.17 21.11 34.67 11.06 0 2.76
Opinion leadership 25.63 44.22 17.09 12.06 1.01 2.42
Trading know-how 28.14 42.21 24.62 4.02 1.01 2.33
Loan facility availed 17.59 49.25 28.64 3.02 1.51 2.39
Farmer size viability 20.10 29.65 25.13 22.11 3.02 2.78
Village connectivity (weathered road) 10.05 1.51 12.06 62.81 13.57 3.88
Annexure 4b: Farmer responses on assessment of aggregate supply of futures contract (%)
Very
low
Low
Indi
ffere
nt
High
Very
hig
h
Mea
n
N =
199
Futures trading terminal 25.63 45.73 25.63 3.02 0.00 2.31
Registered dealer/member 28.14 44.22 23.12 4.02 0.50 2.32
Futures contractinformation access/reach 35.68 28.64 26.63 8.54 0.50 2.57
Annexure
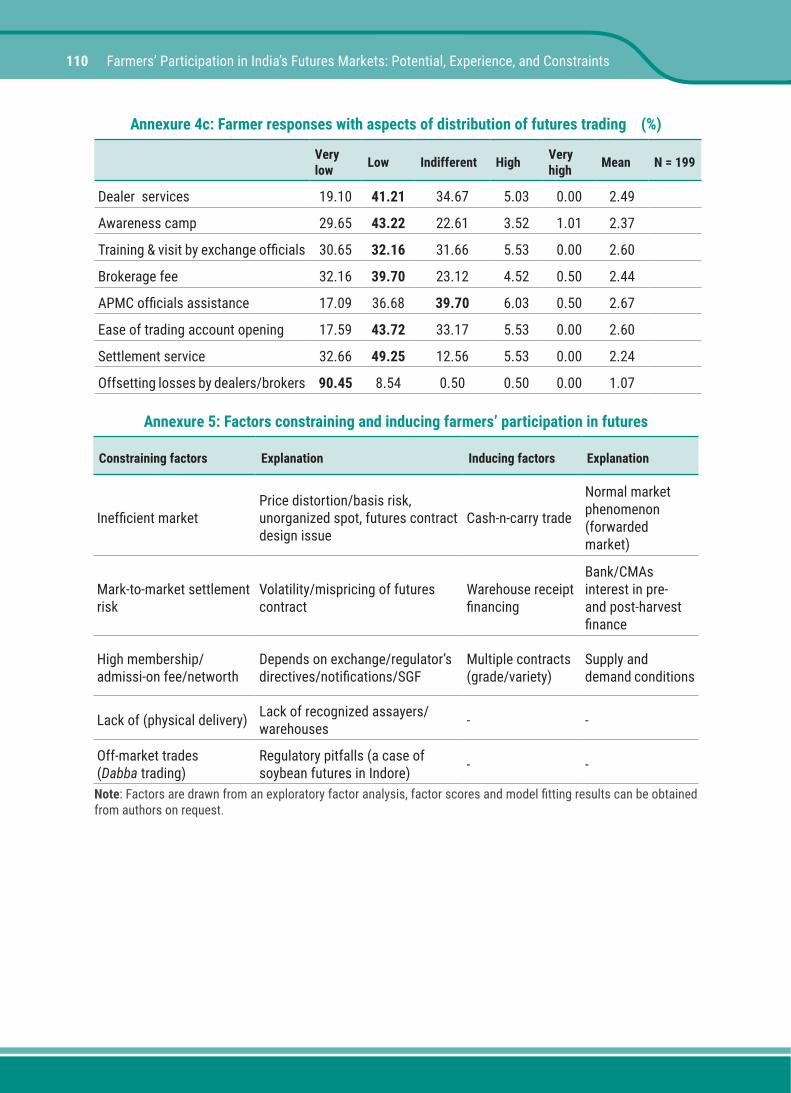
110 Farmers’ Participation in India’s Futures Markets: Potential, Experience, and Constraints
Annexure 4c: Farmer responses with aspects of distribution of futures trading (%)
Very low Low Indifferent High Very
high Mean N = 199
Dealer services 19.10 41.21 34.67 5.03 0.00 2.49
Awareness camp 29.65 43.22 22.61 3.52 1.01 2.37
Training & visit by exchange officials 30.65 32.16 31.66 5.53 0.00 2.60
Brokerage fee 32.16 39.70 23.12 4.52 0.50 2.44
APMC officials assistance 17.09 36.68 39.70 6.03 0.50 2.67
Ease of trading account opening 17.59 43.72 33.17 5.53 0.00 2.60
Settlement service 32.66 49.25 12.56 5.53 0.00 2.24
Offsetting losses by dealers/brokers 90.45 8.54 0.50 0.50 0.00 1.07
Annexure 5: Factors constraining and inducing farmers’ participation in futures
Constraining factors Explanation Inducing factors Explanation
Inefficient marketPrice distortion/basis risk, unorganized spot, futures contract design issue
Cash-n-carry trade
Normal market phenomenon (forwarded market)
Mark-to-market settlement risk
Volatility/mispricing of futures contract
Warehouse receipt financing
Bank/CMAs interest in pre- and post-harvest finance
High membership/admissi-on fee/networth
Depends on exchange/regulator’s directives/notifications/SGF
Multiple contracts (grade/variety)
Supply and demand conditions
Lack of (physical delivery) Lack of recognized assayers/warehouses - -
Off-market trades(Dabba trading)
Regulatory pitfalls (a case of soybean futures in Indore) - -
Note: Factors are drawn from an exploratory factor analysis, factor scores and model fitting results can be obtained from authors on request.

111
Center for Management in Agriculture (CMA) Indian Institute of Management Ahmedabad (IIMA)
Vastrapur, Ahmedabad – 380015
e-mail: [email protected] | Phone: +91-79-6632-4650, 6632-4651 | Fax: +91-79-6632-4652 Web: www.iima.ac.in