farmers’ perceptions of risk sources and ... farmers’ livelihood and rural economy (iqbal et...
TRANSCRIPT

Nazir et al., The J. Anim. Plant Sci. 28(3):2018
FARMERS’ PERCEPTIONS OF RISK SOURCES AND RISK COPING STRATEGIES INPAKISTAN
A. Nazir 1*, G. Li 1, M. J. Sheikh2, X. Zhou 1, A. Humayoon3, M. Rizwan1 and S. Akhtar 1
1College of Economics & Management, Huazhong Agricultural University, Wuhan 430070, China;2Department of Rural Sociology, Faculty of Agricultural Social Sciences, Sindh Agriculture University, Tandojam,
Pakistan. Email:[email protected] Department of Agricultural Economics, Faculty of Agricultural Social Sciences, Sindh Agriculture University,
Tandojam, Pakistan. Email:[email protected]*Corresponding author’s email: [email protected]
ABSTRACT
Agricultural risks potentially decelerate the growth of a country and augment poverty level. For understanding farmers’risk behavior and strategies to cope up possible related risks, the association to socioeconomic attributes, perceived risksources and coping strategies were studied. A total of 480 farmers from the left bank of Indus River (Sindh Province ofPakistan) were interviewed using multistage cluster sampling method through valid and reliable means. Principalcomponent analysis extracted 80% variations for both risk sources and risk coping strategies. While observing the effectof farmers’ demographic attributes on risk sources and coping strategies, change in agricultural machinery (Mean=4.25)for risk source, and promotion of products internationally (Mean=4.2) for management strategies were ranked theforemost. However, crop insurance, precautionary saving, off-farm activities and crop diversification were also foundsignificant. From the Goodness-of-Fit indices of CFA, the RMSEA value for risk sources was 0.056 and 0.074 for riskcoping strategies indicating that the measurement models are fit and within the required limits and considerablyacceptable for a measurement model or structural model. Hence, the outcomes of this study may provide useful insightfor policy makers, advisers, for decision making, developers and sellers of risk coping mechanisms.
Key words: Risk sources; Risk coping strategies; Factor analysis; EFA, CFA, Cronbach Alpha.
INTRODUCTION
Environmental and climate change related risksmake crop cultivation highly vulnerable, which leads toadverse impact on crop production and ultimatelydisturbs farmers’ livelihood and rural economy (Iqbal etal., 2016). Since, the farmers in developing countries arecompletely exposed to the uncertainties of environmentalhazards mainly due to floods, heavy rains, droughts,hailstorms, earthquakes, pest and diseases infestation,etc., therefore, many farmers are living on the edge ofinsecurity; sometimes falling just below, and sometimesrising just above the threshold of survival. Farmers do notknow whether rainfall will become a blessing orsupposed to an evil over a season; they do not know theprices they will receive for produce sold; and whethertheir crops will be survived by infected pests (Ullah et al.,2014). Consequently, several options are available tomanage risks, yet some farmers have developed their owncoping strategies based on their perceptions and attitudetowards risks (Ullah et al., 2016).
Likewise, risk is understood as a factual incidentor actual risk and is quite measurable (Boholm, 2003).Numerous researchers have indicated that farmerscarefully manage their high investment activities throughwhich the expected output is riskier and might lead to
crop failure (Adebusuyi 2004; Alderman 2008; Isam2014). These risks are expressively connected with theproduction, income, price and financial organizations(Ullah and Shivakoti 2014). Generally, it is expressedthat proper timing of rain is significant for productivity ofcrops, otherwise at the time of harvesting it can causeloss in productivity (Özkan et al., 2015). Overall, risk isassessment is a three-step process: (i) risk perception, (ii)risk coping and (iii) risk strategies to manage the risks. Inagriculture, risk perception is specified as strategicdecision making. Generally, risk is characterized into twogroups (i) business risk covering of natural, production,price, institutional, market and (ii) individual risks whichevery so often affects farmers livelihood (Di Falco andPerrings 2005 and Hardaker et al. 2004). Furthermore,Anwar et al., (2013) divulged that agriculture isaccompanied with infrequent climatic situations, pestinfestations and insects, and variance in commodityprices. Climate change and environment related risksmake crops exposed (Iqbal et al. 2016). Appropriate andspecific perceptiveness of risks could also supportfarmers to evaluate the consequences and likelihood ofunveiled risks (Burnett et al. 2013). The evaluation offarmer’s responses and their perceptions regarding risksare imperative due to its significance in perceiving thedecision-making behavior of farmers at the time of
Nazir et al., The J. Anim. Plant Sci. 28(3):2018
confronting uncertain condition (Van Winsen et al. 2016;and Kurkalova et al., 2006).
Agriculture sector is the mainstay of Pakistan’seconomy, and also faces certain climatic variations (Ullahet al. 2015). It contributes 19.5 % in GDP, utilizing42.3% and almost three fourth of the rural people dependdirectly or indirectly on agriculture (GOP 2016). Rapidlyincreasing population, decreasing per capita arable landand availability of water are the core dilemmas ofagriculture in Pakistan. Shortage of fresh water is the keyproblem for crops and farmers have to primarily rely onground water (Erenstein 2009). But the region is greatlyvulnerable to natural hazards mainly caused by undesiredclimate change, floods and droughts (Memon and Thapa2011; Ahmed 2013; Abid et al. 2015). In Sindh, thepopulation density per km2 is 142 and 7.4 /ha ofcultivated area (GOS 2008). In the region, the expandedirrigation facility has captivated an abysmal trail on theproductivity and environment of the basin itself due toescalating levels of water-logging and salinity anddegradation of deltaic ecology (Memon and Mustafa2012; Abid et al. 2015). Furthermore, agriculture sectorof the province faces a higher uncertainty, the rainwaterfloods maroon the rural settlements, and all agriculturaland nonagricultural livelihood activities are interruptedalong with the access to social services (LBG-IAC,2013).
In Pakistan, few similar studies are conducted atfarm level, in which data sets were used to identify theperceived importance of multiple risk sources. Theseinclude Iqbal, et al., (2016); Ullah, et al., (2016) whomidentified sources of risk regarding farm level in KPKnorthern province and cotton farmers in the northeasternPunjab province of Pakistan. They perceived to extremethreat to the viability of their productions relating todisasters and diseases. Though these studies haverecognized farmers’ sources of risk and indicated how
farmers behave under uncertainty, very less work iscarried out regarding how farmers perceive risk sourcesand how they manage it in practice the southeasternprovince. Thus, the changing trend of climate in Pakistanfurther predicts inappropriate similar events in future,which invited the researchers to conduct a comprehensivestudy in Sindh province of Pakistan behavior on thisburning issue. Till so far, no study has been conductedand drawn attention towards farmers’ risk perceptionsand risk coping strategies in the province/region at thislevel. Hence, this study is therefore designed to fill theresearch gap by exploring the farmers’ perceptionsregarding risk sources and risk coping strategies, anddetermine other factors influencing their decision-makingprocess of risk. Further to reveal the associations amongstperceptions of risk sources and risk coping strategies, thefactor scores/regression residuals were employed in OLSregression to see the relationship with farm and farmers’attributes.
This article is segregated into four segments.Segment 2 contains the material and methods, whichelucidates the analytical framework, and specifications ofmodels. In segment 3 the results and discussion of thestudy are elaborated and in segment 4, our results areconcluded.
MATERIALS AND METHODS
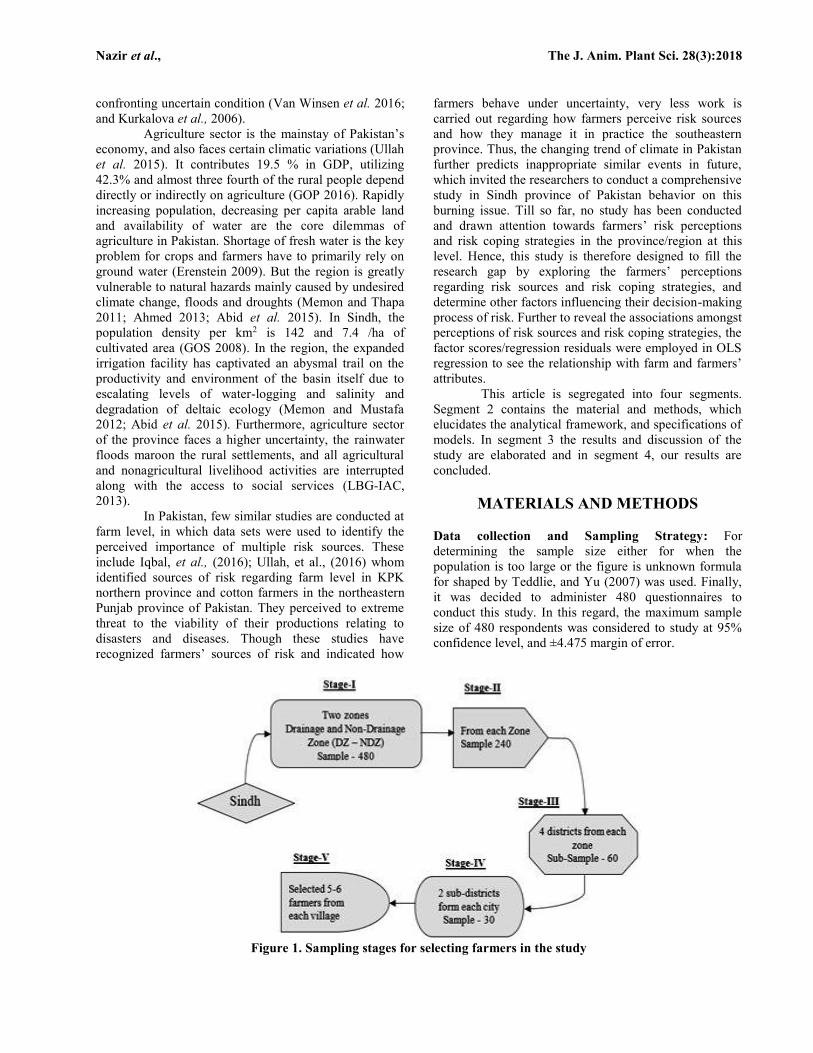
Data collection and Sampling Strategy: Fordetermining the sample size either for when thepopulation is too large or the figure is unknown formulafor shaped by Teddlie, and Yu (2007) was used. Finally,it was decided to administer 480 questionnaires toconduct this study. In this regard, the maximum samplesize of 480 respondents was considered to study at 95%confidence level, and ±4.475 margin of error.
Figure 1. Sampling stages for selecting farmers in the study
Nazir et al., The J. Anim. Plant Sci. 28(3):2018
…. (1)
Where, = Sample Size, Z2 = Abscissa of the
normal curve that cuts off an area at the 95%. Z = 1.96, e= desired level of precision. e = 0.05, p = estimatedproportion of an attribute that is present in the population,p = 0.5, q = 1-p, hence q = 0.5 respectively.
Further farm level cross sectional data wascollected from 480 farmers using multi-stage stratifiedcluster sampling technique (Error! Reference sourcenot found.). In the first stage, we selected the study area,by using the drainage area map of Sindh given by theSIDA (Sindh Irrigation and Drainage Authority). In thesecond stage left bank of Indus is divided into two zonesexisting drainage (LBOD) and (non-drainage) proposeddrainage areas. In the third stage four districts from eachzone were selected, keeping in view both heterogeneityand homogeneity in some attributes. In the fourth stage,two sub districts (Talukas) were selected. In the fifthstage, 5 to 6 farmers from each village were interviewed.Overall 480 and precisely from each zone 240 farmhousehold were interviewed. Prior starting the study,enumerators were trained off-field and in-field about thestudy intentions, questionnaire and data collectionmethods were explained briefly. Further, questionnairewas pre-tested in the field, not only to fulfill the reasonsof in-field training for interviewers, but likely forimproving the quality of survey and to avoid missing anyimportant data. The interviews were conducted basis ofresearch ethics and on shared research principles (Abid etal. 2016). Casual settlements were adopted, prior startingfarmers interview by clarifying the intentions of thestudy. Using interviewing method, 55 questions related todifferent risks sources, and 43 questions related todifferent types of coping strategies they prefer to copewith risk sources, their income sources and various otherfarm household characteristics were asked to rate througha valid and reliable 5 points (Strongly Disagree toStrongly Agree) Likert scale (Preston and Colman 2000).
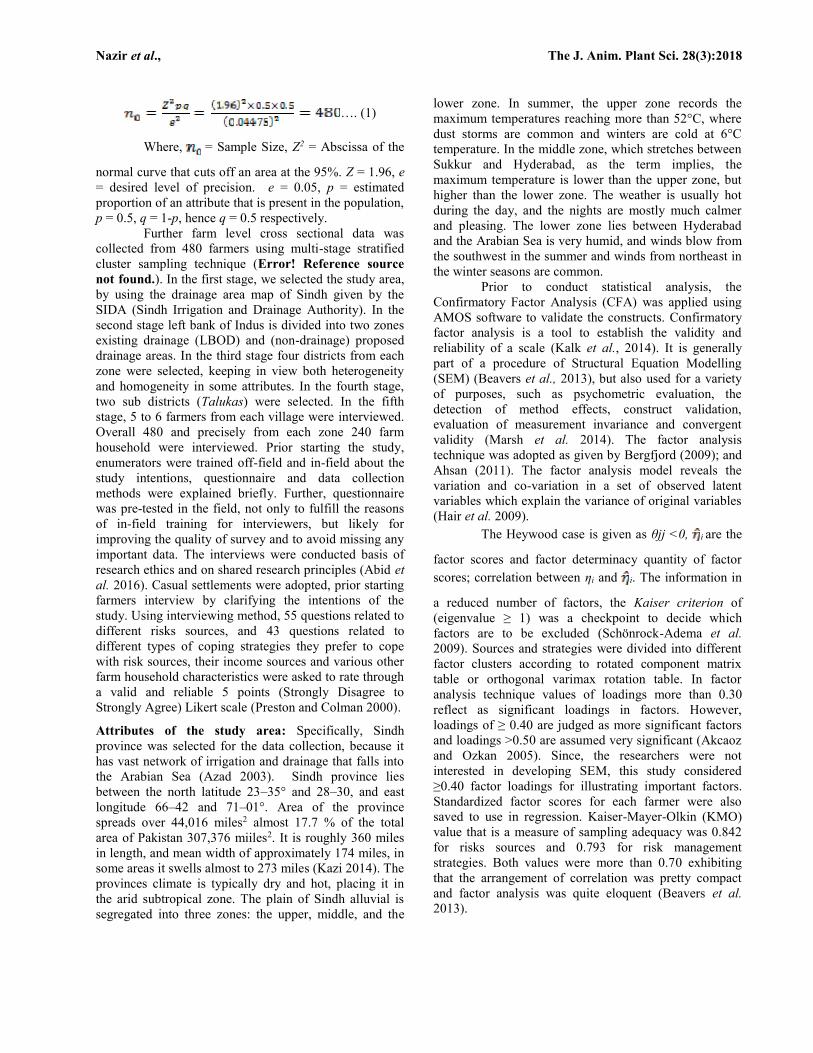
Attributes of the study area: Specifically, Sindhprovince was selected for the data collection, because ithas vast network of irrigation and drainage that falls intothe Arabian Sea (Azad 2003). Sindh province liesbetween the north latitude 23–35° and 28–30, and eastlongitude 66–42 and 71–01°. Area of the provincespreads over 44,016 miles2 almost 17.7 % of the totalarea of Pakistan 307,376 miiles2. It is roughly 360 milesin length, and mean width of approximately 174 miles, insome areas it swells almost to 273 miles (Kazi 2014). Theprovinces climate is typically dry and hot, placing it inthe arid subtropical zone. The plain of Sindh alluvial issegregated into three zones: the upper, middle, and the
lower zone. In summer, the upper zone records themaximum temperatures reaching more than 52°C, wheredust storms are common and winters are cold at 6°Ctemperature. In the middle zone, which stretches betweenSukkur and Hyderabad, as the term implies, themaximum temperature is lower than the upper zone, buthigher than the lower zone. The weather is usually hotduring the day, and the nights are mostly much calmerand pleasing. The lower zone lies between Hyderabadand the Arabian Sea is very humid, and winds blow fromthe southwest in the summer and winds from northeast inthe winter seasons are common.
Prior to conduct statistical analysis, theConfirmatory Factor Analysis (CFA) was applied usingAMOS software to validate the constructs. Confirmatoryfactor analysis is a tool to establish the validity andreliability of a scale (Kalk et al., 2014). It is generallypart of a procedure of Structural Equation Modelling(SEM) (Beavers et al., 2013), but also used for a varietyof purposes, such as psychometric evaluation, thedetection of method effects, construct validation,evaluation of measurement invariance and convergentvalidity (Marsh et al. 2014). The factor analysistechnique was adopted as given by Bergfjord (2009); andAhsan (2011). The factor analysis model reveals thevariation and co-variation in a set of observed latentvariables which explain the variance of original variables(Hair et al. 2009).
The Heywood case is given as θjj <0, i are the
factor scores and factor determinacy quantity of factorscores; correlation between ηi and i. The information in
a reduced number of factors, the Kaiser criterion of(eigenvalue ≥ 1) was a checkpoint to decide whichfactors are to be excluded (Schönrock-Adema et al.2009). Sources and strategies were divided into differentfactor clusters according to rotated component matrixtable or orthogonal varimax rotation table. In factoranalysis technique values of loadings more than 0.30reflect as significant loadings in factors. However,loadings of ≥ 0.40 are judged as more significant factorsand loadings >0.50 are assumed very significant (Akcaozand Ozkan 2005). Since, the researchers were notinterested in developing SEM, this study considered≥0.40 factor loadings for illustrating important factors.Standardized factor scores for each farmer were alsosaved to use in regression. Kaiser-Mayer-Olkin (KMO)value that is a measure of sampling adequacy was 0.842for risks sources and 0.793 for risk managementstrategies. Both values were more than 0.70 exhibitingthat the arrangement of correlation was pretty compactand factor analysis was quite eloquent (Beavers et al.2013).
Nazir et al., The J. Anim. Plant Sci. 28(3):2018
Figure 2. Sample study districts in Sindh province, Pakistan (World map source: ESRI, 2015).1.1 Analytical Procedure1.1.1 Factor Analysis1.1.2 Cronbach’s Alpha
For determining the reliability of the data,Cronbach’s alpha test was applied
Table 1. The internal consistency of reliability is based onthe extent of response to a certain question and similarlyfor others (Spiliotopoulou 2009). Whereas, theCronbach’s alpha was tested and reliability of data was0.655 to 0.966, where majority of the construct variablesfell between .8 to 0.9 range, which is considered excellentreliability.
Further, the homogenous factor scores achievedfrom the regression analysis were regressed on farms’and farmers’ demographic attributes to determine theimpact of these attributes on the farmers’ perceptions ofrisk sources and coping strategies. Precisely, theregression models are solved in the following equations:
Nazir et al., The J. Anim. Plant Sci. 28(3):2018
Table 1. Reliability analysis for the risk factors.
Risk Factors Items CronbachAlpha
Sour
ces Production & Labour 3 0.903
Natural 3 0.889Finance & Management 6 0.896Technology 2 0.776
Social & Institutional 3 0.948
Man
agem
ent
Stra
tegi
es
Capital Management 2 0.655Research & Development 2 0.966Diversification 3 0.849Information & Management 3 0.777Wealth management 3 0.806
…… (2)
……. (3)
Hence, FRSit in equation (2) indicates thehomogenous factor scores for risk sources factors (i =1,2, 3..., n), obtained from the factor analyses of risksources. Likewise, FCSit in equation (3) represents thehomogenous factor scores for risk coping strategiesrespectively.
CFA relationship of Risk Perceptions: In contrast,CFA was also applied by inserting all (AVE ≥ 0.4)
related factor, including items in their respectiveconstruct categories and performed correlation todemonstrate the discriminant validity. The correlationsbetween each of the two factors were in between +1 to -1to achieve discriminant validity; however, a correlation of0.85 or larger an absolute value between variables isdiscouraged (Schreiber, et. al., 2006).
Table 2. Correlation of Factors.
Latent Factors Correlation (≤ .85)
Risk
Sou
rces
Technical-Production -.07Technical-Natural .30Technical-Social and Institutional .23Technical-Finance and Marketing -.33Production-Natural -.25Production-Social and Institutional -.19Production-Finance and Marketing .72Natural-Social and Institutional .54Natural-Finance and Marketing -.55Social and Institutional-Finance and Marketing -.44
Risk
Cop
ing
Stra
tegi
es
Research & Development-Wealth Management .15Research & Development-Capital Management .57Research & Development-Diversification -.44Research & Development-Information Management -.47Wealth Management- Capital Management -.04Wealth Management-Diversification -.04Wealth Management-Information Management -.03Capital Management-Diversification -.48Capital Management-Information Management -.55Diversification-Information Management .69
All the correlation estimates presented inTable 2 after performing third order CFA explain factors’discriminant validity. Likewise, Schreiber et. al., (2016)was of the opinion that when the correlation between two
factors are or very close to one or minus one, it isconsidered to have poor discriminant validity, however, acorrelation of less than 0.85 is considerably accepted.

Nazir et al., The J. Anim. Plant Sci. 28(3):2018
Hence, third order CFA was applied by placing all therelated factors, including their items and applied
correlation to demonstrate the discriminant validity.
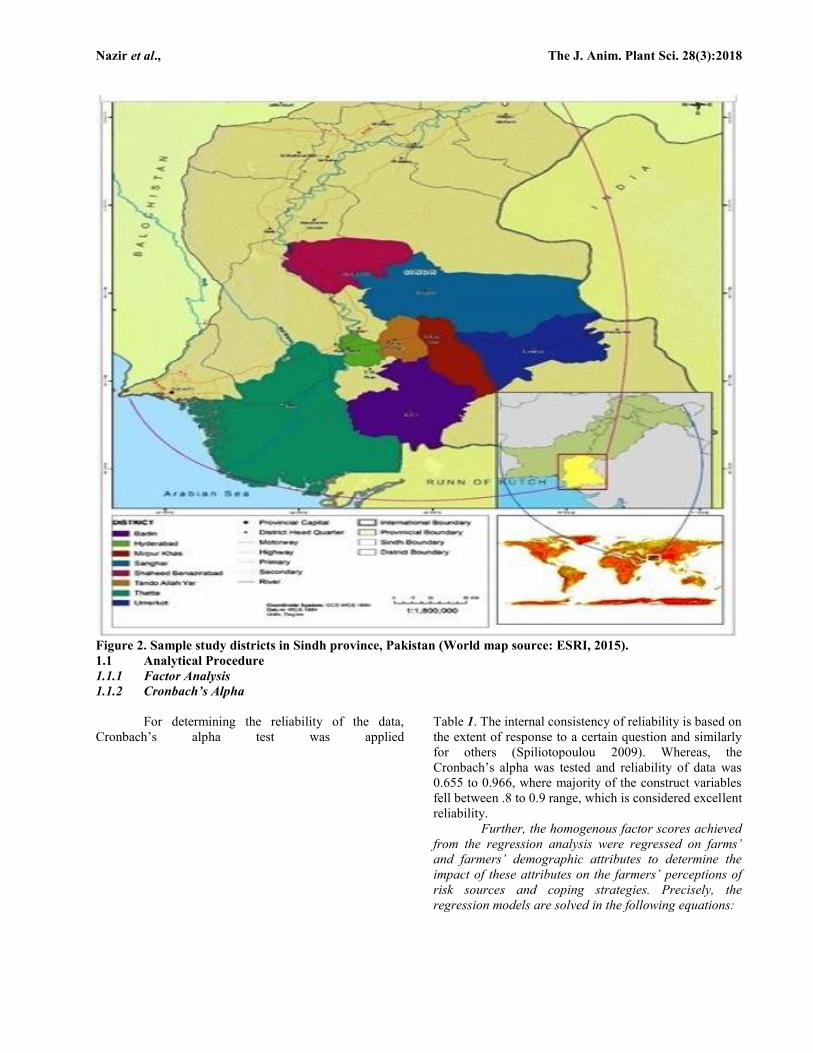
Figure 3. Correlation of Risk Source through CFA.
Albeit, being concerned about the Goodness-of-Fit indices (model fit), which determines the degree towhich the proposed model predicts (fits) the observedcovariance matrix (Ho 2006). Model fit is determined byfit indices which includes; chi-square (χ2), relative χ2
(χ2/df), RMSEA, GFI, AGFI, and TLI. Figure 3 depicts
the measurement model emerged as a result of severaladjustments made from confirmatory factor analysis(CFA). The Goodness-of-Fit indices are under thesuggested limits and as follows; Chi-square (χ2) 264.960,df= 106, Relative χ2 (χ2/df) 2.500, p = 0.000, AGFI =.914, GFI = .940, TLI = .974, and RMSEA = .056. From
Nazir et al., The J. Anim. Plant Sci. 28(3):2018
these Goodness-of-Fit indices, it concluded that themeasurement model is fit and within the required limits
and considerably acceptable for a measurement model orstructural model.
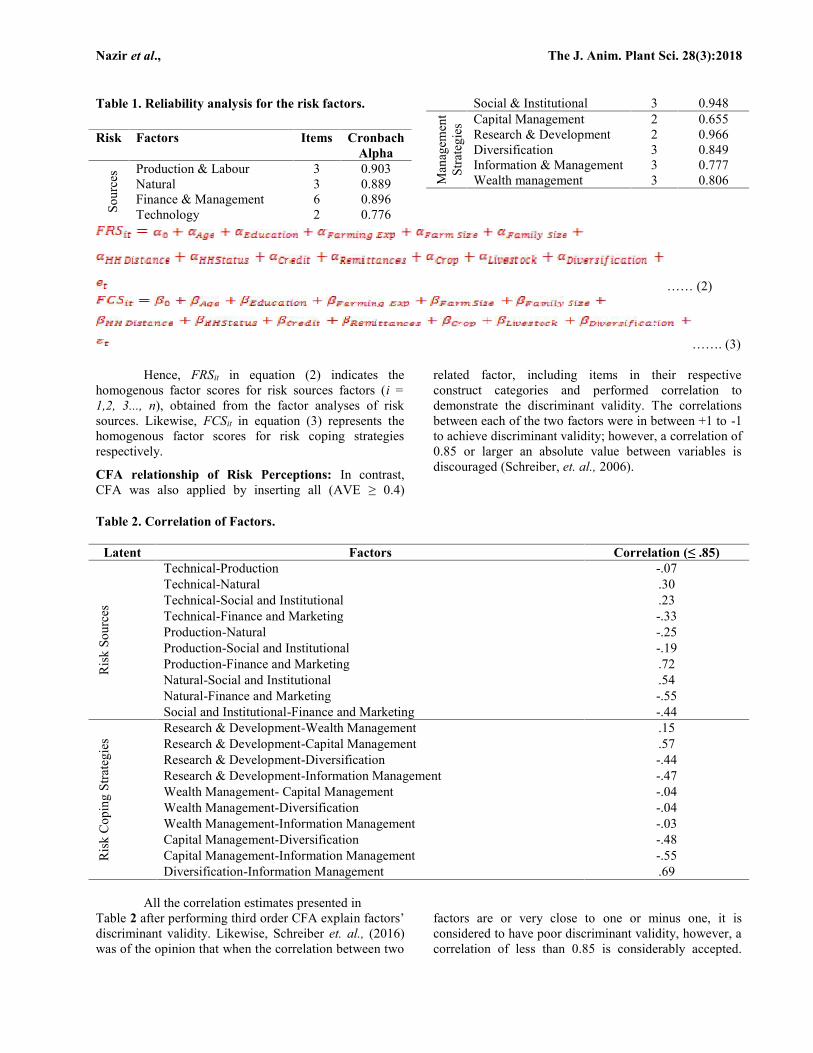
Figure 4. Correlation of Risk Coping Strategies through CFA.
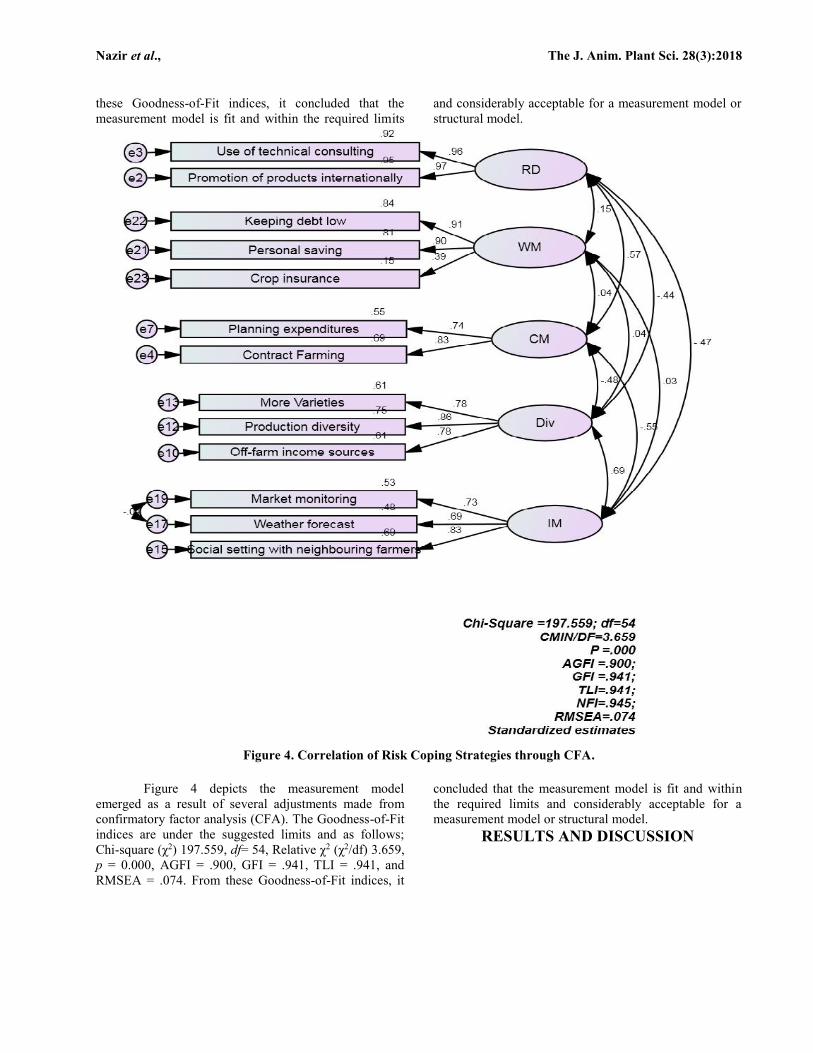
Figure 4 depicts the measurement modelemerged as a result of several adjustments made fromconfirmatory factor analysis (CFA). The Goodness-of-Fitindices are under the suggested limits and as follows;Chi-square (χ2) 197.559, df= 54, Relative χ2 (χ2/df) 3.659,p = 0.000, AGFI = .900, GFI = .941, TLI = .941, andRMSEA = .074. From these Goodness-of-Fit indices, it
concluded that the measurement model is fit and withinthe required limits and considerably acceptable for ameasurement model or structural model.
RESULTS AND DISCUSSION

Nazir et al., The J. Anim. Plant Sci. 28(3):2018
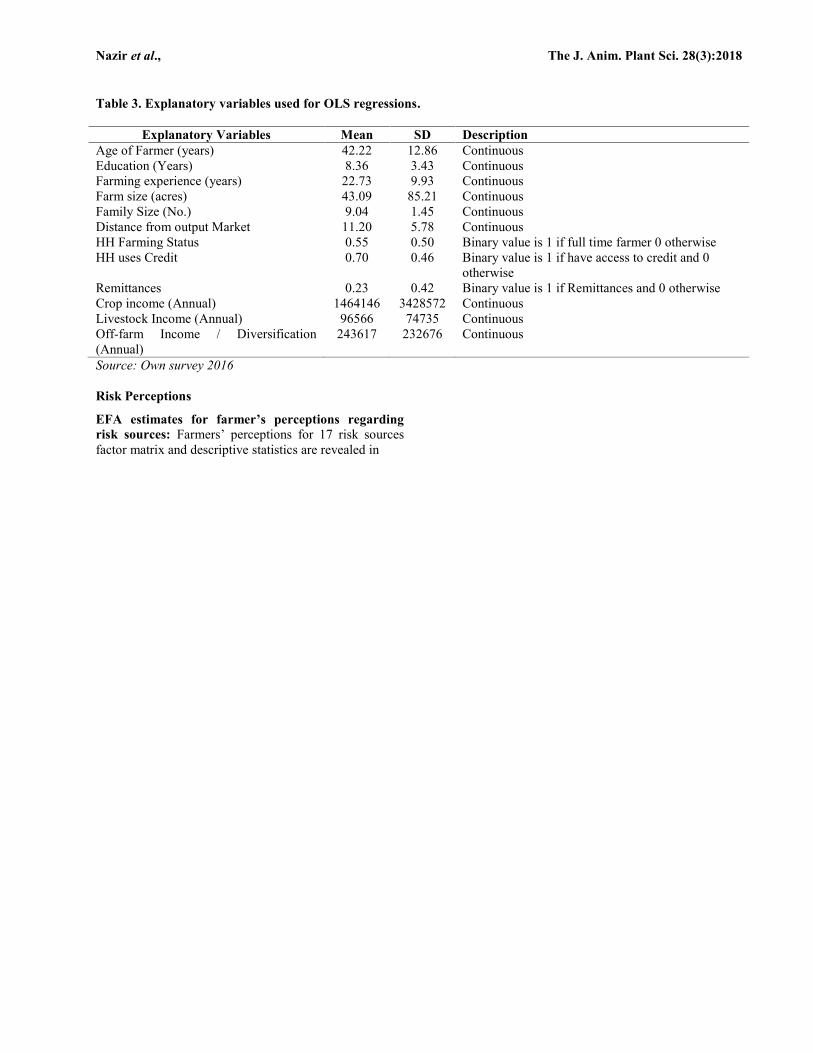
Table 3 presents all independent variables included in theregression analysis. The mean age of farmer 42 yearswith 8 years of education and a household size of 9members. Likewise, the farming household owned 43acres of land, and had 22 years of farming experience.The distance from output market was about 11 km
approximately. Results further indicated that 55 percentfarmers were full time farmers and about 70 percent hadaccess to credit. Also, 23 percent had other incomesources like remittances from the family memberworking in different areas.
Nazir et al., The J. Anim. Plant Sci. 28(3):2018
Table 3. Explanatory variables used for OLS regressions.
Explanatory Variables Mean SD DescriptionAge of Farmer (years) 42.22 12.86 ContinuousEducation (Years) 8.36 3.43 ContinuousFarming experience (years) 22.73 9.93 ContinuousFarm size (acres) 43.09 85.21 ContinuousFamily Size (No.) 9.04 1.45 ContinuousDistance from output Market 11.20 5.78 ContinuousHH Farming Status 0.55 0.50 Binary value is 1 if full time farmer 0 otherwiseHH uses Credit 0.70 0.46 Binary value is 1 if have access to credit and 0
otherwiseRemittances 0.23 0.42 Binary value is 1 if Remittances and 0 otherwiseCrop income (Annual) 1464146 3428572 ContinuousLivestock Income (Annual) 96566 74735 ContinuousOff-farm Income / Diversification(Annual)
243617 232676 Continuous
Source: Own survey 2016
Risk Perceptions
EFA estimates for farmer’s perceptions regardingrisk sources: Farmers’ perceptions for 17 risk sourcesfactor matrix and descriptive statistics are revealed in
Nazir et al., The J. Anim. Plant Sci. 28(3):2018
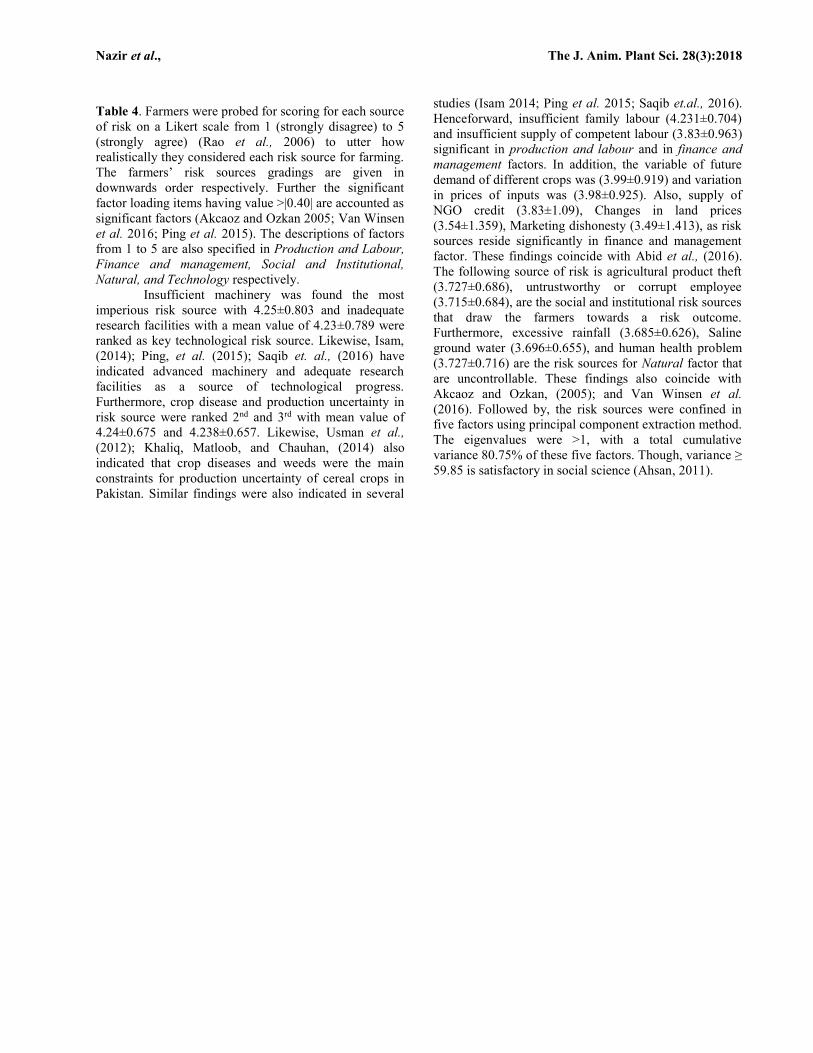
Table 4. Farmers were probed for scoring for each sourceof risk on a Likert scale from 1 (strongly disagree) to 5(strongly agree) (Rao et al., 2006) to utter howrealistically they considered each risk source for farming.The farmers’ risk sources gradings are given indownwards order respectively. Further the significantfactor loading items having value >|0.40| are accounted assignificant factors (Akcaoz and Ozkan 2005; Van Winsenet al. 2016; Ping et al. 2015). The descriptions of factorsfrom 1 to 5 are also specified in Production and Labour,Finance and management, Social and Institutional,Natural, and Technology respectively.
Insufficient machinery was found the mostimperious risk source with 4.25±0.803 and inadequateresearch facilities with a mean value of 4.23±0.789 wereranked as key technological risk source. Likewise, Isam,(2014); Ping, et al. (2015); Saqib et. al., (2016) haveindicated advanced machinery and adequate researchfacilities as a source of technological progress.Furthermore, crop disease and production uncertainty inrisk source were ranked 2nd and 3rd with mean value of4.24±0.675 and 4.238±0.657. Likewise, Usman et al.,(2012); Khaliq, Matloob, and Chauhan, (2014) alsoindicated that crop diseases and weeds were the mainconstraints for production uncertainty of cereal crops inPakistan. Similar findings were also indicated in several
studies (Isam 2014; Ping et al. 2015; Saqib et.al., 2016).Henceforward, insufficient family labour (4.231±0.704)and insufficient supply of competent labour (3.83±0.963)significant in production and labour and in finance andmanagement factors. In addition, the variable of futuredemand of different crops was (3.99±0.919) and variationin prices of inputs was (3.98±0.925). Also, supply ofNGO credit (3.83±1.09), Changes in land prices(3.54±1.359), Marketing dishonesty (3.49±1.413), as risksources reside significantly in finance and managementfactor. These findings coincide with Abid et al., (2016).The following source of risk is agricultural product theft(3.727±0.686), untrustworthy or corrupt employee(3.715±0.684), are the social and institutional risk sourcesthat draw the farmers towards a risk outcome.Furthermore, excessive rainfall (3.685±0.626), Salineground water (3.696±0.655), and human health problem(3.727±0.716) are the risk sources for Natural factor thatare uncontrollable. These findings also coincide withAkcaoz and Ozkan, (2005); and Van Winsen et al.(2016). Followed by, the risk sources were confined infive factors using principal component extraction method.The eigenvalues were >1, with a total cumulativevariance 80.75% of these five factors. Though, variance ≥59.85 is satisfactory in social science (Ahsan, 2011).
Nazir et al., The J. Anim. Plant Sci. 28(3):2018
Table 4. Descriptive statistics and EFA factor loadings of risk sources.
KMO sampling Adequacy = 0.816 Bartlett's Test of Sphericity χ2 = 9154.61***
RISK SOURCES Mean SD 1 2 3 4 5Insufficient machinery 4.254 0.803 0.005 -0.058 0.103 0.145 0.858Crop disease 4.244 0.675 0.882 0.194 -0.014 -0.086 0.038Production uncertainty 4.238 0.657 0.891 0.175 -0.03 -0.053 -0.022Inadequate research activities 4.233 0.789 -0.028 -0.066 0.155 0.014 0.849Insufficient Family Labour 4.231 0.704 0.878 0.132 -0.019 -0.058 -0.036Future Demand 3.990 0.919 0.204 0.878 -0.234 -0.125 0.038Price of Inputs 3.983 0.925 0.21 0.877 -0.228 -0.128 0.041Insufficient supply of competent labour 3.835 0.963 0.542 0.492 -0.145 -0.304 -0.213Supply of NGO credit 3.833 1.093 0.592 0.440 0.04 -0.18 -0.065Infrastructure Issues 3.785 0.771 0.03 -0.096 0.889 0.12 0.122Agricultural product theft 3.727 0.686 -0.053 -0.173 0.926 0.216 0.099Human Health Problem 3.727 0.716 -0.105 -0.129 0.129 0.869 0.043Untrustworthy or corrupt employee 3.715 0.684 -0.046 -0.163 0.933 0.205 0.113Saline ground water 3.696 0.655 -0.129 -0.161 0.2 0.842 0.099Excessive rainfall 3.685 0.626 -0.094 -0.190 0.211 0.87 0.11Changes in land prices 3.567 1.363 0.346 0.644 -0.044 -0.241 -0.407Marketing dishonesty 3.535 1.373 0.358 0.638 -0.043 -0.248 -0.408Eigenvalues 6.729 2.843 1.543 1.482 1.133Percentage of the total variance 39.582 16.721 9.075 8.715 6.663Cumulative percentage of total variance 39.582 56.304 65.379 74.094 80.757Note: Loadings >0.4 are given in Bold. Factor columns 1,2,3,4,5 respectively are named as, Production and Labour, Finance andmanagement, Social and Institutional, Natural, and Technology respectively.
Relationship of perception of risk sources and farmand farmer’s characteristics: While determining theassociation of various farmer’s characteristics with
perception of risk sources, five factors or independentvariables obtained significant scores over dependentvariable during OLS regression analysis. Hence,

Nazir et al., The J. Anim. Plant Sci. 28(3):2018
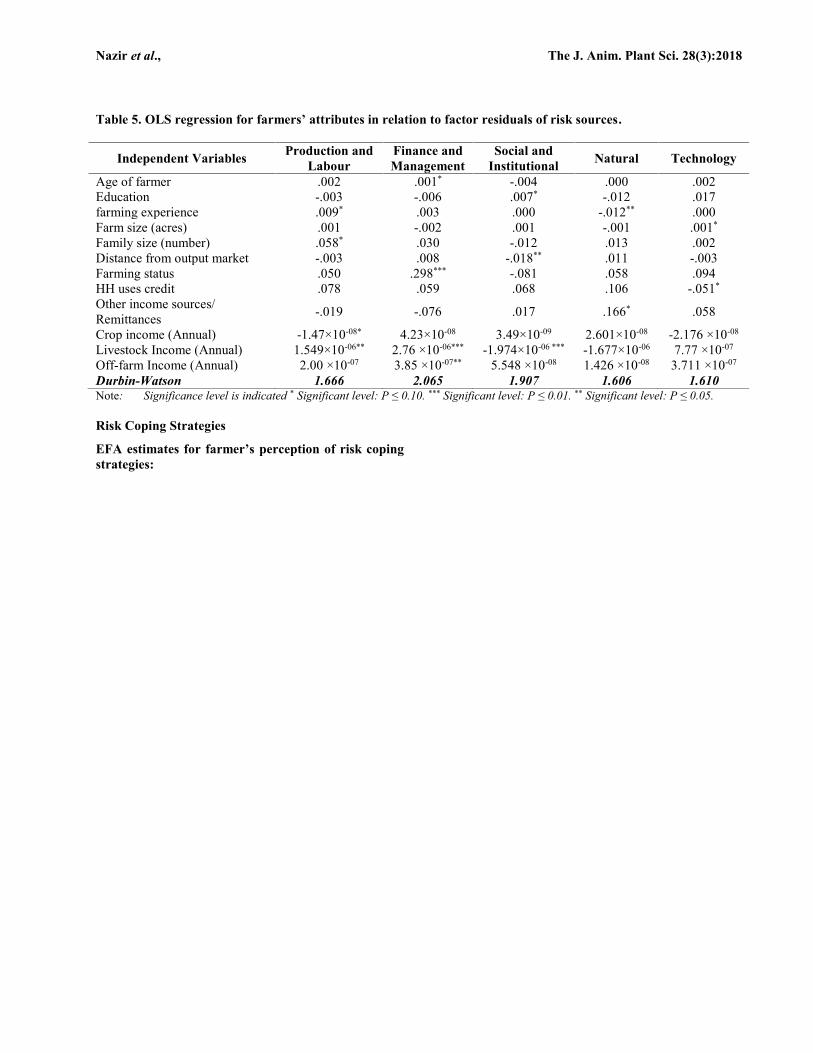
Table 5 exhibits that the farm experience, family size,crop income, income from livestock revealed significantrelationship with production and labour factor scores.However, age, education, farm size, distance from outputmarket, farming status, HH uses credit, other sources ofincome and off -farm income were found non-significant.It may be perceived that importance of these non-significant indicators was comparatively less in the studyarea, as also indicated by Abid et al., (2015). Regardingsocial and institutional factor scores, education, distancefrom output market, and livestock income had positiverelation. This indicates that farmers have high perceptionsof these factors regarding social and institutional risks ascompare to credit accessibility, farming status, and othersources of income. Likewise results were also reported innumerous studies (Lien et al. 2006; Ahsan 2011;Gebreegziabher and Tadesse 2014). Furthermore,farming experience and other sources of income hadpositive relation with natural factor score, while, other
variables had weak relations with natural risk factorscores. Similar findings were also revealed by Ahsan,(2011), and Gebreegziabher and Tadesse, (2014).However, age, farming status, livestock income and off-farm income had relation with production and labour riskfactor score. Likewise, Van Winsen et al. (2016) andGebreegziabher and Tadesse, (2014) indicated productionrisk as an important risk factor. Furthermore,technological risk factor score had significant relationwith farm size and HH uses credit. Hence, currentfindings coincide with prior studies (Saqib et. al., 2016and Gebreegziabher and Tadesse 2014). Albeit, in overallvariables used in the models were significant with at leastone of the dependent variable. Likewise, Van Winsen etal. (2016) and Lien et al., (2006) also revealed similaroutcomes related to risk perception attributable todissimilar perceptions of risk sources from farmer tofarmer.
Nazir et al., The J. Anim. Plant Sci. 28(3):2018
Table 5. OLS regression for farmers’ attributes in relation to factor residuals of risk sources.
Independent Variables Production andLabour
Finance andManagement
Social andInstitutional Natural Technology
Age of farmer .002 .001* -.004 .000 .002Education -.003 -.006 .007* -.012 .017farming experience .009* .003 .000 -.012** .000Farm size (acres) .001 -.002 .001 -.001 .001*
Family size (number) .058* .030 -.012 .013 .002Distance from output market -.003 .008 -.018** .011 -.003Farming status .050 .298*** -.081 .058 .094HH uses credit .078 .059 .068 .106 -.051*
Other income sources/Remittances -.019 -.076 .017 .166* .058
Crop income (Annual) -1.47×10-08* 4.23×10-08 3.49×10-09 2.601×10-08 -2.176 ×10-08
Livestock Income (Annual) 1.549×10-06** 2.76 ×10-06*** -1.974×10-06 *** -1.677×10-06 7.77 ×10-07
Off-farm Income (Annual) 2.00 ×10-07 3.85 ×10-07** 5.548 ×10-08 1.426 ×10-08 3.711 ×10-07
Durbin-Watson 1.666 2.065 1.907 1.606 1.610Note: Significance level is indicated * Significant level: P ≤ 0.10. *** Significant level: P ≤ 0.01. ** Significant level: P ≤ 0.05.
Risk Coping Strategies
EFA estimates for farmer’s perception of risk copingstrategies:
Nazir et al., The J. Anim. Plant Sci. 28(3):2018
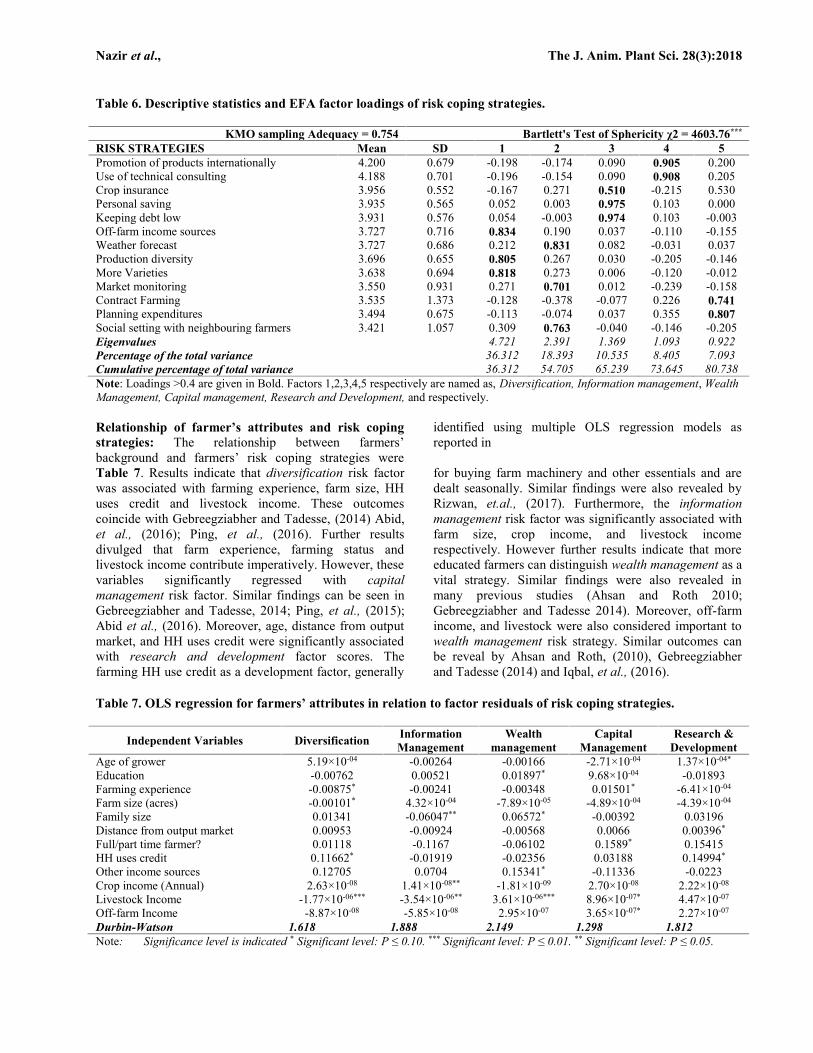
Table 6 depicts the perceptions of risk coping strategies,from which 13 foremost perceptions, and were thenorganized according to mean score in descending order.Promotion of products internationally (4.20±0.679), wasranked as the most significant strategy amongst thefarmers, followed by the use of technical consultant(4.18±0.701) for farming were also perceived commonlyas risk management strategy amongst the farmers. Thesefindings can be coincided with Iqbal et al., 2016; Ullah,et al., (2016). Farmers perceptions about having cropinsurance (3.956±0.552) was the 3rd most significantstrategy amongst the farmers. In literature, insuranceagainst production loan as risk management strategy isalso reported in numerous studies (Shen et al. 2015;Burns and Prager 2016; Pasaribu and Sudiyanto 2016).Though, Pasaribu and Sudiyanto (2016) concluded thatthe Indonesian farmers have adopted crop insurancepolicy, as an effective coping strategy. Likewise, farmersperceived that the personal saving (3.935±0.565) andkeeping debt low (3.931±0.576) are also important riskcoping strategies in farming and fall in WealthManagement factor. In number of studies (Akcaoz andOzkan 2005; Lien et al. 2006; Aditto et al. 2012; Qasim2012) revealed that the farmers are suffering financiallybecause of diminishing purchasing power. In this case,off-farm income is a likely way to overcome these riskyissues. Likewise, in line with farmers also perceived off-
farm income (3.727±0.734) as the key risk copingstrategy. Similarly, farmers perceived for productiondiversity (3.696±0.65). Additionally, another perceivedrisk coping strategies for farmers was growing morevarieties (3.638±0.694) and collectively were grouped indiversification factor. However, Aditto et al., 2012;Qasim, (2012) noted likewise opinions that productiondiversity is an important risk management strategy for thefarmers in developing economy. Furthermore, weatherforecast (3.727±0.686), market monitoring (3.55±0.931)and social setting with neighboring farmers (3.23±1.118)were the next risk coping strategies were exposed by thefarmers and were assembled in information managementfactor. Likewise, Iqbal et al., (2016) summarized in theirstudies that capital management and informationmanagement were important coping strategy for risks inagriculture sector. In Research and Development factor,planning of expenditures (3.494±0.675) and contractfarming (3.535±1.373) were prevailed as key risk copingstrategies. In general majority of the farmers rely oncontract farming in the sense of availing fertilizer, seedand other inputs from commission agents on credit andmarket their produce to the agent on harvesting (Ping, etal., 2015). Henceforth, through factor analysis for riskcoping strategies of farmers, five factors were conformedwith eigenvalue higher than 1 and explaining acumulative variance of 80.74%.
Nazir et al., The J. Anim. Plant Sci. 28(3):2018
Table 6. Descriptive statistics and EFA factor loadings of risk coping strategies.
KMO sampling Adequacy = 0.754 Bartlett's Test of Sphericity χ2 = 4603.76***
RISK STRATEGIES Mean SD 1 2 3 4 5Promotion of products internationally 4.200 0.679 -0.198 -0.174 0.090 0.905 0.200Use of technical consulting 4.188 0.701 -0.196 -0.154 0.090 0.908 0.205Crop insurance 3.956 0.552 -0.167 0.271 0.510 -0.215 0.530Personal saving 3.935 0.565 0.052 0.003 0.975 0.103 0.000Keeping debt low 3.931 0.576 0.054 -0.003 0.974 0.103 -0.003Off-farm income sources 3.727 0.716 0.834 0.190 0.037 -0.110 -0.155Weather forecast 3.727 0.686 0.212 0.831 0.082 -0.031 0.037Production diversity 3.696 0.655 0.805 0.267 0.030 -0.205 -0.146More Varieties 3.638 0.694 0.818 0.273 0.006 -0.120 -0.012Market monitoring 3.550 0.931 0.271 0.701 0.012 -0.239 -0.158Contract Farming 3.535 1.373 -0.128 -0.378 -0.077 0.226 0.741Planning expenditures 3.494 0.675 -0.113 -0.074 0.037 0.355 0.807Social setting with neighbouring farmers 3.421 1.057 0.309 0.763 -0.040 -0.146 -0.205Eigenvalues 4.721 2.391 1.369 1.093 0.922Percentage of the total variance 36.312 18.393 10.535 8.405 7.093Cumulative percentage of total variance 36.312 54.705 65.239 73.645 80.738Note: Loadings >0.4 are given in Bold. Factors 1,2,3,4,5 respectively are named as, Diversification, Information management, WealthManagement, Capital management, Research and Development, and respectively.
Relationship of farmer’s attributes and risk copingstrategies: The relationship between farmers’background and farmers’ risk coping strategies were
identified using multiple OLS regression models asreported in
Table 7. Results indicate that diversification risk factorwas associated with farming experience, farm size, HHuses credit and livestock income. These outcomescoincide with Gebreegziabher and Tadesse, (2014) Abid,et al., (2016); Ping, et al., (2016). Further resultsdivulged that farm experience, farming status andlivestock income contribute imperatively. However, thesevariables significantly regressed with capitalmanagement risk factor. Similar findings can be seen inGebreegziabher and Tadesse, 2014; Ping, et al., (2015);Abid et al., (2016). Moreover, age, distance from outputmarket, and HH uses credit were significantly associatedwith research and development factor scores. Thefarming HH use credit as a development factor, generally
for buying farm machinery and other essentials and aredealt seasonally. Similar findings were also revealed byRizwan, et.al., (2017). Furthermore, the informationmanagement risk factor was significantly associated withfarm size, crop income, and livestock incomerespectively. However further results indicate that moreeducated farmers can distinguish wealth management as avital strategy. Similar findings were also revealed inmany previous studies (Ahsan and Roth 2010;Gebreegziabher and Tadesse 2014). Moreover, off-farmincome, and livestock were also considered important towealth management risk strategy. Similar outcomes canbe reveal by Ahsan and Roth, (2010), Gebreegziabherand Tadesse (2014) and Iqbal, et al., (2016).
Table 7. OLS regression for farmers’ attributes in relation to factor residuals of risk coping strategies.
Independent Variables Diversification InformationManagement
Wealthmanagement
CapitalManagement
Research &Development
Age of grower 5.19×10-04 -0.00264 -0.00166 -2.71×10-04 1.37×10-04*
Education -0.00762 0.00521 0.01897* 9.68×10-04 -0.01893Farming experience -0.00875* -0.00241 -0.00348 0.01501* -6.41×10-04
Farm size (acres) -0.00101* 4.32×10-04 -7.89×10-05 -4.89×10-04 -4.39×10-04
Family size 0.01341 -0.06047** 0.06572* -0.00392 0.03196Distance from output market 0.00953 -0.00924 -0.00568 0.0066 0.00396*
Full/part time farmer? 0.01118 -0.1167 -0.06102 0.1589* 0.15415HH uses credit 0.11662* -0.01919 -0.02356 0.03188 0.14994*
Other income sources 0.12705 0.0704 0.15341* -0.11336 -0.0223Crop income (Annual) 2.63×10-08 1.41×10-08** -1.81×10-09 2.70×10-08 2.22×10-08
Livestock Income -1.77×10-06*** -3.54×10-06** 3.61×10-06*** 8.96×10-07* 4.47×10-07
Off-farm Income -8.87×10-08 -5.85×10-08 2.95×10-07 3.65×10-07* 2.27×10-07
Durbin-Watson 1.618 1.888 2.149 1.298 1.812Note: Significance level is indicated * Significant level: P ≤ 0.10. *** Significant level: P ≤ 0.01. ** Significant level: P ≤ 0.05.

Nazir et al., The J. Anim. Plant Sci. 28(3):2018
Conclusion: This study was established to seek the Sindhfarmers’ perceptions of risk sources and coping strategiesin connection with their background. Based on theresults of this study and previous available literature, theresearchers conclude that there is slight variation offarmers’ perception in Sindh province regarding risksources and risk coping strategies. Since, the findings ofthis study indicated that the key risks sources haveconveyed significant changes in agricultural machinery,price of farm equipment, and absence of farmer’scooperative, private capital resources and human healthissues, therefore, crop insurance, market information, off-farm income sources, and production diversity aresupposed to effective risk coping strategies among thefarming communities of Sindh province of Pakistan.Nevertheless, to a certain degree there are disagreementsbetween risk sources and coping strategies, mainly due toilliteracy and lack of adequate capital. Therefore, farmersare certain for insurance against their produce, andmarket them by avoiding agents and inadequate storagefacilities to store and sell the produce at better prices. It istherefore suggested that the farm advisories must beestablished/activated to make them (farmers) aware aboutpossible risks that may disturb their agriculturaleconomy. In addition, aligned coping strategies ofprevailing risks should also be communicated to the localfarmers to enhance their agricultural output and overallincome.
Acknowledgement: This research is financiallysupported by the National Natural Sciences Foundationof China (NSFC No. 71473100; NSFC-CGIARNo.71461010701).
REFERENCES
Abid, M., Scheffran, J., Schneider, U. A., and M. Ashfaq,(2015). Farmers’ perceptions of and adaptationstrategies to climate change and theirdeterminants: The case of Punjab province,Pakistan. Earth Syst Dynam, 6(1), 225–243.
Abid, M., Schilling, J., Scheffran, J., and F. Zulfiqar(2016). Climate change vulnerability, adaptationand risk perceptions at farm level in Punjab,Pakistan. Sci Total Environ, 547 (February),447–460.
Adebusuyi, B. S. (2004). Stabilisation of commoditymarket of interest to Africa. In Workshop onConstraints to Growth in Sub-Saharan Africa,Proceedings of the Intergovernmental Group ofTwenty-Four, Pretoria, South Africa.
Aditto, S., Gan, C., and G. V. Nartea (2012). Sources ofRisk and Risk Management Strategies: The Caseof Smallholder Farmers in a Developing
Economy. In N. B. T.-R. M.-C. I. and C.Banaitiene (Ed.) (p. Ch. 20). Rijeka: InTech.
Ahmed, Z. (2013). Disaster risks and disastermanagement policies and practices in Pakistan:A critical analysis of Disaster Management Act2010 of Pakistan. Int J Disast Risk Re, (4), 15–20.
Ahsan, D. A. (2011). Farmers’ motivations, riskperceptions and risk management strategies in adeveloping economy: Bangladesh experience. JRisk Res, 14 (3), 325–349.
Ahsan, D. A., and E. V. A. Roth (2010). Farmers’Perceived Risks and Risk ManagementStrategies in an Emerging Mussel AquacultureIndustry in Denmark, Mar Resour Econ, 25(3),309–323.
Akcaoz, H., and B. Ozkan, (2005). Determining risksources and strategies among farmers ofcontrasting risk awareness: A case study forCukurova region of Turkey. J Arid Environ.62(4), 661-675.
Alderman, H. (2008). Managing risk to increaseefficiency and reduce poverty. BackgroundPaper for the World Development Report.Washington, DC
Anwar, M. R., Li Liu, D., Macadam, I., and G. Kelly(2013). Adapting agriculture to climate change:a review. Theor Appl Climatol, 113(1-2), 225-245.
Azad, A. (2003). Sindh water resources management:issues and options. Food and AgricultureOrganization of the United, Nations–Rome,Investment Centre Division, FAO/World BankCooperative Programme.
Beavers, A. S., Lounsbury, J. W., Richards, J. K., Huck,S. W., Skolits, G. J., and S. L. Esquivel, (2013).Educ Res-UK, 18(6).
Bergfjord, O. J. (2009). Risk perception and riskmanagement in Norwegian aquaculture. J RiskRes, 12(1), 91–104.
Boholm, Å. (2003). The cultural nature of risk: Can therebe an anthropology of uncertainty?. Ethnos,68(2), 159-178.
Burnett, E., Kearney, N., Johnston, B., Corlett, J., and S.MacGillivray (2013). Understanding factors thatimpact on health care professionals’ riskperceptions and responses toward Clostridiumdifficile and meticillin-resistant Staphylococcusaureus: A structured literature review. Am JInfect Control, 41(5), 394-400.
Burns, C., and D. Prager (2016). Do Direct Payments andCrop Insurance Influence Commercial FarmSurvival and Decisions to Expand? Proceedings,Annual Meeting, Agricultural and Applied

Nazir et al., The J. Anim. Plant Sci. 28(3):2018
Economics Association. Boston, Massachusetts(No. 235693).
Di Falco, S., and C. Perrings, (2005). Crop biodiversity,risk management and the implications ofagricultural assistance. Ecol Econ, 55(4), 459-466.
Erenstein, O. (2009). Comparing water management inrice–wheat production systems in Haryana, Indiaand Punjab, Pakistan. Agr Water Manage, 96(12), 1799–1806.
Gebreegziabher, K., and T. Tadesse (2014). Riskperception and management in smallholder dairyfarming in Tigray, Northern Ethiopia. J RiskRes, 17(3), 367–381.
Goeringer, P., and H. Leathers (2015). New CropInsurance Option for Diversified Operations:Whole Farm Revenue Protection. Department ofagriculture and resource economics, Fact Sheet,College of Agriculture and Natural Resources,Maryland.
Government of Pakistan (GOP) (2016). EconomicSurvey, Economic Affairs Division,Government of Pakistan. Islamabad.
Government of Sindh (GOS) (2008). DevelopmentStatistics of Sindh, Sindh Bureau of Statistics,Government of Sindh.
Hair, J. F., Black, W. C., Babin, B. J., and R. E.Anderson (2009). Multivariate Data Analysis7th Edition Pearson Prentice Hall.
Hardaker, J. B., Richardson, J. W., Lien, G., and K. D.Schumann (2004). Stochastic efficiency analysiswith risk aversion bounds: a simplifiedapproach. Aust J Agr Resour Ec, 48(2), 253–270.
Ho, R. (2006). Handbook of univariate and multivariatedata analysis and interpretation with SPSS. CRCPress, Tylor and Francis Group.
Iqbal, M. A., Ping, Q., Abid, M., Muhammad M. K.S.,and M. Rizwan (2016). Assessing riskperceptions and attitude among cotton farmers:A case of Punjab province, Pakistan. Int J DisastRisk Re, 16, 68–74.
Isam, A. M. (2014). Risk attitude, risk perceptions andrisk management strategies: an empiricalanalysis of Syrian wheat-cotton and pistachiofarmers. PhD Thesis, Department ofAgricultural Sciences. Georg-August-University, Göttingen, Germany.
Kazi, A. (2014). A review of the assessment andmitigation of floods in Sindh, Pakistan. NatHazards, 70(1), 839–864.
Khaliq, A., Matloob, A., and B. S. Chauhan (2014).Weed management in dry-seeded fine rice undervarying row spacing in the rice-wheat system ofPunjab, Pakistan. Plant Prod Sci, 17(4), 321–332.
Kurkalova, L., Kling, C., and J. Zhao, (2006). Greensubsidies in agriculture: Estimating the adoptioncosts of conservation tillage from observedbehavior. Can J Agr Econ, 54(2), 247-267.
Lien, G., Flaten, O., Jervell, A. M., Ebbesvik, M.,Koesling, M., and P.S. Valle (2006).Management and risk characteristics of part-time and full-time farmers in Norway. ApplEcon Perspect P, 28 (1), 111–131.
Louis Berger Group and Indus Associated Consultants(LBG-IAC) (2013) Regional master plan for leftbank of Indus, Delta and coastal zone, (SIDA)Sindh Irrigation and Drainage Authority.Hyderabad, Sindh.
Marsh, H. W., Morin, A. J. S., Parker, P. D., and G. Kaur(2014). Exploratory structural equationmodeling: An integration of the best features ofexploratory and confirmatory factor analysis.Annu Rev Clin Psycho, 10, 85–110.
Memon, J. A., and G. B. Thapa, (2011). The Indusirrigation system, natural resources, andcommunity occupational quality in the deltaregion of Pakistan. Environ Manage, 47(2), 173-187.
Memon, J., and U. Mustafa (2012). Emerging Issues inthe Implementation of Irrigation and DrainageSector Reforms in Sindh Province of Pakistan.In 28th AGM & Conference of PSDE PakistanInstitute of Development Economics (PIDE).Islamabad, Pakistan.
Özkan, Ş., Farquharson, R. J., Hill, J., and B. Malcolm(2015). A stochastic analysis of the impact ofinput parameters on profit of Australian pasture-based dairy farms under variable carbon pricescenarios. Environ Sci Policy, 48, 163-171.
Pasaribu, S. M., and A. Sudiyanto, (2016). AgriculturalRisk Management: Lesson Learned from theApplication of Rice Crop Insurance inIndonesia. In: Kaneko S., Kawanishi M. (eds)Climate Change Policies and Challenges inIndonesia. Springer, Tokyo.
Ping, Q., Iqbal, M. A., Abid, M., Ahmed, U. I., Nazir, A.,and A. Rehman (2016). Adoption of Off-farmDiversification Income Sources in ManagingAgricultural Risks among Cotton Farmers inPunjab Pakistan. J. Appl. Environ. Biol. Sci,6(8), 47–53.
Preston, C. C., and A. M. Colman, (2000). Optimalnumber of response categories in rating scales:reliability, validity, discriminating power, andrespondent preferences. Acta Psychol, 104(1), 1-15.
Qasim, M. (2012). Determinants of Farm Income andAgricultural Risk Management Strategies: TheCase of Rain-fed Farm Households in Pakistan’s

Nazir et al., The J. Anim. Plant Sci. 28(3):2018
Punjab. International Rural Development,Kassel University Press GmbH.
Rao, K. D., Peters, D. H., and K. Bandeen-Roche, (2006).Towards patient-centered health services inIndia—a scale to measure patient perceptions ofquality. Int J Qual Health C, 18(6), 414-421.
Rizwan, M., Deyi, Z., Nazir, A., Ijaz, U., and Y. Zhu(2017). Risk Perceptions and ManagementStrategies of Rice Growing Households:Evidence from a Developing Country, J. Appl.Environ. Biol. Sci, 7(3), 15–26.
Saqib, S. E., Ahmad, M. M., Panezai, S., and I. A. Rana,(2016). An empirical assessment of farmers' riskattitudes in flood-prone areas of Pakistan. Int JDisast Risk Re, 18, 107-114.
Saqib, S. e., Ahmad, M. M., Panezai, S., and U. Ali,(2016). Factors influencing farmers' adoption ofagricultural credit as a risk managementstrategy: The case of Pakistan. Int J Disast RiskRe, 17, 67-76.
Schönrock-Adema, J., Heijne-Penninga, M., Van Hell, E.A, and J. Cohen-Schotanus, (2009). Necessarysteps in factor analysis: enhancing validationstudies of educational instruments. The PHEEMapplied to clerks as an example. Med Teach,31(6), e226–e232.
Schreiber, J. B., Nora, A., Stage, F. K., Barlow, E. A.,and J. King, (2006). Reporting structuralequation modeling and confirmatory factoranalysis results: A review. J Educ Res, 99(6),323-338.
Shen, Z., Odening, M., and O. Okhrin, (2015). Can expertknowledge compensate for data scarcity in crop
insurance pricing? Eur Rev Agric Econ. 43(2),237-269.
Spiliotopoulou, G. (2009). Reliability reconsidered:Cronbach's alpha and paediatric assessment inoccupational therapy. Aust Occup Ther J, 56(3),150-155.
Teddlie, C., and F. Yu (2007). Mixed methods sampling:A typology with examples. J Mix Method Res,1(1), 77-100.
Ullah, R., and G. P. Shivakoti (2014). Adoption of on-farm and off-farm diversification to manageagricultural risks: are these decisionscorrelated?. Outlook Agr, 43(4), 265-271.
Ullah, R., Shivakoti, G. P., and G. Ali (2015).International Journal of Disaster Risk ReductionFactors effecting farmers’ risk attitude and riskperceptions: The case of Khyber Pakhtunkhwa,Pakistan. Int J Disast Risk Re, 13, 151–157.
Ullah, R., Shivakoti, G. P., Zulfiqar, F., and M. A.Kamran (2016). Farm risks and uncertainties:Sources, impacts and management. OutlookAgr, 45(3), 199–205.
Usman, K., Ullah, I., Khan, S. M., Khan, M. U., Ghulam,S., and M. A. Khan (2012). Integrated weedmanagement through tillage and herbicides forwheat production in rice-wheat cropping systemin northwestern Pakistan. J Integr Agr, 11(6),946–953.
Van Winsen, F., de Mey, Y., Lauwers, L., Van Passel, S.,Vancauteren, M., and E. Wauters (2016).Determinants of risk behaviour: effects ofperceived risks and risk attitude on farmer’sadoption of risk management strategies. J RiskRes, 19(1), 56-78.