farmland real estate trends - mid america...
TRANSCRIPT

Farmland Real Estate
Trends 2013
• Farmland
Values &
Leasing
Trends
• October 17, 2013
• F. Howard
Halderman
AFM
• Halderman
Farm
Management
Service/
• Halderman
Real Estate
Services
Who is Halderman?
MACC Credit Conference 2013 October 2013
October 2013 MACC Credit Conference 2013
Halderman Can Help!
Since 1930, people have been turning to Halderman Farm Management Service, Inc. and Halderman Real Estate Services, Inc. for their farm management and farm real estate needs. All kinds of people – farm owners, investors, tenants, bankers, lenders, trust officers, wealth advisors, attorneys, accountants…in fact, anyone involved with a farm in any way. We’ve provided services, from an occasional consultation to complete farm management and real estate brokerage, to thousands of clients throughout the U.S.
If you have a farm-related problem or want to explore the investment opportunities in farmland, Halderman Can Help!
We’ve been doing it for three generations.
October 2013 MACC Credit Conference 2013
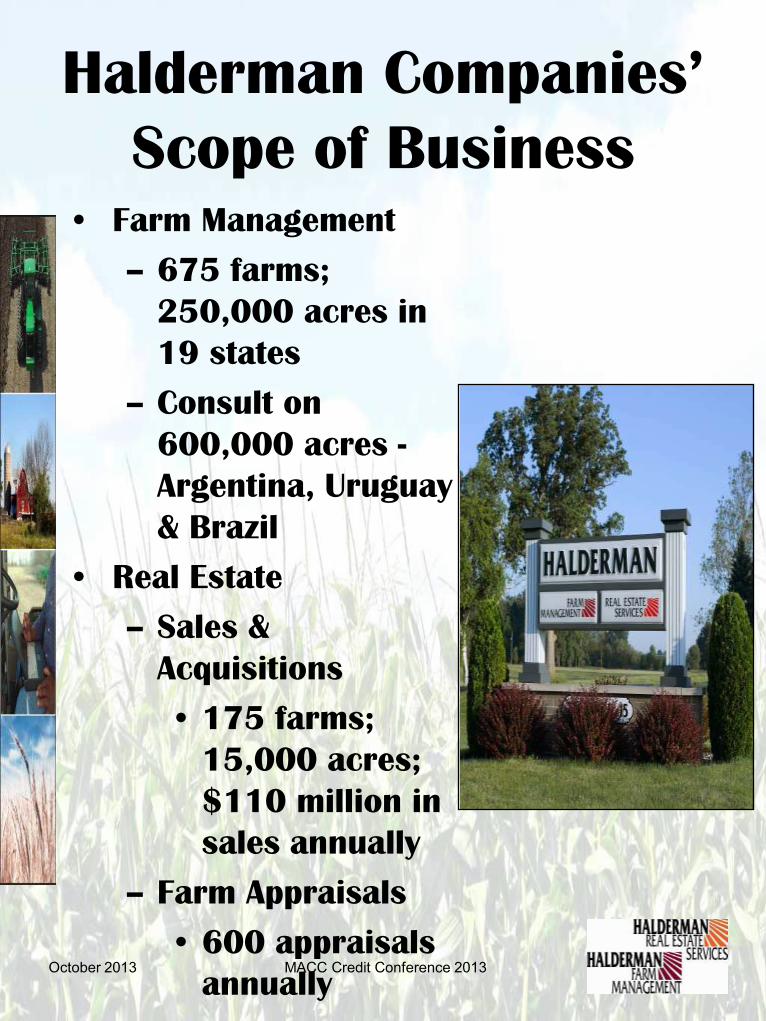
Halderman Companies’
Scope of Business • Farm Management
– 675 farms;
250,000 acres in
19 states
– Consult on
600,000 acres -
Argentina, Uruguay
& Brazil
• Real Estate
– Sales &
Acquisitions
• 175 farms;
15,000 acres;
$110 million in
sales annually
– Farm Appraisals
• 600 appraisals
annually
October 2013 MACC Credit Conference 2013
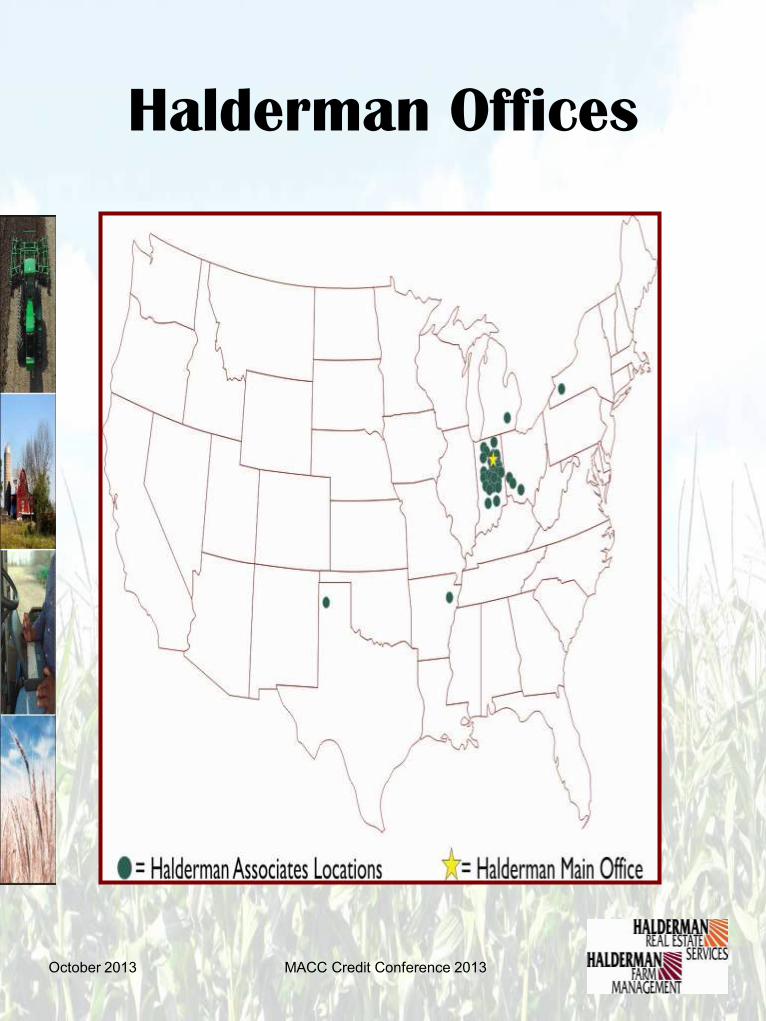
Halderman Offices

October 2013 MACC Credit Conference 2013
History and Staff
• Founded in 1930
• Third Generation Ownership
• 3 corporate managers
• 22 Area Representatives
• 13 Real Estate Associates
• Indiana, Ohio, Michigan, Louisiana, Arkansas, Texas, New York & California
• 10 Support Staff
• Average tenure of staff >20 years

HFMS National Coverage
Area
October 2013 MACC Credit Conference 2013

October 2013 MACC Credit Conference 2013
Farm Land It remains the best investment
in your portfolio!

October 2013 MACC Credit Conference 2013
Farmland Real Estate
Market
• During Fall 2012 capital
gains tax increase fears once
again drive large number of
sales!
• Lower recreational, timber,
and residential values due to
the “2008 financial crisis”
continue, but some signs of
improvement.
• Cropland values remain sky
high!

MACC Credit Conference 2013
Federal Reserve Bank of
Chicago – 7th District
October 2013

MACC Credit Conference 2013
Purdue Survey, Indiana
Farmland Values, 1975-
2013
October 2013

October 2013 MACC Credit Conference 2013
Halderman Farmland
Sales,
by Indiana Region, 2005-
2013
$0$1,000$2,000$3,000$4,000$5,000$6,000$7,000$8,000
Pric
e ($
/A
c)
Indiana
HRES Farmland Sales Results
2005
2006
2007
2008
2009
2010
2011
2012
2013

MACC Credit Conference 2013
Who’s Buying?
October 2013
Farmers
aggressively
buy in ’08
(+29%)
Investors return in ’09 &
‘10 (+30%)

MACC Credit Conference 2013
Sept. – Miami/Wabash Co. – 277 ac. for
$1,812,000
$6,500/acre $47.56/WAPI
Sept. – Miami Co. – 47 ac. for $440,000
$9,285/acre $65.20/WAPI
Sept. – Whitley Co. – 98 ac. for
$790,000
$8,061/acre $52.99/WAPI
Sept. – Carroll Co. – 72 ac. for
$810,000
$11,227/acre $71.55/WAPI
October – Elkhart Co. – 271 ac. for
$3,100,000
$11,415/acre $117.43/WAPI
October – Coshocton Co. – 1,625 ac. for
$4,669,000
$2,873/acre (Pasture and
woods)
October – Allen Co. – 234 ac. for
$2,650,000 $11,315/acre
$77.39/WAPI October 2013
Farmland Real Estate
Sales

MACC Credit Conference 2013
Nov. – Cass Co. – 51 ac. for $455,000
$8,992/acre $53.33/WAPI
Nov. – LaSalle Co., IL – 148 ac. for $1,665,000
$11,000/acre $64.32/WAPI
Nov. – Owen Co. – 44 ac. for $170,000
$3,864/acre $25.74/WAPI
Nov. – Union Co. – 307 ac. for $2,106,000
$6,850/acre $45.00/WAPI
Nov. – Clinton Co. – 123 ac. for $1,075,000
$8,740/acre $51.87/WAPI
Nov. – Benton Co. IN/Iroquois Co. IL – 180 ac.
for $1,955,000
$10,861/acre $64.76/WAPI
Nov. – Cass Co. – 110 ac. for $1,160,000
$10,545/acre $69.28/WAPI
October 2013
Farmland Real Estate
Sales

MACC Credit Conference 2013
Nov. – Clinton Co. – 350 ac. for
$2,605,000
$7,442/acre $47.08/WAPI
Nov. – Miami Co. – 50.1 ac. for
$440,000
$8,782/acre $60.27/WAPI
Dec. – Wabash Co. – 47 ac. for
$355,000
$7,550/acre $51.04/WAPI
Dec. – Fulton Co. – 120 ac. for
$915,000
$7,571/acre $49.41/WAPI
Jan. – Fulton Co. IN – 31 ac. for
$345,000 $11,201/acre
$95.00/WAPI
Jan. – Miami/Howard Co. – 82 ac. for
$985,000
$11,903/acre $71.57/WAPI
October 2013
Farmland Real Estate
Sales
MACC Credit Conference 2013
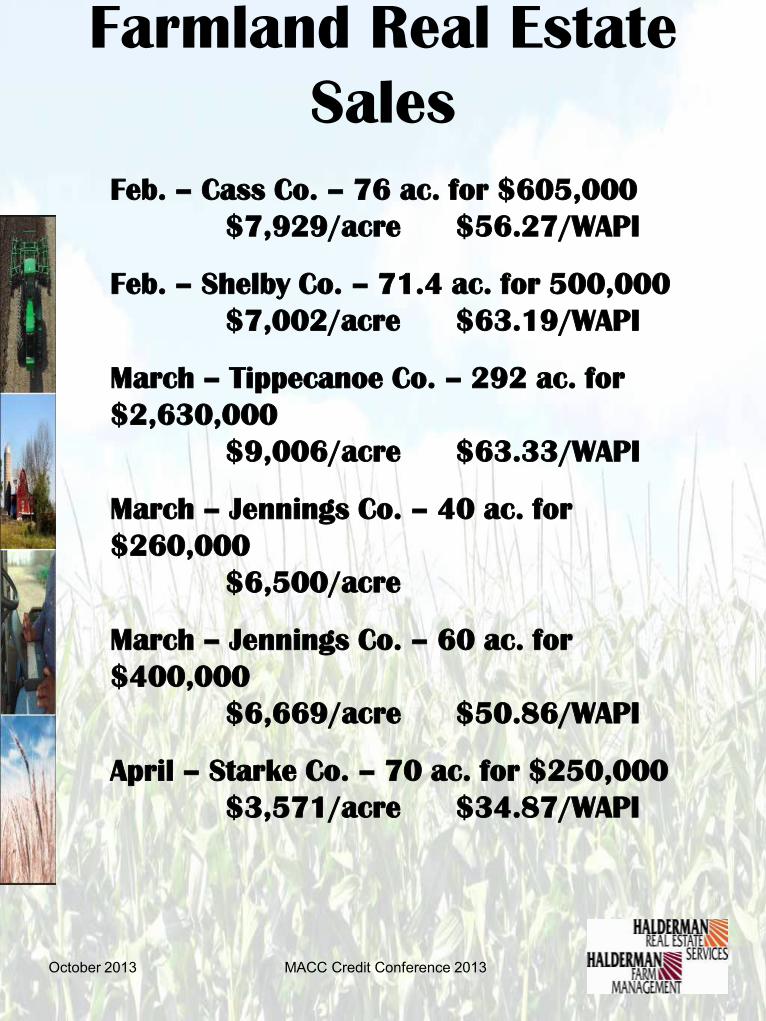
Feb. – Cass Co. – 76 ac. for $605,000
$7,929/acre $56.27/WAPI
Feb. – Shelby Co. – 71.4 ac. for 500,000
$7,002/acre $63.19/WAPI
March – Tippecanoe Co. – 292 ac. for
$2,630,000
$9,006/acre $63.33/WAPI
March – Jennings Co. – 40 ac. for
$260,000
$6,500/acre
March – Jennings Co. – 60 ac. for
$400,000
$6,669/acre $50.86/WAPI
April – Starke Co. – 70 ac. for $250,000
$3,571/acre $34.87/WAPI
October 2013
Farmland Real Estate
Sales

MACC Credit Conference 2013
April – Bolivar Co., MS – 3,627 ac. for
$17.2 MM $4,742/acre
(+$5,200/crop acre)
April – St. Joseph Co. – 79 ac. for
$580,000
$7,272/acre $61.36/WAPI
April – Miami Co. – 105 ac. for
$1,080,000
$10,281/acre $68.54/WAPI
April – Sullivan Co. – 315 ac. for
$2,860,000
$9,079/acre $62.87/WAPI
May – Tippecanoe Co. – 166 ac. for
$1,178,000
$7,096/acre $45.81/WAPI
May – Jackson Co. – 107 ac. for
$1,700,000
$15,887/acre $87.71/WAPI
June – Benton Co. – 119 ac. for
$1,350,000
$11,258/acre $67.94/WAPI October 2013
Farmland Real Estate
Sales
MACC Credit Conference 2013
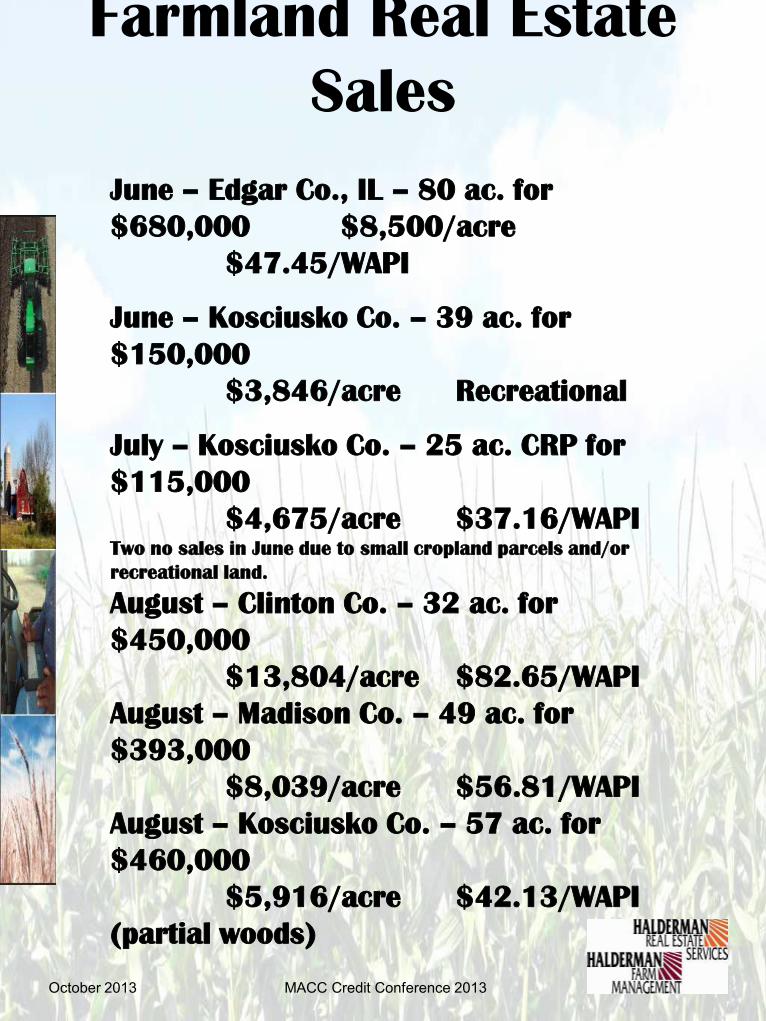
June – Edgar Co., IL – 80 ac. for
$680,000 $8,500/acre
$47.45/WAPI
June – Kosciusko Co. – 39 ac. for
$150,000
$3,846/acre Recreational
July – Kosciusko Co. – 25 ac. CRP for
$115,000
$4,675/acre $37.16/WAPI Two no sales in June due to small cropland parcels and/or
recreational land.
August – Clinton Co. – 32 ac. for
$450,000
$13,804/acre $82.65/WAPI
August – Madison Co. – 49 ac. for
$393,000
$8,039/acre $56.81/WAPI
August – Kosciusko Co. – 57 ac. for
$460,000
$5,916/acre $42.13/WAPI
(partial woods)
October 2013
Farmland Real Estate
Sales

MACC Credit Conference 2013
August – Grant Co. – 80 ac. for
$800,000 $10,000/acre
$67.52/WAPI
August – Scott Co. – 150 ac. for
$860,000
$5,714/acre $42.45/WAPI
August – Allen Co. – 667 ac. for
$5,450,000
$8,170/acre $56.35/WAPI
Sept. – Jasper Co. – 290 ac. for
$1,770,000
$6,103/acre $53.97/WAPI
Sept. – Carroll Co. – 40 ac. for
$540,000
$13,500/acre $81.37/WAPI
Sept. – Shelby Co. – 228 ac. for
$1,015,000
$4,451/acre $41.30/WAPI
Sept. – Clinton Co. OH – 164 ac. for
$1,412,326
$8,600/acre $57.06/WAPI
October 2013
Farmland Real Estate
Sales

Farmland Investment
Characteristics -
Remain the same!
WHY FARMLAND?

October 2013 MACC Credit Conference 2013
Farmers buy because…
• Available cash from ’06-‘13
operations
• Low interest rates – still low,
but for how long??
• Control of acres & “chance
of a lifetime”
• What better alternatives?
– Invest in what you know…and
control
• Retain the returns to land
otherwise paid as rents.

October 2013 MACC Credit Conference 2013
Investors buy because…
• Solid Returns
– Farmland viewed as a “blue-chip”
stock
– Strong capital value growth (5%
CAGR in US)
– Steady dividend (cash) income (3-
4% ROI)
– Nearly zero vacancy rate
• Inflation hedge
– Farmland returns positively
correlated to inflation
• Good portfolio diversification
– Farmland returns negatively
correlated to many financial
investments.

October 2013 MACC Credit Conference 2013
Since 1992, returns averaged 12%+ per annum:
U.S. Farmland History of
Attractive Returns
Notes:
1.The NCREIF Farmland Index is published by the National Council of Real Estate Investment
Fiduciaries and tracks the $1.2 billion tax exempt investor farmland investment market.
2.Data through September 2008.
3.40% Leverage, 6% Borrowing Rate
Permanent Crops:
Row Crops:
Row crops: annual crops.
Permanent crops: multi-year crops.
Sources:
National Council of Real Estate
Investment Fiduciaries (NCREIF) and
U.S. Department of Labor
Perio
d
Total
Return
1 year 29.06%
3 years 26.26%
5 years 23.45%
7 years 18.63%
10
years
15.15%
15
years
13.79%
Perio
d
Total
Return
1 year 21.3%
3 years 38.2%
5 years 32.3%
7 years 23.0%
10
years
17.1%
15
years
13.8%

October 2013 MACC Credit Conference 2013
Index: Farmland Return vs. Stocks, Bonds, Agriculture, Inflation
Sources: National Council of Real Estate Investment Fiduciaries (NCREIF), U.S. Department of
Labor, S&P and Bloomberg.
Farmland outperformed other asset classes in the past
15 years, generating annual returns of over 11%
Attractive Relative Returns
-2.0
0.0
2.0
4.0
6.0
8.0
10.0
1992 1993 1994 1995 1996 1997 1998 1999 2000 2001 2002 2003 2004 2005 2006 2007
U.S. Farmland S&P 500Russell 3000 Lehman U.S. Aggregate Bond
CPI S&P/GSCI - AgricultureFTSE NAREIT Composite
Return Summary
CAGR (%)
Asset Class 10 Yrs 15 Yrs
U.S. Farmland 12.3 11.2
S&P 500 4.9 9.0
Russell 3000 5.9 10.0
Lehman U.S. Agg Bond 6.7 7.2
CPI 2.6 2.6
S&P/GSCI - Agriculture (4.7) 0.7
FTSE NAREIT Composite 11.1 13.5
Average - Ex Farmland 4.4 7.2

October 2013 MACC Credit Conference 2013
Sustained higher demand for grains: food, feed and
fuel.
Rising Demand for Agricultural
Commodities
Sources:
FAO, USDA, Goldman Sachs Commodities research.

October 2013 MACC Credit Conference 2013
Sources:
US Farmland 1910 to 2006 USDA, Large Cap Stocks 1910 to 2006 Ibbotson, Small Cap Stocks
1925 to 2006 Ibbotson, International Stocks 1969 to 2006 MSCI EAFE, Emerging Market
Stocks 1987 to 2006 MSCI Emerging Markets, Long Term Corp Bonds 1925 to 2006 Ibbotson,
Long Term Govt Bonds 1925 to 2006 Ibbotson, US T Bills 1925 to 2006 Ibbotson, General
Real Estate 1972 to 2006 NAREIT Composite, GSCI Index 1969 to 2006 GSCI Total Return,
S&P/GSCI Gold Total Return Index 1978 to 2006, NCREIF Timber Index 1987 to 2006, US
Inflation 1925 to 2006, CPI Ibbotson.
Attractive Correlation
Characteristics
Correlation between Farmland Return and
Returns of Other Assets
Note:
Standard Deviation and Correlations are based on December ending annual returns.
-0.40 -0.20 0.00 0.20 0.40 0.60 0.80
International Stocks
Long Term Corp Bonds
Long Term Govt Bonds
Large Cap Stocks
Timber
Composite Real Estate
Small Cap Stocks
GSCI Index
Emerging Market Stocks
US T-Bills
Gold
US Inflation

October 2013 MACC Credit Conference 2013
Farm Land Where do values go from here?

October 2013 MACC Credit Conference 2013
Where are land prices
going?
• Depends on
»Farm Incomes
»Interest Rates
»Supply • Farm Income records ’07, ‘08
&’11
– (2012 slightly lower) (2013
good?)
• Interest Rates historically low
• Farms for sale ½ of typical
3%

October 2013 MACC Credit Conference 2013
Farm Land Leases Farmland is worth what it earns!

October 2013 MACC Credit Conference 2013
Farm Leases
• Competition for leasing land
remains high!
– More looking at diversification.
• Input costs increased in ’07, ‘08,
’09, & ‘11.
– Flatter in 2012 and 2013 – steady
to lower in 2014??
• Output Opportunities Remain!
– Bio Fuels/Ethanol/Bio Diesel, Feed,
Specialty Crops
• Cash Rents in 2013 - Central IL
from $320 - $447/acre for Class
A

October 2013 MACC Credit Conference 2013
Drought 2012
• Yields were a disaster in many
areas
– Genetics provide more
protection than ever
• Commodity prices moved to all
time highs
• Prices for 2013 grain at
profitable levels
• 74% of IN row crop farmers buy
insurance
– Crop insurance costs taxpayers
$.02/meal.
• Long term demand destruction a
concern
• FYI – today US agriculture uses
15% less water and increased
production > 60%.

MACC Credit Conference 2013
Purdue Survey, Indiana
Farmland Cash Rents,
1975-2013
October 2013
October 2013 MACC Credit Conference 2013
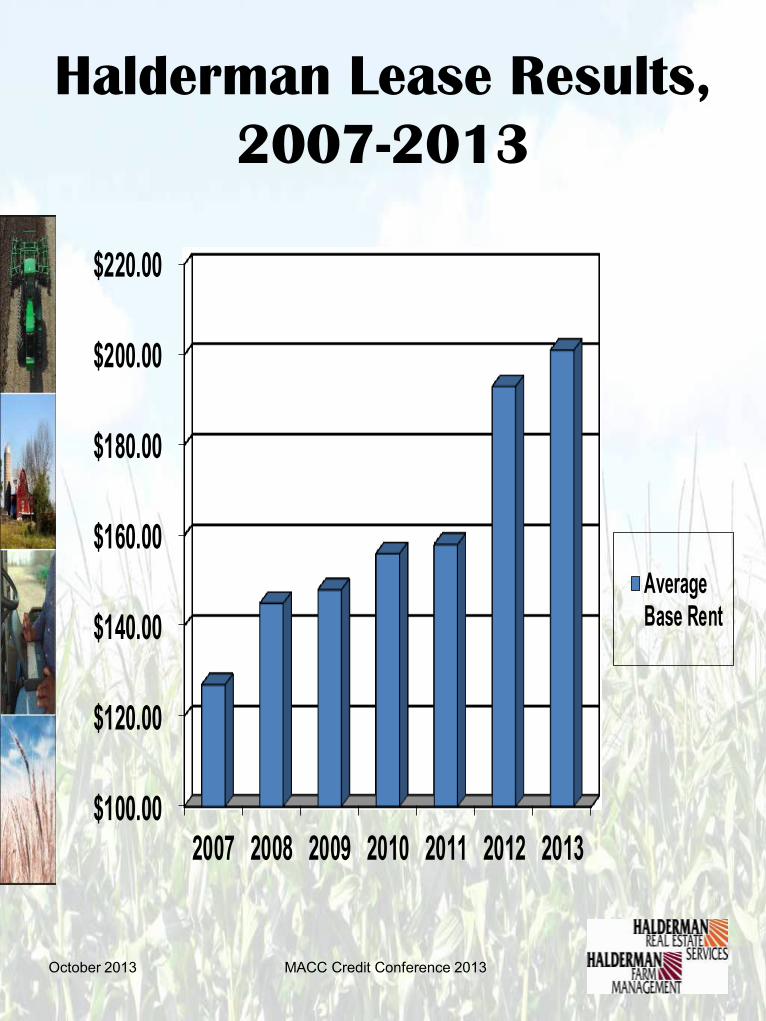
Halderman Lease Results,
2007-2013
$100.00
$120.00
$140.00
$160.00
$180.00
$200.00
$220.00
2007 2008 2009 2010 2011 2012 2013
AverageBase Rent

October 2013 MACC Credit Conference 2013
Lease Types are Shifting
(Halderman New Leases, 2007-
2013)
Cash-Flex leases
grew from 21% to
44%
in 7 years.

MACC Credit Conference 2013
Farmland Real Estate in
2013?
• Long-term world demand
fundamentals remain bullish
for agriculture and therefore
land prices. – UN FAO report shows we need 100% more
food by 2050!
• Farm incomes strong in ‘12
despite drought – outlook for
’13 positive
• Interest rates still favorable
• Supply of farms for sale
remains low
October 2013

MACC Credit Conference 2013
Farmland Real Estate in
2013?
• Maintain all time high values
for prime farmland!
• Foresee continued price
weakness…
– Timber (# of sales up, # of
bids up, prices improved but
still behind high in 2004)
– Recreational (spotty results)
– Rural residential
- Average to below
farmland/hassle farms are
still less desirable.
October 2013

What have we learned??
• The cropland market is
still strong!
• Auctions = best method to
max price
• Recent sales indicate
strength in spite of
declining commodity
prices
• Buyers – investors are
10%
• Residential and
Recreational = continued
weakness, BUT feeling a
little better.
October 2013 MACC Credit Conference 2013
Halderman Real Estate
Services
Real Estate Market
Survey October 1, 2013
Respondents: 20
Geography: IN, Southern MI, & Western OH

Number of Real Estate
Sales Compared To
Previous Years
October 2013 MACC Credit Conference 2013

Farm Sale Methods
Used
October 2013 MACC Credit Conference 2013
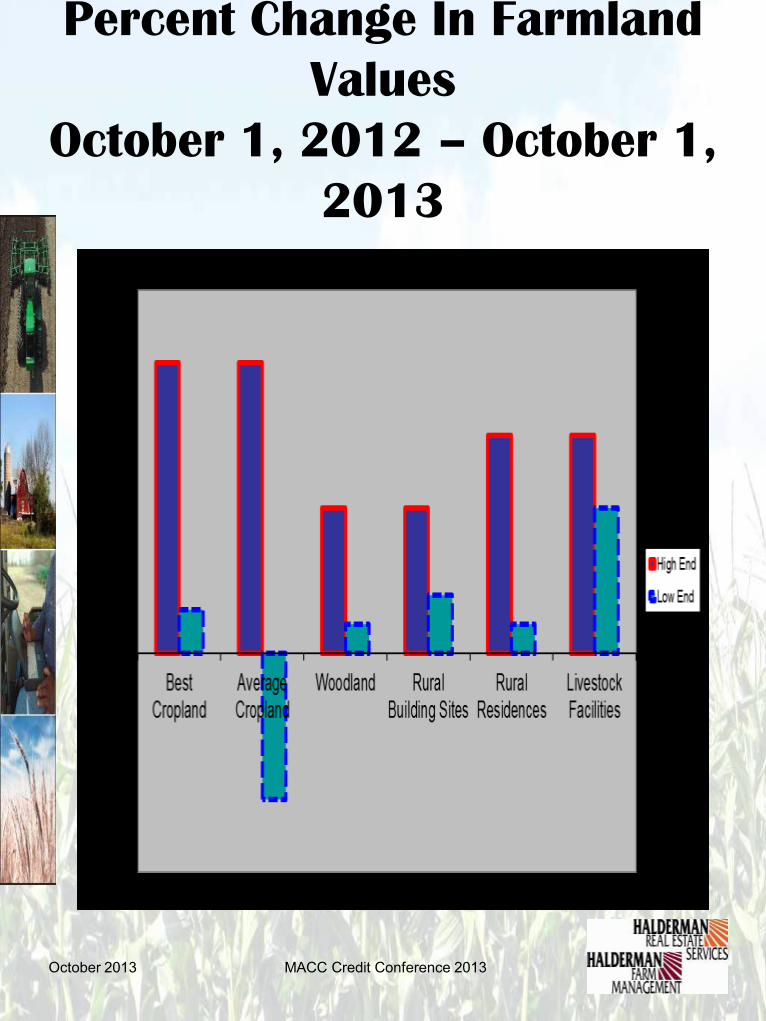
Percent Change In Farmland
Values
October 1, 2012 – October 1,
2013
October 2013 MACC Credit Conference 2013

Dominant Purchasers in the
Land Market
October 2013 MACC Credit Conference 2013

Expectations For Land
Values
October 1, 2013 – May
1, 2014
• Farmland
– Higher: 6 (0% to 5%)
– Lower: 3 (0% to -5%)
– Same: 11
• Rural Residential Lots
– Higher: 5 (3% to 5%)
– Lower: 1 (0% to -5%)
– Same: 13
• Recreational Land
– Higher: 4 (5% to 10%)
– Lower: 1 (0% to -10%)
– Same: 14
October 2013 MACC Credit Conference 2013

MACC Credit Conference 2013
Farmland Real Estate in
2013:
A Bubble? • Land Value Bulls Say . . .
– Low amount of debt in
agriculture
• ¾’s D/A <50% and 75% fixed
– Low interest rates (QE 3 – how
long?)
• Inflection Point in 2nd Quarter??
- World population growth
- Bio Fuels – demand remains
steady?
- Potential for Inflation
- Water resources & competition
- Low supply of farms for sale
October 2013

MACC Credit Conference 2013
What Could Make this a
Bubble? (Fall 2013)
• Land Value Bears say . . .
What if?
– Value of dollar strengthening
continues & demand
destruction = lower exports =
lower commodity prices
– Worldwide economic woes
worsen = lower demand
(Chinese GDP below 7% & EU
concerns)
– Change in biofuels mandates
in primary row crops
– Demand destruction from high
prices October 2013

MACC Credit Conference 2013
What Could Make this a
Bubble? (Fall 2013)
• Interest rates increase due
to hyper -inflation
• Other asset classes’ returns
improve!
• Residential Bubble
Similarities Develop
– Speculative purchases of land
for capital appreciation gains
– Purchases with significant
debt financing on the belief
that land value increases will
cover collateral needs
October 2013

MACC Credit Conference 2013
What Could Make this a
Bubble? (Fall 2013)
• What if??
– Commodity prices erode due
to demand destruction from
high prices ($4/bu. corn for 2
seasons)
– Interest rates increase 100-
300 basis pts.
– Worldwide Economy remains
weak
– Global production continues to
grow
– Farm incomes decline
October 2013

MACC Credit Conference 2013
Why Invest in US
Agriculture?
• 1928
– Population: 1.2 B
– US was 10%
– US provided 10% of world’s
output
• 1968
– Population: 3.5 B
– US was 6%
– US provided 20% of world’s
output
October 2013

MACC Credit Conference 2013
Why Invest in US
Agriculture?
• 2012
– Population: 7 B+
– US is 3%
– US provides 30% of world’s
output
– Today the US producer and US
technology can produce
enough food and fiber to feed
the world!
October 2013

October 2013 MACC Credit Conference 2013
Your Questions?
F. Howard Halderman
President
Halderman Farm Management Service Inc.
Halderman Real Estate Services Inc.
PO Box 297
Wabash, IN 46992
Ofc: 800-424-2324
Fax: 260-563-8889
[email protected] or www.halderman.com