fast blind deblurring of qr code images based on adaptive
TRANSCRIPT

Fast Blind Deblurring of QR Code Images Based on AdaptiveScale Control
Rongjun Chen1& Zhijun Zheng1
& Junfeng Pan1& Yongxing Yu1
& Huimin Zhao1& Jinchang Ren1,2
Accepted: 10 May 2021# The Author(s) 2021
AbstractWith the development of 5G technology, the short delay requirements of commercialization and large amounts of data change ourlifestyle day-to-day. In this background, this paper proposes a fast blind deblurring algorithm for QR code images, which mainlyachieves the effect of adaptive scale control by introducing an evaluationmechanism. Its main purpose is to solve the out-of-focuscaused by lens shake, inaccurate focus, and optical noise by speeding up the latent image estimation in the process of multi-scaledivision iterative deblurring. The algorithm optimizes productivity under the guidance of collaborative computing, based on thecharacteristics of the QR codes, such as the features of gradient and strength. In the evaluation step, the Tenengrad method is usedto evaluate the image quality, and the evaluation value is compared with the empirical value obtained from the experimental data.Combining with the error correction capability, the recognizable QR codes will be output. In addition, we introduced a scalecontrol parameter to study the relationship between the recognition rate and restoration time. Theoretical analysis and experi-mental results show that the proposed algorithm has high recovery efficiency and well recovery effect, can be effectively appliedin industrial applications.
Keywords QR code . Blind deblurring . Tenengradmethod . Adaptive scale control
1 Introduction
As collaborative computing and general technology such asthe Internet of Things (IoT) and information technologyevolved, it provides an environment where people can shareinformation without being restricted by space and time.Through the Internet, it is possible to collaborate effectivelywith anyone, anytime, and anywhere [1]. As the main entranceof the mobile Internet, two-dimensional barcodes are widelyused in commodity payment, public security, financial insur-ance, and other fields due to their large storage capacity, wideapplication range, and strong sharing capabilities. QuickResponse (QR) code, as the most common two-dimensionalbar codes, has the advantages of low cost, easy production,
durability, and so on [2–4]. However, in real life, out-of-focusblurred QR code images are often collected due to imagingproblems such as lens shake, inaccurate focus, and opticalnoise. The ubiquitous image degradation usually leads to dif-ficulties in QR code extraction and identification. In the era ofcommercialization, especially driven by 5G technology, peo-ple have higher requirements for the speed of informationacquisition. This is why the fast deblurring of QR code imageshas become a research focus at this stage, especially in indus-trial applications [5], such as the traceability of salt, food, andmedicine in Fig. 1. When an out-of-focus blurred QR codeimage is acquired, the deblurring algorithm will be used. Itsmain purpose is to restore the damaged image to the greatestextent by improving the signal-to-noise ratio after a series ofprocessing on the damaged or degraded image. Traditionalimage restoration assumes that the image degradation functionhas been given, that is, the blur kernel is known. But in reallife, the blur kernel is usually unknown, and the image canonly be restored by obtaining the prior image, so as to achievethe effect of blind deblurring.
In recent years, a series of studies have been carried out inthe field of blind deblurring at home and abroad. Aiming at theblind deblurring of the binary images, which are similar to theQR code images, Zoran et al. [7] presented a general
* Huimin [email protected]
* Jinchang [email protected]
1 School of Computer Science, Guangdong Polytechnic NormalUniversity, Guangzhou, China
2 National Subsea Centre, Robert Gordon University, Aberdeen, U.K.
Mobile Networks and Applicationshttps://doi.org/10.1007/s11036-021-01780-y

framework for calculating MAP estimates, showing how toderive an appropriate cost function, how to optimize it, andhow to use it to return for the entire image. This frameworkhas made a huge contribution in the field of blind deblurring.The more complex the image is, the better the deblurring willaffect. But it pays more attention to details, so it is difficult toeliminate the ringing effect. Pan et al. [8, 9] proposed a simplebut effective L0-regularized text and beyond deblurring algo-rithm based on the intensity and gradient priors. Comparedwith the existing blind deblurring algorithms, this algorithmdoes not need any complicated filtering strategy to select theedge, and can be applied to debluring the low-illuminationimages. In addition, this algorithm is easy to understand andrealize, but the multi-scale iterative estimation methodadopted is too redundant to take a long time. On the basis ofPan’s algorithm, Liu and Du et al. [10] introduced the binaryfeature of QR codes to construct a new constraint term toachieve double-layer constraints on QR images and have ex-cellent effects on common blurred kernels and multiplenoises. This algorithm is efficient than the traditional algo-rithm but still does not solve the speed problem of blinddeblurring. Nah et al. [11] realized the deblurring of dynamicscenes through the simulation of multi-scale loss functionbased on a multi-scale convolutional neural network.
However, a large number of training samples and trainingtime are the disadvantages of this algorithm. Bai et al. [12]proposed a graph-based blind image deblurring algorithm byinterpreting an image patch as a signal on a weighted graph.This algorithm can deal with various blind image deblurringscenarios, and the reconstructed sharp results are better thanthe state-of-the-art methods visually and numerically. A com-mon disadvantage is that the algorithm is not ideal for moreobscure ones. Based on the Pan’s, Wen et al. [13] proposed anovel algorithm with a simplified sparsity prior of local min-imal pixels (PMP) rather than directly using the half quadraticsplitting algorithm. This algorithm can improve the practicalstability and computational efficiency substantially, and havea certain improvement in speed.
We note that, blind image deblurring is an ill-posed prob-lem, so it is difficult to find an effective and universal solution.However, fortunately, the main processes of the existing blinddeblurring algorithm based on L0 regularization is multi-scaleiteration, image estimation, and blurred kernel estimation,which can effectively solve this problem. In this paper, wepropose a fast blind deblurring algorithm for QR code imagesbecause of the slowness of the existing blind deblurring algo-rithms in the multi-scale iterations. A large number of exper-iments show that this method can effectively implement
Fig. 1 Some examples ofindustrial applications of QRcodes: (a) Salt, (b) Chocolate, (c)Medicine, (d) Beetroot. Source:picture c is snapshot of real situa-tions in the clinical lab of a localhospital from Jiang [6]
Mobile Netw Appl
adaptive scale control, which greatly improves the speed ofthe blind deblurring algorithm. The remainder of this paper isorganized as follows. Section 2 briefly reviews the relatedwork on image deblurring and image quality evaluation.
Section 3 presents the proposed Algorithm through analysingthe evaluation mechanism and the idea of adaptive scale con-trol. Section 4 is the overall process of the algorithm in thispaper. In this section, we elaborate the procedure of the
(a) (b)
(c) (d) (e)
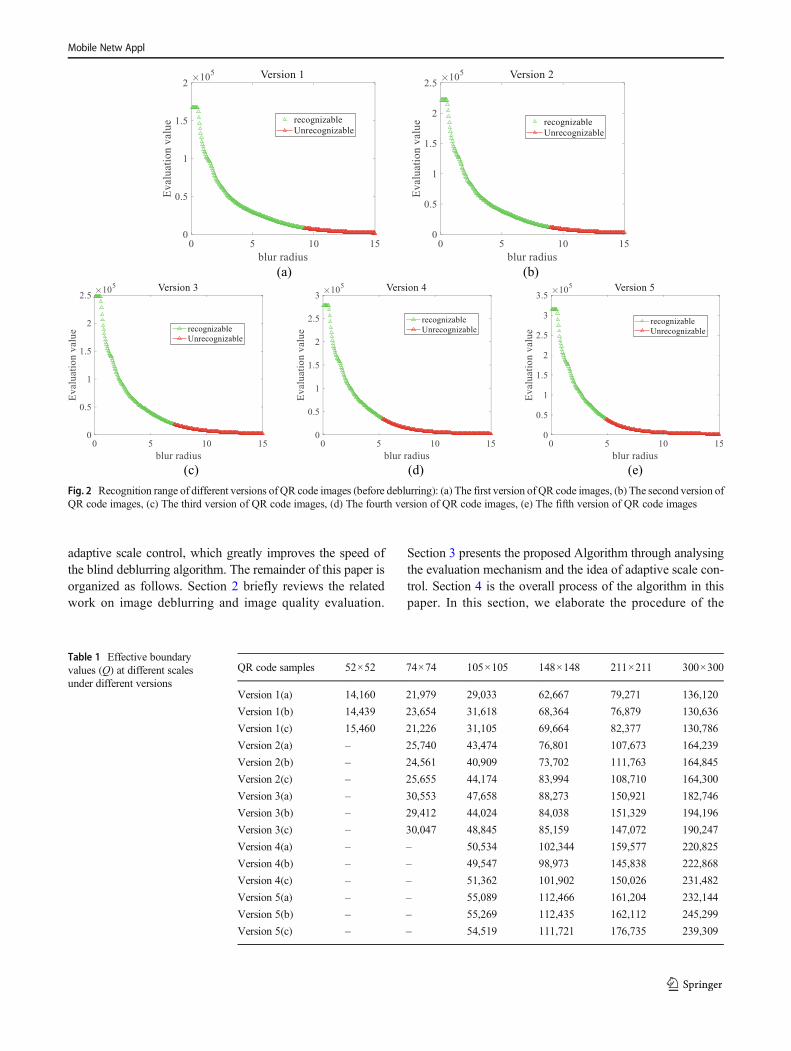
Fig. 2 Recognition range of different versions of QR code images (before deblurring): (a) The first version of QR code images, (b) The second version ofQR code images, (c) The third version of QR code images, (d) The fourth version of QR code images, (e) The fifth version of QR code images
Table 1 Effective boundaryvalues (Q) at different scalesunder different versions
QR code samples 52×52 74×74 105×105 148×148 211×211 300×300
Version 1(a) 14,160 21,979 29,033 62,667 79,271 136,120
Version 1(b) 14,439 23,654 31,618 68,364 76,879 130,636
Version 1(c) 15,460 21,226 31,105 69,664 82,377 130,786
Version 2(a) – 25,740 43,474 76,801 107,673 164,239
Version 2(b) – 24,561 40,909 73,702 111,763 164,845
Version 2(c) – 25,655 44,174 83,994 108,710 164,300
Version 3(a) – 30,553 47,658 88,273 150,921 182,746
Version 3(b) – 29,412 44,024 84,038 151,329 194,196
Version 3(c) – 30,047 48,845 85,159 147,072 190,247
Version 4(a) – – 50,534 102,344 159,577 220,825
Version 4(b) – – 49,547 98,973 145,838 222,868
Version 4(c) – – 51,362 101,902 150,026 231,482
Version 5(a) – – 55,089 112,466 161,204 232,144
Version 5(b) – – 55,269 112,435 162,112 245,299
Version 5(c) – – 54,519 111,721 176,735 239,309
Mobile Netw Appl
algorithm by three main parts, multi-scale division, im-age estimation, and blurred kernel estimation. Section 5shows the experimental results and finally Section 6concludes the paper.
2 Related work
Generally, image restoration technologies can be coarsely di-vided into two categories. One is the non-blind deconvolution
algorithm. The algorithm refers to the deconvolution process-ing on the basis of the image blur mechanism and the pointspread function (PSF). The other is the blind deconvolutionalgorithm. When the PSF is not known, the PSF and the orig-inal clear image need to be estimated according to the priorknowledge of the blurred image, which is an ill-posed prob-lem. In the aspect of image quality evaluation, according towhether there are reference images, full reference, semi-refer-ence, and no-reference are the main methods for objectiveevaluation of image quality. The full reference image
Table 2 Average boundaryvalues (Qmax) at different scalesunder different versions
QR code samples 52×52 74×74 105×105 148×148 211×211 300×300
Version 1 14,906 22,286 30,585 66,898 79,509 132,514
Version 2 – 25,319 42,852 78,166 109,349 164,461
Version 3 – 30,004 46,842 85,823 149,774 189,063
Version 4 – – 50,481 101,073 151,814 225,059
Version 5 – – 54,959 112,207 166,684 238,918
Table 3 The recognition rate and average operation time of QR code images under different scale control parameters p
pQR codes
Recognition Rate (%) - Zxing 3.4.0 Average Operation Time (s)
0 1 2 3 4 5 0 1 2 3 4 5
Version 1 91.67 93.67 99 99 99 99 1.52 1.71 2.60 5.05 9.07 21.5
Version 2 91 91 96.3 96.3 96.3 96.3 2.21 2.43 2.72 5.38 9.38 21.3
Version 3 95 95 95.67 95.67 95.67 95.67 3.11 3.53 3.63 6.0 9.71 21.3
Version 4 97.35 97.35 97.35 98.53 99.12 99.12 3.45 3.59 3.87 6.76 9.74 21.17
Version 5 94.33 94.33 94.33 97.67 99.67 99.67 3.64 3.65 3.92 6.83 10.58 21.22
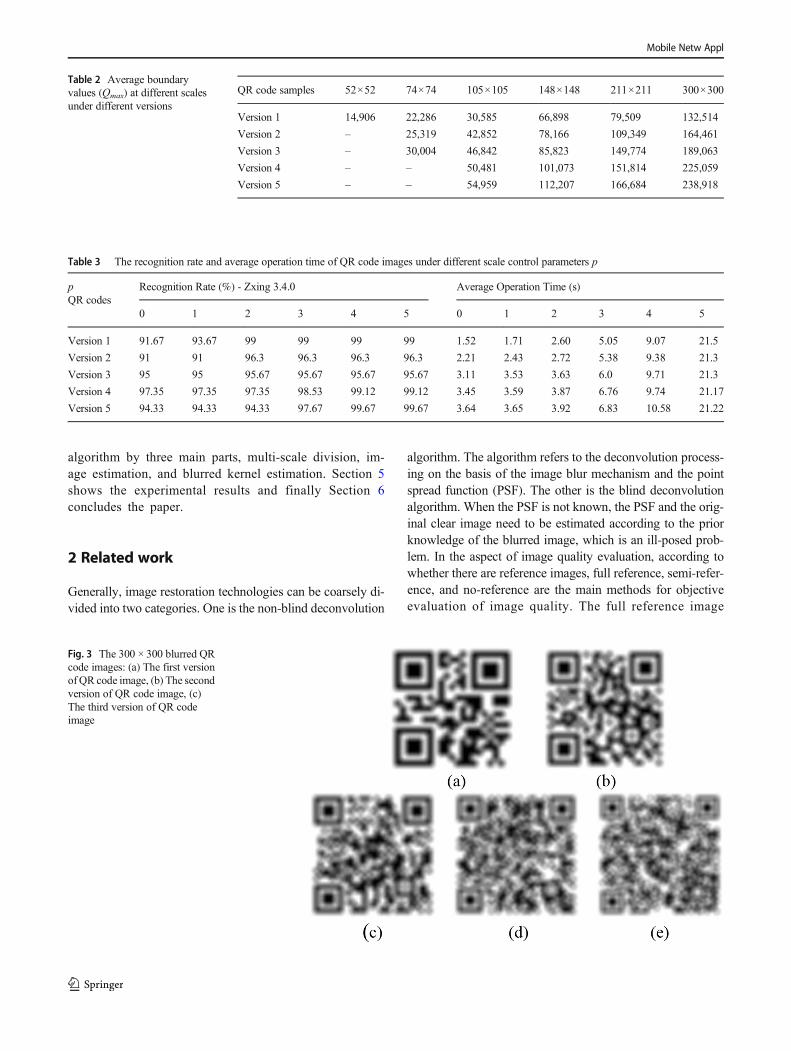
Fig. 3 The 300 × 300 blurred QRcode images: (a) The first versionof QR code image, (b) The secondversion of QR code image, (c)The third version of QR codeimage
Mobile Netw Appl

evaluation method works best, and its premise is that theoriginal reference image can be found. But in general, thereference image is difficult to obtain. The semi-reference im-age evaluation method is generally used when the completereference image information cannot be obtained, or only theinformation of the reference image is extracted. This methodoften uses features of extraction and comparison to evaluatethe image clarity. However, this paper uses the no-referenceimage quality method, which can directly estimate the clarityof the image by using certain characteristics of the imagewithout reference images. It is not as effective as full referenceand semi-reference, but it meets the needs of actual life andhas higher practicality. In the following, we only briefly re-view the previous work closely related to out-of-focus imagedeblurring and image quality evaluation.
2.1 Image Deblurring
Many previous methods introduce complex image priors andregard blind image restoration as a joint optimization problemby penalizing image blurriness and promote image sharpness.For example, L0-norm based priors [8–10], dark channel prior[14], low-rank prior [15], graph-based prior [12], multi-scalelatent structure prior [16], local maximum gradient prior [17]and deep priors [18], etc. These methods can effectively re-duce the ill-posed of blind image restoration algorithms, butthey are usually computationally expensive. The fundamentalreason is mainly through the calculation of any non-convexprior with a large amount of calculation, which leads to com-plex optimization algorithms. What’s more, the parametricassumptions on blur kernels could greatly improve the
Fig. 4 The first version of the blind deblurring algorithm for QR codeimage: (a) Latent image with the scale of 52 × 52, (b) Latent image withthe scale of 74 × 74, (c) Latent image with the scale of 105 × 105, (d)
Latent image with the scale of 148 × 148, (e) Latent image with the scaleof 211 × 211, (f) Latent image with the scale of 300 × 300
Fig. 5 The second version of the blind deblurring algorithm for QR codeimage: (a) Latent image with the scale of 52 × 52, (b) Latent image withthe scale of 74 × 74, (c) Latent image with the scale of 105 × 105, (d)
Latent image with the scale of 148 × 148, (e) Latent image with the scaleof 211 × 211, (f) Latent image with the scale of 300 × 300
Fig. 6 The third version of the blind deblurring algorithm for QR codeimage: (a) Latent image with the scale of 52 × 52, (b) Latent image withthe scale of 74 × 74, (c) Latent image with the scale of 105 × 105, (d)
Latent image with the scale of 148 × 148, (e) Latent image with the scaleof 211 × 211, (f) Latent image with the scale of 300 × 300
Mobile Netw Appl
robustness of blind image deblurring [19, 20], a principledalgorithm within the maximum a posterior framework to tack-le image restoration with a partially known or inaccurate deg-radation model [21], and other deep learning and othermethods that contain a large number of real image sets andtraining sets using self-supervised methods [22–26], thecharacteristics of training data sets are often It willgreatly affect the performance of the entire model, andin many cases, the construction and processing of datasets are often very expensive and low feasibility.
2.2 Image quality evaluation
When an image is blurred or out of focus, it loses the details ofthe edges. Consequently, it is necessary to apply a non-reference image definition evaluation method with high sen-sitivity to the gradient in real life. The common referenceimage evaluation methods are the image histogram method,variance method, Tenengrad method, Laplacian method, fastFourier transform method, grey variance method, histogramentropy method, and local histogram method [27]. In recentyears, the Kang & Park method [28], X-ray tomography [29],StyleGAN [30] etc. are used to analyse and improve imagesharpness. The disadvantage of high image sharpness is usu-ally cost, because it requires more expensive systems andlonger scan times. Therefore, the traditional Tenengrad meth-od is adopted in this paper. This method not only can reduce
the occurrence of local extremum after selecting a certainthreshold [31], but also has good sensitivity and accuracy[32, 33]. It is a common image clarity evaluation functionbased on gradient. In image processing, the edge pixel greyof QR code images in ideal state changes faster, that is, thevalue of gradient function is larger, while the edge pixel greyof blurred QR code images changes more smoothly, and thegradient is smaller.
3 The proposed algorithm
In this paper, a classic statistical method is used. Under theguidance of collaborative computing, an evaluation mecha-nism is introduced. That is, the effective boundary values ofdifferent scales and the recognition rate and average calcula-tion time under the control of different scales are calculatedand analyzed, so as to realize adaptive scale control, which is afast blind deblurring thought to Section 4. This section showswhat is the evaluation mechanism and how to implementadaptive scale control based on theoretical and experimentalanalysis.
3.1 Evaluation mechanism
To study the adaptive scale control to shorten the time of theblind deblurring algorithm of QR code images, the value of
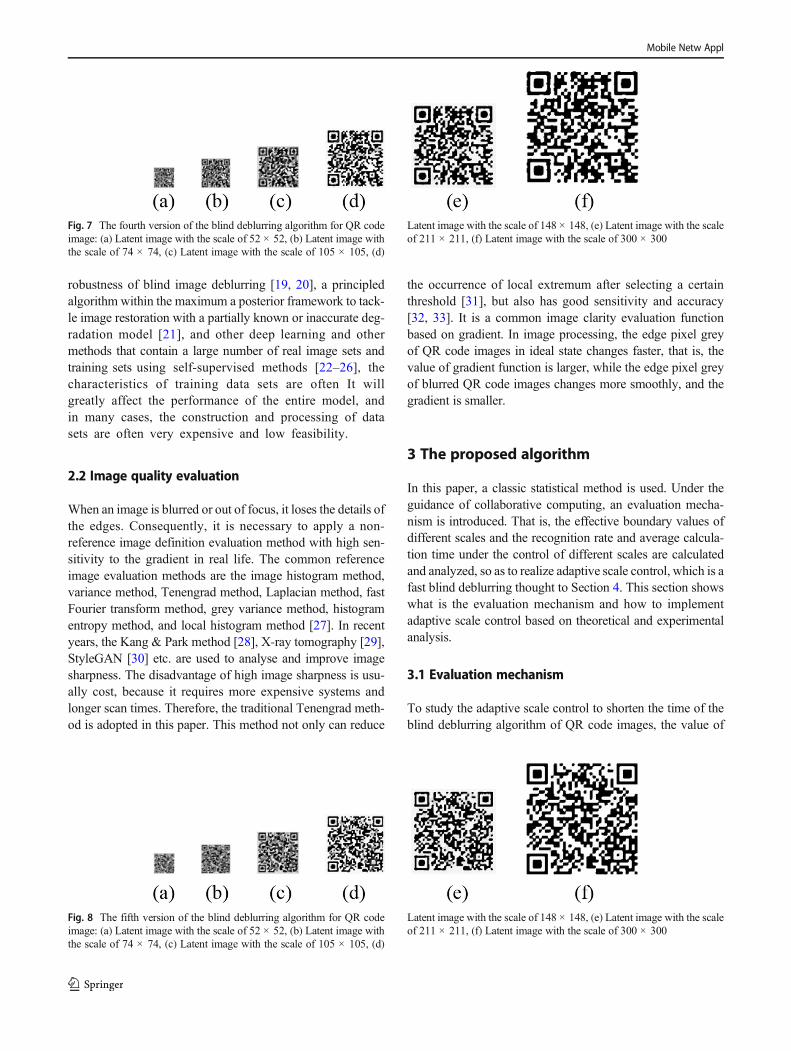
Fig. 7 The fourth version of the blind deblurring algorithm for QR codeimage: (a) Latent image with the scale of 52 × 52, (b) Latent image withthe scale of 74 × 74, (c) Latent image with the scale of 105 × 105, (d)
Latent image with the scale of 148 × 148, (e) Latent image with the scaleof 211 × 211, (f) Latent image with the scale of 300 × 300
Fig. 8 The fifth version of the blind deblurring algorithm for QR codeimage: (a) Latent image with the scale of 52 × 52, (b) Latent image withthe scale of 74 × 74, (c) Latent image with the scale of 105 × 105, (d)
Latent image with the scale of 148 × 148, (e) Latent image with the scaleof 211 × 211, (f) Latent image with the scale of 300 × 300
Mobile Netw Appl
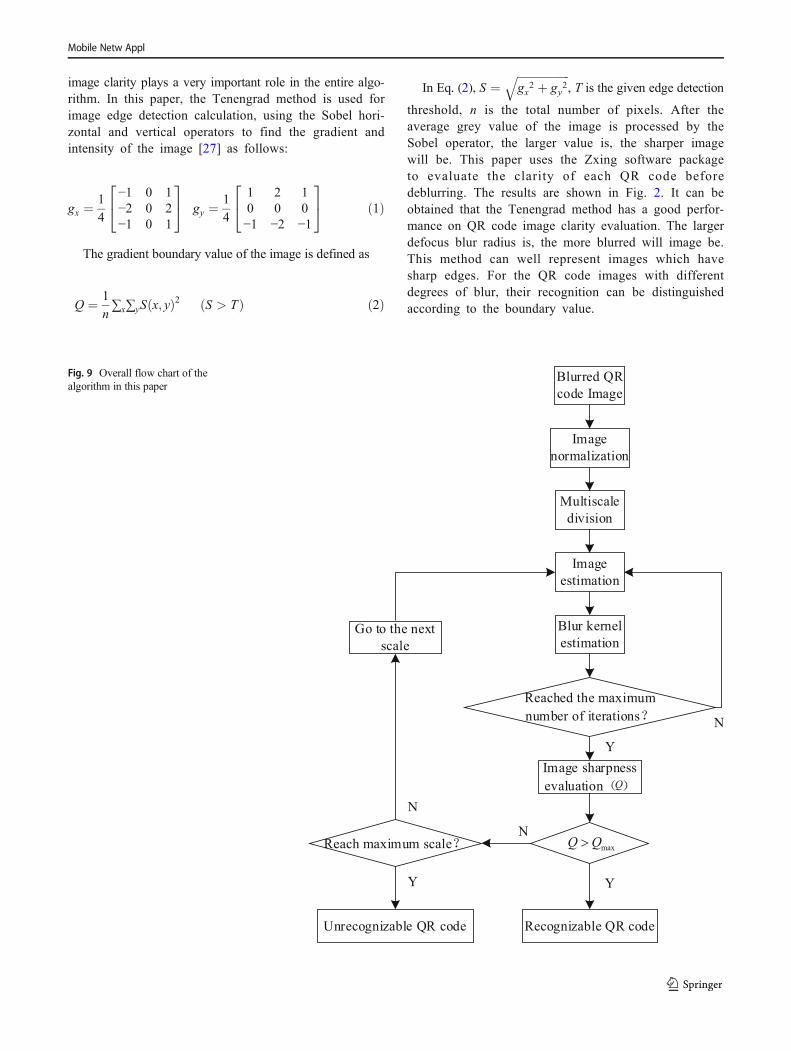
image clarity plays a very important role in the entire algo-rithm. In this paper, the Tenengrad method is used forimage edge detection calculation, using the Sobel hori-zontal and vertical operators to find the gradient andintensity of the image [27] as follows:
gx ¼1
4
−1 0 1−2 0 2−1 0 1
24 35 gy ¼1
4
1 2 10 0 0−1 −2 −1
24 35 ð1Þ
The gradient boundary value of the image is defined as
Q ¼ 1
n∑x∑yS x; yð Þ2 S > Tð Þ ð2Þ
In Eq. (2), S ¼ffiffiffiffiffiffiffiffiffiffiffiffiffiffiffiffiffiffiffigx2 þ gy2
q, T is the given edge detection
threshold, n is the total number of pixels. After theaverage grey value of the image is processed by theSobel operator, the larger value is, the sharper imagewill be. This paper uses the Zxing software packageto evaluate the clarity of each QR code beforedeblurring. The results are shown in Fig. 2. It can beobtained that the Tenengrad method has a good perfor-mance on QR code image clarity evaluation. The largerdefocus blur radius is, the more blurred will image be.This method can well represent images which havesharp edges. For the QR code images with differentdegrees of blur, their recognition can be distinguishedaccording to the boundary value.
Fig. 9 Overall flow chart of thealgorithm in this paper
Mobile Netw Appl
To obtain the boundary value accurately, in this paper, weselect QR code images of three different contents for eachversion to simulate 300 blurred images with a blur radius of[0.05,15]. It can be seen from Fig. 2 that there is a certainrelationship between the recognizability of QR code andTenengrad value, which can be used as an indicator to judgewhether the QR code images can be recognized. According tothe statistics of the experimental results, for QR code imageswith the same version but different contents, the recognitionboundaries are also similar. The boundary defocuses ratio B ofthe 1–5 version of QR codes are about B1 = 9.1, B2 = 8.9,B3 = 6.75, B4 = 5.5, and B5 = 4.9. After that, to improve theaccuracy of the boundary value, we shorten the differentlengths and deblur the images by adding and subtracting0.02 defocus ratio. Therefore, we obtain the effective bound-ary values (Q) at different scales under different versions asshown in Table 1. After obtaining Q, we can get the averageboundary value (Qmax) of different versions, which is the eval-uation mechanism proposed in this paper, as shown inTable 2. Table 2 is the average value of Table 1. It can be seenfrom Table 2 that the evaluation value becomes larger with theincrease of scale or version relatively.
As we all know, QR codes have certain error correction capa-bilities, and the higher version, the more stored content. Besides,the chosen error correction level and the type of encoded data
influence capability [2]. It can be obtained through large quantitiesof experiments that the deblurring intervals of 1–5 version can ber o u g h l y s e t a s I 1 ∈ [ 9 . 1 , 1 2 . 2 ] ,I2 ∈ [8.9,11.8],I3 ∈ [6.75,11.35], I4 ∈ [5.5,11.1] andI5∈ [4.9,9.95]. Since image deblurring requires six scale iterations,we introduce the scale control parameter p (p∈ [0, 5]) to improvethe accuracy of the algorithm in this paper. p (p∈ [0, 5]) indicatesthat each blurred image abandons the previous p scale compari-sons during the scale iteration process, and further compares rec-ognition rate of QR codes. After that, we randomly generate theQR code sample libraries in these intervals, and obtain the recog-nition rate R and deblurring time T from the identifiable images asshown in Table 3. FromTable 3, the relationship betweenR and Tcan be obtained under the same p. As p increases, R and T alsoincrease, and the larger p, the longer time required for adjacentscales. That is while improving the deblurring speed of the QRcode images, it lost a certain recognition rate.
3.2 Adaptive scale control
QR codes have the ability to read at high speed and support errorcorrection processing. That is, when the QR code image is nor-malized and the multi-scale iterative deblurring operation is per-formed, it has the recognition ability before the next scale iteration.Based on this feature of the QR code images, this paper makes a
( a ) (b) (c)
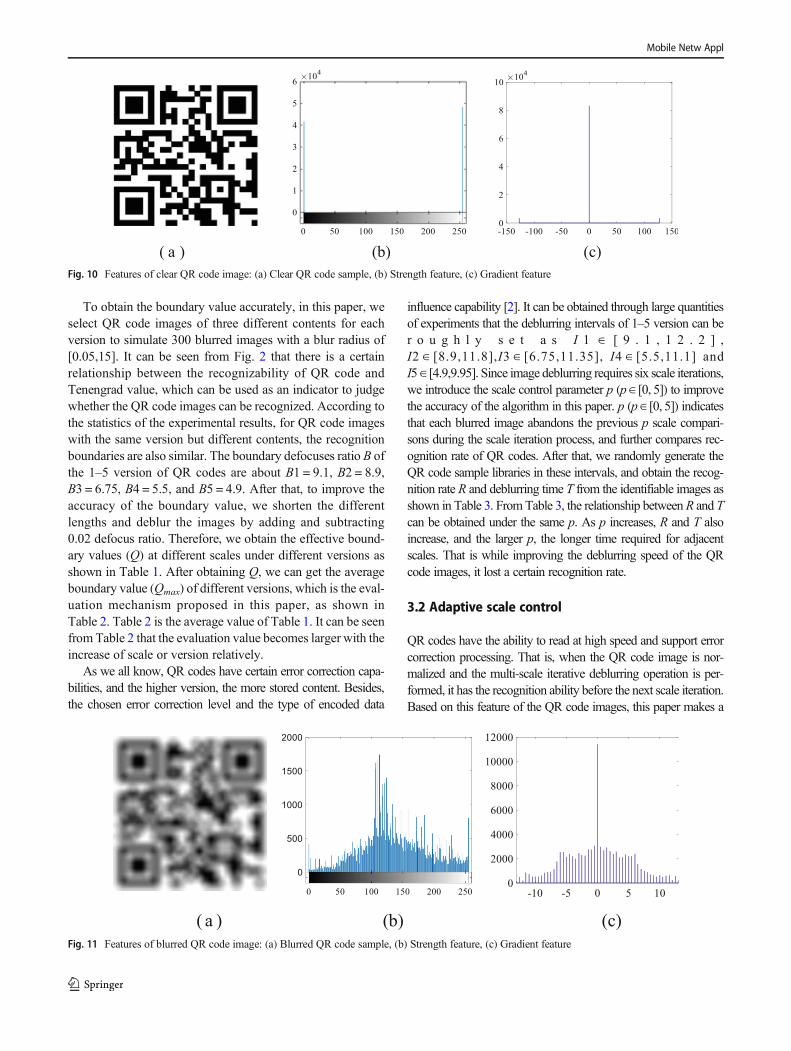
Fig. 11 Features of blurred QR code image: (a) Blurred QR code sample, (b) Strength feature, (c) Gradient feature
( a ) (b) (c)
Fig. 10 Features of clear QR code image: (a) Clear QR code sample, (b) Strength feature, (c) Gradient feature
Mobile Netw Appl

judgment (see Figs. 3, 4, 5, 6, 7 and 8), and Fig. 3 is the collectionof the input images. Figures 4, 5, 6, 7 and 8 show the effects ofeach iteration on the QR code images based on the existing blinddeblurring algorithm [8, 34, 35]). It can be clearly seen that as thenumber of iterations increases, the QR codes become clearer grad-ually, but the blurred QR code image already has the ability torecognize before the number of iterations ends. This is because theQR code has a certain error correction rate, and can be recognizedwhen the image is not optimal.
Based on the aspect of QR codes, this paper intro-duces the Tenengrad method based on the existing blinddeblurring algorithms, which realizes adaptive scale con-trol of QR code images, thereby improving the speed ofthe blind deblurring algorithm.
4 Fast blind deblurring algorithm
Based on the existing blind deblurring algorithms [8, 9, 34–37]and the evaluation mechanism [9, 27, 28, 30, 31, 38], this paperproposes a fast blind deblurring algorithm for QR code imagesbased on adaptive scale control. Firstly, we uniformly normalizethe input QR code images. After that, the images are obtained bymulti-scale division, image estimation and blurred kernel estima-tion algorithm. Finally, a Tenengrad evaluation function wasintroduced to obtain the empirical value. The image normaliza-tion is normalized into a 300 × 300matrix without damaging anyinformation of the image. Multi-scale division, that is, the imageis divided into multiple scales for deblurring operation. Theblurred kernels estimated at each scale will be up-sampled tothe next scale and used as the next input, and finally obtain aclear QR code image. Image estimation is to deconvolve theblurred kernels and blurred QR code images, then predictclearer QR code images. Blurred kernel estimation is touse the clearer QR code images and blurred image obtainedin the previous step as input, and obtain a more accurate
blurred kernel finally. When the maximum number of iter-ations is reached, the Tenengrad method will be used. Weuse this method when the original reference image cannot befound, and rely on gradient features of the image to directlyestimate the clarity of the image. This method firstly obtainsempirical values of QR code images by a large number ofexperimental statistics. After that, each experimental objectwas evaluated. Last but not least, the numerical value Qgenerated by evaluation was compared with empirical valueQmax before deblurring operation on each scale. IfQ >Qmax,the QR code under this scale can already be identified, andno further operation is required to achieve the adaptive scaleeffect of blind deblurring. The overall flow of the algorithmis shown (see Fig.9). The proposed algorithm will be ana-lyzed and calculated from three main parts, that is, multi-scale division, image estimation and blurred kernelestimation.
4.1 Multi-scale division
The multi-scale division algorithm firstly unifies the inputblurred QR code image y into a 300 × 300 matrix and theblurred kernel k into a 31 × 31 matrix. Then, we refer toCho’s idea [36], a coarse-to-fine scheme, when estimatingthe latent image and blurred kernel. When the QR code imageis at the coarse scale, it will initialize k and down-sample y,and then estimate image and blurred kernel. Each scale hasfive iterative optimizations of k. After obtaining the estimatedvalue of k, it will be up-sampled to the next scale level bybilinear interpolation, and then execute the estimation opera-tion and down-sample the blurred image y. The scale divisionformula is as follows (see (3) and (4)):
d ¼lg 5
�kd
� �lg rð Þ þ 1 ð3Þ
Fig. 13 Version 2 - comparison of restoration effects under different algorithms and adaptive scale p: (a) Blurred image, (b) Zoran et al., (c) Pan et al., (d)Wen et al., (e) p = 0, (f) p = 1, (g) p = 2, (h) p = 3, (i) p = 4, (j) p = 5, (k) Ground truth
Fig. 12 Version 1 - comparison of restoration effects under different algorithms and adaptive scale p: (a) Blurred image, (b) Zoran et al., (c) Pan et al., (d)Wen et al., (e) p = 0, (f) p = 1, (g) p = 2, (h) p = 3, (i) p = 4, (j) p = 5, (k) Ground truth
Mobile Netw Appl

kl ¼ rd−1 ð4Þ
In Eqs. (3) and (4), r ¼ ffiffiffiffiffiffiffi0:5
p, d represents the number of
scale divisions, kd is the estimated blurred kernel size, kl is thedivided blurred kernel scale. For a 31 × 31 matrix-size blurredkernel and a matrix size (300 × 300) QR code image, aftermulti-scale division and downward rounding, we get 6 differ-ent scales. The sizes of blurred kernels are 7 × 7, 9 × 9,11 × 11, 17 × 17, 23 × 23, 31 × 31 from the coarse-to-finescheme. The image will also be down sampled to 52 × 52,74 × 74, 105 × 105, 148 × 148, 211 × 211 and 300 × 300. yl isthe image after division.
4.2 Image estimation
Taking the first version as an example, the QR code image isa binary image, which has a strong contrast for its back-ground is white and the module is black. Compared withthe text image, the module of the QR code image is a wholesquare. For clear images, their values are distributed be-tween 0 and 255 in terms of intensity (see Fig.10(b)). Onthe contrary, the blurred image is distributed with a largenumber of non-zero values, and there are very few valueswhere the pixel intensity is zero (see Fig.11(b)). In terms ofimage gradient, the image pixel gradient feature performswell for suppressing artifacts in QR codes, that is, in non-edge regions, the gradient is zero, and between black andwhite modules, the number of zero is relatively rare (seeFig.10(c) and Fig.11(c)). The intensity and gradient distri-bution of QR code images with different blurred degrees aresimilar. Therefore, the prior of QR code image blinddeblurring can be defined as:
P xð Þ ¼ σPt xð Þ þ Pt ∇xð Þ ð5Þ
In Eq. (5), σ represents the weight. Pt(∇x) describes the QRcode image gradient andPt(∇x) = ||∇x||0; Pt(x) describes theintensity characteristics of the QR image, and Pt(x) = ||x||0,where ||x||0 represents L0- regularization.
Based on the prior of the QR code image, this paper quotedthe algorithm mechanism of Pan [8, 9]. Under the assumptionthat the blurred kernel is known or initialized, the non-blinddeconvolution method of the image is used to perform thedeblurring process to obtain a clear image, that is, the L0-regularization of the intensity and gradient of the image isused as the constraint below:
bx ¼ minx
x⨂k−yk k22 þ λP xð Þ ð6Þ
In Eq. (6), x is the clear image, k denotes a blurred kernel, yis a blurred image, λ is the weight parameter, P(x) representsthe prior of the image, ⊗ is the convolution operator, k k22 isthe regularization constraint term. And quote u and g(gh, gv)
T
as auxiliary variables. u is used to approximate x, g(gh, gv)T is
used to approximate ∇x by:
bx ¼ minx;u;g
x⨂k−yj jj j22 þ β x−uj jj j22 þ μ ∇x−gj jj j22 þ λ σ uj jj j0 þ gj jj j0� � ð7Þ
In Eq. (7), β and μ are regularization parameters. Whentheir values are infinitely close to ∞, eq. (7) is equiva-lent to eq. (6). By fixing other variables, we use analternating minimization method to minimize x. Thevalues of μ and g are initialized to zero. In each itera-tion, the solution of x is obtained as follows.
x ¼ minx
x⨂k−yj jj j22 þ β x−uj jj j22 þ μ ∇x−gk k22 ð8Þ
Fig. 15 Version 4 - comparison of restoration effects under different algorithms and adaptive scale p: (a) Blurred image, (b) Zoran et al., (c) Pan et al., (d)Wen et al., (e) p = 0, (f) p = 1, (g) p = 2, (h) p = 3, (i) p = 4, (j) p = 5, (k) Ground truth
Fig. 14 Version 3 - comparison of restoration effects under different algorithms and adaptive scale p: (a) Blurred image, (b) Zoran et al., (c) Pan et al., (d)Wen et al., (e) p = 0, (f) p = 1, (g) p = 2, (h) p = 3, (i) p = 4, (j) p = 5, (k) Ground truth
Mobile Netw Appl
The closed-form solution to this minimization problem isto use the extreme value to derive the formula (8), and use thefast Fourier transform method to convert the convolution op-eration in the matrix space into a point multiplication opera-tion in the frequency domain as:
x ¼ F−1 F kð ÞF yð Þ þ βF uð Þ þ μFG
F kð ÞF kð Þ þ β þ μF ∇ð ÞF ∇ð Þ
!ð9Þ
In Eq. (9), F( ) and F−1( ) respectively represent fast Fourier
transform (FFT) and inverse FFT. Fð Þ is a complex conjugate
operator, andFG ¼ F ∇hð ÞF ∇ghð Þ þF ∇vð ÞF ∇gvð Þ, where ∇h
and ∇v respectively represent horizontal and vertical differen-tial operators. After solving x, we calculate u and g (see (10)and (11)):
u ¼ minu
β x−uj jj j22 þ λσ uj jj j0 ð10Þ
g ¼ ming
μ ∇x−gj jj j22 þ λ gj jj j0 ð11Þ
Eqs. (10) and (11) are pixel-based minimization problems.The solutions of u and g are obtained (see (12) and (13)) basedon Liu [10].
u ¼ x; xj j2≥ λσ
β0; else
8<: ð12Þ
g ¼ ∇x; ∇xj j2≥ λμ
0; else
8<: ð13Þ
4.3 Blurred kernel estimation
For a given image x, this paper refers to Cho [36] using thepredicted gradient idea to further estimate the blurred kernelsby using the minimized energy function, the formula is asfollows (see (14)):
k ¼ mink
∇x⨂k−∇yk k22 þ γ kj jj j22 ð14Þ
Similarly, for better calculations, we derive the formula(14) and use the fast Fourier transform method to transformthe convolution operation in matrix space into a dot productoperation in the frequency domain, we can obtain (see (15)):
∂ f kð Þ∂k
¼ F−1 2F ∇xð ÞF ∇xð ÞF kð Þ−2γF kð Þ−2F ∇xð ÞF ∇yð Þ� �
ð15Þ
In formula (15), the gradient of f(k) should be evaluatedmultiple times during the minimization process. F and F−1
also represent the Fourier transform and its inverse transform,
and Fð Þ is a conjugate fast Fourier transform. F(∇x) andF(∇y) calculations are preprocessed before the conjugate gra-dient starts to reduce the number of FFT calculations in eachiteration.
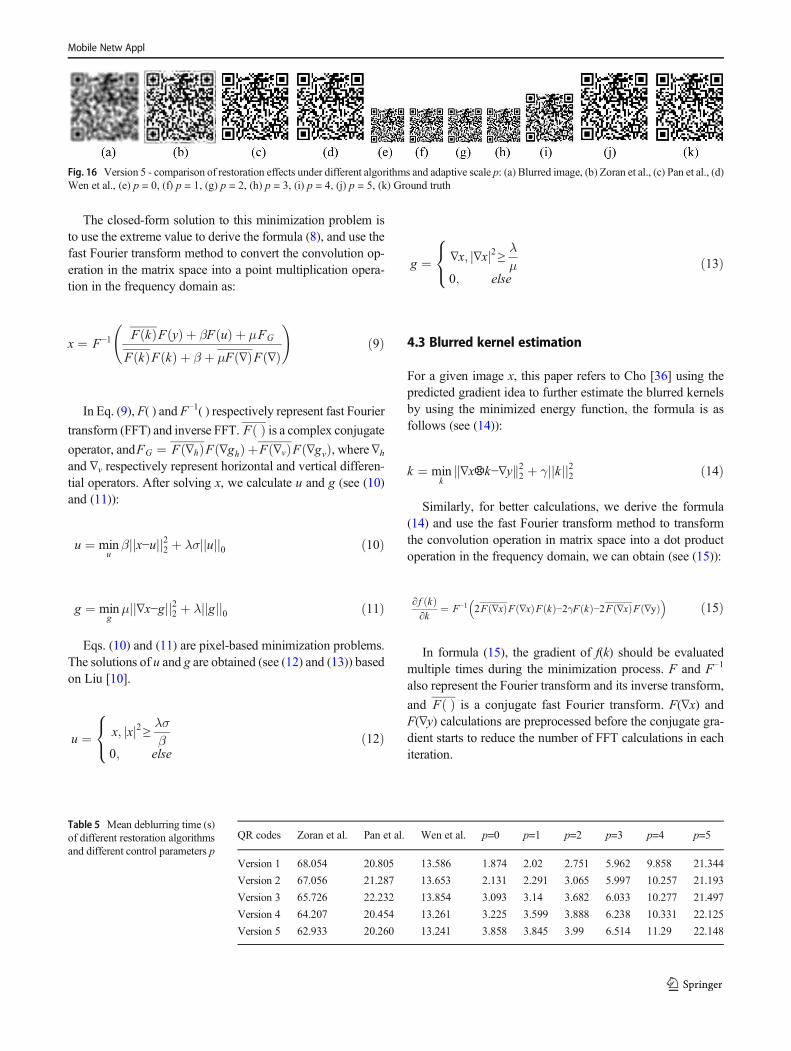
Table 5 Mean deblurring time (s)of different restoration algorithmsand different control parameters p
QR codes Zoran et al. Pan et al. Wen et al. p=0 p=1 p=2 p=3 p=4 p=5
Version 1 68.054 20.805 13.586 1.874 2.02 2.751 5.962 9.858 21.344
Version 2 67.056 21.287 13.653 2.131 2.291 3.065 5.997 10.257 21.193
Version 3 65.726 22.232 13.854 3.093 3.14 3.682 6.033 10.277 21.497
Version 4 64.207 20.454 13.261 3.225 3.599 3.888 6.238 10.331 22.125
Version 5 62.933 20.260 13.241 3.858 3.845 3.99 6.514 11.29 22.148
Fig. 16 Version 5 - comparison of restoration effects under different algorithms and adaptive scale p: (a) Blurred image, (b) Zoran et al., (c) Pan et al., (d)Wen et al., (e) p = 0, (f) p = 1, (g) p = 2, (h) p = 3, (i) p = 4, (j) p = 5, (k) Ground truth
Mobile Netw Appl

5 Experimental results and analysis
The error correction level of the QR code images is H. Basedon a series of experiments, compared to other QR code gen-erators, the Caoliao QR code website has little effect on theTenengrad value of QR codes with different error correctionrates. Therefore, this paper uses the Caoliao website to gener-ate the corresponding version of the QR code and uses theZxing 3.4.0 software package to decode. The input imagesare uniformly initialized to a matrix (300 × 300). The exper-imental environment of this article is the Intel i7 processor,CPU 3.20GHz and Matlab2018a. We will compare thedeblurring effects of different algorithms from simulation
experiments, and analyze the advantages of the algorithmsfrom two dimensions of deblurring time and recognition rateafter deblurring in the second section.
5.1 Simulation experiment
This section carries out simulation experiments, randomlygenerates six clear QR code images for each version, andrandomly generates 20 blurred QR code images as the samplelibraries in the corresponding defocusing intervals I1, I2, I3,I4, and I5. Next, we select a sample and 20 samples for eachversion of the QR codes respectively. The effect comparisonof a single sample is shown in Figs. 12, 13, 14, 15 and 16, and
a b cFig. 18 Recognition rate of 300 randomQR code pictures of the first version in the defocus interval I2 at the adaptive scale (p ∈ [0,2]), (a) p = 0, (b) p = 1,(c) p = 2
a b cFig. 17 Recognition rate of 300 randomQR code pictures of the first version in the defocus interval I1 at the adaptive scale (p ∈ [0,2]), (a) p = 0, (b) p = 1,(c) p = 2
Table 4 Deblurring time (s) un-der of five figures Figures Zoran et al. Pan et al. Wen et al. p=0 p=1 p=2 p=3 p=4 p=5
Fig. 12(a) 69.008 19.495 13.641 1.65 1.688 3.704 5.918 10.32 21.229
Fig. 13(a) 68.090 20.461 13.449 2.805 2.88 3.711 6.102 10.348 21.671
Fig. 14(a) 67.871 20.735 13.561 3.658 3.684 3.715 6.299 10.426 21.945
Fig. 15(a) 65.119 21.335 13.157 3.682 3.775 3.738 6.336 10.513 21.985
Fig. 16(a) 64.369 21.139 13.275 3.704 3.729 3.751 6.795 10.527 22.057
Mobile Netw Appl

the time comparison is shown in Table 4. Table 5 is the meandeblurring time of different algorithms and different controlparameters p under multiple samples. It can be seen that at thesame degree of blur, Pan’s algorithm and Wen’s algorithmhave well deblurring capabilities, but Zoran’s algorithm hasan obvious ringing effect, which affects the recognition
function of QR code images. Starting from the different scalecontrol parameters p, it can be seen that when p is small, theoutput image has the ability to be recognizable. From the timedimension, when the scale control parameter p of our algo-rithm is small, the deblurring speed is improved by about anorder of magnitude compared with other algorithms.
a b cFig. 21 Recognition rate of 300 random QR code pictures of the first version in the defocus interval I5 at the adaptive scale (p ∈ [2, 4]), (a) p = 2, (b) p =3, (c) p = 4
a b cFig. 20 Recognition rate of 300 random QR code pictures of the first version in the defocus interval I4 at the adaptive scale (p ∈ [2, 4]), (a) p = 2, (b) p =3, (c) p = 4
a b cFig. 19 Recognition rate of 300 randomQR code pictures of the first version in the defocus interval I3 at the adaptive scale (p ∈ [0,2]), (a) p = 0, (b) p = 1,(c) p = 2
Mobile Netw Appl
5.2 Deblurring time and recognition rate
After that, combining with Tables 3, 4 and 5 and Figs. 12, 13,14, 15 and 16, for versions 1–3, we can get the most appro-priate value range of p in [0,2]. And for version 4 and version5, the most appropriate value range of p is [2, 4]. The size ofthe QR code output image is determined by the defocus radiusof the input image and the identifiability of the QR code in thecurrent scale, which does not require uniform iteration to thelast scale, thus saving a lot of iteration time. The QR codeidentifiability uses the evaluation mechanism proposed in thispaper, that is, the Tenengrad method, to compare the generat-ed evaluation value. The recognizability of the output imagesare shown in Figs. 17, 18, 19, 20 and 21. Under these fivefigures, each dot represents the corresponding output image ofdifferent fuzzy images. The green one means the image can berecognized, while the red one cannot. We chose the range ofscale control parameters with a large variation of recognitionrate, such as QR code versions 1–3 choose p = [0,2], versions4–5 choose p = [2, 4]. As can be seen from Figs. 17, 18, 19, 20and 21, for version 1 and version 2, when p = 2, they have thehighest recognition rate, reaching 99% and 96.3% respective-ly. For version 3, when p = 0 or p = 1, the recognition rate isthe highest, which can reach 97.67%, while for version 4 andversion 5, when p = 4, they have a well restoration effect, andthe recognition rate can reach 99.67%. From these data, it canbe concluded that our method has a high recognition rate, andthe recognition rate increases with the larger of p under normalcircumstances.
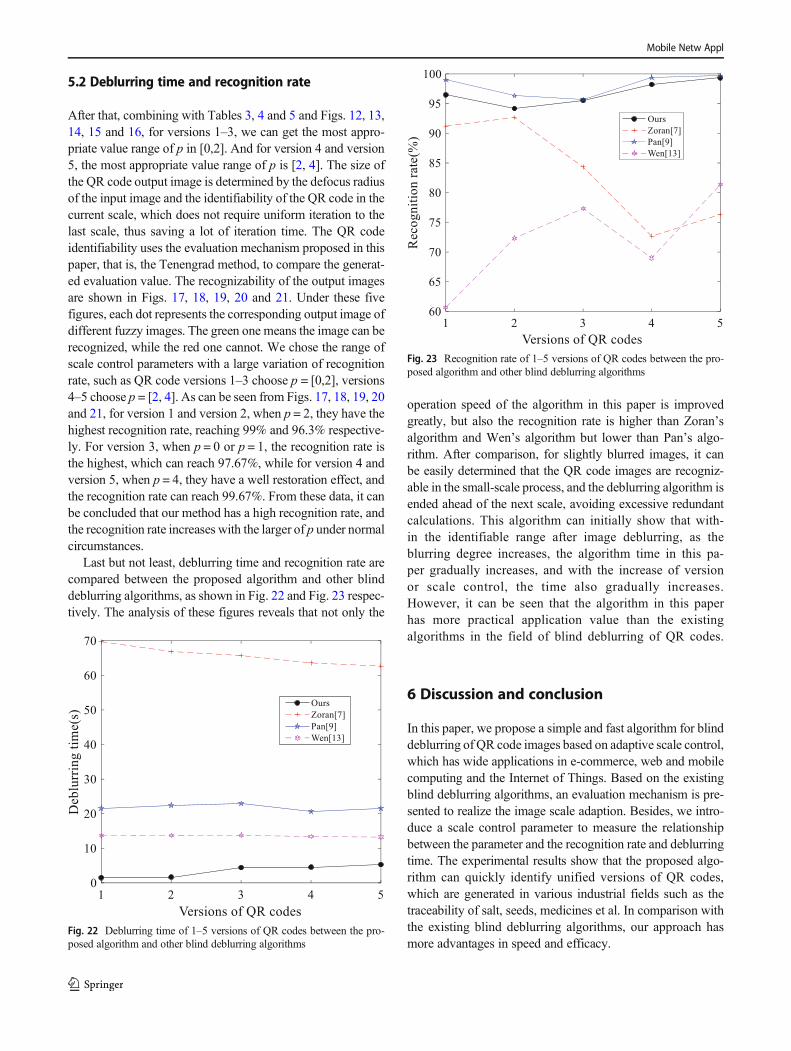
Last but not least, deblurring time and recognition rate arecompared between the proposed algorithm and other blinddeblurring algorithms, as shown in Fig. 22 and Fig. 23 respec-tively. The analysis of these figures reveals that not only the
operation speed of the algorithm in this paper is improvedgreatly, but also the recognition rate is higher than Zoran’salgorithm and Wen’s algorithm but lower than Pan’s algo-rithm. After comparison, for slightly blurred images, it canbe easily determined that the QR code images are recogniz-able in the small-scale process, and the deblurring algorithm isended ahead of the next scale, avoiding excessive redundantcalculations. This algorithm can initially show that with-in the identifiable range after image deblurring, as theblurring degree increases, the algorithm time in this pa-per gradually increases, and with the increase of versionor scale control, the time also gradually increases.However, it can be seen that the algorithm in this paperhas more practical application value than the existingalgorithms in the field of blind deblurring of QR codes.
6 Discussion and conclusion
In this paper, we propose a simple and fast algorithm for blinddeblurring of QR code images based on adaptive scale control,which has wide applications in e-commerce, web and mobilecomputing and the Internet of Things. Based on the existingblind deblurring algorithms, an evaluation mechanism is pre-sented to realize the image scale adaption. Besides, we intro-duce a scale control parameter to measure the relationshipbetween the parameter and the recognition rate and deblurringtime. The experimental results show that the proposed algo-rithm can quickly identify unified versions of QR codes,which are generated in various industrial fields such as thetraceability of salt, seeds, medicines et al. In comparison withthe existing blind deblurring algorithms, our approach hasmore advantages in speed and efficacy.
Fig. 22 Deblurring time of 1–5 versions of QR codes between the pro-posed algorithm and other blind deblurring algorithms
Fig. 23 Recognition rate of 1–5 versions of QR codes between the pro-posed algorithm and other blind deblurring algorithms
Mobile Netw Appl
There are still some limitations in the proposed algorithm.The first limitation is that the proposed algorithm is temporar-ily applied to the averagely blurred QR code images.However, for the uneven blurred QR code images, its recov-ery effect is not so satisfactory. The second limitation is thatthe QR images may be easily corrupted or attacked by so-called adversarial perturbations. For future work, we will con-tinue to solve the limitations of the proposed algorithm andstudy a more universal deblurring method. Besides, we willfocus on exploring the combination of most state-of-art tech-niques to further improve the performance. In real life, a cus-tomized two-dimensional barcode [5] can effectively preventthe forgery of imitation physical labels and maintain goodanti-counterfeiting aesthetics, a unified gradient regularizationfamily [39] can effectively solve the so-called confrontationthat QR images may suffer disturbance destruction or attack,spectral-domain feature segmentation [40] can extract the QRcode images in a complex environment.
Acknowledgements This work was supported by the Project forDistinctive Innovation of General Universities of Guangdong Province(NO.2018KTSCX120), the National Natural Science Foundation ofChina (NO.62072122), the Innovation Team Project of the EducationDepartment of Guangdong Province (NO.2017KCXTD021), the Ph.D.Start-up Fund of Natural Science Foundation of Guangdong Province(NO.2016A030310335), the Education Department of GuangdongProvince (NO.2019KSYS009), the Scientific and TechnologicalP l a n n i n g P r o j e c t s o f G u a n g d o n g P r o v i n c e(NO.2021A0505030074), and the Guangdong Colleges andUniversities Young Innovative Talents Projects (NO.2018KQNCX138).
Open Access This article is licensed under a Creative CommonsAttribution 4.0 International License, which permits use, sharing, adap-tation, distribution and reproduction in any medium or format, as long asyou give appropriate credit to the original author(s) and the source, pro-vide a link to the Creative Commons licence, and indicate if changes weremade. The images or other third party material in this article are includedin the article's Creative Commons licence, unless indicated otherwise in acredit line to the material. If material is not included in the article'sCreative Commons licence and your intended use is not permitted bystatutory regulation or exceeds the permitted use, you will need to obtainpermission directly from the copyright holder. To view a copy of thislicence, visit http://creativecommons.org/licenses/by/4.0/.
References
1. Ai Y, Wang L, Han Z, Zhang P, Hanzo L (2018) Social networkingand caching aided collaborative computing for the internet ofthings. IEEE Commun Mag 56(12):149–155. https://doi.org/10.1109/MCOM.2018.1701089
2. Kieseberg P, LeithnerM,MulazzaniM,Munroe L, Schrittwieser S,Sinha M, Weippl E (2010) QR code security. In Proceedings of the8th International Conference on Advances in Mobile Computingand Multimedia (ACM) (pp. 430-435). https://doi.org/10.1145/1971519.1971593
3. Focardi R, Luccio FL, Wahsheh HA (2019) Usable security for QRcode. J Inf Secur Appl 48:102369. https://doi.org/10.1016/j.jisa.2019.102369
4. Chen C (2017) QR code authentication with embedded messageauthentication code. Mobile Netw Appl 22(3):383–394. https://doi.org/10.1007/s11036-016-0772-y
5. Chen R, Yu Y, Chen J, Zhong Y, Zhao H, Tan HZ (2020)Customized 2D barcode sensing for anti-counterfeiting applicationin smart IoT with fast encoding and information hiding. Sensors20(17):4926. https://doi.org/10.3390/s20174926
6. Jiang B, Ji Y, Tian X, Wang X (2019) Batch Reading denselyarranged QR codes. In IEEE INFOCOM 2019-IEEE Conferenceon Computer Communications (pp. 1216-1224). IEEE. https://doi.org/10.1109/INFOCOM.2019.8737440
7. Zoran D, Weiss Y (2011) From learning models of natural imagepatches to whole image restoration. In 2011 InternationalConference on Computer Vision (pp. 479-486). IEEE. https://doi.org/10.1109/ICCV.2011.6126278
8. Pan J, Hu Z, Su Z, YangMH (2014) Deblurring text images via L0-regularized intensity and gradient prior. In Proceedings of the IEEEConference on Computer Vision and Pattern Recognition (CVPR)(pp.2901-2908). IEEE. https://doi.org/10.1109/CVPR.2014.371
9. Pan J, Hu Z, Su Z, Yang MH (2016) L0-regularized intensity andgradient prior for deblurring text images and beyond. IEEE TransPattern Anal Mach Intell 39(2):342–355. https://doi.org/10.1109/TPAMI.2016.2551244
10. Liu N, DuY, XuY (2018) QR codes blind deconvolution algorithmbased on binary characteristic and L0 norm minimization. PatternRecogn Lett 111:117–123. https://doi.org/10.1016/j.patrec.2018.04.036
11. Nah S, Hyun Kim T, Mu Lee K (2017) Deep multi-scaleconvolutional neural network for dynamic scene deblurring. InProceedings of the IEEE Conference on Computer Vision andPattern Recognition (CVPR) (pp. 3883-3891). IEEE. https://doi.org/10.1109/CVPR.2017.35
12. Bai Y, Cheung G, Liu X, Gao W (2018) Graph-based blind imagedeblurring from a single photograph. IEEE Trans Image Process28(3):1404–1418. https://doi.org/10.1109/TIP.2018.2874290
13. Wen F, Ying R, Liu Y, Liu P, Truong TK (2020) A simple localminimal intensity prior and an improved algorithm for blind imageDeblurring. IEEE Trans Circuits Syst Video Technol:1. https://doi.org/10.1109/TCSVT.2020.3034137
14. Pan J, Sun D, Pfister H, Yang MH (2016) Blind image deblurringusing dark channel prior. in Proceedings of IEEE Conference onComputer Vision and Pattern Recognition (CVPR) (pp. 1628-1636). IEEE. https://doi.org/10.1109/CVPR.2016.180
15. Ren W, Cao X, Pan J, Guo X, Zuo W, Yang MH (2016) Imagedeblurring via enhanced low-rank prior. IEEE Trans Image Process25(7):3426–3437. https://doi.org/10.1109/TIP.2016.2571062
16. Bai Y, Jia H, Jiang M, Liu X, Xie X, Gao W (2020) Single imageblind deblurring using multi-scale latent structure prior. IEEE TransCircuits Syst Video Technol 30(7):2033–2045. https://doi.org/10.1109/TCSVT.2019.2919159
17. Chen L, Fang F, Wang T, Zhang G (2019) Blind image deblurringwith local maximum gradient prior. in Proceedings of IEEEConference on Computer Vision and Pattern Recognition (CVPR)(pp. 1742–1750). IEEE. https://doi.org/10.1109/CVPR.2019.00184
18. Ren D, Zhang K, Wang Q, Hu Q, Zuo W (2020) Neural blinddeconvolution using deep priors. In Proceedings of the IEEE/CVFConference on Computer Vision and Pattern Recognition (CVPR)(pp. 3341-3350). IEEE. https://doi.org/10.1109/CVPR42600.2020.00340
19. Liu YQ, Du X, Shen HL, Chen SJ (2021) Estimating generalizedGaussian blur kernels for out-of-focus image Deblurring. IEEE
Mobile Netw Appl
Trans Circuits Syst Video Technol 31(3):829–843. https://doi.org/10.1109/TCSVT.2020.2990623
20. Nan Y, Ji H (2020) Deep learning for handling kernel/model un-certainty in image deconvolution. In Proceedings of the IEEE/CVFConference on Computer Vision and Pattern Recognition (CVPR)(pp. 2388-2397). IEEE. https://doi.org/10.1109/CVPR42600.2020.00246
21. Ren D, ZuoW, Zhang D, Zhang L, YangMH (2019) Simultaneousfidelity and regularization learning for image restoration. IEEETrans Pattern Anal Mach Intell 43:284–299. https://doi.org/10.1109/TPAMI.2019.2926357
22. Zhang J, Ghanem B (2018) ISTA-net: interpretable optimization-inspired deep network for image compressive sensing. InProceedings of the IEEE conference on computer vision and pat-tern recognition (CVPR) (pp. 1828-1837). IEEE. https://doi.org/10.1109/CVPR.2018.00196
23. ShiW, Jiang F, Liu S, Zhao D (2019) Scalable convolutional neuralnetwork for image compressed sensing. In Proceedings of the IEEEConference on Computer Vision and Pattern Recognition (CVPR)(pp. 12290-12299). IEEE. https://doi.org/10.1109/CVPR.2019.01257
24. Nan Y, Quan Y, Ji H (2020) Variational-EM-based deep learningfor noise-blind image Deblurring. In Proceedings of the IEEE/CVFConference on Computer Vision and Pattern Recognition (CVPR)(pp. 3626-3635). IEEE. https://doi.org/10.1109/CVPR42600.2020.00368
25. Quan Y, Chen M, Pang T, Ji H (2020) Self2Self with dropout:learning self-supervised Denoising from single image. InProceedings of the IEEE/CVF Conference on Computer Visionand Pattern Recognition (CVPR) (pp. 1890-1898). IEEE. https://doi.org/10.1109/CVPR42600.2020.00196
26. Ding Q, Chen G, ZhangX, Huang Q, Ji H, Gao H (2020) Low-doseCT with deep learning regularization via proximal forward back-ward splitting. Phys Med Biol 65(12):125009. https://doi.org/10.1088/1361-6560/ab831a
27. Chern NNK, Neow PA, Ang MH (2001) Practical issues in pixel-based autofocusing for machine vision. In Proceedings 2001 ICRA.IEEE International Conference on Robotics and Automation (Cat.No. 01CH37164) (pp. 2791-2796). IEEE. https://doi.org/10.1109/ROBOT.2001.933045
28. Llano EG, Vázquez MSG, Vargas JMC, Fuentes LMZ, AcostaAAR (2018) Optimized robust multi-sensor scheme for simulta-neous video and image iris recognition. Pattern Recogn Lett 101:44–51. https://doi.org/10.1016/j.patrec.2017.11.012
29. du Plessis A, Tshibalanganda M, le Roux SG (2020) Not all scansare equal: X-ray tomography image quality evaluation. MaterToday Commun 22:100792. https://doi.org/10.1016/j.mtcomm.2019.100792
30. Karras T, Laine S, Aittala M, Hellsten J, Lehtinen J, Aila T (2020)Analyzing and improving the image quality of stylegan. InProceedings of the IEEE/CVF Conference on Computer Visionand Pattern Recognition (CVPR) (pp. 8110-8119). IEEE. https://doi.org/10.1109/CVPR42600.2020.00813
31. Her L, Yang X (2019) Research of image sharpness assessmentalgorithm for autofocus. In 2019 IEEE 4th InternationalConference on Image, Vision and Computing (ICIVC) (pp. 93-98). IEEE. https://doi.org/10.1109/ICIVC47709.2019.8980980
32. Yang C, Chen M, Zhou F, LiW, Peng Z (2020) Accurate and rapidauto-focus methods based on image quality assessment for tele-scope observation. Appl Sci 10(2):658. https://doi.org/10.3390/app10020658
33. Hu S, Li Z, Wang S, Ai M, Hu Q (2020) A texture selection ap-proach for cultural artifact 3D reconstruction considering both ge-ometry and radiation quality. Remote Sens 12(16):2521. https://doi.org/10.3390/rs12162521
34. Pan J, Dong J, Tai YW, Su Z, Yang MH (2017) Learning discrim-inative data fitting functions for blind image deblurring. InProceedings of the IEEE International Conference on ComputerVision (ICCV) (pp. 1068-1076). IEEE. https://doi.org/10.1109/ICCV.2017.122
35. Pan J, Ren W, Hu Z, Yang MH (2018) Learning to deblur imageswith exemplars. IEEE Trans Pattern Anal Mach Intell 41(6):1412–1425. https://doi.org/10.1109/TPAMI.2018.2832125
36. Cho S, Lee S (2009) Fast motion deblurring. ACM Trans Graph28(5):1–8. https://doi.org/10.1145/1661412.1618491
37. Whyte O, Sivic J, Zisserman A (2014) Deblurring shaken and par-tially saturated images. Int J Comput Vis 110(2):185-201. https://doi.org/10.1007/s11263-014-07 27-3
38. Qu Z, Huang X, Chen K, Liu L (2019) Algorithm of multiexposureimage fusion with detail enhancement and ghosting removal. JElectron Imaging 28(1):13–22. https://doi.org/10.1117/1.JEI.28.1.013022
39. Lyu C, Huang K, Liang HN (2015) A unified gradient regulariza-tion family for adversarial examples. In 2015 IEEE InternationalConference on Data Mining (ICDM) (pp. 301-309). IEEE. https://doi.org/10.1109/ICDM.2015.84
40. Zabalza J, Ren J, Zheng J, Han J, Zhao H, Li S, Marshall S (2015)Novel two-dimensional singular spectrum analysis for effective fea-ture extraction and data classification in hyperspectral imaging.IEEE Trans Geosci Remote Sensing 53(8):4418–4433. https://doi.org/10.1109/TGRS.2015.2398468
Publisher’s note Springer Nature remains neutral with regard to jurisdic-tional claims in published maps and institutional affiliations.
Mobile Netw Appl