fast charging and the energy transition go ... - ieei.rtu.lv
TRANSCRIPT

1
Fast Charging and the Energy Transition go hand in hand when using DC Distribution Grids
Power Electronic Solutions to integrate Renewables and eMobility in Distribution Grid
10th International Doctoral School of Electrical Energy Conversion and Saving TechnologiesTU Riga, 28.05.2021
Prof. Dr. ir. Dr. h. c. Rik W. De Doncker, RWTH Aachen University, Germany
Outline
■ Introduction – RWTH Aachen University □ Campus Sustainable Energy, eLAB, CWD, E.ON ERC□ ISEA and PGS□ BMBF Research CAMPUS Flexible Electrical Networks
■ Background – Energy Transition and Flexible Grids□ Renewables and decentralized power generation impact grid structures□ Flexible DC Distribution grids and sector coupling□ eMobility impact on distribution grids
■ Conclusions □ Use cases where DC technology makes a lot of sense□ DC technology never went away□ Standardization activities□ Urgency to drive the DC (r)evolution
2

RWTH Aachen University
¡ Founded in 1870; one of the largest technical universities in Europe
¡ 157 degree courses
– 45,377 students (57% Engineering)
– 7,165 graduates, 9,651 international students
¡ 9,264 employees
– 547 professors (89 Junior Prof.)
– 5,564 research associates
– 2,786 non-scientific staff
– 599 apprentices and interns
¡ 1.0 B€ Budget 2019
– 500 M€ external project funds for R&D
¡ 4,833 Scientific Publications
¡ 25% of all Dr.-Ing. in Germany are from RWTH

E.ON ERC leads the RWTH CAMPUS Cluster Sustainable Energyto accelerate innovation with industry partners
4

Production ofPrototype EVs
Research andDevelopment Training
Project space for SMEs

4 MW test bench for mechanical and electrical research andcharacterization of wind turbines
CWD – Center for Wind Power Drives
I3 Research Center for Wind Power Drives
Prof. Hameyer
Prof. Schröder
Prof. Monti
Prof. De Doncker
Prof. Brecher
Prof. Jacobs
Prof. Abel
7
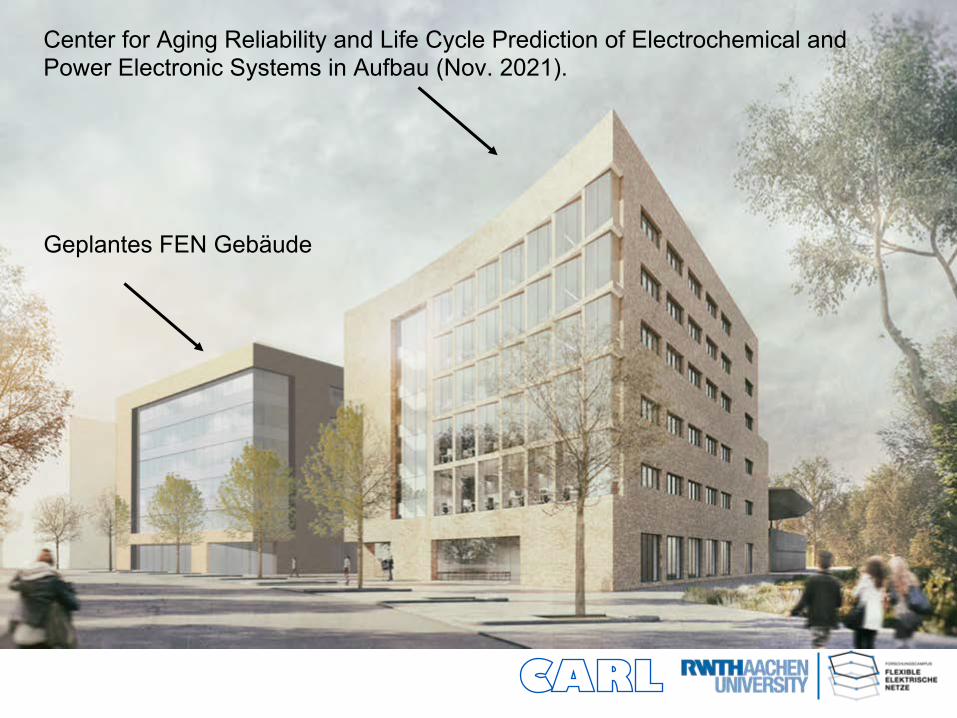
CARL – Center for Aging, Reliability and Life Cycle Prediction of Electrochemical and Power Electronic Systems
Center for Aging Reliability and Life Cycle Prediction of Electrochemical and Power Electronic Systems in Aufbau (Nov. 2021).
Geplantes FEN Gebäude

E.ON ERC at RWTH Aachen UniversityEnergy savings, energy efficiency and sustainable energy supply in theurban environment
9
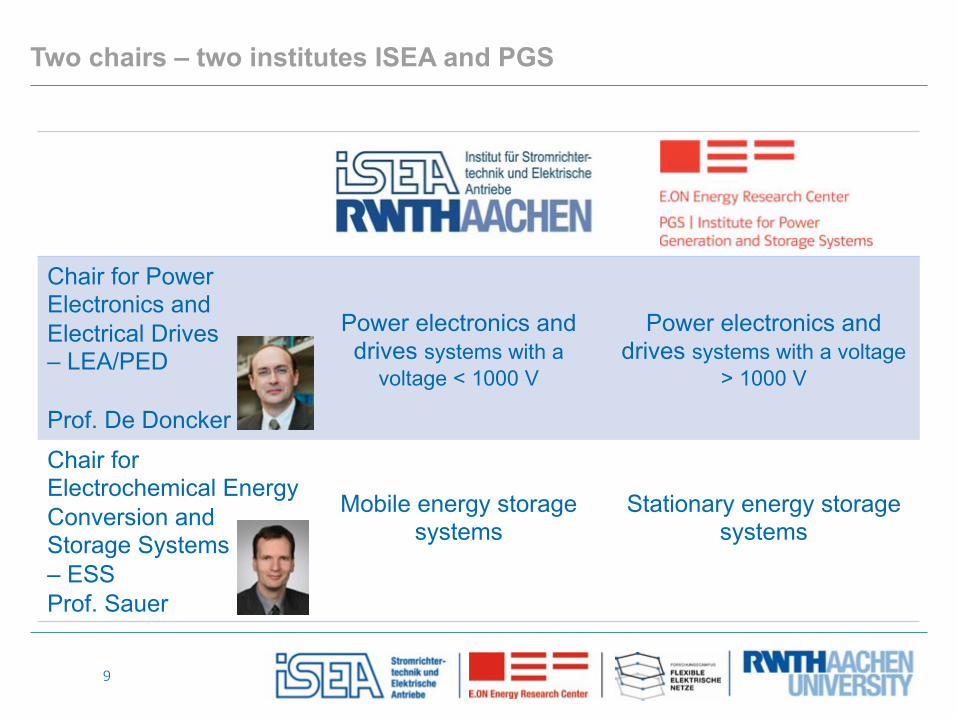
Two chairs – two institutes ISEA and PGS
Chair for Power Electronics and Electrical Drives – LEA/PED
Prof. De Doncker
Power electronics and drives systems with a
voltage < 1000 V
Power electronics and drives systems with a voltage
> 1000 V
Chair for Electrochemical Energy Conversion and Storage Systems – ESS Prof. Sauer
Mobile energy storage systems
Stationary energy storage systems

10
Research areas and staff at ISEA and PGS
Scientific staff
Student projectsStudent projects
Univ.-Prof. Dr. ir. Dr. h. c. Rik De DonckerPower ElectronicsElectrical DrivesElectronic Devices, Switched Mode Power Supplies
Univ.-Prof. Dr. rer. nat. Dirk Uwe SauerElectrochemical Energy Conversion and Storage Systems
1 Adjunct Professor, 2 Lecturers
102 Research Associates
ca. 90 Student Co-Workers
ca. 150 Graduate Students per Year
30 Permanent Staff
9 Apprentices
14 Chief Engineers
Univ.-Prof. Dr. rer. nat. Egbert FiggemeierAgeing Processes and Lifetime Prediction of Batteries (Helmholtz - FZJ)

Power Electronics and Drives Division
11
Device & Component
Analysis
Component& Converter
Design
Modeling & Control
SystemIntegration
Demonstrator Development
10 20 30 40 50 60 70 80 900
0.5
1
1.5
2
2.5
3
3.5
Output Power / kW
Dis
sipa
ted
Pow
er /
kW
Output capacitorsInput capacitorsIGBTs (switching losses)IGBTs (conduction losses)Diodes (reverse recovery)Diodes (conduction losses)Winding inductorCore inductorCore TransformerWinding Transformer

12
PGS|E.ONERC - Electrochemical Storage Systems Division
-2.0
-1.5
-1.0
-0.5
0.0
0.50.5 1.0 1.5 2.0 2.5 3.0 3.5
Im(Z
) / mW
Re(Z) / mW
1 kHz100 Hz
10 Hz1 Hz
0.1 Hz 0.01 Hz
L Rser
CSEI
RSEI RctZW
Cdl
ZARC 1 ZARC 2
Laboratory Analysis
SystemIntegration
Modeling & Lifetime
Prediction
Monitoring & Management
BatteryTesting
13
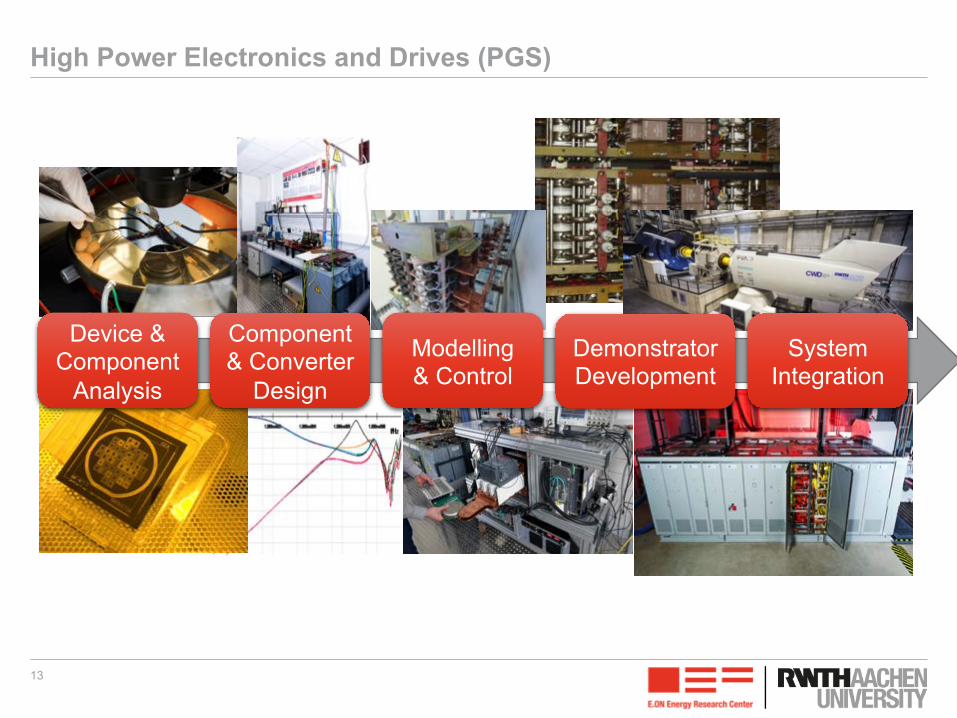
High Power Electronics and Drives (PGS)
Device & Component
Analysis
Component& Converter
Design
Modelling& Control
SystemIntegration
Demonstrator Development
Center für Flexible Elektrische Netze FENForschungscampusFlexible Elektrische Netze FEN

15
Partners of FEN Research Campus accelerate Innovation
Status: Oktober 2020
FCNEBCGGE
ACSPGS
Flexible Electrical Networks(FEN) Research Campus
Scientific Partners
Industry Partners
Under Negotiation
16
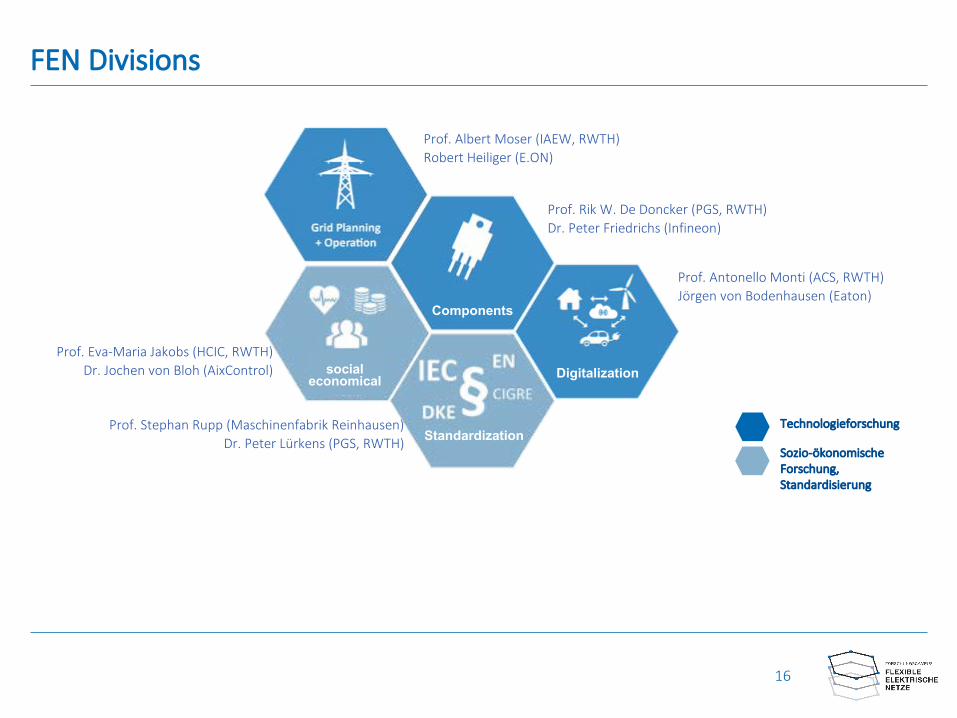
FEN Divisions
Technologieforschung
Sozio-ökonomische Forschung, Standardisierung
Prof. Albert Moser (IAEW, RWTH) Robert Heiliger (E.ON)
Components
socialeconomical
Standardization
Prof. Rik W. De Doncker (PGS, RWTH)Dr. Peter Friedrichs (Infineon)
Prof. Antonello Monti (ACS, RWTH)Jörgen von Bodenhausen (Eaton)
Prof. Eva-Maria Jakobs (HCIC, RWTH)Dr. Jochen von Bloh (AixControl)
Prof. Stephan Rupp (Maschinenfabrik Reinhausen)Dr. Peter Lürkens (PGS, RWTH)
Digitalization

17
FEN Medium-voltage (5 kV) DC CAMPUS grid
5 kV5 kV
1.07 kV
ca. 2.5 MVAca. 3.5 MVA
ca. 1.6 MVA
+2.5 kV
-2.5 kV
≈ 300 m
≈1.3 km
Icabel
Icabel
IN
Rated current of power cables Icabel 680 A
IcabelIcabel
≈ 900 m
M. Stieneker, J. Butz, S. Rabiee, H. Stagge and R. W. D. Doncker, "Medium-Voltage DC Research Grid Aachen," International ETG Congress 2015; Die Energiewende - Blueprints for the new energy age; Proceedings of, Bonn, Germany, 2015, pp. 1-7.

18
FEN-MVDC- Grid at RWTH Campus MelatenOfficial start operation 5 kV MVDC-Grid 19.11.2019

Outline
■ Introduction – RWTH Aachen University□ E.ON ERC□ ISEA and PGS□ Research CAMPUS Flexible Electrical Networks
■ Background – Energy Transition and Flexible Grids□ Renewables and decentralized power generation impact grid structures□ Flexible DC Distribution grids and sector coupling□ eMobility impact on distribution grids
■ Conclusions □ Use cases where DC technology makes a lot of sense□ DC technology never went away□ Standardization□ Urgency to drive the DC (r)evolution
19

20
BackgroundEnergy market mechanisms that enabled more decentralized power production
Market changes that were introduced stepwise (EU):
1. Market liberalization allowed decentralized power generation, creating prosumers, typically small scale power generation (CHP) and REN sources (mostly volatile sources, such as PV and wind)
2. CO2 certificates, Emission Regulations
3. Unbundling of power generation and grid operation
4. Unbundling of TSO and DSO
Engineering challenges:
Need to find technical solutions that are socially and economically viable within these new markets and regulations

21
Global installed capacity of wind
720 GWpeak installed capacity by the end of 2020 – assuming 50% DFG, this translates in approximately 1,080 GVA of power electronic converters
Multi-megawatt power electronic converters are becoming a mass product. During the past 25 years a major cost reduction of voltage source inverters took place; from 500 €/kVA down to 20 €/kVA
Source: PowerWeb
22
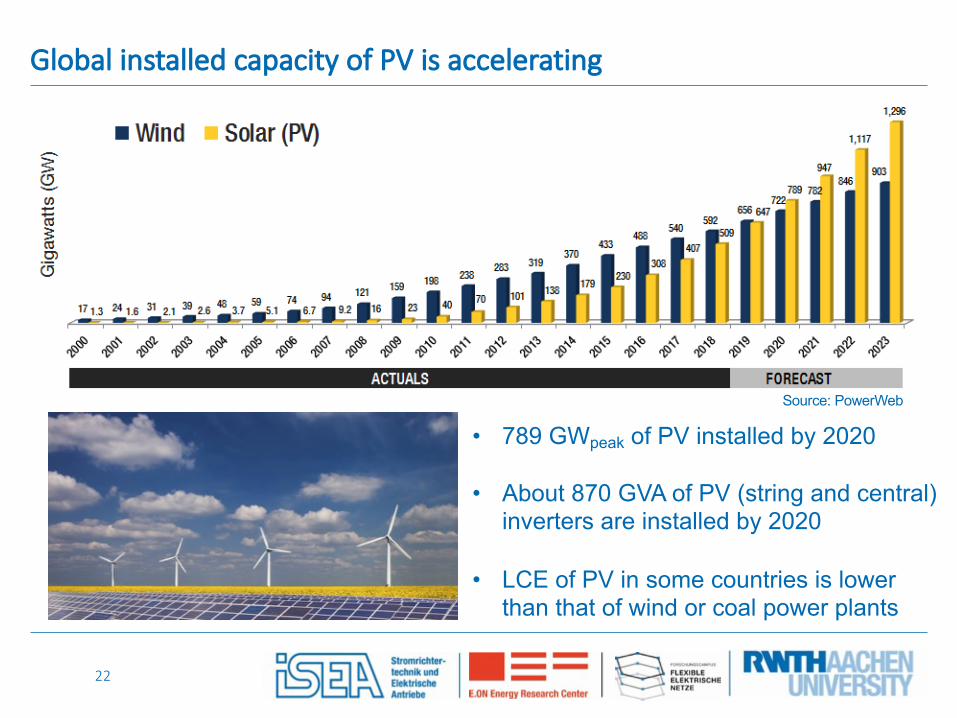
Global installed capacity of PV is accelerating
• 789 GWpeak of PV installed by 2020
• About 870 GVA of PV (string and central) inverters are installed by 2020
• LCE of PV in some countries is lower than that of wind or coal power plants
Source: PowerWeb

23
Price of silicon cells and power electronics inter-twined?
Silicon is made of SiO2 (i.e. sand, an abundant material) and energyEnergy is produced by PVPV energy is controlled and converted by power electronics made of silicon
In 2018$ 0.113 0,0
20,0
40,0
60,0
80,0
100,0
Jan. 04 Mär. 06 Jun. 08 Aug. 10 Okt. 12 Dez. 14Mär. 17 Mai. 19
€/kV
A
Netztransformator Wechselrichter50 Hz Transformer 3-phase Inverter

24
Price is main driving factorPower electronic inverters are progressively having lower costs than 50 Hz transformers
24 Automotive inverter 3 €/kVA DC Solid-State Transformer 9 €/kW
Estimated cost for 2020
0,0
20,0
40,0
60,0
80,0
100,0
Jan. 04 Mär. 06 Jun. 08 Aug. 10 Okt. 12 Dez. 14Mär. 17 Mai. 19
€/kV
A
Netztransformator Wechselrichter50 Hz Transformer 3-phase Inverter

25
Storage Requirements in pan-European REN Electricity System(C. Hoffmann, IRES 2008)
8 %4 %
2 %PV sh
are
[%]
Rel. Coverage RES [%]
Relative Coverage (RES = Wind+PV):
Installed av. annual production RESAverage annual consumption
PV share:
Installed av. annual production PV Average annual production RES
Relative storage demand:
Required storage Average annual consumption
100
80
60
40
20
0100 120 140 160 180
Germany:2% of 627 TWh Û 12.57 TWh
1257 Mrd. € at 100€/kWh, or0,10 €/kWh of total energy and 20 years service time (C.f.: 2% Û Storage horizon : 1 week full load)

26
Renewable Energy Supplies can Cover all Electricity Needs(example Germany)
Köln
München
Berlin
Hamburg
Bremen
K
Area for100% Wind
Area for100% PV
Landfläche BRD: 357.186 km2
QuelleDWD: 1050 kWh/m2.a à 15% Wirkungsgrad à157 GWh/km2.aQuelle BMWi: Bruttostromerzeugung 2015: 627,8 TWh,eq. PV-Fläche 3993 km2 (1,1%, ca, 63 km x 63 km)
Quelle: BWE Studie Potenzial Windenergienutzung an Land (Kurzfassung)(2% f. 390 TWh)

27
Köln
München
Berlin
Hamburg
Bremen
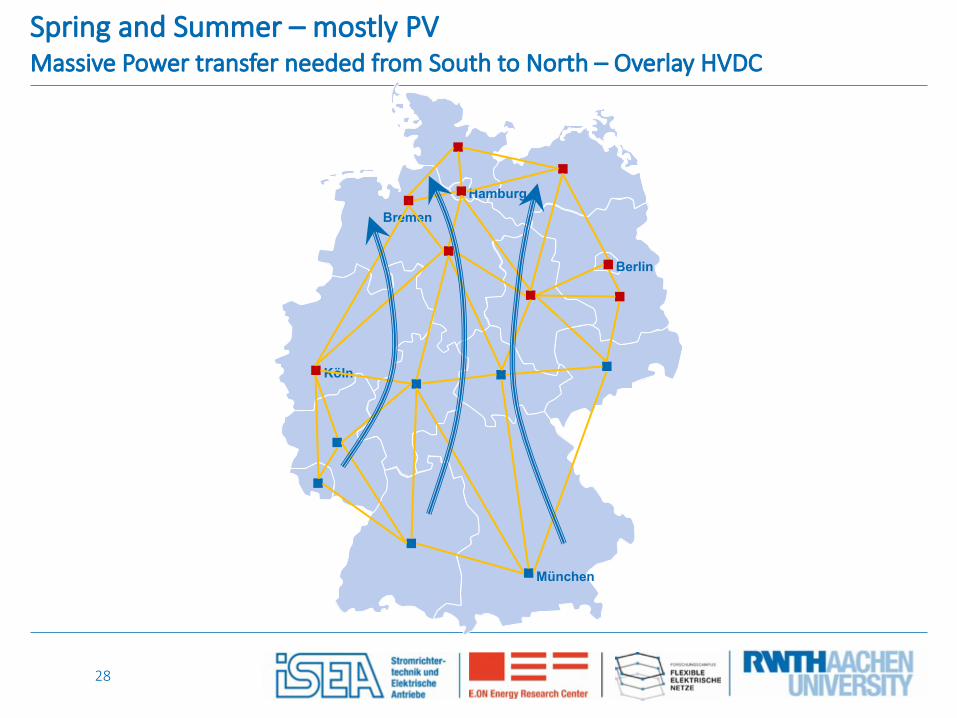
Fall and Winter – mostly Wind EnergyMassive Power transfer needed from South to North – Overlay HVDC
28
Spring and Summer – mostly PVMassive Power transfer needed from South to North – Overlay HVDC
Köln
München
Berlin
Hamburg
Bremen

29
Distributed Installation of REN - Underlay GridExchange of energy via cellular, interconnected medium-voltage distribution grid
Köln
München
Berlin
Hamburg
Bremen
Underlay distribution gridis an interesting business proposition from DSO perspective

30
Urban Regional, Flexible, Multi-terminal MVDC Distribution Grid
© R.W. De Doncker, J. von Bloh

31
Concepts for a CO2-neutral Energy Supply SystemDigitalization and Electrification linking Sectors to make the transition economically viable
Large scale use of renewables, i.e. hydro, wind and PV as primary energy sources. Sources are far distance and local in buildings, city quarters.
HVDC transmission
MVDC distribution
LVDC distribution

32
Concepts for a CO2-neutral Energy Supply SystemDigitalization and Electrification linking Sectors to make the transition economically viable
Linking e-grid to heat sector for short term and seasonal energy storage.
Small scale CHP power back-up sources.
Heat pumps for full electrification of HVAC of buildings.

33
Concepts for a CO2-neutral Energy Supply SystemDigitalization and Electrification linking Sectors to make the transition economically viable
Linking e-grid to e-Mobility sector.
Providing DMS and short term grid stability.
Full electrification of mobility in the urban environment

34
Concepts for a CO2-neutral Energy Supply SystemDigitalization and Electrification linking Sectors to make the transition economically viable
Linking e-grid and heat grid with electrolysersto gas and synthetic fuels sector for long term strategic energy storage.
Reuse of existing infrastructure

35
Concepts for a CO2-neutral Energy Supply SystemDigitalization and Electrification linking Sectors to make the transition economically viable
Digital
Virtual powerplant
Home appliances gateway
E-mobility gateway
Virtual Storage Systems

36
Concepts for a CO2-neutral Energy Supply SystemDigitalization and Electrification linking Sectors to make the transition economically viable
Digital
Virtual powerplant
Home appliances gateway
E-mobility gateway
Virtual Storage Systems
PEBB
PEBB
PEBB
PEBB
PEBB
PEBB
PEBB
PEBB
PEBB
PEBBPEBB
37
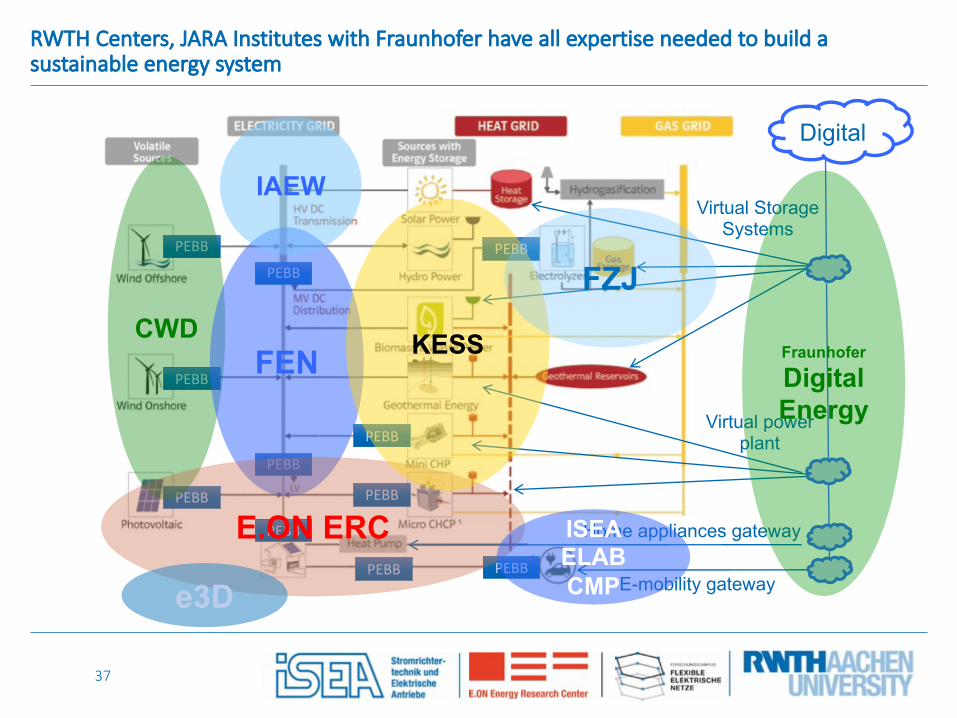
RWTH Centers, JARA Institutes with Fraunhofer have all expertise needed to build a sustainable energy system
Digital
Virtual powerplant
Home appliances gateway
E-mobility gateway
Virtual Storage Systems
PEBB
PEBB
PEBB
PEBB
PEBB
PEBB
PEBB
PEBB
PEBB
PEBBPEBB
CWDFEN
E.ON ERC
e3D
ISEA ELAB CMP
KESS Fraunhofer
Digital Energy
IAEW
FZJ

38
Electrical Grids for a CO2 Neutral Electrical Energy Supply System About 1/3 in HV, 1/3 in MV, 1/3 in Low-Voltage Distribution Grid
Interesting observation:The transmission grid requires just minimal extension with HVDC. ETG Task Force expects less cost for DC integration in infrastructure.
Interesting observation:The transmission grid requires just minimal extension with HVDC. ETG Task Force expects less cost for DC integration in infrastructure.
Interesting observation:The transmission grid requires just minimal extension with HVDC. ETG Task Force expects less cost for DC integration in infrastructure.The MV distribution grid will become bottleneck.

39
The “1/3 rule” already applies to the German installed capacitiesWhat are requirements for massive charging and fast charging EVs?
Future grids cannot ignore the energy feed-in in medium- and low-voltage distribution grids and e-Mobility and must become interconnected
25,6 GW
3,4 GW Offshore-wind parks
Large solar andwind parks
Industrial powerplants
Central power stations
54,2 GW
22,2 GW
40,7 GW Solar andwind parks
Municipal powerplants
23,2 GW PV-systems in localDistribution gridsLocal distribution
grids
-
Bi-directional, interconnected grid structure
High voltagefrom 100 kV
Medium voltage
Low voltage
Conventional power sources Renewable power sources
Daten: Bundesnetzagentur - Daten und Informationen zum EEG (31.12.2015) , Kraftwerksliste und Zahlen (10.06.2016, Status 2015)(5 GW not associated)
… ? GW
4,5 GW

40
Additional installed capacity of 100% e-Mobility is huge
Future grids cannot ignore the energy feed-in in medium- and low-voltage distribution grids and e-Mobility and must become interconnected
25,6 GW
3,4 GW Offshore-wind parks
Large solar andwind parks
Industrial powerplants
Central power stations
54,2 GW
22,2 GW
40,7 GW Solar andwind parks
Municipal powerplants
23,2 GW PV-systems in localDistribution gridsLocal distribution
grids
-
Bi-directional, interconnected grid structure
High voltagefrom 100 kV
Medium voltage
Low voltage
Conventional power sources Renewable power sources
Daten: Bundesnetzagentur - Daten und Informationen zum EEG (31.12.2015) , Kraftwerksliste und Zahlen (10.06.2016, Status 2015)(5 GW not associated)
2.4/1800 GW
4,5 GW
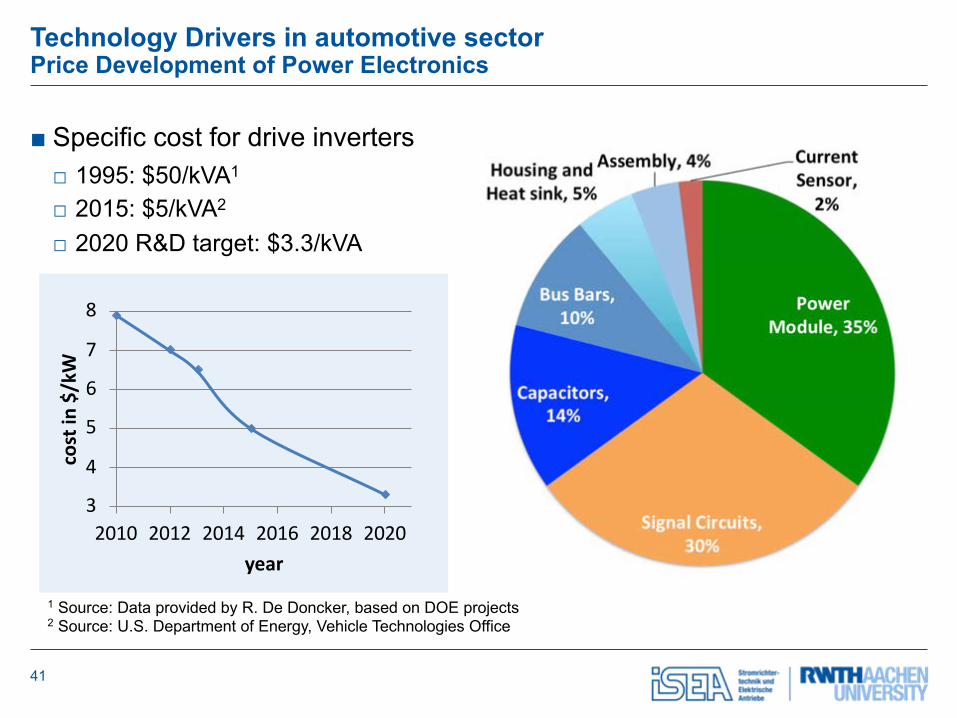
■ Specific cost for drive inverters□ 1995: $50/kVA1
□ 2015: $5/kVA2
□ 2020 R&D target: $3.3/kVA
Technology Drivers in automotive sectorPrice Development of Power Electronics
1 Source: Data provided by R. De Doncker, based on DOE projects2 Source: U.S. Department of Energy, Vehicle Technologies Office
3
4
5
6
7
8
2010 2012 2014 2016 2018 2020
cost
in $
/kW
year
41

■ Modular drive systems■ Competing drivetrain concept:
□ Optimization of individual components, i.e. Inverter and machine
□ Full integration of inverter in machine
Technology Drivers - Modular drivetrain conceptsMore integrated inverter & machine concepts (e-axle)
[ISEA, e performance, 2012] [ISEA, eMoSys, 2014]
Level of integration
[ISEA, e performance, 2012]
Smart stator tooth
Connection toDC bus and capacitorPower electronic
module
Stator tooth
Tooth electronics
[ISEA, EMiLE, 2016]
42
05101520253035
2010 2012 2014 2016 2018 2020kW
/ l
0
5
10
15
20
25
2010 2012 2014 2016 2018 2020
kW /
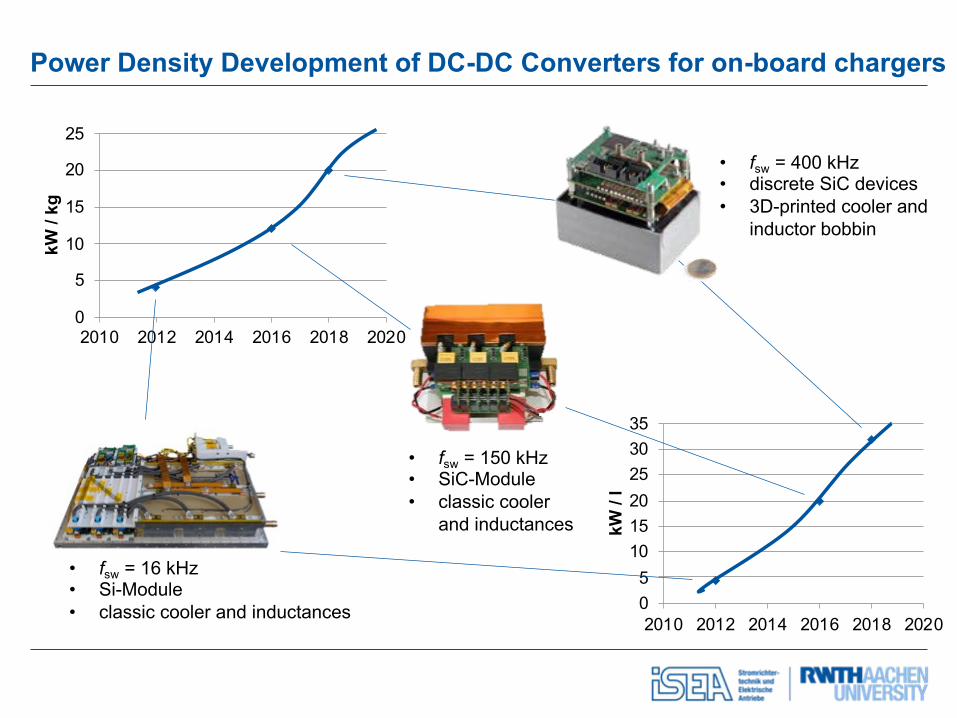
kgPower Density Development of DC-DC Converters for on-board chargers
• fsw = 16 kHz• Si-Module• classic cooler and inductances
• fsw = 150 kHz• SiC-Module• classic cooler
and inductances
• fsw = 400 kHz• discrete SiC devices• 3D-printed cooler and
inductor bobbin

Record power density (98 kW/dm3) using 3D-SLM
Dissertation A. Wienhausen, RWTH Aachen University, http://publications.rwth-aachen.de/record/767329
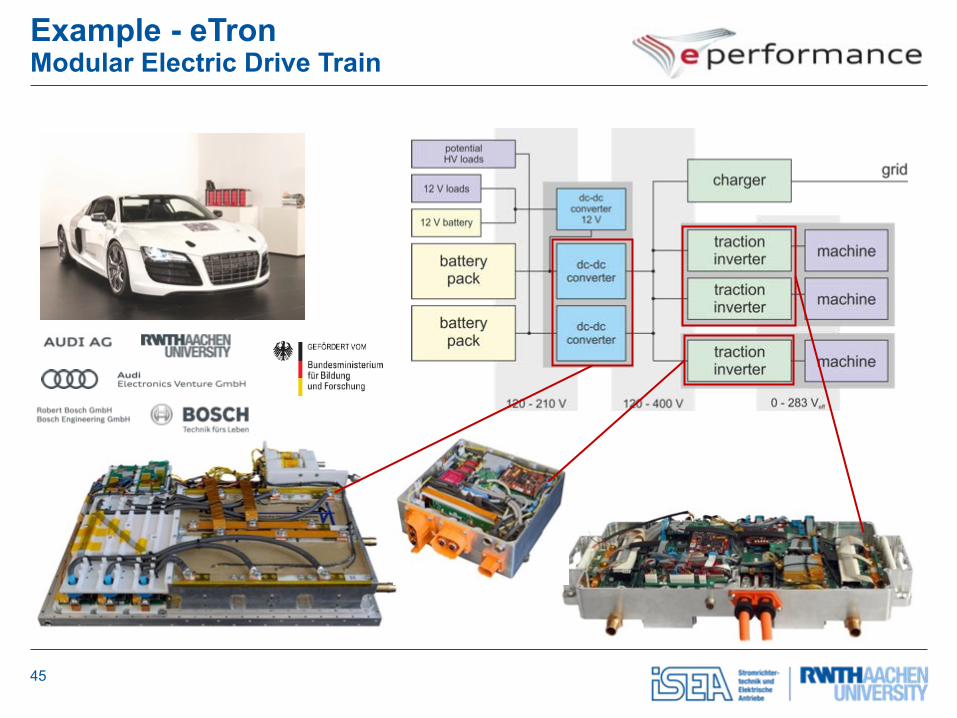
Example - eTronModular Electric Drive Train
45
46
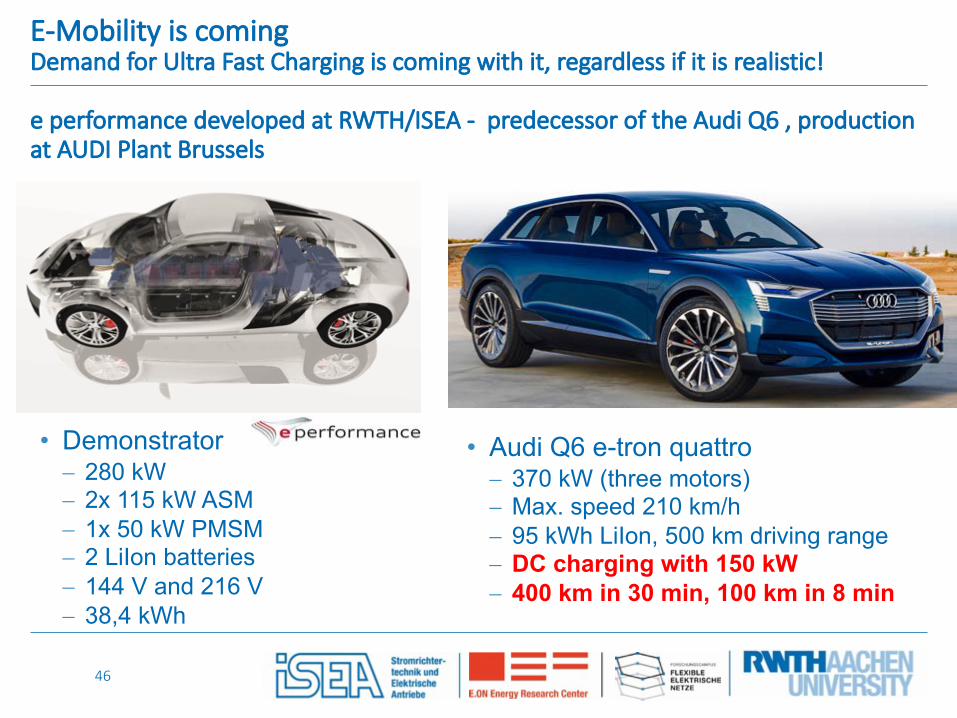
E-Mobility is comingDemand for Ultra Fast Charging is coming with it, regardless if it is realistic!
• Demonstrator- 280 kW- 2x 115 kW ASM- 1x 50 kW PMSM- 2 LiIon batteries- 144 V and 216 V- 38,4 kWh
• Audi Q6 e-tron quattro- 370 kW (three motors)- Max. speed 210 km/h- 95 kWh LiIon, 500 km driving range- DC charging with 150 kW - 400 km in 30 min, 100 km in 8 min
e performance developed at RWTH/ISEA - predecessor of the Audi Q6 , production at AUDI Plant Brussels
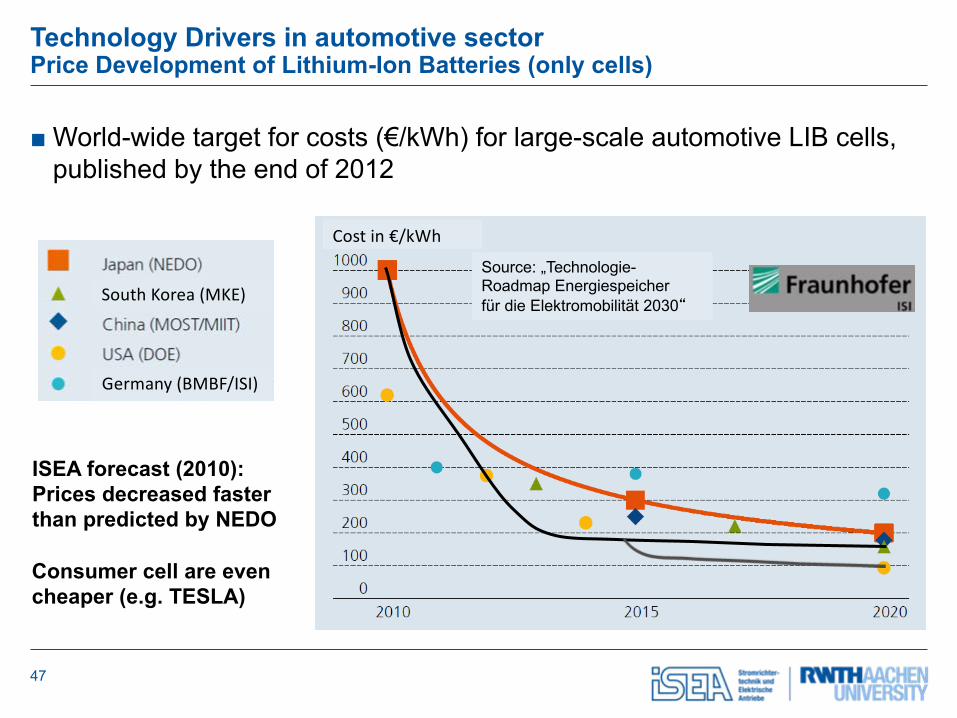
■ World-wide target for costs (€/kWh) for large-scale automotive LIB cells, published by the end of 2012
Technology Drivers in automotive sectorPrice Development of Lithium-Ion Batteries (only cells)
ISEA forecast (2010):Prices decreased fasterthan predicted by NEDO
Germany (BMBF/ISI)
South Korea (MKE)Source: „Technologie-Roadmap Energiespeicherfür die Elektromobilität 2030“
Cost in €/kWh
Consumer cell are evencheaper (e.g. TESLA)
47
48

Definition of Fast Charging
■ Definition from Elektromobilität NRW1
□ Fast charging: P > 22 kW
■ Connectors are standardized in the EU
■ Charging voltage up to 400 Vac or 800 Vdc
1Source: www.elektromobilitaet.nrw.de
www.cleantechnica.com
Household Normal Charging AC Fast-Charging DC Fast-ChargingInstallation Plug socket Wallbox/ Charge
stickPower stick Power stick
Socket SchuKo-socket Typ-2-socket Typ-2-socket Combo-2-socket
Voltage AC 230 V AV 400 V AC 400 V DC < 800 V
Power < 3.7 kW < 22 kW < 44 kW < 170 kW
Charging Time (for22 kWh battery)2
> 10 h 1-5 h 30 min. < 30 min
2 Linear assumption. In reality a 22 kWh ist charged within 90 min. by a charging power of 22 kW due to chemical issues
49

View of (French) OEMs and first Tier SuppliersWhen is Ultra Fast Charging Infrastructure Required?
2015 2017 2020 2022 2030
20 kWh40 kWh
60 kWh60 kWh
100 kWh
120 kWh
80 kWh
Year
195 kW
320 kW
385 kW
* Required power to charge up to 80% SOC within 15 minutes. Constant power during charging process is assumed
Majority of consumers accept 15 minutes of maximum charging time (study by ING Bank, July 2017)
Premium class vehicles need ultra fast charging (>300 kW)
soon!
Standard class vehicle may not need charging power
higher than 200 kW
Source: J.B. Moreau. „The EV charging market: present & future outlook“. APE Conference 2017. Paris
50
Required chargingpower
> 3 C
> 2 C
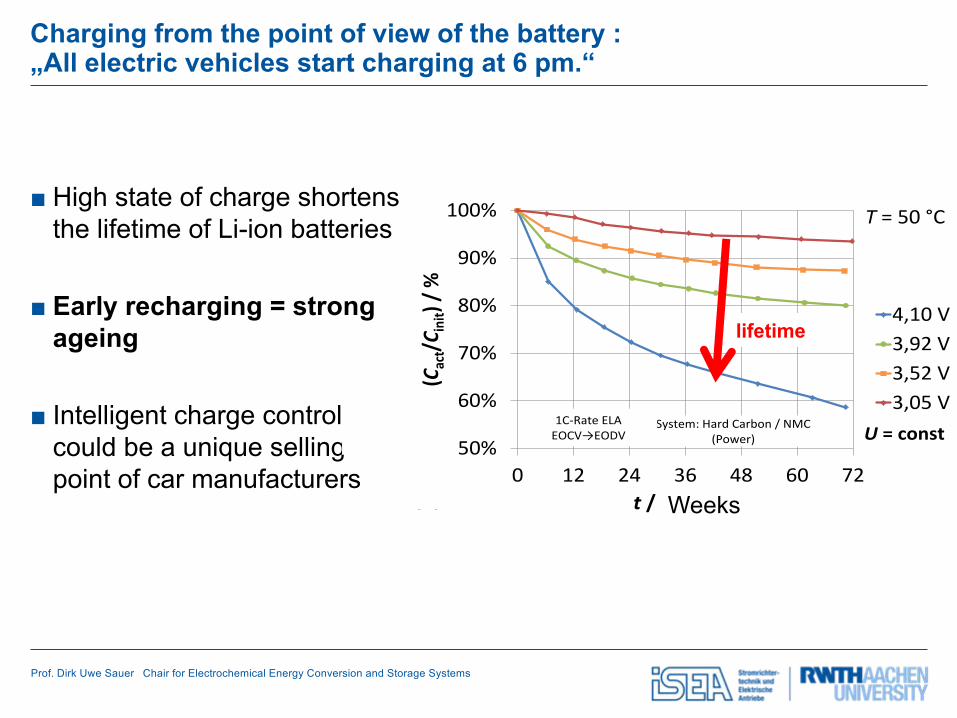
Charging from the point of view of the battery : „All electric vehicles start charging at 6 pm.“
■ High state of charge shortens the lifetime of Li-ion batteries
■ Early recharging = strong ageing
■ Intelligent charge control could be a unique selling point of car manufacturers
50%
60%
70%
80%
90%
100%
0 12 24 36 48 60 72
(Cac
t/Cin
it) /
%
t / Wochen
4,10 V3,92 V3,52 V3,05 V
System: Hard Carbon / NMC (Power)
1C-Rate ELAEOCV→EODV
T = 50 °C
U = const
(b)
lifetime
Prof. Dirk Uwe Sauer Chair for Electrochemical Energy Conversion and Storage Systems
Weeks
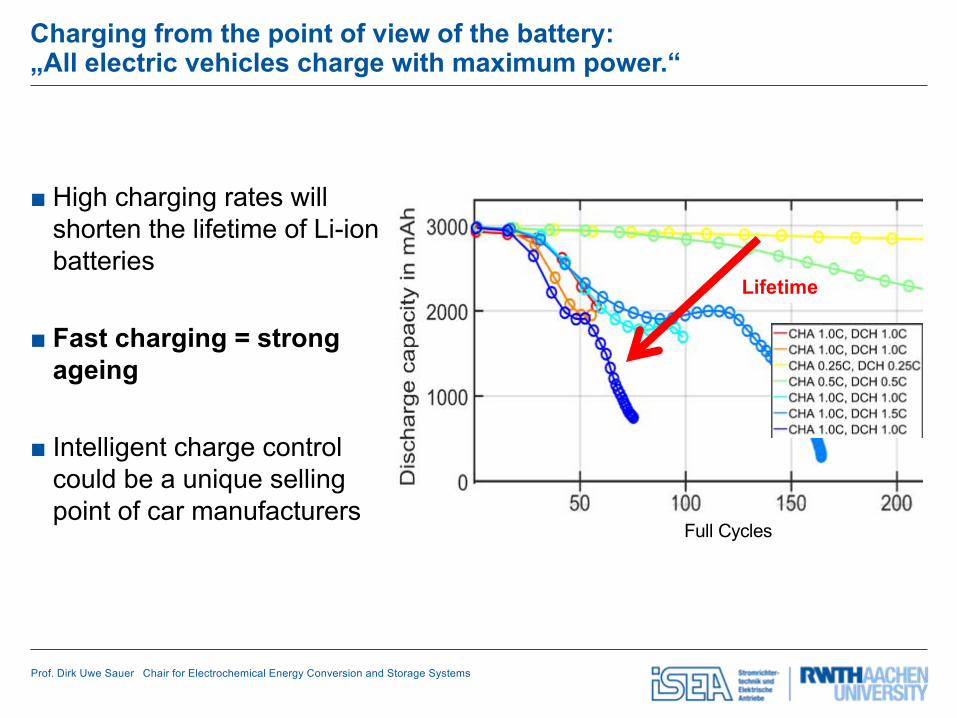
Charging from the point of view of the battery: „All electric vehicles charge with maximum power.“
■ High charging rates will shorten the lifetime of Li-ion batteries
■ Fast charging = strong ageing
■ Intelligent charge control could be a unique selling point of car manufacturers
Lifetime
Full Cycles
Prof. Dirk Uwe Sauer Chair for Electrochemical Energy Conversion and Storage Systems
53
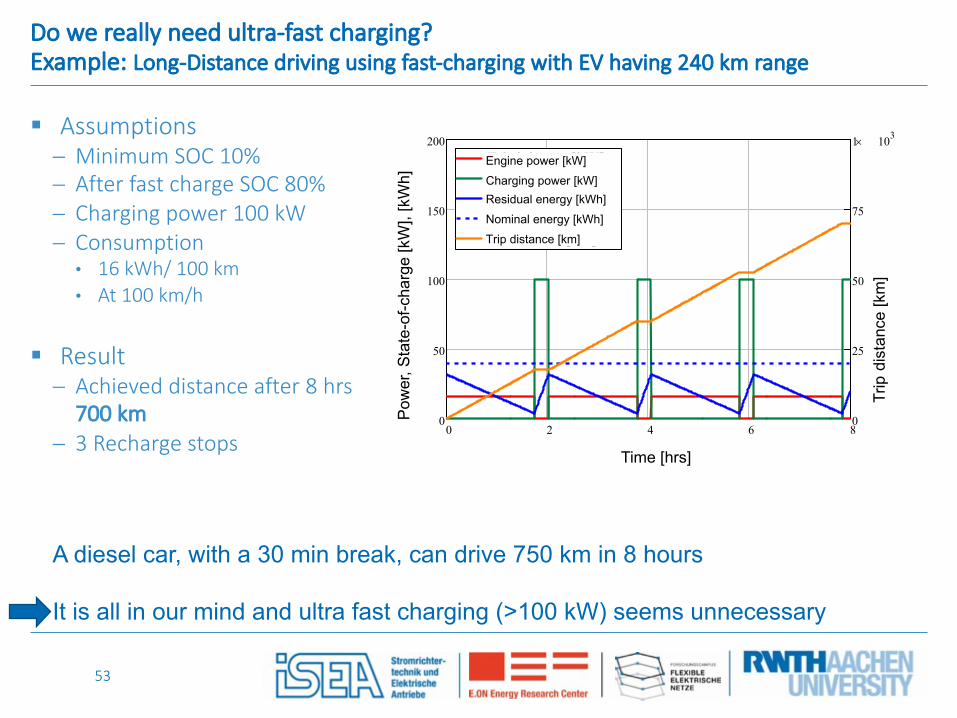
Do we really need ultra-fast charging?Example: Long-Distance driving using fast-charging with EV having 240 km range
§ Assumptions- Minimum SOC 10%- After fast charge SOC 80%- Charging power 100 kW- Consumption• 16 kWh/ 100 km• At 100 km/h
§ Result- Achieved distance after 8 hrs
700 km- 3 Recharge stops
0 2 4 6 80
50
100
150
200
0
250
500
750
1 103´Fahrleistung [kW]Ladeleistung [kW]Restenergie [kWh]Nennenergie [kWh]Fahrstrecke [km]
Zeit [h]
Leis
tung
, Lad
ezus
tand
[kW
, kW
h]
Dis
tanz
[km
]
Pow
er, S
tate
-of-c
harg
e [k
W],
[kW
h]
Time [hrs]
Engine power [kW]Charging power [kW]Residual energy [kWh]Nominal energy [kWh]Trip distance [km]
Trip
dis
tanc
e[k
m]
A diesel car, with a 30 min break, can drive 750 km in 8 hours
It is all in our mind and ultra fast charging (>100 kW) seems unnecessary
54
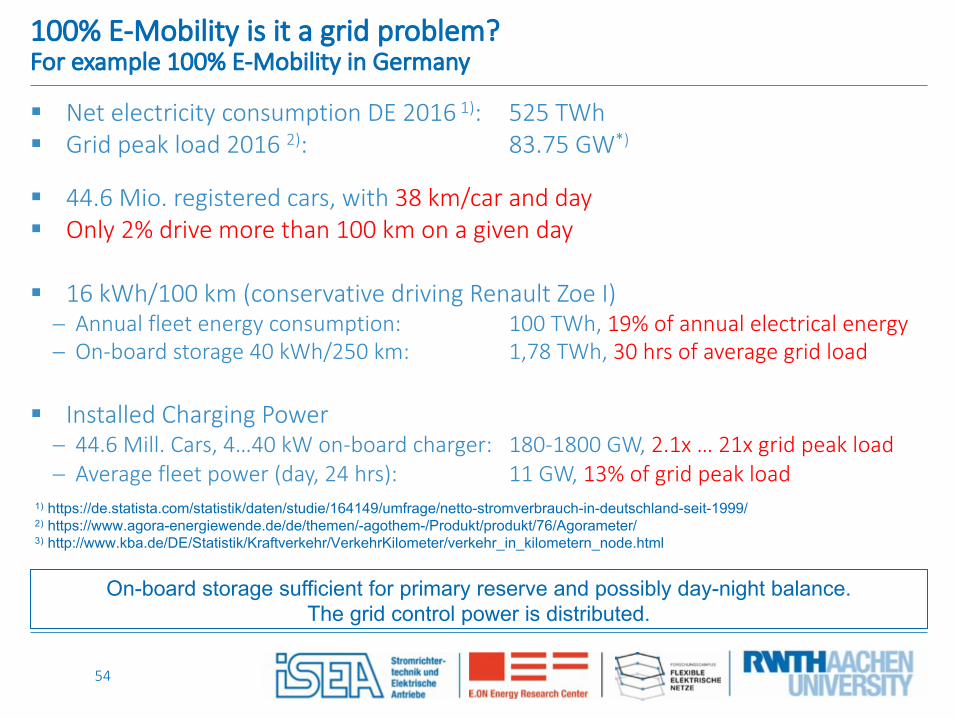
100% E-Mobility is it a grid problem?For example 100% E-Mobility in Germany
§ Net electricity consumption DE 2016 1): 525 TWh§ Grid peak load 2016 2): 83.75 GW*)
§ 44.6 Mio. registered cars, with 38 km/car and day§ Only 2% drive more than 100 km on a given day
§ 16 kWh/100 km (conservative driving Renault Zoe I)- Annual fleet energy consumption: 100 TWh, 19% of annual electrical energy- On-board storage 40 kWh/250 km: 1,78 TWh, 30 hrs of average grid load
§ Installed Charging Power- 44.6 Mill. Cars, 4…40 kW on-board charger: 180-1800 GW, 2.1x … 21x grid peak load- Average fleet power (day, 24 hrs): 11 GW, 13% of grid peak load
1) https://de.statista.com/statistik/daten/studie/164149/umfrage/netto-stromverbrauch-in-deutschland-seit-1999/2) https://www.agora-energiewende.de/de/themen/-agothem-/Produkt/produkt/76/Agorameter/3) http://www.kba.de/DE/Statistik/Kraftverkehr/VerkehrKilometer/verkehr_in_kilometern_node.html
On-board storage sufficient for primary reserve and possibly day-night balance.The grid control power is distributed.

55
Distribution GridTypical Urban AC Grid Structure
Branch A- 21 households, max. total power: 98 kW- Length: 461 m
Branch B- 34 households, max. total power : 129 kW - Length : 715 m
Branch C- 10 households, max. total power : 68 kW - Length : 185 m
Connection to transmission grid- Max. total power : 250 kVA - Average apparent power per household 3,85 kVA
M. Stieneker and R. W. De Doncker, "Medium-voltage DC distribution grids in urban areas," 2016 IEEE 7th International Symposium on Power Electronics for Distributed Generation Systems (PEDG), Vancouver, 2016
56
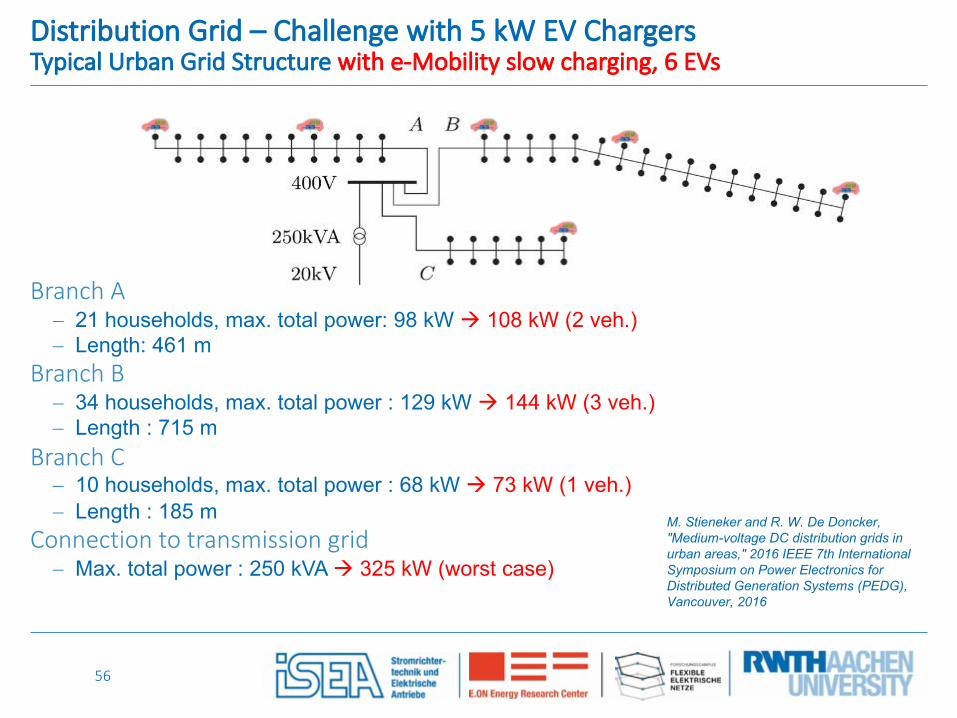
Distribution Grid – Challenge with 5 kW EV ChargersTypical Urban Grid Structure with e-Mobility slow charging, 6 EVs
Branch A- 21 households, max. total power: 98 kW à 108 kW (2 veh.)- Length: 461 m
Branch B- 34 households, max. total power : 129 kW à 144 kW (3 veh.)- Length : 715 m
Branch C- 10 households, max. total power : 68 kW à 73 kW (1 veh.)- Length : 185 m
Connection to transmission grid- Max. total power : 250 kVA à 325 kW (worst case)
M. Stieneker and R. W. De Doncker, "Medium-voltage DC distribution grids in urban areas," 2016 IEEE 7th International Symposium on Power Electronics for Distributed Generation Systems (PEDG), Vancouver, 2016
57
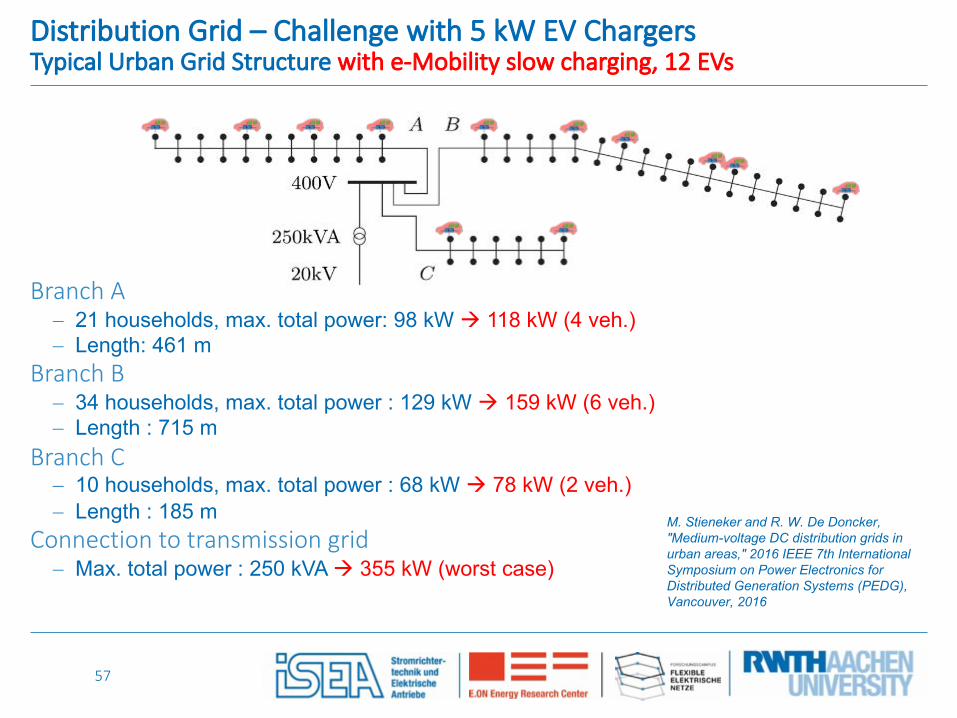
Distribution Grid – Challenge with 5 kW EV ChargersTypical Urban Grid Structure with e-Mobility slow charging, 12 EVs
Branch A- 21 households, max. total power: 98 kW à 118 kW (4 veh.)- Length: 461 m
Branch B- 34 households, max. total power : 129 kW à 159 kW (6 veh.)- Length : 715 m
Branch C- 10 households, max. total power : 68 kW à 78 kW (2 veh.)- Length : 185 m
Connection to transmission grid- Max. total power : 250 kVA à 355 kW (worst case)
M. Stieneker and R. W. De Doncker, "Medium-voltage DC distribution grids in urban areas," 2016 IEEE 7th International Symposium on Power Electronics for Distributed Generation Systems (PEDG), Vancouver, 2016

58
Distribution Grid – Major Problem with 150 kW EV ChargingTypical Urban Grid Structure with e-Mobility fast charging, 6 EVs
Branch A- 21 households, max. total power: 98 kW à 398 kW (2 veh.)- Length: 461 m
Branch B- 34 households, max. total power : 129 kW à 479 kW (3 veh.)- Length : 715 m
Branch C- 10 households, max. total power : 68 kW à 218 kW (1 veh.)- Length : 185 m
Connection to transmission grid- Max. total power : 250 kVA à 1.1 MW (worst case)
M. Stieneker and R. W. De Doncker, "Medium-voltage DC distribution grids in urban areas," 2016 IEEE 7th International Symposium on Power Electronics for Distributed Generation Systems (PEDG), Vancouver, 2016

59
0 200 400 600300
350
400
450
0
100
200
300
Entfernung [m]
Span
nung
[V]
Stro
m [A
]
90%
110%
0 200 400 600300
350
400
450
0
100
200
300
Entfernung [m]
Span
nung
[V]
Stro
m [A
]
90%
110%
0 200 400 600300
350
400
450
0
100
200
300
Entfernung [m]
Span
nung
[V]
Stro
m [A
] 90%
110%
Low voltage distribution grid cannot reliably support e-Vehicles at higher power (40 kW, Segment “B”)
Voltage distributionLine currentLoad currentFeed-in current
Distance [m]
Volta
ge [V
]
Cur
rent
[A]
Cur
rent
[A]
Distance [m]
Volta
ge [V
]
129 kW, evening
+ 2 e-Vehicles
-109 kW, day
0 200 400 600300
350
400
450
0
100
200
300
Entfernung [m]
Span
nung
[V]
Stro
m [A
]
90%
110%+ 2 e-Vehicles
Chargers
Under-voltage
60
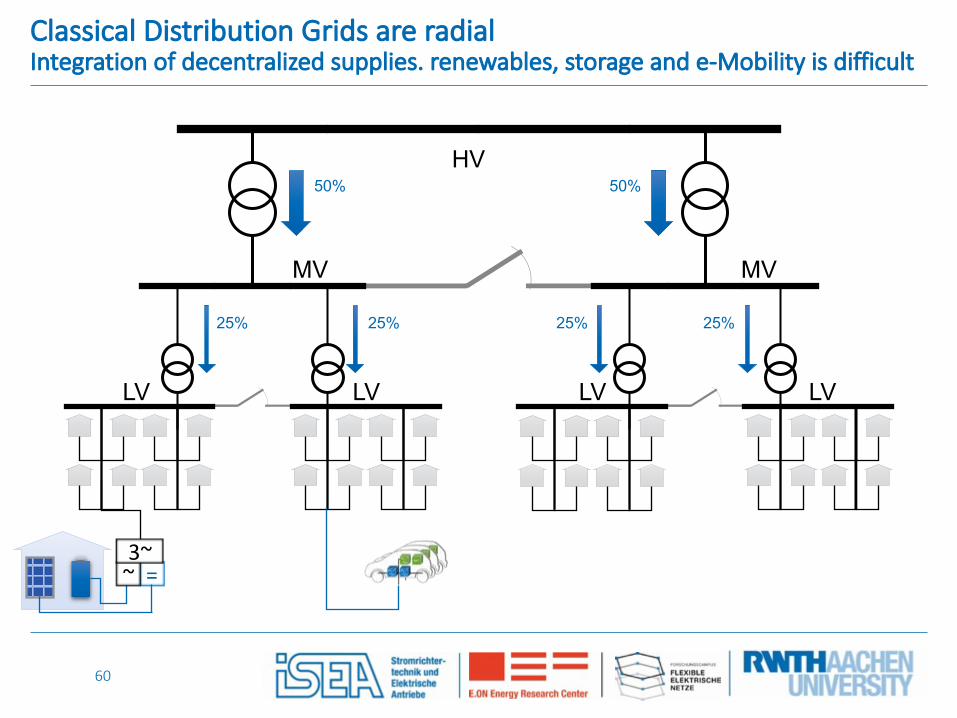
Classical Distribution Grids are radialIntegration of decentralized supplies. renewables, storage and e-Mobility is difficult
MV MV
LVLVLVLV
HV
25% 25% 25% 25%
50% 50%
=~3~

61
Classical Distribution Grids are radial and massively oversizedIntegration of decentralized supplies. renewables, storage and e-Mobility is difficult
HV
25% 25% 25%
100 %
25% 25% 25%
MV MV
LVLVLVLV
25%
=~3~

62
Hybrid Approach to Maximize Capacity of Distribution Grids Integration of e-Mobility, PV, Wind, Storage … by MVDC-Backbone
3~= =
3~= =MVDC
MVDC
3xFCS
HV
==
==
==
= = = == = = =3xFCS
= =
25%
25%
25%
100% 100%
25%50 %50 %
MV MV
MVDC
LVLVLVLV

63
= =N x (F)CS
==
==
==
Hybrid Approach to Maximize Capacity of Distribution Grids Integration of e-Mobility, PV, Wind, Storage … by MVDC-Backbone
3~= =
3~= =MVDC
MVDC
HV
= = = == = = =N x (F)CS
25%
25%
25%
100% 100%
25%50 %50 %
MV MV
MVDC
LVLVLVLV
64
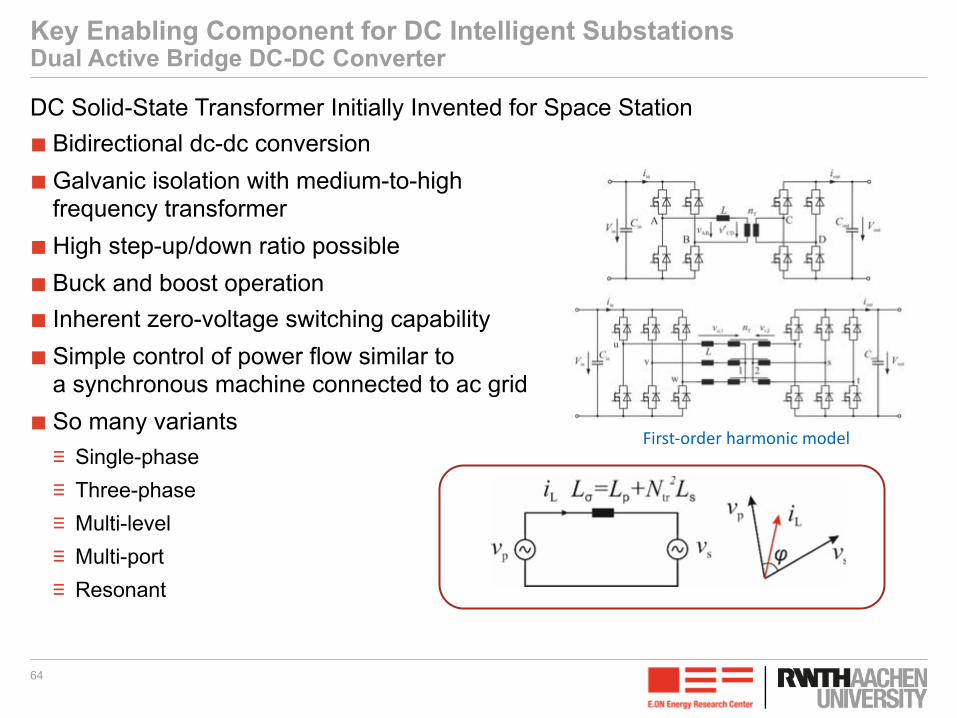
Key Enabling Component for DC Intelligent Substations Dual Active Bridge DC-DC Converter
DC Solid-State Transformer Initially Invented for Space Station■ Bidirectional dc-dc conversion■ Galvanic isolation with medium-to-high
frequency transformer■ High step-up/down ratio possible■ Buck and boost operation■ Inherent zero-voltage switching capability■ Simple control of power flow similar to
a synchronous machine connected to ac grid■ So many variants
≡ Single-phase≡ Three-phase≡ Multi-level ≡ Multi-port≡ Resonant
First-order harmonic model

65
Dual-Active-Bridge-DC-DC-Converter with IGBTs Equivalent circuit diagram with voltage sources
First-order harmonic model
Three-Phase Dual-Active-Bridge Converter in Block-mode Operation

66
Three-Phase Dual-Active-Bridge Converter in Block-mode Operation
𝑢 = 𝐿 ⋅d𝑖d𝑡⇔ 𝑖 =
1𝐿∫ 𝑢d𝑡 mit 𝐿 = 𝐿!" + 𝐿#"$
Waveforms of Dual Active Bridge

67
Three-Phase Dual-Active-Bridge Converter in Block-mode Operation
𝛼
𝛽 𝑢!𝑢′"𝚤!
𝑢! = 𝑢!" + j𝑢!#𝑢$% = 𝑢$" + j𝑢$#
𝑆&
𝑆'
𝑆(
𝚤! = 𝑖!" + j𝑖!#

68
Demonstrator DevelopmentE.ON gGmbH High Power DC-DC Converter
■ P = 7 MW, VDC = 5 kV ±10 %■ Efficiency up to 99.2 %■ Calculation based on synthetic tests:
≡ Measured losses of semiconductor switches ≡ Measured transformer losses (300 kVA)
■ Ultimately air-cooled devices are an optionR. Lenke, Doctoral Thesis, A Contribution to the Design of Isolated DC-DC Converters for Utility Applications, 2012, PGS
N. Soltau, H. Stagge, R. W. De Doncker and O. Apeldoorn, "Development and demonstration of a medium-voltage high-power DC-DC converter for DC distribution systems," 2014 IEEE 5th Int. Symposium on Power Electronics for Distributed Generation Systems (PEDG), Galway, 2014

69
DC TransitionHigher Efficiency, Saving Materials, Digital, Flexible, but also more Ecological!
4,5 MVA, 50 Hz Transformator11.500 kg (2,5 kg/kVA)
5,0 MVA, 1.000 Hz Transformator675 kg (0,14 kg/kVA)
Solid State DC transformers reduce significantly our CO2-foot printEstimated Transformer use; AC@50 Hz >25,000 ton/GVA, DC@1 kHz Grid < 1,500 ton/GW
70
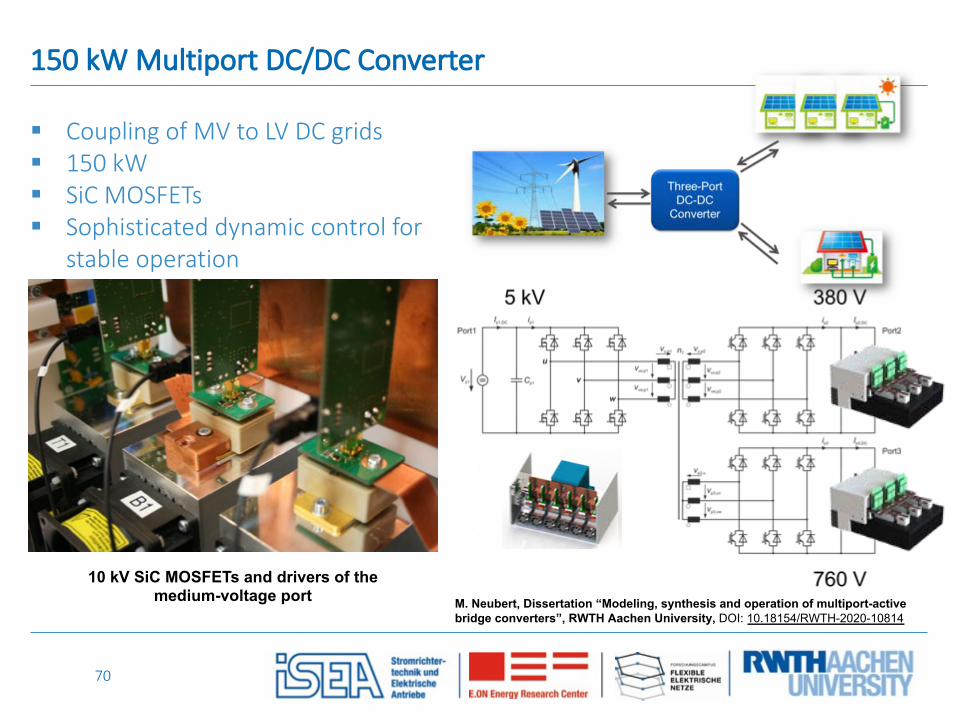
150 kW Multiport DC/DC Converter
§ Coupling of MV to LV DC grids§ 150 kW§ SiC MOSFETs§ Sophisticated dynamic control for
stable operation
10 kV SiC MOSFETs and drivers of themedium-voltage port M. Neubert, Dissertation “Modeling, synthesis and operation of multiport-active
bridge converters”, RWTH Aachen University, DOI: 10.18154/RWTH-2020-10814

71
Flexible Grids for Decentralized Power GenerationCellular Grid Topologies, Sector Coupling and DC Intelligent Substations
© R.W. De Doncker, J. von BlohLVDC-MVDC
LVDC-MVDC
LVDC-MVDC
LVDC-MVDCMVDC-MVDC
HVDC-MVDC
72
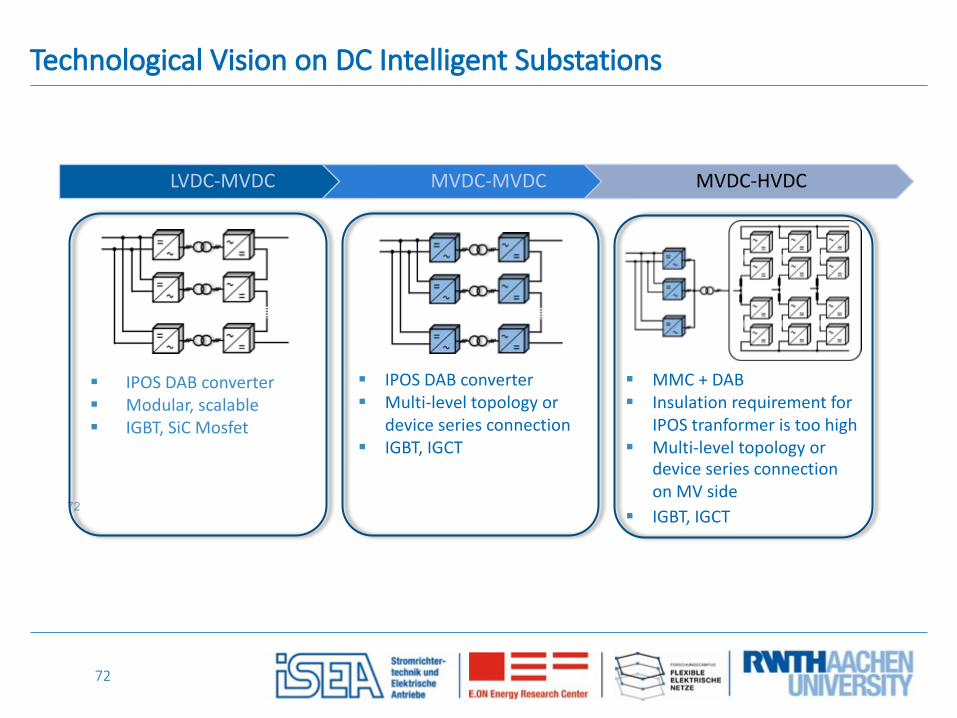
Technological Vision on DC Intelligent Substations
72
LVDC-MVDC MVDC-MVDC MVDC-HVDC
§ IPOS DAB converter§ Modular, scalable§ IGBT, SiC Mosfet
§ IPOS DAB converter§ Multi-level topology or
device series connection§ IGBT, IGCT
§ MMC + DAB§ Insulation requirement for
IPOS tranformer is too high§ Multi-level topology or
device series connectionon MV side
§ IGBT, IGCT

73
MVDC-HVDC Converters – Combining MMC and DABComparison with State-of-the-Art Solution - ±25 kV / ±200 kV, 400 MW System
MMC-FTF Converter (Conventional) TLC-MMC Converter (Proposed)
Converter on HV side Identical Identical
Semiconductors on the HV side 2400× 4.5 kV, 1.2 kA IGBTs 2400× 4.5 kV, 1.2 kA IGBTs
Number of converters on MV side 8 2
Semiconductors on the MV side 2400× 4.5 kV, 1.2 kA IGBTs 300× 4.5 kV, 1.4 kA IGCTs
Capacitive energy on the MV side 3.28 MJ 49 kJ (1.5 % of the conv.)
S. Cui, PhD thesis, “Modular multilevel DC-DC converters interconnecting high-voltage and medium-voltage DC grids”, Dissertation, RWTH Aachen University, 2019, DOI: 10.18154/RWTH-2019-05892
S. Cui, N. Soltau and R. W. De Doncker, "Dynamic performance and fault-tolerant capability of a TLC-MMC hybrid DC-DC converter for interconnection of MVDC and HVDC grids," 2017 IEEE Energy Conversion Congress and Exposition (ECCE), Cincinnati, OH, 2017, pp. 1622-1628, doi: 10.1109/ECCE.2017.8095986.
-39%-36%-29%
-30%

Outline
■ Introduction – RWTH Aachen University□ E.ON ERC□ ISEA and PGS□ Research CAMPUS Flexible Electrical Networks
■ Background – Energy Transition and Flexible Grids□ Renewables and decentralized power generation impact grid structures□ Flexible DC Distribution grids and sector coupling□ eMobility impact on distribution grids
■ Conclusions □ Use cases where DC technology makes a lot of sense□ DC technology never went away□ Standardization□ Urgency to drive the DC (r)evolution
74
75
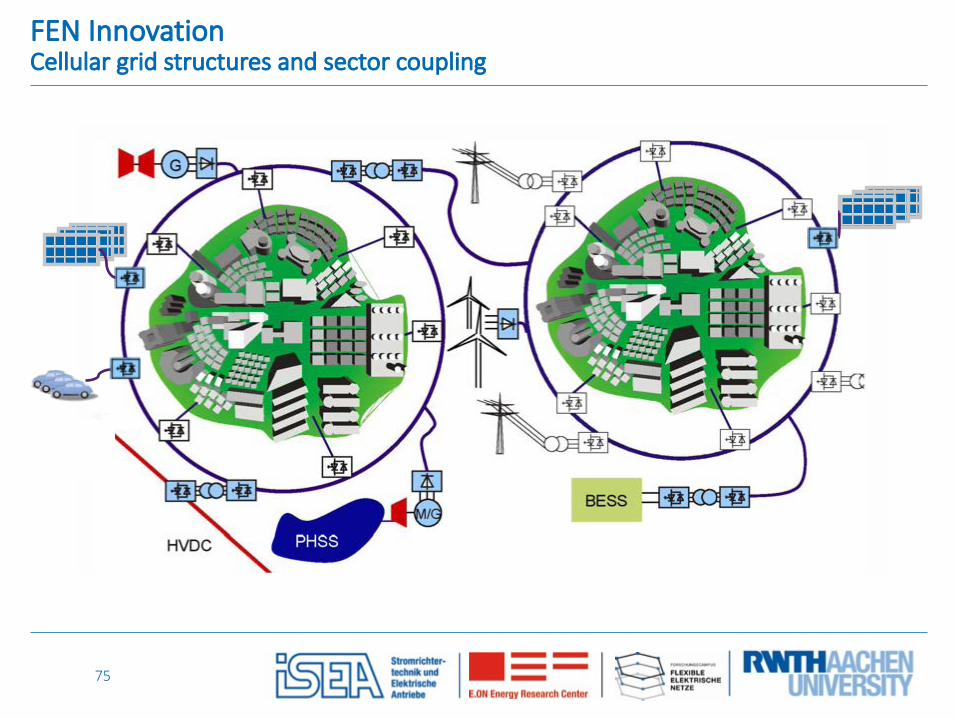
FEN InnovationCellular grid structures and sector coupling
© R.W. De Doncker, J. von Bloh

76
© R.W. De Doncker, J. von Bloh
Commercial Buildings

77
Aus der Nische mittelfristig realistische Anwendungsszenarien
© R.W. De Doncker, J. von Bloh
Integration of Storages

78
Aus der Nische mittelfristig realistische Anwendungsszenarien
© R.W. De Doncker, J. von Bloh
DC Charging Infrastructure

79
Aus der Nische mittelfristig realistische Anwendungsszenarien
© R.W. De Doncker, J. von Bloh
Point-to-Point DC Distribution

80
Aus der Nische mittelfristig realistische Anwendungsszenarien
© R.W. De Doncker, J. von Bloh
Point-to-Point DC Distribution
Industrial DC Grids

81
Aus der Nische mittelfristig realistische Anwendungsszenarien
© R.W. De Doncker, J. von Bloh
Point-to-Point DC Distribution
Industrial DC Grids
Collector Fields forPV-Parks & Windfarms

82
Aus der Nische mittelfristig realistische Anwendungsszenarien
© R.W. De Doncker, J. von Bloh
Dc City Quarterand
Regional Grid
83
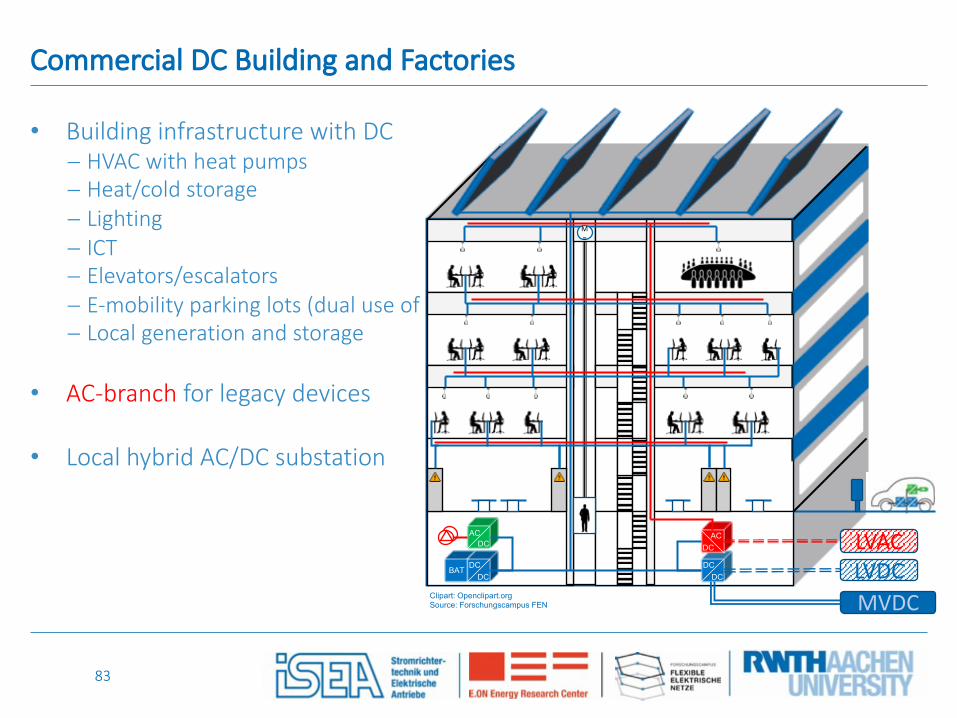
Commercial DC Building and Factories
• Building infrastructure with DC- HVAC with heat pumps- Heat/cold storage- Lighting- ICT- Elevators/escalators- E-mobility parking lots (dual use of batteries)- Local generation and storage
• AC-branch for legacy devices
• Local hybrid AC/DC substation
BAT
ACDC
DCDC
LVACLVDC
ACDC
DCDC
Clipart: Openclipart.orgSource: Forschungscampus FEN MVDC
M=
84
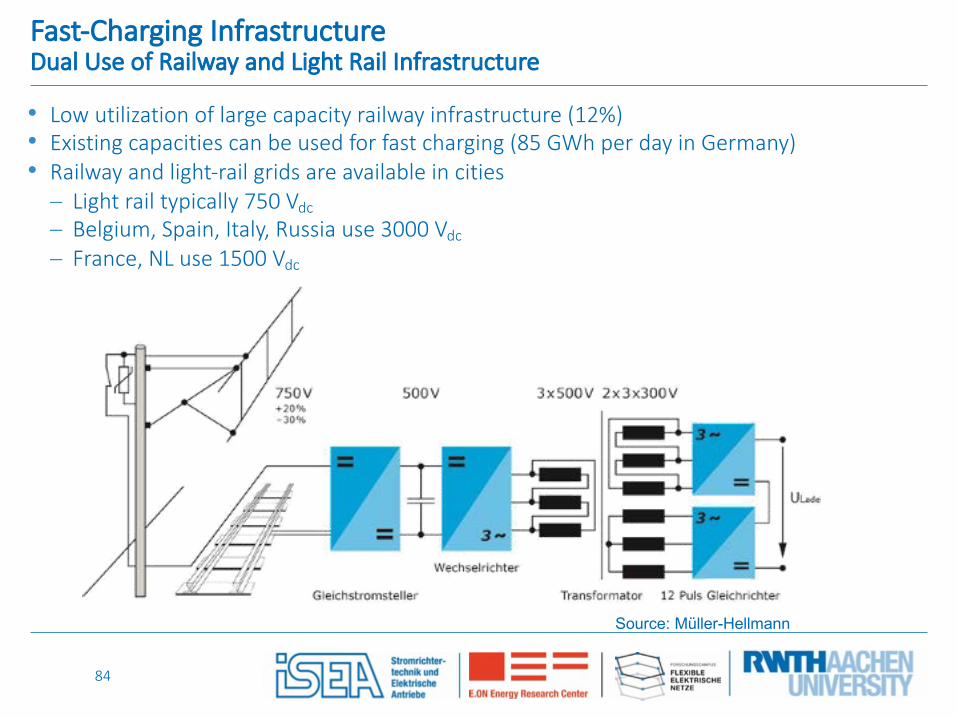
Fast-Charging InfrastructureDual Use of Railway and Light Rail Infrastructure
• Low utilization of large capacity railway infrastructure (12%)• Existing capacities can be used for fast charging (85 GWh per day in Germany)• Railway and light-rail grids are available in cities- Light rail typically 750 Vdc- Belgium, Spain, Italy, Russia use 3000 Vdc
- France, NL use 1500 Vdc
Source: Müller-Hellmann

85
Fast-Charging Infrastructure linked to light-rail
• Research project „BOB“ (Solingen)- Double use of Trolley bus infrastructure- Catenary power used for charging of
on-board batteries during operation- Possible electrification of lines without
catenary- Integration of renewable energies- Services for feeding ac grid
• 4 GW (750 Vdc) installed capacity in German cities alone (VDV – Prof. Müller-Hellmann)- Average use is 12% - Each day about 85 GWh is available to charge EV- 1.4 million EVs with 60 kWh battery- 420 million km range (@20 kWh/100 km)
Source: Uni Wuppertal
86
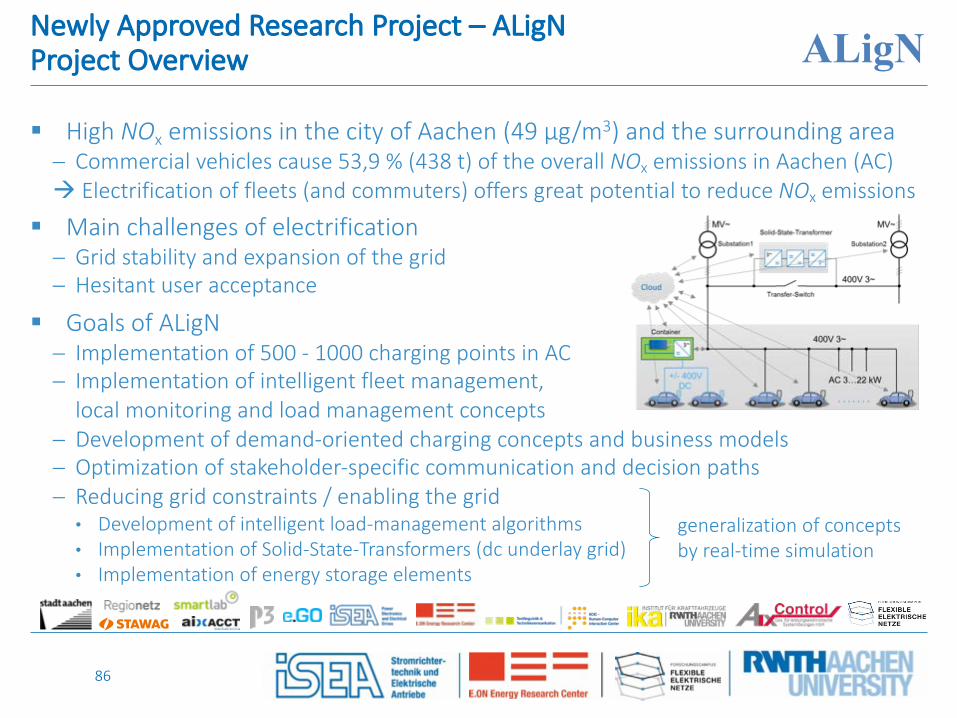
Newly Approved Research Project – ALigNProject Overview
§ High NOx emissions in the city of Aachen (49 µg/m3) and the surrounding area- Commercial vehicles cause 53,9 % (438 t) of the overall NOx emissions in Aachen (AC)à Electrification of fleets (and commuters) offers great potential to reduce NOx emissions
§ Main challenges of electrification - Grid stability and expansion of the grid - Hesitant user acceptance
§ Goals of ALigN- Implementation of 500 - 1000 charging points in AC- Implementation of intelligent fleet management,
local monitoring and load management concepts- Development of demand-oriented charging concepts and business models- Optimization of stakeholder-specific communication and decision paths- Reducing grid constraints / enabling the grid• Development of intelligent load-management algorithms• Implementation of Solid-State-Transformers (dc underlay grid)• Implementation of energy storage elements
generalization of conceptsby real-time simulation
ALigN
87
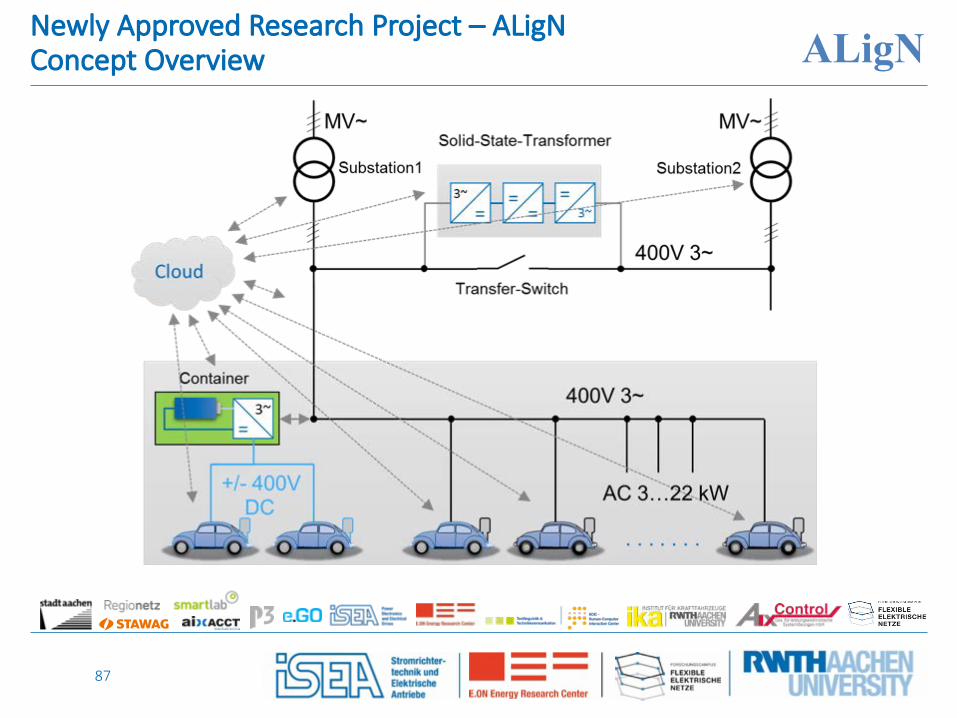
Newly Approved Research Project – ALigNConcept Overview ALigN
88
Urgency to develop/demonstrate DC Intelligent Substations
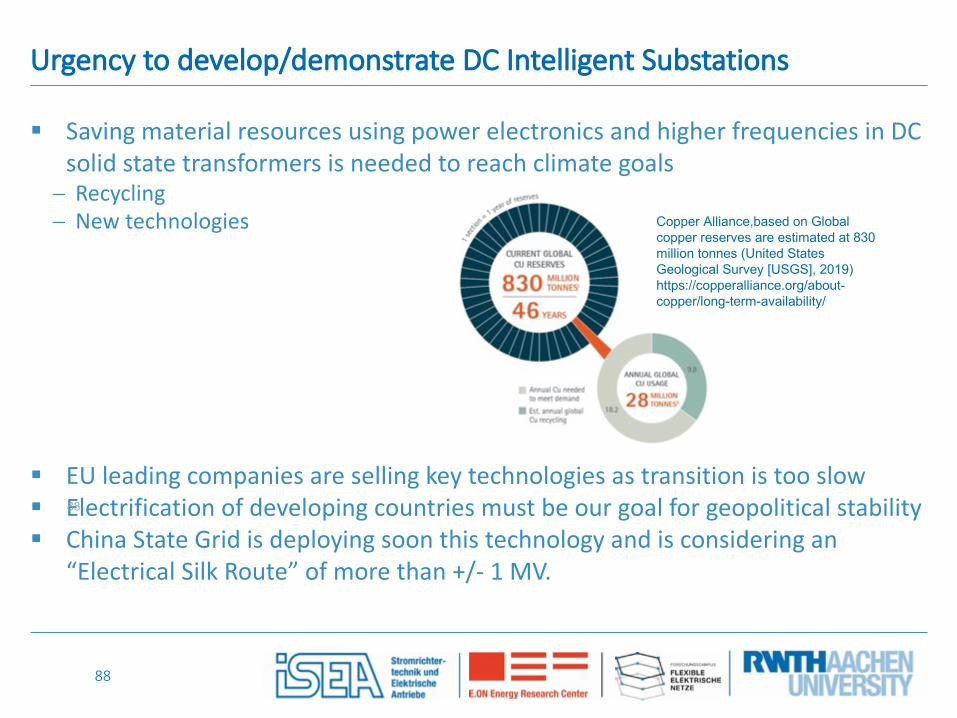
§ Saving material resources using power electronics and higher frequencies in DC solid state transformers is needed to reach climate goals- Recycling- New technologies
§ EU leading companies are selling key technologies as transition is too slow§ Electrification of developing countries must be our goal for geopolitical stability§ China State Grid is deploying soon this technology and is considering an
“Electrical Silk Route” of more than +/- 1 MV.
88
Copper Alliance,based on Global copper reserves are estimated at 830 million tonnes (United States Geological Survey [USGS], 2019) https://copperalliance.org/about-copper/long-term-availability/

89
Fast Charging and the Energy Transition go hand in hand when using DC Distribution Grids
REN, Fast Charging and the Energy Transition go hand in hand when using DC Distribution Grids
Thank you for your attention.
Image sources (banner)• Exterior view of building – ©FEN GmbH• Landscape with wind turbine – ©DDM Company• DC-DC converter – ©E.ON ERC• Network – iStockphoto.com/studiovision• Aerial view – ©Peter Winandy• Energiewende – ©stockWERK/fotolia.com• Puzzle – ©vege/fotolia.com• Power grid/Wind turbine/Solar plant –
©PhotographyByMK/fotolia.com
@FENaachen
Xing.FENaachen.net
Linkedin.FENaachen.net
Contact:
Flexible Electrical Networks FEN Research CampusCampus-Boulevard 7952074 Aachen
Tel. : +49 241 80 224 71 [email protected]
Prof. Rik W. De Doncker