fast hierarchical importance sampling with blue …ravir/6160/papers/importance...fast hierarchical...
TRANSCRIPT

Fast Hierarchical Importance Sampling with Blue Noise Properties
Victor Ostromoukhov∗
University of MontrealCharles Donohue †
University of MontrealPierre-Marc Jodoin ‡
University of Montreal
Figure 1: A high dynamic range 1024×512 environment map [Debevec 98] sampled with 3000 point lights. In this image, importance densityis represented by the lightness of the background. It took 0.064 seconds on a 2.6 GHz P4 to generate this point set. Similar results usinga hardware accelerated Lloyd relaxation [Hoff et al. 1999] required 1 second, while Structured Importance Sampling [Agarwal et al. 2003]took 1393 seconds.
Abstract
This paper presents a novel method for efficiently generating a goodsampling pattern given an importance density over a 2D domain.A Penrose tiling is hierarchically subdivided creating a sufficientlylarge number of sample points. These points are numbered us-ing the Fibonacci number system, and these numbers are used tothreshold the samples against the local value of the importance den-sity. Pre-computed correction vectors, obtained using relaxation,are used to improve the spectral characteristics of the sampling pat-tern. The technique is deterministic and very fast; the samplingtime grows linearly with the required number of samples. We illus-trate our technique with importance-based environment mapping,but the technique is versatile enough to be used in a large varietyof computer graphics applications, such as light transport calcula-tions, digital halftoning, geometry processing, and various render-ing techniques.
CR Categories: I.3.3 [Picture/Image Generation]: Anti-aliasing;I.3.m [Miscellaneous]: Sampling.
Keywords: Rendering, Importance Sampling, Deterministic Sam-pling, Hierarchical Representation, Environment Mapping, DigitalHalftoning, Blue Noise, Lookup Table-based Techniques, PenroseTiling, Fibonacci Number System.
∗e-mail: [email protected]†e-mail: [email protected]‡e-mail: [email protected]
1 Introduction
Sampling is ubiquitous in computer graphics. Many researchershave studied how the properties of sampling may affect the qual-ity of the achieved results in applications such as ray tracing,Monte Carlo path tracing, motion blur, geometry processing, digi-tal halftoning, etc. Nowadays, it is generally accepted that isotropictwo-dimensional sampling with blue noise Fourier spectrum is wellsuited for a large range of applications – see [Cook 1986], [Ulich-ney 1988], [Shirley 1991], [Mitchell 1991], [McCool and Fiume1992], [Glassner 1995], [Hiller et al. 2001], [Kollig and Keller2002], [Kollig and Keller 2003].
Often, these graphics applications need distributions of samplesproportional to an importance that results from a prior treatment(e.g., BRDF of a surface, distribution of light energy, and geometri-cal properties). The problem of 2D importance sampling with bluenoise can be stated as follows:
• Given the importance density I on a domain D, as an ana-lytical function or in the form of an array of discrete values.Without loss of generality, I can be normalized in such a waythat 0≤ I(x,y)≤ 1 ∀(x,y) ∈ D.
• Find a set of discrete samples, whose local density of sam-ples (the number of samples per unit area, calculated locally)is proportional to the importance density I, and whose Fourierspectrum exhibits the following properties: (a) low angularanisotropy, and (b) characteristic blue noise profile of the ra-dial component, i.e., a low-magnitude disk around the DCterm, a high-magnitude annulus that corresponds to the meandistance between the samples, and a surrounding medium-magnitude background exterior to the annulus (see more de-tails in [Ulichney 1987], [Hiller et al. 2001]).
Many different techniques have been developed in order to solvethis problem. Some of them, known as relaxation techniques, canproduce solutions of remarkable quality. In particular, Lloyd’s re-laxation [Lloyd 1983] and its variants lead to centroidal Voronoitessellations [Du et al. 1999]. Unfortunately, the price paid for this
To appear in the proceedings of ACM SIGGRAPH 2004

quality is high: relaxation techniques are fundamentally slow be-cause they have to solve, often iteratively, the problem of neighbor-hood determination of each point with respect to all others. Eventhe most advanced and optimized implementations remain slow.The hardware-assisted implementation of Lloyd’s relaxation [Hoffet al. 1999] is faster but is limited by the resolution of the framebuffer. Some techniques use a form of stochastic sampling (dartthrowing), such as the method proposed in [McCool and Fiume1992], where random points are added or rejected according to theproximity to previous points. Due to the low convergence rate ofthese methods, their running times are at best in the same order asLloyd’s. These methods are strictly descending and can be verysensitive to the initial point set.
Other approaches employed in digital halftoning, known as error-diffusion techniques (see [Ulichney 1987], [Ostromoukhov 2001],[Zhou and Fang 2003]), are considerably faster because only a verylimited neighborhood of each point is examined. An example of ef-ficient usage of error-diffusion in geometry processing has been ex-ploited in [Alliez et al. 2002]. The main drawback of error-diffusionis the discrete nature of the elements on which it operates: they mustbe rectangular tiles with fixed spatial resolution. This limits con-siderably the use of error-diffusion as a general-purpose samplingtechnique for computer graphics, where multi-resolution samplingis often needed. This drawback has been explicitly mentioned in[Surazhsky et al. 2003] where Lloyd’s relaxation was preferred toerror-diffusion.
Another fast sampling technique that could compare to ours interms of running times would be to use a cumulative density func-tion (CDF), generated from the probability density, and to sampleit with a stratified Monte-Carlo technique. Although such an ap-proach can generate points that reflect the required local density,they do not follow the desired blue-noise distribution, as shown inFigure 13. Recently, [Secord et al. 2002] have used a similar ap-proach, using some well-known low-discrepancy sequences suchas Halton and Sobol sequences (see [Niederreiter 1992] combinedwith CDF, in order to distribute graphics primitives at interactiverates, in an NPR context. Although this deterministic approach isvery promising, the convincing multi-purpose results have yet to beseen (see Figure 13).
In this paper, we introduce a novel Penrose tiling-based importancesampling technique that presents certain advantages over existingtechniques. It belongs to the family of point sampling, that is, eachpoint is processed independently of other points. The treatmentfor each point is simple and computationally inexpensive, whichguarantees the very high speed of our algorithm. Moreover, thanksto off-line optimization and to a specially designed lookup table,the quality of the sampling is high, approaching the quality of cen-troidal Voronoi tessellations. The size of the lookup table is reason-ably small (typically, less than 1K of data). No data-dependent pre-calculation is needed. Our technique is multi-resolution and can besuccessfully applied on high dynamic range images (we illustratethis in Section 5).
The rest of the paper is organized as follows. In Section 2, we recallsome historical facts and properties of Penrose tiling. In Section 3we describe the core of our sampling system. In Section 4, we en-rich the basic technique with an advanced relaxation that producesan almost perfect blue noise Fourier spectrum at all importance lev-els. In Section 5, we apply, as a case study, the proposed techniqueto importance-based environment mapping. Finally, in Sections 6and 7, we discuss future work and draw some conclusions.
2 Penrose Tiling
The history of Penrose tiling is fascinating. It goes back to the workof Johannes Kepler, a 17th-century astronomer and mathematician.
Figure 2: Left: Kepler’s drawing from Harmonice Mundi publishedin 1619. This tiling inspired Roger Penrose to discover his ape-riodic tiling composed of two marked rhombs (top right). Tilesfrom his original 1979 article contain arrows as matching rules thatforce the aperiodicity of the tiling. Bottom right: Optical Fouriertransform of the vertices of Penrose tiling obtained in 1982 by AlanMackay.
Figure 3: Left: Original Penrose tiling with two kinds of rhombs.Right: An alternative representation of the same tiling, where therhombs are split in two halves, and the pentagons of two kinds areplaced at the vertices of the original tiling.
In his book Harmonice Mundi, he published an atlas of varioustilings with regular polygons. One of them, shown in Figure 2(left), excited the imagination of many mathematicians over a longperiod. Is it possible to tile the plane only with regular pentagons,decagons, and five-pointed stars? According to Kepler’s drawing,it was possible if one permitted also strange peanut-shaped figures(“monsters”), such as the one visible underneath the label “Aa”.
In the early 1970s, a modern physicist and mathematician, RogerPenrose, was mesmerized by Kepler’s drawing. He modified it insuch a way that he was able to tile the plane non-periodically witha similar set of tiles. And he did much more: he found that intro-ducing special matching rules such as marks on the edges of thetiles will preclude any periodic arrangements of the tiles. Still, thetiling shows a clearly identifiable local order. This tiling belongsto the family of aperiodic structures, i.e., structures whose non-periodicity is forced by the matching rules. Penrose published afirst account of his discovery in [Penrose 1974]. Later, Penrosepublished a paper where he presented three different but tightly re-lated aperiodic tiling systems with matching rules [Penrose 1979].One of them, shown in Figure 2 (top right), has only two extremelysimple shapes, two different rhombs with matching rules. In 1977,Martin Gardner published in his column in Scientific American, anenthusiastic account of Penrose’s discovery [Gardner 1977]. AfterGardner’s publication, Penrose tiling became well-known to a largenumber of mathematicians, physicists, and chemists.
The Penrose tiling with rhombs shown in Figure 2 (top right) and inFigure 3 (left) has attracted special attention, due to its simplicity.In the early 1980s, Alan Mackay generalized the Penrose tiling to
a b
c d
e
f
b a
f
c
ae
d
f
c
e
a
e
df
a
1
1
1
1
1
φ-1
11 1 1 1
1 1
φ-1 φ-1φ-1
φ-1
φ-1
φ-1
φ-1
φ-2
φ-2
φ-1
φ
φ
φ-2
φ-1
φ-2
1 1
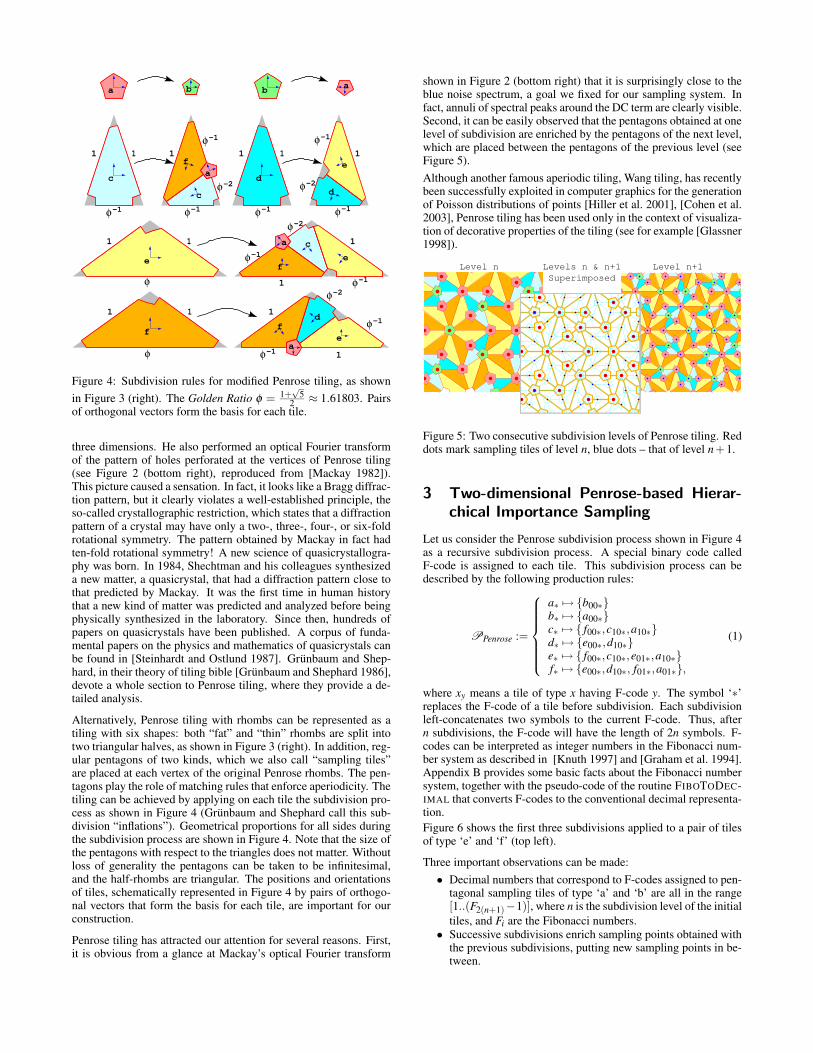
Figure 4: Subdivision rules for modified Penrose tiling, as shownin Figure 3 (right). The Golden Ratio φ = 1+
√5
2 ≈ 1.61803. Pairsof orthogonal vectors form the basis for each tile.
three dimensions. He also performed an optical Fourier transformof the pattern of holes perforated at the vertices of Penrose tiling(see Figure 2 (bottom right), reproduced from [Mackay 1982]).This picture caused a sensation. In fact, it looks like a Bragg diffrac-tion pattern, but it clearly violates a well-established principle, theso-called crystallographic restriction, which states that a diffractionpattern of a crystal may have only a two-, three-, four-, or six-foldrotational symmetry. The pattern obtained by Mackay in fact hadten-fold rotational symmetry! A new science of quasicrystallogra-phy was born. In 1984, Shechtman and his colleagues synthesizeda new matter, a quasicrystal, that had a diffraction pattern close tothat predicted by Mackay. It was the first time in human historythat a new kind of matter was predicted and analyzed before beingphysically synthesized in the laboratory. Since then, hundreds ofpapers on quasicrystals have been published. A corpus of funda-mental papers on the physics and mathematics of quasicrystals canbe found in [Steinhardt and Ostlund 1987]. Grunbaum and Shep-hard, in their theory of tiling bible [Grunbaum and Shephard 1986],devote a whole section to Penrose tiling, where they provide a de-tailed analysis.
Alternatively, Penrose tiling with rhombs can be represented as atiling with six shapes: both “fat” and “thin” rhombs are split intotwo triangular halves, as shown in Figure 3 (right). In addition, reg-ular pentagons of two kinds, which we also call “sampling tiles”are placed at each vertex of the original Penrose rhombs. The pen-tagons play the role of matching rules that enforce aperiodicity. Thetiling can be achieved by applying on each tile the subdivision pro-cess as shown in Figure 4 (Grunbaum and Shephard call this sub-division “inflations”). Geometrical proportions for all sides duringthe subdivision process are shown in Figure 4. Note that the size ofthe pentagons with respect to the triangles does not matter. Withoutloss of generality the pentagons can be taken to be infinitesimal,and the half-rhombs are triangular. The positions and orientationsof tiles, schematically represented in Figure 4 by pairs of orthogo-nal vectors that form the basis for each tile, are important for ourconstruction.
Penrose tiling has attracted our attention for several reasons. First,it is obvious from a glance at Mackay’s optical Fourier transform
shown in Figure 2 (bottom right) that it is surprisingly close to theblue noise spectrum, a goal we fixed for our sampling system. Infact, annuli of spectral peaks around the DC term are clearly visible.Second, it can be easily observed that the pentagons obtained at onelevel of subdivision are enriched by the pentagons of the next level,which are placed between the pentagons of the previous level (seeFigure 5).Although another famous aperiodic tiling, Wang tiling, has recentlybeen successfully exploited in computer graphics for the generationof Poisson distributions of points [Hiller et al. 2001], [Cohen et al.2003], Penrose tiling has been used only in the context of visualiza-tion of decorative properties of the tiling (see for example [Glassner1998]).
Level n Level n+1Levels n & n+1Superimposed
Figure 5: Two consecutive subdivision levels of Penrose tiling. Reddots mark sampling tiles of level n, blue dots – that of level n+1.
3 Two-dimensional Penrose-based Hierar-
chical Importance Sampling
Let us consider the Penrose subdivision process shown in Figure 4as a recursive subdivision process. A special binary code calledF-code is assigned to each tile. This subdivision process can bedescribed by the following production rules:
PPenrose :=
a∗ 7→ {b00∗}b∗ 7→ {a00∗}c∗ 7→ { f00∗,c10∗,a10∗}d∗ 7→ {e00∗,d10∗}e∗ 7→ { f00∗,c10∗,e01∗,a10∗}f∗ 7→ {e00∗,d10∗, f01∗,a01∗},
(1)
where xy means a tile of type x having F-code y. The symbol ‘∗’replaces the F-code of a tile before subdivision. Each subdivisionleft-concatenates two symbols to the current F-code. Thus, aftern subdivisions, the F-code will have the length of 2n symbols. F-codes can be interpreted as integer numbers in the Fibonacci num-ber system as described in [Knuth 1997] and [Graham et al. 1994].Appendix B provides some basic facts about the Fibonacci numbersystem, together with the pseudo-code of the routine FIBOTODEC-IMAL that converts F-codes to the conventional decimal representa-tion.Figure 6 shows the first three subdivisions applied to a pair of tilesof type ‘e’ and ‘f’ (top left).
Three important observations can be made:• Decimal numbers that correspond to F-codes assigned to pen-
tagonal sampling tiles of type ‘a’ and ‘b’ are all in the range[1..(F2(n+1)−1)], where n is the subdivision level of the initialtiles, and Fi are the Fibonacci numbers.
• Successive subdivisions enrich sampling points obtained withthe previous subdivisions, putting new sampling points in be-tween.

e
f
10
01
0100
1010
1001
0010
1000
0101
0001
100000010100
000100
010010
101010
001010
010001101001
100101
001001
000010
010000
101000
100100
001000
100010
100001010101
000101
000001
2
1
3
7
6
2
54
113
11
3
10207
919
17
6
2
818
16
515
14124
1
Figure 6: Three subdivisions according to the production rules (1).Only the F-codes of pentagonal sampling tiles are shown (in red),together with corresponding decimal values (in black).
• Decimal numbers already assigned at a subdivision level nwill remain at the same positions during all further subdivi-sions. The principle of this distribution is similar to that ofBayer’s dispersed-dot dither [Bayer 1973], [Foley et al. 1990]or that of rotated dispersed-dot dither [Ostromoukhov et al.1994].
This allows us to build an adaptive importance sampling sys-tem based on the Penrose subdivision system with the productionrules (1). Our adaptive importance sampling system is simple.First, we cover the area of interest, where the importance is defined,with a pair of tiles of type ‘e’ and ‘f’, as shown in Figure 6 (top left).Then, we apply the recursive subdivision process according to theproduction rules (1). We stop subdividing when the required localsubdivision level κ is reached. In this case, we output the center ofthe ‘a’ and ‘b’ type tiles, if the local importance is greater than thedecimal value of the F-code of the current tile. Pseudo-code for thisalgorithm is shown in Appendix A.Importance density may be scaled by a factor mag, constant forthe entire importance density image, in order to obtain the desirednumber of points. This effect is illustrated in the companion video1.The required local level of subdivision κ can be determined as
κ = dlogφ 2 maxtile
(mag · I(x,y))e, (2)
where d e is the usual notation for ceiling, I(x,y) is the importancevalue at position (x,y), and φ = 1+
√5
2 is the Golden Ratio. The fac-tor logφ 2 can be explained as the factor of self-similarity of Penrosetiling. In fact, from one level of subdivision to the next, the area ofPenrose tiles diminishes by factor φ 2. The value maxtile(·) can beachieved with standard scan-conversion on the triangle, for tiles oftype ‘c’, ‘d’, ‘e’, and ‘f’ (no scan-conversion is needed for tiles oftype ‘a’ and ‘b’ that are supposed to be infinitesimal). This scan-conversion is opened to possible optimization. If less precision isrequired but speed is capital, the importance can be tested only at afew points within the tile.
4 Lookup Table-based Relaxation
To improve the spatial distribution of the sampling points, we createa table of corrective vectors, which is used at run-time to relocatethe sampling points. These corrective vectors, expressed in terms of
1Siggraph 2004 Full Conference DVD-ROM; also available on the website of the first author: www.iro.umontreal.ca/ ˜ ostrom/ImportanceSampling
Before Relaxation After RelaxationCorrections
Figure 7: Lloyd’s relaxation applied on sampling point set of con-stant importance, produced with our Penrose tiling-based system.Small corrections are shown as yellow lines connecting the centersof uncorrected (blue) and corrected (red) sampling points.
1
1
1
3
13 3
2
1816
9
19
16
6
17
15
515
14
12
1
10
207
0
515
14
12
4
13
3
20
7
2
196
11
11
8888888
22222221
888888
2 88888888
181818181818
Figure 8: Structural indices is obtained by converting the 6 mostsignificant bits of the F-code assigned to each tile to the conven-tional decimal representation. Only sampling (pentagonal) tiles areconsidered. In this figure, we use identical colors for tiles of type‘b’ and ‘c’, ‘d’ and ‘e’, to better visually identify the structure. No-tice how the local neighborhoods around tiles with the same la-bel are similar, after rotation. Highlighted are the neighborhoodsaround pentagons labeled with is = 5.
orthogonal basis proper to each tile, will have the effect of “relax-ing” the point distribution. See Figure 7 and the companion video1.Unfortunately, even though there are only two different samplingtiles, the fact that Penrose tiles fill the plane aperiodically makesit impossible to account for every possible correction vector. Nev-ertheless, the self-similar nature of the tiling can be harnessed toobtain a limited number of corrective vectors. To accomplish this,we relabel the sampling tiles with what we call a “structural index”,is, which is calculated from the first six bits of their F-code (see Fig-ure 8). This gives a total of 21 different labels (the maximum valueencoded with the F-system over 6 bits). Each of these 21 labels hasa corresponding corrective vector. This six-bit structural indexinghas been found experimentally.Because these corrective vectors have to be representative of anyimportance density function, we must optimize them with regardsto different importance values. We chose to optimize the vectorsover n importance values that are represented by what we call the“importance index”, iv which is calculated as follows:
iv = bn ·ψ(mag · I(x,y))c, (3)
where b c is the usual notation for the floor, I(x,y) is the importancevalue at position (x,y) and ψ(·) maps a real number onto the interval[0..1]. We found that with n = 8 we get rather smooth gradationsacross importance values.The resulting corrective vectors optimized over each importance

Importance Levels of Subdivision
Resulting Sampling Points
109
87
6
Figure 9: A typical importance map sampled with our system. Bluedots indicate the centers of the sampling tiles. Yellow lines showlookup table-based corrections applied on sampling points. Reddots show the corrected sampling points. Please note seamless tran-sitions between zones of different levels of subdivision.
value are stored in a 8× 21 lookup table where the first index isaddressed by the importance index iv and the second dimension isaddressed by the structural index is.
The procedure used to generate the lookup table is the following.
First, we initialize the lookup table with zero vectors. Then, foreach importance index, iv, we apply the following process.
1. With our sampling system, create a large patch of samplingpoints that correspond to the current importance, using thelatest version of the lookup table for corrections as will beexplained below.
2. Apply Lloyd’s relaxation on this set. Be careful to make pe-ripheral points immovable. This is needed because the patchis finite. See Figure 7.
3. For each sampling point, calculate the difference between theuncorrected position and the relaxed position.
4. Calculate the mean value of correction vectors, for all sam-pling tiles with the same structural index is. Store the resultsin the table at position (iv, is).
5. Repeat steps (1)-(4) until convergence is attained (typically 5to 10 iterations).
Considering the lookup table as a vector field, a low-pass filter isthen applied to the vectors across importance indices. Then, thewhole process is repeated until convergence is attained (typically 5to 10 iterations). Thus, relaxation and low-pass filtering are appliedalternatively.
At the end of the optimization, the corrected points closely matchthose obtained by true Lloyd relaxation, for all importance levels.The low-pass filtering between each iteration ensures that the pointswill be distributed adequately over gradients in non-constant impor-tance density functions.
Figures 9, 13 (top), 10, and 11 (top right) illustrate the resultsachieved with our system. Please note how our technique capturesnuances of importance in all subranges of the dynamic range.
Fourier Transform
Angular Anisotropy
Radial ComponentImportance
Figure 10: Fourier amplitude spectrum (DFT) of a smooth impor-tance density image sampled with 2600 points, together with its theradial component and angular anisotropy of the spectrum. Pleasenotice the typical blue noise profile of the radial component.
Several examples of lookup tables of various sizes can be foundon1. Please notice that the lookup table of size 8×21 described hereis compact, yet still gives satisfactory results. Larger size lookuptables are applicable as well.
5 Case Study: Environment Map Sampling
One of many applications of our technique in computer graphicsis the sampling of HDR environment maps. The idea is to reducethe environment map to a relatively small number of point lightsources, thus speeding up the integration of the incoming illumi-nation. We compare our sampling system with those used in re-cent incarnations of the above idea, notably Structured ImportanceSampling [Agarwal et al. 2003] and LightGen [Cohen and Debevec2001]. See the companion video 1.This problem essentially reduces to the k-centers problem, to whichthere is no known polynomial-time solution. To achieve a fast so-lution, an approximation must be used. [Agarwal et al. 2003] usethe Hochbaum-Shmoys algorithm, and [Cohen and Debevec 2001]use k-means clustering; both are iterative searches. In [Kollig andKeller 2003], a modifed Lloyd’s relaxation scheme is used to dis-tribute the sampling points, which is also an iterative process. In oursystem, the sampling points are deterministic and the lookup tableis pre-calculated; only a thresholding operation must be performedduring the sampling. Thus, we can obtain an empirical linear timeapproximation (time on a 2.6 GHz P4 processor):
No. of points 236 343 455 690 930 1847 3006Time in ms 6 9 12 17 22 42 64
The resulting sample distribution compares well with the othertechniques. The running times, though, are several orders of mag-nitude lower. In order to obtain running times similar to our system,
1Siggraph 2004 Full Conference DVD-ROM; also available on the website of the first author: www.iro.umontreal.ca/ ˜ ostrom/ImportanceSampling

Figure 11: Galileo’s Tomb environment map, sampled with left: LightGen, center: Structured Importance Sampling, and right: our system.The map size is 1024×512, the number of samples is 300. On a 2.6 GHz P4, sampling times were: left: 45 minutes, center: 25 seconds,right: 8 milliseconds.
one could use the cumulative importance density function sampledwith a stratified Monte-Carlo sampling pattern or low-discrepancysequences, as shown in Figure 13. As mentioned before, the result-ing sample points do not exhibit a blue-noise distribution. Whethera blue-noise distribution of the lights is better in this context can bedebated, but that is beyond the scope of this paper.With the relative speed of our system, the bottleneck quickly be-comes the rendering process. With a rendering system that couldhandle a few hundred lights in real time, it would be possible to sim-ulate distant illumination with dynamic maps at interactive frame-rates, using our sampling system.See Figures 1 and 11 and the companion video.
6 Discussion and Future Work
Several important notions are given in this paper without formalproof. For example, the property of uniformity of point distributionintroduced in Section 3 must be thoroughly studied and adequatelypresented. This is a considerable work that goes far beyond thescope of this paper. Adequate mathematical tools for this studyshould be developed.As we mentioned in Section 2, three-dimensional extension of Pen-rose tiling was proposed by Mackay more than twenty years ago;it played an important role in the discovery of quasicrystals. Con-sequently, one may expect to build a 3D construction, similar toour construction in Section 3, which would result in isotropic 3Dpoint distribution, modulated by 3D importance density functions.
Such hierarchical constructions would be useful in various com-puter graphics applications. Moreover, a multi-dimensional vari-ant of our construction may exist as well. It would be helpful invarious light transport calculations where multi-dimensional impor-tance density functions must be sampled (see also [Veach 1997],[Kollig and Keller 2001], [Kollig and Keller 2002]).Sampling point sets produced with our method are not perfectlyisotropic. One possible way to improve our results would be study-ing different available aperiodic tilings with the methodology intro-duced in this paper. Among the known aperiodic tilings that sharevarious properties with Penrose tiling, we are considering Am-mann’s octagonal tiling [Grunbaum and Shephard 1986], Socolar’sdodecagonal tiling [Socolar 1989], and Wang tiling [Grunbaumand Shephard 1986], [Hiller et al. 2001], [Cohen et al. 2003].
Another way to improve isotropy would be to use our method asa starting point for some other methods, such as weighted Lloyd’srelaxation, which will then converge in much fewer iterations.
7 Conclusions
Let us summarize the contributions of this paper.First, we have proposed an original method for sequentially num-bering all vertices of Penrose tiling, based on the Fibonacci numbersystem. The Penrose tiling is used as an underlying structure fora recursive subdivision. The numbers associated with the tiles areused as thresholds in the sampling process.Second, we improve the above system with corrective vectors to en-

sure blue noise properties of the sampling point distribution. Thisis achieved through an off-line Lloyd relaxation scheme. The cor-rective vectors obtained in the optimization are stored in a two-dimensional lookup table.Our technique is very fast because the required processing per sam-pling point is simple. The processing time grows linearly with thenumber of sampling points. Typical processing time for samplinga scene with thousands of sampling points can be measured in mil-liseconds. Because each tile is processed independently, the pro-posed system is parallelizable and therefore can be efficiently im-plemented with hardware.Because of its speed, simplicity, and multi-resolution propertiescombined with good quality of point distribution, our importancesampling technique may be applied in a large variety of graphicalapplications.
8 Acknowledgements
For the first author, this paper represents a culmination of a verylong-term research project that goes back to his Ph.D. thesis someten years ago. We would like to express our gratitude to many peo-ple who were involved at different degrees in discussions related tothe present paper. Thanks to Roger Hersch, Isaac Amidror, DavidSalesin, Branko Grunbaum, Przemyslaw Prusinkiewicz, Craig Ka-plan, Douglas Zongker, Eric Stollnitz, Daniel Wood, Julie Dorsey,Pierre Alliez, Mathieu Desbrun, Alexander Keller, Jiri Patera, MarkGrundland, Pierre McKenzie, Jean Vaucher, and Neil Stewart. Wewould like to thank the anonymous SIGGRAPH reviewers for theirconstructive and pertinent comments. Very special thanks to FredoDurand and Pierre Poulin for their unconditional support and help.Finally, we are indebted to our families for their support during thehard days of the paper submission.
References
AGARWAL, S., RAMAMOORTHI, R., BELONGIE, S., AND JENSEN, H.2003. Structured importance sampling of environment maps. ACMTrans. on Graphics 22, 3 (July), 605–612.
ALLIEZ, P., MEYER, M., AND DESBRUN, M. 2002. Interactive geometryremeshing. ACM Trans. on Graphics 21, 3, 347–354.
BAYER, B. 1973. An optimum method for two-level rendition ofcontinuous-tone pictures. In IEEE Int. Conf. on Communications, 11–15.
COHEN, J., AND DEBEVEC, P. 2001. LightGen, HDRShop plugin.http://www.ict.usc.edu/∼jcohen/lightgen/lightgen.html.
COHEN, M., SHADE, J., HILLER, S., AND DEUSSEN, O. 2003. Wangtiles for image and texture generation. ACM Trans. on Graphics 22, 3(July), 287–294.
COOK, R. 1986. Stochastic sampling in computer graphics. ACM Trans.on Graphics 5, 1 (Jan.), 51–72.
DEBEVEC, P. 1998. Rendering synthetic objects into real scenes: Bridgingtraditional and image-based graphics with global illumination and highdynamic range photography. In Proc. SIGGRAPH ’98, 189–198.
DU, Q., FABER, V., AND GUNZBURGER, M. 1999. Centroidal Voronoitessellations: Applications and algorithms. SIAM Review 41, 4 (Dec.),637–676.
FOLEY, J., VAN DAM, A., FEINER, S., AND HUGHES, J. 1990. ComputerGraphics, Principles and Practice, 2nd ed. Addison-Wesley.
GARDNER, M. 1977. Extraordinary nonperiodic tiling that enriches thetheory of tiles. Scientific American 236, 110–121.
GLASSNER, A. 1995. Principles of Digital Image Synthesis. MorganKaufmann.
GLASSNER, A. 1998. Andrew Glassner’s notebook: Penrose tiling. IEEEComputer Graphics & Applications 18, 4, 78–86.
GRAHAM, R., KNUTH, D., AND PATASHNIK, O. 1994. Concrete Math-ematics: a Foundation for Computer Science, 2nd ed. Chapter 6.6.Addison-Wesley.
GRUNBAUM, B., AND SHEPHARD, G. 1986. Tilings and Patterns. W.H.Freeman.
HILLER, S., DEUSSEN, O., AND KELLER, A. 2001. Tiled blue noisesamples. In Proc. Vision Modeling and Visualization, 265–272.
HOFF, K., CULVER, T., KEYSER, J., LIN, M., AND MANOCHA, D. 1999.Fast computation of generalized voronoi diagrams using graphics hard-ware. In Proc. SIGGRAPH ’99, 277–286.
KNUTH, D. 1997. The Art of Computer Programming, Volume 1, Funda-mental Algorithms, 3rd ed. page 86. Addison-Wesley.
KOLLIG, T., AND KELLER, A. 2001. Efficient bidirectional path tracingby randomized quasi-monte carlo integration. Niederreiter, K. Fang, andF. Hickernell, Eds., Monte Carlo and Quasi-Monte Carlo Methods 2000,290–305.
KOLLIG, T., AND KELLER, A. 2002. Efficient multidimensional sampling.Computer Graphics Forum 21, 3, 557–564.
KOLLIG, T., AND KELLER, A. 2003. Efficient illumination by high dy-namic range images. In Eurographics Symposium on Rendering: 14thEurographics Workshop on Rendering, 45–51.
LLOYD, S. 1983. An optimization approach to relaxation labeling algo-rithms. Image and Vision Computing 1, 2, 85–91.
MACKAY, A. 1982. Crystallography and the Penrose pattern. Physica114A, 609–613.
MCCOOL, M., AND FIUME, E. 1992. Hierarchical poisson disk samplingdistributions. In Proc. Graphics Interface ’92, 94–105.
MITCHELL, D. 1991. Spectrally optimal sampling for distributed ray trac-ing. In Proc. SIGGRAPH ’91, vol. 25, 157–164.
NIEDERREITER, H. 1992. Random Number Generation and Quasi-Monte-Carlo Methods. Soc. for Industrial and Applied Mathematics.
OSTROMOUKHOV, V., HERSCH, R., AND AMIDROR, I. 1994. Rotateddispersion dither: a new technique for digital halftoning. In Proc. SIG-GRAPH ’94, 123–130.
OSTROMOUKHOV, V. 2001. A simple and efficient error-diffusion algo-rithm. In Proc. SIGGRAPH 2001, 567–572.
PENROSE, R. 1974. The role of aesthetics in pure and applied mathematicalresearch. Bull. Inst. Math. & its Applns. 10, 266–271.
PENROSE, R. 1979. Pentaplexity, a class of non-periodic tilings of theplane. The Mathematical Intelligencer 2, 32–37.
SECORD, A., HEIDRICH, W., AND STREIT, L. 2002. Fast primitive dis-tribution for illustration. In 13th Eurographics Workshop on Rendering,215–226.
SHIRLEY, P. 1991. Discrepancy as a quality measure for sample distribu-tions. In Proc. Eurographics ’91, 183–194.
SOCOLAR, J. 1989. Simple octagonal and dodecagonal quasicrystals. Phys-ical Revue B39, 10519–10551.
STEINHARDT, P., AND OSTLUND, S. 1987. The Physics of Quasicrystals.World Scientific.
SURAZHSKY, V., ALLIEZ, P., AND GOTSMAN, C. 2003. Isotropic remesh-ing of surfaces: a local parameterization approach. In Proc. of 12th Int.Meshing Roundtable.
ULICHNEY, R. 1987. Digital Halftoning. MIT Press.
ULICHNEY, R. A. 1988. Dithering with blue noise. Proc. of the IEEE 76,56–79.
VEACH, E. 1997. Robust Monte Carlo Methods for Light Transport Simu-lation. PhD thesis. Stanford University.
ZHOU, B., AND FANG, X. 2003. Improving mid-tone quality of variable-coefficient error diffusion using threshold modulation. ACM Trans. onGraphics 22, 3 (July), 437–444.

APPENDIX A: Pseudo-code of the Adaptive
Subdivision and Sampling
ADAPTIVESAMP(t o f type tile)1 � Structure tile contains the fields:2 � type: [‘a’..‘f’]3 � LOS: Level of Subdivision4 � vertices: center if ‘a’ or ‘b’, triangle otherwise5 � Fcode6 � mag and importance are global variables7 local LOS← GETMAXLOSWITHINTILE(t)8 if t.LOS≥ local LOS9 then � Terminal: don’t need more subdivisions
10 local importance← mag ·GETLOCALIMPORTANCE(t)11 if t.type = (‘c’ or ‘d’ or ‘e’ or ‘f’)12 then return � Not a ”sampling tile”: do nothing13 if local importance≥ FIBOTODECIMAL(t.Fcode)14 then OUTPUTSAMPLE(t.center)15 return16 else � Need more subdivisions17 {t1, .., tn}← SUBDIVIDEUSINGPRODUCTIONRULES(t)18 return {ADAPTIVESAMP(t1), ..,ADAPTIVESAMP(tn)}
It is worth mentioning that the routines GETMAXLOSWITHIN-TILE(t) and GETLOCALIMPORTANCE(t) play a very important,even crucial role in the algorithm. If, for any reason (e.g., becauseof a singularity in the importance density), they fail to evaluate thelocal importance/max importance, it may result in locally erroneoussampling density.
APPENDIX B: φ - and F- Number Systems
Details about φ - and F- (Fibonacci) number systems can be foundin [Knuth 1997] and [Graham et al. 1994].
The φ -system is a positional number system in base φ , whereφ = 1+
√5
2 is the Golden Ratio. Any rational number x can be ex-pressed in this system exactly as in our conventional binary or dec-imal systems, except that instead of using powers of two or ten, thissystem employs powers of φ . For example, the number (101.001)φin base φ is
(101.001)φ = φ 2 +φ 0 +φ−3 ≈ 3.854110
The φ -system is closely related to the F-system (the abbreviationfor Fibonacci system). The F-system is also a positional sys-tem. Any integer n can be presented in the F-system as a sum ofFibonacci numbers Fj multiplied by their positional coefficients,which may be 0’s or 1’s. Thus, a number n can be expressed by itsF-code (bmbm−1 . . .b3b2)F :
n = (bmbm−1 . . .b3b2)F ⇐⇒ n =m
∑j=2
b jFj. (4)
The first index in the summation is j = 2 because of the conventionused for Fibonacci numbers Fj:
F0 = 0, F1 = 1, F2 = 1, F3 = 2, F4 = 3, F5 = 5, F6 = 8,F7 = 13, . . .
The representation of numbers is not unique in the F-system, butit becomes unique if the rule of normal form is imposed: two ad-jacent 1’s are not permitted. The procedure of conversion from anarbitrary sequence of 0’s and 1’s to the normal form, along withmany other technical details, can be found in [Graham et al. 1994].Here are the first twelve integers expressed in the F-system in nor-mal form:
3 8 13 21 34 55 89 144
0.2
0.4
0.6
0.8
1
Figure 12: Function Ψ(x). Note that Ψ(x) “jumps” every F2 j
Figure 13: A ramp importance density image sampled with (top)our system and the cumulative importance density function sampledwith (middle) a stratified Monte-Carlo pattern, or (bottom) Sobollow-discrepancy sequence.
1 = (00001)F , 2 = (00010)F , 3 = (00100)F ,4 = (00101)F , 5 = (01000)F , 6 = (01001)F ,7 = (01010)F , 8 = (10000)F , 9 = (10001)F ,
10 = (10010)F , 11 = (10100)F , 12 = (10101)F .
More examples of interpretation of such sequences of 0’s and 1’s,which we shall call F-codes, as integer numbers, are shown in Fig-ure 6.
The routine FIBOTODECIMAL converts F-codes to the conven-tional decimal representation.
FIBOTODECIMAL(Fcode)1 accumulator← 02 for i← 0 to LENGTH(Fcode)−13 do4 accumulator← accumulator +Fcode[i] ·Fi+25 return accumulator
Function Ψ(x) that maps a real positive x onto interval [0..1], asshown in Figure 12, is defined as follows:
Ψ(x) = (logφ 2
√5 · x) mod 1.
It can be easily derived from the well-known Binet’s formula
Fn = [φ n/√
5],
where [ ] is the usual notation for the nint (Nearest Integer) function.