fast response fluid flow control valve/nozzle … material… · 1 the department of defense...
TRANSCRIPT

1
The Department of Defense National Center of Excellence for First Responder Technology Transfer
Fast Response Fluid Flow Control Valve/Nozzle (Fast Flow Nozzle)
Patent No.: US 6,907,940 B1
Market Overview Naval Surface Warfare Center (NAVSEA)-Crane Division
Crane, Indiana
May 2011
2000 Corporate Drive, Suite 300, Wexford, PA 15090 Tele: 1-724-933-3520 Email: [email protected] Website: www.dodfirstlink.com
Services provided by Pittsburgh Gateways Corp. and Advanced Manufacturing Technology Ventures LLC
Distribution Statement A: Approved for Public Release; Distribution Unlimited

2
The following study was completed by FirstLink. It represents the best efforts of the FirstLink team to gather, assimilate and assess certain information pertaining to the topic at hand. It is recognized that this study analyzes certain economic conditions. As these conditions are in constant flux, neither FirstLink nor its members (Pittsburgh Gateways Corp.; AMTV, LLC or its affiliates) can be responsible for these conditions. Any decisions, actions or investment made on the subject covered are solely those of the client (Department of Defense, Department of Homeland Security, or Air Force Research Laboratory).
Distribution Statement A: Approved for Public Release; Distribution Unlimited
3
Table of Contents
Executive Summary ..................................................................................................................................................... 6
1 Introduction ......................................................................................................................................................... 8
2 Technical Synopsis ............................................................................................................................................. 10
2.1 Major Components and Operational Specifications ................................................................................... 10
2.2 Prospective Advantages ............................................................................................................................. 24
2.3 Initial Pricing Assumptions ........................................................................................................................ 25
2.4 Go-to-Market Needs................................................................................................................................... 26
3 Applications and Markets ................................................................................................................................. 27
3.1 Civilian ....................................................................................................................................................... 29
3.1.1 Civilian Market Definition and Quantification ...................................................................................... 29
3.1.2 Civilian Market Drivers and Influences ................................................................................................. 41
3.2 Military Market .......................................................................................................................................... 60
3.2.1 Military Market Definition and Quantification ...................................................................................... 60
3.2.2 Military Market Drivers and Influences ................................................................................................. 71
4 Competitive Landscape ..................................................................................................................................... 72
4.1 Existing Technologies ................................................................................................................................ 74
4.2 Competitive Ability .................................................................................................................................... 76
4.3 Key Competitors and Potential Licensing and Partnership Targets ........................................................... 77
5 Cautions and Considerations ............................................................................................................................ 83
5.1 Approvals and Manufacturing Considerations ........................................................................................... 83
5.2 Montreal Protocol ..................................................................................................................................... 83
5.3 Switching Cost ........................................................................................................................................... 84
6 Conclusion .......................................................................................................................................................... 88
Appendix A: List of Nuclear Facilities in the United States ................................................................................... 91
Appendix B: Evaluation of Fike® Corporation’s Explosion Suppression System for Ultra-High Speed Fire Suppression Applications .......................................................................................................................................... 97
Appendix C: Blast Initiated Deluge System Assessment-AFRL .......................................................................... 109
Distribution Statement A: Approved for Public Release; Distribution Unlimited

4
Table 1 : Fast Response Fluid Flow Control Valve/Nozzle ......................................................... 16Table 2: Detailed View of Chamber Base .................................................................................... 18Table 3 : Jet Core Side, Cross-Sectional View (A) and Composite Front View (B) .................... 20Table 4: Retention Ring Composite Front View (A) and Side, Cross-sectional View (B) .......... 22Table 5: Nozzle Port End Perspective View (A) and ................................................................... 24Table 6: Fast Flow Nozzle Prospective Advantages and Detail .................................................. 24Table 7: Fast Flow Nozzle Prospective Manufacturing Cost ....................................................... 25Table 8: NAICS 32-33, Explosives and Ammunition 2007 Economic Census ........................ 31Table 9: NAICS 331 Fabricated Metal Manufacturing, 2007 Economic Census ..................... 31Table 10:Select NAICS Codes ...................................................................................................... 36Table 11Installations, Removals, and Cumulative Totals of Offshore Production Facilities in Federal Waters: 1959-2010 ....................................................................................................... 39Table 12: Industrial Disasters with Explosive Incidents ......................................................... 42Table 13: CSB Completed Investigations ................................................................................... 46Table 14: Disaster Definitions .................................................................................................... 49Table 15: Natural Disasters by Type .......................................................................................... 51Table 16: Summary Natural Hazard Statistics for 2009 in the United States ........................ 52Table 17: 2011 Wildfire Statistics .............................................................................................. 57Table 18: Number of DoD Facilities by Type, Worldwide ........................................................ 62Table 19FY2011 Overseas Contingency Operations (OCO) Budget: ...................................... 64Table 20: Major DoD Acquisition ............................................................................................... 66Table 21: FLC Laboratories by Department or Agency ............................................................ 68Table 22: Existing Suppression Systems ................................................................................... 76Table 23: Fire Suppression Market Players .............................................................................. 78Table 24: Fast Flow Nozzle Prospective Advantages and Detail ................................................ 86Table 25: Fast Flow Nozzle Prospective Advantages and Detail ................................................ 88
Distribution Statement A: Approved for Public Release; Distribution Unlimited
5
Figure 1: Side Crossectional-View of Fast Response Fluid Flow Control Valve/Nozzle ............ 14Figure 2: Exploded View of Fast Response Fluid Flow Control Valve/Nozzle ........................... 15Figure 3: Detailed View of Chamber Base ................................................................................... 17Figure 4: Jet Core Side, Cross-Sectional View (A) and Composite Front View (B) ................... 19Figure 5: Retention Ring Composite Front View (A) and Side, Cross-sectional View (B) ......... 21Figure 6: Nozzle Port End Perspective View (A) and .................................................................. 23Figure 7: North American Fire Suppression System Market 2005-2013 ..................................... 28Figure 8: Gulf of Mexico Offshore Production Facilities 1959-2009 .......................................... 38Figure 9: Percent Distribution, Manner in which Fatal Work Injuries Occurred: 2008 ....... 43Figure 10: Percent Distribution, Manner in which Fatal Work Injuries Occurred in Multiple-Fatality Incidents: 2008 .............................................................................................................. 44Figure 11: Disaster Events, 2008 .................................................................................................. 50Figure 12: Wind Zones in the United States ................................................................................. 53Figure 13: Tornado Activity ......................................................................................................... 55Figure 14: Nuclear Facilities in the United States ........................................................................ 56Figure 15: Fires and Acres Burned 2000-2011 ............................................................................. 58Figure 16: US Drought Monitor, May 31, 2011 ........................................................................... 59Figure 17: Observed Fire Danger Class, U.S. June, 2011 ............................................................ 60Figure 18: Geographic Distribution of Department of Defense (DoD) Sites ........................... 62Figure 19: FY 2011 Overseas Contingency Operations (OCO) Budget: $159.3 Billion ......... 64Figure 20: FY 2011 Major Defense Acquisition Program (MDAP) Budget: ........................... 65Figure 21: FY 2011 Military Construction Budget Allocation: $16.9 Billion .......................... 67Figure 22: Federal Laboratory Distributions Across the U.S. ...................................................... 69Figure 23: Geographic Representation of Federal Laboratories ................................................... 69Figure 24: North America Fire Suppression Systems Market 2005-2013 .................................... 72
Distribution Statement A: Approved for Public Release; Distribution Unlimited

6
Executive Summary
A Fast Response Fluid Flow Control Valve/Nozzle has been developed by the Naval Surface Warfare Center (NAVSEA)-Crane Division in Crane, Indiana. The Fast Flow Nozzle is designed to optimize water delivery volume and speed in the event of an explosion or fire and provides a fast-acting technology for a fire suppression system to combat aggressive, fast-moving, high-temperature fires. The Fast Flow Nozzle is claimed to significantly outperform existing nozzles on the market in terms of both water volume delivery and response speed. This analysis provides a general overview of the Fast Flow Nozzle and prospective market opportunities. The primary markets examined within which the Fast Flow Nozzle may find relevance include, but are not limited to; the civilian and military fire suppression markets. Each potential market is defined, quantified, and market drivers and influences are explored. A summary of the information contained within the full assessment is provided below.
• A fast response in the rupture and flow of material (goal is <1 millisecond),
Technical Synopsis
The Fast Flow Nozzle is used for high-speed fire suppression systems. The prospective advantages of the Fast Flow Nozzle include:
• The modified nozzle sprays 300-350 GPM compared to the standard 20-25 GPM system therefore the nozzle delivers water at fifteen times the efficiency of existing fire suppression systems,
• The technology may be retrofitted to fixed pipe systems to provide virtually unlimited extinguishing material in only 10-15 milliseconds (cutting response time in half),
• The flow rate from one nozzle is sufficient to replace up to six traditional valve heads which allows for a cost savings,
• Allows for retrofitting of existing systems, • Can achieve higher flow rate using existing piping, • Has passed testing by the Navy at Crane lab, • Strength and durability to perform in fire situations, • The nozzle is a high value product with a low lifetime cost, and • The portable system prototype is more convenient and affordable than current fire
suppression systems.
At this time, the largest hurdle on the path to commercial market adoption is the procuring of a low cost, high performance gas generator that meets the power requirements of the nozzle delivery goals. Currently considered generators may price the overall unit out of some prospective end users’ purchasing capacity. As such, an important step in moving toward commercialization is identifying potential partners that may be able to optimize gas generator performance while minimizing unit cost.
Distribution Statement A: Approved for Public Release; Distribution Unlimited

7
Markets and Competitive Landscape
The Fast Flow Nozzle may find specific advantages in situations where traditional fire suppression systems are slower than the speed of onset and expansion of local high-intensity, and explosives fires. Within this context, the Civilian and Military markets are defined, quantified, and examined for potential opportunity. In addition drivers and influences of both markets are examined.
Competition for the Fast Flow Nozzle includes current suppression systems that are said to exhibit considerably slower response times than the Fast Flow Nozzle. The slower response time of existing technologies may not be adequate to contain or extinguish high intensity explosions and fires.
This section also identifies potential licensee and partnership targets by examining highly competitive and well positioned firms within the fire suppression industry. Also considered is the Fast Flow Nozzle’s ability to be seamlessly implanted into existing product lines.
• The need for additional testing to verify its suitability for use on various types of fires;
Conclusion
In closing, this market overview identifies several go-to-market needs of the Fast Flow Nozzle including:
• The need for faster suppression of particularly aggressive fires; and • The need for a procurement strategy of a suitable and cost-effective gas generator unit
That said, the advantages of the Fast Flow Nozzle may provide the impetus to resolve the go-to-market needs, particularly in a military fire emergency. The key advantage that the Fast Flow Nozzle provides is the ability to suppress a fire in 10-15 milliseconds, versus 35 milliseconds for the currently fielded systems, which may provide enhanced suppression capabilities in applications such as munitions manufacturing where lag time between a fire or explosion initiation and suppression response may be critical in mitigating damage or loss of life.
Ultimately, market penetration for the Fast Flow Nozzle may hinge largely on the ability of prospective licensees to procure a suitable gas generator component that does not price the unit out of the appropriate market for fire suppression systems. Additionally, targeting prospective licensees or partners that have established paths to market in terms of sales and distribution channels, as well as an established and highly regarded foot in the market may work to enhance market penetration strategies. As claimed performance greatly surpasses that of currently commercialized systems, initial, and subsequently wider, adoption of the Fast Flow Nozzle may depend on the ability to develop a comprehensive system that falls in line with prospective end user purchasing capacity.
Distribution Statement A: Approved for Public Release; Distribution Unlimited

8
1 Introduction
A Fast Response Fluid Flow Control Valve/Nozzle (Fast Flow Nozzle) has been developed by the Naval Surface Warfare Center (NAVSEA)-Crane Division in Crane, Indiana. The Fast Flow Nozzle provides a fast-acting technology for a fire protection/suppression system to combat aggressive, fast-moving, high-temperature fires. In light of the Fast Flow Nozzle’s ease-of-use for emergency fire situations, it may provide the following advantages:
• A fast response in the rupture and flow of material (goal is <1 millisecond), • The modified nozzle sprays 300-350 GPM compared to the standard 20-25 GPM system
therefore the nozzle delivers water at fifteen times the efficiency of existing fire suppression systems,
• The technology may be retrofitted to fixed pipe systems to provide virtually unlimited extinguishing material in only 10-15 milliseconds (cutting response time in half),
• The flow rate from one nozzle is sufficient to replace up to six traditional valve heads which allows for a cost savings,
• Allows for retrofitting of existing systems, • Can achieve higher flow rate using existing piping, • Has passed testing by the Navy at Crane lab, • Strength and durability to perform in fire situations, • The nozzle is a high value product with a low lifetime cost, and • The portable system prototype is more convenient and affordable than current fire
suppression systems.
In addition to examining the Fast Flow Nozzle’s key components and operation, and how the advantages may be achieved, this assessment provides an overview of the potential opportunity within the military and civilian markets. This report is broken down as follows:
• Technical Synopsis and Applications • Markets • Competitive Synopsis • Cautions and Considerations
Ultimately, the Fast Flow Nozzle is designed to facilitate emergency fire response in civilian and military situations. Based on the data examined, indicators appear positive but are matched by several go-to-market needs including the procurement of a cost-effective gas generator component. It is important to note that this analysis is not undertaken in an effort to dictate
Distribution Statement A: Approved for Public Release; Distribution Unlimited

9
commercialization strategies or to recommend a specific market application. Rather, a general overview of the Fast Flow Nozzle’s functionality and the markets to which it may enter are provided for further strategic analysis.
Distribution Statement A: Approved for Public Release; Distribution Unlimited

10
2 Technical Synopsis
A Fast Response Fluid Flow Control Valve/Nozzle (Fast Flow Nozzle) has been developed by the Naval Surface Warfare Center (NAVSEA)-Crane Division in Crane, Indiana. The Fast Flow Nozzle provides a fast response fluid flow control valve/nozzle for use in high-speed, high-temperature fire protection/suppression systems of the type having an essentially unlimited supply of fire extinguishing/suppressing materials. This technology provides a fast response fluid flow control valve/nozzle with a frangible, or easily broken, element that will not the flow of the fire extinguishing/suppressing materials after the system is activated.
2.1 Major Components and Operational Specifications1
Figure 1 is a side cross-sectional view while Figure 2 is an exploded view of a fast response fluid flow control valve/nozzle. Table 1 gives the names of the components and corresponding figure numbers in the diagrams of Figure 1 and Figure 2.
As shown in Figure 2, the frangible disk 40 is preferably a rupture disc assembly commercially available from the Oklahoma Safety Equipment Company (OSECO) of Broken Arrow, OK. The disc assembly 40 generally comprises a stainless steel spherically curved disc 42 and a base 41 formed from two stainless steel rings 44, 45. The rings 44, 45 and disc 42 are fixedly attached (e.g., welded) in order to form the finished assembly 40. The disc assembly is designed to rupture at a pressure of 300 psi (OSECO’s disc design provides for rupture pressures from 160 to 4,000 psi as specified). Ring 44 includes an o-ring groove 46 to assist in providing a water-tight seal between the disc assembly 40 and the jet core 30.
Figure 3 and Figure 4 gives a detailed view of the chamber base. Table 2 gives the names of the components and corresponding figure numbers in the diagrams of Figure 3 and Figure 4. The chamber base 20 comprises a base and outer walls of a chamber 21 of varying diameters, internal threads 22A at one end, internal threads 22B and external threads 23 at the opposite end, an actuator mounting port 24, an air bleed port 26, a plurality of key pin holes 29 formed in the end 28 proximate the external threads 23, and an o-ring groove 34. The actuator mounting port 24 and the air bleed port 26 are in fluid communication with the internal chamber 21 and positioned 180E apart on the external surface near the end with the internal threads 22A. The internal threads 22A represent the means (i.e. a fire suppressant inlet port 80, as in Figure 1) for creating a threaded connection between the valve/nozzle 10 a typical high-speed fire protection/suppression piping system. A hexagonal cross-section 25 is formed in the external surface of the chamber base 20, at the end that includes the internal threads 22A, to further facilitate the making of the aforementioned threaded connection. The chamber base 20 is
1 Ahlers, Jeffrey, “Fast Response Fluid Flow Control Valve/Nozzle,” U.S. Patent 6,907,940 B1 June 21, 2005.
Distribution Statement A: Approved for Public Release; Distribution Unlimited
11
preferably fabricated of commercially available, round stainless steel stock. Other strong and light-weight materials, such as titanium, may also be used for construction of the chamber base.
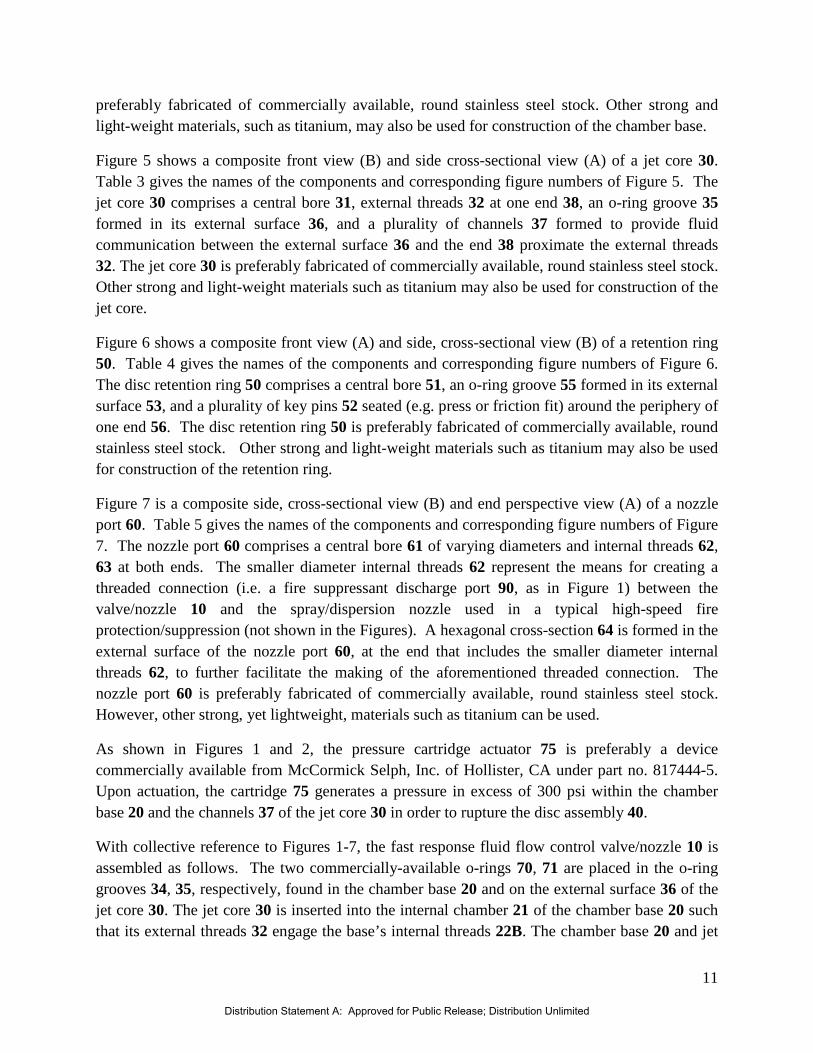
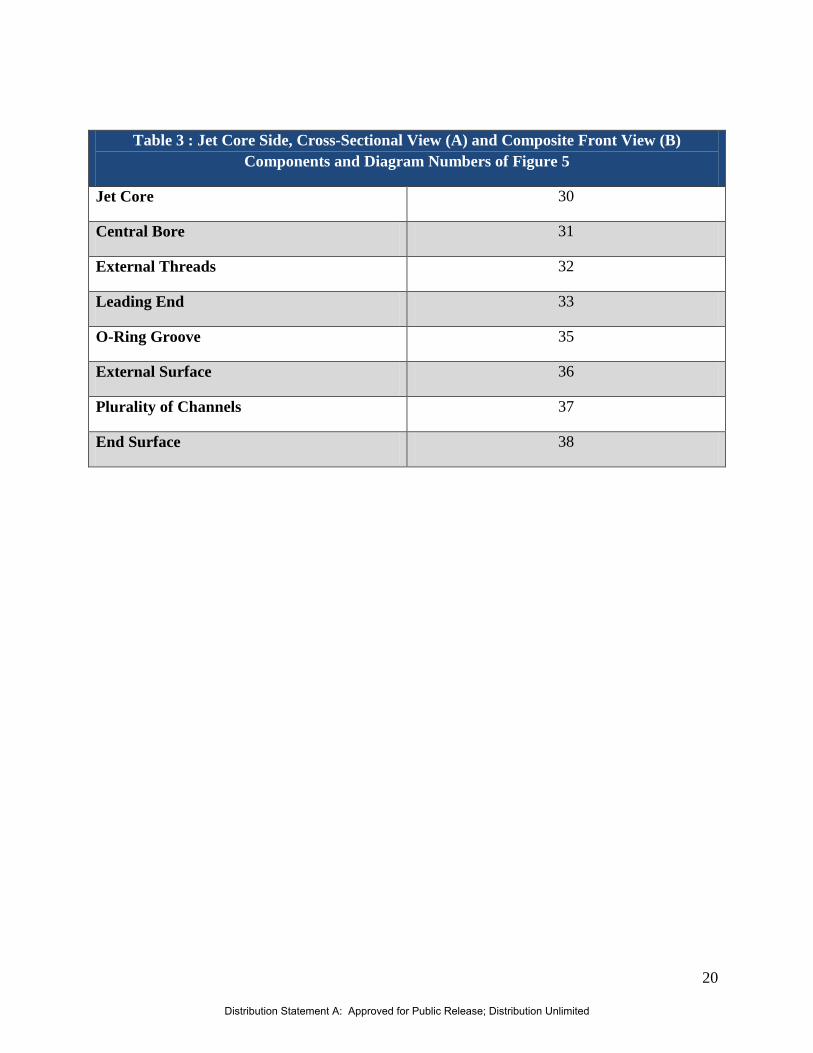
Figure 5 shows a composite front view (B) and side cross-sectional view (A) of a jet core 30. Table 3 gives the names of the components and corresponding figure numbers of Figure 5. The jet core 30 comprises a central bore 31, external threads 32 at one end 38, an o-ring groove 35 formed in its external surface 36, and a plurality of channels 37 formed to provide fluid communication between the external surface 36 and the end 38 proximate the external threads 32. The jet core 30 is preferably fabricated of commercially available, round stainless steel stock. Other strong and light-weight materials such as titanium may also be used for construction of the jet core.
Figure 6 shows a composite front view (A) and side, cross-sectional view (B) of a retention ring 50. Table 4 gives the names of the components and corresponding figure numbers of Figure 6. The disc retention ring 50 comprises a central bore 51, an o-ring groove 55 formed in its external surface 53, and a plurality of key pins 52 seated (e.g. press or friction fit) around the periphery of one end 56. The disc retention ring 50 is preferably fabricated of commercially available, round stainless steel stock. Other strong and light-weight materials such as titanium may also be used for construction of the retention ring.
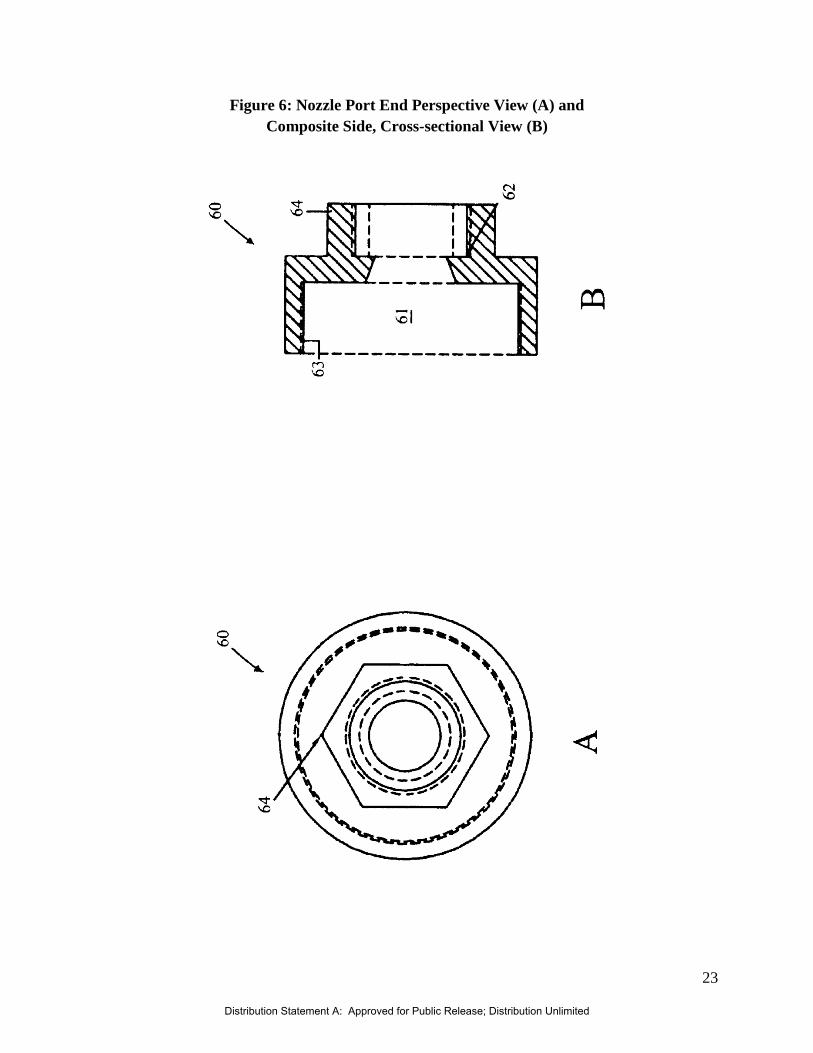
Figure 7 is a composite side, cross-sectional view (B) and end perspective view (A) of a nozzle port 60. Table 5 gives the names of the components and corresponding figure numbers of Figure 7. The nozzle port 60 comprises a central bore 61 of varying diameters and internal threads 62, 63 at both ends. The smaller diameter internal threads 62 represent the means for creating a threaded connection (i.e. a fire suppressant discharge port 90, as in Figure 1) between the valve/nozzle 10 and the spray/dispersion nozzle used in a typical high-speed fire protection/suppression (not shown in the Figures). A hexagonal cross-section 64 is formed in the external surface of the nozzle port 60, at the end that includes the smaller diameter internal threads 62, to further facilitate the making of the aforementioned threaded connection. The nozzle port 60 is preferably fabricated of commercially available, round stainless steel stock. However, other strong, yet lightweight, materials such as titanium can be used.
As shown in Figures 1 and 2, the pressure cartridge actuator 75 is preferably a device commercially available from McCormick Selph, Inc. of Hollister, CA under part no. 817444-5. Upon actuation, the cartridge 75 generates a pressure in excess of 300 psi within the chamber base 20 and the channels 37 of the jet core 30 in order to rupture the disc assembly 40.
With collective reference to Figures 1-7, the fast response fluid flow control valve/nozzle 10 is assembled as follows. The two commercially-available o-rings 70, 71 are placed in the o-ring grooves 34, 35, respectively, found in the chamber base 20 and on the external surface 36 of the jet core 30. The jet core 30 is inserted into the internal chamber 21 of the chamber base 20 such that its external threads 32 engage the base’s internal threads 22B. The chamber base 20 and jet
Distribution Statement A: Approved for Public Release; Distribution Unlimited

12
core 30 are thus screwed together until the smaller o-ring 70 engages the leading end 33 of the jet core 30 and the larger o-ring 71 engages an angled internal surface 27A of the base 20. The base 41 of the disc assembly 40 is placed in position against an internal face 54 of the retention ring 50 such that its spherical surface 42 curves toward the face 54. O-rings 72, 73 are placed in grooves 55, 46, respectively. The combination of retention ring 50, disc assembly 40, and o-rings 72, 73 is attached in a releasable manner to the previously created sub-assembly of the chamber base 20 and jet core 30 by aligning and engaging the plurality of key pins 52 on the retention ring 50 with the plurality of holes 29 formed in the chamber base 20. The joining of these components serve to compress o-ring 73 within groove 46 against end surface 38 of the jet core 30 and to engage o-ring 72 with an internal surface 27B of the chamber base 20, thereby trapping the disc assembly 40 between the core 30 and the ring 50. The nozzle port 60 is attached to the resulting sub-assembly by engaging internal threads 63 of the nozzle port 60 with the external threads 23 of the chamber base 20. Finally, the cartridge actuator 75 is attached in a releasable manner to the chamber base 20 via the internal threads 76 located within the mounting port 24.
The operation of the valve/nozzle 10, after its installation in a typical fixed pipe high-speed fire protection/suppression system, once any trapped air is removed from the chamber through bleed port 26 (a conventional bleeder valve can be used for this purpose but is not shown in the Figures), is as follows. The valve/nozzle assembly 10 contains an internal chamber 12 that is pressurized to more than 300 psi by the initiation of the cartridge actuator 75 upon the detection of a fire/explosion. The pressure wave created by the actuator’s initiation is directed through the channels 37 and against the underside (i.e. convex) surface 42 of the frangible disc 40 in order to rupture the disc 40 and release the fire extinguishing/suppressing material that enters through inlet port 80 and exits through a dispensing nozzle attached to the discharge port 90.
As is readily perceived in the foregoing description, the fast response fluid flow control valve/nozzle 10 of the present invention combine the technology used to rupture the frangible discs found in container-based fire protection/suppression systems with that found in fixed pipe, high-speed spray/sprinkler systems. The present invention applies over-pressurization technology to a significantly smaller chamber 12 contained within the fast response fluid control valve/nozzle 10 that is virtually isolated from the essentially unlimited supply of fire extinguishing/suppressing material. The design of the valve/nozzle 10 directs the over-pressurization created in the chamber 12 through the channels 37 in the jet core 30 to create a small, localized pressure wave on the underside of the frangible disc assembly 40. The pressure wave is, due to its localized nature, sufficient to rupture the disc assembly 40 in an extremely rapid manner without generating any flow disrupting back pressure that would delay the discharge of the fire extinguishing/suppressing material through the fast response fluid flow
Distribution Statement A: Approved for Public Release; Distribution Unlimited

13
control valve/nozzle 10. The present invention is scalable to provide for use in a variety of applications, fabricated of materials that provide the durability/longevity required by the nature of its use, capable of being retrofitted to existing fixed pipe fire protection/suppression systems, and economical to manufacture in order to provide for widespread use.
Distribution Statement A: Approved for Public Release; Distribution Unlimited

14
Figure 1: Side Crossectional-View of Fast Response Fluid Flow Control Valve/Nozzle
Distribution Statement A: Approved for Public Release; Distribution Unlimited

15
Figure 2: Exploded View of Fast Response Fluid Flow Control Valve/Nozzle
Distribution Statement A: Approved for Public Release; Distribution Unlimited

16
Table 1 : Fast Response Fluid Flow Control Valve/Nozzle Components and Diagram Numbers of Figures 1 and 2
Fast Response Fluid Flow Control Valve/Nozzle
10
Chamber Base 20
Jet Core 30
Channel 37
Frangible Disc 40
Base 41
Stainless Steel Spherically Curved Disc 42
Stainless Steel Ring 44
Stainless Steel Ring 45
O-Ring Groove (to provide a water-tight seal between the disc assembly and the jet core)
46
Disc Retention Ring 50
Nozzle Port 60
Plurality of O-Rings 70-73
Pressure Cartridge 75
Fire Suppressant Inlet Port 80
Distribution Statement A: Approved for Public Release; Distribution Unlimited

17
Figure 3: Detailed View of Chamber Base
Figure 4: Detailed View of Chamber Base
Distribution Statement A: Approved for Public Release; Distribution Unlimited

18
Table 2: Detailed View of Chamber Base Components and Diagram Numbers of Figures 3 & 4
Chamber Base 20
Base and Outer Walls of an Internal Chamber with Varying Diameters
21
Internal Threads 22A
Internal Threads 22B
External Threads 23
Actuator Mounting Port 24
Hexagonal Cross-section 25
Air Bleed Port 26
Angled Internal Surface 27A
A Plurality of Key Pin Holes 29
End 28
O-ring Groove 34
Internal Threads 76
Distribution Statement A: Approved for Public Release; Distribution Unlimited

19
Figure 4: Jet Core Side, Cross-Sectional View (A) and Composite Front View (B)
Distribution Statement A: Approved for Public Release; Distribution Unlimited
20
Table 3 : Jet Core Side, Cross-Sectional View (A) and Composite Front View (B) Components and Diagram Numbers of Figure 5
Jet Core 30
Central Bore 31
External Threads 32
Leading End 33
O-Ring Groove 35
External Surface 36
Plurality of Channels 37
End Surface 38
Distribution Statement A: Approved for Public Release; Distribution Unlimited

21
Figure 5: Retention Ring Composite Front View (A) and Side, Cross-sectional View (B)
Distribution Statement A: Approved for Public Release; Distribution Unlimited

22
Table 4: Retention Ring Composite Front View (A) and Side, Cross-sectional View (B) Components and Diagram Numbers of Figure 6
Retention Ring 50
Central Bore 51
External Surface 53
Plurality of Key Pins 52
O-Ring Groove 55
Internal Face 54
End 56
Distribution Statement A: Approved for Public Release; Distribution Unlimited
23
Figure 6: Nozzle Port End Perspective View (A) and Composite Side, Cross-sectional View (B)
Distribution Statement A: Approved for Public Release; Distribution Unlimited
24
Table 5: Nozzle Port End Perspective View (A) and Composite Side, Cross-sectional View (B) Components and Diagram Numbers of Figure 7
Nozzle Port 60
Central Bore of Varying Diameter 61
Smaller Diameter Internal Threads 62
Internal Threads 63
Hexagonal Cross-section 64
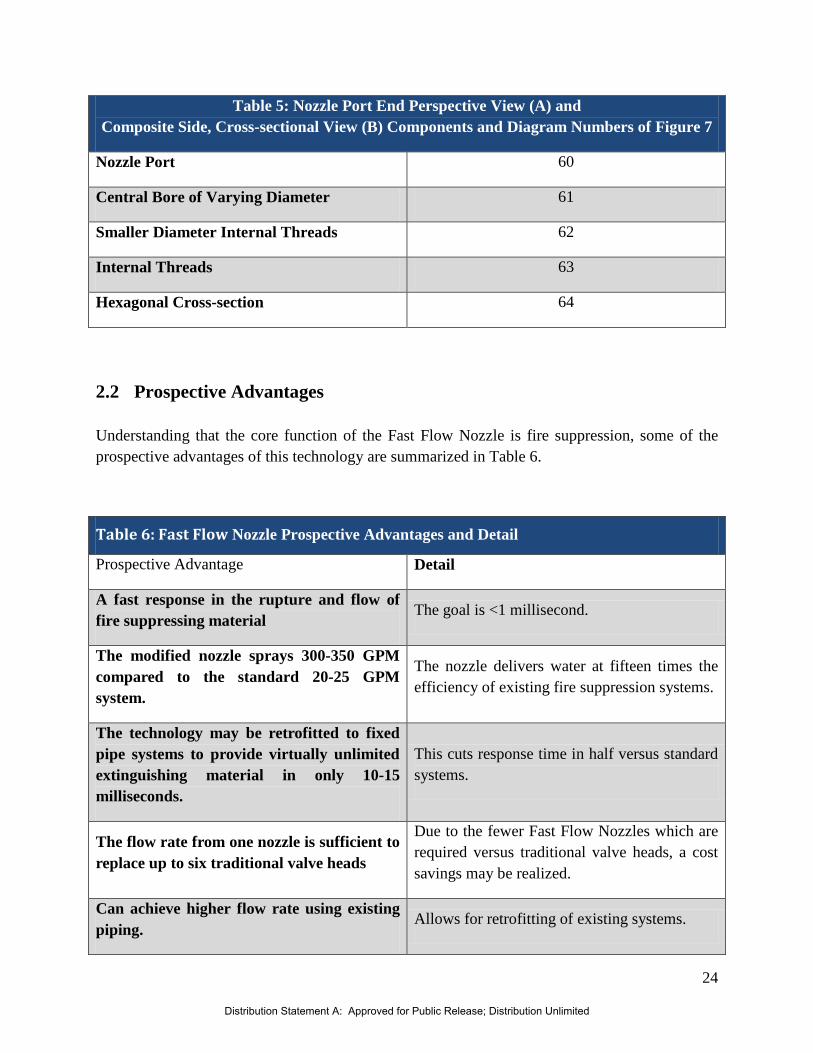
2.2 Prospective Advantages
Understanding that the core function of the Fast Flow Nozzle is fire suppression, some of the prospective advantages of this technology are summarized in Table 6.
Table 6: Fast Flow Nozzle Prospective Advantages and Detail
Prospective Advantage Detail
A fast response in the rupture and flow of fire suppressing material
The goal is <1 millisecond.
The modified nozzle sprays 300-350 GPM compared to the standard 20-25 GPM system.
The nozzle delivers water at fifteen times the efficiency of existing fire suppression systems.
The technology may be retrofitted to fixed pipe systems to provide virtually unlimited extinguishing material in only 10-15 milliseconds.
This cuts response time in half versus standard systems.
The flow rate from one nozzle is sufficient to replace up to six traditional valve heads
Due to the fewer Fast Flow Nozzles which are required versus traditional valve heads, a cost savings may be realized.
Can achieve higher flow rate using existing piping.
Allows for retrofitting of existing systems.
Distribution Statement A: Approved for Public Release; Distribution Unlimited
25
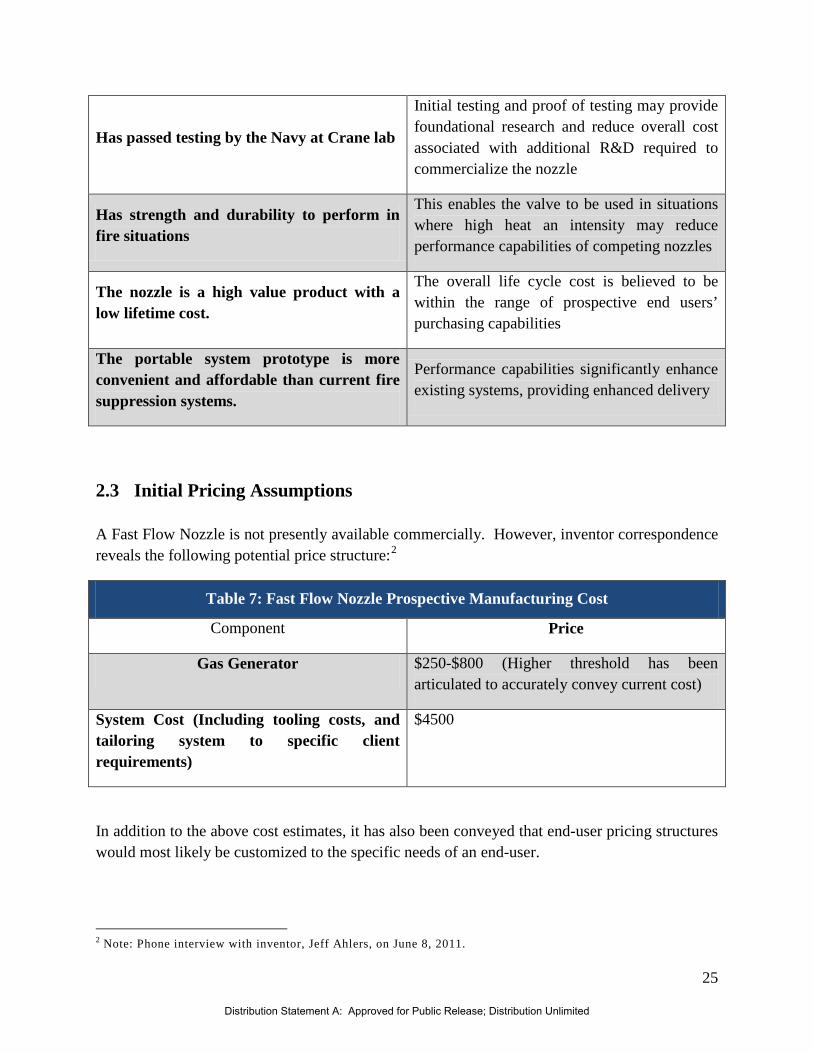
Has passed testing by the Navy at Crane lab
Initial testing and proof of testing may provide foundational research and reduce overall cost associated with additional R&D required to commercialize the nozzle
Has strength and durability to perform in fire situations
This enables the valve to be used in situations where high heat an intensity may reduce performance capabilities of competing nozzles
The nozzle is a high value product with a low lifetime cost.
The overall life cycle cost is believed to be within the range of prospective end users’ purchasing capabilities
The portable system prototype is more convenient and affordable than current fire suppression systems.
Performance capabilities significantly enhance existing systems, providing enhanced delivery
2.3 Initial Pricing Assumptions
A Fast Flow Nozzle is not presently available commercially. However, inventor correspondence reveals the following potential price structure:2
Table 7: Fast Flow Nozzle Prospective Manufacturing Cost
Component Price
Gas Generator $250-$800 (Higher threshold has been articulated to accurately convey current cost)
System Cost (Including tooling costs, and tailoring system to specific client requirements)
$4500
In addition to the above cost estimates, it has also been conveyed that end-user pricing structures would most likely be customized to the specific needs of an end-user.
2 Note: Phone interview with inventor, Jeff Ahlers, on June 8, 2011.
Distribution Statement A: Approved for Public Release; Distribution Unlimited
26
That said, this assessment will move to identify the markets for which the Fast Flow Nozzle may have the greatest market relevance and evaluate potential market opportunity that may exist for fire protection/suppression products such as the Fast Flow Nozzle.
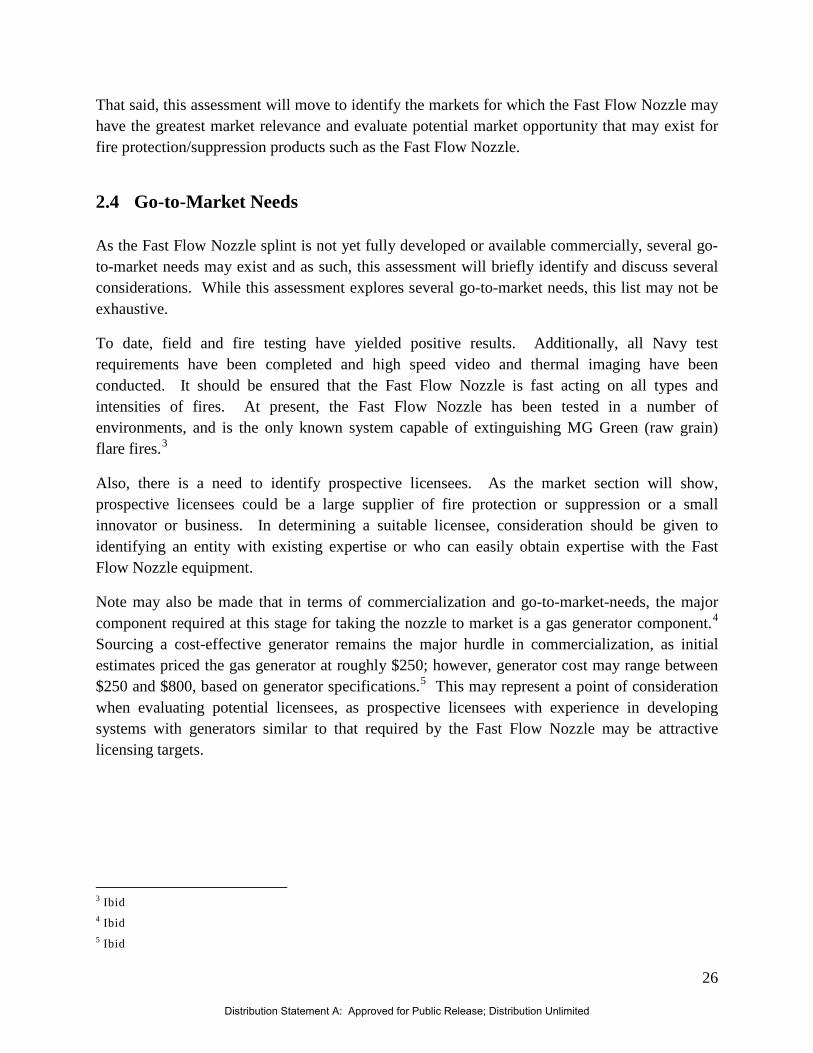
2.4 Go-to-Market Needs
As the Fast Flow Nozzle splint is not yet fully developed or available commercially, several go-to-market needs may exist and as such, this assessment will briefly identify and discuss several considerations. While this assessment explores several go-to-market needs, this list may not be exhaustive.
To date, field and fire testing have yielded positive results. Additionally, all Navy test requirements have been completed and high speed video and thermal imaging have been conducted. It should be ensured that the Fast Flow Nozzle is fast acting on all types and intensities of fires. At present, the Fast Flow Nozzle has been tested in a number of environments, and is the only known system capable of extinguishing MG Green (raw grain) flare fires.3
Note may also be made that in terms of commercialization and go-to-market-needs, the major component required at this stage for taking the nozzle to market is a gas generator component.
Also, there is a need to identify prospective licensees. As the market section will show, prospective licensees could be a large supplier of fire protection or suppression or a small innovator or business. In determining a suitable licensee, consideration should be given to identifying an entity with existing expertise or who can easily obtain expertise with the Fast Flow Nozzle equipment.
4 Sourcing a cost-effective generator remains the major hurdle in commercialization, as initial estimates priced the gas generator at roughly $250; however, generator cost may range between $250 and $800, based on generator specifications.5
3 Ibid 4 Ibid 5 Ibid
This may represent a point of consideration when evaluating potential licensees, as prospective licensees with experience in developing systems with generators similar to that required by the Fast Flow Nozzle may be attractive licensing targets.
Distribution Statement A: Approved for Public Release; Distribution Unlimited
27
3 Applications and Markets
Applications
This assessment understands the core application of the Fast Flow Nozzle to be civilian and military high-speed, high-temperature fire protection/suppression markets.
The civilian or military applications could be for existing fixed pipe system retrofits, new pipe systems, or portable systems. Situations in which the higher flow rates and improved rupture times are particularly applicable include for protection against explosives and energetics local fires.
While it is understood that this is the main application for the Fast Flow Nozzle, this assessment will work to uncover additional markets for which other applications may exist.
• Civilian Market
Markets
Recognizing the core applications of the Fast Flow Nozzle to reside primarily within the civilian and military high-speed, high-temperature fire protection/suppression markets, these are primary markets which may benefit from said application.
Therefore primary markets for this assessment are:
• Military Market
These markets are defined and quantified, and market drivers and influences are examined. Emphasis is placed on markets within the United States, as initial points of entry will likely be domestic.
Prior to an examination of the civilian and military markets in isolation, it may serve well to take a broad perspective of the overall fire suppression systems market. A report released by Global Industry Analysis estimates that the market for fire suppression systems in North America and Europe will grow to $1.6 billion dollars by 2014.6 Rising levels of industrial investment and greater safety requirements and technological advances are said to drive sustained growth in this market. The report also makes note that technologies that work to optimize effectiveness and environmental impact may be favorable to the market as new “green” systems are developed and integrated into suppression platforms.7
6 "Fire Suppression Systems Market to Reach $1.6 Billion by 2014, According to New Report by Global Industry
Analysts." PR Web. Vocus PRW Holdings, LLC, 17 Feb 2009. Web 7 Ibid
Distribution Statement A: Approved for Public Release; Distribution Unlimited

28
An additional report released by Frost and Sullivan entitled North American Fire Suppression Systems Market projects that the North American market for fire suppression systems is expected to grow from $591 million in 2005 to roughly $955 million in 2013, with a compound annual growth rate of 5.6%.8
Figure 7: North American Fire Suppression System Market 2005-2013
The graph below articulates the North American revenue projections outlined by Frost & Sullivan:
In addition to new building construction and renovation projects, the report also cites security concerns for commercial and industrial sites as a driving force in the market growth for fire suppression systems. In addition to traditional sprinkler systems, industrial applications for manufacturing may work to drive market growth in a positive manner.9
8 "New Building Construction and Renovation Projects Drive North American Fire Suppression Systems."Frost &
Sullivan. Frost & Sullivan, 31 Mar 2008. Web. 9 Ibid
One point of consideration within the context of this assessment may be that while neither of the reports discussed above break the market down by civilian and military consumption, it is understood that overall revenues reviewed account for both.
Moving forward, this assessment will work to delineate the civilian and military markets by way of definition and quantification.
2005 2006 2007 2008 2009 2010 2011 2012 2013Revenues 591. 653. 690. 728. 769. 812. 858. 906. 954.
0.0
200.0
400.0
600.0
800.0
1000.0
1200.0
Rev
enu
es (
mil
lion
s)
North American Fire Suppression Systems Market Projections, 2005-2013
Distribution Statement A: Approved for Public Release; Distribution Unlimited
29
3.1 Civilian
3.1.1 Civilian Market Definition and Quantification
As noted above, market revenue breakdowns for the civilian versus the military market have thus far been elusive; however, an indirect quantification of each market may work to build an understanding of market potential that may exist for the Fast Flow Nozzle. While it is understood that the Fast Flow Nozzle may be considered a niche technology within the fire suppression systems market, this assessment will work to target those segments within which the nozzle may hold most market relevance.
As briefly noted above, the North American fire suppression systems market is witnessing significant growth due to increased activity in the construction sector. Economic conditions are likely to favor an already upbeat construction market, further driving retrofits such as the high flow system technology. Both new building construction and retrofits of existing buildings have remained buoyant, mostly driven by code compliance, thus positively impacting revenue growth.10
report on New Residential Construction for March 2011 Recently, the U.S. Census Bureau and U.S. Department of Housing and Urban
Development (HUD) issued its showing a 5.7 percent increase in single-family home building permits from the month before, and a 7.7 percent increase in new home starts compared to the month before.11
The North American and European markets for fire suppression systems are expected to grow to $1.6 billion dollar through 2014.
12 Also, if the government commits to modernizing the fire safety regulations, both fire detection and fire suppression markets will experience growth in demand, revenues, and competition.13
The sectors within this market include water-based suppression systems including sprinkler systems and water-mist systems, gaseous fire suppression systems including carbon dioxide systems, halocarbon (chemical) systems, inert gas systems, and special fire suppression systems
10 “North American Fire Suppression Systems Markets,”
http://www.marketresearch.com/product/display.asp?productid=1590690&xs=r&SID=42418400-491214309-
532681989&curr=USD&kw=&view=abs, Oct. 2007 11 Norman, D., “New Home Construction Activity Increases in March,” /, April 19, 2011. 12 "Fire Suppression Systems Market to Reach $1.6 Billion by 2014, According to New Report by Global Industry
Analysts." PR Web. Vocus PRW Holdings, LLC, 17 Feb 2009. Web 13 “Fire Detection and Suppression Markets in Russia Fired Up by the Progress Made in the Industrial Sector,
Frost & Sullivan” http://www.frost.com/prod/servlet/press-release.pag?docid=206356494, July. 2010.
Distribution Statement A: Approved for Public Release; Distribution Unlimited
30
including foam systems and dry/wet chemical systems.14
• Manufacturing
These systems work to mitigate the loss of human and physical capital by suppressing fires and explosions.
The main segments examined in this assessment are:
• Nuclear Facilities • Offshore Oil Production Facilities
3.1.1.1 Manufacturing
The U.S. Chemical Safety Board (CSB) is an independent federal agency that investigates chemical and industrial accidents with the objective of protecting workers, the public, and the environment. CSB investigates industrial disasters associated with chemical and general manufacturing explosions and fires. 15 At present, the CSB has completed a total of 65 investigations and is currently investigating 18 industrial disasters.16 While the occurrence of these disasters may drive the market demand for systems that work to mitigate the damage caused in the event of such incidences, identifying and quantifying the number of industrial establishments that may experience such events may shed light on a prospective pool of end users for technologies such as the Fast Flow Nozzle. The chart below articulates the types of arms manufacturers in the United States and select data for each North American Industry Classification System code (NAICS). It should be noted that one additional category that may represent a potential end-user for fire suppression technologies may be fireworks manufacturers. The NAICS classifies this group under code 325998, All Other Miscellaneous Chemical Product and Preparation Manufacturing.17 As such, this assessment will not attempt to quantify the fireworks industry based on vague NAICS data, but will rather posit that fireworks manufactures may constitute an end-user, and as such may warrant further exploration. The following chart articulates select NAICS codes and corresponding data: 18
14 “North American Fire Suppression Systems Markets,”
h
ttp://www.marketresearch.com/product/display.asp?productid=1590690&xs=r&SID=42418400-491214309-
532681989&curr=USD&kw=&view=abs, Oct. 2007 15 "Complete Investigations." CSB. U.S. Chemical Safety Board, 2011. Web.
<http://www.csb.gov/investigations/investigations.aspx?Type=2&F_All=y>. 16 Ibid 17 "NAICS 332992." U.S. Census Bureau. U.S. Census Bureau, 03 May 2011. Web. 18 "American FactFinder." U.S. Census Bureau. U.S. Census Bureau, 03 May 2011. Web. 29 Jun 2011.
Distribution Statement A: Approved for Public Release; Distribution Unlimited

31
Table 8: NAICS 32-33, Explosives and Ammunition 2007 Economic Census19
2007 NAICS code
Definition Companies Number of establishments
Number of employees
325920 Explosives manufacturing
56 83 6,532
332992 Small arms ammunition manufacturing
102 105 9,427
332993 Ammunition (except small arms) manufacturing
36 44 5,677
332994 Small arms manufacturing
210 222 10,774
Additionally, the NAICS classifications of fabricated metal manufacturing may first be used to quantify the fabricated metal producing subsector of the civilian market. This market sector may be important due to the fact that the fabricated metal industry may be used to forge, stamp, bend, form and assist in the production of machines used to shape individual pieces of metal, such as in welding and assembly. Additionally, metal manufacturers may reveal a pertinent quantification within the fire suppression systems sector for health and safety reasons. Fabricated Metal Manufacturing as defined by the NAICS is the ability to transform metal into intermediate or end products, other than machinery, computers and electronics and metal furniture, or to treat metals and metal formed products fabricated elsewhere. The table relays the U.S. Census Bureau’s most recent released count of fabricated metals manufacturing.
Table 9: NAICS 331 Fabricated Metal Manufacturing, 2007 Economic Census20
2007 NAICS code Definition
Number of establishments
Annual payroll
($1,000) Number of employees
331111 Iron and steel mills 352 7,123,603 106,312
331112 Electrometallurgical ferroalloy product manufacturing 20 113,198 2,144
19 "2007 Economic Census." U.S. Census Bureau 15 apr 2011:. Web. 20 Ib
Distribution Statement A: Approved for Public Release; Distribution Unlimited

32
331221 Rolled steel shape manufacturing 150 529,205 10,402
331312 Primary aluminum production 48 524,260 9,167
331315 Aluminum sheet, plate, and foil manufacturing 116 1,024,654 17,540
331316 Aluminum extruded product manufacturing 197 899,515 23,113
331411 Primary smelting and refining of copper 10 100,483 1,732
331419 Primary nonferrous metal, except Cu and Al 182 501,530 8,645
331511 Iron foundries 468 2,458,798 51,309
331512 Steel investment foundries 134 709,742 16,650
331513 Steel foundries (except investment) 222 778,698 17,920
331521 Aluminum die-casting foundries 295 1,193,887 28,101
331522 Nonferrous (except aluminum) die-casting foundries 162 281,841 6,786
331524 Aluminum foundries (except die-casting) 497 866,336 22,116
331525 Copper foundries (except die-casting) 239 266,201 6,953
331528 Other nonferrous foundries (except die-casting) 122 234,688 5,295
Most recent data for the U.S. Census Bureau reveals market quantification of various types of metals’ establishments and facilities. A direct quantification of prospective deployment locales within subsectors categorized as foundries may be particularly relevant for a fire suppression
Distribution Statement A: Approved for Public Release; Distribution Unlimited

33
system. Fabricated metal manufacturers were tabulated above to include: foundries, mills, wire drawling, refining, smelting, extrusion, shaping and rolling manufacturers or producers. Because many of these facilities employ thousands of employees, thousands of civilians at any time could be saved in the event of a industrial disaster with a sufficient fire suppression system.
3.1.1.2 Nuclear Facilities
The United States receives roughly 19.6% of its energy from nuclear power.21 Because of the potential volatility and consequences associated with attacks to nuclear facilities, it is important to ensure their safety. Physical security at nuclear power plants involves the threat of radiological threats that could directly or indirectly endanger public health and safety through exposure to radiation. In addition to preventing possible exposure of the public to fatal doses of radiation, nuclear site security requirements aim to prevent other acts of terrorism, including cyber attacks.22
Nuclear plant security measures are designed to protect three primary areas of vulnerability within three zones:
Even though nuclear facilities pose catastrophic consequences in the event of an attack, they are inherently different from other manufacturing facilities that may find use with a technology like the Fast Flow Nozzle. Nuclear facilities are not accessible to the public and entry likely requires very strict security checks and requirements. However, because these sites are potentially very large in size and complexity, with only a small security staff, a risk management and resource deployment system to efficiently organize the security activities may be beneficial.
23
• “Owner-controlled” buffer regions
Zones
• “Protected areas” – where access is restricted to a portion of plant employees and
monitored visitors
• “Vital areas” – further restricted to only some security personnel with additional barriers
and access requirements
21Laura Pierpoint, “Nuclear Power: Carbon-Free Electricity,” 1 April 2009, Web, August 2010,
<http://www.mitenergyclub.org/assets/2010/4/5/NuclearPower-EClub101-web.pdf> 22 Nuclear Power Plant Security, Web. 2010.
<http://www.nei.org/keyissues/safetyandsecurity/factsheets/powerplantsecurity/> 23 Mark Holt and Anthony Andrews, “Nuclear Power Plant Security and Vulnerability”, Congressional Research
Service, 18 March 2009.
Distribution Statement A: Approved for Public Release; Distribution Unlimited

34
• Controls on the nuclear chain reaction
Areas of vulnerability
• Cooling systems that prevent hot nuclear fuel from melting even after the chain reaction
has stopped
• Storage facilities for highly radioactive spent nuclear fuel
A fundamental concept of nuclear plant security lies in the requirements set forth by the Nuclear Regulatory Commission (NRC). This concept, referred to as the design basis threat (DBT) establishes the severity of the potential attacks that a plant’s security force must be capable of defending against. All totaled, the DBT considers 12 factors, including such aspects as an assessment of various terrorist threats, sizable explosive devices and modern weapons, attacks by persons with sophisticated knowledge of facility operations and attacks on spent fuel shipments. Note may also be made that of the above areas of vulnerability, the cooling systems that prevent nuclear fuel from melting may be the area for which the Fast Flow Nozzle may have greatest market relevance.
Given that nuclear plants are considerably less complex infrastructure sites due to the single, fixed security force and lack of public entry, it would seem reasonable to assume that security would be relatively trouble-free. However, over the past decade there have been many reports of ill-equipped and prepared security personnel at plants throughout the U.S. According to the Project on Government Oversight’s (POGO) investigation into power plant security, only one of four nuclear power plants is confident its plant could defeat a terrorist attack.24 It was determined that this lack of readiness was primarily due to the private security personnel hired to guard the facilities. According to POGO, the guards claimed that morale was low and that they are, “under-equipped, under-manned, and underpaid.” Other reports, such as the video recording released of the inattentive security officers at the Peach Bottom nuclear power plant, confirmed that there had been multiple occasions on which multiple security officers were inattentive.25
As noted previously this section, nuclear power plants account for nearly 20% of energy consumption in the U.S. This power is generated at 104 commercial power plants throughout the
While security measures have been upgraded since the attacks of September 2001 and since these reports were first released, security personnel could potentially benefit from a system that better provided them with risk management and resource allocation techniques, in addition to one that boosts the morale of the officers under its employ.
24 Project on Government Oversight, “Nuclear Power Plant Security: Voices from Inside the Fences,” 12
September 2002, Web. August 2010, < http://www.pogo.org/pogo-files/reports/nuclear-security-
safety/voices-from-inside-the-fences/> 25 Faddis.
Distribution Statement A: Approved for Public Release; Distribution Unlimited

35
country (consisting of 69 pressurized and 35 boiling water).26 Furthermore, as of June 2010, there are also 31 future power plants currently under consideration for construction throughout the United States.27
While terror events represent one potential threat to the safety of nuclear threats, natural and man-made disasters may also pose a threat to nuclear facilities. As exemplified by the Fukushima Daiichi Nuclear Power Plant Accident that was a result of both an earthquake and subsequent tsunami, nuclear facilities may be vulnerable to operational breaches due to natural disasters. According to Douglas Fynan, a nuclear engineer at the University of Michigan, “there could be significant benefit to systems which work to supply large quantities of liquid to cool spent rods, in the event of a manmade or natural disaster. While systems are currently in place, the disaster at Fukushima is an example of the need to reexamine currently commercialized systems that work to carry out this function.”
28
3.1.1.3 Oil Production
At present there are 104 commercial nuclear power plants in operation within the United States that may constitute prospective end users for a technology such as the Fast Flow Nozzle that may work to enhance cooling capabilities in the event of an unforeseen event. A listing of the nuclear power plants owned and operated in the U.S. can be found in Appendix A.
An additional segment for which the Fast Flow Nozzle may have enhanced relevance is that of oil mining and extraction. Generally speaking, oil production facilities may find use for a technology that works to mitigate risk associated with explosions and fires.
NAICS 32511, Petrochemical Manufacturing may represent an initial industry for which a technology such as the Fast Flow Nozzle may provide enhanced relevance. NAICS 32511 consists of 56 establishments in the U.S. with a total employee base of 9,229.29
NAICS
two digit 21, Mining, may be used to quantify the Crude Petroleum and Natural Gas Extraction or Natural Gas Liquid Extraction subsectors of the mining market.30
26“9: Nuclear Energy,” Annual Energy Review 2008, Energy Information Administration, Web, August 2010,
<http://www.eia.doe.gov/emeu/aer/pdf/pages/sec9.pdf> 27United States Nuclear Regulatory Commission, “Expected New Nuclear Power Plant Applications,” Updated
June, 21, 2010, <http://www.nrc.gov/reactors/new-reactors/new-licensing-files/expected-new-rx-
applications.pdf> 28 Phone interview with Douglas Fynan, June 10, 2011. Interview conducted by Jeffrey Stempka 29 "2007 Economic Census." U.S. Census Bureau 15 apr 2011:. Web. 30 "Sector 21: Mining: Geographic Area Series: Industry Statistics for the State or Offshore Areas: 2007 ." 2007
Economic Census 18 Dec. 2009: Web.
This market sector may be important due to the fact that the mining industry may be used to create, develop and establish new uses for existing energies or new energies as a whole. Mining as defined by
Distribution Statement A: Approved for Public Release; Distribution Unlimited

36
the NAICS is the ability to explore, develop and/or produce petroleum or natural gas from wells in which the hydrocarbons will initially flow or can be produced using normal pumping techniques or the production of crude petroleum from surface shales or tar sands or from reservoirs in which the hydrocarbons are semisolids.31
Table 10:Select NAICS Codes
Additionally there are over 5,920 crude petroleum and natural gas extraction mines within the United States. There are 293 Natural Gas Liquid Extraction establishments within the coastal United States. There are also 30 crude petroleum and natural gas extraction mines off the coasts belonging to the United States. The table below relays the U.S. Census Bureau’s most recent released count of Sector 21: Mining throughout the U.S. and U.S. owned mines off shore.
2007 NAICS code Meaning of 2007
NAICS code Number of
establishments
211111 Crude petroleum and natural gas extraction 5,920
211112 Natural gas liquid extraction 293
Moving forward, a direct quantification of prospective deployment locales within subsectors categorized as liquid or gas extraction may be particularly relevant as an energy source. Mining industries were tabulated above to include: Crude Petroleum and Natural Gas Extraction on land and off shore as well as Natural Gas Liquid Extraction. Most recent data for the U.S. Census Bureau reveals market quantification for different types of mine extraction, both on and off shore establishments and rigs.
That said, this assessment will briefly examine the offshore oil production industry as a prospective group of end users for the Fast Flow Nozzle. According to the Bureau of Ocean Energy Management, Regulation, and Enforcement (BOEMRE), U.S. offshore production accounted for 27% of all U.S. crude oil production and 11% of all natural gas production in 2009.32 Additionally, the Gulf of Mexico (GOM) region accounts for roughly 95% of U.S. offshore production. Further, production in deepwater regions –1,000 feet and deeper– in the GOM accounted for 74% of oil and 43% of natural gas production in the U.S. in 2009.33
31 "211111 Crude Petroleum and Natural Gas Extraction." 2007 NAICS Definitions 2010: Web.
32 "Deepwater Horizon Oil Spill Disaster: Risk, Recovery, and Insurance Implications."Congressional Research
Service. Congressional Research Service, 10 Jul 2010. Web. 33 Ibid
Distribution Statement A: Approved for Public Release; Distribution Unlimited

37
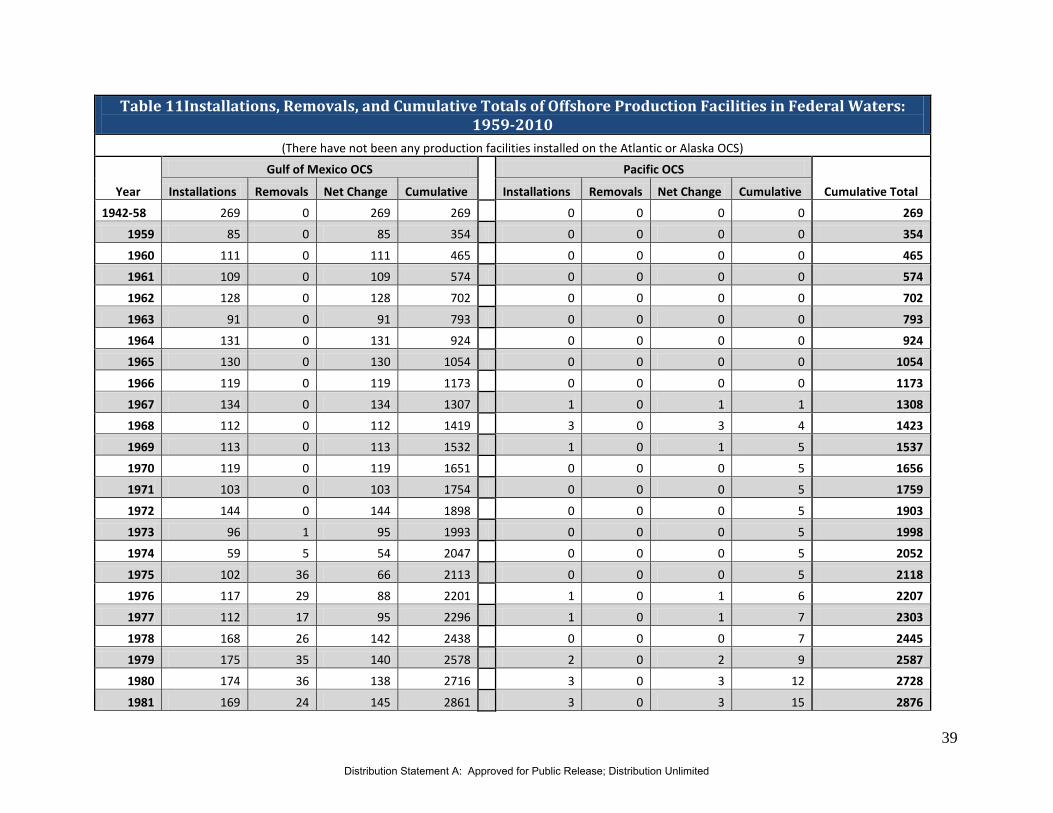
As exemplified by the Deepwater Horizon Oil Spill Disaster of 2010, explosions and fires are an ever present threat to the safety of both offshore oil personnel and for the public at large. According to a Congressional Research Service report to Congress entitled Deepwater Horizon Oil Spill Disaster: Risk, Recovery, and Insurance Implications, “the ultra-deepwater, semi-submersible mobile offshore oil rig, Deepwater Horizon experienced an explosion and fire and sank in the Gulf of Mexico off the shores of Louisiana.”34 As a result of the disaster, 11 fatalities and a number of injuries occurred. In addition to the loss of human life, an estimated 35,000-60,000 barrels of oil and gas escaped the well-head every day, compromising the ecological quality of nearby ecosystems.35 Following the explosion, an effort was undertaken to control the ensuing fire that ultimately contributed to the sinking of the structure. The primary tools used in response efforts were mainly Coast Guard vessels employed to fire large amounts of water onto the flames.36 From April 30, 2010 to August 30, 2010 a total of 58 vessels were deployed in response efforts.37 While not all of these vessels were fire suppression vessels, it is understood that an effort to extinguish the fire from the sea was undertaken following the explosion and prior to the sinking of the Deepwater Horizon. Within this prospective application, a Fast Flow Nozzle may be integrated into the fire suppression systems on board the oil facilities, or perhaps response vessels. That said, while it is not known to what extent a fire suppression system with a Fast Flow Nozzle could have worked to mitigate damage of this or similar events, this may represent an additional segment for which a technology such as the Fast Flow Nozzle may have enhanced relevance. As such, a brief quantification of the number of offshore oil and gas production facilities may work to build a picture as to potential market size for a technology like the Fast Flow Nozzle that may work to mitigate risk associated with explosions and fires within this context. The graph below articulates the cumulative total of production facilities installed in the Gulf of Mexico over the period from 1959 to 2009.38 As of 2009, there were a total of 3,560 offshore production facilities in the Gulf of Mexico. While this is a decline from a peak of 4,049 facilities in 2001, this may represent a significant pool of prospective end users for a technology that may enhance safety and response capabilities in the event of a blowout or other type of explosive event. Following this graph, a historical chart outlining the installation of offshore production facilities in both the Gulf of Mexico and the Pacific outer continental shelf (OCS) may be found.39
34
"Deepwater Horizon Oil Spill Disaster: Risk, Recovery, and Insurance Implications."Congressional Research
Service. Congressional Research Service, 10 Jul 2010. Web. 35 Ibid 36 "Deepwater Horizon Response." State Emergency Response Team, Florida. Florida Division of Emergency
Management, 02 Mar 2011. Web. 37 Ibid 38 "Deepwater Horizon Oil Spill Disaster: Risk, Recovery, and Insurance Implications."Congressional Research
Service. Congressional Research Service, 10 Jul 2010. Web. 39 Ibid
Distribution Statement A: Approved for Public Release; Distribution Unlimited

38
Figure 8: Gulf of Mexico Offshore Production Facilities 1959-2009
0
500
1000
1500
2000
2500
3000
3500
4000
4500
1942
-58
1960
1962
1964
1966
1968
1970
1972
1974
1976
1978
1980
1982
1984
1986
1988
1990
1992
1994
1996
1998
2000
2002
2004
2006
2008
Cumulative Total: Gulf of Mexico Offshore Production Facilities 1959-2009
(Facilities in Federal Waters)
Gulf of Mexico
Distribution Statement A: Approved for Public Release; Distribution Unlimited
39
Table 11Installations, Removals, and Cumulative Totals of Offshore Production Facilities in Federal Waters: 1959-2010
(There have not been any production facilities installed on the Atlantic or Alaska OCS)
Year
Gulf of Mexico OCS
Pacific OCS
Cumulative Total Installations Removals Net Change Cumulative Installations Removals Net Change Cumulative
1942-58 269 0 269 269 0 0 0 0 269
1959 85 0 85 354 0 0 0 0 354
1960 111 0 111 465 0 0 0 0 465
1961 109 0 109 574 0 0 0 0 574
1962 128 0 128 702 0 0 0 0 702
1963 91 0 91 793 0 0 0 0 793
1964 131 0 131 924 0 0 0 0 924
1965 130 0 130 1054 0 0 0 0 1054
1966 119 0 119 1173 0 0 0 0 1173
1967 134 0 134 1307 1 0 1 1 1308
1968 112 0 112 1419 3 0 3 4 1423
1969 113 0 113 1532 1 0 1 5 1537
1970 119 0 119 1651 0 0 0 5 1656
1971 103 0 103 1754 0 0 0 5 1759
1972 144 0 144 1898 0 0 0 5 1903
1973 96 1 95 1993 0 0 0 5 1998
1974 59 5 54 2047 0 0 0 5 2052
1975 102 36 66 2113 0 0 0 5 2118
1976 117 29 88 2201 1 0 1 6 2207
1977 112 17 95 2296 1 0 1 7 2303
1978 168 26 142 2438 0 0 0 7 2445
1979 175 35 140 2578 2 0 2 9 2587
1980 174 36 138 2716 3 0 3 12 2728
1981 169 24 145 2861 3 0 3 15 2876
Distribution Statement A: Approved for Public Release; Distribution Unlimited

40
1982 195 15 180 3041 0 0 0 15 3056
1983 173 38 135 3176 1 0 1 16 3192
1984 227 53 174 3350 1 0 1 17 3367
1985 215 55 160 3510 3 0 3 20 3530
1986 111 34 77 3587 1 0 1 21 3608
1987 116 23 93 3680 1 0 1 22 3702
1988 170 100 70 3750 0 0 0 22 3772
1989 197 94 103 3853 2 0 2 24 3877
1990 174 108 66 3919 0 0 0 24 3943
1991 156 117 39 3958 0 0 0 24 3982
1992 89 105 -16 3942 0 0 0 24 3966
1993 123 172 -49 3893 0 0 0 24 3917
1994 176 125 51 3944 0 1 -1 23 3967
1995 132 118 14 3958 0 0 0 23 3981
1996 153 120 33 3991 0 0 0 23 4014
1997 147 178 -31 3960 0 0 0 23 3983
1998 148 76 72 4032 0 0 0 23 4055
1999 106 145 -39 3993 0 0 0 23 4016
2000 146 142 4 3997 0 0 0 23 4020
2001 161 109 52 4049 0 0 0 23 4072
2002 102 121 -19 4030 0 0 0 23 4053
2003 121 169 -48 3982 0 0 0 23 4005
2004 124 194 -70 3912 0 0 0 23 3935
2005 100 124 -24 3888 0 0 0 23 3911
2006 111 108 3 3891 0 0 0 23 3914
2007 82 157 -75 3816 0 0 0 23 3839
2008 72 150 -78 3738 0 0 0 23 3761
2009 28 206 -178 3560 0 0 0 23 3583
Totals 6925 3365 3560 3560 24 1 23 23 3583
Distribution Statement A: Approved for Public Release; Distribution Unlimited

41
As explosion events and fires may be a serious threat to the safety of oil production facility personnel in addition to working to undermine the stability of the production structure, technologies that work to mitigate the risk associated with such events may be attractive to companies that build, own and operate these facilities. Again, while an analysis the functional integration of a technology such as the Fast Flow Nozzle into the operational aspects of offshore oil production facilities is beyond the scope of this assessment, it has been identified that high temperature explosions may be a serious consideration in these environments. As such, the Fast Flow Nozzle may represent one technology that may work to control explosions and fires in oil production facilities.
3.1.2 Civilian Market Drivers and Influences
Market drivers and influences for the civilian manufacturing and energy market may include the following:
• Increased activity in the building and construction markets and modernization of fire safety regulations
• Industrial disasters • Natural Disasters
3.1.2.1 Increased activity in the building and construction markets and modernization of fire safety regulations
With the increased activity in the building and construction markets, there is expected to be increased activity in the fire protection/suppression markets. As new structures are built, additional equipment will be necessary for fire protection/suppression. As mentioned above, the U.S. Census Bureau and U.S. Department of Housing and Urban Development (HUD) issued their report on New Residential Construction for March 2011 showing a 5.7 percent increase in single-family home building permits from the month before, and a 7.7 percent increase in new home starts compared to the month before.40
Minimum fire safety standards are established, although many municipalities choose to adopt more stringent standards arising from historic, geographic, or other conditions, if the alternative requirements result in a level of protection to life, safety, or property at a level equal to or greater than the minimum fire safety standards or requirements.
41
40 Norman, D., “New Home Construction Activity Increases in March,”
http://www.realestateindustrynews.com/real-estate-market/new-home-construction-activity-increases-in-
march/, April 19, 2011. 41 Minimum Fire Safety Standards, < http://law.onecle.com/florida/insurance/633.025.html>, March 26, 2010.
Distribution Statement A: Approved for Public Release; Distribution Unlimited
42
3.1.2.2 Industrial Disasters
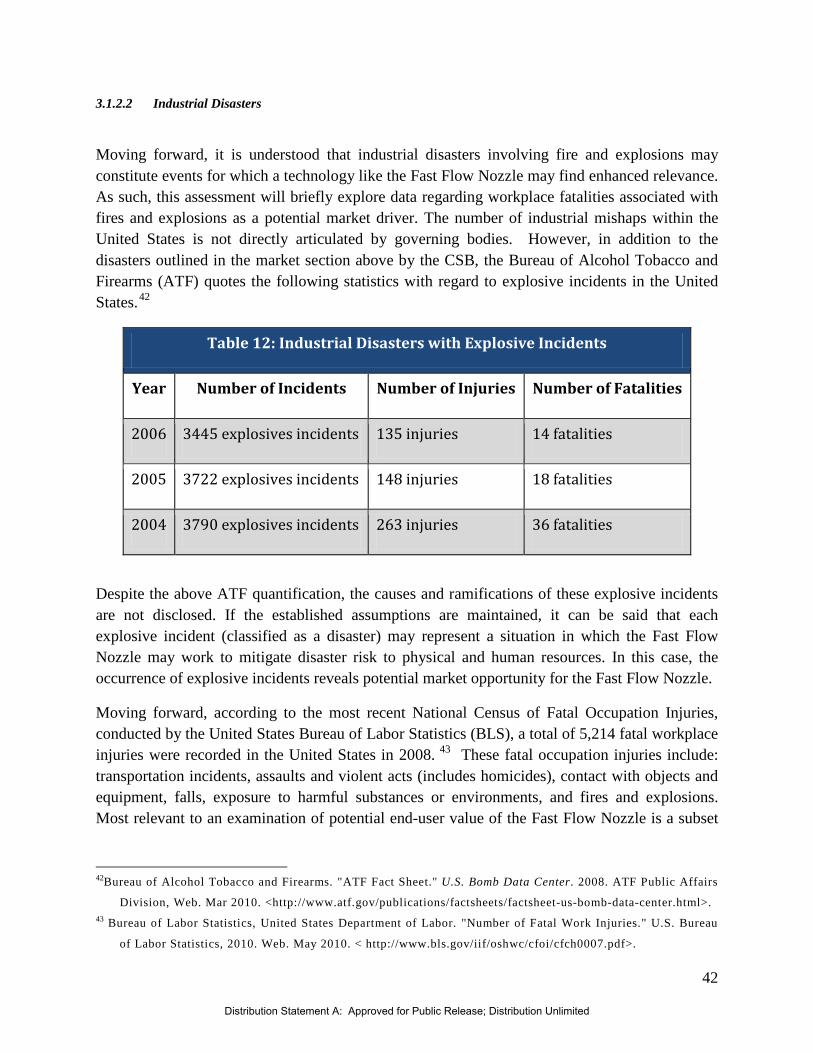
Moving forward, it is understood that industrial disasters involving fire and explosions may constitute events for which a technology like the Fast Flow Nozzle may find enhanced relevance. As such, this assessment will briefly explore data regarding workplace fatalities associated with fires and explosions as a potential market driver. The number of industrial mishaps within the United States is not directly articulated by governing bodies. However, in addition to the disasters outlined in the market section above by the CSB, the Bureau of Alcohol Tobacco and Firearms (ATF) quotes the following statistics with regard to explosive incidents in the United States.42
Table 12: Industrial Disasters with Explosive Incidents
Year Number of Incidents Number of Injuries Number of Fatalities
2006 3445 explosives incidents 135 injuries 14 fatalities
2005 3722 explosives incidents 148 injuries 18 fatalities
2004 3790 explosives incidents 263 injuries 36 fatalities
Despite the above ATF quantification, the causes and ramifications of these explosive incidents are not disclosed. If the established assumptions are maintained, it can be said that each explosive incident (classified as a disaster) may represent a situation in which the Fast Flow Nozzle may work to mitigate disaster risk to physical and human resources. In this case, the occurrence of explosive incidents reveals potential market opportunity for the Fast Flow Nozzle.
Moving forward, according to the most recent National Census of Fatal Occupation Injuries, conducted by the United States Bureau of Labor Statistics (BLS), a total of 5,214 fatal workplace injuries were recorded in the United States in 2008. 43
42Bureau of Alcohol Tobacco and Firearms. "ATF Fact Sheet." U.S. Bomb Data Center. 2008. ATF Public Affairs
Division, Web. Mar 2010. <http://www.atf.gov/publications/factsheets/factsheet-us-bomb-data-center.html>. 43 Bureau of Labor Statistics, United States Department of Labor. "Number of Fatal Work Injuries." U.S. Bureau
of Labor Statistics, 2010. Web. May 2010. < http://www.bls.gov/iif/oshwc/cfoi/cfch0007.pdf>.
These fatal occupation injuries include: transportation incidents, assaults and violent acts (includes homicides), contact with objects and equipment, falls, exposure to harmful substances or environments, and fires and explosions. Most relevant to an examination of potential end-user value of the Fast Flow Nozzle is a subset
Distribution Statement A: Approved for Public Release; Distribution Unlimited

43
of data examining fires and explosions in the work place. This data is grouped with transportation incidents resulting in worker fatality.
Transportation incidents (highway, non-highway, and pedestrians struck) constituted 2,130 of the 5,214 fatal work injuries in 2008. There were 794 assaults and violent acts in the workplace in 2008: 511 shootings, 32 stabbings, and 251 self-inflicted injuries.44 Increasingly relevant to the Fast Flow Nozzle, there were 156 workplace deaths attributed to fires and explosions in 2008.45 If the established potential relationship between ballistic threat and end-user value of the Fast Flow Nozzle’s fire and explosion mitigation capabilities are maintained, these 156 workplace deaths due to fires and explosions may serve as a market indicator. The chart below depicts the number of fatal work injuries by type.46
Figure 9: Percent Distribution, Manner in which Fatal Work Injuries Occurred: 2008
47
44Bureau of Labor Statistics, United States Department of Labor. "NATIONAL CENSUS OF FATAL
OCCUPATIONAL INJURIES IN 2008." www.bls.gov/news.release. United States Department of Labor, 20
Aug 2009. Web. May 2010. <http://www.bls.gov/news.release/pdf/cfoi.pdf> 45 Bureau of Labor Statistics, United States Department of Labor. "Fatal occupational injuries resulting from
transportation incidents and homicides by occupation, All United States, 2008." U.S. Bureau of Labor
Statistics, 2010. Web. May 2010. <http://www.bls.gov/iif/oshwc/cfoi/cftb0237.pdf>. 46 Bureau of Labor Statistics, United States Department of Labor. "Number of Fatal Work Injuries." U.S. Bureau
of Labor Statistics, 2010. Web. May 2010. < http://www.bls.gov/iif/oshwc/cfoi/cfch0007.pdf>. 47 Ibid.
Fires and Explosions
3%
Transportation Incidents
41%
Contact with Objects and Equipment
18%
Assaults and Violent Acts
17%
Falls13%
Exposure to Harmful
Substances or Environments
8%
Total = 5,214
Distribution Statement A: Approved for Public Release; Distribution Unlimited

44
According to BLS statistics, the number of deaths between 2007 and 2008 and resulted from fires and explosions increased by approximately 22 deaths.48
Additionally, it may be noted that in situations where there were multiple deaths, fires and explosions accounted for approximately 9% of the incidents.
This was one of two categories that experienced increases in the period examined, with the other being Contact with Objects and Equipment, which experienced an increase in 17 deaths over the period examined.
49
Figure 10: Percent Distribution, Manner in which Fatal Work Injuries Occurred in Multiple-Fatality Incidents: 200850
Overall, the BLS reports that 90 percent of 2008’s fatal work injuries involved workers in a private industry. 3,639 of the 5,214 fatalities were private sector wage and salary workers. 544 (approximately ten percent) of the fatalities were classed by the BLS to be government workers, and 1,031 to be self-employed workers. As with the ATF data discussed above, the causes and 48 "Number of Fatal Work Injuries, 1992-2008." Bureau of Labor Statistics. Bureau of Labor Statistics, 2009.
Web. < http://www.bls.gov/iif/oshwc/cfoi/cfch0007.pdf> 49 Ibid 50 Ibid
Distribution Statement A: Approved for Public Release; Distribution Unlimited

45
ramifications of these explosive incidents are not disclosed. Understanding that an explosion may represent a situation for which a fire suppression system may be warranted, this data may be construed to support demand for suppression systems that work to mitigate human and physical assets in such an event.
As identified above, the U.S. Chemical Safety Board (CSB) is an independent federal agency that investigates chemical and industrial accidents with the objective of protecting workers, the public, and the environment. CSB investigates industrial disasters associated with chemical and general manufacturing explosions and fires. 51 While a full list of ongoing and completed investigations may be found on the CSB’s website, examining the types of incidents that they investigate may shed light on areas for which a need for fire suppression systems may exist. The following chart details several investigations completed by the CSB:52
51
"Complete Investigations." CSB. U.S. Chemical Safety Board, 2011. Web.
<http://www.csb.gov/investigations/investigations.aspx?Type=2&F_All=y>. 52 Ibid
Distribution Statement A: Approved for Public Release; Distribution Unlimited

46
Table 13: CSB Completed Investigations
Event Location Date Accident Type (If provided) Details
Goodyear Heat Exchange Rupture Houston, TX 11-Jun-08
On June 11, 2008, one worker was killed and approximately seven others were injured, during a maintenance operation on a heat exchanger. Ammonia overpressured inside the exchanger, causing it to rupture.
Bayer CropScience Pesticide Waste Tank Explosion
Institute, WV 28-Aug-08
Chemical Manufacturing -
Fire and Explosion
Two workers were fatally injured when a waste tank containing the pesticide methomyl violently exploded, damaging a process unit at the Bayer CropScience chemical plant in Institute, West Virginia.
Xcel Energy Company Hydroelectric Tunnel Fire
Georgetown, CO 2-Oct-07 Confided Space/ Asphyxiation
On October 2, 2007, five people were killed and three others injured when a fire erupted 1,000 feet underground in a tunnel at Xcel Energy Company's hydroelectric power plant in Georgetown, Colorado, located approximately 45 miles west of Denver. The fatally injured workers were trapped deep underground during an operation to coat the inside of the tunnel with epoxy using highly flammable solvents. The tunnel is several thousand feet long and connects two reservoirs with electricity-generating turbines.
Distribution Statement A: Approved for Public Release; Distribution Unlimited

47
Veolia Environmental Services Flammable Vapor Explosion and Fire
West Carrollton, OH 4-May-09
On May 4, 2009, flammable vapors were suddenly released into the atmosphere. The vapors found an ignition source, leading to an explosion and fire that seriously injured two workers and damaged twenty residences.
ConAgra Natural Gas Explosion and Ammonia Release
Garner, NC 9-Jun-09 Flammable Vapor
On the afternoon of June 9, 2009, 4 workers were fatally injured and dozens of others were injured when an explosion occurred at the ConAgra Foods facility in Garner, North Carolina.
Kleen Energy Natural Gas Explosion
Middletown, CT 7-Feb-10 Flammable Vapor
Six workers were fatally injured during a planned work activity to clean debris from natural gas pipes at Kleen Energy in Middletown, CT. To remove the debris, workers used natural gas at a high pressure of approximately 650 pounds per square inch. The high velocity of the natural gas flow was intended to remove any debris in the new piping. During this process, the natural gas found an ignition source and exploded.
T2 Laboratories Inc. Reactive Chemical Explosion
Jacksonville, FL 19-Dec-07 Reactive Incident
On December 19, 2007, four people were killed and 13 others were transported to the hospital when an explosion occured at T2 Laboratories Inc. during the production of a gasoline additive called methylcyclopentadienyl manganese tricarbonyl.
Distribution Statement A: Approved for Public Release; Distribution Unlimited

48
Imperial Sugar Company Dust Explosion and Fire
Port Wentworth, GA 7-Feb-08 Combustible
Dust Explosion and Fire
On February 7, 2008, a huge explosion and fire occurred at the Imperial Sugar refinery northwest of Savannah, Georgia, causing 14 deaths and injuring 38 others, including 14 with serious and life-threatening burns. The explosion was fueled by massive accumulations of combustible sugar dust throughout the packaging building.
Distribution Statement A: Approved for Public Release; Distribution Unlimited

49
3.1.2.3 NATURAL DISASATERS
Ultimately, public information regarding disasters beyond those which are “natural” is relatively limited. Thus, with regard to market influence and drivers, this assessment now focuses on those potentially driving the occurrence of natural disasters.
As noted, natural disaster incidents may necessitate enhanced disaster response systems to be integrated into critical facilities such as nuclear power plants that may pose a significant threat if safety or security measures were to be compromised. As such, a brief evaluation of natural disasters, their geographic distribution, and where critical infrastructure (in this case nuclear facilities) exist within the United States may work to understand the way in which these events may drive the need for systems such as the Fast Flow Nozzle that may be employed to direct large quantities of liquid to critical areas in the event of a natural or manmade disaster.
In general, the United States is one of the top ranking countries with regard to the occurrence of natural disasters. This is in accordance with data and definitions provided by the Center for Research on the Epidemiology of Disasters (CRED). The CRED articulates the following classifications of natural disasters.
Based on the definitions above, it is the occurrence of the CRED’s defined meteorological, geophysical, hydrological, and climatological disasters which may prompt end-user value of severe-weather protection. Including all of the above classifications of natural disasters, the United States ranked as the second most affected country with 22 natural disaster events in 2008.
Table 14: Disaster Definitions Disaster Subgroup
Definition Disaster Main Type
Geophysical Events originating from solid earth Earthquake, Volcano, Mass Movement (dry)
Meteorological Events caused by short-lived/small to meso scale atmospheric processes (in the spectrum from minutes to days)
Storm
Hydrological Events caused by deviations in the normal water cycle and/or overflow of bodies of water caused by wind set-up
Flood, Mass Movement (wet)
Climatological
Events caused by long-lived/meso to macro scale processes (in the spectrum from intra-seasonal to multi-decadal climate variability)
Extreme Temperature, Drought, Wildfire
Biological Disaster caused by the exposure of living organisms to germs and toxic substances
Epidemic, Insect Infestation, Animal Stampede
Distribution Statement A: Approved for Public Release; Distribution Unlimited

50
China was ranked as number one with 29 natural disasters. The CRED reports the following figures in ranking the top ten countries by the number of disasters reported in 2008. Maintaining focus on potential domestic market opportunity, it is worthy to note that the United States has occupied a top ranking for disaster occurrence from 2005-2008. Moreover, meteorological disasters (i.e. storms) were the top ranking type of natural disaster within the United States.
Figure 11: Disaster Events, 2008
As noted, the most frequently occurring natural disaster in 2008 within the United States were those classified as meteorological. The CRED provides the following breakdown of natural disaster occurrence by region—the Americas including the United States.
Distribution Statement A: Approved for Public Release; Distribution Unlimited

51
Table 15: Natural Disasters by Type
No. of Natural Disasters
Africa Americas Asia Europe Oceania Global
Climatological 2008
Avg. 2000-07
10 4 9 9 0 32
9 14 13 19 2 57
Geophysical 2008
Avg. 2000-07
3 8 18 2 1 32
3 7 22 3 2 37
Hydrological 2008
Avg. 2000-07
48 39 73 9 9 178
42 39 82 28 5 196
Meteorological 2008
Avg. 2000-07
10 44 43 13 2 112
9 34 42 15 7 107
Total 2008
Avg. 2000-07
71 95 143 33 12 354
63 94 160 65 16 397
The above statistics reveal that the United States and Asia are by far the top ranking regions with regard to meteorological natural disasters.
While this assessment will not go into great detail with regard to each type of natural disaster, in order to understand the impact that natural disasters may have on existing nuclear facilities, and therefore on driving demand for technologies that may be employed to mitigate losses following these natural disasters, meteorological events will be evaluated.
The National Weather Service (NWS) offers further insight into the occurrence of meteorological natural disasters within the United States. The Service provides the following breakdown of natural disaster statistics resulting in fatality, injury, property damage, or crop damage for 2009. As established, the occurrence of severe-weather hazards that may damage critical infrastructure, such as nuclear facilities, may be of particular importance to the Fast Flow Nozzle. As noted, the Fast Flow Nozzle may offer an additional level of protection against situations where nuclear core cooling is compromised such as in the event of power loss. Therefore, of particular relevance, and in line with CRED definition, is the creation of hazards in relation to the occurrence of convection events, tropical cyclones and high winds outlined below.
Distribution Statement A: Approved for Public Release; Distribution Unlimited
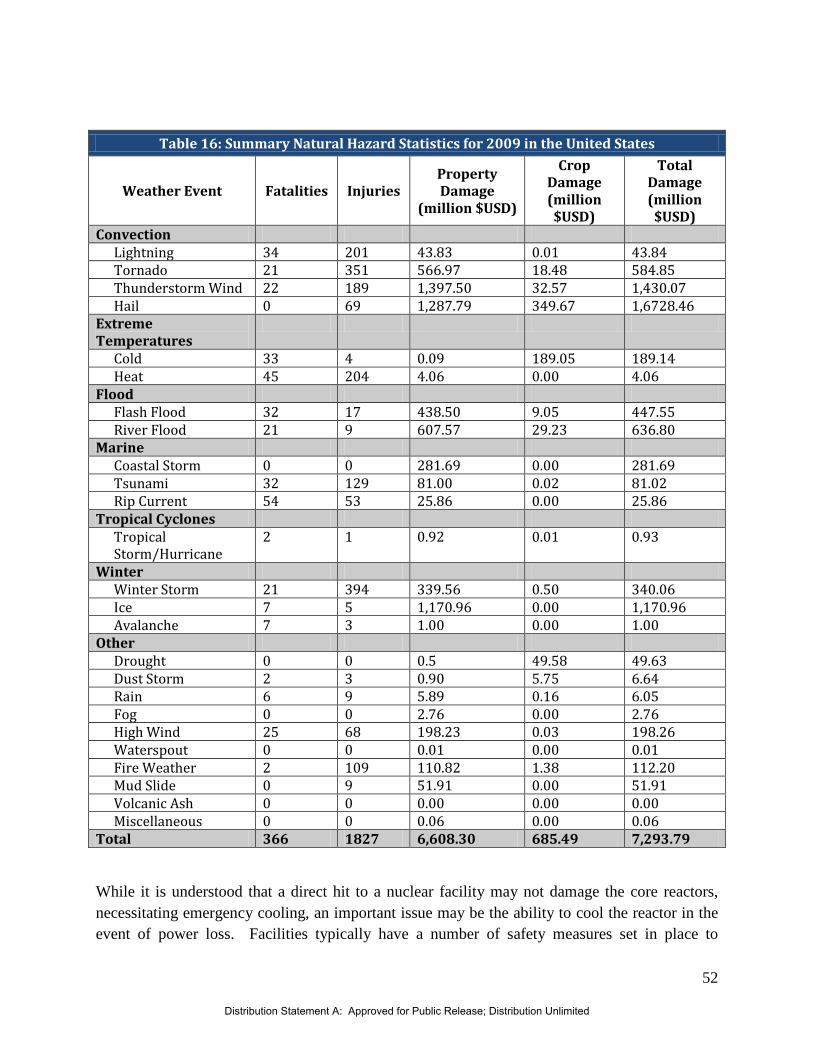
52
Table 16: Summary Natural Hazard Statistics for 2009 in the United States
Weather Event Fatalities Injuries Property Damage
(million $USD)
Crop Damage (million $USD)
Total Damage (million
$USD) Convection
Lightning 34 201 43.83 0.01 43.84 Tornado 21 351 566.97 18.48 584.85 Thunderstorm Wind 22 189 1,397.50 32.57 1,430.07 Hail 0 69 1,287.79 349.67 1,6728.46
Extreme Temperatures
Cold 33 4 0.09 189.05 189.14 Heat 45 204 4.06 0.00 4.06
Flood Flash Flood 32 17 438.50 9.05 447.55 River Flood 21 9 607.57 29.23 636.80
Marine Coastal Storm 0 0 281.69 0.00 281.69 Tsunami 32 129 81.00 0.02 81.02 Rip Current 54 53 25.86 0.00 25.86
Tropical Cyclones Tropical Storm/Hurricane
2 1 0.92 0.01 0.93
Winter Winter Storm 21 394 339.56 0.50 340.06 Ice 7 5 1,170.96 0.00 1,170.96 Avalanche 7 3 1.00 0.00 1.00
Other Drought 0 0 0.5 49.58 49.63 Dust Storm 2 3 0.90 5.75 6.64 Rain 6 9 5.89 0.16 6.05 Fog 0 0 2.76 0.00 2.76 High Wind 25 68 198.23 0.03 198.26 Waterspout 0 0 0.01 0.00 0.01 Fire Weather 2 109 110.82 1.38 112.20 Mud Slide 0 9 51.91 0.00 51.91 Volcanic Ash 0 0 0.00 0.00 0.00 Miscellaneous 0 0 0.06 0.00 0.06
Total 366 1827 6,608.30 685.49 7,293.79
While it is understood that a direct hit to a nuclear facility may not damage the core reactors, necessitating emergency cooling, an important issue may be the ability to cool the reactor in the event of power loss. Facilities typically have a number of safety measures set in place to
Distribution Statement A: Approved for Public Release; Distribution Unlimited

53
function properly if a sustained loss of power occurs; however, a technology such as the Fast Flow Nozzle could potentially be integrated into the system enabling a high volume of water to be pumped on site in the event of a major unforeseen catastrophe that exhausts existing precautions.53
Figure 12: Wind Zones in the United States
Further specifying the potential market relevance for additional water delivery, the United States Federal Emergency Management Agency (FEMA) divides the United States into four zones that geographically reflect the number and magnitude of extreme wind storms. Those geographic locations for which one or both of these variables increase may serve to exist as markets in which the Fast Flow Nozzle may increase in relevance. The map below depicts FEMA’s wind zone designations. As the map is recreated from third party source, specific quantification is not
53 "Good Question: What if a Tornado Hit a Nuclear Power Plant." CBS Minnesota. CBS, 14 Mar 2011. Web.
Distribution Statement A: Approved for Public Release; Distribution Unlimited

54
provided and the image should only be interpreted as a general overview of geographic influence on prospective severe-weather market relevance. 54
In addition to the above geographic wind zones, FEMA also provides a comparison of the number of recorded tornados per 2,470 square miles within the United States and its territories. This comparison, depicted in the map below, may offer further insight into geographic markets which may have an increased value for the Fast Flow Nozzle as a water deluge system.
Regions designated to be in Zone IV (red) have experienced the highest number of, and strongest, severe wind events (i.e. tornadoes). Zone III (orange) locations have experienced significant severe weather activity and include coastal areas that are susceptible to hurricanes.
55 This insight maintains the assumption that increased exposure to severe weather threats may prompt increased value of post catastrophic event risk mitigation. Again recreated from a third-party source, specific quantification is not provided and the image should only be interpreted as a general overview of geographic influence on prospective severe-weather (tornado) market relevance.56
54 United States Federal Emergency Management Agency, Department of Homeland Security. "Taking Shelter
from the Storm." Building a Safe Room For Your Home or Small Business. 3rd ed. FEMA, 2008. Print. 55 United States Federal Emergency Management Agency, Department of Homeland Security. "Taking Shelter
from the Storm." Building a Safe Room For Your Home or Small Business. 3rd ed. FEMA, 2008. Print. 56 Ibid.
Distribution Statement A: Approved for Public Release; Distribution Unlimited

55
Figure 13: Tornado Activity
The noted EF3, EF4 and EF5 specification relates to the Enhanced Fujita Scale (EF Scale)—that used by the National Oceanic and Atmospheric Administration (NOAA) to rank and indicate damage experienced by a building during a tornado. Those depicted above are EF3-EF5 tornadoes, the top three on a scale of zero to five. Maintaining the assumption that with enhanced severe weather threat comes increased value of protective measures, those inhabitants with higher occurrence of tornadoes, especially those with higher ranked magnitudes, may have increased value for the Fast Flow Nozzle. Market relevance for a suppression system for critical infrastructure may increase within these geographic regions for which greater occurrences of natural disasters exist.
The following map is a representation of the geographic distribution of active nuclear facilities in the United States:57
57 "Operating Nuclear Power Reactors." U.S.N.R.. United States Nuclear Regulatory Commission, 2011. Web.
Distribution Statement A: Approved for Public Release; Distribution Unlimited
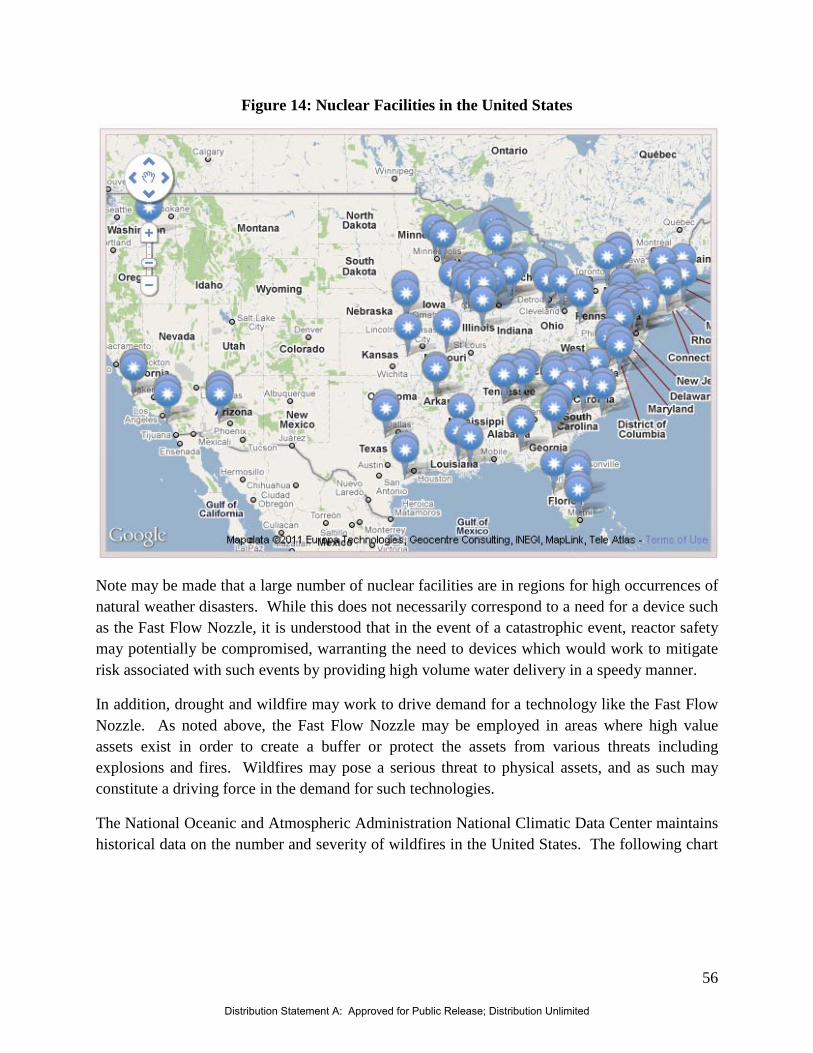
56
Figure 14: Nuclear Facilities in the United States
Note may be made that a large number of nuclear facilities are in regions for high occurrences of natural weather disasters. While this does not necessarily correspond to a need for a device such as the Fast Flow Nozzle, it is understood that in the event of a catastrophic event, reactor safety may potentially be compromised, warranting the need to devices which would work to mitigate risk associated with such events by providing high volume water delivery in a speedy manner.
In addition, drought and wildfire may work to drive demand for a technology like the Fast Flow Nozzle. As noted above, the Fast Flow Nozzle may be employed in areas where high value assets exist in order to create a buffer or protect the assets from various threats including explosions and fires. Wildfires may pose a serious threat to physical assets, and as such may constitute a driving force in the demand for such technologies.
The National Oceanic and Atmospheric Administration National Climatic Data Center maintains historical data on the number and severity of wildfires in the United States. The following chart
Distribution Statement A: Approved for Public Release; Distribution Unlimited

57
articulates the number of wildfires and resulting acres burned over the period from June 2, 2000 to June 2, 2011:58
Table 17: 2011 Wildfire Statistics
(Source: NIFC)
Year–To–Date Totals as of June 2nd
Nationwide Number of
Fires
Nationwide Number of
Acres Burned
Nationwide Number of
Acres Burned Per
Fire 6/2/2011 29,857 3,450,882 116 6/2/2010 25,784 674,222 26 6/2/2009 41,785 1,410,776 34 6/2/2008 27,120 1,501,036 55 6/2/2007 36,714 1,334,672 36 6/2/2006 41,845 2,556,162 61 6/2/2005 25,058 374,405 15 6/2/2004 32,068 531,270 17 6/2/2003 21,542 405,937 19 6/2/2002 30,817 1,115,133 36 6/2/2001 33,876 726,576 21 6/2/2000 39,865 1,027,072 26
5–yr average 34,650 1,495,374
(2006 – 2010)
10–yr average 31,661 1,063,019
(2001 – 2010)
While it may be noted that the number of fires has generally been trending down over the period examined, it appears that the overall number of acres burned and hence the number of acres burned per fire has dramatically increased with a dramatic spike in 2011.59
58 "State of the Climate Wildfires May 2011." NOAA. National Oceanic and Atmospheric Administration, May
2011. Web. 59 Ibid
Distribution Statement A: Approved for Public Release; Distribution Unlimited

58
Figure 15: Fires and Acres Burned 2000-2011
Understanding that there may be a need for a technology that delivers a high volume of water very quickly in situations where natural disasters such as a wildfire threaten high value assets or critical areas, the Fast Flow Nozzle may offer enhanced capabilities with respect to protecting said assets and mitigating risk associated with a wild fire. That said, the maps below represent the U.S. drought monitor and observed fire danger class as of May 31 and June 01, 2011, respectively.60
60 Ibid
While these maps represent a snapshot of the U.S., it is understood that the areas defined as drought areas and high danger fire zones are commonly defined as such on a year by year basis. As such, they may represent geographic areas for which a technology such as the Fast Flow Nozzle may find enhanced market relevance when approaching the market from the standpoint of asset protection against natural fires.
20,000
25,000
30,000
35,000
40,000
45,000
1/1/
2000
1/1/
2001
1/1/
2002
1/1/
2003
1/1/
2004
1/1/
2005
1/1/
2006
1/1/
2007
1/1/
2008
1/1/
2009
1/1/
2010
1/1/
2011
Number of Fires 2000-2011
Number of Fires
Linear (Number of Fires)
20,000520,000
1,020,0001,520,0002,020,0002,520,0003,020,0003,520,0004,020,000
1/1/
2000
1/1/
2001
1/1/
2002
1/1/
2003
1/1/
2004
1/1/
2005
1/1/
2006
1/1/
2007
1/1/
2008
1/1/
2009
1/1/
2010
1/1/
2011
Acres Burned 2000-2011
Acres Burned
Linear (Acres Burned)
Distribution Statement A: Approved for Public Release; Distribution Unlimited

59
Figure 16: US Drought Monitor, May 31, 2011
Distribution Statement A: Approved for Public Release; Distribution Unlimited

60
Figure 17: Observed Fire Danger Class, U.S. June, 2011
In reviewing the data considered, it appears that there may be a market for the Fast Flow Nozzle in the civilian segment beyond that of initially considered applications. All else constant, ultimate market success will be based on the nozzle’s ability to be integrated into existing systems to meet the needs of end users for specific applications.
Moving forward, this assessment will examine the potential military market for the Fast Flow Nozzle.
3.2 Military Market
3.2.1 Military Market Definition and Quantification
The military high-speed, high-temperature fire protection/suppression market includes those military applications for this equipment including on military installations and as part of military conflicts anywhere in the world. These applications include use of fire protection/suppression equipment as part of training exercises, such as putting-out training fires, and in actual fire emergencies.
Distribution Statement A: Approved for Public Release; Distribution Unlimited

61
3.2.1.1 Military Sites
The locations of military service and agency sites which may constitute the prospective military context to which the Fast Flow Nozzle may be deployed are graphed below.61 A “site” is defined by the Department of Defense as a specific geographic location where the DoD owns or manages land, buildings, structures or linear structures. Sites are assigned to military installations. A site may exist in one of three forms: land only (where there are no facilities present); facility or facilities only (where the underlying land is neither owner nor controlled by the government); and land and facilities. An installation is commonly referred to as a base, camp, post, station, yard, center, homeport facility for any ship, or any other activity under the jurisdiction, custody or control of the DoD. Further definitions can be sought by consulting the relevant source. 62
In general, the DoD manages a property portfolio consisting of more than 539,000 facilities (buildings and structures) located on more than 5,570 sites, on approximately 29 million acres. According to the Office of the Deputy Under the Secretary of Defense (Installations and Environment), the DoD footprint encompasses the 50 states, 7 territories, and 38 foreign countries. The majority of foreign sites are located in Germany (235), Japan (123), and South Korea (87).
63
61 Ibid. 62 Ibid. 63 Department of Defense. "Base Structure Report, Fiscal Year 2009 Baseline (A Summary of DoD's Real
Property Inventory)." www.defense.gov/pubs. Department of Defense, Aug 2008. Web. May 2010.
<http://www.defense.gov/pubs/pdfs/2009baseline.pdf>
Distribution Statement A: Approved for Public Release; Distribution Unlimited

62
Figure 18: Geographic Distribution of Department of Defense (DoD) Sites64
When the military market is specified to include the military context of DoD sites and facilities, there are 5,579 sites specifically possessed by the DoD to which the Fast Flow Nozzle may integrated within the military market. The above distribution can be further broken down as DoD sites are classified as either buildings, structures, and linear structures.
65
Table 18: Number of DoD Facilities by Type, Worldwide
Geographic Area
Building Structures Linear Structures
Total
United States 247,209 140,953 37,854 426,016
U.S. Territories 6,381 3,331 842 10,554
Overseas 53,705 39,515 9,563 102,783
Total 307,295 183,799 48,259 539,353
64 Ibid. 65 Ibid.
Distribution Statement A: Approved for Public Release; Distribution Unlimited

63
Of the five branches of the United States military, the U.S. Army manages the largest number of DoD facilities at 242,773. This top rank is followed by the Navy (112,215), the Air Force (142,661), the Marine Corps (41,184), and the Washington Headquarters Service (WHS, 520). Ultimately, the figures outlined above provide a general framework of DoD facilities—or military context—within which the Fast Flow Nozzle may find market relevance and/or market opportunity. It is within DoD buildings, structures, and linear structures that the Fast Flow Nozzle may be installed for use by military end-users. Similar to varying levels of ballistic threat which may be found within deployment locales, such variation may exist within the bounds of the DoD property portfolio. That is, sites, facilities, or installations which endure an increased level of ballistic threat or explosive exposure may realize an increase in value for the Fast Flow Nozzle’s fire and explosion mitigation benefits. It is worth noting that given the connotation of ballistic threat carried by some DoD sites and facilities, or their occupants, the above market size may prove somewhat smaller as some DoD facilities may have pre-existing systems in place to defend against and mitigate fire and explosion exposure.
The Department of Defense (DoD) requested $708 billion for fiscal year (FY) 2011. The budget includes $549 billion in discretionary budget authority to fund base defense programs and $159 billion to support overseas contingency operations (OCO), primarily in Afghanistan and Iraq.66
66 U.S. Department of Defense, Office of the Assistant Secretary of Defense (Public Affairs). "DOD Releases
Defense Reviews, 2011 Budget Proposal, and 2010 War Funding Supplemental Request - Update."
Defense.gov News Release. U.S. Department of Defense, February 01, 2010. Web. May 2010.
<http://www.defense.gov/Releases/Release.aspx?ReleaseID=13281>.
The FY2011 base budget represents an increase of $18 billion over the $531 billion enacted for FY2010. This is an increase of 3.4 percent, or 1.8 percent real growth after adjusting for inflation. While the establishment of military installations overseas (permanent or temporary) does not necessarily imply that fire suppression systems will be employed and integrated into the fire or explosion response plans of the military, it is possible that a technology like the Fast Flow Nozzle may be employed in an attempt to provide one additional layer in a pursuit to protect high-value targets or assets.
Of particular interest may be the budget allocation to overseas contingency operations (OCO). That is, the assumption may be maintained that deployment carries correlation to an increased exposure to fire and explosive threats and subsequently, a potentially increased need for such protective measures as the Fast Flow Nozzle. The funds ($159 billion) allocated to OCO are primarily for support of operations within Afghanistan and Iraq (i.e. 132,000 deployed forces) and are broken down as follows:
Distribution Statement A: Approved for Public Release; Distribution Unlimited

64
Figure 19: FY 2011 Overseas Contingency Operations (OCO) Budget: $159.3 Billion67
Table 19: FY2011 Overseas Contingency Operations (OCO) Budget: $159.3 Billion
Category *Allocation Continuing the Fight $132.4
Operations $89.4 Force Protection $12.0
IED Defeat $3.3 Military Intelligence $7.0 Iraq Security Forces $2.0
Afghan National Security Forces $11.6 Coalition Support $2.0
CERP $1.3 Military Construction $1.2
Temporary Army End Strength $2.1 Navy IAs $0.5
Reconstitution $21.3 Non-DoD Classified $5.6
*Numbers may not add due to rounding
Within this breakdown, a technology such as the Fast Flow Nozzle may be included in overseas Military Construction which has an anticipated allocation of $1.2 billion dollars. 67U.S. Department of Defense. "SUMMARY OF THE DOD FISCAL 2011 BUDGET
PROPOSAL." www.defense.gov/news/FINAL PRESS RELEASE v3 1.pdf. U.S. Department of Defense, 01
Feb 2010. Web. May 2010.
<http://www.defense.gov/news/FINAL%20PRESS%20RELEASE%20v3%20%201.pdf>.
Distribution Statement A: Approved for Public Release; Distribution Unlimited

65
In addition to OCO considerations, procurement allocations within the DoD budget may also shed light on potential military purchasing power. If Fast Flow Nozzle licensees or manufacturers are able to penetrate the military market, procurement allocations may be the funds with which military end-users may purchase the Fast Flow Nozzle. Procurement appropriation is listed at $104.8 billion in FY2010, projected to increase by 7.7% to $112.9 billion in FY2011. Again accepting budgetary quantification as representative of market priorities and here, procurement to be indicative of prospective purchasing power, opportunity within the military market appears to be increasing. Of course, an increasing procurement budget does not guarantee that budget comptrollers will allocate funds to purchase the Fast Flow Nozzle and the traditional value stream will need to be examined.
The FY 2011 procurement budget ($112.9 billion) can be further specified into programs designated as Major Defense Acquisition Programs (MDAP). $80.0 billion has been allocated for MDAP in FY2011. Funding categories are broken down by mission area to include:
Figure 20: FY 2011 Major Defense Acquisition Program (MDAP) Budget: $80.0 Billion68
68 Ibid.
$55.4
$11.1
$23.3
$9.9$12.9
$25.1$9.9
$55.2
$11.8Aircraft
Command, Control, Communications and Computer Systems (C4)Ground Programs
Missile Defense
Munitions and Missiles
Shipbuilding and Maritime SystemsSpace Based and Related SystemsMission Support
Science and Technology$USD, Billion
Distribution Statement A: Approved for Public Release; Distribution Unlimited

66
Table 20: Major DoD Acquisition
Major Defense Acquisition Program FY2011 Budget Allocation (billion $USD)
Aircraft 55.4
Command, Control, Communications
and Computer (C4) Systems 11.1
Ground Programs 23.3
Missile Defense 9.9
Munitions and Missiles 12.9
Shipbuilding and Maritime Systems 25.1
Space Based and Related Systems 9.9
Mission Support 55.2
Science and Technology 11.8
Of the nine categories, Munitions and Missiles may prove to be the most relevant to the Fast Flow Nozzle—acknowledging the potential for increased fire and explosion scenarios for which the Fast Flow Nozzle may find enhanced relevance. The Munitions and Missiles allocation of $12.9 billion focuses primarily on developing and procuring weaponry. In attempts to identify budget segments which have the potential to include Fast Flow Nozzle expenditure, the unit may have the potential to be included in Military Construction. Or, the military’s budget allocation to such measures as new construction may provide comparative insight into the Fast Flow Nozzle’s prospective military market. That is, comparable relevance for the Fast Flow Nozzle may be recognized in the dominant allocation of funds to military construction—facilities into which fire and explosion mitigation technologies may be integrated.
Distribution Statement A: Approved for Public Release; Distribution Unlimited

67
Figure 21: FY 2011 Military Construction Budget Allocation: $16.9 Billion69
Ultimately, when DoD budgets are interpreted to be representative of market quantification—both the general DoD budget and OCO are projected to increase in 2011. Procurement allocation, prospectively indicative of military purchasing power, is also projected to increase in FY2011.
3.2.1.2 Federal Laboratories
One area for which a demand for fire suppression systems may exist is that of federal laboratories. While the nature of research conducted in federal laboratories may drive the strength of demand, it is understood that some research activities may carry increased potential for explosive/fire disasters such as in the realm of explosives manufacturing research or the research itself may necessitate systems which quickly extinguish or work to control explosions or fires (i.e. jet engine testing). At present, there are 316 laboratories listed on the The Federal Laboratory Consortium (FLC) website as part of the consortium. While not all labs may have use for technologies such as the Fast Flow Nozzle, the labs listed may represent a prospective
69 Ibid.
138.5, 25%
200.2, 37%
112.2, 21%
76.1, 14%
16.9, 3% 1.8, 0% 2.4, 0%
Military Personnel
Operations and Maintenance
Procurement
RDT&E
Military Construction
Family Housing
Revolving and Management Funds
$USD, Billion
Distribution Statement A: Approved for Public Release; Distribution Unlimited

68
pool of end users for the nozzle. The table and figures below outline the distribution of FLC labs by department/agency, and geography:70
Table 21: FLC Laboratories by Department or Agency
Laboratory or Department Labs Laboratory or Department Labs
Department of Defense 128 Dept. of Homeland Security 5
Dept. of Interior 64 Dept. of Transportation 5
Dept. of Health and Human Services 38 Dept. of Commerce 4
Dept. of Energy 32 National Science Foundation 4
Dept. of Agriculture 16 Dept. of Labor 1
NASA 10 National Security Agency 1
Environmental Protection Agency 7 Tennessee Valley Authority 1
70 "About the FLC." FLC. Federal Laboratory Consortium, May 2011. Web.
Distribution Statement A: Approved for Public Release; Distribution Unlimited

69
Figure 22: Federal Laboratory Distributions across the U.S.
Figure 23: Geographic Representation of Federal Laboratories
Federal Laboratory Distribution (FLC, 2011)
60
24
21
Hawaii: 1
Distribution Statement A: Approved for Public Release; Distribution Unlimited
70
As noted, not all laboratories may require technologies such as the Fast Flow Nozzle in lab research functions; however, these laboratories represent a potential pool of end users within the federal marketplace. As such, a closer examination of their research operations and risk potential may further narrow the prospective client field. While such an examination is outside the scope of this assessment, the identification of these prospective end users may work to build a more robust picture of the market opportunity for the Fast Flow Nozzle. In terms of potential opportunity with regard to defense research, the Department of Defense base allocation of $76.1 billion to research development test and evaluation (RDT&E) programs for fiscal year 2011.71 Further, and as example, the Army Contracting Command, Joint Munitions and Lethality Contracting Center, Joint Armament Center posted a Sources Sought notice on FedBizOpps.gov for firms with the capability to “manufacture, repair and supply parts, controllers, tooling and hardware for high speed portable or permanent deluge equipment, fire suppression systems.”72 Further, the request specifies the following requirements:73
• Two detectors
The portable deluge system, as a minimum, will consist of:
• Two nozzles • A pressurized tank with at least 100 gallons of water • Response time must not exceed 100 milliseconds • Should be tied to backup water supply • Must be compatible with existing systems
Note should be made that this was not a formal request for proposal. The interested vendor list consists of Pyrotech USA, Inc., and Risketec Solutions, Inc.74
71 "RDT&E Programs." DoD. Office of the Under Secretary of Defense (Comptroller), 2011. Web 72 "42-- High Speed portable or permanent deluge equipment, fire suppression system."FedBizOpps.gov. General
Services Administration, 2011. Web. 73 Ibid 74 Ibid
In addition to the Army Contracting Command’s interest in fire suppression systems, the Air Force Research Laboratory (AFRL’s) has been actively evaluating suppression technologies to be used in munitions applications. While several of these technologies will be discussed in the Competitive Landscape section of this report, it appears that similar research efforts exist in other DoD labs. Perhaps the Fast Flow Nozzle may work to meet the needs of the other DoD labs seeking high performance fire and explosive fire suppression systems.
Distribution Statement A: Approved for Public Release; Distribution Unlimited

71
3.2.2 Military Market Drivers and Influences
The drivers and influences for the military market include:
• Federal spending on RDT&E
Recognizing the above outlined potential military end-users, the market definition recognized by this assessment also notes the specification of military end-users within the military context of military bases or, otherwise designated military site or facility. Recognizing the military context to be assigned by the Department of Defense (DoD), it is understood that the existence of DoD controlled facilities may also work to drive military demand for a technology that mitigates damage resultant from fires and explosions. That said, DoD controlled facilities, as discussed above represent both a quantification and a driving frorce for technologies such as the Fast Flow Nozzle.
RDT&E funds from the federal government may drive demand for a technology such as the Fast Flow Nozzle. In additional to providing a means by which the nozzle may be procured, RDT&E efforts may implicitly drive demand as the nature of research may necessitate technologies that work to control explosions and fires. While this driver is discussed above as a potential market quantifier, it is also noted to drive the procurement of technologies employed within testing environments. As will be discussed within the Competitive Landscape section of this assessment, there are existing efforts within a number of Department of Defense laboratories aimed at developing fire suppression equipment that optimize suppression capabilities and minimize response time.
While it is also understood that Defense spending in areas such as construction may drive demand for suppression systems that are integrated into structures, it appears that the greatest opportunity may exist in munitions applications.
Moving forward, this assessment will work to identify both potential sources of competition for the Fast Flow Nozzle and prospective licensees for the technology.
Distribution Statement A: Approved for Public Release; Distribution Unlimited

72
4 Competitive Landscape
The Competitive Landscape section of this assessment will first work to identify several currently commercialized technologies that may represent competition for the Fast Flow Nozzle. After a brief examination of potential competition is complete, an assessment of competing firms in the market will work to identify potentially attractive licensees or partners for the Fast Flow Nozzle technology.
As discussed in the market section of this assessment, a recent report released by Frost and Sullivan entitled North American Fire Suppression Systems Market projects that the North American market for fire suppression systems is expected to grow from $591 million in 2005 to roughly $955 million in 2013, with a compound annual growth rate of 5.6%.75
Figure 24: North America Fire Suppression Systems Market 2005-2013
In addition to new building construction and renovation projects, the report also cites security concerns for commercial and industrial sites as a driving force in the market growth for fire suppression systems. In addition to traditional sprinkler systems, industrial applications for manufacturing may work to drive market growth in a positive manner.76
75 "New Building Construction and Renovation Projects Drive North American Fire Suppression Systems."Frost
& Sullivan. Frost & Sullivan, 31 Mar 2008. Web. 76 Ibid
2005 2006 2007 2008 2009 2010 2011 2012 2013Revenues 591. 653. 690. 728. 769. 812. 858. 906. 954.
0.0
200.0
400.0
600.0
800.0
1000.0
1200.0
Rev
enu
es (
mil
lion
s)
North American Fire Suppression Systems Market Projections, 2005-2013
Distribution Statement A: Approved for Public Release; Distribution Unlimited

73
The key players in the fire protection/suppression market include Tyco Fire Suppression and Building Products, Globe Fire Sprinkler Corporation, VFP (Viking Fire Protection) Fire Systems, Fike Corporation and United Technologies (UTC). 77
While there are several large companies that compete within the fire suppression market, the industry is generally characterized as fragmented, with hundreds of small firms competing for a large amount of market share.
78
Frost & Sullivan make note that while the market may have a number of smaller and niche players, increased price sensitivity and a growing trend of mergers and acquisitions may make it difficult for existing small and niche firms to compete long-term. Even though the market is growing in maturity, it appears that the industry is entering the last phase of a shakeout stage where larger firms tend to absorb smaller and niche competitors. This may be important to consider when evaluating potential licensees or partners.
In addition, while the market may be characterized as fragmented, it is generally considered a mature market, where differentiation and innovation are key strategic components with regard to firms’ competitive capabilities. Further investigation reveals that a significant amount of merger and acquisition activity has characterized the industry over the past decade. For instance, Angus Fire Armour, Badger Fire Protection, Chemetron Fire Systems, Kidde Fire Fighting, and Marioff Corp., are all well known companies within the fire suppression market. All of these companies are subsidiaries of United Technologies, as part of their fire suppression portfolio of companies. Further, Ansul, Inc., Gem Sprinkler Co., Grinnel, National Foam, Inc., and Pyro-Chem are all identified as major players in the fire suppression market by Frost and Sullivan. All of these are subsidiaries of Tyco International. While there are a number of different market players that compete on niche competencies, many larger firms are diversifying their product line portfolios through acquiring companies with competencies that fill gaps in their own product lines. As such, when considering partnership or licensing opportunities, targeting larger firms with a diverse fire detection and suppression portfolio may serve to enhance market penetration potential, as existing sales and marketing channels may be leveraged.
79
77"New Building Construction and Renovation Projects Drive North American Fire Suppression Systems."Frost &
Sullivan. Frost & Sullivan, 31 Mar 2008. Web. 78"2010 Annual Report." Tyco Annual Report. Tyco International, 2011. Web. 79 "New Building Construction and Renovation Projects Drive North American Fire Suppression Systems."Frost
& Sullivan. Frost & Sullivan, 31 Mar 2008. Web.
While smaller firms may have existing manufacturing capabilities and more horizontal management structures, larger, more stable firms may make more attractive licenses or partners, as they may constitute stability and be sustainable in the marketplace.
Distribution Statement A: Approved for Public Release; Distribution Unlimited

74
4.1 Existing Technologies
Competition for the Fast Flow Nozzle includes traditional high flow rate sprinkler heads. Some specific competitive technologies are listed below. Note may be made that while the Fast Flow Nozzle competes within the market defined as “Fire Suppression Systems,” based on its performance specifications, it specifically competes within a relatively small segment of the overall market that aims to deliver high volumes of water very quickly in response to high-intensity fires.
One competitive technology is Fike’s Clean Agent Fire Suppression system which uses DuPont’s HFC-227 ea/FM-200® as the extinguishing agent, which leaves no residue, and does not require costly clean-up. It provides speed in fire suppression, reduces damages, saves on floor space, and allows for visibility. This system discharges in ten seconds or less, which extinguishes fires quickly and effectively.80
Another Fike technology that may constitute a competitive technology is the Explosion Suppression System for Ultra-high Speed Fire Suppression Applications. This technology was evaluated by the Air Force Research Laboratory (AFRL) in 2007. The system was tested and recorded with high-speed digital cameras, and response times were evaluated over a total of 9 tests. The reaction time of the system ranged from 2.1-2.9 milliseconds with an average response time of 2.9 milliseconds.
81 While this time is far superior to the response time required by National Fire Protection Association (NFPA) Standard 15, which is 100 milliseconds.82
Another competitive technology is the Air Force Research Laboratory’s (AFRL’s) Blast Initiated Deluge System which is described as an ultra-high-speed fire suppression system.
AFRL’s assessment of Fike’s suppression system may be found in Appendix B.
83
80 Notes from Interview with Fike Corporation by Emerging Growth Enterprise analyst Byron Clemons as
described in the final presentation to NAVSEA Crane on November 3, 2010. 81 Hawk, John. "Evaluation of Fike Corporation's Explosion Suppression System for Ultra-High Speed Fire
Suppression Applications." Air Force Research Laboratories. U.S. AFRL, Dec 2007. Web.
<http://dodreports.com/pdf/ada480288.pdf> 82 Ibid
This system was developed in response to incidents at munitions plants which caused considerable equipment damage, production delays, and personnel injuries. It was developed to stop high velocity fires caused by deflagration of explosives, propellants, and pyrotechnic materials. A detector was developed which is one hundred times faster than the best detector on the market. The water velocity is three times faster than the state-of-the-art system. In live fire experiments with up to four pounds of magnesium-Teflon pyrotechnic material, the system put water on fires 36 inches
83 Dierdorf, D. et.al. “Blast Initiated Deluge System An Ultra-High-Speed Fire Suppression System” <
http://www.nfpa.org/assets/files//pdf/proceedings/blast_initiated_deluge_system-d.dierdorf-
j.hawk_paper.pdf> January 2006.
Distribution Statement A: Approved for Public Release; Distribution Unlimited
75
from the spray head 6 milliseconds after detection and extinguished fires in as little as 16 milliseconds. It is said that the detector used in the system is 100 times faster that the best detector on the market.84
Another competitive technology is ANSUL’s (a Tyco International Company) INERGEN® fire suppression system based on nitrogen, argon, and carbon dioxide which can extinguish a flammable liquid fire in typically 17-21 seconds or an average of 19 seconds.
AFRL’s assessment of this technology may be found in Appendix C. Note may be made at this point that it appears that AFRL is actively evaluating suppression systems and as such, may find use with the Fast Flow Nozzle.
85
Other competitive technologies include Fire Equipment Inc.’s clean agent fire suppression systems for protection of high-value assets, portable extinguishers, sprinkler systems, and explosion suppression systems.
86
Still other competitive technologies include ASSI Fire Protection Systems waterless fire protection systems including Include FM-200, 3M NovecTM Fire Protection Fluid, ArgoniteTM Systems, FE-13TM Extinguishing System for harsh and demanding applications such as occupied structures.
87
84 Ibid
The competitive products, manufacturers, and key relevant details are summarized in Table 8 below. Note may be made that these products represent a small number of potential competitors; however, they are representative of the types of systems that are currently commercialized and therefore may compete against the Fast Flow Nozzle.
85INERGEN® Fire Suppression Product Information from ANSUL website,
https://www.ansul.com/en/Products/clean_agent_systems/inergen.asp> viewed on May 23, 2011. 86 Kelly, R. Fire Suppression Systems < http://firesuppressionsystems.com/>2011. 87 ASSI Fire Protection Systems, Waterless Fire Suppression Systems
< http://www.advancedsafetysystems.com/products.html> 2011.
Distribution Statement A: Approved for Public Release; Distribution Unlimited

76
Table 22: Existing Suppression Systems
Product Name Manufacturer Relevant Details
Clean Agent Fire Suppression System-FM-
200®
Fike Corporation Discharges in ten seconds or less.
INERGEN®
Fire Suppression System
ANSUL (a Tyco International Company)
Based on nitrogen, argon, and carbon dioxide and can extinguish a flammable liquid fire in 17-21 seconds, with an average of 19 seconds.
AFRL Blast-initiated Deluge
System
AFRL (Air Force Research
Laboratory)
Detector is one hundred times faster than the best detector on the market and the water velocity is three times faster than the state-of-the-art system. In live fire experiments, the system put water on fires 36 inches from the spray head 6 milliseconds after detection and extinguished fires in as little as 16 milliseconds.
Fire Suppression Systems
Fire Defense Equipment Company
Can be based on clean agents (faster than water, safe for people, require no clean-up, and cause no damage to business assets), carbon dioxide, foam, and dry chemical systems.
Clean Agent Fire Suppression
Systems
Fire Equipment Inc.
Clean agent fire suppression systems for protection of high-value assets, portable extinguishers, sprinkler systems, and explosion suppression systems.
Waterless Fire Suppression
Systems
ASSI Fire Protection Systems
Include FM-200, 3M NovecTM Fire Protection Fluid, ArgoniteTM Systems, FE-13TM Extinguishing System for harsh and demanding applications such as occupied structures.
4.2 Competitive Ability
The key competitive ability of the Fast Flow Nozzle is its fast rupture and flow material and its ability to deliver virtually unlimited extinguishing material in 10-15 milliseconds, which is less than half the response time of competitive materials. In addition, the nozzle delivers water at nearly fifteen times the flow rate of existing fire suppression systems. Furthermore, the flow rate
Distribution Statement A: Approved for Public Release; Distribution Unlimited

77
from one nozzle is sufficient to replace six traditional valve heads. In addition, the modified nozzle can provide 300-350 GPM compared to the standard 20-25 GPM. Also, the system allows for retrofitting of existing systems and can provide a higher flow rate in existing piping. It should be noted that the system has passed testing by the Naval Surface Warfare Center-Crane Division. The system has strength and durability to perform in fire situations. In addition, the portable system prototype is more affordable than current fire suppression systems. Considering the expense over the lifetime of the product, the nozzle is a high value product with a low lifetime cost.
4.3 Key Competitors and Potential Licensing and Partnership Targets
Understanding potential competition that may exist in the form of currently commercialized fire suppression systems, the Fast Flow Nozzle may be an attractive technology for a firm competing in the fire suppression market. Understanding the Fast Flow Nozzle’s unique prospective advantages and performance specifications, it may be a good fit for an existing product line, and may ultimately augment an existing competing firm’s ability to meet the needs of a wider user base. That said, a number of firms currently competing in the fire suppression market may represent attractive targets for licensing opportunities and potential alliances. As such, this section of the assessment will briefly explore several firms that may constitute potentially attractive targets for such activities. While this assessment does not rank or assert that one target may be more attractive than the next, by identifying several potentially attractive targets, a deeper exploration into the nuances of what any form or partnership would look like may begin.
The following chart represents a high level assessment of major companies that compete within the fire suppression system markets, and the specific segment within which they compete. Data has been compiled from the companies’ websites. As there are three major segments within the overall fire suppression market, a high-level view of the firms that compete in each segment may provide a foundation upon which a more robust picture of prospective partnerships may begin to emerge. Note that this chart does not take into account whether companies are subsidiaries.
Distribution Statement A: Approved for Public Release; Distribution Unlimited

78
Table 23: Fire Suppression Market Players
Company Water Gas Specialty
3s, Inc X X X A &M Fire and Safety Equipment, Inc
Adams Fire protection na na X AFEX, Division of Bronaventure group, Inc. na na X
Amerex Corporation X X X American Fire Protection, Inc X X X ANSUL, Inc X X X Best Fire X X X County Fire Protection, Inc X X X EMCOR na X X Fike Corporation X X X Fire Chief Equipment Co, Inc. X X X Fire control Systems, Inc na X X Fire Pro USA X na na Fire Systems, Inc Fireaway na X X Fireboy-Xintex na X X General Fire Extinguisher Services, Inc X X X
Globe Technologies Corporation Fire Suppression System Components
Haines City Fire Extinguisher service, Inc X na X
Heiser Logistics, Inc X X X
International POD, LLC na na X
Jomarr Products, Inc na na X Jorgensen Company X X X Kiddie Fire Systems na X X Kimbrough Fire Extinguisher Co. na na X Koorsen Fire & Security, Inc X na X Life Mist Technologyies X na na Monroe Extinguisher Company na X X Peripheral Manufacturing, Inc na na X PHL Links, LLC Fire Suppression System Components
Distribution Statement A: Approved for Public Release; Distribution Unlimited

79
PYRO-CHEM X X X Red Ball Oxygen X X X Remstar na na X Safety Systems Technology (NV), Inc na X na
Safety Systems, Inc na X X
SBT na X Sea-Fire Marine na X X Sensor Electronics Corporation Gas Detectors SK Bowling Company, Inc na X X Southern Fire Protection na X X Strad Energy/Fire Caddy na na X Strategic Corporate Developments Sutton Clark Supply, Inc X X X T & S Fire and Security, Inc na X X The Safety Team, Inc X X na Total Safety na X X Tyko Fire and Security X X X Universal Sprinkler Company X X X UTC Fire and Security X X X Viking Group/Minimax X X X
As noted previously, many larger firms are diversifying their product line portfolios through acquiring companies with competencies that fill gaps in their own product lines. As such, when considering partnership or licensing opportunities, targeting larger firms with a diverse fire detection and suppression portfolio may serve to enhance market penetration potential, as existing sales and marketing channels may be leveraged. The following companies are identified as potentially attractive targets for licensing and partnership opportunities.
Tyco Fire Protection Products is a subsidiary of Tyco International and was formed as part of Tyco Safety Products to create a portfolio of the world’s most recognized brands and create a comprehensive line of products that meet a wide range of customer needs within the fire suppression market.
Tyco International
88 Several well known subsidiaries of Tyco Fire Protection Products include:89
• Ansul
88 2010 “Fire Suppression Systems." TycoProducts. Tyco International, 2011. Web. 89 Ibid
Distribution Statement A: Approved for Public Release; Distribution Unlimited

80
• Grinnel • Hygood • Nureppin • Pyro-chem • Skum • Rapid Response
While the above subsidiaries do not represent the entire portfolio of Tyco fire suppression companies, it serves as an example that Tyco, among other firms, is diversifying its product portfolio through acquisitions. Further, serving 14 core markets, Tyco has well established sales and marketing channels that may be leveraged in order to take a technology such as the Fast Flow Nozzle to market. Of particular note may be Tyco’s penetration and current presence in the following markets:
• Government and Military • Manufacturing • Marine • Metal Processing • Mining • Petroleum, oil and gas • Power Generation
As these markets represent areas for which the Fast Flow Nozzle may hold enhanced market relevance, Tyco’s existing footprint in these areas may be of particular importance when considering potential targets for licensing or partnership opportunities.
UTC Fire & Security is a subsidiary of United Technologies. Their core products focus on meeting the needs of clients in a variety of markets by providing fire detection and suppression technologies to a wide range of markets. In terms of fire suppression systems, UTC provides three main types of products, which include clean agents, explosion protection, and water mist systems. Within these product offerings, several major subsidiaries that manage well known and well respected products in the market are:
United Technologies (UTC)
90
• Angus Fire Armour
• Badger Fire Protection • Chemetron Fire Systems • Kidde Fire Fighting • Marioff Corporation
90 "United Technologies ." UTC Fire Suppression. United Technologies, 2011. Web. 29 Jun 2011.
<http://www.utcfireandsecurity.com>.
Distribution Statement A: Approved for Public Release; Distribution Unlimited
81
Similarly to that of Tyco, UTC has a number of existing competencies that may make it an attractive target for partnership or licensing opportunities.
Fike Corporation may offer a unique partnership prospect, as it not only competes in the overall fire suppression market, it is a leader in the manufacturing and distribution of rupture discs that are integral components of the Fast Flow Nozzle’s functionality. Additionally, Fike manufactures an explosion suppression nozzle that is capable of detecting and responding to explosions in less than 1 millisecond.
Fike Corporation
91
• Pressure relieve systems
Fike is a major competitor in a number of segments within the fire suppression market including:
• Fire suppression systems • Detection and control • Fire alarm • Explosion protection • Outfield products
Fike’s unique position in the market may make it an attractive partner. Fike also has well established global service and sales networks which include wholly-owned subsidiaries, manufacturer’s representatives, distributors and dealers.92 Note may be made that Fike appears to have existing relationships with federal laboratories including AFRL specifically regarding high-speed, high-temperature suppression systems.
VFP Fire Systems
• Engineering and design
VFP Fire Systems, Inc. has been a leading company in the fire suppression market since 1927. VFP offers a diverse fire sprinkler product line including wet pipe, dry pipe, deluge and pre-action fire sprinkler systems. VFP is a leading company in the deluge nozzle segment, and serves a wide base of clients in this market from manufacturing and metal processing to government applications. In addition to a full product line, VFP offers a number of complementary services including:
• Installation • Project Management • Service and inspection • Building and retrofit
91 "Fike Corporation Fire Suppression." Fike Fire Suppression. Fike Corporation, 2011. Web. 29 Jun 2011.
<http://www.fike.com/suppression.html>. 92 Ibid
Distribution Statement A: Approved for Public Release; Distribution Unlimited

82
Coupled with a diverse product offering, VFP has been a leader in the fire protection and suppression market since the 1920s. 93
93 "VFP Fire Systems." VFP Fire. VFP, 2011. Web. <http://www.vfpfire.com>.
While brief in nature, the above overview of potential licensee or partnership targets may serve as an initial point of consideration when evaluating go-to-market strategies. As previously noted, M&A trends in the fire suppression marketplace may drive market penetration strategies towards licensing or partnership opportunities, as partner/licensee competencies and existing market positions may be leveraged, ultimately securing a path to market.
Distribution Statement A: Approved for Public Release; Distribution Unlimited
83
5 Cautions and Considerations
This assessment has worked to provide a market overview for the primary applications of the Fast Flow Nozzle and its prospective advantages relative to existing and emerging technologies. As development of the Fast Flow Nozzle progresses including testing on various types and intensities of fires, and market opportunities are further identified, a variety of cautions and considerations will be further revealed. While by no means exhaustive, this discussion addresses only those cautions and considerations which are known at this time.
5.1 Approvals and Manufacturing Considerations
Underwriters Laboratories Inc. (UL) and Factory Mutual (FM) Approvals certifications are both necessary for fire protection/suppression equipment. Additionally, fire suppression systems must meet the standards laid out by NFPA Standard 15. Response time articulated in this standard is 100 milliseconds.
Since the Fast Flow Nozzle has not been commercially produced, a manufacturer would first need to be identified. Next a method of manufacturing would need to be determined. As installation costs may vary and are specific to end user needs, it may be difficult to specify exact manufacturing costs for the Nozzle. That said, it is understood that the Fast Flow Nozzle meets and exceeds performance requirements for commercial fire suppression commercialization.
5.2 Montreal Protocol 94
The Montreal Protocol on Substances that Deplete the Ozone Layer is a treaty that aimed to phase out the production of numerous substances believed to deplete ozone. The treaty focused on several groups of halogenated hydrocarbons that are believed to contribute to the depletion of the ozone. This includes a number of halogenated hydrocarbons that were used in the suppression of fires. A number of systems that employ the phased out substances still exist today, and in many countries are being replaced by more ecological friendly systems.
95
94 "Montreal Protocol On Substances That Deplete the Ozone Layer." UNEP. United Nations Environment
Programme (UNEP), 2006. Web. 95 Ibid
As is the case, products such as 3M™ Novec™ has gained wide appeal for applications that once employed halogenated hydrocarbons in fire suppression strategies.
Distribution Statement A: Approved for Public Release; Distribution Unlimited
84
5.3 Switching Cost
Moving forward, as a potential improvement over existing fire suppression technologies, and as an alternative solution to existing technologies, the Fast Flow Nozzle may constitute an incremental improvement over currently fielded systems. Improvements over existing fire suppression technologies are claimed, the subsequent embodiment of which may offer enhanced solutions. However, the question remains, will these improvements hold enough value for end-users to switch from existing technologies?
Generally speaking, there are two main switching cost scenarios which may be encountered within the market of existing technologies; first, the replacement and/or upgrade of a functional technology and second, the replacement of a non-functional or malfunctioning technology. These scenarios can be broken down into the following equations. These equations are conceptual in nature, created only as an example of considerations to be made as development ensues, and should not be interpreted as material decision making tools.
Switching Cost of Replacing and/or Upgrading a Functioning Technology
= (Lost Utility of Existing Functional Technology + Monetary Cost of Fast Flow Nozzle + Opportunity Cost of Fast Flow Nozzle Adoption) – Fast Flow Nozzle ROI
Switching Cost of Replacing a Nonfunctional or Malfunctioning Technology
= (Monetary Cost of Fast Flow Nozzle + Lost Cost Savings of Repairing the Existing Technology + Fast Flow Nozzle Adoption) – Fast Flow Nozzle ROI
Both scenarios involve the consumer bearing the monetary cost of the product (the purchase price), as well as the opportunity cost of embodiments of the Fast Flow Nozzle. Examples of costs in this regard may be potential training requirements to safely employ or maintain the Fast Flow Nozzle and any learning time necessitated by adoption. Replacing and/or upgrading an existing functional technology sees the specific cost of this technology’s lost utility. Replacing a non/malfunctioning technology carries the specific loss of any cost savings were this technology to be repaired (at a lower cost) as opposed to replaced. While lost utility and sacrificed cost savings can be considered opportunity costs, they are here distinguished for the sake of clarity. As the Fast Flow Nozzle may be retrofitted into existing systems, this may reduce overall adoption cost, as only a number of components must be replaced, and the main components of the suppression system may stay intact.
Distribution Statement A: Approved for Public Release; Distribution Unlimited

85
Moving forward, as development of the Fast Flow Nozzle ensues, the questions of which of these variables are known, and which can be minimized can be asked by licensees and development entities. Current estimates place the price of the Fast Flow Nozzle $250 to $800 with system costs around $4500 per installation. As pricing structures for the Fast Flow Nozzle are determined, price points and future variations can be factored into such models as those above in an effort to consider their potential effect on overall switching costs.
Sellers of the Fast Flow Nozzle alone may not have control over the lost utility of end-users’ existing functional technologies. However, the variables of opportunity cost of the Fast Flow Nozzle and Fast Flow Nozzle ROI could potentially be manipulated. As established, the opportunity cost of Fast Flow Nozzle adoption may refer to such costs as training requirements and learning time necessitated by switching to laser-based solutions. Minimizing these costs may offer one example of potential avenues to optimizing the costs associated with purchase and adoption.
The Fast Flow Nozzle’s return on investment is primarily based on the technology’s claimed advantages. That is, the Fast Flow Nozzle’s prospective advantages may be what foster purchase motivation and work to counter any corresponding costs. The previously created chart regarding the Fast Flow Nozzle’s prospective advantages is seen below, now to specifically note potential sources of end-user return on investment via relevant prospective advantages. Note may also be made that depending on the assets being considered as being potentially protected by the Fast Flow Nozzle, ROI may far outweigh the cost of adoption. For instance, if the Fast Flow Nozzle were integrated into backup cooling strategies for a nuclear facility, the benefit of protecting both the facility and the population at large may vastly outweigh the unit and installation costs of the Fast Flow Nozzle. That said, it is understood that ROI may differ significantly from prospective end user to prospective end user, as the specific assets for which the Fast Flow Nozzle may be protecting may fluctuate significantly.
Distribution Statement A: Approved for Public Release; Distribution Unlimited
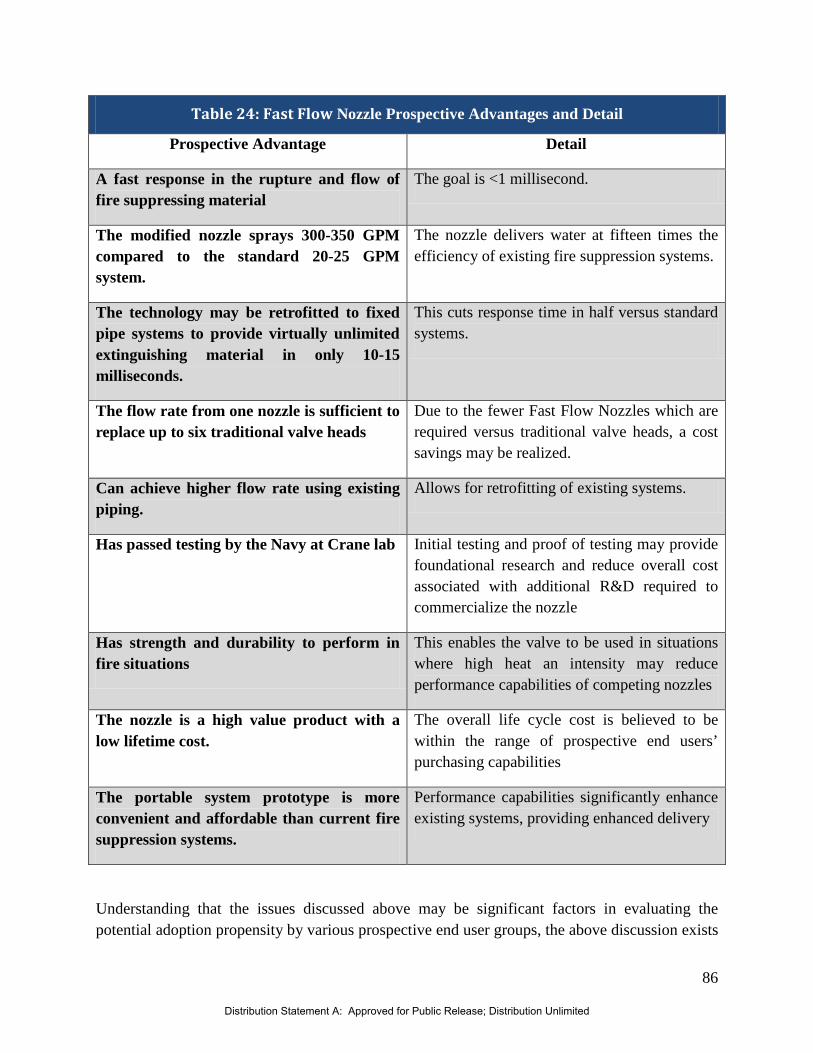
86
Table 24: Fast Flow Nozzle Prospective Advantages and Detail
Prospective Advantage Detail
A fast response in the rupture and flow of fire suppressing material
The goal is <1 millisecond.
The modified nozzle sprays 300-350 GPM compared to the standard 20-25 GPM system.
The nozzle delivers water at fifteen times the efficiency of existing fire suppression systems.
The technology may be retrofitted to fixed pipe systems to provide virtually unlimited extinguishing material in only 10-15 milliseconds.
This cuts response time in half versus standard systems.
The flow rate from one nozzle is sufficient to replace up to six traditional valve heads
Due to the fewer Fast Flow Nozzles which are required versus traditional valve heads, a cost savings may be realized.
Can achieve higher flow rate using existing piping.
Allows for retrofitting of existing systems.
Has passed testing by the Navy at Crane lab Initial testing and proof of testing may provide foundational research and reduce overall cost associated with additional R&D required to commercialize the nozzle
Has strength and durability to perform in fire situations
This enables the valve to be used in situations where high heat an intensity may reduce performance capabilities of competing nozzles
The nozzle is a high value product with a low lifetime cost.
The overall life cycle cost is believed to be within the range of prospective end users’ purchasing capabilities
The portable system prototype is more convenient and affordable than current fire suppression systems.
Performance capabilities significantly enhance existing systems, providing enhanced delivery
Understanding that the issues discussed above may be significant factors in evaluating the potential adoption propensity by various prospective end user groups, the above discussion exists
Distribution Statement A: Approved for Public Release; Distribution Unlimited

87
while holding price constant. That said, consideration may be given to the potentially competitive cost of the Fast Flow Nozzle against currently commercialized (and employed) suppression systems (particularly due to the nozzle’s ability to be retrofitted into existing systems). Potential licensees may work to gain a better understanding of fundamental segment needs and develop marketing strategies that leverage the degree to which the Fast Flow Nozzle may fit those particular needs gaps. Additionally, while the Fast Flow Nozzle may be categorized on the market as a suppression technology, a further investigation of consumer perception may serve to develop an understanding of potential market penetration strategies that may differentiate the Fast Flow Nozzle from potential competition. Said another way, if prospective end users develop a side-by-side perceptual comparison of the Fast Flow Nozzle against currently commercialized technologies such as existing deluge suppression systems, initial considerations may be made within the contextual bounds of suppression technologies and as such may drive up front observations to that of price. If price is the driving factor for suppression technologies, then on a fundamental level, the Fast Flow Nozzle may be priced fairly competitive within the market. However, if prospective Fast Flow Nozzle licensees are able to drive perceptual development of the nozzle within the market place as a technology that is not simply a suppression technology, but something that may offer additional benefits with application extensions other than fire suppression, perhaps price disparities (that may exist if components such as a cost-effective gas generator are unable to be procured) may be justified. Additionally, if the added benefit that the Fast Flow Nozzle may provide to prospective end users is effectively articulated, then any disparity may also be overcome.
Ultimately, understanding that switching costs may be a potential barrier to market penetration for technologies such as the Fast Flow Nozzle, developing strategies that aim to mitigate and overcome this and other barriers may serve to enhance the attractiveness of the Fast Flow Nozzle to target markets and may work to assist in the driving of market adoption.
Distribution Statement A: Approved for Public Release; Distribution Unlimited

88
6 Conclusion
The Fast Flow Nozzle works to enhance fire and explosion containment and suppression capabilities of those prospective end users for which high-flow, fast response fire suppression may be necessitated. Although currently commercialized fire suppression systems may work to mitigate damage caused by high intensity fires or explosions, the Fast Flow Nozzle may offer an alternative suppression system that works to decrease potential destruction by detecting and suppressing fires and explosions faster than currently commercialized systems. The Fast Flow Nozzle then strives to offer the prospective advantages tabulated below:
Table 25: Fast Flow Nozzle Prospective Advantages and Detail
Prospective Advantage Detail
A fast response in the rupture and flow of fire suppressing material
The goal is <1 millisecond.
The modified nozzle sprays 300-350 GPM compared to the standard 20-25 GPM system.
The nozzle delivers water at fifteen times the efficiency of existing fire suppression systems.
The technology may be retrofitted to fixed pipe systems to provide virtually unlimited extinguishing material in only 10-15 milliseconds.
This cuts response time in half versus standard systems.
The flow rate from one nozzle is sufficient to replace up to six traditional valve heads
Due to the fewer Fast Flow Nozzles which are required versus traditional valve heads, a cost savings may be realized.
Can achieve higher flow rate using existing piping.
Allows for retrofitting of existing systems.
Has passed testing by the Navy at Crane lab
Initial testing and proof of testing may provide foundational research and reduce overall cost associated with additional R&D required to commercialize the nozzle
Has strength and durability to perform in fire situations
This enables the valve to be used in situations where high heat an intensity may reduce performance capabilities of competing nozzles
Distribution Statement A: Approved for Public Release; Distribution Unlimited

89
The nozzle is a high value product with a low lifetime cost.
The overall life cycle cost is believed to be within the range of prospective end users’ purchasing capabilities
The portable system prototype is more convenient and affordable than current fire suppression systems.
Performance capabilities significantly enhance existing systems, providing enhanced delivery
Prospective advantages of the Fast Flow Nozzle may constitute a source of product differentiation and competitive advantage. Relative to currently commercialized suppression systems, the Fast Flow Nozzle may serve to enhance the capabilities of prospective end users to suppress or contain explosive blasts or fires resulting in a number of applications. As the Fast Flow Nozzle is further developed and market adoption ensues, articulating the prospective advantages tabulated above and framing them in such a way that aligns with prospective end user purchase parameters, competitive ability may be strengthened.
Existing fire suppression systems have been commercialized and may have a strong hold on the market. As the Fast Flow Nozzle may be retrofitted into existing systems, attractiveness may ultimately hinge on its performance capabilities above that of currently commercialized units. Additionally, while it is yet to be determined whether the Fast Flow Nozzle will initially serve as a complement or substitute to existing fire suppression technologies (whether it will be retrofitted or completely installed with a new unit) within the competitive landscape, the former may be more probable and may ease resistance to entry exerted by the market incumbents
Further, the cost of adoption may be a critical point of consideration for prospective end users, and adoption may be resultant of a cost-benefit analysis where the Fast Flow Nozzle is compared against both existing suppression systems and potential alternatives. As commercialization and penetration strategies are developed, consideration may be given to the cost structures currently in place for suppression technologies for various markets examined. Based on prospective end user groups, pricing considerations may need to take into account purchasing power and/or propensity to purchase.
Based on the data examined, the civilian manufacturing oil and gas production markets may warrant strategic consideration for initial market entry. These two markets appear to have a clear and well defined need for fire suppression technologies in various settings. Understanding that there may exist a clear need for suppression systems, it may appear that technologies that are developed, and which serve to enhance the suppression capabilities for these applications may at the least warrant consideration from said prospective end users. While adoption may rely not only on suppression performance, but also on variables like price and ease of use, these variables should be considered in marketing and communications strategies aimed at increasing awareness
Distribution Statement A: Approved for Public Release; Distribution Unlimited

90
of the Fast Flow Nozzle, its prospective advantages and the real ROI that it can generate in suppression situations.
Ultimately, the Fast Flow Nozzle appears technologically viable. That said, there appears to be a definite market for suppression technologies like the Fast Flow Nozzle. Adoption may rely heavily on the ability of prospective licensees or partners to work to develop customized, yet cost-effective fire suppression systems using the Fast Flow Nozzle that significantly enhance suppression capabilities. Further, while the Fast Flow Nozzle may provide enhanced fire suppression capabilities to prospective end users, price may be a key factor with regard to marginal enhancements in suppression performance and the incremental cost at which the prospective end users may have to incur to achieve superior performance. That said, commercialization strategies may also work to align potential price points with prospective end user budgetary considerations.
Distribution Statement A: Approved for Public Release; Distribution Unlimited
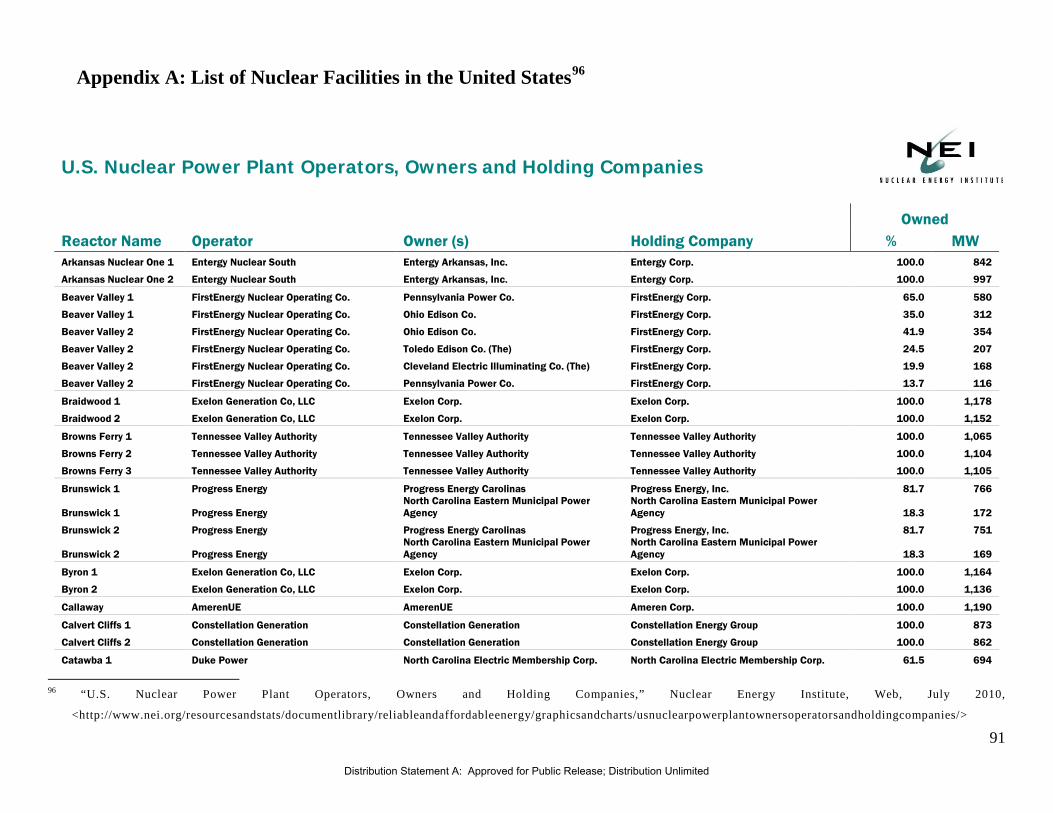
91
Appendix A: List of Nuclear Facilities in the United States96
U.S. Nuclear Power Plant Operators, Owners and Holding Companies
Owned
Reactor Name Operator Owner (s) Holding Company % MW Arkansas Nuclear One 1 Entergy Nuclear South Entergy Arkansas, Inc. Entergy Corp. 100.0 842
Arkansas Nuclear One 2 Entergy Nuclear South Entergy Arkansas, Inc. Entergy Corp. 100.0 997
Beaver Valley 1 FirstEnergy Nuclear Operating Co. Pennsylvania Power Co. FirstEnergy Corp. 65.0 580
Beaver Valley 1 FirstEnergy Nuclear Operating Co. Ohio Edison Co. FirstEnergy Corp. 35.0 312
Beaver Valley 2 FirstEnergy Nuclear Operating Co. Ohio Edison Co. FirstEnergy Corp. 41.9 354
Beaver Valley 2 FirstEnergy Nuclear Operating Co. Toledo Edison Co. (The) FirstEnergy Corp. 24.5 207
Beaver Valley 2 FirstEnergy Nuclear Operating Co. Cleveland Electric Illuminating Co. (The) FirstEnergy Corp. 19.9 168
Beaver Valley 2 FirstEnergy Nuclear Operating Co. Pennsylvania Power Co. FirstEnergy Corp. 13.7 116
Braidwood 1 Exelon Generation Co, LLC Exelon Corp. Exelon Corp. 100.0 1,178
Braidwood 2 Exelon Generation Co, LLC Exelon Corp. Exelon Corp. 100.0 1,152
Browns Ferry 1 Tennessee Valley Authority Tennessee Valley Authority Tennessee Valley Authority 100.0 1,065
Browns Ferry 2 Tennessee Valley Authority Tennessee Valley Authority Tennessee Valley Authority 100.0 1,104
Browns Ferry 3 Tennessee Valley Authority Tennessee Valley Authority Tennessee Valley Authority 100.0 1,105
Brunswick 1 Progress Energy Progress Energy Carolinas Progress Energy, Inc. 81.7 766
Brunswick 1 Progress Energy North Carolina Eastern Municipal Power Agency
North Carolina Eastern Municipal Power Agency 18.3 172
Brunswick 2 Progress Energy Progress Energy Carolinas Progress Energy, Inc. 81.7 751
Brunswick 2 Progress Energy North Carolina Eastern Municipal Power Agency
North Carolina Eastern Municipal Power Agency 18.3 169
Byron 1 Exelon Generation Co, LLC Exelon Corp. Exelon Corp. 100.0 1,164
Byron 2 Exelon Generation Co, LLC Exelon Corp. Exelon Corp. 100.0 1,136
Callaway AmerenUE AmerenUE Ameren Corp. 100.0 1,190
Calvert Cliffs 1 Constellation Generation Constellation Generation Constellation Energy Group 100.0 873
Calvert Cliffs 2 Constellation Generation Constellation Generation Constellation Energy Group 100.0 862
Catawba 1 Duke Power North Carolina Electric Membership Corp. North Carolina Electric Membership Corp. 61.5 694
96 “U.S. Nuclear Power Plant Operators, Owners and Holding Companies,” Nuclear Energy Institute, Web, July 2010,
<http://www.nei.org/resourcesandstats/documentlibrary/reliableandaffordableenergy/graphicsandcharts/usnuclearpowerplantownersoperatorsandholdingcompanies/>
Distribution Statement A: Approved for Public Release; Distribution Unlimited
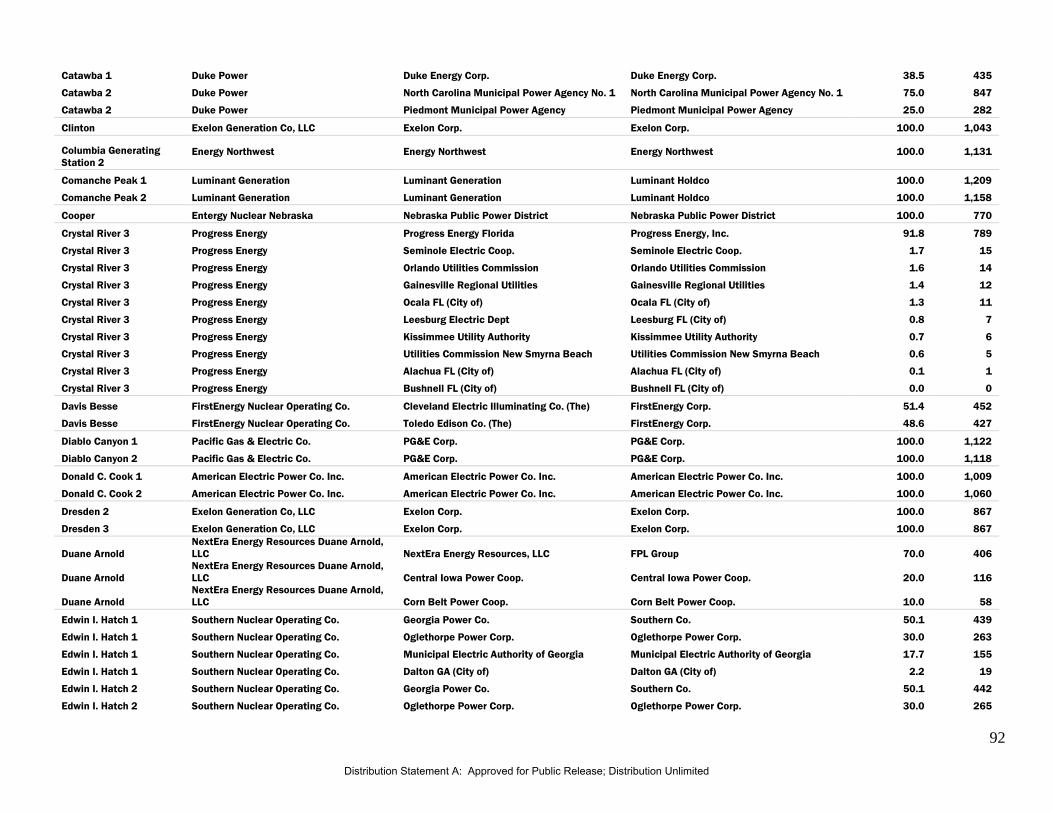
92
Catawba 1 Duke Power Duke Energy Corp. Duke Energy Corp. 38.5 435
Catawba 2 Duke Power North Carolina Municipal Power Agency No. 1 North Carolina Municipal Power Agency No. 1 75.0 847
Catawba 2 Duke Power Piedmont Municipal Power Agency Piedmont Municipal Power Agency 25.0 282
Clinton Exelon Generation Co, LLC Exelon Corp. Exelon Corp. 100.0 1,043
Columbia Generating Station 2
Energy Northwest Energy Northwest Energy Northwest 100.0 1,131
Comanche Peak 1 Luminant Generation Luminant Generation Luminant Holdco 100.0 1,209
Comanche Peak 2 Luminant Generation Luminant Generation Luminant Holdco 100.0 1,158
Cooper Entergy Nuclear Nebraska Nebraska Public Power District Nebraska Public Power District 100.0 770
Crystal River 3 Progress Energy Progress Energy Florida Progress Energy, Inc. 91.8 789
Crystal River 3 Progress Energy Seminole Electric Coop. Seminole Electric Coop. 1.7 15
Crystal River 3 Progress Energy Orlando Utilities Commission Orlando Utilities Commission 1.6 14
Crystal River 3 Progress Energy Gainesville Regional Utilities Gainesville Regional Utilities 1.4 12
Crystal River 3 Progress Energy Ocala FL (City of) Ocala FL (City of) 1.3 11
Crystal River 3 Progress Energy Leesburg Electric Dept Leesburg FL (City of) 0.8 7
Crystal River 3 Progress Energy Kissimmee Utility Authority Kissimmee Utility Authority 0.7 6
Crystal River 3 Progress Energy Utilities Commission New Smyrna Beach Utilities Commission New Smyrna Beach 0.6 5
Crystal River 3 Progress Energy Alachua FL (City of) Alachua FL (City of) 0.1 1
Crystal River 3 Progress Energy Bushnell FL (City of) Bushnell FL (City of) 0.0 0
Davis Besse FirstEnergy Nuclear Operating Co. Cleveland Electric Illuminating Co. (The) FirstEnergy Corp. 51.4 452
Davis Besse FirstEnergy Nuclear Operating Co. Toledo Edison Co. (The) FirstEnergy Corp. 48.6 427
Diablo Canyon 1 Pacific Gas & Electric Co. PG&E Corp. PG&E Corp. 100.0 1,122
Diablo Canyon 2 Pacific Gas & Electric Co. PG&E Corp. PG&E Corp. 100.0 1,118
Donald C. Cook 1 American Electric Power Co. Inc. American Electric Power Co. Inc. American Electric Power Co. Inc. 100.0 1,009
Donald C. Cook 2 American Electric Power Co. Inc. American Electric Power Co. Inc. American Electric Power Co. Inc. 100.0 1,060
Dresden 2 Exelon Generation Co, LLC Exelon Corp. Exelon Corp. 100.0 867
Dresden 3 Exelon Generation Co, LLC Exelon Corp. Exelon Corp. 100.0 867
Duane Arnold NextEra Energy Resources Duane Arnold, LLC NextEra Energy Resources, LLC FPL Group 70.0 406
Duane Arnold NextEra Energy Resources Duane Arnold, LLC Central Iowa Power Coop. Central Iowa Power Coop. 20.0 116
Duane Arnold NextEra Energy Resources Duane Arnold, LLC Corn Belt Power Coop. Corn Belt Power Coop. 10.0 58
Edwin I. Hatch 1 Southern Nuclear Operating Co. Georgia Power Co. Southern Co. 50.1 439
Edwin I. Hatch 1 Southern Nuclear Operating Co. Oglethorpe Power Corp. Oglethorpe Power Corp. 30.0 263
Edwin I. Hatch 1 Southern Nuclear Operating Co. Municipal Electric Authority of Georgia Municipal Electric Authority of Georgia 17.7 155
Edwin I. Hatch 1 Southern Nuclear Operating Co. Dalton GA (City of) Dalton GA (City of) 2.2 19
Edwin I. Hatch 2 Southern Nuclear Operating Co. Georgia Power Co. Southern Co. 50.1 442
Edwin I. Hatch 2 Southern Nuclear Operating Co. Oglethorpe Power Corp. Oglethorpe Power Corp. 30.0 265
Distribution Statement A: Approved for Public Release; Distribution Unlimited

93
Edwin I. Hatch 2 Southern Nuclear Operating Co. Municipal Electric Authority of Georgia Municipal Electric Authority of Georgia 17.7 156
Edwin I. Hatch 2 Southern Nuclear Operating Co. Dalton GA (City of) Dalton GA (City of) 2.2 19
Fermi 2 Detroit Edison Co (The) DTE Energy Co. DTE Energy Co. 100.0 1,122
Fort Calhoun Omaha Public Power District Omaha Public Power District Omaha Public Power District 100.0 482
Ginna Constellation Generation Constellation Generation Constellation Energy Group 100.0 581
Grand Gulf 1 Entergy Nuclear South System Energy Resources, Inc. Entergy Corp. 90.0 1,133
Grand Gulf 1 Entergy Nuclear South South Mississippi Electric Power Association South Mississippi Electric Power Association 10.0 126
H.B. Robinson 2 Progress Energy Progress Energy Carolinas Progress Energy, Inc. 100.0 710
Hope Creek 1 PSEG Nuclear, LLC PSEG Power Public Service Enterprise Group, Inc. 100.0 1,161
Indian Point 2 Entergy Nuclear Northeast Entergy Nuclear Operations, Inc. Entergy Corp. 100.0 1,025
Indian Point 3 Entergy Nuclear Northeast Entergy Nuclear Operations, Inc. Entergy Corp. 100.0 1,040
James A. Fitzpatrick Entergy Nuclear Northeast Entergy Nuclear Operations, Inc. Entergy Corp. 100.0 854
Joseph M. Farley 1 Southern Nuclear Operating Co. Alabama Power Southern Co. 100.0 851
Joseph M. Farley 2 Southern Nuclear Operating Co. Alabama Power Southern Co. 100.0 860
Kewaunee Dominion Generation Dominion Generation Dominion Resources, Inc. 100.0 556
La Salle 1 Exelon Generation Co, LLC Exelon Corp. Exelon Corp. 100.0 1,118
La Salle 2 Exelon Generation Co, LLC Exelon Corp. Exelon Corp. 100.0 1,120
Limerick 1 Exelon Generation Co, LLC Exelon Corp. Exelon Corp. 100.0 1,130
Limerick 2 Exelon Generation Co, LLC Exelon Corp. Exelon Corp. 100.0 1,134
McGuire 1 Duke Power Duke Energy Corp. Duke Energy Corp. 100.0 1,100
McGuire 2 Duke Power Duke Energy Corp. Duke Energy Corp. 100.0 1,100
Millstone 2 Dominion Generation Dominion Resources, Inc. Dominion Resources, Inc. 100.0 877
Millstone 3 Dominion Generation Dominion Resources, Inc. Dominion Resources, Inc. 93.5 1,063
Millstone 3 Dominion Generation Massachusetts Municipal Wholesale Electric Co.
Massachusetts Municipal Wholesale Electric Co. 4.8 55
Millstone 3 Dominion Generation Central Vermont Public Service Corp. Central Vermont Public Service Corp. 1.7 20
Monticello Northern States Power Company Xcel Energy, Inc. Xcel Energy, Inc. 100.0 572
Nine Mile Point 1 Constellation Generation Constellation Generation Constellation Energy Group 100.0 621
Nine Mile Point 2 Constellation Generation Constellation Generation Constellation Energy Group 82.0 937
Nine Mile Point 2 Constellation Generation Long Island Power Authority Long Island Power Authority 18.0 206
North Anna 1 Dominion Generation Virginia Electric & Power Co. Dominion Resources, Inc. 88.4 798
North Anna 1 Dominion Generation Old Dominion Electric Coop. Old Dominion Electric Coop. 11.6 105
North Anna 2 Dominion Generation Virginia Electric & Power Co. Dominion Resources, Inc. 88.4 798
North Anna 2 Dominion Generation Old Dominion Electric Coop. Old Dominion Electric Coop. 11.6 105
Oconee 1 Duke Power Duke Energy Corp. Duke Energy Corp. 100.0 846
Oconee 2 Duke Power Duke Energy Corp. Duke Energy Corp. 100.0 846
Oconee 3 Duke Power Duke Energy Corp. Duke Energy Corp. 100.0 846
Oyster Creek 1 Exelon Generation Co, LLC Exelon Corp. Exelon Corp. 100.0 615
Distribution Statement A: Approved for Public Release; Distribution Unlimited

94
Palisades Entergy Nuclear Entergy Nuclear Entergy Corp. 100.0 778
Palo Verde 1 Arizona Public Service Co. Arizona Public Service Co. Pinnacle West Capital Corp. 29.1 382
Palo Verde 1 Arizona Public Service Co. Salt River Project Salt River Project 17.5 229
Palo Verde 1 Arizona Public Service Co. El Paso Electric Co. El Paso Electric Co. 15.8 207
Palo Verde 1 Arizona Public Service Co. Southern California Edison Co. Edison International 15.8 207
Palo Verde 1 Arizona Public Service Co. Public Service Co of New Mexico PNM Resources, Inc. 10.2 134
Palo Verde 1 Arizona Public Service Co. Southern California Public Power Authority Southern California Public Power Authority 5.9 77
Palo Verde 1 Arizona Public Service Co. Los Angeles Dept. of Water & Power Los Angeles Dept of Water & Power 5.7 75
Palo Verde 2 Arizona Public Service Co. Arizona Public Service Co. Pinnacle West Capital Corp. 29.1 382
Palo Verde 2 Arizona Public Service Co. Salt River Project Salt River Project 17.5 230
Palo Verde 2 Arizona Public Service Co. El Paso Electric Co. El Paso Electric Co. 15.8 208
Palo Verde 2 Arizona Public Service Co. Southern California Edison Co. Edison International 15.8 208
Palo Verde 2 Arizona Public Service Co. Public Service Co of New Mexico PNM Resources, Inc. 10.2 134
Palo Verde 2 Arizona Public Service Co. Southern California Public Power Authority Southern California Public Power Authority 5.9 78
Palo Verde 2 Arizona Public Service Co. Los Angeles Dept. of Water & Power Los Angeles Dept of Water & Power 5.7 75
Palo Verde 3 Arizona Public Service Co. Arizona Public Service Co. Pinnacle West Capital Corp. 29.1 383
Palo Verde 3 Arizona Public Service Co. Salt River Project Salt River Project 17.5 230
Palo Verde 3 Arizona Public Service Co. El Paso Electric Co. El Paso Electric Co. 15.8 208
Palo Verde 3 Arizona Public Service Co. Southern California Edison Co. Edison International 15.8 208
Palo Verde 3 Arizona Public Service Co. Public Service Co of New Mexico PNM Resources, Inc. 10.2 134
Palo Verde 3 Arizona Public Service Co. Southern California Public Power Authority Southern California Public Power Authority 5.9 78
Palo Verde 3 Arizona Public Service Co. Los Angeles Dept. of Water & Power Los Angeles Dept of Water & Power 5.7 75
Peach Bottom 2 Exelon Generation Co, LLC Exelon Corp. Exelon Corp. 50.0 556
Peach Bottom 2 Exelon Generation Co, LLC PSEG Power Public Service Enterprise Group, Inc. 50.0 556
Peach Bottom 3 Exelon Generation Co, LLC Exelon Corp. Exelon Corp. 50.0 556
Peach Bottom 3 Exelon Generation Co, LLC PSEG Power Public Service Enterprise Group, Inc. 50.0 556
Perry 1 FirstEnergy Nuclear Operating Co. Cleveland Electric Illuminating Co. (The) FirstEnergy Corp. 44.9 558
Perry 1 FirstEnergy Nuclear Operating Co. Ohio Edison Co. FirstEnergy Corp. 30.0 374
Perry 1 FirstEnergy Nuclear Operating Co. Toledo Edison Co. (The) FirstEnergy Corp. 19.9 248
Perry 1 FirstEnergy Nuclear Operating Co. Pennsylvania Power Co. FirstEnergy Corp. 5.2 65
Pilgrim 1 Entergy Nuclear Northeast Entergy Nuclear Generation Inc. Entergy Corp. 100.0 685
Point Beach 1 NextEra Energy Resources Point Beach, LLC NextEra Energy Resources, LLC FPL Group 100.0 510
Point Beach 2 NextEra Energy Resources Point Beach, LLC NextEra Energy Resources, LLC FPL Group 100.0 516
Prairie Island 1 Northern States Power Company Xcel Energy, Inc. Xcel Energy, Inc. 100.0 551
Prairie Island 2 Northern States Power Company Xcel Energy, Inc. Xcel Energy, Inc. 100.0 545
Quad Cities 1 Exelon Generation Co, LLC Exelon Corp. Exelon Corp. 75.0 650
Quad Cities 1 Exelon Generation Co, LLC MidAmerican Energy Co. Berkshire Hathaway, Inc. 25.0 217
Distribution Statement A: Approved for Public Release; Distribution Unlimited

95
Quad Cities 2 Exelon Generation Co, LLC Exelon Corp. Exelon Corp. 75.0 650
Quad Cities 2 Exelon Generation Co, LLC MidAmerican Energy Co. Berkshire Hathaway, Inc. 25.0 217
River Bend 1 Entergy Nuclear South Entergy Gulf States, Inc. Entergy Corp. 100.0 978
Salem 1 PSEG Nuclear, LLC PSEG Power Public Service Enterprise Group, Inc. 57.4 674
Salem 1 PSEG Nuclear, LLC Exelon Corp. Exelon Corp. 42.6 500
Salem 2 PSEG Nuclear, LLC PSEG Power Public Service Enterprise Group, Inc. 57.4 665
Salem 2 PSEG Nuclear, LLC Exelon Corp. Exelon Corp. 42.6 493
San Onofre 2 Southern California Edison Co. Southern California Edison Co. Edison International 75.1 803
San Onofre 2 Southern California Edison Co. San Diego Gas & Electric Co. Sempra Energy 20.0 214
San Onofre 2 Southern California Edison Co. Anaheim Public Utilities Dept. Anaheim CA (City of) 3.2 34
San Onofre 2 Southern California Edison Co. Riverside Public Utilities Riverside Public Utilities 1.8 19
San Onofre 3 Southern California Edison Co. Southern California Edison Co. Edison International 75.1 811
San Onofre 3 Southern California Edison Co. San Diego Gas & Electric Co. Sempra Energy 20.0 216
San Onofre 3 Southern California Edison Co. Anaheim Public Utilities Dept. Anaheim CA (City of) 3.2 34
San Onofre 3 Southern California Edison Co. Riverside Public Utilities Riverside Public Utilities 1.8 19
Seabrook 1 NextEra Energy Resources Seabrook, LLC NextEra Energy Resources, LLC FPL Group 88.2 1,099
Seabrook 1 NextEra Energy Resources Seabrook, LLC Massachusetts Municipal Wholesale Electric Co.
Massachusetts Municipal Wholesale Electric Co. 11.6 144
Seabrook 1 NextEra Energy Resources Seabrook, LLC Taunton Municipal Lighting Plant Taunton Municipal Lighting Plant 0.1 1
Seabrook 1 NextEra Energy Resources Seabrook, LLC Hudson Light & Power Dept. Hudson Light & Power Dept. 0.1 1
Sequoyah 1 Tennessee Valley Authority Tennessee Valley Authority Tennessee Valley Authority 100.0 1,148
Sequoyah 2 Tennessee Valley Authority Tennessee Valley Authority Tennessee Valley Authority 100.0 1,126
Shearon Harris 1 Progress Energy Progress Energy Carolinas Progress Energy, Inc. 83.8 754
Shearon Harris 1 Progress Energy North Carolina Eastern Municipal Power Agency
North Carolina Eastern Municipal Power Agency 16.2 146
South Texas Project 1 STP Nuclear Operating Co. NRG Energy NRG Energy, Inc. 44.0 563
South Texas Project 1 STP Nuclear Operating Co. CPS Energy CPS Energy 40.0 512
South Texas Project 1 STP Nuclear Operating Co. Austin Energy Austin Energy 16.0 205
South Texas Project 2 STP Nuclear Operating Co. NRG Energy NRG Energy, Inc. 44.0 563
South Texas Project 2 STP Nuclear Operating Co. CPS Energy CPS Energy 40.0 512
South Texas Project 2 STP Nuclear Operating Co. Austin Energy Austin Energy 16.0 205
St. Lucie 1 Florida Power & Light Co. Florida Power & Light Co. FPL Group 100.0 839
St. Lucie 2 Florida Power & Light Co. Florida Power & Light Co. FPL Group 85.1 714
St. Lucie 2 Florida Power & Light Co. Florida Municipal Power Agency Florida Municipal Power Agency 8.8 74
St. Lucie 2 Florida Power & Light Co. Orlando Utilities Commission Orlando Utilities Commission 6.1 51
Surry 1 Dominion Generation Dominion Resources, Inc. Dominion Resources, Inc. 100.0 799
Surry 2 Dominion Generation Dominion Resources, Inc. Dominion Resources, Inc. 100.0 799
Susquehanna 1 PPL Susquehanna, LLC PPL Corp. PPL Corp. 90.0 1,067
Susquehanna 1 PPL Susquehanna, LLC Allegheny Electric Coop, Inc. Allegheny Electric Coop, Inc. 10.0 119
Distribution Statement A: Approved for Public Release; Distribution Unlimited

96
Susquehanna 2 PPL Susquehanna, LLC PPL Corp. PPL Corp. 90.0 1,026
Susquehanna 2 PPL Susquehanna, LLC Allegheny Electric Coop, Inc. Allegheny Electric Coop, Inc. 10.0 114
Three Mile Island 1 Exelon Generation Co, LLC Exelon Corp. Exelon Corp. 100.0 786
Turkey Point 3 Florida Power & Light Co. FPL Group FPL Group 100.0 693
Turkey Point 4 Florida Power & Light Co. FPL Group FPL Group 100.0 693
V.C. Summer South Carolina Electric & Gas Co. South Carolina Electric & Gas Co. SCANA Corp. 66.7 644
V.C. Summer South Carolina Electric & Gas Co. Santee Cooper Santee Cooper 33.3 322
Vermont Yankee 1 Entergy Nuclear Vermont Yankee, LLC Entergy Nuclear Operations, Inc. Entergy Corp. 100.0 620
Vogtle 1 Southern Nuclear Operating Co. Georgia Power Co. Southern Co. 45.7 526
Vogtle 1 Southern Nuclear Operating Co. Oglethorpe Power Corp. Oglethorpe Power Corp. 30.0 345
Vogtle 1 Southern Nuclear Operating Co. Municipal Electric Authority of Georgia Municipal Electric Authority of Georgia 22.7 261
Vogtle 1 Southern Nuclear Operating Co. Dalton GA (City of) Dalton GA (City of) 1.6 18
Vogtle 2 Southern Nuclear Operating Co. Georgia Power Co. Southern Co. 45.7 526
Vogtle 2 Southern Nuclear Operating Co. Oglethorpe Power Corp. Oglethorpe Power Corp. 30.0 346
Vogtle 2 Southern Nuclear Operating Co. Municipal Electric Authority of Georgia Municipal Electric Authority of Georgia 22.7 262
Vogtle 2 Southern Nuclear Operating Co. Dalton GA (City of) Dalton GA (City of) 1.6 18
Waterford 3 Entergy Nuclear South Entergy Louisiana, Inc. Entergy Corp. 100.0 1,176
Watts Bar 1 Tennessee Valley Authority Tennessee Valley Authority Tennessee Valley Authority 100.0 1,123
Wolf Creek 1 Wolf Creek Nuclear Operations Corp. Kansas City Power & Light Co. Great Plains Energy, Inc. 47.0 545
Wolf Creek 1 Wolf Creek Nuclear Operations Corp. Kansas Gas & Electric Co. Westar Energy, Inc. 47.0 545
Wolf Creek 1 Wolf Creek Nuclear Operations Corp. Kansas Electric Power Coop. Kansas Electric Power Coop, Inc. 6.0 70
Updated: 5/10 Owner companies belong to the holding companies.
Distribution Statement A: Approved for Public Release; Distribution Unlimited

97
Appendix B: Evaluation of Fike® Corporation’s Explosion Suppression System for Ultra-High Speed Fire Suppression Applications
Distribution Statement A: Approved for Public Release; Distribution Unlimited

98
Distribution Statement A: Approved for Public Release; Distribution Unlimited

99
Distribution Statement A: Approved for Public Release; Distribution Unlimited
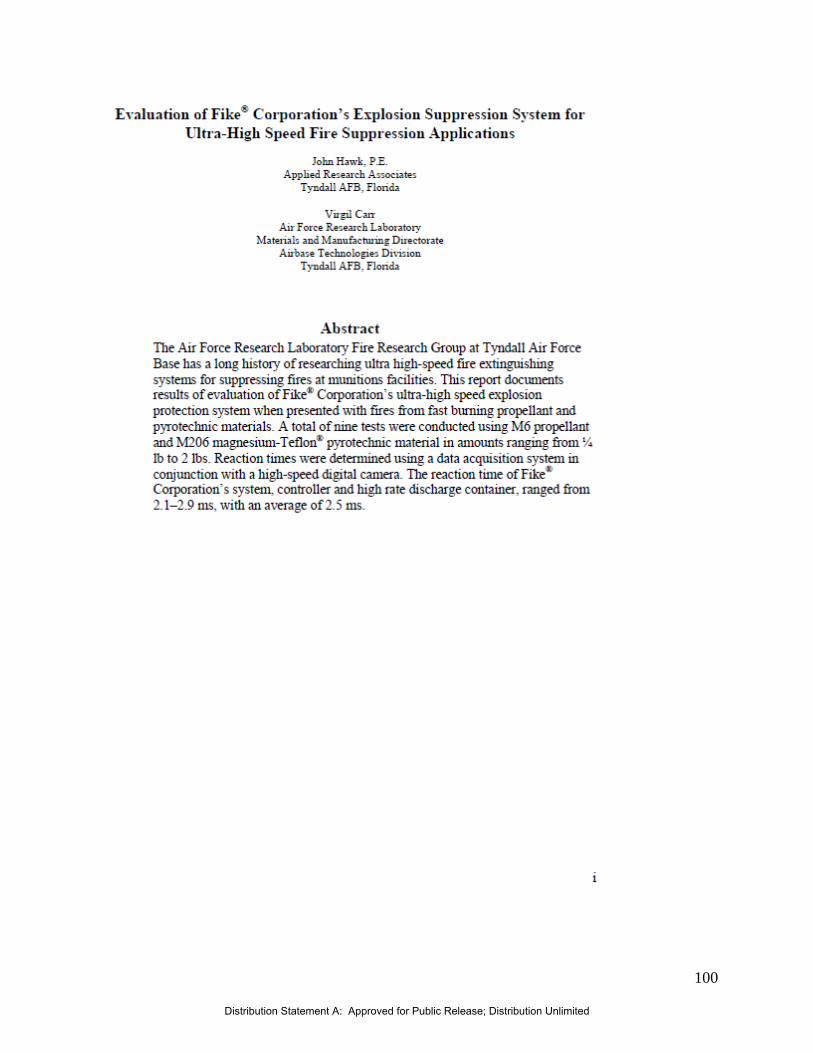
100
Distribution Statement A: Approved for Public Release; Distribution Unlimited

101
Distribution Statement A: Approved for Public Release; Distribution Unlimited

102
Distribution Statement A: Approved for Public Release; Distribution Unlimited

103
Distribution Statement A: Approved for Public Release; Distribution Unlimited

104
Distribution Statement A: Approved for Public Release; Distribution Unlimited
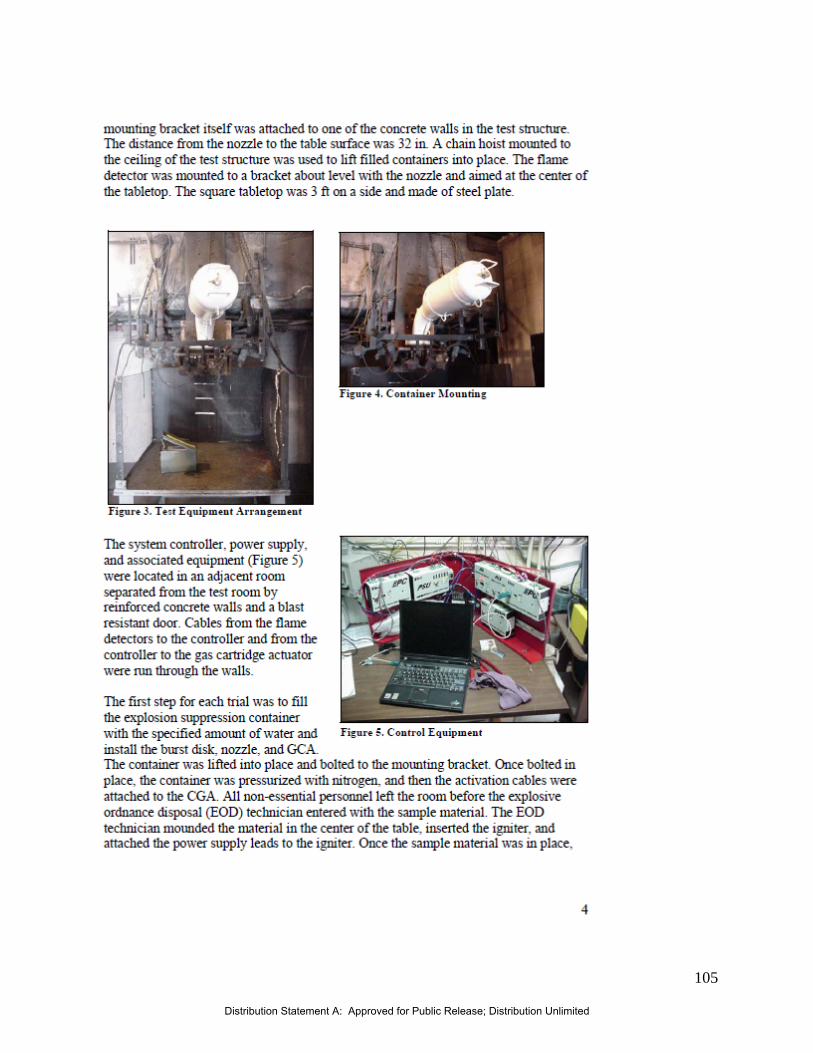
105
Distribution Statement A: Approved for Public Release; Distribution Unlimited

106
Distribution Statement A: Approved for Public Release; Distribution Unlimited

107
Distribution Statement A: Approved for Public Release; Distribution Unlimited

108
Distribution Statement A: Approved for Public Release; Distribution Unlimited

109
Appendix C: Blast Initiated Deluge System Assessment-AFRL
Distribution Statement A: Approved for Public Release; Distribution Unlimited

110
Distribution Statement A: Approved for Public Release; Distribution Unlimited

111
Distribution Statement A: Approved for Public Release; Distribution Unlimited

112
Distribution Statement A: Approved for Public Release; Distribution Unlimited
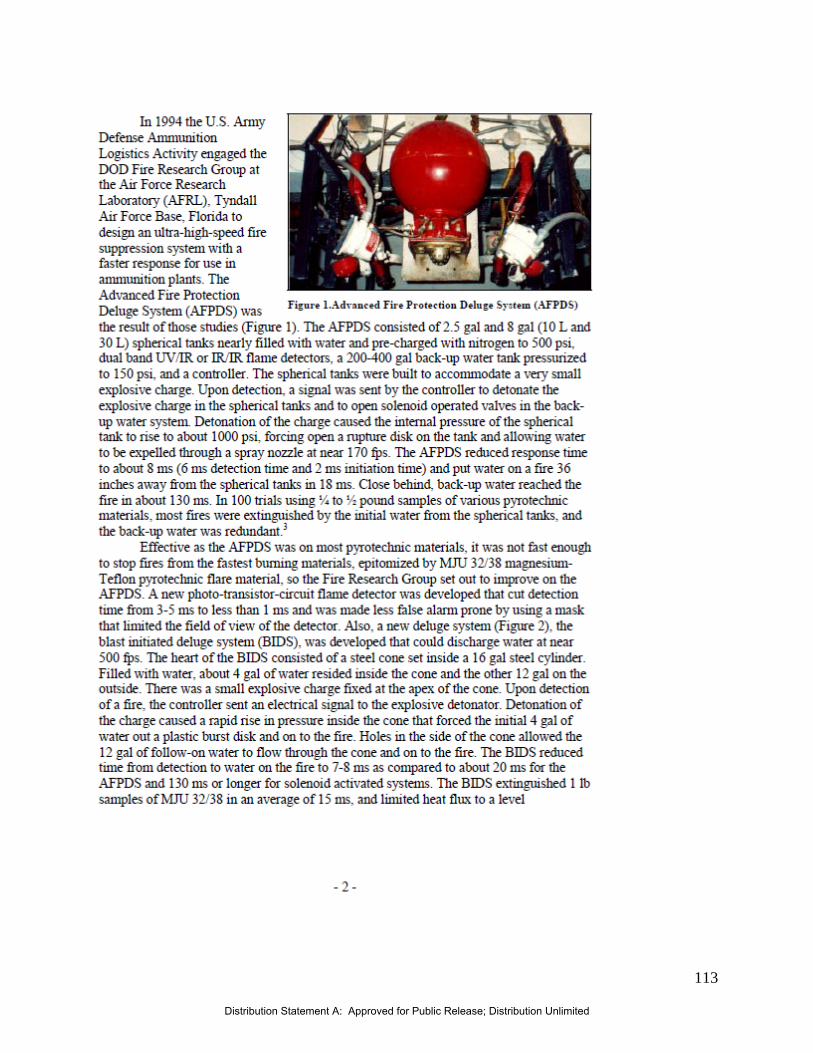
113
Distribution Statement A: Approved for Public Release; Distribution Unlimited

114
Distribution Statement A: Approved for Public Release; Distribution Unlimited

115
Distribution Statement A: Approved for Public Release; Distribution Unlimited

116
Distribution Statement A: Approved for Public Release; Distribution Unlimited

117
Distribution Statement A: Approved for Public Release; Distribution Unlimited
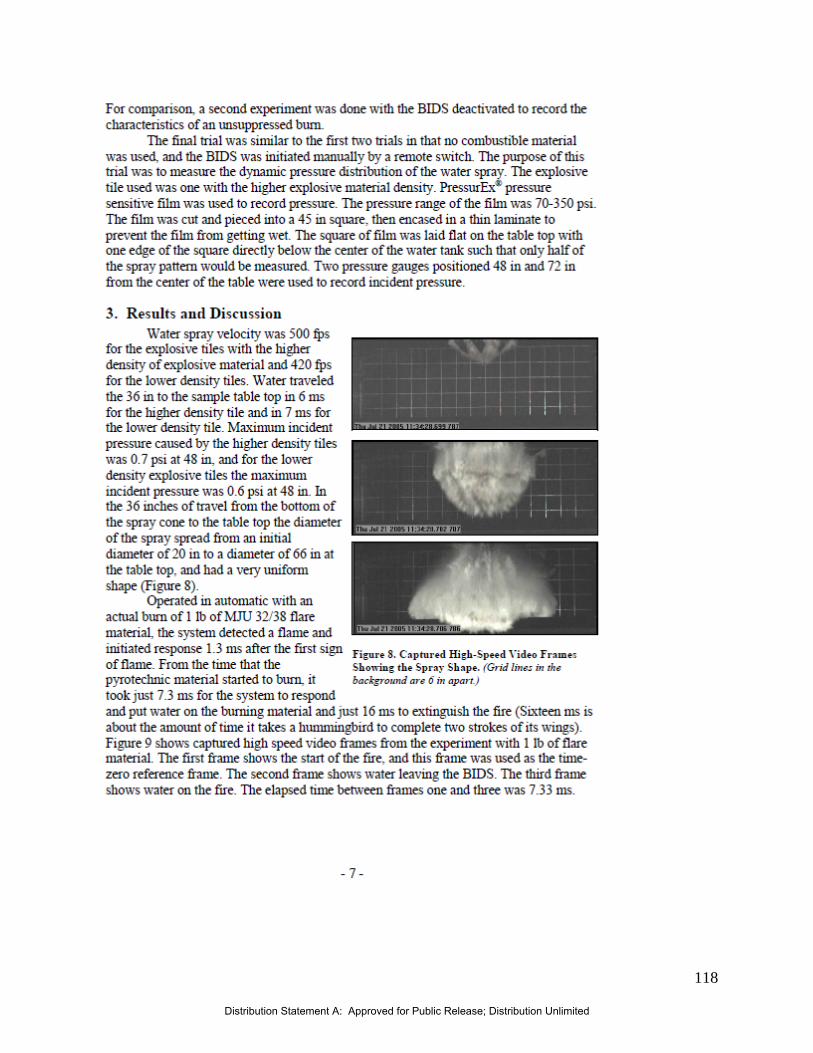
118
Distribution Statement A: Approved for Public Release; Distribution Unlimited

119
Distribution Statement A: Approved for Public Release; Distribution Unlimited

120
Distribution Statement A: Approved for Public Release; Distribution Unlimited

121
Distribution Statement A: Approved for Public Release; Distribution Unlimited

122
Distribution Statement A: Approved for Public Release; Distribution Unlimited

123
Distribution Statement A: Approved for Public Release; Distribution Unlimited

124
Distribution Statement A: Approved for Public Release; Distribution Unlimited