fast spectral rainflow fatigue damage assessment … · fast spectral rainflow fatigue damage...
TRANSCRIPT

ww
w.if
rem
er.fr
lfrem
erFAST SPECTRAL RAINFLOW FATIGUE DAMAGE ASSESSMENT UNDER WIDEBAND MULTIPEAK
LOADING
Michel OLAGNON & Zakoua GUÉDÉIFREMER, Brest (France)
Fatigue Workshop - 24th February 2010Broadband spectral fatigue: from gaussian to non-gaussian, from research to industry

ww
w.if
rem
er.fr
lfrem
er
ContextFine description of sea states climate
as partition into waves systems
Complex fatigue damage assessment a large set of operational sea states (combinations of all the wave systems components) has to be considered
1

ww
w.if
rem
er.fr
lfrem
ermetocean database
discretization+
statistics
scatter diagram (jPDFof HS, Tp, )
dimension = 3 102 to 103 fatigue loadings
unimodal loadings
metocean database
discretization+
statistics
scatter diagrams (jPDF of HS
(i), Tp(i), (i) , i=1,2,3)
dimension = 9 106 to 109 fatigue loadings.
partition
wave systems data (swells, wind sea)
multimodal loadings
2

ww
w.if
rem
er.fr
lfrem
er
ObjectiveUse the Iterative Components Addition (ICA) formulas set up earlier [Olagnon & Guédé, 2008] to simplify the damage computation.
ICA formulas allow to compute the damage of a multimodal loading spectra in terms of the damage of its individual components taken separately, keeping a low level of conservatism.
D( S1 + S2 + S3 … ) = ICA( D(S1) , D(S2) , D(S3) …)
Full damage computation [Stress – Rainflow – Miner] needed only for the wave systems components and ICA-based damage computation for the large set of all their combinations by ICA formula.
drastic reduction of computation time
3

ww
w.if
rem
er.fr
lfrem
er
Outline
1. ICA FROMULA
2. APPLICATION: FPSO ON WEST AFRICA AREA
3. CONCLUSION & PERSSPECTIVES
4

ww
w.if
rem
er.fr
lfrem
er
BASIC IDEA UNDER ICA FORMULA
sum signal
LF signal
MaxA ; minA
MaxB ; minB
Partition of the set of turning points
LF narrow band
Miner damage with S-N curve: N = K Sm
HF & LF clearly separated
Assumptions
From the mathematical formulation of the rainflow counting [Rychlik, 1987], each subset is stable by rainflow counting
DS = DA + DB
1. ICA FORMULA
5

ww
w.if
rem
er.fr
lfrem
er
EXPRESSION OF DAMAGES DA & DB
1. ICA FORMULA
HFm
aNA DkkD S
LH
S
AN N
NNNk ;1
factor due to reduction in number of cycles
scaling effect due to addition of low-frequency signal
S
HFBa
BLFAASS
HF
Aa
MMMk
MNMNMN
MMMk
11 :obtain we
from
mean value range :;
m
BmLFB
MK
ND
E2
(NB)
(NB = NLF)
1
22 m
KND
mlf
LFLF
LF
mB
mB DMm
D
E1
21
1
hf
E[MBm] & E[MB] are estimated with a slightly conservative approximation
of the distribution of MB in terms of some spectral moments6

ww
w.if
rem
er.fr
lfrem
er
1. ICA FORMULA
Approximation of MB distribution
Ff ,The local maxima of the composite signal follow a Rice distribution [1945],
NS/NLH = 1/ : mean number of peaks between two successive zero-upcrossings. The peaks are assumed independent (conservative assumption)
sum signal
LF signal
MaxA ; minA
MaxB ; minB
MB is the maximum among the local maxima between two successive zeroupcrossings of the low-frequency signal
111
11 )()(1)(,)()(
xFxfxyxFxY
7

ww
w.if
rem
er.fr
lfrem
er
1. ICA FORMULA
Conservatism level
The conservatism level (Clevel) is higher for larger and lower For m = 3, Clevel > 130% for ; and ; For m = 5, Clevel > 130% for
8
0.1 mh,0/mt,0 0.9 ; 1.2 Tp,h/Tp;l 20 with Tp,h = 5s
+ m = 3+ m = 5
130%
ww
w.if
rem
er.fr
lfrem
erBriefly,
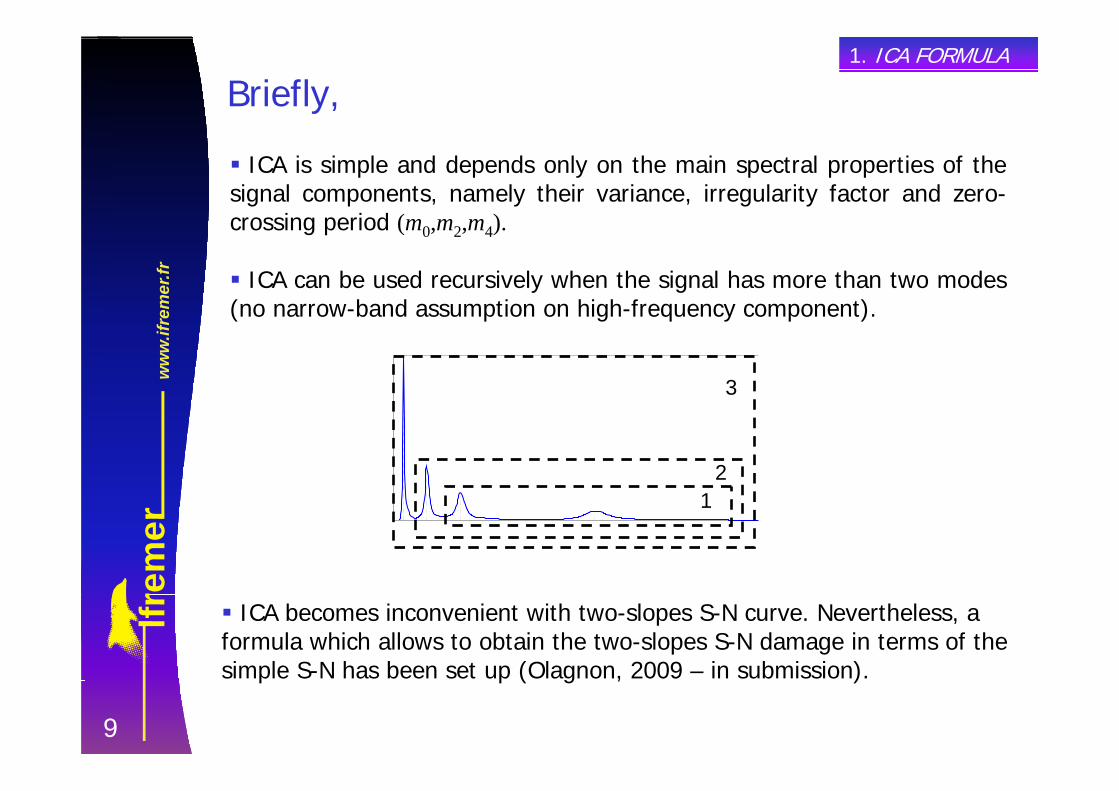
ICA is simple and depends only on the main spectral properties of the signal components, namely their variance, irregularity factor and zero-crossing period (m0,m2,m4).
ICA can be used recursively when the signal has more than two modes(no narrow-band assumption on high-frequency component).
12
3
ICA becomes inconvenient with two-slopes S-N curve. Nevertheless, a formula which allows to obtain the two-slopes S-N damage in terms of the simple S-N has been set up (Olagnon, 2009 – in submission).
1. ICA FORMULA
9

ww
w.if
rem
er.fr
lfrem
erIndustrial application
Wave loadings: from metocean database of measured sea states in the West Africa area (almost 3 years)
Mechanical modeling: Wave bending moment of an FPSO Hull girder linear hydrodynamic response (with RAO)
Fatigue design requirement: double-slopes S-N curve from Bureau Veritas requirements, 100 years design lifetime
Work
Assessment of the occurrence probabilities of all the operational sea states given under some assumptions
Assessment of the total damage• from the metocean database with time-domain simulations• from the operator’s specifications with a ICA-based method
2. APPLICATION
10

ww
w.if
rem
er.fr
lfrem
er
Metocean database partition & assumptions on metocean climate
Assumptions made for the re-construction of the metocean climate
(H1) : independent wave systems
(H2) : wave systems conditioned on the type of combination
Including a requirement to meet the proportions observed in the database and exclusion criteria on the ratio of the peak periods and the discrepancy between the directions (e.g. close wave systems components, unrealistic combinations)
2. APPLICATION
Partitions of the sea states of the metocean databasecombinations number frequency [%]
MS only 1212 15,07MS + SS 2740 34,08MS + WS 1536 19,1
MS + SS + WS 2549 31,7no MS 3 0,05total 8040 100
11

ww
w.if
rem
er.fr
lfrem
er
12
2. APPLICATIONJoint occurrence probabilities1. Directional scatter diagrams of the Wave systems
Suit the discretization to the criteria:• log-scale (multiplicative) classes for the periods• half criterion threshold as class width for directions and the log(period).
2. Joint occurrence probabilities of all the possible combinations
Given under independence assumption and truncated to the set of possible combinations.
product of the wave systems frequencies from the scatter diagrams normalized by the sum of the frequencies of the possible combinations
As a result, observed MS fall into 169 classes, SS into 148, WS into 165.
(H1) : 2 millions combinations allowed to occur(H2) : 800 thousand combinations allowed to occur

ww
w.if
rem
er.fr
lfrem
erComparison of statistical properties of HS under assumption (H1)
metocean databasere-built metocean climate
13
2. APPLICATION
stats. prop.mean HS 1,59 0,99 1,4 1,27 1,25 1,2 1,22 1,43std HS 0,48 0,49 0,4 0,5 0,32 0,46 0,32 0,47HS,1/3 2,14 1,25 1,85 1,77 1,6 1,46 1,58 1,92HS,1/10 2,63 1,75 2,23 2,15 1,9 1,9 1,91 2,28
MS only MS + SS MS + WS MS + SS + WS
Significant discrepancies between statistics derived from the hypothesis (H1) and that of the database. The fact that the HSare higher for MS only is not reflected by (H1).

ww
w.if
rem
er.fr
lfrem
er
Smaller discrepancies between statistics derived from the assumption (H2) and that of the database. However, under (H2) the HS are greater for combinations without SS and lower for combinations with SS.
Both assumptions do not reflect the trends observed in the metocean database.14
2. APPLICATION
stats. prop.mean HS 1,59 1,64 1,4 1,32 1,25 1,27 1,22 1,15std HS 0,48 0,5 0,4 0,44 0,32 0,36 0,32 0,35HS,1/3 2,14 2,25 1,85 1,77 1,6 1,46 1,58 1,48HS,1/10 2,63 2,75 2,23 2,15 1,9 1,9 1,91 1,79
MS only MS + SS MS + WS MS + SS + WS
Comparison of statistical properties of HS under assumption (H2)
metocean databasere-built metocean climate

ww
w.if
rem
er.fr
lfrem
erICA-BASED DAMAGE ASSESSMENT PROCEDURE
1. Partition & Discretization of the wave spectra of the metoceandatabase
2. Determination of the wave systems combinations probabilities of occurrence
3. Calculation of the responses spectra to the wave systems components
4. Responses partition and identification of the « response systems »
5. Calculation of the damages and other characteristics (spectral moments) of the response systems
6. Combination within each possible sea state (i.e. each wave systems combination) using ICA formula
7. Summation with the probabilities of occurrence
15
2. APPLICATION

ww
w.if
rem
er.fr
lfrem
er
valeur Ratio ./Dt valeur Ratio ./Dt valeur Ratio ./Dt
MS only 15,07 0,2863 0,2684 93,75% 0,2557 89,31% 0,1492 52,11%MS + SS 34,08 0,2542 0,2263 89,02% 0,2314 91,04% 0,1618 63,66%MS + WS 19,01 0,0604 0,0548 90,73% 0,0567 93,89% 0,0438 72,55%
MS + SS + WS 31,7 0,0748 0,0613 81,95% 0,0692 92,57% 0,0547 73,17%total 100 0,6757 0,6108 90,40% 0,6358 94,09% 0,4772 70,62%
Dt* DHS,1/3 DHS,1/10sea states Prob. Occ. [%] Dt
Fatigue damage from metocean database(Reference)
* Partition with « triangle » spectral shape model
16
2. APPLICATION
The sea states with higher HS are responsible for a greater proportion of the damage. DHS,1/3 represents 95% of the damage and DHS,1/10 represents 70%. But this result depends on the structural response under consideration.
The triangle spectral shape considered here (which does not take into account the tail of the spectra) yields a non-gaussianprocess and gives lower damages. A « wallops » spectral shape model (with a high frequency tail) would provide larger results.

ww
w.if
rem
er.fr
lfrem
er
The damage computed with the ICA-based procedure suit the effects of the assumptions made for the metocean climate re-construction.
Concerning the computation efficiency. The step n°7 of the ICA-based procedure last some seconds with a FORTRAN program on a fast computer ( 15s for 2 millions combinations).
17
2. APPLICATION
valeur Ratio ./Dt* valeur Ratio ./Dt*MS only 15,07 0,2684 0,0808 30,11% 0,3615 134,70%MS + SS 34,08 0,2263 0,2483 109,73% 0,217 95,91%MS + WS 19,01 0,0548 0,1005 183,42% 0,0721 131,52%
MS + SS + WS 31,7 0,0613 0,233 380,06% 0,0638 104,15%total 100 0,6108 0,6626 108,49% 0,7145 116,98%
sea states Prob. Occ. [%] Dt*DICA - (H1) DICA - (H2)
Fatigue damage from ICA-based assessment method
* Partition with « triangle » spectral shape model
ww
w.if
rem
er.fr
lfrem
er
CONCLUSION
ICA formula is simply implemented in a general procedure for fatigue damage assessment under multimodal sea states with good performance;
This formula provided reasonably conservative results for the actual application.
Problems highlighted:
The use of two-slopes S-N curve. Problem solved using a formula to obtain the damage with double slope S-N curve from those with single slope S-N curve.
the metocean climate constructed under the independence assumption is not satisfactory. (H1) shows major discrepancies with the database. (H2) is better but not totally satisfactory.
18

ww
w.if
rem
er.fr
lfrem
erPERSPECTIVES
In the short term, other applications to be considered :
a very low-frequency response in addition to the wave systems responses
structural responses which are significantly direction-dependent
non-linear responses which can be represented by a linear response corrected with a factor depending on some parameters (e.g. HS,Tp)
In a longer term, extend the approximation of the distribution of MB to non-gaussian responses.
Improve the re-construction of the metocean climate, using instead on the overall statistics of environmental parameters, their evolution over time (events statistics).
19
ww
w.if
rem
er.fr
lfrem
er
Thank you for your attention !!!