fate and biological effects of engineered … and biological effects of engineered nanomaterials...
TRANSCRIPT

Fate and Biological Effects of Engineered Nanomaterials
during Simulated Wastewater Treatment Processes
by
Yifei Wang
A Thesis Presented in Partial Fulfillment of the Requirements for the Degree
Master of Science
Approved March 2012 by the Graduate Supervisory Committee:
Paul Westerhoff, Chair
Rosa Krajmalnik-Brown Kiril Hristovski Bruce Rittmann
ARIZONA STATE UNIVERSITY
May 2012
i
ABSTRACT
As engineered nanomaterials (NMs) become used in industry and commerce
their loading to sewage will increase. However, the fate of widely used NMs in
wastewater treatment plants (WWTPs) remains poorly understood. In this research,
sequencing batch reactors (SBRs) were operated with hydraulic (HRT) and sludge
(SRT) retention times representative of full-scale biological WWTPs for several
weeks. NM loadings at the higher range of expected environmental concentrations
were selected. To achieve the pseudo-equilibrium state concentration of NMs in
biomass, SBR experiments needed to operate for more than three times the SRT
value, approximately 18 days. Under the conditions tested, NMs had negligible
effects on ability of the wastewater bacteria to biodegrade organic material, as
measured by chemical oxygen demand (COD). NM mass balance closure was
achieved by measuring NMs in liquid effluent and waste biosolids. All NMs were
well removed at the typical biomass concentration (1~2 gSS/L). However,
carboxy-terminated polymer coated silver nanoparticles (fn-Ag) were removed less
effectively (88% removal) than hydroxylated fullerenes (fullerols; >90% removal),
nano TiO2 (>95% removal) or aqueous fullerenes (nC60; >95% removal). Although
most NMs did not settle out of the feed solution without bacteria present,
approximately 65% of the titanium dioxide was removed even in the absence of
biomass simply due to self-aggregation and settling. Experiments conducted over 4
months with daily loadings of nC60 showed that nC60 removal from solution
depends on the biomass concentration. Under conditions representative of most
suspended growth biological WWTPs (e.g., activated sludge), most of the NMs
ii
will accumulate in biosolids rather than in liquid effluent discharged to surface
waters. Significant fractions of fn-Ag were associated with colloidal material which
suggests that efficient particle separation processes (sedimentation or filtration)
could further improve removal of NM from effluent. As most NMs appear to
accumulate in biosolids, future research should examine the fate of NMs during
disposal of WWTP biosolids, which may occur through composting or anaerobic
digestion and/or land application, incineration, or landfill disposal.

iii
ACKNOWLEDGEMENT
This thesis could not have been completed without the help and support of
many colleagues. First, I want to thank Dr. Paul Westerhoff for being my advisor
during my Master’s program. I want to thank my committee members Dr. Bruce
Rittmann, Dr. Rosa Krajmalnik-Brown, and Dr. Kiril Hristovski who were always
available to discuss ideas and questions.
I want to thank Ayla Kiser, Troy Benn, and Chao-an Chiu for helping me in
my experiments. I want to thank Marisa Masles and Thomas Collela for their
support with the Arizona State University analytical instruments. Finally, I want to
thank the U.S. Environmental Protection Agency and Water Environmental
Research Foundation who funded the projects, making this all possible.
iv
TABLE OF CONTENTS
Page
ABSTRACT .................................................................................................................. i
ACKNOWLEDGEMENT ......................................................................................... iii
LIST OF TABLES ....................................................................................................... v
LIST OF FIGURES .................................................................................................... vi
CHAPTER
1 INTRODUCTION .................................................................................. 1
2 EXPERIMENTAL APPROACH .......................................................... 4
2.1 Sequencing Batch Reactors .......................................................... 4
2.2 Preperation of Nanomaterial Stock Solutions .............................. 5
2.3 Analytical Methods ....................................................................... 7
3 RESULTS AND DISCUSSION .......................................................... 10
3.1 Influence of Nanomaterial on Substrate Utilization and Bacterial
Growth ....................................................................................... 10
3.2 Nanomaterial Removal from the Liquid Phase in Sequencing
Batch Reactors ............................................................................ 14
3.3 Nanomaterial Accumulation in Biosolids and Mass Balance ... 23
4 CONCLUSION AND FUTURE WORK RECOMMENDATION ... 28
REFERENCES ........................................................................................................ 30
APPENDIX
A Supplemental Information ................................................................ 36

v
LIST OF TABLES
Table Page
1. Summary of Engineered Nanomaterials properties ............................ 7
vi
LIST OF FIGURES
Figure Page
1. Plots of COD concentrations over time during operation of the SBRs
............................................................................................................. 11
2. COD removal kinetics during day 6 of the 4-week SBR testing ..... 12
3. Biomass concentrations over time in SBRs without NMs (control) or
with various NMs added .............................................................. 14
4. Silver concentrations in SBRs either without biomass or with biomass
............................................................................................................. 16
5. Titanium concentrations in SBRs either without biomass or with
biomass .......................................................................................... 17
6. Fullerene (C60) concentrations in an SBR without biomass during a
6-day operation experiment without and with sodium azide ..... 18
7. Variation of nC60 concentration in settled supernatant during long-term
operation of the SBR ..................................................................... 23
8. TEM of biomass sample from the fn-Ag SBR .................................... 24
9. SEM images of titanium dioxide on biomass shown in backscatter
mode .............................................................................................. 25
10. Change in silver or titanium biosolid concentrations during NM
loading and after cessation of NM loading in the SBR .............. 26
A-1A. Photograph of SBRs on a mixing system with aeration tubes .... 37
A-1B. Schematic diagram for the SBRs .................................................. 37

vii
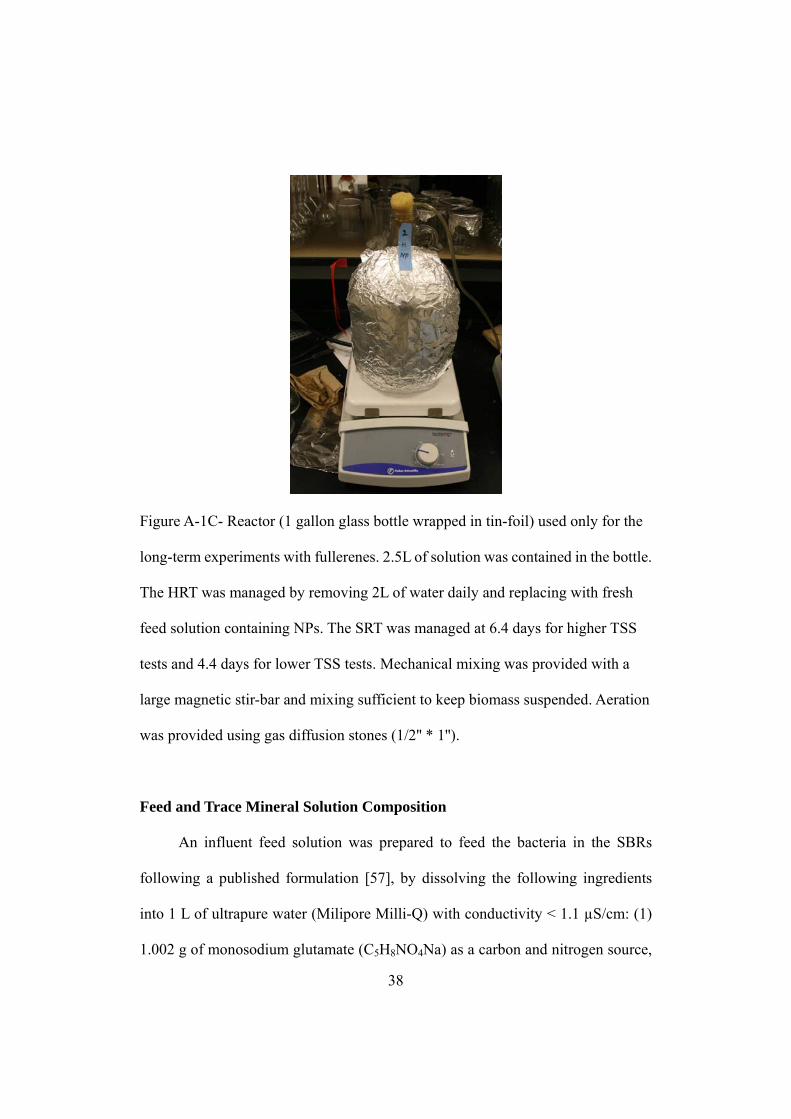
A-1C. Reactor (1 gallon glass bottle wrapped in tin-foil) used only for the
long-term experiments with fullerenes ................................. 38
A-2. XRD of HOMBIKAT titanium dioxide nanoparticles .................. 40
A-3. Silver concentrations in the influent, settled effluent, filtered
effluent and the total suspended solids in a SBR operated for
30 days .................................................................................... 41
A-4. Silver concentrations in biosolids from SBRs operated for 30 days
............................................................................................................. 42
A-5. Representative mass balances for silver and titanium from SBR tests
............................................................................................................. 43
1
Chapter 1
INTRODUCTION
Engineered nanomaterials (ENMs) are operationally defined as materials in
size between 1 to 100 nanometers with at least one dimension, where unique
properties enable novel applications [1]. These novel properties that emerge at the
nano-scale enable the development of materials with unique physical, chemical,
and biological properties that their macromolecular counterparts do not share [1].
Today the use of nanomaterials (NMs) in commercial products is rapidly increasing.
In 2006, more than 300 commercial products on the market claimed to have
enhanced properties due to incorporated NMs; this number had more than
quadrupled by 2010 [2, 3]. Silver is the most common NM used in products,
followed by carbon-based NMs and TiO2 [3]. A market research firm (Bins &
Associates) estimates that the production of nanoparticles will be on the order of
millions of tons by 2010 [4]. As a result of this increasing production and utilization,
research has begun to assess the potential risks related to the presence of these
ultra-small materials in the environment, including effects on bacteria, algae, fish,
and other organisms [2, 5-15]. Risk assessment and management rely upon both
effects data (e.g., toxicity) and exposure information. Therefore, both to assess the
risk of engineered NMs in the environment and to control their release, an
understanding of the processes that affect NM flux through society is critical. This
has been the focus of recent exposure modeling assessments [16-21].
Of particular interest is the removal and distribution of ENMs within
conventional wastewater treatment plants (WWTPs) that could be the pathways of

2
ENMs entering the aquatic and territory environment. Treated effluents and
biosolids from WWTPs and biosolids facilities are sources for pollutants entering
the environment. Many NMs used in commercial products will enter municipal or
industrial wastewaters, which are collected and treated at centralized wastewater
treatment plants (WWTPs) [21-23]. Although NMs may undergo transformation
(e.g., dissolution of metal ions from metal-based NMs), the primary process of NM
removal from sewage will be the association with biosolids, a process termed
biosorption, and their subsequent removal by sedimentation and/or filtration
[23-26]. Field study has discovered silver sulfide nanoparticles generated during
the wastewater treatment process, which indicates the role of WWTPs in the
transformation of silver NMs [27]. NMs in biosolids are often land applied such
that terrestrial organisms are exposed. NMs that are not removed pass through the
WWTPs in the water and are discharged into rivers, lakes, and oceans, where
aquatic organisms are exposed [23, 28].
The goal of this research is to understand the fate of ENMs among
various phases during activated sludge wastewater treatment. The research
will focus on the removal of the ENMs when they enter the wastewater treatment
plants, the distribution of the ENMs during the wastewater treatment, and the
re-entering of the ENMs to the environment. The objectives of this study to achieve
this goal are: (1) to quantify the removal efficiency of silver, titanium dioxide, and
carbonaceous NMs from simulated wastewater and into biosolids using lab-scale
sequencing batch reactors (SBRs) and (2) to evaluate the effects of NMs on the
function of bacteria in WWTPs. By accomplishing these goals, we can develop a

3
better understanding of the fate of these NMs in WWTPs. Previous studies on NM
fate during wastewater treatment have used static batch reactors or predictive
life-cycle models [19, 29-31]. Here we operate SBRs for extended periods of time
with continuous daily loadings of NMs along with removal of settled effluent and
settled biosolids.

4
Chapter 2
EXPERIMENTAL APPROACH
2.1 SEQUENCING BATCH REACTORS
Laboratory-scale sequencing batch reactors were used in the experiments. For
most experiments the reactors had a liquid volume of 1.6 L (Figures A-1A and B
provides details); only for a long-term test (150 days) was a slightly different
configuration used (Figure A-1C). The long-term experiments were conducted to
vary nC60 feed concentrations and biomass levels within a continuously operated
system. Samples were aerated and mechanically mixed. The reactors were seeded
with bacteria culture (return activated sludge) from Northwest Wastewater
Treatment Plant in Mesa, Arizona which operated with a sludge retention time
close to six days. The reactors were supplied with a previously published synthetic
feed solution [32] (detailed composition provided in SI) comprised of salts, trace
nutrients, buffer and monosodium glutamate (C5H8NO4Na) as a carbon and
nitrogen source. This feed solution had a conductivity of 0.5 mS, COD of 780 mg/L,
and total dissolved nitrogen (TDN) of 150 mg N/L. Detailed operation and
sampling procedures are presented in the Supplementary Information (SI) in
Appendix A. Briefly, the hydraulic residence time (HRT) of the SBRs was 8 hours
(aeration time) plus settling. The sludge retention time (SRT) was managed in most
test at 6.4 days, which is typical for activated sludge systems for COD removal;
only in lower TSS tests for the 150-day fullerene tests was the SRT decreased to 4.4
days which was necessary to maintain the lower target TSS level. HRT and SRT
were regulated by removing settled supernatant and mixed suspended solids.

5
Typical wastewater treatment systems operate at TSS levels of 1500 to 2500 mg/L,
and this was the target level for most experiments. Lower TSS levels were targeted
during the 150 day SBR experiment to demonstrate in continuous flow operation
the effect of biomass levels of nanomaterials removal. Reactors were operated for
several weeks to reach steady state, which was determined on the basis of
consistent total suspended solids (TSS) concentration and effluent chemical oxygen
demand (COD), before addition of NMs began. Control reactors were operated
with (1) the feed solution with NMs but no biomass and (2) the feed solution with
no NMs.
2.2 PREPARATION OF NANOMATERIAL STOCK SOLUTIONS
Stock suspensions of NMs were prepared using ultrapure water (Milipore
Milli-Q) with conductivity < 1.1 µS/cm. Characteristics of the NMs in the stock
suspensions are summarized in Table 1 and Figure SI.2. The stock solution of
functionalized (carboxyl terminated polymer coating) silver nanoparticles (fn-Ag)
used the as-received liquid solution (~300 mgAg/L) from the manufacturer
(Northern Nanotechnologies, Ontario, Canada). The fn-Ag stock solution
contained 8% to 10% ionic silver as measured by ion-specific electrode (ISE)
(Accumet® Silver/Sulfide, Fisher), which was used in combination with a pH/mV
meter (ΦTM 250 series, Beckman) to measure free Ag+ ions, and confirmed by
centrifugal ultrafiltration using a 10 kDa membrane (Amicon). To investigate the
potential toxic effects of ionic silver, stock solutions were prepared by dissolving
200 mg Ag from AgClO4 (Sigma-Aldrich) in 1 L of ultrapure water.

6
Titanium dioxide NM stock suspensions were prepared using Hombikat TiO2
powder (Sachtleben Chemie GmbH, Duisburg, Germany). Hombikat TiO2 has a
low iso-electric point (pHZPC ~ 5.3 as estimated using a ZetaPALS instrument,
Brookhaven Instruments, NY). The stock suspension was prepared by suspending 1
g of TiO2 into 1 L of ultrapure water and sonicating it with an ultrasonic probe (5T
Standard Probe, Model 2000U, Ultrasonic Power Cooperation, Freeport, IL, USA)
for 2 hours at 200 W/L. Portions of the suspension were centrifuged at 1000 G for
30 min, and the supernatant was used as the stock TiO2 suspension (n-TiO2). The
stock solution contained 320 mgTi/L. XRD results indicate that all TiO2 is pure
anatase (Figure A.2). Suwannee River natural organic matter (NOM) (International
Humic Substances Society) was added during select experiments.
Fullerene (C60) and hydroxylated-fullerene (C60(OH)24-yNay) were purchased
from MER Corporation, Tucson, Arizona. Aqueous fullerene (nC60) was prepared
by adding ~500 mg of C60 dry powder to 1L nanopure water and sonicating at
200W/L for 6 hours. The solution was then filtered (Whatman GFF) and permeate
became the stock solution. The fullerol stock solution was prepared similarly by
adding ~70 mg of n-C60(OH)24-yNay to 500 mL ultrapure water, sonicating for 30
minutes, and then filtering.

7
Table 1 – Summary of Engineered nanomaterials properties
Nanomaterial Supplier
Dosage
applied to
SBR (mg/L)
DLS Mean Diameter (nm) Zeta
Potential
at pH 7
(mV)
In Nanopure
Water
(Polydispersity)
In SBR
Feed
Solution
fn-Ag
Northern
Nanotech
(Vive Nano)
0.5 to 1.5 ~5
(0.322) ~30 -6
n-TiO2 Hombikat 0.5 to 2.0 ~20
(0.233) ~1700 -30
Aq-nC60 MER Corp 0.5 to 2.5 ~88
(0.172) ~129 -52
n-C60(OH)x(ONa)y MER Corp 2.5 ~40
(0.128) ~90 -21
2.3 ANALYTICAL METHODS
Organic carbon substrate utilization by the biomass was assessed using COD,
which was measured via the closed reflux dichromate colorimetric method 5220 D
(Standard Methods for Water and Wastewater Analysis) [33]. Sample pH was also
measured (Beckman Φ250 pH/Temp/mV Meter, Beckman Coulter Inc, Fullerton,
CA, USA). Dissolved organic carbon (DOC) and total organic carbon (TOC)
concentrations were analyzed using a TOC instrument (Shimadzu TOC-V CSH).
Biomass concentration was determined as the TSS concentration following the
Standard Methods for Water and Wastewater Analysis [33].
Metal concentrations in liquid samples were determined by acid digestion
followed by analysis using Inductively Coupled Plasma-Optical Emission
Spectroscopy (ICP-OES) (Thermo iCAP6300 ICP-Optical Emission Spectrometer).

8
Detection limits were below 1 µg/L. Liquid aliquots of silver nanoparticle
dispersions were digested in concentrated ultrapure nitric acid with addition of 30%
H2O2 using a hotplate digestion method [33]. Liquid aliquots of titanium dioxide
nanoparticle dispersions were converted to titanium ions by digestion in a mixture
of ultrapure concentrated nitric and sulfuric acids at T > 2200C using a hotplate
digestion method [33]. Recovery of metals from nanoparticle was between 90%
and 110%, within acceptable USEPA ranges. Metal concentrations in dry biomass
samples were determined by filtering (Whatman GF/F filter) and drying the
biomass at 1050C to constant mass prior to acid digestion. Dry biomass was
digested following USEPA SW-846, Method 3050B [33].
Concentrations of fullerenes and fullerols were analyzed using a UV/VIS
spectrophotometer (HACH DR5000) at 347 nm and 400 nm, respectively, during
short-term SBR tests. During long-term SBR tests (150 days) using fullerenes, nC60
was measured after liquid-liquid extraction (10 mL sample, 30 mL glacial acetic
acid to prevent emulsion formation, 10 mL toluene) followed by LC/MS (days 0 to
45) and then HPLC (days 45 to 150) following established methods [34-36];
comparable results for the two methods obtained between days 30 and 60 validated
the switch to the easier HPLC method. Both methods had detection limits of 1 µg/L
when the toluene extract was reduced to 0.5 mL prior to analysis.
Scanning electron microscopy/focused ion beam microscopy equipped with an
energy dispersive X-ray microanalysis system (SEM/EDS) (FEI Nova 200
SEM/FIB with EDAX) and transmission electron microscopy (TEM) equipped
with EDS (Philips CM200 FEG TEM/STEM with EDAX) was used to characterize
9
the nanoparticles visually and determine their presence in the biomass. Zeta
potential and particle sizes were estimated using the phase analysis light scattering
technique (PALS) (ZetaPALS Brookhaven Instruments, Brookhaven, NY). PALS
particle sizes were estimated using the monomodal size distribution (MSD). X-ray
diffraction (Siemens D5000, CuK X-ray source) was used to characterize the
crystallographic structure of NMs.
10
Chapter 3
RESULTS AND DISCUSSION
3.1 INFLUENCE OF NANOMATERIALS ON SUBSTRATE UTILIZATION AND
BACTERIAL GROWTH
NM dosages of 0.5 to 2.5 mg/L were applied to SBRs, which were operated for
several weeks (Table 1). Organic carbon substrate utilization by the bacterial
biomass was assessed by analyzing COD in the effluent. Over a 27-day operation
period, influent COD levels in the feed solution averaged 748 ± 13 mg/L. The
average COD level of the settled effluent from SBRs without NMs was 64 ± 28
mg/L. The average (27-day operation) COD in the settled effluent from SBRs with
fn-Ag and n-TiO2 were 45 ± 12 mg/L and 45 ± 16 mg/L, respectively. SBRs
supplied with ionic silver (AgClO4) had an average COD in the settled effluent of
39 ± 19 mg/L. Effluent COD from the SBRs with fullerene and fullerol were 21 ± 8
mg/L and 32 ± 12 mg/L, respectively. Plots of COD in SBR settled effluents are
presented in Figure 1. Based on an F-test, effluent COD levels in SBRs with and
without NMs were not statistically different (p > 0.07). Thus in our study, under the
TSS levels (see below) and NM dosages reflective of the upper limit of expected
environmental concentrations, the presence of NMs did not adversely affect COD
removal in the biological reactors.
11
0
200
400
600
800
1000
0 10 20 30
CO
D, m
gCO
D/L
Day
Influent COD-Ag NP added
Effluent COD
0
200
400
600
800
1000
0 10 20 30
CO
D, m
gCO
D/L
Day
Influent COD-Ti NP+NOM added
Effluent COD
0
200
400
600
800
1000
0 10 20 30
CO
D, m
gCO
D/L
Day
Influent COD-AgClO4 added
Effluent COD
0
20
40
60
80
100
0 2 4 6 8 10
CO
D
(mgC
OD
/L)
Days of Operation
Lower Biomass Functionalized Ag NP Added
TiO2 NP Added
0
20
40
60
80
100
0 5 10 15 20 25 30
CO
D
(mgC
OD
/L)
Days of Operation
Functionalized Ag NP Added
TiO2 NP+NOM Added
AgClO4 Added
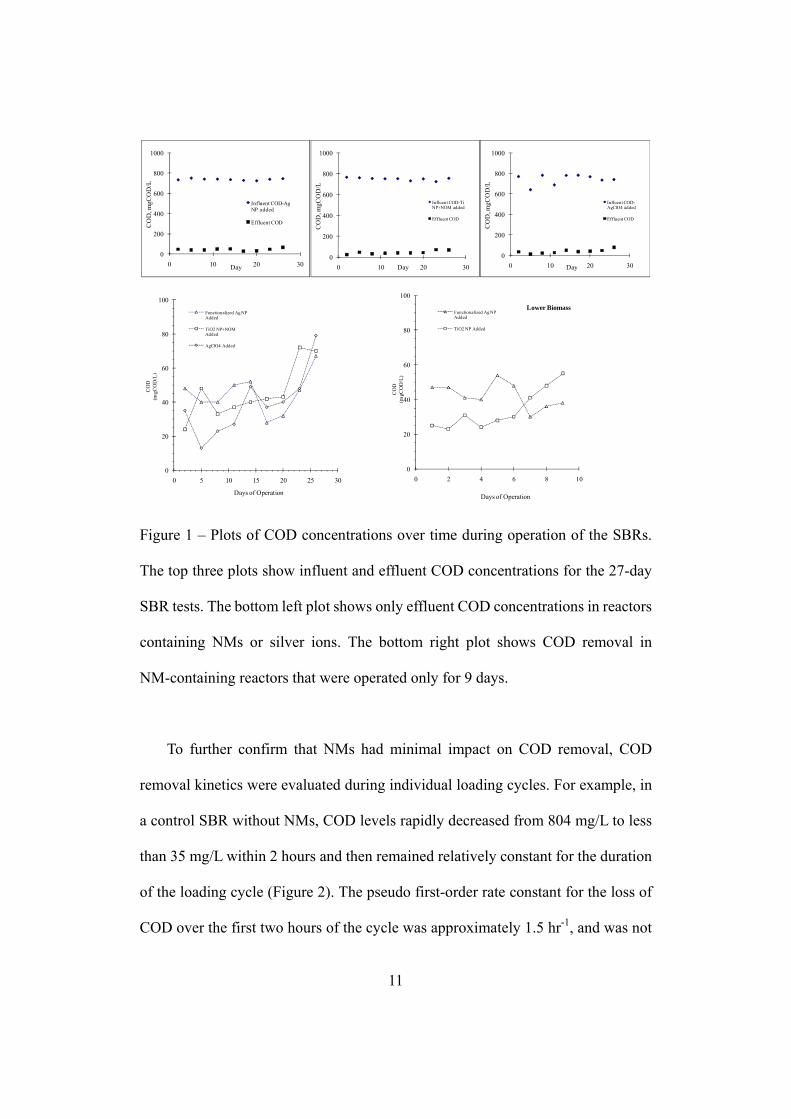
Figure 1 – Plots of COD concentrations over time during operation of the SBRs.
The top three plots show influent and effluent COD concentrations for the 27-day
SBR tests. The bottom left plot shows only effluent COD concentrations in reactors
containing NMs or silver ions. The bottom right plot shows COD removal in
NM-containing reactors that were operated only for 9 days.
To further confirm that NMs had minimal impact on COD removal, COD
removal kinetics were evaluated during individual loading cycles. For example, in
a control SBR without NMs, COD levels rapidly decreased from 804 mg/L to less
than 35 mg/L within 2 hours and then remained relatively constant for the duration
of the loading cycle (Figure 2). The pseudo first-order rate constant for the loss of
COD over the first two hours of the cycle was approximately 1.5 hr-1, and was not
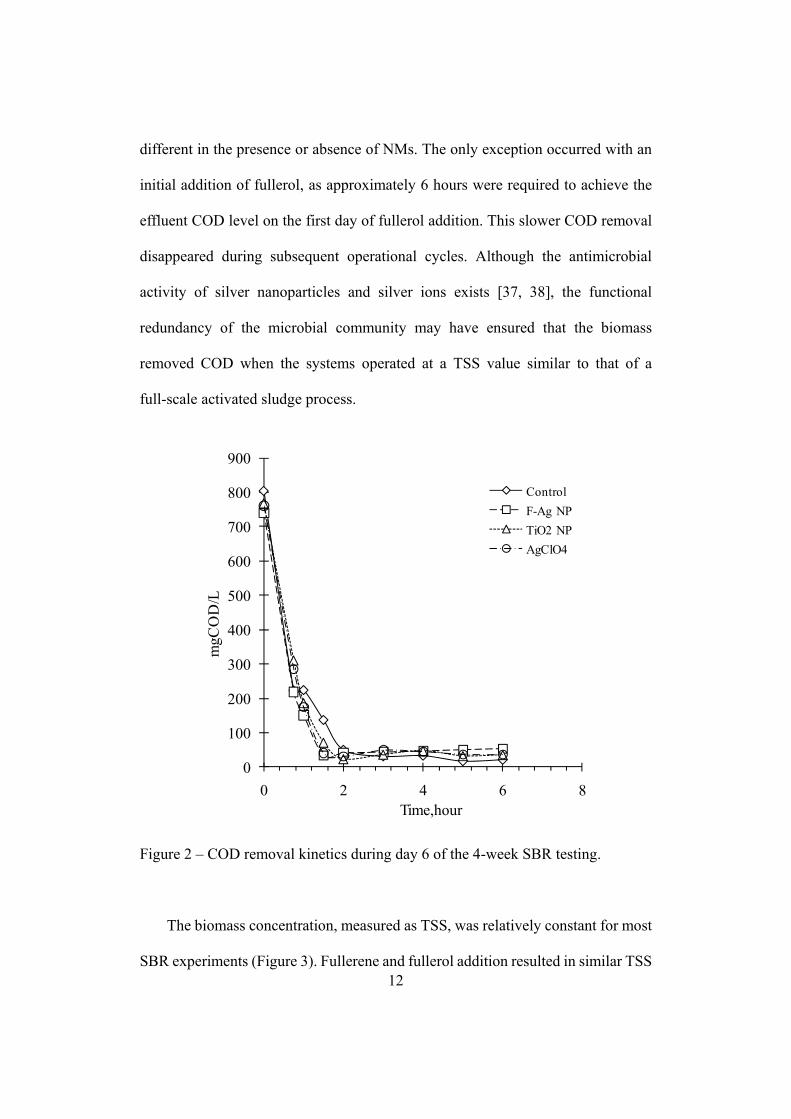
12
different in the presence or absence of NMs. The only exception occurred with an
initial addition of fullerol, as approximately 6 hours were required to achieve the
effluent COD level on the first day of fullerol addition. This slower COD removal
disappeared during subsequent operational cycles. Although the antimicrobial
activity of silver nanoparticles and silver ions exists [37, 38], the functional
redundancy of the microbial community may have ensured that the biomass
removed COD when the systems operated at a TSS value similar to that of a
full-scale activated sludge process.
0
100
200
300
400
500
600
700
800
900
0 2 4 6 8
mgC
OD
/L
Time,hour
Control
F-Ag NP
TiO2 NP
AgClO4
Figure 2 – COD removal kinetics during day 6 of the 4-week SBR testing.
The biomass concentration, measured as TSS, was relatively constant for most
SBR experiments (Figure 3). Fullerene and fullerol addition resulted in similar TSS
13
levels as the controls and exhibited no long-term detrimental influence on COD
removal. Biomass concentrations were also constant with n-TiO2 (average 1.3 ± 0.2
gTSS/L). Biomass concentrations were similar to controls for fn-Ag (average 1.8 ±
0.2 gTSS/L) and AgClO4 (average 1.7 ± 0.2 gTSS/L), except during the first
operational cycle of feed solutions containing NMs was a significant change (10%
to 15% decline) in TSS observed. This could suggest an initial shock from the NMs,
or silver ions, after which the mixed microbial community adapted to their
presence.
14
Figure 3 – Biomass concentrations over time in SBRs without NMs (control) or
with various NMs added.
3.2 NANOMATERIAL REMOVAL FROM THE LIQUID PHASE IN SEQUENCING
BATCH REACTORS
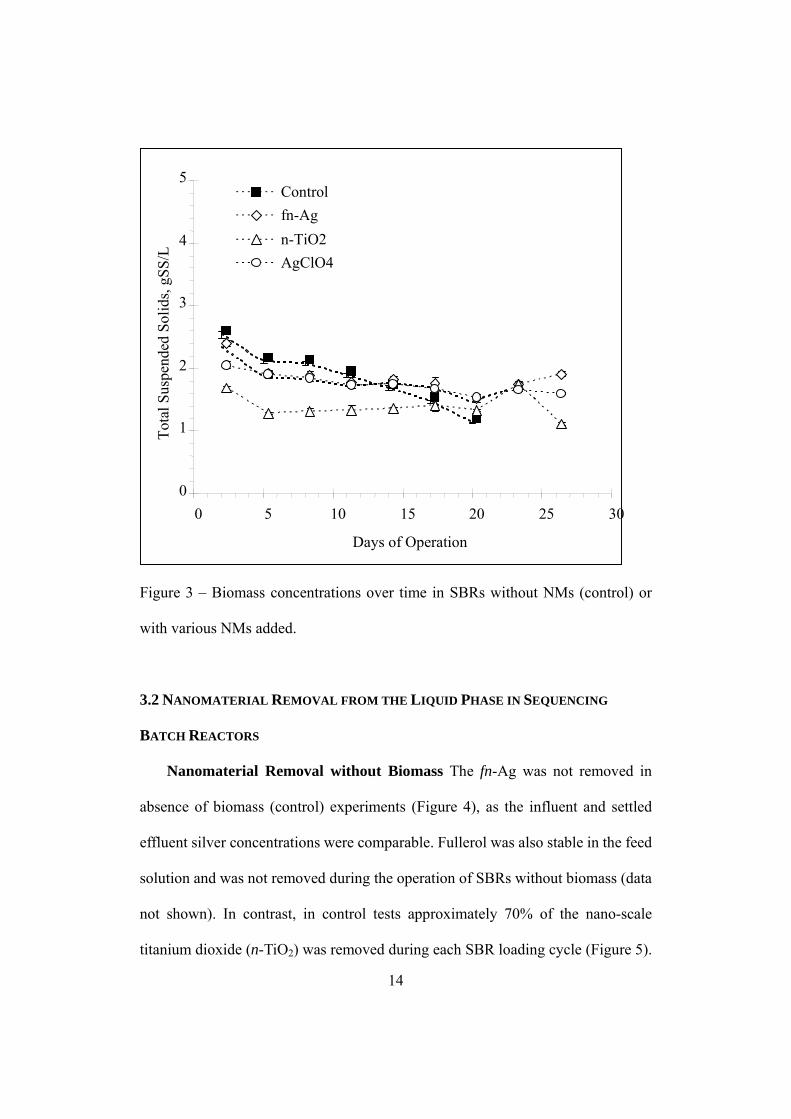
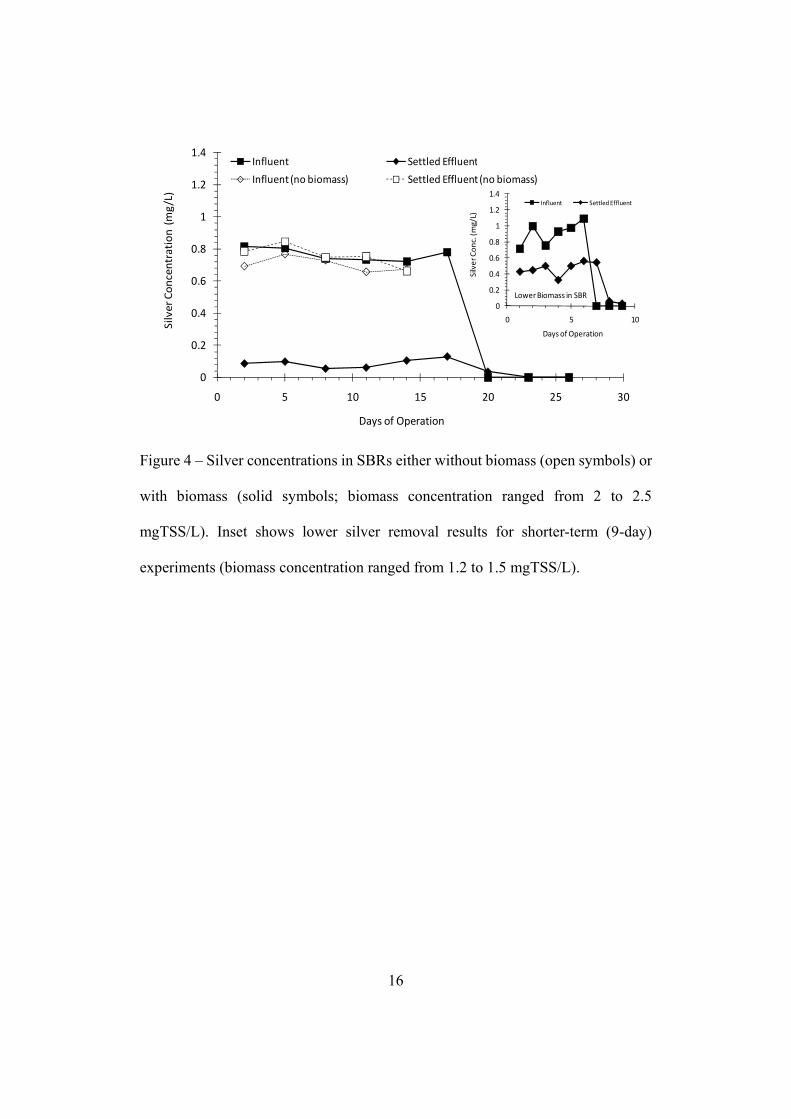
Nanomaterial Removal without Biomass The fn-Ag was not removed in
absence of biomass (control) experiments (Figure 4), as the influent and settled
effluent silver concentrations were comparable. Fullerol was also stable in the feed
solution and was not removed during the operation of SBRs without biomass (data
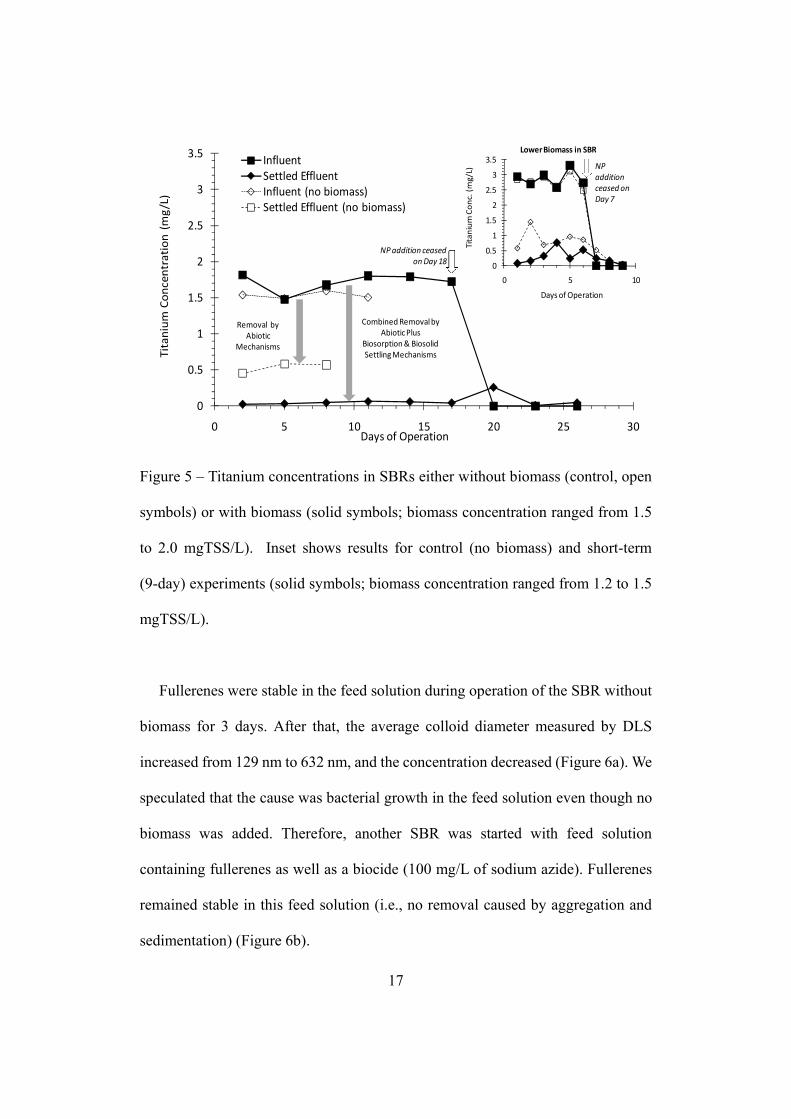
not shown). In contrast, in control tests approximately 70% of the nano-scale
titanium dioxide (n-TiO2) was removed during each SBR loading cycle (Figure 5).
0
1
2
3
4
5
0 5 10 15 20 25 30
Days of Operation
Control
fn-Ag
n-TiO2
AgClO4
Tot
al S
uspe
nded
Sol
ids,
gS
S/L
15
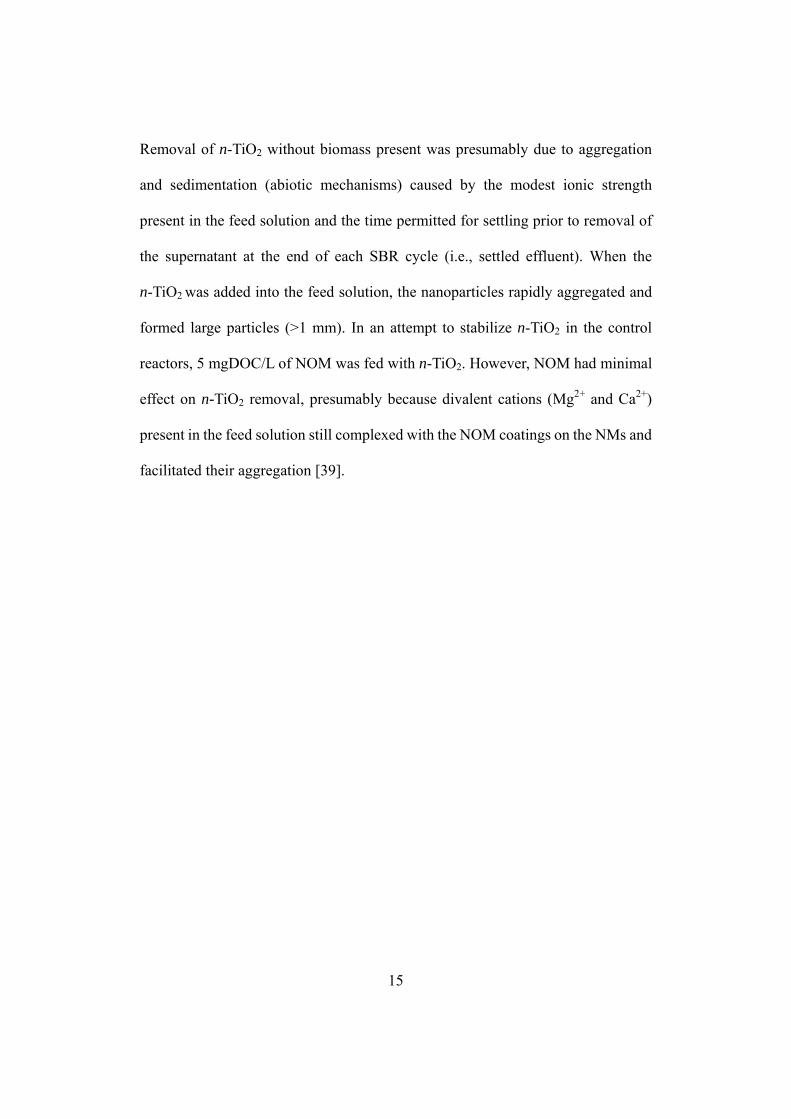
Removal of n-TiO2 without biomass present was presumably due to aggregation
and sedimentation (abiotic mechanisms) caused by the modest ionic strength
present in the feed solution and the time permitted for settling prior to removal of
the supernatant at the end of each SBR cycle (i.e., settled effluent). When the
n-TiO2 was added into the feed solution, the nanoparticles rapidly aggregated and
formed large particles (>1 mm). In an attempt to stabilize n-TiO2 in the control
reactors, 5 mgDOC/L of NOM was fed with n-TiO2. However, NOM had minimal
effect on n-TiO2 removal, presumably because divalent cations (Mg2+ and Ca2+)
present in the feed solution still complexed with the NOM coatings on the NMs and
facilitated their aggregation [39].
16
0
0.2
0.4
0.6
0.8
1
1.2
1.4
0 5 10 15 20 25 30
Silver Concentration (mg/L)
Days of Operation
Influent Settled Effluent
Influent (no biomass) Settled Effluent (no biomass)
0
0.2
0.4
0.6
0.8
1
1.2
1.4
0 5 10
Silver Conc. (m
g/L)
Days of Operation
Lower Biomass in SBR
Influent Settled Effluent
Figure 4 – Silver concentrations in SBRs either without biomass (open symbols) or
with biomass (solid symbols; biomass concentration ranged from 2 to 2.5
mgTSS/L). Inset shows lower silver removal results for shorter-term (9-day)
experiments (biomass concentration ranged from 1.2 to 1.5 mgTSS/L).
17
0
0.5
1
1.5
2
2.5
3
3.5
0 5 10 15 20 25 30
Titanium Concentration (mg/L)
Days of Operation
InfluentSettled EffluentInfluent (no biomass)Settled Effluent (no biomass)
Removal by Abiotic
Mechanisms
CombinedRemoval by Abiotic Plus
Biosorption& Biosolid Settling Mechanisms
0
0.5
1
1.5
2
2.5
3
3.5
0 5 10
Titanium Conc. (mg/L)
Days of Operation
NP addition ceased on Day 7
Lower Biomass in SBR
NP addition ceased on Day 18
Figure 5 – Titanium concentrations in SBRs either without biomass (control, open
symbols) or with biomass (solid symbols; biomass concentration ranged from 1.5
to 2.0 mgTSS/L). Inset shows results for control (no biomass) and short-term
(9-day) experiments (solid symbols; biomass concentration ranged from 1.2 to 1.5
mgTSS/L).
Fullerenes were stable in the feed solution during operation of the SBR without
biomass for 3 days. After that, the average colloid diameter measured by DLS
increased from 129 nm to 632 nm, and the concentration decreased (Figure 6a). We
speculated that the cause was bacterial growth in the feed solution even though no
biomass was added. Therefore, another SBR was started with feed solution
containing fullerenes as well as a biocide (100 mg/L of sodium azide). Fullerenes
remained stable in this feed solution (i.e., no removal caused by aggregation and
sedimentation) (Figure 6b).

18
0.00
0.50
1.00
1.50
2.00
2.50
0 1 2 3 4 5 6 7Time,day
nC60
Con
c. m
gC60
/L
Influent nC60
Settled supernatant
a
0.00
0.50
1.00
1.50
2.00
2.50
0 1 2 3 4 5 6 7Time,day
nC60
Con
c. m
gC60
/L
Influent nC60
Settled supernatant
a
0.00
0.50
1.00
1.50
2.00
2.50
0 1 2 3 4 5 6 7Time, Days
nC60
Con
c. m
gC60
/L
Influent nC60
Effluent nC60
b
0.00
0.50
1.00
1.50
2.00
2.50
0 1 2 3 4 5 6 7Time, Days
nC60
Con
c. m
gC60
/L
Influent nC60
Effluent nC60
b
Figure 6-Fullerene (C60) concentrations in an SBR without biomass during a 6-day
operation experiment without (a) and with (b) sodium azide.
NM Removal in the Presence of Biomass NMs were loaded continuously
during each operational cycle (cycled aeration, withdrawal of mixed suspended
solids for SRT management, settling, withdrawal of settled supernatant for HRT
management, replenishment with fresh feed solution containing NMs) for a fixed
duration to study NM removal, and then the reactors operated with replenishment
of the feed solution only (no NMs added) to evaluate “washout” from the reactor.
Figure 4 shows influent and effluent silver data for fn-Ag in reactors both with and
without biomass added. In the presence of biomass (1.8 0.2 mgTSS/L; Figure 3)
after reaching steady state, 88% 4% of the fn-Ag was removed from settled
supernatant (i.e., effluent) when fresh NMs and feed solution were added during

19
each operational cycle (days 1 through 18). After day 18, replenishment of the feed
solution without NMs continued (i.e., zero silver in the SBR influent). Effluent
silver concentrations took an additional few days to reach influent levels, which
indicates a slow “washout” of silver after ceasing fn-Ag addition into the SBR (feed
water without NMs was added after day 18). Operation of a 9-day SBR test at a
lower biomass concentration (1.1 0.2 mgTSS/L) resulted in 49% 10% removal
of silver while fn-Ag was added (Figure 4 inset). Again, after cessation of fn-Ag
addition on day 7, a short washout period of silver from the reactor was observed.
Another SBR was then operated for 30 days with an average influent fn-Ag
concentration of 2.0 0.1 mg/L and a TSS of 0.55 0.10 gSS/L (Figure A.3). The
settled supernatant was sampled directly as well as filtered using 0.45-µm
membranes and 10 kDa centrifugal ultrafiltration membranes. During this period
the silver removal in the settled, 0.45-µm membrane-filtered, and 10 kDa
membrane-filtered effluent averaged 58 18%, 88 ± 15%, and 99 0.1%,
respectively; the filtered effluent always had a larger removal than the settled
effluent. Therefore, a fraction of the silver was associated with colloidal cellular
material (i.e., between 0.45-µm and 10kDa) that did not completely settle during
the cyclic operation (i.e., it was present in the supernatant). In separate experiments
using the stock solution, the 10kDa membranes retained fn-Ag and allowed ionic
silver to pass through. Thus ionic silver was concluded not to be present in the SBR
effluent. Ionic silver could have precipitated as silver chloride or silver sulfide, or
adsorbed onto biomass. TEM analysis was conducted on silver nanoparticles in the
settled biosolids (Figure SI.8). The size and shape of the silver in the biosolids were

20
consistent with the initial fn-Ag nanoparticles, and EDX confirmed them as silver.
Therefore, a significant portion, if not all, of the fn-Ag nanoparticles did not
undergo dissolution and where incorporated into the settled biosolids.
Ionic silver was 8% to 10% of the total silver in the fn-Ag stock solution.
Therefore, the fate of ionic silver was investigated in a separate SBR operated
similarly to that for fn-Ag. The biomass concentration over the 27-day experiment
averaged 1.8 0.2 mgTSS/L (Figure 3). The average silver removal was 94 3%;
the influent ionic silver concentration was 0.90 0.03 mg/L. Ionic silver readily
sorbs to wastewater biomass [40]. However, in control experiments (no biomass)
with ionic silver, silver was removed from the supernatant, which suggests that
precipitation of ionic silver could have occurred. The feed solution contained 0.25
mM chloride. Silver chloride is highly insoluble (Ksp = 1.56 x 10⁻¹⁰), and the
predicted silver ion concentration in the feed solution at equilibrium would be no
more than 0.065 mgAg/L.
Figure 5 shows the influent and effluent titanium concentrations for addition
of TiO2 to SBRs. The removal of titanium increased from 65% in the absence of
biomass to 97 1% with biomass present (1.3 0.2 mgTSS/L). Experiments were
not conducted with ionic titanium because of its extremely low solubility.
Initial experiments using fullerols and fullerene were conducted for 6 days of
NM loading plus 3 days for washout, and the NM concentrations were quantified
by absorption spectroscopy. Fullerol removal determination was based upon
absorbance measurements at 400 nm. Influent solutions containing fullerols had an
average absorbance of 0.0447 ± 0.0009 cm-1. The settled effluent had an

21
absorbance of 0.0114 ± 0.0037 cm-1, which equates to roughly 75% fullerol
removal. On the basis of an influent fullerene concentration of ~2 mg/L
(absorbance at 347 nm of 0.0687 ± 0.0011 cm-1), the settled effluent consistently
contained less than 5% of the influent concentration (i.e., >95% removal).
Quantification of higher removals was complicated by the presence in the settled
effluent of organics that also had absorbance at 347 nm. The day 6 sample
underwent solid phase extraction and LC/MS following methods outlined
elsewhere [41]; this analysis suggested that very low concentrations of fullerenes
were present (<0.1 mg/L, which equates to >95% removal). However, extraction
and low-level quantification is more difficult for fullerols than for nC60 and was not
undertaken here [42].
To document the long-term and variable operation of SBRs, continuous daily
nC60 loading into a SBR was conducted over nearly 5 months. Biomass
concentrations and nC60 loadings were intentionally varied (Figure 7). The influent
nC60 concentration was 0.76 mg/L during Phase 1 (Day 0 to 90). During the first 30
days the biomass concentration was maintained at 1.8 to 2.2 g/L, and the nC60
concentration in the settled supernatant averaged 0.03 mg/L (96% removal). The
biomass concentration was then gradually decreased to 0.6 g/L by Day 60 by
supplying less carbon substrate (COD = 500 mg/L) and reducing the SRT from 6.4
days to 4.4 days. From Day 60 to 90, the nC60 concentration in the settled
supernatant averaged 0.06 mg/L (92% removal). Despite the 70% decrease in
biomass, high removals of nC60 persisted. During Phase 2 (Day 90 to 120) the
influent nC60 concentration was reduced by a factor of 10 to 0.07 mg/L while
22
maintaining the biomass concentration at 0.6 g/L. The nC60 concentration in the
settled supernatant averaged 0.002 mg/L (97% removal). During Phase 3 (Day 120
to 150) the influent nC60 concentration was increased to 2.0 mg/L while
maintaining the same biomass (0.6 g/L). The nC60 concentration in the settled
supernatant averaged 0.35 mg/L (83% removal). These experiments indicate
excellent removal of nC60 under typical activated sludge biomass concentrations
(>1.5 g/L), although some nC60 was always detectable in the settled supernatant
(i.e., simulated WWTP effluent). Under very low biomass conditions and very high
nC60 loadings (e.g., Phase 3), fullerene removal began to deteriorate.

23
0
0.5
1
1.5
2
2.5
3
0
0.25
0.5
0.75
0 50 100 150
Biomass Conc. (gTSS / L)
nC60 Conc. (m
gC60 / L )
Days of Operation
nC60 conc. In settled superntant
Biomass conc.
Phase 1 (Day 0‐90) 2 (Day 90‐120) 3 (120‐150)Influent nC60 = 0.76 mg/L 0.07 mg/L 2.0 mg/L
Figure 7 - Variation of nC60 concentration in settled supernatant during long-term
operation of the SBR. During Phase 1 the influent nC60 was maintained at 0.764
mg/L and biomass concentration intentionally decreased. During Phases 2 and 3
the biomass concentration was maintained at a low level and nC60 intentionally
varied.
3.3 NANOMATERIAL ACCUMULATION IN BIOSOLIDS AND MASS BALANCE
Biosolid samples were collected from the SBRs once per day to manage the
SRT. These samples were collected at the end of each complete mixing and aeration
period (i.e., mixed liquor), prior to the settling period. The presence of NMs in
24
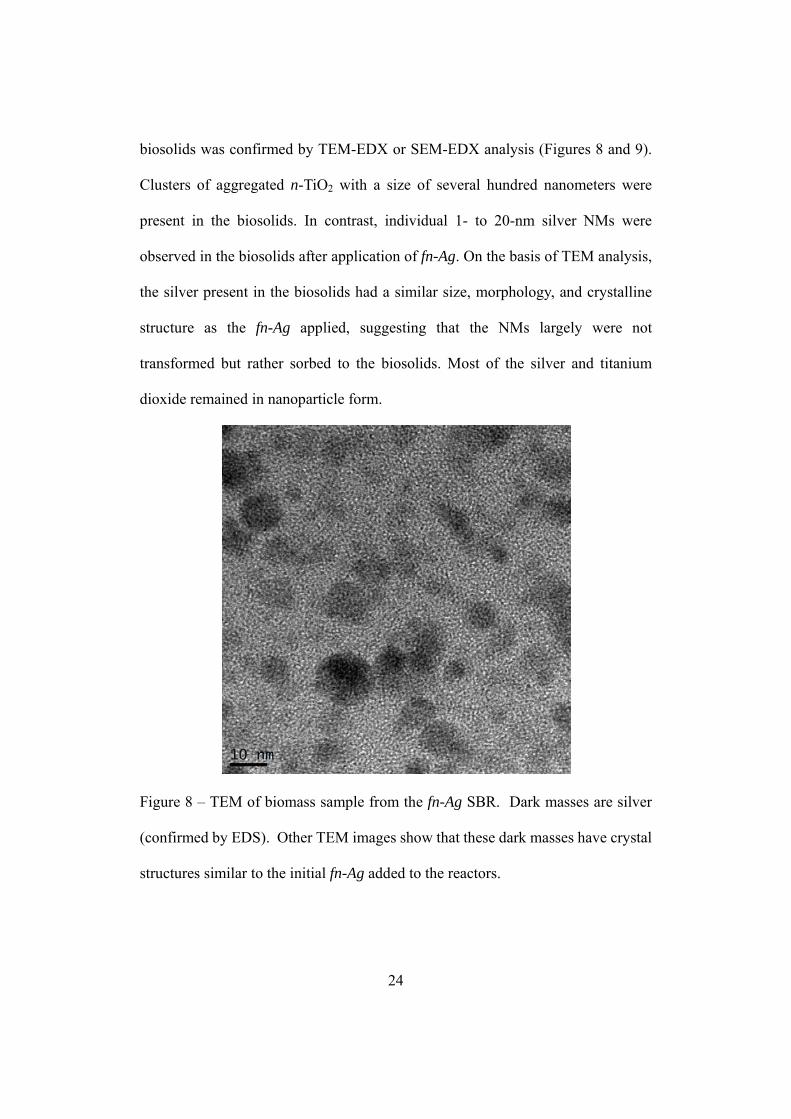
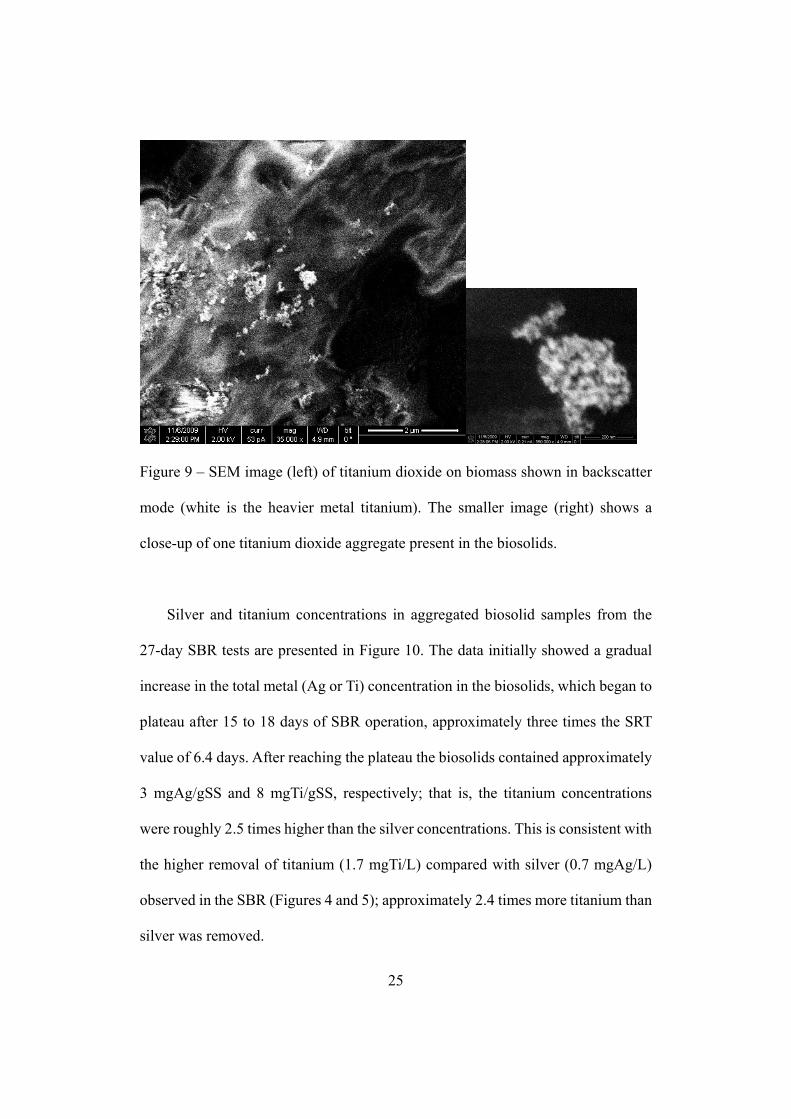
biosolids was confirmed by TEM-EDX or SEM-EDX analysis (Figures 8 and 9).
Clusters of aggregated n-TiO2 with a size of several hundred nanometers were
present in the biosolids. In contrast, individual 1- to 20-nm silver NMs were
observed in the biosolids after application of fn-Ag. On the basis of TEM analysis,
the silver present in the biosolids had a similar size, morphology, and crystalline
structure as the fn-Ag applied, suggesting that the NMs largely were not
transformed but rather sorbed to the biosolids. Most of the silver and titanium
dioxide remained in nanoparticle form.
Figure 8 – TEM of biomass sample from the fn-Ag SBR. Dark masses are silver
(confirmed by EDS). Other TEM images show that these dark masses have crystal
structures similar to the initial fn-Ag added to the reactors.
25
Figure 9 – SEM image (left) of titanium dioxide on biomass shown in backscatter
mode (white is the heavier metal titanium). The smaller image (right) shows a
close-up of one titanium dioxide aggregate present in the biosolids.
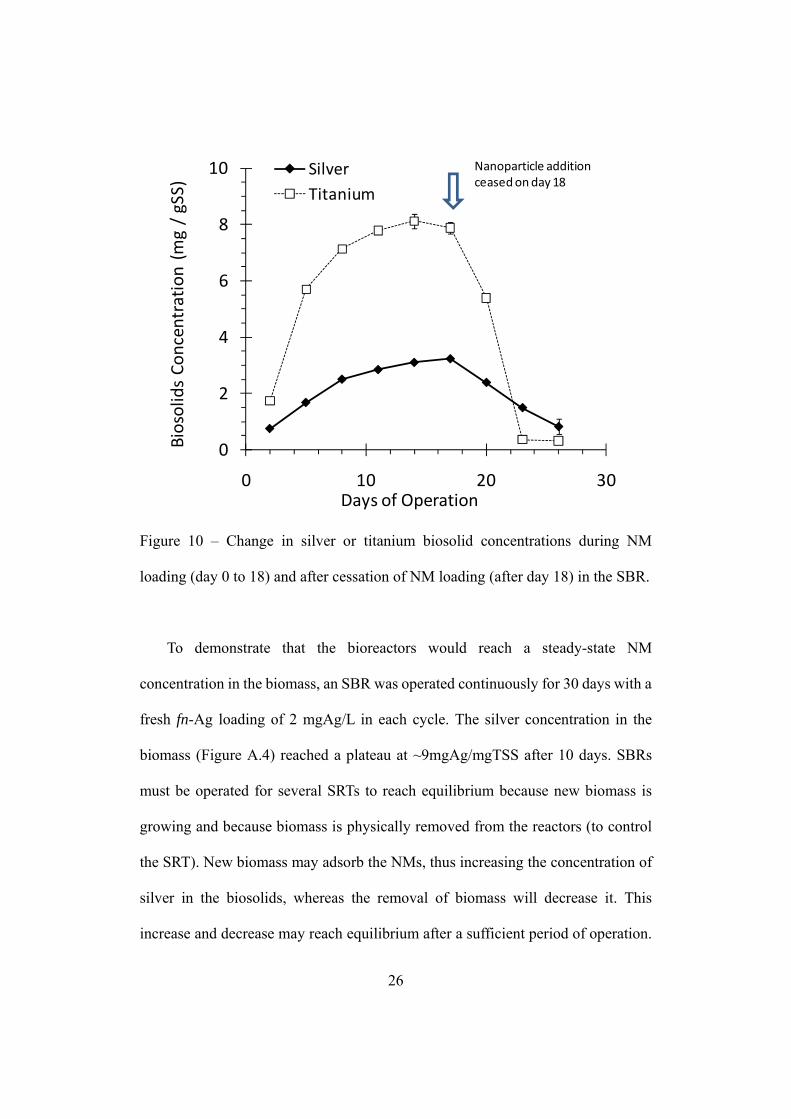
Silver and titanium concentrations in aggregated biosolid samples from the
27-day SBR tests are presented in Figure 10. The data initially showed a gradual
increase in the total metal (Ag or Ti) concentration in the biosolids, which began to
plateau after 15 to 18 days of SBR operation, approximately three times the SRT
value of 6.4 days. After reaching the plateau the biosolids contained approximately
3 mgAg/gSS and 8 mgTi/gSS, respectively; that is, the titanium concentrations
were roughly 2.5 times higher than the silver concentrations. This is consistent with
the higher removal of titanium (1.7 mgTi/L) compared with silver (0.7 mgAg/L)
observed in the SBR (Figures 4 and 5); approximately 2.4 times more titanium than
silver was removed.
26
0
2
4
6
8
10
0 10 20 30
Biosolids Concentration (mg / gSS)
Days of Operation
Silver
Titanium
Nanoparticle addition ceased on day 18
Figure 10 – Change in silver or titanium biosolid concentrations during NM
loading (day 0 to 18) and after cessation of NM loading (after day 18) in the SBR.
To demonstrate that the bioreactors would reach a steady-state NM
concentration in the biomass, an SBR was operated continuously for 30 days with a
fresh fn-Ag loading of 2 mgAg/L in each cycle. The silver concentration in the
biomass (Figure A.4) reached a plateau at ~9mgAg/mgTSS after 10 days. SBRs
must be operated for several SRTs to reach equilibrium because new biomass is
growing and because biomass is physically removed from the reactors (to control
the SRT). New biomass may adsorb the NMs, thus increasing the concentration of
silver in the biosolids, whereas the removal of biomass will decrease it. This
increase and decrease may reach equilibrium after a sufficient period of operation.
27
The two fn-Ag experiments with 2 mgAg/L (Figures A.3 and A.4) resulted in
roughly 3 times higher silver concentration in the biosolids than the 0.8 mgAg/L
(Figures 4 and 10), which shows that higher silver loadings lead to higher steady
state biosolids concentrations of silver; the 2 mgAg/L experiment was operated at a
slightly lower steady state biomass concentration (0.6 mgTSS/L; Figure A.3) than
the 0.8 mgAg/L experiment (1.8 0.2 mgTSS/L; Figure A.3) which accounts for
the slightly higher silver concentration in the higher silver loading experiment.
Overall, the results implied that short-term operation of SBR reactors (i.e., less than
2 to 3 times the SRT value), or even batch isotherm tests, may not accurately
represent the accumulation of NMs in biosolids in a real WWTP.
Combining data for NM concentrations in settled effluent with mixed liquor
samples allowed for NM mass balances to be conducted. Over the course of the
SBR experiments, mass balances between metal loading and measured metal
concentrations were in good agreement (<10% difference). Several mass balance
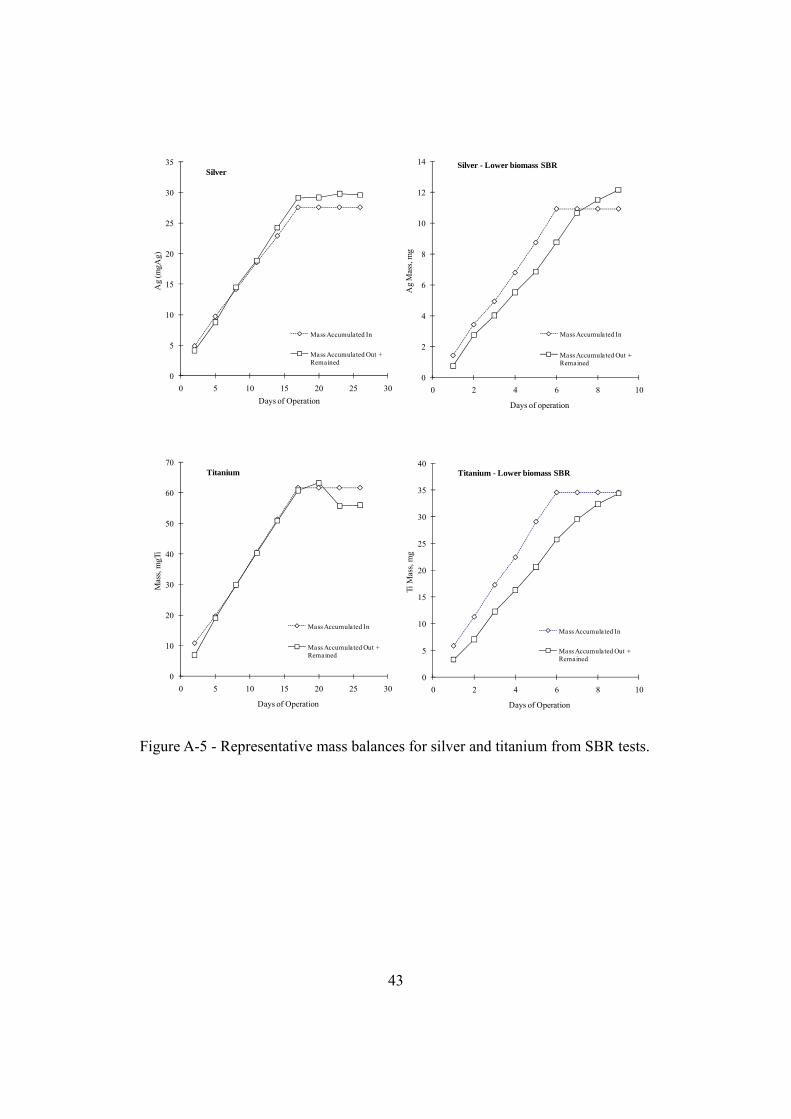
plots are presented in Figure A.5. Closure of the mass balances is important
because it confirms that other NM loss mechanisms, such as NM sorption to the
reactor or attachment to bubbles (i.e., aerosolization), were negligible in the SBRs.
28
Chapter 4
CONCLUSION AND FUTURE WORK RECOMMENDATION
Overall, the data collected indicate that biological wastewater treatment plants
operated using suspended biomass (e.g., activated sludge) have the potential to
remove engineered nanomaterials from wastewaters. Both small, negatively
charged NMs (e.g., fn-Ag) and larger aggregates of NMs (e.g., n-TiO2) are removed
by interaction with biomass in systems operated with TSS similar to that of
full-scale WWTPs. The mechanisms of these interactions between NMs and
bacteria appear to involve electrostatic attraction and to be size dependent [43, 44].
It is apparent that in our SBRs and other batch experiments that higher biomass
(TSS) concentrations improved NM removal [45]. Thus, systems operated with
even higher TSS levels than those selected here, which represent common activated
sludge systems, could be expected to remove NMs more efficiently. For example,
membrane bioreactors (MBRs) often operate with biomass concentrations on the
order of 10 gTSS/L. In addition to operating at higher biomass concentrations, the
0.1- to 0.4-µm membrane employed by MBR systems would likely improve overall
silver removal compared with sedimentation alone. Many older or smaller WWTPs
employ fixed-film biological reactors (e.g., trickling filters) rather than the
suspended biomass systems simulated here, which are used by activated sludge
systems. Further research into NM removal by attached microbial communities is
therefore needed.
As NM removal from wastewater occurs, NMs become concentrated in
biosolids. Roughly 6 to 8 million tons of municipal waste biosolids are produced

29
annually in the USA [46], and this amount is increasing because of the
commissioning of new plants and upgrades of existing facilities [47].
Approximately 60% of the biosolids in the USA are applied to land, 22%
incinerated, and 17% landfilled [46], but the trends are regionally variable. There is
considerable debate about the proper disposal for biosolids [48]. On one hand, land
application of biosolids is viewed as a sustainable practice because they provide
valuable nutrients and structure to soils. On the other hand, new or more stringent
regulations due to a wide array of pollutant could lead to less land application of
biosolids and higher rates of incineration [48]. Incineration can recover thermal
energy, but it creates new problems associated with particulate emissions and
deposition of ashes into landfills. Incineration of biosolids generates particulates
containing heavy metals or polyaromatic hydrocarbons [49, 50]. Fly ash is often
mixed with biosolids and land applied as a fertilizer [51]. Elements used in NMs
(e.g. Ti, Zn) are found in fly ash in concentrations exceeding 3000 ppm [52], but
little work has characterized the mineralogy of these residuals. Approximately 170
incinerators treat biosolids within the USA [53] incinerating almost a quarter of
biosolids generated in the nation [54]. Incineration is more prevalent in countries
with high population density (e.g., the European Union and Japan) where land
disposal is not an option or public concern about food chain contamination exists
[48, 52, 55, 56]. Additional research is needed to understand the long-term fate of
NMs as biosolids are subsequently disposed.
30
REFERENCES
1. NNI, N.N.I., What is nanotechnology?, 2006: Wilmington, DE: Dupont, and Washington, DC: Environmental Defense.
2. Maynard, A.D., et al., Safe handling of nanotechnology. Nature, 2006. 444(7117): p. 267-269.
3. WoodrowWilson. The Project on Emerging Technologies (http://www.nanotechproject.org/). 2009.
4. Thayer, A.M., Firms find a new field of dreams. Chem. Eng. News, 2000. 78(42): p. 36-38.
5. Muhling, M., et al., An investigation into the effects of silver nanoparticles on antibiotic resistance of naturally occurring bacteria in an estuarine sediment. Marine Environmental Research, 2009. 68(5): p. 278-283.
6. Ramsden, C.S., et al., Dietary exposure to titanium dioxide nanoparticles in rainbow trout, (Oncorhynchus mykiss): no effect on growth, but subtle biochemical disturbances in the brain. Ecotoxicology, 2009. 18(7): p. 939-951.
7. Handy, R.D., A.N. Jha, and A. Al-Jubory, In vitro techniques and their application to nanoparticles. Comparative Biochemistry and Physiology a-Molecular & Integrative Physiology, 2009. 153A(2): p. S87-S87.
8. Oberdorster, G., V. Stone, and K. Donaldson, Toxicology of nanoparticles: A historical perspective. Nanotoxicology, 2007. 1(1): p. 2-25.
9. Klaine, S.J., et al., Nanomaterials in the environment: Behavior, fate, bioavailability, and effects. Environmental Toxicology and Chemistry, 2008. 27(9): p. 1825-1851.
10. Handy, R.D., R. Owen, and E. Valsami-Jones, The ecotoxicology of nanoparticles and nanomaterials: current status, knowledge gaps, challenges, and future needs. Ecotoxicology, 2008. 17(5): p. 315-325.

31
11. Duran, N., et al., Antibacterial effect of silver nanoparticles produced by fungal process on textile fabrics and their effluent treatment. Journal of Biomedical Nanotechnology, 2007. 3(2): p. 203-208.
12. Tong, Z.H., et al., Impact of fullerene (C-60) on a soil microbial community. Environmental Science & Technology, 2007. 41(8): p. 2985-2991.
13. Cheng, J.P., E. Flahaut, and S.H. Cheng, Effect of carbon nanotubes on developing zebrafish (Danio rerio) embryos. Environmental Toxicology and Chemistry, 2007. 26(4): p. 708-716.
14. Moore, M.N., Do nanoparticles present ecotoxicological risks for the health of the aquatic environment? Environment International, 2006. 32(8): p. 967-976.
15. Oberdorster, E., et al., Ecotoxicology of carbon-based engineered nanoparticles: Effects of fullerene (C-60) on aquatic organisms. Carbon, 2006. 44(6): p. 1112-1120.
16. Robichaud, C.O., et al., Estimates of Upper Bounds and Trends in Nano-TiO2 Production As a Basis for Exposure Assessment Environ. Sci. Technol., ASAP.
17. Wiesner, M.R., et al., Decreasing Uncertainties in Assessing Environmental Exposure, Risk, and Ecological Implications of Nanomaterials. Environmental Science & Technology, 2009. 43(17): p. 6458-6462.
18. Nowack, B., Is anything out there? What life cycle perspectives of nano-products can tell us about nanoparticles in the environment. Nano Today, 2009. 4(1): p. 11-12.
19. Gottschalk, F., et al., Modeled Environmental Concentrations of Engineered Nanomaterials (TiO2, ZnO, Ag, CNT, Fullerenes) for Different Regions. Environmental Science & Technology, 2009. 43(24): p. 9216-9222.
20. Mueller, N.C. and B. Nowack, Exposure modeling of engineered nanoparticles in the environment. Environmental Science & Technology, 2008. 42(12): p. 4447-4453.
32
21. Nowack, B. and T.D. Bucheli, Occurrence, behavior and effects of nanoparticles in the environment Environmental Pollution, 2007. 150(1): p. 5-22.
22. Nowack, B., The behavior and effects of nanoparticles in the environment. Environmental Pollution, 2009. 157(4): p. 1063-1064.
23. Brar, S.K.V., M.; Tyagi, R.D.; Surampalli, R.Y. , Engineered nanoparticles in wastewater and wastewater sludge – Evidence and impacts. Waste Management, 2010. 30: p. 504-520.
24. Kiser, M.A., et al., Titanium Nanomaterial Removal and Release from Wastewater Treatment Plants. Environ. Sci. Tech., 2009.
25. Benn, T., The Release of Engineered Nanomaterials from Commercial Products, in School of Sustainable Engineering and The Built Environment2009, Arizona State University: Tempe, AZ.
26. Limbach, L.K., et al., Removal of oxide nanoparticles in a model wastewater treatment plant: Influence of agglomeration and surfactants on clearing efficiency. Environmental Science & Technology, 2008. 42(15): p. 5828-5833.
27. Kim, B., Park, C.S., Murayama, M., Hochella, M.F., Discovery and Characterization of Silver Sulfide Nanoparticles in Final Sewage Sludge Products. Environ. Sci. & Technol., 2010. 44(19): p. 7509-7514.
28. Nowack, B. and T.D. Bucheli, Occurrence, behavior and effects of nanoparticles in the environment, in Environmental Pollution2007. p. 5-22.
29. Yin, Y.X., et al., Examination of purified single-walled carbon nanotubes on activated sludge process using batch reactors. Journal of Environmental Science and Health Part a-Toxic/Hazardous Substances & Environmental Engineering, 2009. 44(7): p. 661-665.
30. Jarvie, H.P., Al-Obaidi, H., King, S.M., Bowes, M.J., Lawrence, M.J., Drake, A.F., Green, M.A., Dobson, P.J., Fate of Silica Nanoparticles in Simulated Primary Wastewater Treatment. Environ. Sci. & Technol., 2009. 43(22): p. 8622-8628.
33
31. Limbach, L.K., et al., Removal of oxide nanoparticles in a model wastewater treatment plant: Influence of agglomeration and surfactants on clearing efficiency, in Environmental Science & Technology2008. p. 5828-5833.
32. Moussa, M.S., et al., Modelling nitrification, heterotrophic growth and predation in activated sludge. Water Research, 2005. 39(20): p. 5080-5098.
33. APHA, AWWA, and WEF, Standard Methods for the Examination of Water And Wastewater (21st Edition)2005, Washington, DC: American Public Health Association.
34. Benn, T., P. Westerhoff, and P. Herckes, Detection of Fullerenes (C60 and C70) in Commercial Cosmetics. Environmental Engineering Science, 2010. 39 (6): p. 1875-1882.
35. Pycke, B.F., et al., Strategies for quantifying C60 fullerenes in biological samples and implications for toxicological Studies. Trends in Analytical Chemistry, 2011. 30(1): p. 44-57.
36. Benn, T., et al., Evaluation of extraction methods for quantification of aqueous fullerenes in urine. Analytical and Bioanalytical Chemistry, in-press.
37. Duran, N., et al., Antibacterial effect of silver nanoparticles produced by fungal process on textile fabrics and their effluent treatment, in Journal of Biomedical Nanotechnology2007. p. 203-208.
38. Choi, O.K., Hu, Z.Q., Nitrification inhibition by silver nanoparticles. Water Sci. & Technol., 2009. 59(9): p. 1669-1702.
39. Zhang, Y., et al., Impact of Natural Organic Matter and Divalent Cations on the Stability of Aqueous Nanoparticles. Water Research, 2009. 43(17): p. 4249-4257.
40. Adams, N.W.H. and J.R. Kramer, Silver speciation in wastewater effluent, surface waters, and pore waters. Environmental Toxicology and Chemistry, 1999. 18(12): p. 2667-2673.
34
41. Chen, Z., P. Westerhoff, and P. Herckes, Quantification of C-60 fullerene concentrations in water. Environmental Toxicology and Chemistry, 2008. 27(9): p. 1852-1859.
42. Chao, T.-C., et al., Characterization and LC-MS/MS based quantification of hydroxylated fullerenes. Analytical Chemistry, in-press.
43. Zhang, W., A.G. Stack, and Y.S. Chen, Interaction force measurement between E. coli cells and nanoparticles immobilized surfaces by using AFM. Colloids and Surfaces B-Biointerfaces, 2011. 82(2): p. 316-324.
44. Zhang, W., et al., Adsorption of hematite nanoparticles onto Caco-2 cells and the cellular impairments: effect of particle size. Nanotechnology, 2011. 21(35).
45. Kiser, M.A., et al., Titanium Nanomaterial Removal and Release from Wastewater Treatment Plants, in Environmental Science & Technology2009. p. 6757-6763.
46. Peccia, J. and T. Paez-Rubio, QUANTIFICATION OF AIRBORNE BIOLOGICAL CONTAMINANTS ASSOCIATED WITH LAND APPLIED BIOSOLIDS, in Final Report2006, Water Environment Research Foundation. p. 169.
47. NRC, BIOSOLIDS APPLIED TO LAND: ADVANCING STANDARDS AND PRACTICES, N.R.C. (NRC), Editor 2002, National Academy Press: Washington, DC. p. 284.
48. Wang, H.L., et al., Technological options for the management of biosolids. Environmental Science and Pollution Research, 2008. 15(4): p. 308-317.
49. Shao, J.G., et al., Emission characteristics of heavy metals and organic pollutants from the combustion of sewage sludge in a fluidized bed combustor. Energy & Fuels, 2008. 22(4): p. 2278-2283.
50. de Velden, A.V., et al., The distribution of heavy metals during fluidized bed combustion of sludge (FBSC). Journal of Hazardous Materials, 2008. 151(1): p. 96-102.
35
51. Reijnders, L., Disposal, uses and treatments of combustion ashes: a review. Resources Conservation and Recycling, 2005. 43(3): p. 313-336.
52. Marani, D., et al., Behaviour of Cd, Cr, Mn, Ni, Pb, and Zn in sewage sludge incineration by fluidised bed furnace. Waste Management, 2003. 23(2): p. 117-124.
53. EPA, U., AP 42: Compilation of Air Pollutant Emission Factors, Volume 1: Stationary Point and Area Sources (5th Edition), Retrieved from http://www.epa.gov/ttnchie1/ap42/ on January 16, Editor 2009.
54. USEPA, Biosolids Generation, Use, and Disposal in the United States, 1999: Washington DC.
55. Commision, E., Pollutants in urban wastewater and sewage sludge. Final Report, 2001, Office for Official Publications of the European Communities: Luxembourg.
56. Hara, K. and T. Mino, Environmental assessment of sewage sludge recycling options and treatment processes in Tokyo. Waste Management, 2008. 28(12): p. 2645-2652.
57. Moussa, M.S., et al., Modelling nitrification, heterotrophic growth and predation in activated sludge, in Water Research2005. p. 5080-5098.

36
APPENDIX A
SUPPLEMENTARY INFORMATION

37
Figure A-1A- Photograph of SBRs on a mixing system with aeration tubes (blue).
Gas washing bottle
House compressed air
Valve and sampling port
Figure A-1B- Schematic diagram for the SBRs which includes mechanical mixing
provided using a standard apparatus using rotational shafts with rectangular
paddles (1-inch x 3-inch) attached at the end (Stirrer Model 7790-400, Phipps and
Bird, VA) at 120 rpm. Multiple gas diffusion stones (3/8'' * 19/16'') were used
during aeration and did not interfere with mechanical mixing. The total volume of
the reactor (B-Ker from Phipps and Bird) is 2 L and has dimensions of 7-15/16" H x
4-15/16" W.
38
Figure A-1C- Reactor (1 gallon glass bottle wrapped in tin-foil) used only for the
long-term experiments with fullerenes. 2.5L of solution was contained in the bottle.
The HRT was managed by removing 2L of water daily and replacing with fresh
feed solution containing NPs. The SRT was managed at 6.4 days for higher TSS
tests and 4.4 days for lower TSS tests. Mechanical mixing was provided with a
large magnetic stir-bar and mixing sufficient to keep biomass suspended. Aeration
was provided using gas diffusion stones (1/2'' * 1'').
Feed and Trace Mineral Solution Composition
An influent feed solution was prepared to feed the bacteria in the SBRs
following a published formulation [57], by dissolving the following ingredients
into 1 L of ultrapure water (Milipore Milli-Q) with conductivity < 1.1 µS/cm: (1)
1.002 g of monosodium glutamate (C5H8NO4Na) as a carbon and nitrogen source,
39
(2) 219 mg of potassium dihydrogen phosphate KH2PO4 as a phosphorous source,
(3) 90 mg of magnesium sulfate heptahydrate (MgSO4•7H2O), (4) 14 mg of
calcium chloride monohydrate (CaCl2•H2O), (5) 36 mg of potassium chloride
(KCl), and (6) 0.3 mL of trace minerals solution (see SI) to enhance bacterial
growth. The synthetic feed solution had a conductivity of 0.5 mS, COD of 780
mg/L, and total dissolved nitrogen (TDN) of 150 mg N/L.
The trace minerals solution was prepared by dissolving the following salts in
1 L of ultrapure water: (1) 1.5 g of ferric chloride hexahydrate (FeCl3•6H2O), (2)
0.15 g of boric acid (H3BO3), (3) 0.03 g of copper sulfate pentahydrate
(CuSO4)•5H2O, (4) 0.18 g of potassium iodide (KI), (5) 0.12 g of manganese
chloride tetrahydrate (MnCl2•4H2O), (6) 0.06 g of sodium molybdenate dihydrate
(Na2MoO4•2H2O), (7) 0.12 g of zinc sulfate heptahydrate (ZnSO4•7H2O), (8) 0.15
g of cobalt chloride hexahydrate (CoCl2•6H2O), and (9) 10 g of Sodium-EDTA
[57].
SBR operation and sampling procedure
The reactors were operated in a 10 hr cycle mode that consisted of 8 hours of
aeration (using diffusion stones and mechanical mixing), 90 minutes of sludge
settling, and 30 minutes of effluent replacement. Before the sludge settling step,
125 mL of the mixed liquor suspended solid was removed and stored for analysis at
4 oC. The effluent replacement included discharge of 875 mL of settled supernatant
and addition of 1 L fresh synthetic feed solution. This mode of operation allowed
for a Sludge Retention Time (SRT) of 6.4 days.

40
For the 27-day operated reactor, aliquots (each 25 mL) were collected over six
cycle periods (3 days) and combined to obtain 3-day composite influent samples.
The 125 mL aliquots obtained from the mixed liquor over six cycle periods were
also to form 3-day composite mixed liquor samples. Using the same protocols,
3-day composite effluent samples were also prepared. Additional 20-mL aliquots
were sampled over a six cycle periods from the bottom 0.6 L of the control reactors
with no biomass, and the samples were combined for a 3-day composite sample.
All samples were stored in the dark at 40C before processing and analysis.
For the 150-day fullerene experiment the SRT was maintained at either 6.4
days or 4.4 days, with the later required to achieve steady-state concentrations of
lower TSS levels which were desired. The same HRT was maintained.
Hombikat UV-100
20 25 30 35 40 45 50 55 60
2θ (⁰)
Figure A-2 - XRD of HOMBIKAT titanium dioxide nanoparticles.

41
0
0.5
1
1.5
2
2.5
3
0 5 10 15 20 25 30 35
Time,Days
Con
cent
ratio
n,m
gAg/
L
0
0.5
1
1.5
Tot
al S
uspe
nded
Sol
ids
gSS
/L
Influent AgSettled effluent AgFiltered Ag (0.45um membrane)Filtered Ag (10kDa membrane)Total Suspended Solids
Figure A-3 - Silver concentrations in the influent, settled effluent, filtered effluent
(0.45 m membrane and 10 kDa membrane) and the total suspended solids in a
SBR operated for 30 days.

42
0
1
2
3
4
5
6
7
8
9
10
0 10 20 30 40
Time, Day
Con
c. m
gAg/
g-S
S
Figure A-4 - Silver concentrations in biosolids from SBRs operated for 30 days
(Figure A.3)
43
0
2
4
6
8
10
12
14
0 2 4 6 8 10
Ag
Mas
s, m
gDays of operation
Silver - Lower biomass SBR
Mass Accumulated In
Mass Accumulated Out + Remained
0
5
10
15
20
25
30
35
0 5 10 15 20 25 30
Ag
(mgA
g)
Days of Operation
Silver
Mass Accumulated In
Mass Accumulated Out + Remained
0
10
20
30
40
50
60
70
0 5 10 15 20 25 30
Mas
s, m
gTi
Days of Operation
Titanium
Mass Accumulated In
Mass Accumulated Out + Remained
0
5
10
15
20
25
30
35
40
0 2 4 6 8 10
Ti M
ass,
mg
Days of Operation
Titanium - Lower biomass SBR
Mass Accumulated In
Mass Accumulated Out + Remained
Figure A-5 - Representative mass balances for silver and titanium from SBR tests.