fate of atmospheric hox and peroxides in the … effects of transition metal redox coupling on ho x...
TRANSCRIPT

Fate of Atmospheric HOX and Peroxides in the Particle Phase
by
Kaitlin Marie Badali
A thesis submitted in conformity with the requirements for the degree of Master of Science (M.Sc.)
Department of Chemistry University of Toronto
© Copyright by Kaitlin Marie Badali 2014

ii
Fate of Atmospheric HOX and Peroxides in the Particle Phase
Kaitlin Marie Badali
Master of Science (M.Sc.)
Department of Chemistry
University of Toronto
2014
Abstract
The odd hydrogen radicals hydroxy (OH) and hydroperoxy (HO2), collectively referred to as
HOX, along with peroxides, play a significant role in determining the oxidative capacity of
the atmosphere. These oxidants are key species in the removal of many harmful trace gases
in the atmosphere. When transition metal ions are present in an aqueous aerosol, they will
efficiently cycle with HOX radicals and affect the rate at which sink species are formed. The
plausibility of the coupling of copper and iron redox cycles is investigated using aqueous
solutions of organics and transition metals to represent aqueous aerosols. The formation of
secondary organic aerosols (SOA) has been shown to generate hydroperoxides. The yields
and stability of peroxides in SOA generated and aged under a variety of conditions is
investigated, with both atmospheric and indoor air quality implications.

iii
Acknowledgments
Throughout my time at the University of Toronto, I have had an overwhelming amount of
support from both the Environmental Chemistry department and my family. Firstly, I would
like to thank my supervisor, Jon Abbatt, for his advice and guidance throughout my graduate
degree. His knowledge of atmospheric chemistry and supportive supervision technique
allowed me to develop my critical thinking and research skills. I would also like to thank my
committee members, Andre Simpson for his input into this thesis, and Jamie Donaldson for
his insightful questions. Thank you to the Donaldson group for the lending of the
fluorometer, to the Mabury group for use of the Solar Simulator, and the Murphy group for
the modelling software. Thank you to Jinqiu Mao at Princeton University for his guidance
and suggestions through the first project.
I would like to thank the incredible collection of students and post-docs that comprise the
Abbatt research group – everyone brings such a unique contribution to the group dynamic
and helped me in different ways. Firstly, I would like to thank Maria for her friendship and
scientific support through both projects – I couldn’t be happier to share an office with you,
gracias! Thank you to Shouming for his SOA expertise and helping me through the chamber
experiments, to Dana for her extensive knowledge of the HRP-DCF assay, Ran for his
mechanistic help and insightful interpretations, and Rob for showing me the ropes the
summer I arrived. A special thanks to Jacquie and Michaela for your friendship and coffee
breaks! Thank you to each and every member of the group for helping me along in a special
way.
Finally, I would like to thank my family for the unwavering support through my entire
university career. My parents both emotionally and financially supported me along these past
7 years, I could not have done it without you and I am forever in debt (literally!). Graham,
you have been my rock through this all and I couldn’t thank you enough for everything
you’ve done. To my brothers, Alex and Chris, my grandma, Jen, Chester and everyone else –
your love and encouragement have helped me along the way!

iv
Table of Contents
Abstract ..................................................................................................................................... ii
Acknowledgments ................................................................................................................... iii
Table of Contents ..................................................................................................................... iv
List of Tables ........................................................................................................................... vi
List of Figures ......................................................................................................................... vii
Chapter 1 Introduction and Overview ...................................................................................... 1
1.1 Oxidative Capacity of the Atmosphere ........................................................................... 1
1.2 HOX Radicals in the Atmosphere .................................................................................... 2
1.3 Peroxides in the Atmosphere .......................................................................................... 5
1.3.1 Peroxide Measurement ............................................................................................. 7
1.4 Research Goals ................................................................................................................ 9
1.4.1 Effects of Transition Metal Redox Coupling on HOX Chemistry ............................ 9
1.4.2 Production and Stability of Peroxides in Secondary Organic Aerosol .................. 10
1.5 References ..................................................................................................................... 11
Chapter 2 Aqueous HOX Chemistry with Copper-Iron Redox Coupling ............................... 14
2.1 Introduction ................................................................................................................... 14
2.2 Methods ......................................................................................................................... 17
2.2.1 Photolysis Samples ................................................................................................. 17
2.2.2 Horseradish Peroxidase Assay ............................................................................... 19
2.2.3 Kinetic Modelling................................................................................................... 20
2.3 Results and Discussion ................................................................................................. 21
2.3.1 Acetaldehyde photolysis......................................................................................... 21
2.3.2 Aldehyde and Copper Photolysis ........................................................................... 23
2.3.3 Aldehyde and Iron Photolysis ................................................................................ 24
2.3.4 Aldehyde, Copper, and Iron ................................................................................... 27
2.3.5 Kinetic model results .............................................................................................. 30
2.3.6 Organic Iron Complexes ........................................................................................ 31
2.4 Conclusions and Atmospheric Implications ................................................................. 33
v
2.5 References ..................................................................................................................... 35
2.6 Appendix ....................................................................................................................... 37
Chapter 3 Yields and Stability of Peroxides from Secondary Organic Aerosol Formation ... 40
3.1 Introduction ................................................................................................................... 40
3.2 Methods ......................................................................................................................... 45
3.2.1 SOA Collection using Flow Tube .......................................................................... 45
3.2.2 SOA Collection using Environmental Chamber .................................................... 46
3.2.3 SOA Storage and Extraction .................................................................................. 48
3.2.4 Photolysis in Solar Simulator ................................................................................. 48
3.2.5 Indoor Photolysis using Fluorescent Lights ........................................................... 49
3.3 Results and Discussion ................................................................................................. 49
3.3.1 Peroxide Yields in SOA ......................................................................................... 49
3.3.2 Effect of SOA Mass Loading ................................................................................. 52
3.3.3 On-Filter Stability................................................................................................... 52
3.3.4 Effect of Parafilm ................................................................................................... 54
3.3.5 In-Solution Stability ............................................................................................... 55
3.3.6 SOA Photolysis in Solar Simulator ........................................................................ 56
3.3.7 SOA Photolysis under Fluorescence Lights ........................................................... 60
3.4 Conclusions and Environmental Implications .............................................................. 60
3.5 References ..................................................................................................................... 63
Chapter 4 Implications and Future Work ............................................................................... 65
4.1 Environmental Implications .......................................................................................... 65
4.2 Future Work .................................................................................................................. 66

vi
List of Tables
Table 2.1 – Reactions and rate constants included in kinetic model ...................................... 21
Table 2.2 – Hydrogen peroxide production from photolyzed aldehyde samples ................... 22
Table 2.3 – Peroxide production in a system containing 1 mM acetaldehyde with varying
copper to iron ratios ................................................................................................................ 27
Table 2.4 – Modelled reaction rates of iron(II) and HO2 as copper concentration increases . 28
Table 3.1 – Review of peroxide yields from fresh SOA samples reported in past studies .... 50
Table 3.2 – Peroxide yields of filters stored for 24 hours using parafilm .............................. 54
Table 3.3 – Peroxide yields from photolysis of SOA on-filter and in-solution for 7 hours
under fluorescent lights........................................................................................................... 60

vii
List of Figures
Figure 1.1 – Mechanism through which hydrogen peroxide produces fluorescent signal in
HRP-DCF assay, with DCF formation and HRP catalytic cycle.............................................. 8
Figure 1.2– HRP-DCF assay sensitivities to H2O2, ROOH (t-butylhydroperoxide, cumene
hydroperoxide), and ROOR (di-t-butyl peroxide) .................................................................... 9
Figure 2.1 – Coupling of copper and iron redox cycles with fates of HOX radicals .............. 15
Figure 2.2 – Experimental setup of Suntest CPS Solar Simulator fitted with xenon arc lamp,
with respective spectrum. ....................................................................................................... 18
Figure 2.3– Calibration curve of hydrogen peroxide obtained using the HRP-DCF assay .... 19
Figure 2.4 – Peroxide production from 3 hour photolysis of 3 mM acetaldehyde in solar
simulator ................................................................................................................................. 22
Figure 2.5 – Hydrogen peroxide concentrations produced from 1-hour photolysis of samples
containing 1 mM acetaldehyde, 1 mM CuSO4, and/or 1 μM FeSO4 ...................................... 23
Figure 2.6 – Modelled production of hydrogen peroxide in a system containing 1 mM
aldehyde with varying copper concentrations at 60 minutes of photolysis ............................ 24
Figure 2.7 - Concentration of hydrogen peroxide produced from solutions containing 1 mM
acetaldehyde with iron(II) varied from 0.01 to 1.0 µM. ......................................................... 25
Figure 2.8 – Modelled Fe(III) concentration in a system containing 1 mM aldehyde with
Cu/Fe ratios of 0 (1 μM Fe(II)), 0.1 (0.1 μM Cu(II) with 1 μM Fe(II)), 1 (1 μM Cu(II) with 1
μM Fe(II)), and 1000 (1 mM Cu(II) with 1 μM Fe(II)). Dashed lines represent simulations in
which the coupling reaction (R3) was removed from model. ................................................ 29
Figure 2.9 – Generation of hydrogen peroxide from photolysis of organic acids both with and
without iron(III). ..................................................................................................................... 31
Figure 2.10 – Proposed mechanism of oxidation of acetaldehyde to form oxalic acid, which
is shown to complex with iron(III). ........................................................................................ 32
Figure 2.11 – Kinetic Model output of key species from system containing 1 mM
acetaldehyde ........................................................................................................................... 37
Figure 2.12 – Kinetic model output of key a) HOX and b) transition metal species from
system containing 1 mM acetaldehyde with 1 mM copper(II) ............................................... 37
Figure 2.13 – Kinetic model output of key a) HOX and b) transition metal species from
system containing 1 mM acetaldehyde with 1 μM iron(II) .................................................... 38

viii
Figure 2.14 – Kinetic model output of key a) HOX and b) transition metal species from
system containing 1 mM acetaldehyde with 1 mM copper(II) and 1 μM iron (II)................. 39
Figure 3.1 – Deposition location of particles within the body as a function of particle size . 40
Figure 3.2 – Mechanism of limonene ozonolysis, showing select oxidation peroxide-related
products................................................................................................................................... 42
Figure 3.3 – Simplified schematic of flow tube set up for SOA generation and collection. .. 46 Figure 3.4 – Simplified schematic of environmental chamber set up for SOA generation and
collection................................................................................................................................. 47
Figure 3.5 – Stability of peroxides in SOA stored on-filter at room temperature and in freezer
at -20 °C. ................................................................................................................................. 53
Figure 3.6 – Stability of peroxides in aqueous extract of SOA sample at room temperature. 55
Figure 3.7 – Peroxide yields from SOA photolysis using a xenon arc lamp in the solar
simulator. ................................................................................................................................ 59

1
Chapter 1
Introduction and Overview
1.1 Oxidative Capacity of the Atmosphere
Atmospheric oxidants have been the focus of much research in recent decades due to
their direct influence on air quality and climate. These species play a primary role in
dictating the oxidative capacity of the atmosphere, which is a measure of its ability to cleanse
itself of reduced gases.[1, 2] The oxidation of species such as volatile organic compounds
(VOCs), methane (CH4), carbon monoxide (CO), halocarbons, and other greenhouse gases
will generate products of lower volatility.[2-4] As a result, these gases will condense into
particles or cloud droplets and can ultimately be removed from the atmosphere through wet
and dry deposition. While oxidation chemistry within the particle and aqueous phases has
been recognized, the most heavily studied systems, and thus most thoroughly understood, are
primarily centred on gas phase reactions. With recent environmental concerns growing
around issues such as climate change, acid rain, and greenhouse gas emissions, there is a
need to understand the oxidation chemistry of the atmosphere that will occur in all phases.
Three common oxidants within the atmosphere are the hydroxy (OH) and
hydroperoxy (HO2) radicals and peroxides.[5] The OH and HO2 radicals, collectively known
as HOX, will rapidly cycle with each other in the presence of different atmospheric species.
Peroxides, on the other hand, are considered to be a reversible sink of HOX, as they are
formed through a radical termination reaction of HO2. This sink is short lived, however, as
photolysis or other reactions of the peroxides will regenerate HOX through the production of
OH radicals.[6] Consequently, the abundance and fate of these three oxidants are closely
linked and dependent on each other.
Aqueous chemistry can occur in the atmosphere in either cloud droplets or aqueous
aerosols. The liquid water content of aqueous aerosols tends to be quite low, ranging from
7.6x10⁻⁷
– 4x10⁻⁵
cm3/m
3.[7] Consequently, species that are found within the aqueous phase
of the aerosol tend to be highly concentrated. Due to the comparatively high volume of water
in cloud droplets, the concentrations of species within the aqueous phase are much more

2
dilute. Typical cloud water content ranges from 0.05-3 cm3/m
3.[7] The surface to volume
ratio of aerosol particles will also be substantially different from cloud droplets, and will
therefore influence the rates and significance of reactions that will occur. As a result of the
high surface area, it is expected that surface reactions will be more significant in aerosol
chemistry than in cloud droplets.[8]
The peroxides and HOX radicals are expected to become incorporated into the particle
and aqueous phases primarily through uptake from the gas phase.[9] Many reactions that
occur in the aqueous phase are also known to produce HOX radicals and peroxides, and thus
can also be important aqueous phase sources of oxidants. Both peroxides and the HO2 radical
are highly water soluble, resulting in a rapid uptake into aqueous aerosols and cloud droplets
from the gas phase. Past studies have reported the presence of peroxides and OH radicals
within aqueous cloud droplets, demonstrating their importance as oxidants within the
aqueous phase.
A lack of information regarding indoor air chemistry has also been recognized in
recent years, resulting in an increase of studies looking at indoor air quality. Like outdoors,
some of the major oxidants indoors are believed to be peroxides, the hydroxy and
hydroperoxy radicals.[10] Several studies in the past decade have evaluated the production of
peroxide species within secondary organic aerosol that is known to form indoors. These
studies will be discussed in detail in Chapter 3. Overall, the abundance and reactivity of these
oxidants indoors is not yet well characterized.
1.2 HOX Radicals in the Atmosphere
The primary source of HOX in the atmosphere is the production of the hydroxyl
radical from the photolysis of ozone in the presence of water vapour. This reaction, as shown
below in R1 and R2, will occur at wavelengths of 315 nm and below.[4] The primary source
of HO2 radicals is the atmosphere is the photolysis of carbonyls, such as formaldehyde
shown in R3.[8] Additionally, HO2 radicals are generated through oxidation processes in the
atmosphere that are initiated by OH radicals.

3
O3 + hν O(1D)
O(1D) + H2O 2 OH
CH2O + hν CO + 2 HO2
Atmospheric concentrations of the HOX radicals vary widely and are dependent on
surrounding conditions. The concentrations of OH will be significantly influenced by both
the humidity and solar irradiation levels of its environment, as well as the concentrations of
various reactants.[2] Under typical clean-air conditions, the HO2 radical is approximately
100 times more abundant than OH.[4] A summary of recent HO2 measurements report an
average mixing ratio of 8.7 ± 3.7 pptv.[11] Despite its low concentration, the effectiveness of
OH as an oxidant is accounted for by it highly reactive nature. Under typical tropospheric
conditions, the lifetime of the OH radical is only 1 second.[12, 13] Conversely, the HO2
radical is less reactive within the gas-phase, typically having a lifetime of 100 seconds.[4]
Past studies have investigated oxidation by both OH and HO2 radicals within aerosol
particles and cloud droplets, stressing the importance of considering heterogeneous oxidation
by HOX when studying the chemistry of the atmosphere. These radicals can become
incorporated into the particle or aqueous phase through uptake processes, or formed by
reactions at the surface or within particles. Typically, uptake of HOX into particles will only
occur through interactions with HO2, as a result of its higher gas phase concentrations and
solubility in the aqueous phase. With a pKa value of 4.69, HO2 will tend to dissociate into O2-
and H+
upon uptake into the aqueous phase.[14] While the concentration of O2- may be
much lower than the protonated form in some particles, its reaction rates can be faster than
those of HO2.[11] Concentrations of OH in the atmosphere tend to be too low for its uptake
to be significant. The typical lifetime of the OH radical is also much shorter than its average
uptake rate.[8]
The uptake of HOX radicals into cloud droplets is typically limited by gas phase
diffusion to the droplet surface.[15] This limitation is not significant for aerosol particles,
however, due to their small size. One consequence of the small particle size of aerosols is
that dissolved species tend to re-evaporate from the particle at much faster rates than in a
cloud droplet.[8] It is common for atmospheric particles to possess an organic coating on
2 O2
R1
R2
R3
4
their surfaces. In these particles, the uptake across the coating will be inhibited, resulting in a
decrease in the levels of HOX radicals within these aerosols.[15]
The uptake rates of HO2 radicals into cloud droplets and aerosol particles under
various conditions have been the subject of much recent research. Due to the solubility and
dissociation of HO2 in the aqueous phase, it has been found that its uptake coefficients (γ)
can range from 0.05-0.1.[16] The rate of uptake has been found to be enhanced when the
particle is enriched in species such as transition metals, increasing to uptake coefficients as
high as >0.2 in the presence of copper.[15, 17] Much of the chemistry that will occur within
the particle following uptake is still not well understood, especially due to the presence of
varying species in different particle types.
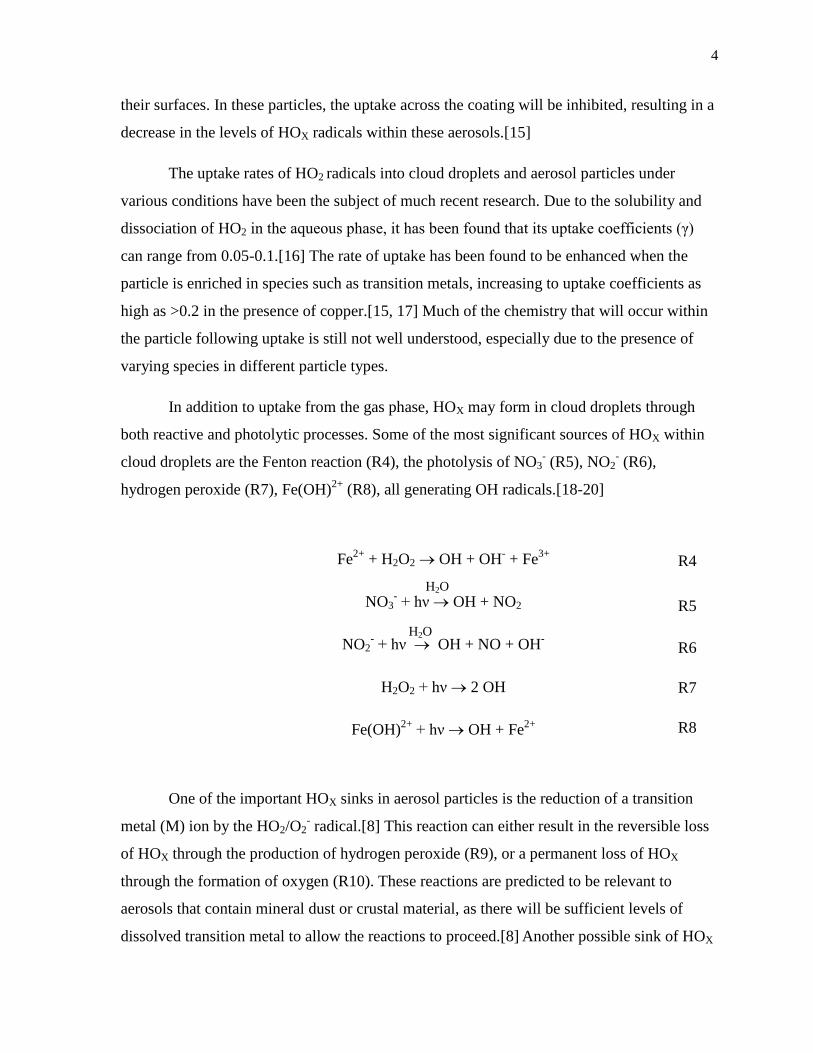
In addition to uptake from the gas phase, HOX may form in cloud droplets through
both reactive and photolytic processes. Some of the most significant sources of HOX within
cloud droplets are the Fenton reaction (R4), the photolysis of NO3- (R5), NO2
- (R6),
hydrogen peroxide (R7), Fe(OH)2+
(R8), all generating OH radicals.[18-20]
Fe2+
+ H2O2 OH + OH- + Fe
3+
NO3- + hν OH + NO2
NO2- + hν OH + NO + OH
-
H2O2 + hν 2 OH
Fe(OH)2+
+ hν OH + Fe2+
One of the important HOX sinks in aerosol particles is the reduction of a transition
metal (M) ion by the HO2/O2- radical.[8] This reaction can either result in the reversible loss
of HOX through the production of hydrogen peroxide (R9), or a permanent loss of HOX
through the formation of oxygen (R10). These reactions are predicted to be relevant to
aerosols that contain mineral dust or crustal material, as there will be sufficient levels of
dissolved transition metal to allow the reactions to proceed.[8] Another possible sink of HOX
R4
R5
R6
R7
R8
H2O
H2O

5
in aerosol particles is the reaction of HO2 with dissolved halide species, however this sink is
typically only significant in the marine boundary layer where there are high levels of
halides.[21]
Mx + O2
- M
(x+1) + H2O2 + 2OH
-
Mx + O2
- M
(x+1) + O2
1.3 Peroxides in the Atmosphere
Of the peroxide family, hydrogen peroxide is most prevalent in the atmosphere,
typically accounting for 70-90% of total peroxide content.[22] The remaining portion of the
peroxides is thought to be composed of small organic peroxides, with methyl hydroperoxide
and peroxyacetic acid being most frequently measured.[23] Typical mixing ratios of
hydrogen peroxide are 0.5-5 ppb in the gas phase, while concentrations are approximately
250 µM in the aqueous phase of cloud droplets.[23, 24] Peak peroxide levels have been
measured in the summer during high pollution events, when solar irradiation and peroxide-
forming species are at their highest.[23]
One of the primary loss processes of HOX radicals in the atmosphere is the radical
termination reaction of HO2 to generate peroxides.[23] This reaction can form either
hydrogen peroxide through the self reaction of HO2 (R11), or organic hydroperoxides
through the reaction of HO2 with RO2 (R12).[25] These pathways to produce peroxides in
the atmosphere can occur both in the gas phase and within the aqueous phase. In the aqueous
phase, as the liquid water content of the aerosols or cloud droplets increases, the rate at
which peroxide will be formed through this self reaction will decrease.[23] This reduction in
the production rate is a result of the dilution of HO2 as the volume of water increases.
HO2 + HO2 H2O2 + O2
HO2 + RO2 ROOH + O2
R11
R12
H2O
R9
R10

6
The ozonolysis of volatile organic compounds has also been shown to be a potential
source of peroxides, through first forming an energetic radical known as a Criegee
intermediate. This intermediate can go on to react with water, generating hydroperoxides.[24,
26, 27]
Similar to the processes that occur with HO2 radicals, peroxides can be taken up into
the aqueous and particle phases from the gas phase.[27] Their favourable partitioning to the
aqueous phase is a result of their high solubility in water and their abundance in the gas
phase.[24, 28] Once in the aqueous phase, the peroxides may be held tightly in solution by
binding with ions present in solution. This results in the formation of a peroxohydrate adduct,
similar to a solvation shell that would form with water.[29]
In past studies, the photolysis of cloud and fog droplets has been shown to generate
peroxides.[30] Although this production was observed in samples collected from various
locations, the species responsible for this photolytic production have not yet been
identified.[18] The production of peroxides was also observed in aqueous solutions of
ambient automobile exhaust particles.[31] This generation is expected to be due to the redox
cycle of HO2 radicals with transition metals, quinone, and organic species that may be found
in various atmospheric particles.[24, 31]
In the aqueous phase, peroxides are known to be the most significant pathway to
oxidize sulphur. This oxidation, shown in R13 and R14, results in the production of sulphuric
acid.[32] Although peroxide is expected to participate in other oxidation reactions in the
aqueous or particle phases, these reactions have not been well characterized and their
significance is not known. As mentioned in the previous section, the peroxides may
potentially volatilize into the gas phase from small particles with low liquid water content.
SO2 + H2O HSO3- + H
+
HSO3- + H2O2 HSO4
- + H2O
Peroxides are of particular importance in the atmosphere because of the significant
role they play in oxidizing sulphur in the aqueous phase to form acid rain.[33] Peroxides also
have the potential to interfere with processes within the biosphere by damaging delicate
R13
R14

7
leaves and other components of various plant species. Once the peroxides have deposited
onto the plant, they have been shown to rapidly oxidize chlorophyll to a colourless
compound.[23] This hinders the plant’s photosynthesis ability, causing their eventual demise.
The association of peroxides with particles is also a concern for human health. Past
studies have shown that particles will carry oxidants much deeper into the respiratory system
than their gas-phase equivalents.[29, 34] Once deep within the lungs, the peroxides will
create an imbalance in oxidants and antioxidants within the cells, causing oxidative
stress.[35] The precise effects that peroxides will have on human health are not well
characterized, however, with various studies publishing conflicting results about the impacts
that particle-bound oxidants will have within the body.
1.3.1 Peroxide Measurement
Due to the challenges associated with measuring radical species, past studies have
used the measurements of peroxides as an indication of OH and HO2 radical levels.[32]
Currently, no real-time online measurement technique exists for the quantification of
peroxides. Within the community, the most commonly employed methods for detection
involve offline electrochemical reduction, chemiluminescence, and fluorescence
techniques.[27, 30] In both projects of this thesis, a fluorescent assay technique based on a
method by Keston and Brandt[36] was used to evaluate peroxide content within aqueous
samples. The experimental methods of this technique will be described in detail in Chapter 2.
a)

8
Figure 1.1 – Mechanism through which hydrogen peroxide produces fluorescent signal in
HRP-DCF assay, with a) DCF formation (adapted from Black & Brandt)[37] and b) HRP
catalytic cycle (adapted from Berglund et al.)[38]
In the assay, horseradish peroxidase (HRP) is used as a catalyst in the reaction of
peroxide with a fluorescent agent, dichlorofluorescein (DCF). The pathway through which
peroxide will generate the fluorescent molecule is found in Figure 1.1. A stock solution of
the fluorescent molecule is in the diacetate form (DCFH-DA), and must be converted to the
“activated” hydrolyzed form (DCFH) through a reaction with a base. The conversion of the
hydrolyzed molecule into the fluorescent form (DCF) in part a) of Figure 1 requires the
removal of two hydrogen atoms.[37] The catalytic cycle of horseradish peroxidase, seen in
part b) of Figure 1.1, consumes two hydrogen atoms to return the catalyst to its ground state
following its reaction with hydrogen peroxide.[38] This cycle will remove the protons from
DCFH, producing one fluorescing DCF for each hydrogen peroxide molecule consumed.
In a characterization study of the assay conducted by our group, the sensitivities of
the HRP-DCF assay to hydrogen peroxide and organic peroxides (ROOH, ROOR) were
tested. The results, as shown in Figure 1.2, demonstrate the assay’s overwhelming sensitivity
to hydrogen peroxide in aqueous samples.[39] Due to the extremely low responses by
organic peroxides, it is assumed that their contributions to the fluorescence signal will be
b)

9
negligible. Thus, it is inferred that fluorescence measured in all experimental samples will
exclusively come from hydrogen peroxide.
Figure 1.2– HRP-DCF assay sensitivities to H2O2, ROOH (t-butylhydroperoxide, cumene
hydroperoxide), and ROOR (di-t-butyl peroxide).[39]
1.4 Research Goals
In this thesis, two projects evaluate distinct aqueous- and particle-phase chemistry that
has the potential to affect levels of oxidants within the atmosphere. It is hoped that the results
of these projects will help to improve the understanding of atmospheric oxidation chemistry.
The research conducted in the second project not only occurs in the troposphere, but also has
implications for indoor air quality. In further developing our knowledge of oxidants within
aerosol particles, we will be able to better evaluate potential health effects caused by
inhalation of these particles.
1.4.1 Effects of Transition Metal Redox Coupling on HOX Chemistry
In the first project, the influence of transition metal-catalyzed redox cycles on
aqueous HOX chemistry was evaluated. It has long been accepted that transition metals will

10
participate in a redox cycles with HOX radicals in an aqueous environment.[40] In a recent
modelling paper by Mao et al., however, it was suggested that the cycles of copper and iron
would be coupled together when simultaneously present in an aerosol.[11] This chemistry
could have implications on the levels of HOX in the atmosphere, as it could form an
irreversible sink through the production of water.
In order to evaluate this coupling chemistry, the production of peroxides was
monitored in systems containing HOX radicals with only copper, only iron, and both copper
and iron together. Aqueous acetaldehyde was used as a photolytic source of HOX in all
samples, and hydrogen peroxide was measured using the HRP-DCF fluorescence assay. A
kinetic model was created in order to predict the fates and reaction pathways of different
species within each system studied experimentally.
1.4.2 Production and Stability of Peroxides in Secondary Organic Aerosol
In the second project, the production and stability of peroxides within aerosol
particles was investigated. Several past studies have reported the generation of
hydroperoxides during the oxidation of volatile organic compounds to form secondary
organic aerosols.[41] These peroxides will typically be formed as a temporary sink of gas-
phase HOX radicals. It is currently expected that most peroxides are found within particles as
the result of an uptake process from the gas phase, so this chemistry could represent an
important source of peroxide within the particle phase. The particles have been shown to
form both in the atmosphere and indoors, resulting in the potential to have effects on both
climate and health.
The yields of peroxides were measured in secondary organic aerosol formed through
the ozonolysis of α-pinene and limonene using the HRP-DCF fluorescence assay. To gain a
more complete understanding of these peroxides, their stabilities were measured under dry
and aqueous conditions at room temperature and within a freezer. The photolytic stability of
the peroxides was determined through a series of experiments using a solar simulator to
represent atmospheric conditions and fluorescent light source to replicate an indoor
environment.

11
1.5 References
[1] R.G. Prinn, The cleansing capacity of the atmosphere, in Annual Review of
Environment and Resources, 2003, pp. 29-57.
[2] R. Commane, C.F.A. Floquet, T. Ingham, D. Stone, M.J. Evans, and D.E. Heard,
Observations of OH and HO2 radicals over West Africa, in Atmospheric Chemistry
and Physics, 2010, pp. 8783-8801.
[3] J. Lelieveld, and P.J. Crutzen, The role of clouds in tropospheric photochemistry, in
Journal of Atmospheric Chemistry, 1991, pp. 229-267.
[4] D.R. Crosley, The measurement of OH and HO2 in the atmosphere, in Journal of the
Atmospheric Sciences, 1995, pp. 3299-3314.
[5] A.M. Thompson, The oxidizing capacity of the Earth's atmosphere - probably past
and future changes, in Science, 1992, pp. 1157-1165.
[6] L. Jaegle, D.J. Jacob, P.O. Wennberg, C.M. Spivakovsky, T.F. Hanisco, E.J.
Lanzendorf, E.J. Hintsa, D.W. Fahey, E.R. Keim, M.H. Proffitt, E.L. Atlas, F. Flocke,
S. Schauffler, C.T. McElroy, C. Midwinter, L. Pfister, and J.C. Wilson, Observed OH
and HO2 in the upper troposphere suggest a major source from convective injection
of peroxides, in Geophysical Research Letters, 1997, pp. 3181-3184.
[7] H. Herrmann, Kinetics of aqueous phase reactions relevant for atmospheric
chemistry, in Chemical Reviews, 2003, pp. 4691-4716.
[8] D.J. Jacob, Heterogeneous chemistry and tropospheric ozone, in Atmospheric
Environment, 2000, pp. 2131-2159.
[9] Z.M. Chen, H.L. Wang, L.H. Zhu, C.X. Wang, C.Y. Jie, and W. Hua, Aqueous-phase
ozonolysis of methacrolein and methyl vinyl ketone: a potentially important source of
atmospheric aqueous oxidants, in Atmospheric Chemistry and Physics, 2008, pp.
2255-2265.
[10] S. Gligorovski, and C.J. Weschler, The Oxidative Capacity of Indoor Atmospheres, in
Environmental Science & Technology, 2013, pp. 13905-13906.
[11] J. Mao, S. Fan, D.J. Jacob, and K.R. Travis, Radical loss in the atmosphere from Cu-
Fe redox coupling in aerosols, in Atmospheric Chemistry and Physics, 2013, pp. 509-
519.
[12] J. Lelieveld, W. Peters, F.J. Dentener, and M.C. Krol, Stability of tropospheric
hydroxyl chemistry, in Journal of Geophysical Research-Atmospheres, 2002, pp. 11.
[13] R. Sommariva, A.L. Haggerstone, L.J. Carpenter, N. Carslaw, D.J. Creasey, D.E.
Heard, J.D. Lee, A.C. Lewis, M.J. Pilling, and J. Zador, OH and HO2 chemistry in
clean marine air during SOAPEX-2, in Atmospheric Chemistry and Physics, 2004,
pp. 839-856.
[14] S.E. Schwartz, Gas-phase and aqueous-phase chemistry of HO2 in liquid water
clouds, in Journal of Geophysical Research-Atmospheres, 1984, pp. 1589-1598.
[15] M. Mozurkewich, P.H. McMurry, A. Gupta, and J.G. Calvert, Mass accommodation
coefficient for HO2 radicals on aqueous particles, in Journal of Geophysical
Research-Atmospheres, 1987, pp. 4163-4170.
[16] J.P.D. Abbatt, A.K.Y. Lee, and J.A. Thornton, Quantifying trace gas uptake to
tropospheric aerosol: recent advances and remaining challenges, in Chemical
Society Reviews, 2012, pp. 6555-6581.

12
[17] F. Taketani, Y. Kanaya, and H. Akimoto, Kinetics of heterogeneous reactions of HO2
radical at ambient concentration levels with (NH4)(2)SO4 and NaCl aerosol
particles, in Journal of Physical Chemistry A, 2008, pp. 2370-2377.
[18] B.C. Faust, C. Anastasio, J.M. Allen, and T. Arakaki, Aqueous-phase photochemical
formation of peroxides in authentic cloud and fog waters, in Science, 1993, pp. 73-75.
[19] H. Herrmann, B. Ervens, H.W. Jacobi, R. Wolke, P. Nowacki, and R. Zellner,
CAPRAM2.3: A chemical aqueous phase radical mechanism for tropospheric
chemistry, in Journal of Atmospheric Chemistry, 2000, pp. 231-284.
[20] B. Ervens, S. Gligorovski, and H. Herrmann, Temperature-dependent rate constants
for hydroxyl radical reactions with organic compounds in aqueous solutions, in
Physical Chemistry Chemical Physics, 2003, pp. 1811-1824.
[21] B.M. Matthew, I. George, and C. Anastasio, Hydroperoxyl radical (HO2 center dot)
oxidizes dibromide radical anion (Br-center dot(2)-) to bromine (Br-2) in aqueous
solution: Implications for the formation of Br-2 in the marine boundary layer, in
Geophysical Research Letters, 2003, pp. 5.
[22] Y. Ren, A.J. Ding, T. Wang, X.H. Shen, J. Guo, J.M. Zhang, Y. Wang, P.J. Xu, X.F.
Wang, J. Gao, and J.L. Collett, Measurement of gas-phase total peroxides at the
summit of Mount Tai in China, in Atmospheric Environment, 2009, pp. 1702-1711.
[23] D.W. Gunz, and M.R. Hoffmann, Atmospheric chemistry of peroxides - a review, in
Atmospheric Environment Part a-General Topics, 1990, pp. 1601-1633.
[24] C. Arellanes, S.E. Paulson, P.M. Fine, and C. Sioutas, Exceeding of Henry's law by
hydrogen peroxide associated with urban aerosols, in Environmental Science &
Technology, 2006, pp. 4859-4866.
[25] W. Hua, Z.M. Chen, C.Y. Jie, Y. Kondo, A. Hofzumahaus, N. Takegawa, C.C.
Chang, K.D. Lu, Y. Miyazaki, K. Kita, H.L. Wang, Y.H. Zhang, and M. Hu,
Atmospheric hydrogen peroxide and organic hydroperoxides during PRIDE-PRD'06,
China: their concentration, formation mechanism and contribution to secondary
aerosols, in Atmospheric Chemistry and Physics, 2008, pp. 6755-6773.
[26] A.S. Hasson, A.W. Ho, K.T. Kuwata, and S.E. Paulson, Production of stabilized
Criegee intermediates and peroxides in the gas phase ozonolysis of alkenes 2.
Asymmetric and biogenic alkenes, in Journal of Geophysical Research-Atmospheres,
2001, pp. 34143-34153.
[27] P. Mertes, L. Pfaffenberger, J. Dommen, M. Kalberer, and U. Baltensperger,
Development of a sensitive long path absorption photometer to quantify peroxides in
aerosol particles (Peroxide-LOPAP), in Atmospheric Measurement Techniques,
2012, pp. 2339-2348.
[28] A.S. Hasson, and S.E. Paulson, An investigation of the relationship between gas-
phase and aerosol-borne hydroperoxides in urban air, in Journal of Aerosol Science,
2003, pp. 459-468.
[29] S.K. Friedlander, and E.K. Yeh, The submicron atmospheric aerosol as a carrier of
reactive chemical species: Case of peroxides, in Applied Occupational and
Environmental Hygiene, 1998, pp. 416 - 420.
[30] A. Mutzel, M. Rodigast, Y. Iinuma, O. Boege, and H. Herrmann, An improved
method for the quantification of SOA bound peroxides, in Atmospheric Environment,
2013, pp. 365-369.

13
[31] Y. Wang, C. Arellanes, and S.E. Paulson, Hydrogen Peroxide Associated with
Ambient Fine-Mode, Diesel, and Biodiesel Aerosol Particles in Southern California,
in Aerosol Science and Technology, 2012, pp. 394-402.
[32] M.H. Lee, B.G. Heikes, and D.W. O'Sullivan, Hydrogen peroxide and organic
hydroperoxide in the troposphere: A review, in Atmospheric Environment, 2000, pp.
3475-3494.
[33] H. Liang, Z.M. Chen, D. Huang, Y. Zhao, and Z.Y. Li, Impacts of aerosols on the
chemistry of atmospheric trace gases: a case study of peroxides and HO2 radicals, in
Atmospheric Chemistry and Physics, 2013, pp. 11259-11276.
[34] X. Chen, and P.K. Hopke, Secondary organic aerosol from alpha-pinene ozonolysis
in dynamic chamber system, in Indoor Air, 2009, pp. 335-345.
[35] F. Tao, B. Gonzalez-Flecha, and L. Kobzik, Reactive oxygen species in pulmonary
inflammation by ambient particulates, in Free Radical Biology and Medicine, 2003,
pp. 327-340.
[36] A.S. Keston, and R. Brandt, Fluorometric analysis of ultramicro quantities of
hydrogen peroxide, in Analytical Biochemistry, 1965, pp. 1-&.
[37] M.J. Black, and R.B. Brandt, Spectrofluorometric anaylsis of hydrogen-peroxide, in
Analytical Biochemistry, 1974, pp. 246-254.
[38] G.I. Berglund, G.H. Carlsson, A.T. Smith, H. Szoke, A. Henriksen, and J. Hajdu, The
catalytic pathway of horseradish peroxidase at high resolution, in Nature, 2002, pp.
463-468.
[39] D. Aljawhary, Personal Communication, 2014.
[40] L. Deguillaume, M. Leriche, K. Desboeufs, G. Mailhot, C. George, and N.
Chaumerliac, Transition metals in atmospheric liquid phases: Sources, reactivity, and
sensitive parameters, in Chemical Reviews, 2005, pp. 3388-3431.
[41] K.S. Docherty, W. Wu, Y.B. Lim, and P.J. Ziemann, Contributions of organic
peroxides to secondary aerosol formed from reactions of monoterpenes with O-3, in
Environmental Science & Technology, 2005, pp. 4049-4059.
14
Chapter 2
Aqueous HOX Chemistry with Copper-Iron Redox Coupling
2.1 Introduction
It is common for atmospheric aerosol particles and cloud droplets to be enriched with
transition metals through both anthropogenic and natural processes.[1-4] Iron is the most
abundant transition metal within the Earth, and consequently many crustal aerosols and dust
particles contain iron, as well as manganese and copper.[4-6] The metal ions in these
particles tend to be highly soluble at the acidic pH levels that are commonly found in cloud
water and aqueous aerosols, and thus many transition metals will be found in the aqueous
phase.[2, 7] The aerosol concentrations of transition metals are heavily dependent on the
source and aqueous environment of the particles, and as a result widespread values have been
reported. Literature values of total transition metal concentration are 0.02-670 µM, 0.0006-
23 µM, and 0.00055-80 µM for iron, copper, and manganese respectively.[2] There is some
discrepancy with these concentration values when applied to cloud chemistry however, as the
speciation of the metals is not known.[4] Reported concentrations of dissolved iron, copper
and manganese within cloud and fog droplets range from 0.02-134 µM, 0.0007-7 µM, and
0.0009-4 μM respectively.[2, 8, 9] It is believed that much of the iron(II) is found in the free
Fe2+
form; on the other hand, it is expected that almost all of the dissolved iron(III) will be
complexed with organic compounds, SO42-
, and OH-.[10] It is expected that much of the
copper present in the cloud water will be found in organic complexes, regardless of its
oxidation state.[4] The reactivity of copper complexes with HOX radicals and other
atmospheric species is significantly lower than that of the free copper ions.[10, 11]
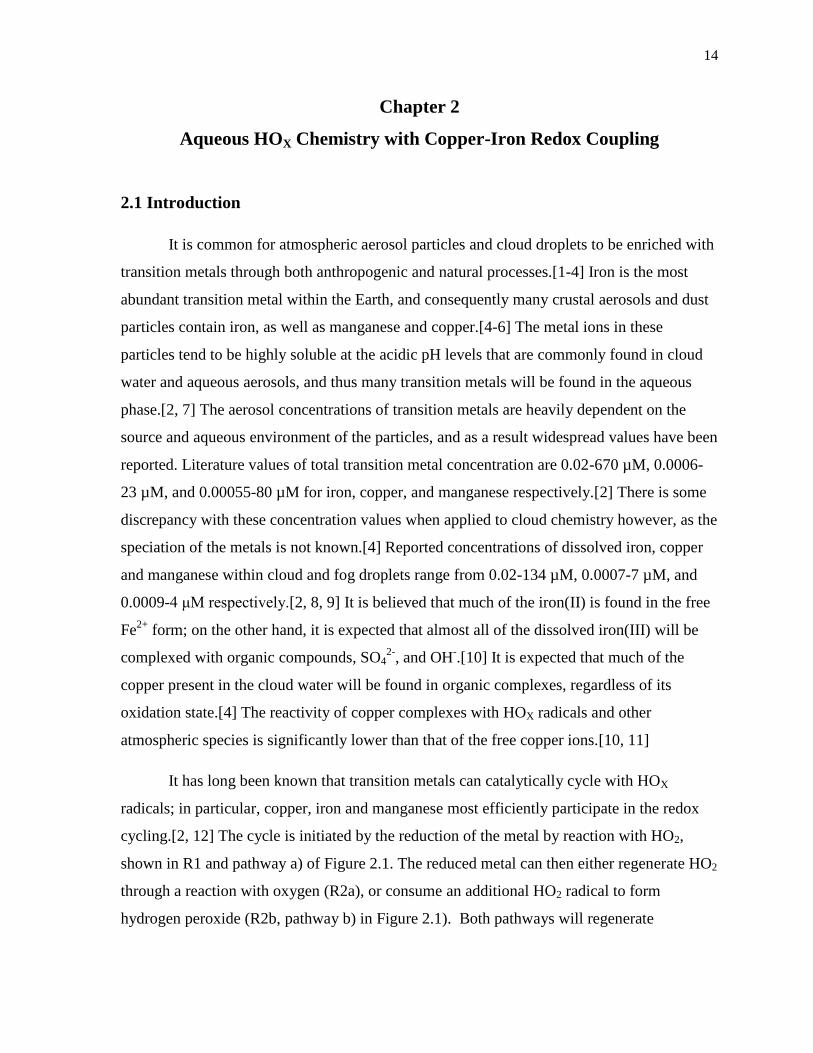
It has long been known that transition metals can catalytically cycle with HOX
radicals; in particular, copper, iron and manganese most efficiently participate in the redox
cycling.[2, 12] The cycle is initiated by the reduction of the metal by reaction with HO2,
shown in R1 and pathway a) of Figure 2.1. The reduced metal can then either regenerate HO2
through a reaction with oxygen (R2a), or consume an additional HO2 radical to form
hydrogen peroxide (R2b, pathway b) in Figure 2.1). Both pathways will regenerate

15
Figure 2.1 – Coupling of copper and iron redox cycles with fates of HOX radicals (adapted
from Mao et al. [12])
the oxidized metal, allowing the cycle to continue indefinitely. Although the reaction rate
constants of the copper cycle are much larger than the other transition metals, the iron cycle
may be just as significant due to atmospheric concentrations of iron typically being an order
of magnitude greater than copper.[12] At commonly reported atmospheric concentrations of
transition metals, it is expected that the catalytic transition metal-catalyzed sink of HOX will
be more significant than the self-reaction of HO2 to form H2O2.[4]
Mn+ HO Mn-1+ O + H
+
Mn-1+ O H+
Mn+ HO
Mn-1+ HO H+
Mn+ H O
It is possible that both copper and iron will be present within an aqueous aerosol
simultaneously, with iron being the more abundant species. A recent modeling paper
published by Mao et al. proposed the coupling of copper and iron redox cycles within
R1
R2a
R2b
a)
b)
c)
d)
e)
f)

16
atmospheric aerosols.[12] Under these conditions, it is suggested that iron(III) will be
reduced to iron(II) through reaction with copper(I) (R3, pathway c) in Figure 2.1), in place of
a reaction with HO2 (R1).
Cu(I) + Fe(III) Cu(II) + Fe(II)
The fate of the iron(II) can have significant implications on the chemistry of aqueous HOX,
ultimately affecting the oxidative capacity of the atmosphere. Products such as hydrogen
peroxide are considered to be reversible sinks of HOX, as photolysis or reaction of peroxide
will regenerate OH radicals. Alternatively, the production of water is a permanent sink of
HOX, as it will be unable to regenerate the radicals.[12] A reaction of iron(II) with HO2 (R4a,
pathway d in Figure 2.1) will result in an overall null cycle of HOX through production of
H2O2. If the iron(II) reacts with H2O2 (R4b, pathway e in Figure 2.1), the production of OH
will regenerate some of the consumed HOX. The net result of this pathway, however, is a net
HOX sink through the formation of water. The reaction of iron(II) with OH (R4c, pathway f
in Figure 2.1) will be a net sink of HOX as only water will be produced.
Fe(II) + HO2: HO + HO Cu/Fe H O + O
Fe(II) + H2O2: HO + H O Cu/Fe OH + O + H O
Fe(II) + OH: HO + OH Cu/Fe O + H O
The purpose of this project is to investigate the proposed coupling of copper and iron
in an aqueous environment in a laboratory setting in order to evaluate the likelihood of this
chemistry proceeding in the environment. Acetaldehyde was used as a photolytic source of
aqueous-phase HOX radicals in all experiments. Upon photolysis, acetaldehyde will
dissociate into either HCO or H radicals, which will react with oxygen to produce HO2 (R5-
R6).[13] The effects that the presence of copper and iron will have on the cycling of HOX
radicals was evaluated by measuring the concentration of hydrogen peroxide in samples
R4b
R4c
R3
R4a
17
while varying the concentrations of the transition metals. In samples that contain only the
transition metal with the HOX radicals, it is expected that the same amount of peroxide will
be measured as in a system that contains only HOX radicals. In samples that contain both
transition metals with the HOX radicals, it is anticipated that a decrease in peroxide will be
observed if the coupling reaction is proceeding. The coupling will result in the loss of HOX
radicals through the production of water, thus limiting the amount of peroxide that will form.
CH3CHO + hν CH3 + HCO
HCO + O2 HO2 + CO
CH3CHO + hν CH3CO + H
H + O2 HO2
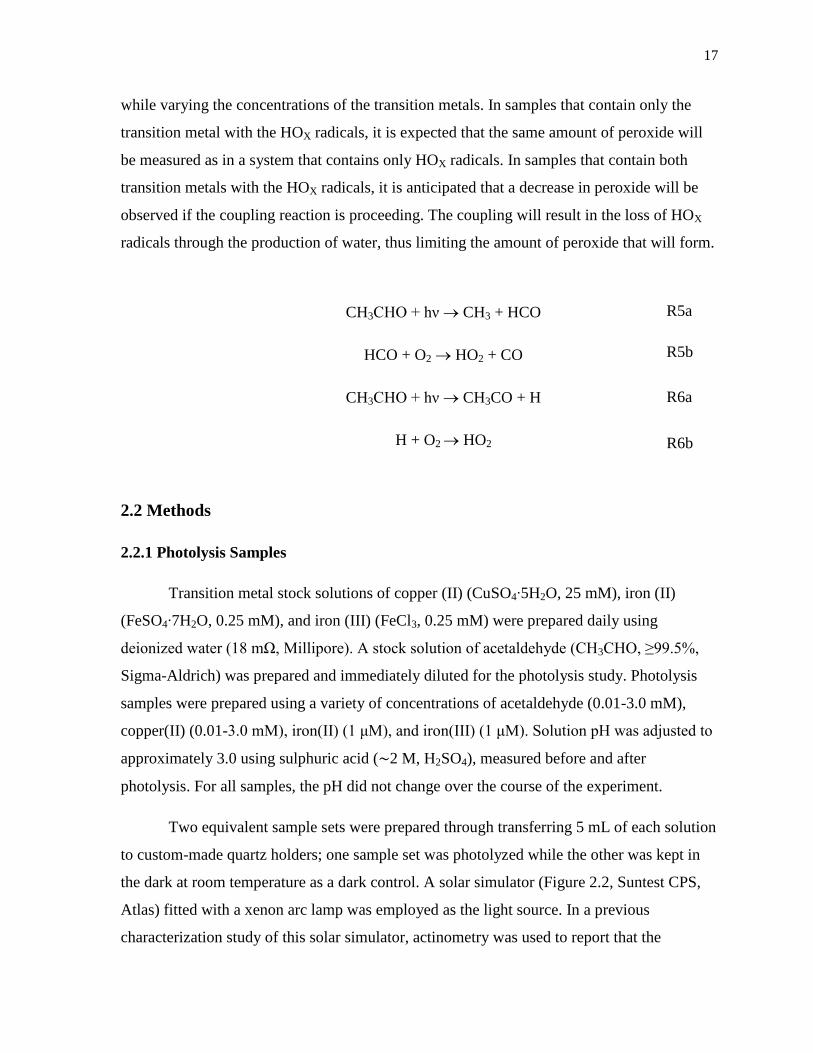
2.2 Methods
2.2.1 Photolysis Samples
Transition metal stock solutions of copper (II) (CuSO4∙5H2O, 25 mM), iron (II)
(FeSO4∙7H2O, 0.25 mM), and iron (III) (FeCl3, 0.25 mM) were prepared daily using
deionized water (18 mΩ, Millipore). A stock solution of acetaldehyde (CH3CHO, ≥99.5%,
Sigma-Aldrich) was prepared and immediately diluted for the photolysis study. Photolysis
samples were prepared using a variety of concentrations of acetaldehyde (0.01-3.0 mM),
copper(II) (0.01-3.0 mM), iron(II) (1 μM), and iron(III) (1 μM). Solution pH was adjusted to
approximately 3.0 using sulphuric acid (∼2 M, H2SO4), measured before and after
photolysis. For all samples, the pH did not change over the course of the experiment.
Two equivalent sample sets were prepared through transferring 5 mL of each solution
to custom-made quartz holders; one sample set was photolyzed while the other was kept in
the dark at room temperature as a dark control. A solar simulator (Figure 2.2, Suntest CPS,
Atlas) fitted with a xenon arc lamp was employed as the light source. In a previous
characterization study of this solar simulator, actinometry was used to report that the
R5b
R6a
R6b
R5a

18
intensity of the system was 8.5 einstein/min.[14] Inside the simulator, samples were placed
on a cooled plate held at 4 °C and covered with a quartz case. A cooling stream of air was
flowed through the simulator while the lamp was in operation. During a typical photolysis
experiment, aqueous sample temperatures did not exceed 33 °C. Unless otherwise stated,
samples were photolyzed for 1 hour, followed by immediate analysis of hydrogen peroxide
concentration.
Figure 2.2 – a) Experimental setup of Suntest CPS Solar Simulator fitted with xenon arc
lamp, with respective b) spectrum (not calibrated).
40x1015
30
20
10
0
Flu
x (
pho
tons
s-1 c
m-2
)
800700600500400300
Wavelength (nm)
a)
b)
19
2.2.2 Horseradish Peroxidase Assay
A stock solution of ’,7’-dichlorofluorescein diacetate (1 mM DCFHDA,
C24H14Cl2O7, Sigma-Aldrich) was prepared in methanol and stored at -20°C. The DCFHDA
was converted to the hydrolyzed ’,7’-dichlorofluorescein (DCFH) form by adding 1.0 mL
DCFHDA to 4.0 mL sodium hydroxide (0.01 M, NaOH) and allowing the hydrolysis to
proceed for 30 minutes at room temperature. The fluorescing solution, referred to as HRP-
DCF, was prepared by mixing 4.0 mL of DCFH with 7.0 mg of peroxidase from horseradish
(HRP, Type I, Sigma-Aldrich), brought to a final volume of 100 mL with pH 7.2 phosphate
buffer (7.35 mM KH2PO4, 17.6 mM Na2HPO4). The HRP-DCF solution was kept in amber
bottles on ice until needed.
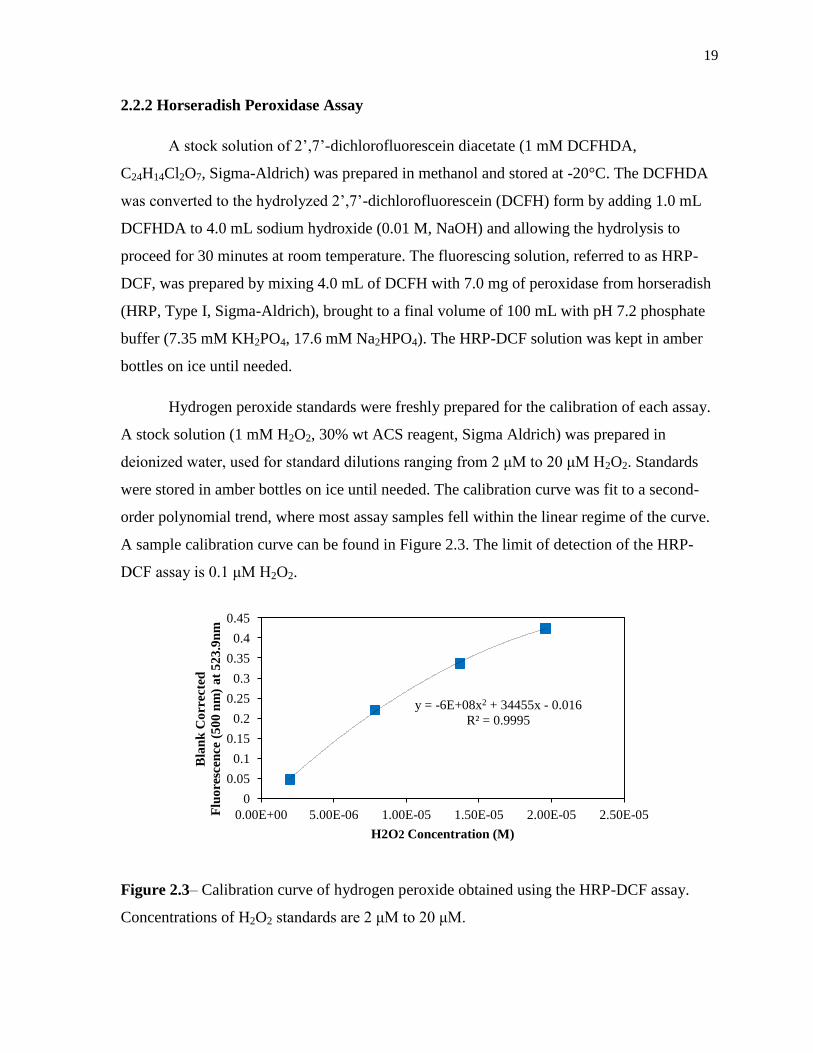
Hydrogen peroxide standards were freshly prepared for the calibration of each assay.
A stock solution (1 mM H2O2, 30% wt ACS reagent, Sigma Aldrich) was prepared in
deionized water, used for standard dilutions ranging from μM to 0 μM H2O2. Standards
were stored in amber bottles on ice until needed. The calibration curve was fit to a second-
order polynomial trend, where most assay samples fell within the linear regime of the curve.
A sample calibration curve can be found in Figure 2.3. The limit of detection of the HRP-
DCF assay is 0.1 μM H2O2.
Figure 2.3– Calibration curve of hydrogen peroxide obtained using the HRP-DCF assay.
Concentrations of H2O2 standards are μM to 0 μM.
y = -6E+08x2 + 34455x - 0.016
R² = 0.9995
0
0.05
0.1
0.15
0.2
0.25
0.3
0.35
0.4
0.45
0.00E+00 5.00E-06 1.00E-05 1.50E-05 2.00E-05 2.50E-05
Bla
nk
Co
rrec
ted
Flu
ore
scen
ce (
50
0 n
m)
at
52
3.9
nm
H2O2 Concentration (M)

20
Assay samples were prepared by adding 50 μL of the sample with 2.25 mL HRP-
DCF in Teflon-capped amber vials. Samples were briefly mixed before reacting at room
temperature in the dark for 30 minutes. The reaction was quenched by putting vials on ice for
30 seconds, before measuring the sample fluorescence. A spectrometer/fluorometer
(SpectroVis Plus, Vernier) was operated in fluorescence mode with a 500 nm excitation light
source, measuring sample spectra at 523.9 nm. Data were collected using Logger Pro
software (Version 3.8.2, Vernier).
2.2.3 Kinetic Modelling
A kinetic model of the copper/iron chemistry was created using the React modelling
program (version 1.2, Alchemy Software). A summary of reactions used in the model can be
found in Table 2.1. The model was set to run for 60 minutes using 1 second time steps. The
photolysis of acetaldehyde was simplified in the model to a reaction converting the aldehyde
directly to HO2 (reaction 2), with the rate constant selected to match the model to
experimental results. The model’s initial conditions were as follows: 1.0 mM H+ to match
experimental pH of 3, 0.235 mM O2 to match approximated dissolved oxygen at photolysis
sample temperature of 33 °C, and 55 M H2O. Initial acetaldehyde, copper(II), and iron(II)
concentrations were varied in order to study different experimental systems. The rate
constants are expressed in units of M-1
s-1
, where 8.8(-7) represents 8.8 x10⁻⁷
M-1
s-1
.
As will be discussed further in the following section, it was found that 1.6 μM H2O2
was generated upon the photolysis of an aqueous solution of 1 mM acetaldehyde using our
experimental set up. By running the model to represent a system containing 1 mM
acetaldehyde and no transition metals, the rate constant for the photolysis of acetaldehyde
(reaction 2) was adjusted so that the output produced 1.6 μM H2O2 after a one hour
simulation. The rate constant representing the conversion of acetaldehyde to HO2 was found
to be 8.8 x10⁻⁷
M-1
s-1
. This suggests that the photolytic lifetime of acetaldehyde is
approximately 13 days under the experimental conditions used in this study.

21
Table 2.1 – Reactions and rate constants included in kinetic model
Reaction Rate
Constant
(M-1
s-1
)
Reference
1 H2O H+ + OH
- 1.0(-14)
a
2 Aldehyde HO2 8.8(-7)b
Experimental
3 HO2 O2- + H
+ 2.1(-5)
a Bielski, 1978 [15]
4 HO2 + HO2 H2O2 + O2 8.6(5) Bielski, 1978 [15]
5 OH + HO2 H2O + O2 7.0(9) Sehested et al., 1968 [16]
6 OH + O2-
OH
- + O2
1.0(10) Sehested et al., 1968 [16]
7 OH + H2O2 H2O + HO2 2.7(7) Christensen et al., 1982 [17]
8 HO2 + O2- H2O2 + O2 + OH
- 1.0(8) Bielski, 1978 [15]
9 HO2 + Cu2+ Cu
+ + O2 + H
+ 1.0(8) Rabani et al., 1973 [18]
10 O2- + Cu
2+ Cu
+ + O2 8.0(9) Rabani et al., 1973 [18]
11 OH + Cu+
Cu
2+ + OH
- 3.0(9) Goldstein et al., 1992 [19]
12 O2 + Cu+ Cu
2+ + O2
- 4.6(5) Bjergbakke et al., 1976 [20]
13 H2O2 + Cu+ Cu
2+ + OH + OH
- 7.0(3) Berdnikov, 1973 [21]
14 HO2 + Cu+ + H
+ Cu
2+ + H2O2 3.5(9) Berdnikov, 1973 [21]
15 O2- + Cu
+ + 2H
+ Cu
2+ + H2O2 9.4(9) vonPiechowski et al., 1993 [11]
16 H2O2 + Fe2+ Fe
3+ + OH + OH
- 70 Christensen et al., 1993 [17]
17 H2O2 + Fe3+
Fe2+
+ HO2 + H+
2.0(-3) Walling and Goosen, 1973 [22]
18 O2- + Fe
2+ + 2H
+ Fe
3+ + H2O2 1.0(7) Rush and Bielski, 1985 [23]
19 O2- + Fe
3+
Fe
2+ + O2 1.5(8) Rush and Bielski, 1985 [23]
20 HO2 + Fe2+
+ H+ Fe
3+ + H2O2 1.2(6) Jayson et al., 1973 [24]
21 OH + Fe2+ Fe(OH)
2+ 4.6(8) Christensen&Sehested,1980[25]
R3 Fe3+
+ Cu+ Cu
2+ + Fe
2+ 1.3(7) Bjergbakke et al., 1976 [20]
a Denotes equilibrium constant
b Denotes first order rate constant in units of s
-1
2.3 Results and Discussion
2.3.1 Acetaldehyde photolysis
The photolysis of acetaldehyde samples produced detectable levels of hydrogen
peroxide, suggesting that it is a suitable source of aqueous-phase HOX radicals. Samples
containing less than 1 mM acetaldehyde produce peroxide levels near the method’s limit of
detection (0.1 μM) based on a 1-hour photolysis time, and were therefore not used in this
study. A summary of the concentration of hydrogen peroxide produced from a 1-hour
photolysis of various acetaldehyde concentrations can be found in Table 2.2.

22
Table 2.2 – Hydrogen peroxide production from photolyzed aldehyde samples
Concentration of
Acetaldehyde
Amount of H2O2
Produced (μM)
Standard
Deviation (μM)
0.10 mM 0.06 0.02
1.0 mM 1.6 0.52
3.0 mM 6.1 1.4
The photolytic production of hydrogen peroxide from acetaldehyde was linear as a
function of photolysis time, as seen in Figure 2.4. Based on these results, an experimental
photolysis time of 1 hour was selected for the remainder of the study; this is the shortest
experimental time that produces a signal that lies confidently above the method’s detection
limit and within the linear portion of the calibration curve. The growth in error bars as time
progressed was a result of placement of samples within the solar simulator. Samples that
were situated closest to the inlet of the cooling air contained slightly lower levels of peroxide
than those further away, however this effect only becomes significant at longer photolysis
times.
Figure 2.4 – Peroxide production from 3 hour photolysis of 3 mM acetaldehyde in solar
simulator
y = 0.0738x + 1.3677
R² = 0.9585
0
2
4
6
8
10
12
14
0 20 40 60 80 100 120 140
H2O
2 P
rod
uce
d (
μM
)
Photolysis Time (min)

23
2.3.2 Aldehyde and Copper Photolysis
The hydrogen peroxide concentrations of photolysis of samples containing both 1
mM acetaldehyde and 1mM copper were not found to be significantly different from samples
containing only 1 mM acetaldehyde, as seen in Figure 2.5. In other experiments, the
dependence of peroxide production on copper concentration was tested by preparing samples
containing 3 mM acetaldehyde with CuSO4 concentrations ranging from 0.1-3 mM. It was
found that the peroxide production of these samples was also the same as samples with only
acetaldehyde, and thus is independent of the copper concentration. For the remaining
experiments of this study, 1 mM of CuSO4 was used in all copper-containing samples.
Figure 2.5 – Hydrogen peroxide concentrations produced from 1-hour photolysis of samples
containing 1 mM acetaldehyde, 1 mM CuSO4, and/or 1 μM FeSO4
Although copper acts as a catalyst in the cycling of HOX and the production of
hydrogen peroxide, it does not produce significantly different amounts of peroxide than a
system with only HOX. It is expected that at very short times in the sample’s photolysis, the
reaction of copper(I) and HO2 is the dominant HOX reaction (Table 2.1, reaction 14),
resulting in the rapid production of H2O2 . However, as the amount of H2O2 begins to build up
0
2
4
6
8
10
12
14
16
18
H2O
2 C
on
cen
tra
tio
n (
μM
)
Aldehyde
Aldehyde+Copper
Aldehyde+Iron
Aldehyde+Copper+Iron

24
as the photolysis continues, the reaction of copper(I) with H2O2 (reaction 13) begins to
become more significant. This results in a loss of H2O2, thus slowing the overall production
rate of H2O2. This result is confirmed in the modeling of the system, where at very short
reaction times (on the order of milliseconds) samples containing copper produce
approximately 1.2 times more peroxide than those containing only acetaldehyde. Within the
full hour of photolysis, however, the model predicts that samples containing 0.1-3 mM
copper will produce 10-40 % less peroxide than samples containing only acetaldehyde, as
shown in Figure 2.6. This effect was not observed experimentally, suggesting that the model
over-predicts the loss of peroxide. Model predictions show that copper is in excess with
respect to HOX radicals by several orders of magnitude. Thus, over the range of
concentrations used experimentally, the copper always remains in excess, accounting for no
observed dependency of peroxide production on copper concentration.
Figure 2.6 – Modelled production of hydrogen peroxide in a system containing 1 mM
aldehyde with varying copper concentrations at 60 minutes of photolysis
2.3.3 Aldehyde and Iron Photolysis
The photolysis of samples containing aldehyde with 1 mM FeSO4 produced no
detectable levels of hydrogen peroxide. Under these conditions, the lifetime of hydrogen

25
peroxide in the presence of Fe(II) is 14 seconds (reaction 16). In order for the peroxide to
persist through the timescale of the experiment, concentrations of FeSO4 cannot exceed 1
μM. Under these conditions, the lifetime of H2O2 will be 240 minutes.
The photolysis of samples containing both acetaldehyde and 1 μM iron produced
hydrogen peroxide concentrations that were approximately one order of magnitude greater
than those containing no iron, seen in Figure 2.5. Unlike the copper system, the photolytic
generation of H2O2 does depend on the sample’s concentration of FeSO4. As the
concentration of Fe(II) increased from 0.01 μM to 1 μM, the concentration of peroxide
linearly increased, seen in Figure 2.7.
Figure 2.7 - Concentration of hydrogen peroxide produced from solutions containing 1 mM
acetaldehyde with iron(II) varied from 0.01 to 1.0 µM (note: no error bars are shown due to
single measurement for each experiment)
In order to better understand the chemistry of the iron system, samples were prepared
in which iron was added to the solutions both before and after photolysis. It was found that
samples photolyzed in the presence of iron produced 13 μM peroxide; this is an order of
magnitude more hydrogen peroxide produced than samples in which iron was added after
photolysis, which only produced 1.5 μM. The high levels of peroxide observed in samples
y = 7.9154x + 3.6917
R² = 0.9978
0
2
4
6
8
10
12
14
0.0 0.2 0.4 0.6 0.8 1.0 1.2
H2O
2 C
on
cen
tra
tio
n (
μM
)
Fe(II) Concentration (μM)

26
photolyzed in the presence of iron suggests that the formation of a complex that efficiently
releases HOX is occurring, as opposed to the iron interfering with the HRP-DCF solution in
the fluorescence analysis.
Based on iron’s high affinity to form complexes with organic ligands, it is likely that
there is a high degree of complexation within the photolysis samples. As the acetaldehyde
photodissociates, there will be a mixture of organic radicals and stable molecules available to
complex. Upon photolysis of the complex, an organic radical will be formed from the ligand.
This radical can go on to react with O2, ultimately forming HO2, as shown in R7-R9.[26]
This additional source of HO2 within the system may account for the increase in peroxide in
iron-containing samples. A more thorough discussion of iron-organic complexes can be
found in a later section of this chapter.
Fe(III)-L Fe(II) + L∙
L∙ + O2 O2-∙ + L
+
O2-∙ + H
+ HO2∙
The increase in peroxide may also be due to the production of OH radicals from an
iron-hydroxy complex. In an aqueous solution, iron(III) ions will be in equilibrium with their
complexed form, [Fe(III)(OH)(H2O)5]2+
. At the sample pH of 3 that is used in this study, it
has been shown that the majority of iron in the solution will be found in this complexed
form.[27, 28] Upon photolysis, OH radicals will be produced as shown below in R10.[27]
These radicals have the potential to further react with acetaldehyde to first generate a
carboxylic acid and HO2 radical, as shown in a later section in Figure 2.10, product a). The
extra production of HO2 would then lead to an increase in the amount of hydrogen peroxide
formed.
[Fe(III)(OH)(H2O)5]2+
+ H2O + hν [Fe(II)(H2O)6]2+
+ OH∙
Experiments in which aqueous solutions of iron at pH 3 were photolyzed with
benzoic acid, a common OH radical trap, have shown the production of OH radicals under
our experimental conditions.[29] As OH radicals are generated, they will rapidly oxidize
benzoic acid to form hydroxybenzoic acid. In this experiment, benzoic acid (≥99.5%, Sigma-
R7
R8
R9
R10

27
Aldrich) was added to a final concentration of 1 mM in solution with 1 µM iron(III).
Solutions were photolyzed for 1 hour using the solar simulator. The production of OH
radicals was monitored through measuring the formation of hydroxybenzoic acid using a
direct analysis in real time mass spectrometer (DART-MS). The observed formation of
hydroxybenzoic acid in the iron(III) samples confirms that there is production of OH radical.
Thus, there is potential that the OH radicals will react with excess acetaldehyde in the iron-
only samples, resulting in the production of hydrogen peroxide.
2.3.4 Aldehyde, Copper, and Iron
In samples containing acetaldehyde in the presence of both copper and iron, it is
found that the photolytic production of hydrogen peroxide is significantly less than samples
containing acetaldehyde with only iron. However, there is an increase of approximately two
times the concentration of H2O2 found in samples with no transition metals, seen in Figure
2.5. In these experiments with both metals, acetaldehyde and iron concentrations were held at
1 mM and 1 µM respectively, while copper concentrations ranged from 0.1 µM to 1.0 mM.
This allowed the study of the effect of changing the copper to iron ratio, Cu/Fe. As the
amount of copper increased within the system, it was found that the amount of hydrogen
peroxide produced decreased, as seen in Table 2.3.
Table 2.3 – Peroxide production in a system containing 1 mM acetaldehyde with varying
copper to iron ratios
Ratio of Cu/Fe Amount of H2O2
Produced (μM) Standard Deviation (μM)
0 14.8 2.0
0.1 13.1 2.3
1 13.4 2.6
1000 4.48 0.79
It is believed that the observed decrease in peroxide produced from samples
containing aldehyde and both transition metals compared to samples containing only iron is
due to a hindrance of the formation of the iron complexes. Both the organic and hydroxy
complexes contain iron in the +3 oxidation state, however the samples are prepared using

28
iron in the +2 oxidation state. This decrease in iron(III) could be due to either a slowed
production through the reaction of iron(II) and HO2, or an increase in iron(III) loss through
the coupling reaction of iron(III) and copper(I).
In the system containing only iron, iron(II) will react with HO2 (reaction 20),
generating iron(III). The iron(III) can then go on to form the complexes, photolytically
generating peroxide. In the presence of copper and iron however, the reaction of HO2 with
copper (reaction 9) is favoured over that with iron. Thus, as the amount of copper in the
system increases, the reaction of iron(II) and HO2 will become less dominant, slowing the
production of iron(III) and ultimately reducing the degree of complexation. This effect is
seen in the model simulations, where the reaction rate between iron(II) and HO2 decreases as
the amount of copper increases, as seen in Table 2.4.
Table 2.4 – Modelled reaction rates of iron(II) and HO2 as copper concentration increases
Copper/Iron ratio Rate of Reaction 20 (M/s)
0 Cu/Fe 3.5 x10⁻¹⁰
0.1 Cu/Fe 2.7 x10⁻¹⁰
1 Cu/Fe 1.5 x10⁻¹⁰
1000 Cu/Fe 5.3 x10⁻¹²
To evaluate the effect of the coupling reaction on the concentration of iron(III), the
model simulation was run both with and without reaction R3. As seen in Figure 2.8, the
concentration of iron(III) decreases as a function of increasing copper concentration when
the coupling reaction is included. However, the modelled Fe(III) concentrations from the
simulation without the coupling reaction predicts a more similar result to what was observed
experimentally. In this case, the model predicts that a system with only iron will have
approximately the same amount of iron(III) as a system with 0.1 and 1 Cu/Fe. This would
mean that a similar amount of iron-complexes will form in these three systems, producing
approximately the same amount of hydrogen peroxide. Consequently, it is not anticipated
that the coupling reaction of iron(III) with copper(I) is a significant reaction under these
experimental conditions. It is clear, however, that there is some form of coupling occurring
between the copper and iron redox cycles, as the modelled concentrations in the 0.1 and 1

29
Cu/Fe systems without coupling do not follow the same trend as the iron-only system
through the whole simulation.
Figure 2.8 – Modelled Fe(III) concentration in a system containing 1 mM aldehyde with
Cu/Fe ratios of 0 (1 μM Fe(II)), 0.1 (0.1 μM Cu(II) with 1 μM Fe(II)), 1 (1 μM Cu(II) with 1
μM Fe(II)), and 1000 (1 mM Cu(II) with 1 μM Fe(II)). Dashed lines represent simulations in
which the coupling reaction (R3) was removed from model.
Despite the fact that the presence of copper will reduce the extent of complexation of
iron with organic ligands (particularly in the system containing 1 mM copper(II) with 1 μM
iron(II), 1000 Cu/Fe), it is still anticipated that complexes will form in small amounts.
Although the production rate of iron(III) will be significantly slower in a system containing
copper, this reaction will still proceed, allowing some iron(III) to form, albeit to a much
lesser extent than the iron-only system. These complexes are still expected to photolytically
generate H2O2, accounting for the higher levels observed in this system as compared to the
aldehyde-only and copper containing systems.
30
2.3.5 Kinetic model results
The kinetic model was primarily used to determine the fate of each species in each
experimental system. Modelled concentrations of key species for each system studied can be
found in Figures 2.11-2.14 in the Appendix. The most heavily studied systems studied
through the model contained 1 mM acetaldehyde with 1 mM copper(II), and/or 1 μM iron(II)
at a solution pH of 3.
In a system containing 1 mM acetaldehyde and 1mM copper(II), it was found that the
dominant pathway of peroxide production was the reaction of copper(I) with the HO2 radical
(reaction 14), proceeding at a rate of 3.5 x10⁻¹⁰
M/s. The reaction of copper(I) with the
dissociated O2- radical (reaction 15) was the second largest production of hydrogen peroxide,
with a reaction rate of 2.0 x10⁻¹¹
M/s. Finally, the self reaction of HO2 (reaction 4) and O2-
(reaction 8) were the least significant sources of hydrogen peroxide, proceeding at rates of
3.5 x10⁻¹⁷
and 8.4 x10⁻¹⁷
M/s respectively.
In a system containing 1 mM acetaldehyde with 1 μM iron(II), the model predicted
that the dominant pathway of hydrogen peroxide production is through the reaction of
iron(II) with HO2 (reaction 20), with a rate of 3.5 x10⁻¹⁰
M/s. The second pathway of
peroxide formation is from the reaction of iron(II) with O2- (reaction 18), proceeding at a rate
of 6.0 x10⁻¹¹
M/s. Like in the copper-only system, the self reaction of HO2 (reaction 4) and
O2- (reaction 8) were the least significant sources of peroxide, with rates of 2.2 x10
-13 and 5.3
x10-13
M/s respectively. The model did not include any iron complex chemistry, and thus a
significant amount of the peroxide that was observed experimentally is unaccounted for
using this model.
In a system containing 1 mM acetaldehyde with both 1 mM copper(II) and 1 μM
iron(II), it was found that the dominant peroxide production is from the reaction of copper(I)
with HO2 (reaction 14), with a rate of 3.3 x10⁻¹⁰
M/s. The peroxide is then generated by the
reaction of copper(I) with O2- (reaction 15, 1.8 x10
-11 M/s), iron(II) with HO2 (reaction 20,
5.2 x10⁻¹²
M/s) iron(II) with O2- (reaction 18, 9.0 x10
-13 M/s), HO2
with O2
- (reaction 8, 8.0
x10-17
M/s), and the HO2 self reaction (reaction 4, 3.4 x10⁻¹⁷
M/s), given in order of
decreasing significance. In this system, the reaction of copper(I) with HO2 was more
31
significant than the reaction of copper(I) with iron(III) (reaction R3, with a rate of 5.6 x10⁻¹¹
M/s), suggesting that the coupling chemistry under these conditions would not be as
significant as previously predicted.
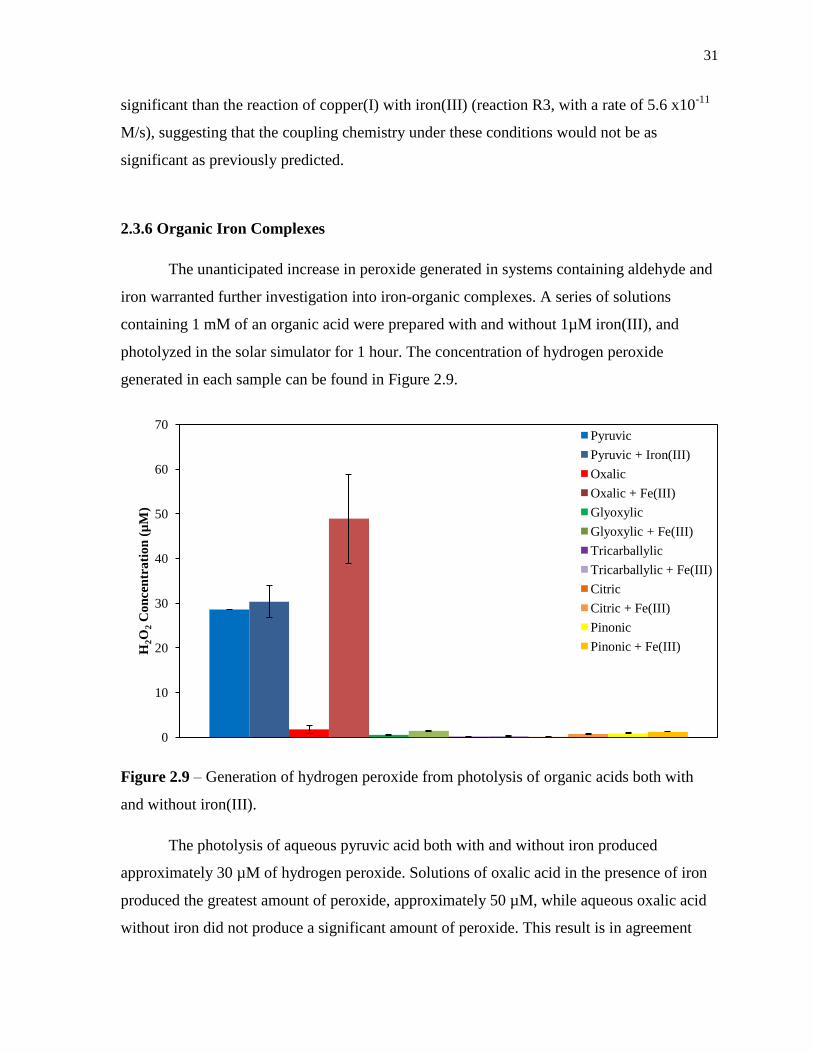
2.3.6 Organic Iron Complexes
The unanticipated increase in peroxide generated in systems containing aldehyde and
iron warranted further investigation into iron-organic complexes. A series of solutions
containing 1 mM of an organic acid were prepared with and without 1µM iron(III), and
photolyzed in the solar simulator for 1 hour. The concentration of hydrogen peroxide
generated in each sample can be found in Figure 2.9.
Figure 2.9 – Generation of hydrogen peroxide from photolysis of organic acids both with
and without iron(III).
The photolysis of aqueous pyruvic acid both with and without iron produced
approximately 30 µM of hydrogen peroxide. Solutions of oxalic acid in the presence of iron
produced the greatest amount of peroxide, approximately 50 µM, while aqueous oxalic acid
without iron did not produce a significant amount of peroxide. This result is in agreement
0
10
20
30
40
50
60
70
H2O
2 C
on
cen
tra
tio
n (
µM
)
Pyruvic
Pyruvic + Iron(III)
Oxalic
Oxalic + Fe(III)
Glyoxylic
Glyoxylic + Fe(III)
Tricarballylic
Tricarballylic + Fe(III)
Citric
Citric + Fe(III)
Pinonic
Pinonic + Fe(III)

32
with previous studies that found oxalate complexes favourably with iron.[30, 31] There was
a significant increase in the amount of peroxide produced from the photolysis of glyoxylic
acid when iron was included, however the amount of peroxide was insignificant when
compared to that from oxalic acid with iron. The other organic acids tested in this study did
not produce significant amounts of peroxide, both with and without iron.
Acetaldehyde can also be oxidized in solution to form organic compounds that are
known to complex with iron, including oxalic acid, glyoxylic acid, and pyruvic acid.[26, 32]
A proposed oxidation mechanism can be found in Figure 2.10, with oxalic and glyoxylic
acids labelled with b and c respectively. Upon the photolysis of acetaldehyde, it is also likely
that several organic fragments are generated in solution. This complex mixture of organics
have the potential to form compounds that will favourably complex with iron(III) in solution.
Figure 2.10 – Proposed mechanism of oxidation of acetaldehyde to form a) acetic acid,
which is further oxidized to b) glyoxylic acid, and ultimately forming c) oxalic acid, which is
shown to complex with iron(III) to generate peroxide.
b) c)
a)

33
2.4 Conclusions and Atmospheric Implications
The redox cycling of HOX radicals in the presence of transition metals was evaluated
by measuring hydrogen peroxide production in photolyzed aqueous solutions. In particular,
the changes in peroxide production in a system containing both copper and iron
simultaneously was used to evaluate if a proposed coupling of the two metal redox cycles
was occurring in solution.
In aqueous solutions of a HOX source with transition metals, the amounts of hydrogen
peroxide generated after one hour in the presence and absence of only copper ions are not
significantly different. This result was anticipated, showing that the observed peroxide
production is a result of HOX radicals participating in the transition metal catalyzed redox
cycle.
In the presence of only iron, an order of magnitude more peroxide is generated than
in its absence, suggesting that the iron ions are complexed in solution. The complexes could
be the result of iron interacting with organics in the solution, such as oxalate, forming an
iron-organic complex, or due to the speciation of iron under acidic aqueous conditions,
forming an iron-hydroxy complex. Both types of complex will efficiently lead to peroxide
production after photolysis.
When copper and iron are present simultaneously in solution, there is a significant
increase in peroxide when compared to a system without transition metals. The amount of
peroxide, however, is less than that in a system containing only iron. It is believed that the
presence of copper will slow the conversion of iron(II) to iron(III), thus reducing the amount
of iron(III) available to form complexes.
The efficacy of the copper-iron coupling suggested by Mao et al. in their recent
modelling paper could not be demonstrated in a simple system containing one organic
species. In an environmental system, it is likely that there will be a complex mixture of many
different, highly concentrated organic species. Thus, it is possible that in the atmosphere the
degree of complexation with iron may be comparable or higher than that observed in this
study. As a result, it would be necessary to conduct similar experiments in more

34
atmospherically relevant samples in order to evaluate if this coupling could be significant in
the atmosphere.

35
2.5 References
[1] K.V. Desboeufs, A. Sofikitis, R. Losno, J.L. Colin, and P. Ausset, Dissolution and
solubility of trace metals from natural and anthropogenic aerosol particulate matter, in
Chemosphere, 2005, pp. 195-203.
[2] L. Deguillaume, M. Leriche, K. Desboeufs, G. Mailhot, C. George, and N. Chaumerliac,
Transition metals in atmospheric liquid phases: Sources, reactivity, and sensitive
parameters, in Chemical Reviews, 2005, pp. 3388-3431.
[3] R.L. Siefert, S.O. Pehkonen, Y. Erel, and M.R. Hoffmann, Iron photochemistry of
aqueous suspensions of ambient aerosol with added organic-acids, in Geochimica Et
Cosmochimica Acta, 1994, pp. 3271-3279.
[4] D.J. Jacob, Heterogeneous chemistry and tropospheric ozone, in Atmospheric
Environment, 2000, pp. 2131-2159.
[5] C. Weller, S. Horn, and H. Herrmann, Photolysis of Fe(III) carboxylato complexes:
Fe(II) quantum yields and reaction mechanisms, in Journal of Photochemistry and
Photobiology a-Chemistry, 2013, pp. 24-36.
[6] B.C. Faust, and J. Hoigne, Photolysis of Fe(III)-hydroxy complexes as sources of OH
radicals in clouds, fog, and rain, in Atmospheric Environment Part a-General Topics,
1990, pp. 79-89.
[7] C.J. Weschler, M.L. Mandich, and T.E. Graedel, Speciation, photosensitivity, and
reactions of transition-metal ions in atmospheric droplets, in Journal of Geophysical
Research-Atmospheres, 1986, pp. 5189-5204.
[8] C. Anastasio, B.C. Faust, and J.M. Allen, Aqueous-phase photochemical formation of
hydrogen-peroxide in authentic cloud waters, in Journal of Geophysical Research-
Atmospheres, 1994, pp. 8231-8248.
[9] D.L. Sedlak, J. Hoigne, M.M. David, R.N. Colvile, E. Seyffer, K. Acker, W. Wiepercht,
J.A. Lind, and S. Fuzzi, The cloudwater chemistry of iron and copper at Great Dun Fell,
UK, in Atmospheric Environment, 1997, pp. 2515-2526.
[10] L. Deguillaume, M. Leriche, A. Monod, and N. Chaumerliac, The role of transition metal
ions on HOx radicals in clouds: a numerical evaluation of its impact on multiphase
chemistry, in Atmospheric Chemistry and Physics, 2004, pp. 95-110.
[11] M. Vonpiechowski, T. Nauser, J. Hoigne, and R.E. Buhler, O2- decay catalyzed by Cu2+
and Cu+ ions in aqueous-solutions - A pulse-radiolysis study for atmospheric chemistry,
in Berichte Der Bunsen-Gesellschaft-Physical Chemistry Chemical Physics, 1993, pp.
762-771.
[12] J. Mao, S. Fan, D.J. Jacob, and K.R. Travis, Radical loss in the atmosphere from Cu-Fe
redox coupling in aerosols, in Atmospheric Chemistry and Physics, 2013, pp. 509-519.
[13] P. Warneck, and G.K. Moortgat, Quantum yields and photodissociation coefficients of
acetaldehyde in the troposphere, in Atmospheric Environment, 2012, pp. 153-163.
[14] D.A. Jackson, and S.A. Mabury, Environmental properties of pentafluorosulfanyl
compounds: Physical properties and photodegradation, in Environmental Toxicology
and Chemistry, 2009, pp. 1866-1873.
[15] B.H.J. Bielski, Reevaluation of the spectral and kinetic properties of HO2 and O2- free
radicals, in Photochemistry and Photobiology, Blackwell Publishing Ltd, 1978, pp. 645-
649.
[16] K. Sehested, O.L. Rasmussen, and H. Fricke, Rate constants of OH with HO2,O2-, and
H2O2+ from hydrogen peroxide formation in pulse-irradiated oxygenated water, in The
Journal of Physical Chemistry, American Chemical Society, 1968, pp. 626-631.

36
[17] H. Christensen, K. Sehested, and H. Corfitzen, Reactions of hydroxyl radicals with
hydrogen peroxide at ambient and elevated temperatures, in The Journal of Physical
Chemistry, American Chemical Society, 1982, pp. 1588-1590.
[18] J. Rabani, D. Klug-Roth, and J. Lilie, Pulse radiolytic investigations of the catalyzed
disproportionation of peroxy radicals. Aqueous cupric ions, in The Journal of Physical
Chemistry, American Chemical Society, 1973, pp. 1169-1175.
[19] S. Goldstein, G. Czapski, H. Cohen, and D. Meyerstein, Deamination of β-alanine
induced by hydroxyl radicals and monovalent copper ions. A pulse radiolysis study, in
Inorganica Chimica Acta, 1992, pp. 87-93.
[20] E. Bjergbakke, K. Sehested, and O.L. Rasmussen, The Reaction Mechanism and Rate
Constants in the Radiolysis of Fe2+ and Cu2+ Solutions, in Radiation Research,
Radiation Research Society, 1976, pp. 433-442.
[21] V. Berdnikov, Catalytic activity of the hydrated copper ion in the decomposition of
hydrogen peroxide, in Russian Journal of Physical Chemistry, 1973, pp. 1060-1162.
[22] C. Walling, and A. Goosen, Mechanism of the ferric ion catalyzed decomposition of
hydrogen peroxide. Effect of organic substrates, in Journal of the American Chemical
Society, American Chemical Society, 1973, pp. 2987-2991.
[23] J.D. Rush, and B.H.J. Bielski, Pulse radiolytic studies of the reaction of
perhydroxyl/superoxide O2- with iron(II)/iron(III) ions. The reactivity of HO2/O2- with
ferric ions and its implication on the occurrence of the Haber-Weiss reaction, in The
Journal of Physical Chemistry, American Chemical Society, 1985, pp. 5062-5066.
[24] G.G. Jayson, B.J. Parsons, and A.J. Swallow, Oxidation of ferrous ions by perhydroxyl
radicals, in Journal of the Chemical Society, Faraday Transactions 1: Physical
Chemistry in Condensed Phases, The Royal Society of Chemistry, 1973, pp. 236-242.
[25] H. Christensen, and K. Sehested, Pulse radiolysis at high temperatures and high
pressures, in Radiation Physics and Chemistry (1977), 1980, pp. 183-186.
[26] Y.G. Zuo, and J. Hoigne, Evidence for photochemical formation of H2O2 and oxidation
of SO2 in authentic fog water, in Science, 1993, pp. 71-73.
[27] G.S. Zhuang, Z. Yi, R.A. Duce, and P.R. Brown, Link between iron and sulfur cycles
suggested by detection of Fe(II) in remote marine aerosols, in Nature, 1992, pp. 537-539.
[28] W. Feng, and D. Nansheng, Photochemistry of hydrolytic iron (III) species and
photoinduced degradation of organic compounds. A minireview, in Chemosphere, 2000,
pp. 1137-1147.
[29] X.L. Zhou, and K. Mopper, Determination of photochemically produced hydroxyl
radicals in seawater and fresh-water, in Marine Chemistry, 1990, pp. 71-88.
[30] Y.G. Zuo, and J. Hoigne, Formation of hydrogen-peroxide and depletion of oxalic-acid
in atmospheric water by photolysis of iron(III) oxalato complexes, in Environmental
Science & Technology, 1992, pp. 1014-1022.
[31] C. Weller, S. Horn, and H. Herrmann, Effects of Fe(III)-concentration, speciation,
excitation-wavelength and light intensity on the quantum yield of iron(III)-oxalato
complex photolysis, in Journal of Photochemistry and Photobiology a-Chemistry, 2013,
pp. 41-49.
[32] Y.G. Zuo, and J. Hoigne, Photochemical decomposition of oxalic, glyoxalic and pyruvic-
acid catalyzed by iron in atmospheric waters, in Atmospheric Environment, 1994, pp.
1231-1239.

37
2.6 Appendix
Figure 2.11 – Kinetic Model output of key species from system containing 1 mM
acetaldehyde
Figure 2.12 – Kinetic model output of key a) HOX and b) transition metal species from
system containing 1 mM acetaldehyde with 1 mM copper(II)
a)
b)
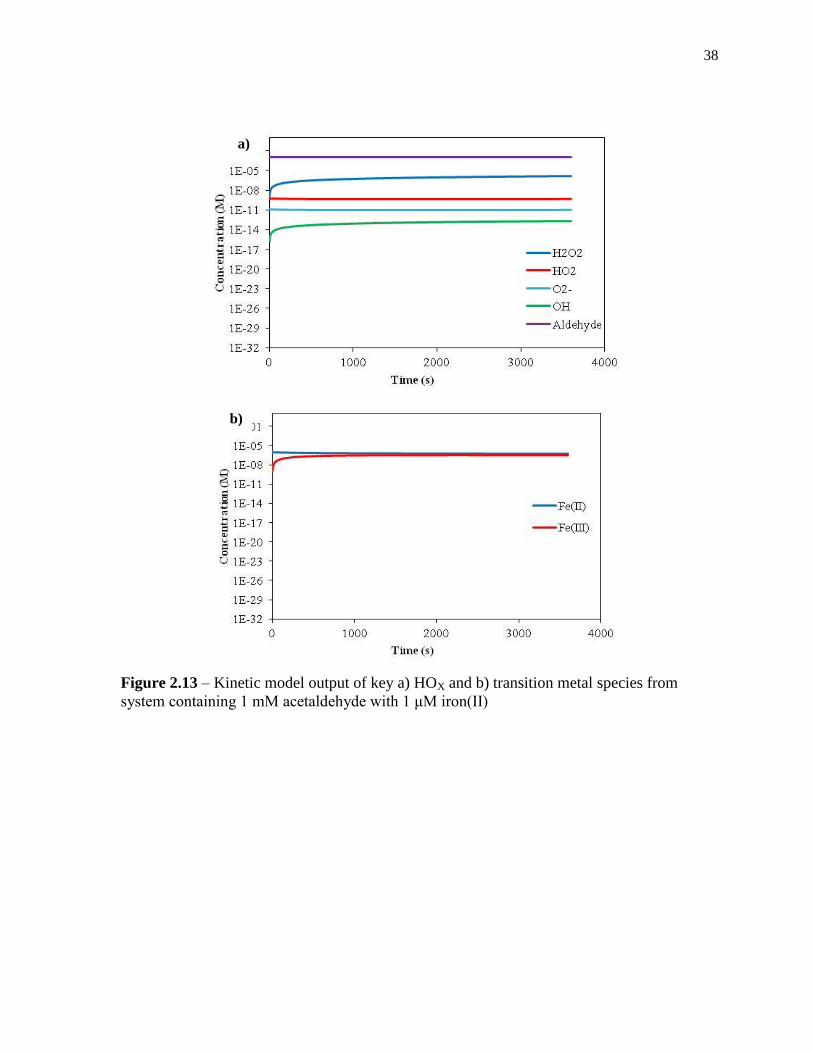
38
Figure 2.13 – Kinetic model output of key a) HOX and b) transition metal species from
system containing 1 mM acetaldehyde with 1 μM iron(II)
a)
b)

39
Figure 2.14 – Kinetic model output of key a) HOX and b) transition metal species from
system containing 1 mM acetaldehyde with 1 mM copper(II) and 1 μM iron (II)
a)
b)

40
Chapter 3
Yields and Stability of Peroxides from Secondary Organic Aerosol
Formation
3.1 Introduction
Aerosol particles have been the focus of much research in recent years due to their
impacts on both climate and human health. Secondary organic aerosol (SOA) is made of
particles that are formed in the atmosphere by the processing of primary gas-phase organic
emissions to form compounds of lower volatility. Depending on the environmental
conditions, source of the precursor species, and degree of atmospheric processing, the
particles formed may contain not only organic molecules such as organic acids, peroxides,
and other functionalized species, but may also become internally mixed with inorganics,
including metals.
Of particular importance, peroxides can be found in the gaseous and particle
phases.[1] Peroxides that are in the particle phase have the potential to be carried much
deeper into the respiratory system upon inhalation than those in the gaseous phase. As a
result of their high solubility, gas-phase peroxides tend to be lost to fluids in the upper
regions of the respiratory tract.[2, 3] It has long been suggested that particles will have
increasingly more negative effects on health the deeper they penetrate into the respiratory
system, as seen in Figure 3.1.[3, 4] Studies have shown that ultrafine particles are more
detrimental to health as a result of their deposition locations among other factors.[5, 6]
Figure 3.1 – Deposition location of particles within the body as a function of particle size.[7]

41
As the particles bring peroxides deeper within the body, the natural balance of
oxidants and antioxidants is disrupted, causing an excess of oxidizing species.[8] This
imbalance results in oxidative stress within the body, leading to health complications such as
exacerbation of asthma, pneumonia, DNA damage causing cancer, and extreme cases
resulting in mortality.[6, 9]
Many cleaning products and air fresheners that are used indoors contain organic
precursors to secondary organic aerosols known as terpenes. One of the most commonly
detected volatile organic compound (VOC) indoors is limonene.[10] Limonene is primarily
found as a green solvent in household cleaners, a component of wax finishing products, and
the active ingredient of air fresheners, but can also be found in the peels of many citrus
fruits.[11, 12] Another prevalent VOC is α-pinene, which is produced through both biogenic
and anthropogenic means. Like limonene, α-pinene is frequently used as a component in
household cleaners and air fresheners, however it may also be emitted by wood products
used indoors such as furniture.[13-15] Past studies have measured typical indoor terpene
mixing ratios of up to 500 ppb, with the detected levels being heavily dependent on terpene-
containing product use and room ventilation.[14] In a recent study by Singer et al., it was
found that limonene levels reached as high as 1400 ppb following the use of an orange-oil
based cleaning product, resulting in a mass loading of SOA of up the 300 μg/m3 in the
presence of ozone.[16] In another study by Salthammer, terpene levels reached 900 ppb
following the use of an oil treatment on wood indoors.[14]
Due to the limited levels of sunlight indoors, the formation of secondary organic
aerosols is expected to be primarily through the ozonolysis of alkenes.[13, 17] The main
source of indoor ozone is through the transport of outdoor air through cracks and imperfectly
sealed buildings, and as a result typical indoor concentrations will be heavily influenced by
the environment outside.[13, 18] It has been reported that indoor concentrations of ozone are
typically 30-70 % of those measured outdoors.[13, 18] Additional sources of ozone indoors
include office and household devices, such as photocopiers and laser printers.[12] A recent
consumer trend involves the use of ozone generators indoors in order to “purify” the air.
While the release of ozone from these generators is reported by manufacturers to be within a

42
safe human exposure limit (less than 100 ppb), ozone concentrations of 2500 ppb have been
measured in a room equipped with a generator.[13, 18]
Figure 3.2 – Mechanism of limonene ozonolysis, showing select oxidation peroxide-related
products (adapted from Walser et al, 2008).[19]
A general reaction mechanism for the ozonolysis of terpenes, specifically the
oxidation of limonene, can be found in Figure 3.2.[19] The reaction between ozone and
terpenes is initiated by the addition of the ozone molecule across the double bond of the
organic compound, forming a primary ozonide. The ozonide molecule will decompose to
form a carbonyl and an energetic radical called a Criegee intermediate. There are several
fates of this intermediate, including the formation of peroxides (as shown in Figure 3.2),
Primary
Ozonide
Criegee
Intermediate
Peroxy
radical
Organic
hydroperoxide
43
organic acids, aldehydes, and ketones through the stabilization of the radical.[18] The
oxidized organic products of this reaction will have lower vapour pressures than the initial
terpene, causing the products to condense and form a SOA particle.
The association of hydroperoxides with secondary organic aerosol has been
investigated in several past studies.[12, 13, 15, 20-25] In a study conducted by Li et al., the
concentrations of total organic and hydrogen peroxides formed during the ozonolysis of
limonene were measured in both the gas and particle phases simultaneously. It was estimated
that 0.91 ±0.42 ppb of peroxide was generated from the reaction at limonene and ozone
concentrations relevant to indoor conditions.[13] A study by Docherty et al. measured the
yields of peroxides in SOA formed through the ozonolysis of α- and β-pinene, Δ-3carene, and
sabinene, reporting yields of 47-85 % of the SOA mass.[20] A series of studies conducted by
Chen and Hopke measured peroxides associated with particles formed using α-pinene,
limonene, and linalool VOC precursors.[12, 15, 24] It was found that the peroxide yields
were 1.8-26 x10-10
mole peroxide/μg SOA. The stability of the peroxides on the particles was
evaluated for 24 hours at room temperature for linalool and limonene SOA and in a
refrigerator for limonene SOA, reporting losses of 15-69% of peroxides at room temperature
and 10% in the refrigerator. A study by Wang et al. investigated peroxide associate with
SOA formed through the oxidation of α- and β-pinene and toluene precursors, reporting
yields of 2.7 x10⁻¹¹
, 6.2 x10⁻¹¹
mole peroxide/μg SOA for α- and β-pinene.[21] No peroxides
were detected for the fresh measurement of toluene SOA. The stability of the peroxides both
on-particle and in an aqueous solution were also measured, finding an exponential decay of
peroxides on-particle, and an increase in peroxide within the first 20 hours after extraction,
followed by a period of stability in aqueous solution. Mertes et al. generated α-pinene SOA,
measuring peroxide yields of 12-34 % of the SOA mass.[23] A study by Bateman et al.
measured the yields of peroxides from limonene SOA, reporting a value of 2% in terms of
the moles of SOA collected.[22] The stability of the peroxides under photolytic conditions
were also evaluated, finding that there was no significant change in peroxide levels following
14 hours of photolysis. A study by Mutzel et al. attempted to improve the quantification of
peroxides in SOA by measuring peroxides in α-pinene SOA, however no yields were
reported in terms of the amount of SOA analyzed.[25] In all of the studies mentioned,
different techniques were used to measure and quantify the peroxide levels within the SOA.

44
As will be discussed in a later section, the techniques have different sensitivities to hydro and
organic peroxides, accounting for some of the widespread variation in the reported peroxide
yields.
The purpose of this study is to investigate the yields and stability of peroxides in
secondary organic aerosols in order to develop a more thorough understanding of their
potential contribution to oxidation chemistry in the atmosphere and indoor environments.
The analysis of the peroxides in this study is done using the horseradish peroxidase-
dichlorofluorescien (HRP-DCF) assay as described in the previous chapter, with sensitivity
to primarily hydrogen peroxide. Aerosols are generated through the ozonolysis of α-pinene
and limonene using both a flow tube apparatus and environmental chamber in order to
evaluate the effect of aerosol mass loading on peroxide yields. The stability of peroxides will
be measured both on-filter and in aqueous solution. This will allow us to gain a sense of the
peroxide lifetimes in particles that remain dry upon emission into the atmosphere or indoors,
and in particles that take up water to form either aqueous aerosol or cloud droplets. The
photolytic stability of the peroxides in aqueous solution is evaluated using a solar simulator
to represent the outdoor environment, while a fluorescent light source was used to evaluate
the stability of the peroxides indoors both on a dry particle and in an aqueous solution.
Finally, the stability of the peroxides on-filter was measured in a -20 °C freezer in an attempt
to validate the common protocol within the community of freezing filter samples prior to
analysis. The results of the thermal stability experiments will be used to validate the peroxide
yields obtained in previous studies. To our knowledge, no previous study has observed the
photolytic stability of peroxides in any aerosol under indoor conditions, or in α-pinene SOA
outdoors.
The results of this project will lead to a more thorough understanding of the peroxides
associated with aerosol. Knowledge of the peroxide lifetimes within the particle will make it
possible to evaluate the length of time of which a particle will remain a health risk due to
oxidative stress, as opposed to solely being a respiratory risk. Understanding the nature
peroxides within particles will also improve the understanding of oxidation chemistry that
will occur in particulate and aqueous phases.

45
3.2 Methods
3.2.1 SOA Collection using Flow Tube
Secondary organic aerosol samples were collected using a flow tube setup with a
headspace bubbler providing the organic precursor, as seen in Figure 3.3. The flow tube was
used to collect a high mass of particles that was required to perform the HRP-DCF assay in a
short period of time, ensuring the freshness of the SOA. The flow tube has dimensions of 60
cm in length, 3.74 cm in inner radius, with a volume of 2.64 L. During SOA collection, the
flow tube was fully covered with foil to prevent exposure to light. All flows are reported as
volumetric measurements and were controlled by mass flow controllers (MFC) which were
calibrated using a Gilibrator air flow calibrator (Gilibrator-2, Sensidyne Instrumentation).
Ozone was generated by flowing air over a mercury lamp, with a flow rate of 150 ccm (MFC
1). Nitrogen was passed through a glass bubbler containing the VOC precursor ((-)-α-pinene,
≥99%, Sigma-Aldrich ; (R)-(+)-Limonene, 97%, Sigma-Aldrich) at a rate of 10 ccm (MFC
2). The bubbler was chilled at -7 °C for α-pinene experiments, and 2 °C for limonene
experiments. A carrier flow of clean air was added to the VOC flow after the bubbler, at 25
ccm (MFC 3). An excess dilution flow of 1500 ccm of clean air was incorporated into the
flows through a needle valve, with an open vent in the line before the air mixed with the
ozone flow. This excess flow is used to supply extra air to the flow tube in the case of
fluctuations in the other flows, ensuring that the total flow through the flow tube remains 1
lpm. The ozone and VOC flows were introduced to the top of the flow tube using a custom-
made stainless steel T-fitting that prevented mixing until the flows reached the body of the
flow tube. The flow rate through the flow tube was held at 1000 ccm using a pump (MFC 4).
Aerosol samples were collected on supported polytetrafluoroethylene (PTFE) filters (Zefluor,
Pall Life Sciences, 47 mm diameter, .0 μm pore size). Filter samples for stability and
fluorescent light photolysis experiments were collected for 2 hours, with approximately 500
μg of SOA generated. Filter samples for photolysis experiments using the solar simulator
were collected overnight (approximately 16 hours), yielding approximately 4.5 mg of SOA.

46
Figure 3.3 – Simplified schematic of flow tube set up for SOA generation and collection.
The amount of ozone entering the flow tube was periodically measured using an
ozone analyzer (model 49C, Thermo Environmental Instruments Inc.). Approximately 1700
ppb of ozone was introduced to the flow tube, while an excess of 870 ppb of ozone was
detected at the exit of the flow tube. Based on the consumption of ozone, it is estimated that
approximately 830 ppb of α-pinene and limonene are consumed within the flow tube. The
mixing ratios of the VOCs introduced into the flow tube were not measured. The mass
loadings of SOA within the flow tube were 3500 and 5000 μg/m3 for α-pinene and limonene
experiments, respectively.
3.2.2 SOA Collection using Environmental Chamber
An environmental chamber was used to collect secondary organic aerosol samples to
evaluate peroxide yields at lower mass loads (see Figure 3.4). The chamber is a 1 m3 teflon
bag supported by a Teflon-coated frame. The bag is externally surrounded by stainless steel
panels, preventing exposure to outside light. As in the flow tube set up, all chamber flows are
reported as volumetric measurements and were controlled by mass flow controllers. Ozone

47
was generated by passing air through a mercury lamp at a flow of 6 lpm (MFC 5). A dilution
flow of air of 7 lpm (MFC 4) is mixed with the ozone flow prior to being introduced into the
chamber through a stainless steel port. Limonene ((R)-(+)-Limonene, 97%, Sigma-Aldrich)
was introduced to the chamber using a 10 ccm flow of nitrogen through a headspace bubbler
chilled at 5 °C (MFC 1). α-pinene was introduced to the chamber through a 12 ccm flow
from a custom cylinder with a certified concentration (3 0 ppm ± 0 % α-pinene in nitrogen,
Air Liquide). The VOC flows were carried with a dilution flow of air of 500 ccm (MFC 2),
meeting an additional dilution flow of 2.2 lpm (MFC 3) before entering the chamber through
a stainless steel port. The flow rate through the chamber was held at 15 lpm using a pump
(MFC 6). Aerosol samples were collected on supported PTFE filters (Zefluor, Pall Life
Sciences, 47 mm diameter, .0 μm pore size) for hours, collecting an average of 185 μg
and 900 μg of α-pinene and limonene SOA respectively.
Figure 3.4 – Simplified schematic of environmental chamber set up for SOA generation and
collection.
The ozone levels within the chamber were periodically measured using an ozone
analyzer during collection. Approximately 320 ppb of ozone was introduced to the chamber,
while excesses of 85 ppb and 140 ppb of ozone were measured at the exit of the chamber
during α-pinene and limonene experiments respectively. A proton-transfer mass spectrometer
48
(PTR-MS, Ionicon Analytik GmbH) was used to measure the mixing ratio of limonene
within the chamber; it was found that 250 ppb of limonene was introduced into the chamber
using the bubbler. The flow of α-pinene used from the certified cylinder resulted in a mixing
ratio of 250 ppb within the chamber. The mass loadings of SOA within the chamber were
100 μg/m3 for α-pinene experiments, and 500 μg/m
3 for limonene experiments, considerably
lower than in the flow tube.
3.2.3 SOA Storage and Extraction
Following collection, SOA samples for on-filter stability testing were weighed and
immediately placed in a sealed plastic filter holder (Analyslide Petri Dish, Pall Life
Sciences). Samples were either placed in a dark cupboard at room temperature, or placed in a
sealed plastic bag and into a dark freezer at -20 °C. Filter samples were left for 1 to 18 days
before being reweighed and extracted for peroxide analysis. Frozen samples were brought to
room temperature before being removed from the filter holder to prevent the condensation of
contaminants onto the filter surface. SOA samples for in-solution stability or photolysis
experiments were weighed and extracted immediately following collection.
Filter samples were placed in a foil-covered Teflon bottle with deionized water (15
mL for stability samples; the volume for photolysis was varied to achieve SOA concentration
of 1 mM in solution, assuming the molecular weight of SOA is 200 g/mole[22]) and placed
on a shake table for 15 minutes at 420 rpm. Following extraction, an aliquot of each sample
was immediately prepared for analysis using the HRP-DCF assay, as described in Chapter 2.
Extracted solutions were covered with parafilm and foil, and stored in the dark at room
temperature to evaluate in-solution peroxide stability.
3.2.4 Photolysis in Solar Simulator
Following extraction, 1 mM SOA samples (prepared under the assumption that the
molecular weight of SOA is 200 g/mole) were transferred to custom-made quartz sample
holders. A volume of aqueous iron(III) chloride was added to some SOA samples for a final

49
concentration of 1 μM. Hydrogen peroxide samples were also prepared with and without iron
as photolysis standards. An equivalent set of all samples was prepared and stored in the dark
as a control. A xenon arc lamp in the Suntest CPS solar simulator was used as the light
source, as described previously in Chapter 2. Samples were photolyzed for 3 hours, with
aliquots of each sample being taken every hour for peroxide analysis.
3.2.5 Indoor Photolysis using Fluorescent Lights
Photolysis experiments using fluorescent lights in the laboratory were conducted with
the SOA sample both on filter and in solution. For on filter photolysis experiments, filter
samples were immediately placed in a pyrex covered petri dish after collection. In solution
samples were extracted in 15 mL of deionized water before being transferred to the petri
dish. Samples were positioned on the bench top under the laboratory’s fluorescent lights for
7 hours at room temperature. Equivalent samples were prepared and placed in a dark
cupboard for 7 hours to serve as a dark blank. Following photolysis, on filter samples were
extracted in water for 15 minutes. Solutions were then analyzed for peroxide content using
the HRP-DCF assay.
3.3 Results and Discussion
3.3.1 Peroxide Yields in SOA
Peroxide yields from “fresh” SOA samples are considered to be the measurements
made immediately following the 15 minute aqueous extraction of an SOA sample that was
promptly extracted after collection. A summary of fresh peroxide yields can be found in
Table 3.1, showing values reported by both this study and previously published studies. The
yields have been reported in three ways: 1) % mole, moles of peroxides/moles of SOA
x100%, where the molecular weight of SOA is assumed to be 200 g/mole; 2) % mass, mass
of peroxides/mass of SOA collected x100%, where molecular weight of peroxides is
assumed to be 34 g/mole; and 3) normalized yield, moles of peroxides/mass of SOA
collected. Yields will be reported as % mole for the remainder of these results.
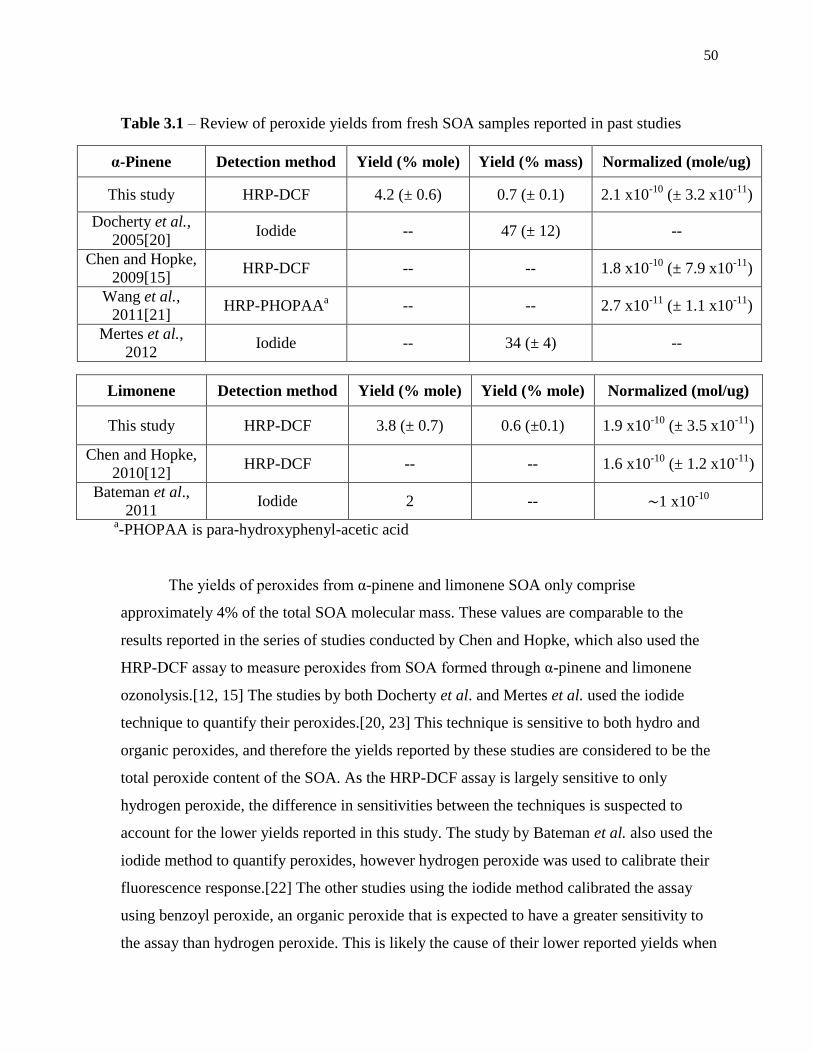
50
Table 3.1 – Review of peroxide yields from fresh SOA samples reported in past studies
α-Pinene Detection method Yield (% mole) Yield (% mass) Normalized (mole/ug)
This study HRP-DCF 4.2 (± 0.6) 0.7 (± 0.1) 2.1 x10⁻¹⁰
(± 3.2 x10⁻¹¹
)
Docherty et al.,
2005[20] Iodide -- 47 (± 12) --
Chen and Hopke,
2009[15] HRP-DCF -- -- 1.8 x10
-10 (± 7.9 x10
-11)
Wang et al.,
2011[21] HRP-PHOPAA
a -- -- 2.7 x10
-11 (± 1.1 x10
-11)
Mertes et al.,
2012 Iodide -- 34 (± 4) --
a-PHOPAA is para-hydroxyphenyl-acetic acid
The yields of peroxides from α-pinene and limonene SOA only comprise
approximately 4% of the total SOA molecular mass. These values are comparable to the
results reported in the series of studies conducted by Chen and Hopke, which also used the
HRP-DCF assay to measure peroxides from SOA formed through α-pinene and limonene
ozonolysis.[12, 15] The studies by both Docherty et al. and Mertes et al. used the iodide
technique to quantify their peroxides.[20, 23] This technique is sensitive to both hydro and
organic peroxides, and therefore the yields reported by these studies are considered to be the
total peroxide content of the SOA. As the HRP-DCF assay is largely sensitive to only
hydrogen peroxide, the difference in sensitivities between the techniques is suspected to
account for the lower yields reported in this study. The study by Bateman et al. also used the
iodide method to quantify peroxides, however hydrogen peroxide was used to calibrate their
fluorescence response.[22] The other studies using the iodide method calibrated the assay
using benzoyl peroxide, an organic peroxide that is expected to have a greater sensitivity to
the assay than hydrogen peroxide. This is likely the cause of their lower reported yields when
Limonene Detection method Yield (% mole) Yield (% mole) Normalized (mol/ug)
This study HRP-DCF 3.8 (± 0.7) 0.6 (±0.1) 1.9 x10⁻¹⁰
(± 3.5 x10⁻¹¹
)
Chen and Hopke,
2010[12] HRP-DCF -- -- 1.6 x10
-10 (± 1.2 x10
-11)
Bateman et al.,
2011 Iodide 2 -- ∼1 x10
-10

51
compared to other studies using the iodide technique. Finally, the study by Wang et al.
reported yields that were approximately an order of magnitude lower than the α-pinene yields
in this study. This study also used horseradish peroxidase as their catalyst, however they used
a HPLC technique to speciate the peroxides, and para-hydroxyphenyl-acetic acid was used in
the place of dichlorofluoroscein as their fluorescing agent. Unfortunately, the origin of the
discrepancies between the values is not known.
As seen in Chapter 1, the sensitivity of the HRP-DCF assay heavily favours hydrogen
peroxide, although small sensitivity to simple organic peroxides exists. For this reason, it is
believed that the peroxides detected arising from the SOA are primarily hydrogen peroxide
with the possibility of having small amounts of other organic hydroperoxide species present.
That being said, a control experiment was conducted in which gas phase hydrogen peroxide
was passed through a Teflon filter. Upon extraction in water, it was found that no measurable
amount of hydrogen peroxide had stuck to the filter. This result suggests that the peroxides
measured in this work were not in the form of hydrogen peroxide when present in the aerosol
particles and on the filter, but rather converted to hydrogen peroxide when the filter materials
were put into solution for the assay. Indeed, hydrogen peroxide is so volatile that one would
not expect it to significantly partition to particles.
While we cannot confidently identify the form of the peroxides on the filters, it is
likely that they are in some form of small organic hyhdroperoxides. In particular, a general
class of compounds, the α-hydroxyhydroperoxides, exist in equilibrium with hydrogen
peroxide and organics containing carbonyl functional groups, especially aldehydes.[26] Their
abundance is much higher in the elevated precursor concentrations present in aerosol than in
dilute water solutions, i.e. it is expected that they decompose to form hydrogen peroxide
when dissolved in water. The chemistry of this class of organic peroxides and other classes is
not well enough known to be confident that this is the class of molecules that ultimately
gives rise to the signals observed.

52
3.3.2 Effect of SOA Mass Loading
The yields of peroxides in SOA generated using the chamber set up can be found in
Figure 3.5a. The mass loadings of SOA in the chamber were approximately 35 times lower
than those in the flow tube. The fresh yields of peroxides in chamber SOA were found to be
.9 % mole for α-pinene at 5.2 % mole for limonene. These yields are similar to those from
SOA collected using the flow tube (4.2 % mole and 3.8 % mole respectively). The yields
from chamber SOA that was stored at room temperature for 24 hours were found to be 1.1 %
mole and .4 % mole for α-pinene and limonene experiments; this corresponds to a loss of
peroxides of approximately 50%. Similar trends were observed in SOA collected using the
flow tube, as will be discussed in the following section. The results demonstrate that mass
loading does not have a large effect on peroxide yields in SOA, and as a result the remainder
of the experiments will use SOA generated through the flow tube set up.
3.3.3 On-Filter Stability
The yields of peroxide from α-pinene and limonene SOA can be found in Figure 3.5
as a function of filter age before extraction. At room temperature, a loss of peroxide was
observed as the filter age increased for both α-pinene and limonene SOA. Within 24 hours at
room temperature, a decay of approximately 50% of the total peroxide yield was observed.
An insignificant amount of peroxide remained in both SOA types after 7 days.
Unlike the stability at room temperature, it was found that the peroxide yields were
stable when the filters were stored in the freezer at -20 °C. No significant change in peroxide
yields was observed in α-pinene and limonene SOA filters that were stored in the freezer for
up to 7 days.

53
Figure 3.5 – Stability of peroxides in SOA stored on-filter at (a) room temperature and (b) in
freezer at -20 °C (note: points without error bars represent experiments where a single
measurement was performed)
The decay of peroxides from the SOA samples at room temperature on filter suggests
that the species are lost either through volatilization or through chemical reactions. If the
peroxides begin as small organic peroxides, they could either volatilize directly from the
0.0
1.0
2.0
3.0
4.0
5.0
6.0
0 50 100 150 200
Yie
ld (
% m
ole
)
Filter age (hrs)
α-pinene - flow tube
limonene - flow tube
α-pinene - chamber
limonene - chamber
0.0
1.0
2.0
3.0
4.0
5.0
6.0
0 50 100 150 200
Yie
ld (
% m
ole
)
Filter age (hrs)
α-pinene
limonene
(a)
(b)

54
particle, or as hydrogen peroxide following a conversion reaction within the particle phase.
Although organic peroxides are volatile, hydrogen peroxide will volatilize at a faster rate
given its low molecular weight. As a specific example, if the peroxides are in the form of α-
hydroxyhydroperoxides present on the filter as discussed above, then these species may be
slowly decomposing to form hydrogen peroxide, which rapidly volatilizes.
At low temperature, the volatilization and reaction rates of the peroxides are expected
to be much slower than at room temperature. Consequently, the loss of the peroxides through
these processes will be less significant, accounting for the stable yields observed. The
demonstrated stability of the peroxides at -20 °C for the entire period of observation suggests
that it is acceptable to store collected samples prior to analysis for hydrogen peroxide. Thus,
there is no recommended change to the current protocol commonly used in the community.
3.3.4 Effect of Parafilm
The effect of using parafilm to seal samples in the filter holders was investigated
using both room temperature and freezer limonene SOA samples. Following collection, the
filters were placed in the filter holders and immediately parafilmed where applicable. Filter
samples were stored for 24 hours before extraction and peroxide analysis. The results are
summarized in Table 3.2. It was found that storing filter samples with parafilm had no
significant effect on the yield of peroxides.
Table 3.2 – Peroxide yields of filters stored for 24 hours using parafilm
Yield (% mole)
With Parafilm Without Parafilm
Room Temperature 1.81 1.66
Freezer 4.13 5.31

55
3.3.5 In-Solution Stability
The stability of peroxides in aqueous solutions of α-pinene and limonene SOA had
very similar trends following extraction. The yields of peroxides in aqueous solutions of
SOA samples extracted 24 hours after collection can be found in Figure 3.6 as a function of
solution age. Within the first 48 hours after extraction, the amount of peroxide in solution
increased by approximately 50% of its original yield. After 48 hours, the peroxide slowly
decayed in the solution, reaching a yield of approximately 0% within 7 days.
A control experiment was performed in which the Teflon filter was removed from the
aqueous solution following the initial 15 minute extraction period. In this sample, the same
increase in peroxide yields was observed within the first 48 hours following extraction. This
result confirms that the measured increase in yields is due to a chemical process within the
extracted solution, as opposed to a more efficient extraction of the filter at longer extraction
times.
Figure 3.6 – Stability of peroxides in aqueous extract of 24 hr SOA sample at room
temperature. (note: no error bars shown due to single measurements performed for
experiment)
0
0.5
1
1.5
2
2.5
3
3.5
4
4.5
0 50 100 150 200
Yie
ld (
% m
ole
)
Time Since Extraction (hr)
α-pinene
limonene

56
If the peroxides in the particle begin as organic hydroperoxides, it is possible that the
increase in yields is due to a gradual decomposition reaction to form hydrogen peroxide
within the first 48 hours. Although the total peroxide content in the extract may not be
changing, a larger fraction would be present in the H2O2 form. Since the HRP-DCF assay is
sensitive to only hydrogen peroxide, this could account for the increase in yields.
At times longer than 48 hours following extraction, there is a slow decay of the
peroxides observed in the solution. It is possible that there is a continuous chemical loss of
the peroxides by other species present in the SOA extract. At short times, this loss is masked
by the conversion of organic hydroperoxides to hydrogen peroxide, resulting in an observed
increase. As the conversion reaction slows, however, the loss process dominates, resulting in
an overall decrease in peroxide yields.
In aqueous solution, the exponential loss that was observed on-filter at room
temperature is no longer significant. In water, hydrogen peroxide and organic
hydroperoxides have a very high solubility, and as a result they will not be volatile. A control
experiment was performed in which a standard of hydrogen peroxide was kept in the dark at
room temperature under the same conditions as the SOA extracts. It was found that the
concentration of the hydrogen peroxide was stable for the initial 3 days of storage, before
gradually decaying. This suggests that at least a portion of the observed loss of peroxides in
aqueous SOA samples is due to the volatilization from the solution.
3.3.6 SOA Photolysis in Solar Simulator
Aqueous extracts of α-pinene and limonene SOA were photolyzed using the solar
simulator for 3 hours. The results of these experiments are found in Figure 3.7, with the
closed points representing photolyzed samples and the open points representing the
corresponding dark control sample. No significant change in peroxide yields was observed in
α-pinene solutions that were photolyzed or kept in the dark. In solutions containing α-pinene
and iron, a decrease in peroxide levels were observed in photolyzed solutions, with a slightly
less significant decrease in the dark solution. A linear increase in peroxide yields was
observed in photolyzed limonene solutions, while the dark solution did not have a significant

57
change in peroxide yields. In solutions containing limonene SOA and iron, an increase in
peroxide yields was observed after 1 hour of photolysis, however there was no significant
change in yields during the 2 subsequent hours of photolysis. The dark limonene solution
containing iron did not have a significant change in peroxide yields.
1.50
2.00
2.50
3.00
3.50
4.00
4.50
0 50 100 150 200
Yie
ld (
% m
ole
)
Photolysis time (min)
α-pinene - light
α-pinene - dark
(a)

58
1.50
2.00
2.50
3.00
3.50
4.00
0 50 100 150 200
Yie
ld (
% m
ole
)
Photolysis time (min)
α-pinene + Fe - light
α-pinene + Fe - dark
1.50
2.00
2.50
3.00
3.50
4.00
4.50
0 50 100 150 200
Yie
ld (
% m
ole
)
Photolysis Time (min)
limonene - light
limonene - dark
(b)
(c)

59
Figure 3.7 – Peroxide yields from SOA photolysis using a xenon arc lamp in the solar
simulator.
In photolyzed solutions containing only α-pinene, no change in peroxide was
observed, suggesting that there is no photolytic process involving the peroxides. This result
is consistent with a control experiment in which an aqueous hydrogen peroxide standard was
photolyzed and no change was observed. In the presence of iron, however, the decrease in
peroxide yields suggests that there is a photolytic loss process involving iron. Again, this
result is consistent with the photolysis of a hydrogen peroxide standard containing iron. The
observed decrease of hydrogen peroxide in the presence of iron is likely due to photo-Fenton
chemistry, in which iron will consume peroxide to generate HOX radicals. The increase in
peroxide yields observed in photolyzed limonene extracts indicates that there is a photolytic
production of peroxides. In the presence of iron, there is an increase in peroxide within the
first hour of photolysis, followed by stable yields for the remaining measurements. It is
suspected that there is a competition within the solution between the photolytic production of
peroxides from the limonene SOA and the photolytic loss of peroxides from the iron. This
general topic of photochemical production of peroxide from aqueous limonene SOA
photolysis is potentially interesting, but we would require better speciated measurements of
the peroxides to make definitive claims about this mechanism.
1.50
2.00
2.50
3.00
3.50
4.00
4.50
0 50 100 150 200
Yie
ld (
% m
ole
)
Photolysis Time (min)
limonene + Fe - light
limonene + Fe - dark
(d)
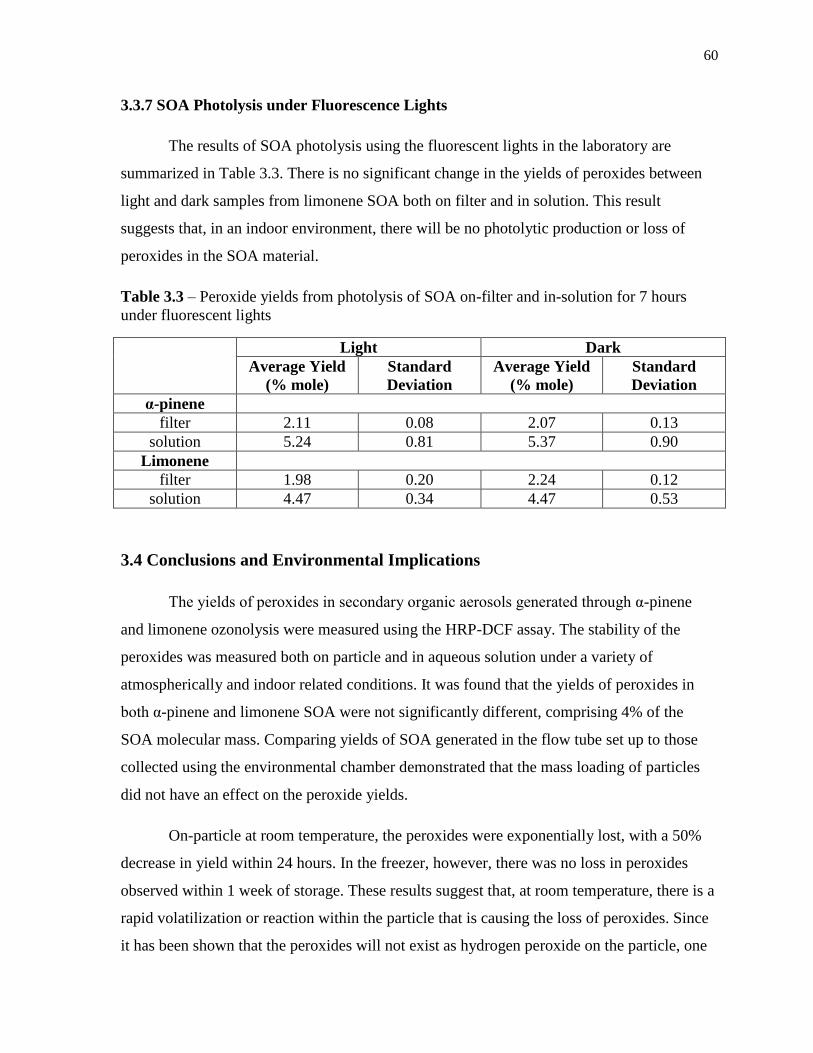
60
3.3.7 SOA Photolysis under Fluorescence Lights
The results of SOA photolysis using the fluorescent lights in the laboratory are
summarized in Table 3.3. There is no significant change in the yields of peroxides between
light and dark samples from limonene SOA both on filter and in solution. This result
suggests that, in an indoor environment, there will be no photolytic production or loss of
peroxides in the SOA material.
Table 3.3 – Peroxide yields from photolysis of SOA on-filter and in-solution for 7 hours
under fluorescent lights
Light Dark
Average Yield
(% mole)
Standard
Deviation
Average Yield
(% mole)
Standard
Deviation
α-pinene
filter 2.11 0.08 2.07 0.13
solution 5.24 0.81 5.37 0.90
Limonene
filter 1.98 0.20 2.24 0.12
solution 4.47 0.34 4.47 0.53
3.4 Conclusions and Environmental Implications
The yields of peroxides in secondary organic aerosols generated through α-pinene
and limonene ozonolysis were measured using the HRP-DCF assay. The stability of the
peroxides was measured both on particle and in aqueous solution under a variety of
atmospherically and indoor related conditions. It was found that the yields of peroxides in
both α-pinene and limonene SOA were not significantly different, comprising 4% of the
SOA molecular mass. Comparing yields of SOA generated in the flow tube set up to those
collected using the environmental chamber demonstrated that the mass loading of particles
did not have an effect on the peroxide yields.
On-particle at room temperature, the peroxides were exponentially lost, with a 50%
decrease in yield within 24 hours. In the freezer, however, there was no loss in peroxides
observed within 1 week of storage. These results suggest that, at room temperature, there is a
rapid volatilization or reaction within the particle that is causing the loss of peroxides. Since
it has been shown that the peroxides will not exist as hydrogen peroxide on the particle, one

61
possibility is that they are in the form of α-hydroxyperoxides. These species are known to be
in equilibrium with hydrogen peroxide and organics with carbonyl functional groups.
In the freezer, however, the loss processes observed at room temperature become
insignificant due to the slowing of rates caused by the reduced temperatures. Consistent with
this observation, in aqueous solution, there was an observed increase in peroxide yields
within the first 48 hours following extraction at room temperature. This increase is likely due
to the chemical decomposition reaction occurring within the extracted solution, of the
conversion of organic hydroperoxides to hydrogen peroxide.
The photolysis of the extracted SOA solutions using the solar simulator produced
inconclusive results that warrant further investigation. No change in peroxide yields were
observed during the photolysis of α-pinene SOA, however a linear increase was observed in
the photolysis of limonene SOA. In the presence of iron, there was an observed decrease in
peroxide in the α-pinene extract. With iron, the yields of peroxide in limonene SOA
increased within the first hour of photolysis, stabilizing for the remaining 2 hours of
photolysis. Using the fluorescent light source to reproduce indoor photolysis, no changes in
peroxide yields were observed in-solution or on-particle.
Based on the results of this study, it is expected that the peroxides begin in the
aerosol particle as small organic hydroperoxides. With time, these peroxides are converted to
hydrogen peroxide both on-particle and in-solution. Although the peroxides only comprise a
small portion of the SOA, they have potential to influence chemistry indoors and to affect
human health. Outdoors, it is anticipated that these peroxides will be available to participate
in oxidation chemistry within the aerosol particles in the atmosphere, for example through
Fenton like chemistry or photolysis to form OH.[1] Oxidation chemistry due to the peroxides
would have a greater opportunity to proceed within aqueous particles, as the lifetime of
peroxides was demonstrated to be longer in solution. If the peroxides are lost from the
particles through volatilization, this process could be a source of oxidants to the gas phase.
Indoors, SOA can be either inhaled directly or it can deposit on indoor surfaces where
it can become part of the semi-volatile organic matter that is known to be ubiquitously
present.[27] For the airborne particles, peroxides associated with the SOA, as one component

62
of the general class of molecules referred to as Reactive Oxygen Species (ROS), have the
potential to cause oxidative stress upon inhalation. Based on our work, it is expected that the
peroxides exist as hydroperoxides in the particles – and not as hydrogen peroxide – thus
allowing them to be carried deep into the respiratory system; being so volatile and soluble, it
is unlikely that hydrogen peroxide itself can pass long distances into the respiratory
pathways. Once the particles deposit and dissolve in the lung fluid, the hydroperoxides will
likely decompose to form hydrogen peroxide, a potent ROS constituent. Given that air
exchange rates indoors are typically on the hour of orders, the loss of peroxides at room
temperature that we observed occurring on the day-to-multiday timescale is likely to be
unimportant.
A second potential impact of these peroxides is if they deposit onto surfaces indoors.
In this case, they can be potentially ingested after touching theses surfaces or, probably more
importantly, they may participate in condensed phase chemistry that could impact the
composition of the films. In particular, one question that we are now evaluating is whether
these peroxides can participate in the formation of more active oxidants, such as the
condensed phase hydroxyl radical, under indoor conditions. To be important, this chemistry
would have to occur in the films on the first day or two of SOA deposition given the
timescale we observed for on-filter decay of these species.

63
3.5 References
[1] D.W. Gunz, and M.R. Hoffmann, Atmospheric chemistry of peroxides - a review, in
Atmospheric Environment Part a-General Topics, 1990, pp. 1601-1633.
[2] S.K. Friedlander, and E.K. Yeh, The submicron atmospheric aerosol as a carrier of
reactive chemical species: Case of peroxides, in Applied Occupational and
Environmental Hygiene, 1998, pp. 416 - 420.
[3] L.A. Morio, K.A. Hooper, J. Brittingham, T.H. Li, R.E. Gordon, B.J. Turpin, and
D.L. Laskin, Tissue injury following inhalation of fine particulate matter and
hydrogen peroxide is associated with altered production of inflammatory mediators
and antioxidants by alveolar macrophages, in Toxicology and Applied
Pharmacology, 2001, pp. 188-199.
[4] M. Lippmann, and R.E. Albert, Effect of particle size on regional deposition of
inhaled aerosols in human respiratory tract, in American Industrial Hygiene
Association Journal, 1969, pp. 257-&.
[5] G. Oberdorster, Pulmonary effects of inhaled ultrafine particles, in International
Archives of Occupational and Environmental Health, 2001, pp. 1-8.
[6] F. Tao, B. Gonzalez-Flecha, and L. Kobzik, Reactive oxygen species in pulmonary
inflammation by ambient particulates, in Free Radical Biology and Medicine, 2003,
pp. 327-340.
[7] D. Moore, G.D. Robson, and A.P.J. Trinci, 21st Century Guidebook to Fungi,
Cambridge University Press, Cambridge, United Kingdom, 2011.
[8] S.A. Gurgueira, J. Lawrence, B. Coull, G.G.K. Murthy, and B. Gonzalez-Flecha,
Rapid increases in the steady-state concentration of reactive oxygen species in the
lungs and heart after particulate air pollution inhalation, in Environmental Health
Perspectives, 2002, pp. 749-755.
[9] L. Risom, P. Moller, and S. Loft, Oxidative stress-induced DNA damage by
particulate air pollution, in Mutation Research-Fundamental and Molecular
Mechanisms of Mutagenesis, 2005, pp. 119-137.
[10] C.J. Weschler, and H.C. Shields, Indoor ozone/terpene reactions as a source of
indoor particles, in Atmospheric Environment, 1999, pp. 2301-2312.
[11] J.Y. Zhang, K.E.H. Hartz, S.N. Pandis, and N.M. Donahue, Secondary organic
aerosol formation from limonene ozonolysis: Homogeneous and heterogeneous
influences as a function of NOx, in Journal of Physical Chemistry A, 2006, pp.
11053-11063.
[12] X. Chen, and P.K. Hopke, A chamber study of secondary organic aerosol formation
by limonene ozonolysis, in Indoor Air, 2010, pp. 320-328.
[13] T.H. Li, B.J. Turpin, H.C. Shields, and C.J. Weschler, Indoor hydrogen peroxide
derived from ozone/d-limonene reactions, in Environmental Science & Technology,
2002, pp. 3295-3302.
[14] J. Toftum, S. Feund, T. Salthammer, and C.J. Weschler, Secondary organic aerosols
from ozone-initiated reactions with emissions from wood-based materials and a
"green" paint, in Atmospheric Environment, 2008, pp. 7632-7640.
[15] X. Chen, and P.K. Hopke, Secondary organic aerosol from alpha-pinene ozonolysis
in dynamic chamber system, in Indoor Air, 2009, pp. 335-345.
64
[16] B.C. Singer, B.K. Coleman, H. Destaillats, A.T. Hodgson, M.M. Lunden, C.J.
Weschler, and W.W. Nazaroff, Indoor secondary pollutants from cleaning product
and air freshener use in the presence of ozone, in Atmospheric Environment, 2006,
pp. 6696-6710.
[17] Z.H. Fan, P. Lioy, C. Weschler, N. Fiedler, H. Kipen, and J.F. Zhang, Ozone-initiated
reactions with mixtures of volatile organic compounds under simulated indoor
conditions, in Environmental Science & Technology, 2003, pp. 1811-1821.
[18] C.J. Weschler, Ozone in indoor environments: Concentration and chemistry, in
Indoor Air-International Journal of Indoor Air Quality and Climate, 2000, pp. 269-
288.
[19] M.L. Walser, Y. Desyaterik, J. Laskin, A. Laskin, and S.A. Nizkorodov, High-
resolution mass spectrometric analysis of secondary organic aerosol produced by
ozonation of limonene, in Physical Chemistry Chemical Physics, 2008, pp. 1009-
1022.
[20] K.S. Docherty, W. Wu, Y.B. Lim, and P.J. Ziemann, Contributions of organic
peroxides to secondary aerosol formed from reactions of monoterpenes with O-3, in
Environmental Science & Technology, 2005, pp. 4049-4059.
[21] Y. Wang, H. Kim, and S.E. Paulson, Hydrogen peroxide generation from alpha- and
beta-pinene and toluene secondary organic aerosols, in Atmospheric Environment,
2011, pp. 3149-3156.
[22] A.P. Bateman, S.A. Nizkorodov, J. Laskin, and A. Laskin, Photolytic processing of
secondary organic aerosols dissolved in cloud droplets, in Physical Chemistry
Chemical Physics, 2011, pp. 12199-12212.
[23] P. Mertes, L. Pfaffenberger, J. Dommen, M. Kalberer, and U. Baltensperger,
Development of a sensitive long path absorption photometer to quantify peroxides in
aerosol particles (Peroxide-LOPAP), in Atmospheric Measurement Techniques,
2012, pp. 2339-2348.
[24] X. Chen, and P.K. Hopke, A chamber study of secondary organic aerosol formation
by linalool ozonolysis, in Atmospheric Environment, 2009, pp. 3935-3940.
[25] A. Mutzel, M. Rodigast, Y. Iinuma, O. Boege, and H. Herrmann, An improved
method for the quantification of SOA bound peroxides, in Atmospheric Environment,
2013, pp. 365-369.
[26] R. Zhao, A.K.Y. Lee, R. Soong, A.J. Simpson, and J.P.D. Abbatt, Formation of
aqueous-phase alpha-hydroxyhydroperoxides (alpha-HHP): potential atmospheric
impacts, in Atmospheric Chemistry and Physics, 2013, pp. 5857-5872.
[27] Q.T. Liu, R. Chen, B.E. McCarry, M.L. Diamond, and B. Bahavar, Characterization
of polar organic compounds in the organic film on indoor and outdoor glass
windows, in Environmental Science & Technology, 2003, pp. 2340-2349.

65
Chapter 4
Implications and Future Work
4.1 Environmental Implications
In the first project, the potential coupling of metal-catalyzed redox cycles was
investigated by evaluating peroxide production in systems in the presence and absence of
transition metals. With a coupling of the redox cycles, the production of peroxide was
expected to decrease, demonstrating an irreversible loss of HOX. Under the experimental
conditions used, the results were not able to demonstrate this coupling, as iron’s affinity to
form complexes dominated over its participation in the coupling reaction. To better evaluate
the significance of this coupling chemistry in the atmosphere, a more atmospherically
relevant sample should be used.
The results of this project demonstrated that a substantial amount of peroxide could
be produced from a system containing one simple organic with iron. This suggests that there
will be the potential to have a larger extent of iron complexation within atmospheric
aerosols, which are known to have a much more diverse mixture of many concentrated
organic species. The photolysis of these iron complexes could be a significant source of
peroxides within the particle phase, however this will be heavily dependent on the organics
that are present, as not all complexes have been shown to generate peroxide. This could
increase the amount of oxidants present within the particle, ultimately increasing its
oxidative capacity.
In the second project, the production of peroxides within secondary organic aerosols
generated from α-pinene and limonene precursors was studied. The stability of the peroxides
was investigated under a range of indoor and atmospherically relevant conditions. It was
found that the yields of peroxides in SOA generated using the different precursors were not
significantly different. While the yields of hydrogen peroxide increased in an aqueous
solution within the initial days following formation (likely due to the conversion of organic
hydroperoxides into hydrogen peroxide), there was a rapid decay of peroxides from the dry
particles.

66
In the atmosphere, the peroxides that are associated with the aerosol would be
available to participate in oxidation chemistry within the particle phase. In an aqueous
aerosol, the peroxides are expected to remain in the aqueous phase for several days due to
their demonstrated longer lifetimes. On a dry particle however, the peroxides are expected to
be rapidly lost. The volatilization of the peroxides from the particle could be a source of HOX
to the gas phase.
Indoors, the peroxides in the SOA particles can both influence oxidation chemistry
and have health implications. Upon inhalation, the peroxides associated with the particles are
expected to be carried deep within the lungs. The transport of these oxidants will cause an
imbalance between oxidants and antioxidants within the cells, causing oxidative stress. The
particles also have the potential to be deposited onto organic films commonly found indoors.
Here, the peroxides could promote oxidation within the films, changing their composition.
4.2 Future Work
In order to deepen the understanding of the results of the first project, it is
recommended that the iron complexes are investigated. To evaluate the significance of the
iron hydroxyl complex, it will be valuable to have a quantitative measurement of the OH
radicals. This could be accomplished by performing a benzoic acid OH trap experiment as
described previously, and quantifying the samples using a more sensitive mass spectrometer
than previously used. Using this concentration of OH, the amount of peroxide that would be
generated by the oxidation of acetaldehyde could be used to determine the contribution of
this reaction to the overall increase in peroxide that was observed in the acetaldehyde and
iron system. To investigate the iron organic complex, an analytical technique such as ion
chromatography with an electrical conductivity detector could be used to confirm the
production of oxalic acid through the oxidation of acetaldehyde in the system. By performing
a quantitative analysis, it will be possible to determine the contribution of the organic
complex to the increase in peroxide from the acetaldehyde and iron system.
As a consequence of measuring only hydrogen peroxide, much of the chemistry that
occurred in the transition metal samples is not well understood. In order to have a better

67
understanding of the processes in the sample, other species in the samples such as the
transition metal ions, OH and HO2 radicals could be measured using techniques such as ion
chromatography and electron spin resonance. This would confirm the concentrations and
significance of the pathways predicted using the models, and help to explain how the redox
cycles may be influenced by the metals.
The experiments conducted in the first project could be performed using an
alternative source of aqueous HOX radicals. Propanaldehyde is an example of a simple
organic that is expected to generate HO2 radicals upon photolysis, while not likely to form
oxalic acid upon oxidation. If the same trends in peroxide production are confirmed, this
would strengthen the prediction that the coupling chemistry is not likely to be significant in
an ambient particle. In order to better evaluate the efficacy of the coupling chemistry,
however, the inclusion of other species commonly found in aerosol particles and cloud
droplets at relevant concentrations is important. By increasing the diversity of the species in
the samples, it will be possible to better predict the interferences some species may have on
the coupling reaction.
A more thorough speciation of the peroxides measured in the second project would
improve the understanding of the species that are generated through SOA formation. This
could be done by using the iodide technique to measure the total peroxide concentration
(including hydrogen peroxide, organic hydroperoxides, and organic peroxides). Measuring
the initial yields and changes of the individual peroxides under the various conditions would
deepen the understanding of the conversion and loss processes affecting the observed yields
in this study.
To evaluate the broader impact of the second project, it would be interesting to see if
the peroxides associated with the SOA particles will promote oxidation chemistry in the
particle phase or indoor films. The peroxides could generate HOX radicals through reaction
or photolysis, which could then oxidize other material within the particle or film. Having a
more thorough understanding of the oxidation that may occur following particle formation
could improve the knowledge of the aging processes that will change the composition of
aerosols and indoor films.