fatigue and damage tolerance analysis of a hybrid ...mln/ltrs-pdfs/nasa-2001-57ahs-gbm.pdffatigue...
TRANSCRIPT

Fatigue and Damage ToleranceAnalysis of a Hybrid
Composite Tapered Flexbeam
American Helicopter Society ForumMay 9-11, 2001 in Washington DC.
Gretchen B. Murri
Research Engineer
Army Vehicle Technology Directorate, Hampton, VA
Jeffrey R. Schaff
Research Engineer/Scientist
United Technologies Research Center
East Hartford, CT
Alan L. Dobyns
Senior Structures Specialist
Sikorsky Aircraft, Stratford, CT
ABSTRACTThe behavior of nonlinear tapered composite
flexbeams under combined axial tension and cyclic
bending loading was studied using coupon test
specimens and finite element (FE) analyses. The
flexbeams used a hybrid material system of
graphite/epoxy and glass/epoxy and had internal
dropped plies, dropped in an overlapping stepwise
pattern. Two material configurations, differing only in
the use of glass or graphite plies in the continuous
plies near the midplane, were studied. Test
specimens were cut from a full-size helicopter tail-
rotor flexbeam and were tested in a hydraulic load
frame under combined constant axial-tension load
and transverse cyclic bending loads. The first
delamination damage observed in the specimens
˚ Presented at the American Helicopter Society 57th
Annual Forum, Washington, DC, May 9-11, 2001.
Copyright © 2001 by the American Helicopter Society
International, Inc. All rights reserved.
occurred at the area around the tip of the outermost
ply-drop group in the tapered region of the flexbeam,
near the thick end. Delaminations grew slowly and
stably, toward the thick end of the flexbeam, at the
interfaces above and below the dropped-ply region. A
2D finite element model of the flexbeam was
developed. The model was analyzed using a
geometrically non-linear analysis with both the
ANSYS and ABAQUS FE codes. The global
responses of each analysis agreed well with the test
results. The ANSYS model was used to calculate
strain energy release rates (G) for delaminations
initiating at two different ply-ending locations. The
results showed that delaminations were more inclined
to grow at the locations where they were observed in
the test specimens. Both ANSYS and ABAQUS
were used to calculate G values associated with
delamination initiating at the observed location but
growing in different interfaces, either above or below
the ply-ending group toward the thick end, or toward
the thin end from the tip of the resin pocket. The
different analysis codes generated the same trends
and comparable peak values, within 5-11% for each
delamination path. Both codes showed that
delamination toward the thick region was largely
mode II, and toward the thin region was
predominantly mode I. The calculated peak G-values
from either analysis predict delamination is most
likely to occur along the same interface where it was
observed in the test specimens. Calculated peak G
values were used with material characterization data
to calculate a curve relating the fatigue life of the
specimens, N, to the applied transverse load, V, for a
given constant axial load.
NOMENCLATURE
b delamination length along taper above
ply ending, mm
bl delamination length along taper below ply
ending, mm
a delamination length toward thin region,
mm
E1, E2 Young's moduli in 1- and 2- directions, GPa
G total strain energy release rate, J/m2
G12 shear moduli, GPa
GI mode I strain energy release rate, J/m2
GII mode II strain energy release rate, J/m2
N number of loading cycles
P axial tension load, kN
V measured transverse (bending) load, kN
tply ply thickness in PATRAN model
v transverse displacement at tip of flexbeam,
mm
θ flexbeam flapping angle, degrees
δ transverse stroke of ATB test machine, mm
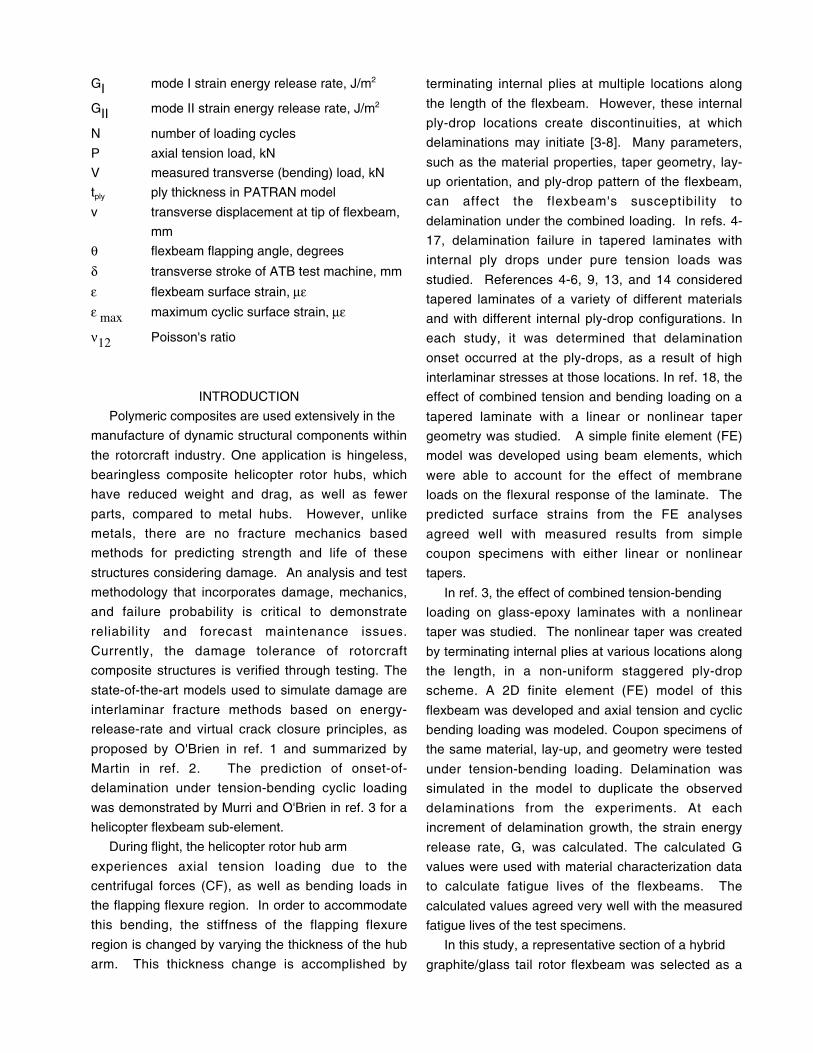
ε flexbeam surface strain, µεε max maximum cyclic surface strain, µε
ν12 Poisson's ratio
INTRODUCTION
Polymeric composites are used extensively in the
manufacture of dynamic structural components within
the rotorcraft industry. One application is hingeless,
bearingless composite helicopter rotor hubs, which
have reduced weight and drag, as well as fewer
parts, compared to metal hubs. However, unlike
metals, there are no fracture mechanics based
methods for predicting strength and life of these
structures considering damage. An analysis and test
methodology that incorporates damage, mechanics,
and failure probability is critical to demonstrate
reliability and forecast maintenance issues.
Currently, the damage tolerance of rotorcraft
composite structures is verified through testing. The
state-of-the-art models used to simulate damage are
interlaminar fracture methods based on energy-
release-rate and virtual crack closure principles, as
proposed by O'Brien in ref. 1 and summarized by
Martin in ref. 2. The prediction of onset-of-
delamination under tension-bending cyclic loading
was demonstrated by Murri and O'Brien in ref. 3 for a
helicopter flexbeam sub-element.
During flight, the helicopter rotor hub arm
experiences axial tension loading due to the
centrifugal forces (CF), as well as bending loads in
the flapping flexure region. In order to accommodate
this bending, the stiffness of the flapping flexure
region is changed by varying the thickness of the hub
arm. This thickness change is accomplished by
terminating internal plies at multiple locations along
the length of the flexbeam. However, these internal
ply-drop locations create discontinuities, at which
delaminations may initiate [3-8]. Many parameters,
such as the material properties, taper geometry, lay-
up orientation, and ply-drop pattern of the flexbeam,
can affect the flexbeam's susceptibility to
delamination under the combined loading. In refs. 4-
17, delamination failure in tapered laminates with
internal ply drops under pure tension loads was
studied. References 4-6, 9, 13, and 14 considered
tapered laminates of a variety of different materials
and with different internal ply-drop configurations. In
each study, it was determined that delamination
onset occurred at the ply-drops, as a result of high
interlaminar stresses at those locations. In ref. 18, the
effect of combined tension and bending loading on a
tapered laminate with a linear or nonlinear taper
geometry was studied. A simple finite element (FE)
model was developed using beam elements, which
were able to account for the effect of membrane
loads on the flexural response of the laminate. The
predicted surface strains from the FE analyses
agreed well with measured results from simple
coupon specimens with either linear or nonlinear
tapers.
In ref. 3, the effect of combined tension-bending
loading on glass-epoxy laminates with a nonlinear
taper was studied. The nonlinear taper was created
by terminating internal plies at various locations along
the length, in a non-uniform staggered ply-drop
scheme. A 2D finite element (FE) model of this
flexbeam was developed and axial tension and cyclic
bending loading was modeled. Coupon specimens of
the same material, lay-up, and geometry were tested
under tension-bending loading. Delamination was
simulated in the model to duplicate the observed
delaminations from the experiments. At each
increment of delamination growth, the strain energy
release rate, G, was calculated. The calculated G
values were used with material characterization data
to calculate fatigue lives of the flexbeams. The
calculated values agreed very well with the measured
fatigue lives of the test specimens.
In this study, a representative section of a hybrid
graphite/glass tail rotor flexbeam was selected as a

benchmark structure for analysis and testing. A
series of flexbeam sub-element specimens were cut
from a full-size flexbeam and were subjected to axial
tension and cyclic flatwise-bending loading. A 2D
finite element model that truly represents the same
geometry, lay-up and hybrid material system as the
tested specimens was developed. The model was
analyzed using the ANSYS and ABAQUS FE codes,
using geometric nonlinear options and incorporating
contact effects. The analyses were used to calculate
strain energy release rates for modeled delamination
growth at several interfaces. Results of the analyses
were compared to each other and to the test results.
EXPERIMENTS
Specimen Geometry and Test Conditions
The flexbeam is the primary load-bearing member
of the rotor assembly and transfers bending and
torsion loads from the blade to the rotor. Flexbeams
are therefore designed to provide high edgewise
rigidity for stability, and low torsional and flatwise
rigidity for flexibility. To accommodate this flexibility
requirement, the flexbeam thickness varies along the
length, with a thin center region of unidirectional
plies, a taper region where unidirectional and off-axis
plies are added in steps along the length, and a thick
attachment region of unidirectional and off-axis plies.
Laboratory testing was performed on sub-element
size specimens cut from the outboard taper region of
full size flexbeams on a commercial Sikorsky tail
rotor. Figure 1 shows a typical test specimen. The
specimens had a nonlinear taper design and the lay-
up was symmetric about the midplane. The specimen
thickness varied from 129 plies at the thick end, to 39
plies at the thin end. The layup consists of 0, 45 and
-45 degree plies, with the continuous plies being
strictly 0-degree and the ply-ending groups being
either 45/-45 pairs, or [02/45/-45] groups. The
specimens were fabricated using a combination of
S2/8552 glass/epoxy and graphite/epoxy. Material
properties and nominal ply thickness for both
materials are given in Table 1.
Table 1. Typical laminae room temperature material
properties.
========================================
Material graphite/epoxy glass/epoxy S2/8552
-----------------------------------------------------------------------E1t, GPa (msi) 161.35 (23.40) 47.58 (6.90)E2t, GPa (msi) 11.38 (1.65) 13.10 (1.90)E1c, GPa (msi) 143.4 (20.80) 46.88 (6.80)E2c, GPa (msi) 12.75 (1.85) 17.93 (2.60)G12, GPa (msi) 5.17 (0.75) 5.03 (0.73)ν12 0.32 0.27Thickness, mm 0.152 (0.006) 0.152 (0.006) (in)========================================
Two different flexbeam configurations were
studied. They were identical in exterior taper
geometry and material systems, but the lay-ups
differed in the use of either graphite plies or glass
plies closest to the mid-plane. The different lay-ups
will be referred to in this report as graphite-midplane
specimen (GRMS) or glass-midplane specimen
(GLMS), respectively. The lengths of the GRMS and
GLMS specimens are 203.2 mm (8-inch) and 165.1
mm (6.5-inch), respectively. The gage length was
shortened from the original 203.2 mm to 165.1 mm to
reduce the transverse stoke required to achieve the
desired strain levels, and to improve the ATB
performance. For the two gage lengths, only the
length of the thin region varied; the length of the
tapered region was always 80.7 mm (3.17 in.). The
thick region was the same length for both specimen
types, and was completely within the bottom grip for
all specimens. The nominal dimensions of the GLMS
specimens are shown in fig. 2.
Figure 3 shows a photograph of the tapered
region of a GLMS specimen at the specimen edge.
The figure shows the hybrid materials, as well as the
continuous belt-ply groups and the dropped-ply
group. The tapered section is divided into three
regions, each containing 4 to 7 ply-ending packs.
Within each of these packs, 2 to 4 plies are
terminated in stepwise fashion. The terminated plies
(ply-endings) are identified by region number, pack
number, and ply-ending number. Pack numbers and
ply-ending numbers increase, moving from the
flexbeam upper and lower surfaces toward the
midplane. Ply-endings 111 and 311 are defined in
fig 3. As the sketch in fig. 3 shows, the terminated
plies are dropped in an overlapping pattern, so that
the plies closest to the midplane are shortest and are
terminated first.
Axial Tension Bending Machine
The flexbeam specimens were tested in a servo-
hydraulic load frame, called the Axial-Tension
Bending (ATB) machine, which is shown
schematically in fig. 4. The ATB can be used to
produce constant axial tension loading, combined
with cyclic bending loading. As fig. 4 shows, the axial
load cell is located above the top grip, but below the
pivot connecting the axial and transverse actuators.
Therefore, the axial tension load, P, "rotates" with
the specimen as the transverse load is applied and
remains constant as the specimen flexes under the
transverse bending load, V. With the axial tension
load applied under load control, and the transverse
bending applied using stroke control, a constant
membrane load should be maintained throughout the
loading cycle.
Static Tests
Before testing, specimens were instrumented with
strain gages along the length on the left and right
sides of the flexbeam as shown in fig. 2, with gages
in both the thin and tapered regions. Using the end of
the taper region at the thick end as a reference (STA
32.84 shown on fig. 2), the specimens were inserted
into the lower grip with the thick end completely in the
fixed bottom grip, and the bottom of the tapered
region (STA 32.84) flush with the top of the lower
grip. The gage length between the grips was either
203.2 mm (8 inches) for the GRMS specimen or
165.1 mm (6.5 inches) for the GLMS specimens.
Static testing was conducted on all specimens,
prior to fatigue testing, to determine the relationship
between applied loads and specimen deflection and
surface strains. These relationships were used to
determine axial load and cyclic transverse
displacements for fatigue testing. For static
excursions, a constant axial tension load, P, was
applied and held constant, while the transverse
stroke, δ, was applied, in steps of approximately 2.54
mm (0.1 inch), up to a maximum stroke of 45.7 mm
(1.8 inch). At each transverse stroke step, the strains
as referenced in fig. 2 were recorded, as well as the
transverse flexbeam tip-displacement, v, and flapping
angle, θ . The flexbeam tip-displacement was
measured using a spring-loaded direct-current
displacement transducer (DCDT) which was mounted
to the side of the load frame and detected the
displacement of a bracket attached to the centerline
of the top grip. The flapping angle was measured by
means of a digital protractor mounted to the top grip.
Figure 5 shows a schematic of the specimen in the
ATB with loads and deflections labeled. Observation
of specimen markings and load-displacement
measurements indicated no evidence of slipping.
Fatigue Tests
For fatigue testing, the tension load and transverse
displacement for each specimen were chosen based
on a desired maximum surface strain level, rather
than a prescribed transverse deflection or flapping
angle. The axial tension load was chosen as the load
that resulted in a strain of approximately 2500 µε inthe constant thickness region of the specimen
approximately 74 mm from upper grip, i.e., gages 5
and 7a in fig. 2. Then, with the axial load applied, a
transverse displacement was chosen to correspond
to a desired maximum strain level at the beginning of
the tapered region, ply ending 111; i.e., gage 4 or 4a
of fig. 2. This region is chosen for comparison with
baseline fullscale flexbeam data, which references
strains at this location. The maximum strain levels
for fatigue testing were between 5628 µε and 8000
µε. A minimum transverse displacement was chosen
to give an R-ratio (εmin/εmax) of approximately R=0.1 at
gage 4 for each test. Asymmetric loading was used
in this study, rather than fully-reversed (R=-1) to more
accurately simulate the actually loading experienced
by a flexbeam in flight, and for better comparison with
material characterization data from fatigue 4ENF
tests at R=-0.1.
Prior to fatigue tests, the specimen edges were
painted with a thin coating of white paint, which is
brittle and makes delaminations easier to see. The
axial load was applied first, at a loading rate of 2.22
kN/sec (500 lb./sec). Then the transverse stroke was
applied to achieve the mean transverse

displacement. The transverse stroke was then
applied sinusoidally, at a frequency of 3 Hz.
During the fatigue testing, the axial and transverse
loads were briefly monitored to verify the repeatability
and accuracy of the loads chosen from the static
excursions. A representative axial and transverse
load-time history is plotted in fig. 6, at N=24732
cycles into the test, for a prescribed axial tension load
of 35.14 kN (7900 lbs.). Good repeatability of the
loading by the Teststar controller (2%) was observed.
However, fig. 6 indicates the axial load is not held
constant as the cyclic transverse load is applied.
Rather, the axial load varies by about ± 21 %, from
27.76 kN (6240 lbs.) to 42.70 kN (9600 lbs). The
actual fatigue loads were recorded and used in
subsequent analysis.
ANALYSIS
Finite Element Model
A brief summary of the finite element model is
provided. The model was developed to duplicate the
nonlinear tapered geometry of the flexbeam and the
boundary conditions of the loading apparatus. The
model, generated using the PATRAN (v8.0) modeling
software and shown in fig. 7, was 2D and was
symmetric about the midplane. Individual plies were
modeled such that the two outermost ply-ending
packs from each region of fig. 3 were discretely
created, using square elements and one element per
ply. The location of the ply-endings was determined
from design drawings, and the resin pocket size at
the end of terminated plies was estimated based on
average values from photomicrograph inspection. In
contrast, the plies near the centerline and below the
outermost ply endings are coarsely modeled, using
three layers of elements and merging plies in the
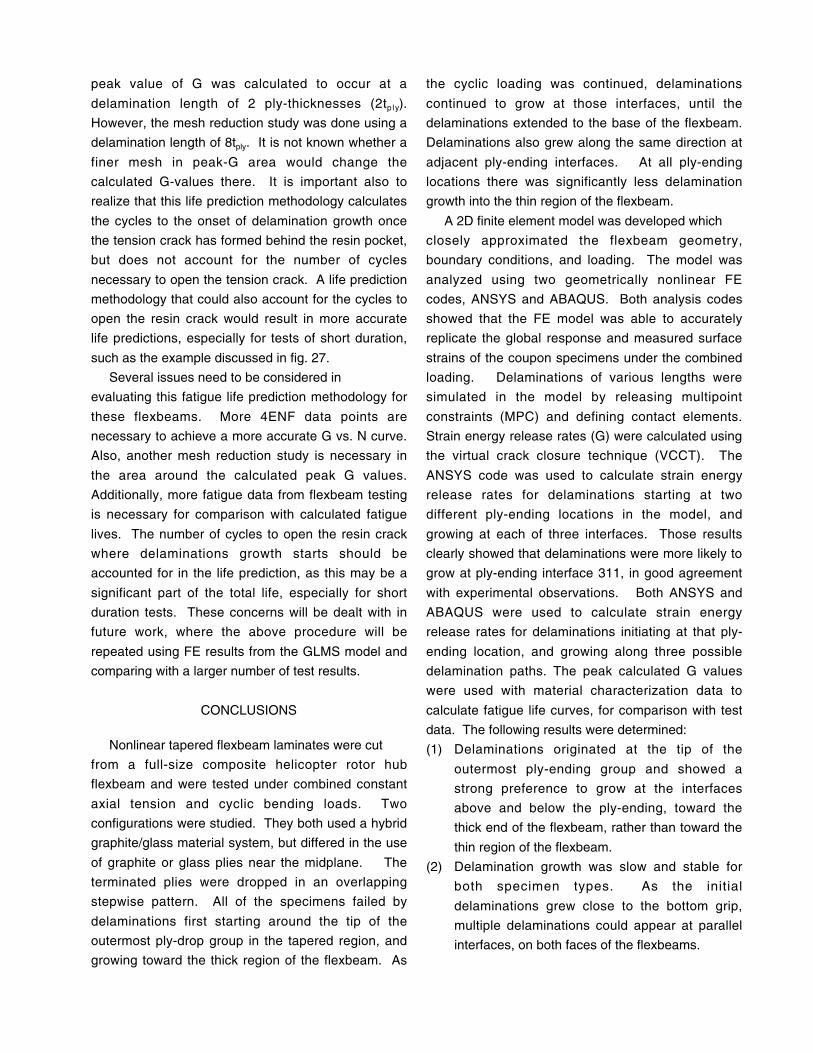
material definition. Figure 8 shows a close-up of the
finite element representation of ply-ending 111.
The model was analyzed using both the ANSYS
and ABAQUS FE packages. A two-dimensional
eight-noded plane-strain quadrilateral element was
used in both analyses. ANSYS and ABAQUS differ
in their implementation of element coordinate
systems, orthotropic materials, constraint equations,
and solution algorithms. A representative ply-ending
problem was solved by both FE codes and calculated
strain energy release rates agreed within 2%. For
combined tension-bending loading, a nonlinear
solution was used with stress stiffening and large
deformation options in both codes. Three-
dimensional orthotropic properties, i.e., x-z plane,
were determined based on the unidirectional elastic
constants given in Table 1, using laminated plate
theory to calculate smeared properties in the coarsely
meshed regions. In order to assign the correct
material properties to the elements in the tapered
region, a local coordinate system was assigned to
each element in the model, with the element 1-
direction parallel to the element side from the local
node i to local node i+1, as shown in fig. 8. The local
t-n coordinate system was then used to define the
material properties of each element.
For both analyses, fixed conditions were
simulated at the thick end of the model. For the
ANSYS model, beam elements, with EI=1.74E8 N-m2
(6.05E8 lb-in2), were used to simulate the ATB
loading fixture and upper grip, extending 172 mm
(6.75 in.) beyond the flexbeam tip, as shown in fig 5.
The axial and transverse forces were applied at the
tip of the beam model. For the ABAQUS analysis, the
upper grip and loading fixture are represented by
rectangular elements with a cross-section equal to
the thin end of the composite flexbeam. Those
elements representing the loading fixture were
assigned moduli to yield a bending stiffness, EI,
equivalent to the actual ATB fixtures. The axial
tension load was then applied to the free end of the
model as a distributed load and the transverse
bending was applied as a prescribed displacement in
the negative-y direction.
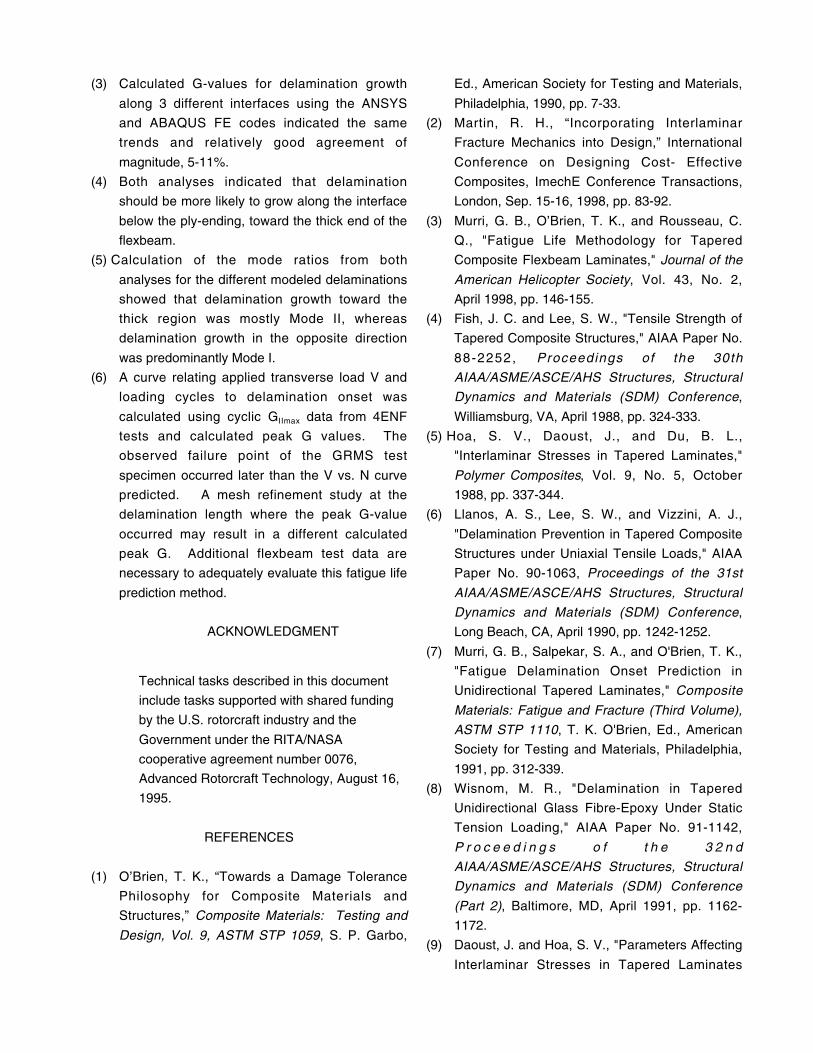
The manner in which the resin pocket is modeled
ahead of the ply-ending was an important detail in
model development. Figure 9 shows a micrograph of
the area around a ply-drop. To represent the resin
pocket, a right triangular region was meshed. Figure
9 shows that the thickness of the ply increases ahead
of the resin pocket as the ply ending is introduced.
Hard nodal points were created at ply-ending and
resin pocket regions to create a mesh that accounted
for the reduced fiber volume region ahead of the ply-
ending, while maintaining a smooth continuous slope

with the surface of the flexbeam. The size of the resin
pocket was estimated from photomicrograph
observations. The length of the resin zone in the FE
model and in the specimens varied from 11tply at ply-
ending 111, to 3.3tply at ply-ending 314. Typically the
resin pocket length for the first ply-ending in a given
ply-pack was larger than downstream ply-endings.
The ply-ending geometry was characterized for 12
specimens and significant variability was noted. For
example, the mean and standard deviation for ply-
ending 311 was measured as 6.07 tply and 2.20 tply,
respectively.
Strain Energy Release Rate Computation
In order to simulate a crack or delamination in
the flexbeam, multi-point constraint (MPC) nodes
were incorporated in the model at the interfaces
around ply-endings 111 and 311. Delaminations
were then simulated at those interfaces by
incrementally releasing the MPCs.
The Virtual Crack Closure Technique (VCCT) was
used to calculate strain energy release rates at each
step of simulated delamination growth. The VCCT
calculates the mode I (opening) and mode II (sliding
shear) components of strain energy release rate (GI
and GII, respectively), using the forces at the
delamination tip, and the relative displacements
behind the delamination tip. Figure 10 shows the
equations for GI and GII; as well as the forces at
nodes i and j; and the displacements at nodes l and
m, all in the n-t coordinate system. These nodal
forces and displacements were obtained from the
ABAQUS and ANSYS output files. Because these
flexbeams experience large deflections, the
displacements and forces must be measured in the
local coordinate system; i.e., the normal-tangential
(n-t) coordinate system for the deformed elements
(see fig. 10). Details of these calculations are given
in refs. 19 and 20. The total strain energy release
rate, G, is obtained by summing the individual mode
components. Hence,
G = GI + GII
since GIII=0 for plane strain conditions.
Mesh Refinement Study
A convergence study was performed using
ANSYS to determine the effect of the number of
elements per modeled ply in the region of the
delamination tip, on the calculated strain energy
release rate, G. A representative section of the finite
element model of the flexbeam was extracted for
study. Four mesh densities were considered in this
study: 1 element/ply, 2 element/ply, 4 element/ply,
and 8 element/ply.
A brief summary of the finite element model used
for the mesh refinement study is provided. A reduced
model section, representing the first two ply endings
(111 and 112) of the outboard taper region between
STA 28.393 to STA 30.024 of fig 2, was taken from
the full FE model. The model was fixed at STA
30.024 and constraint equations were applied at STA
28.393 to enforce a rigid plane at the specimen tip.
The axial and transverse forces were applied at the
tip and distributed by mass node and constraint
equations; Fx=-4.54 kN (-1020 lbs.), Fy=-0.489 kN
(-110 lbs.). For the combined axial and transverse
load case, a non-linear solution was executed with
stress stiffening and large deformation activated.
First, a model with 1 element/ply was analyzed for
several delamination lengths, where the crack started
from the resin tip and extended along the path toward
the ‘thin’ end of the flexbeam. GI and GI I were
calculated as a function of delamination length, a.
From this result a delamination length of a=8tply was
selected for the convergence study. The results are
shown in fig. 11 for GI and GII versus the number of
elements used per ply, at constant a=8tply. This length
was selected since GI and GII are nearly equal in
magnitude at a=8tply, thus the refinement study is
inclusive of both modes. As the figure shows,
increasing the number of elements from one per ply
to eight per ply causes a change in GI and GII of
4.7%. These results indicate that a mesh of 1
element/ply was adequate for the analysis using 2D
higher-order elements.
RESULTS
Global Response
Combined tension-bending fatigue testing was
performed on three specimens: a 203.2 mm (8-inch)

long GRMS, and two 165.1 mm (6.5 inch) long GLMS
specimens (GLMS1 and GLMS2). Surface strains in
the FE model were calculated using both the
ABAQUS and ANSYS analyses and were compared
to measured values from the static testing to
determine how accurately the model reproduced the
global behavior of the test specimens. Figure 12
shows the measured and predicted transverse
displacement, v, of the GRMS specimen tip for a
prescribed fixed axial load and varying transverse
load, V, from the ANSYS and ABAQUS analyses.
Overall, the global response of the specimen and
ATB fixture is well predicted by the FE result.
Figure 13 shows the strain comparisons along the
length of the flexbeam for GRMS specimen.
Measured and calculated results are shown at an
axial load of 42.7 kN (9610 lbs.) and a transverse
displacement of -60.7 mm (-2.39 inches). As the
figure shows, the ANSYS and ABAQUS results are
almost identical, and are in good agreement with the
measured strains for both the tension and
compression surfaces of the flexbeam. The
maximum surface strains occurred in the thinner
region of the taper, at approximately 53 mm from the
bottom grip, near gages 3 and 3a in fig. 2. Similarly,
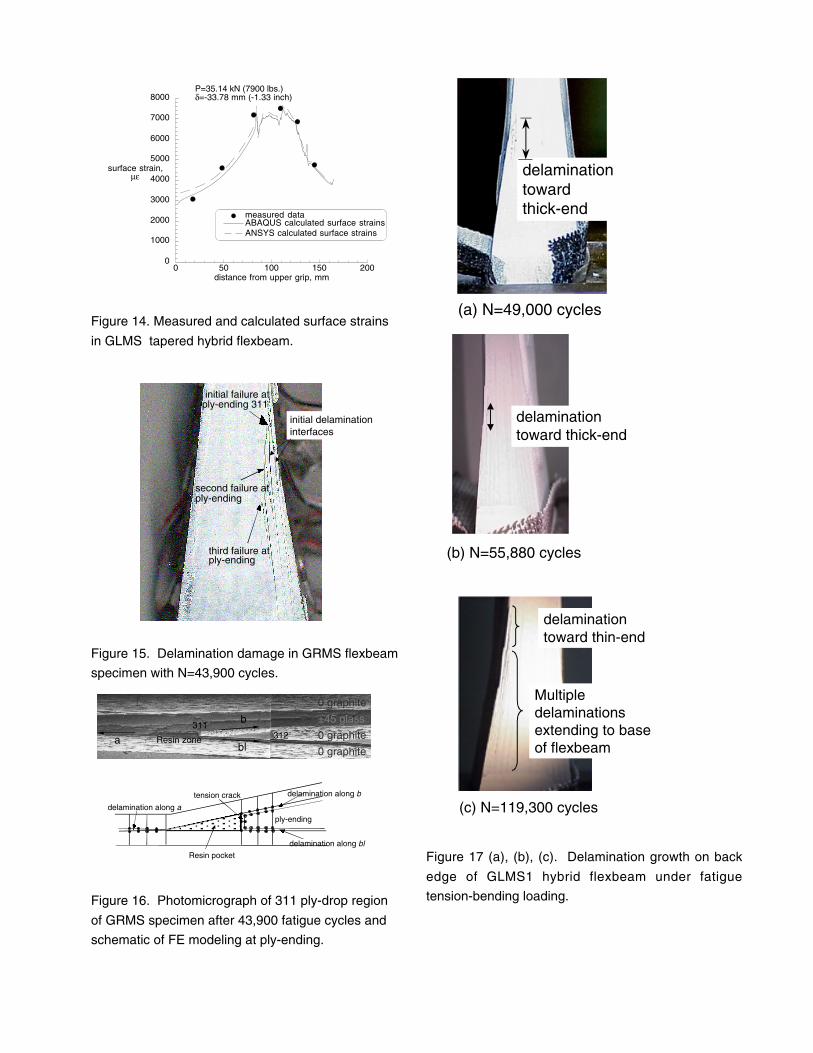
fig. 14 shows equally good results for the tension
surface of the GLMS1 specimen. Based on these
results, the FE models appear to duplicate the global
response of the specimens under loading in the ATB
very well.
Fatigue Tests
The specimens were visually monitored
periodically for delamination onset and growth
throughout the fatigue loading cycle. Both the left
and right edges were monitored. In all three tested
specimens, the initial damage occurred on the
“tension” side of the specimen, in the tapered region.
The location of the initial damage site along the
length was the same for all the specimens, and
suggested that the delamination had started at ply-
ending 311. For all the specimens, the damage was
visible on both edges of the specimen, (left and right),
at the same location, and had the same general
appearance, indicating that uniform length
delaminations had formed across the width of the
specimen. Once the initial damage formed, the
delaminations always tended to grow toward the thick
end of the laminate. In all cases the delamination
growth was very slow and stable. Very little
delamination growth was observed to grow from the
initiation site toward the thin end of the flexbeam (see
fig. 16).
The GRMS specimen was fatigue tested with a
constant axial load of 42.52 kN (9560 lbs.) and cyclic
transverse load from -8.76 kN to 1.638 kN (-1970 lbs.
to 368 lbs.). This corresponded to maximum and
minimum surface strains at gage 2 of 8000 and 1010
µε, respectively, with an R-ratio of 0.126. The
specimen was inspected at N=2900 cycles and
damage was already visible on the “tension” side of
the specimen, in the area near ply ending 311. At
first the delamination was evident on the one edge
only. As the fatigue loading continued, damage
became evident at the corresponding location on the
other edge also, and delaminations could be
observed growing toward the thick end of the
flexbeam. By N=28,855 cycles, delaminations
existed at the interfaces above and below ply-ending
311, and had grown almost all the way to the bottom
grip. Figure 15 shows the specimen after N=43,900
cycles. Along with the initial delamination surfaces,
several more delaminations had formed at
neighboring interfaces between the original interfaces
and the midplane. These delaminations appeared to
have started at ply-ending locations 321 and 331.
Fatigue testing was continued to N=281,000 cycles,
at which point there was extensive delamination
damage in the tapered region on both edges, but no
unstable delamination growth or catastrophic failure.
Figure 16 shows a photomicrograph of the area
around ply-ending 311. Inspection of the
photomicrograph suggests that the damage began as
a tension crack behind the resin pocket. The likely
delamination interfaces are labeled in fig. 16 as the
interface under 311 (labeled interface bl), the
interface above 311 (interface b), or the interface
forward from the tip of the resin pocket toward the
thin region of the flexbeam (interface a). Results for
the GRMS specimen indicate a preference for growth
along interface bl, based on experimental observation
and delamination length compared to interfaces a
and b.
The GLMS1 specimen was fatigue tested under a
constant axial load of 35.14 kN (7900 lbs.) and cyclic
transverse load between -5.68kN and 2.15 kN (-1277
lbs. to 483 lbs). This corresponded to maximum and
minimum surface strains at gage 2 of 6859 and 673
µε, respectively (R=0.098). The fatigue test resulted
in delamination initiation on the left and right edges of
the specimen at 22,000 cycles and 27,686 cycles,
respectively. The initial damage occurred at the
same location along the length as for the GRMS
specimen. As the fatigue testing was continued,
delaminations grew from this damage site, toward the
thick end of the flexbeam. Figure 17 shows
photographs of the delamination damage at three
different values of N. As the photos show,
delaminations were much more inclined to grow
along interfaces b and bl, than along interface a,
similar to the GRMS specimen, although there is a
small amount of detectable growth along a visible at
N=55,880 and at N=119,300.
The GLMS2 specimen was fatigue tested under
slightly less severe conditions than GLMS1, at a
constant axial load of 31.58 kN (7100 lbs.) and cyclic
transverse load between -4.45 kN and 1.63 kN (-
1000 lbs. to 367 lbs.). Those load levels resulted in
maximum and minimum surface strains at gage 2 of
5628 and 684 µε, respectively (R=0.121). For this
specimen, delamination could not be detected
visually until approximately N=330,00 cycles. At that
point, a tension crack at the resin pocket at ply-
ending 311 was faintly visible. By N=340,000 cycles,
delaminations were obvious along interfaces b and
bl, These delaminations grew slowly with continued
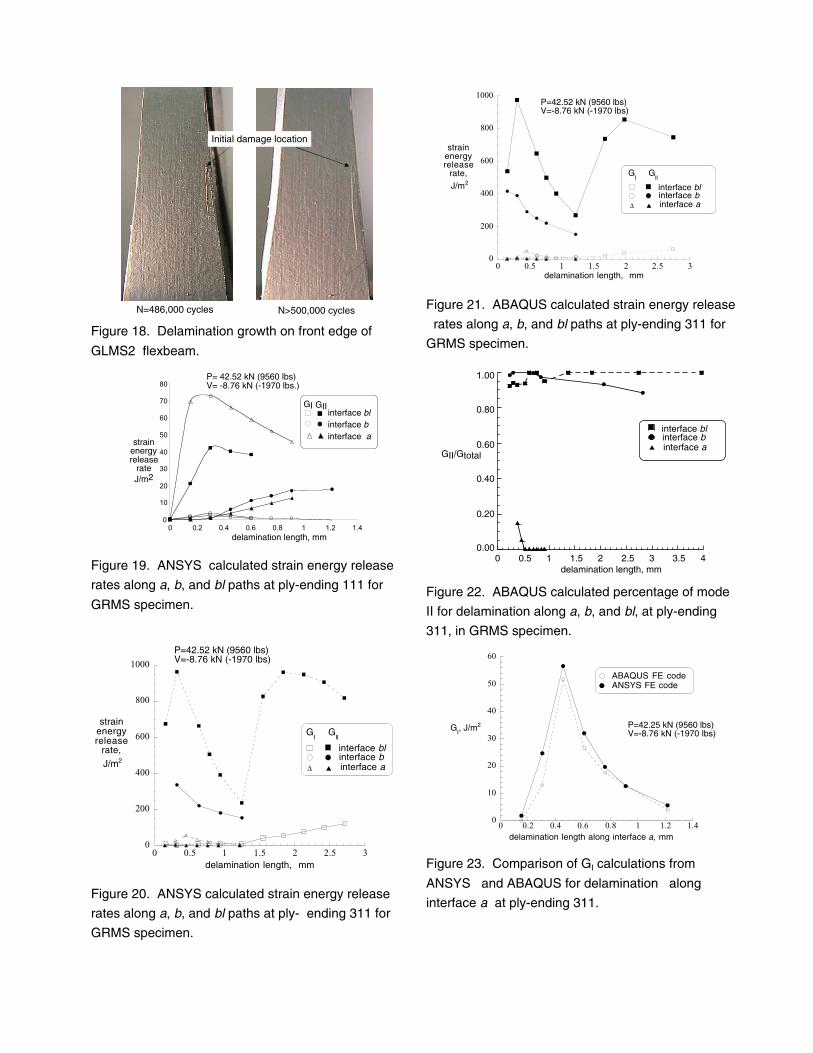
loading. Figure 18 shows photos of the front face at
N=486,00 cycles and at N>500,000 cycles. Unlike
specimens GRMS and GLMS1, delaminations did not
form at any other interfaces.
Strain Energy Release Rate Analysis
In this work, the strain energy release rate (SERR)
analysis had three purposes: quantify likely location
of delamination at a ply-ending group, identify the
expected delamination path, and predict the onset of
delamination. To accomplish the first goal,
comparisons of preliminary ANSYS SERR results at
two ply-ending locations were made, to identify the
critical location. Then detailed SERR analyses were
performed using both the ANSYS and ABAQUS
models for delaminations originating at the critical
location, and growing along multiple delamination
paths. In all cases, a resin crack was simulated at
the ply-ending by uncoupling the nodes along the
desired path. The tension crack that formed behind
the resin pocket was modeled by using separate
uncoupled nodes at the midside node location on the
adjoining elements at that location (see fig. 16).
The ANSYS GRMS model was used to obtain
strain energy release rates for delaminations initiating
from both ply-endings 111 and 311 and growing
along paths a, b, and bl, for loading conditions
P=42.52 kN (9560 lbs.) and V=-8.76 kN (-1970 lbs.)
and modeling the tension crack open behind the resin
pocket. Figure 19 shows GI and GII results for ply
ending 111 along paths a, b, and bl. In this analysis,
the peak value, 73 J/m2 (0.417 in-lb/in2), corresponds
to GI along path a at ply-ending 111 at length a=2tply.
Figure 20 shows the ANSYS results at ply-ending
311. The GII-value for delamination along bl reaches
a peak of 964 J/m2 (5.50 in-lb/in2) at a=2tply, then
reaches a second peak as the delamination
approaches the second ply-ending, 312. For
delaminations along interface b, a peak value of GII is
reached at the same delamination length as the bl
interface. As fig. 20 shows, delamination growth
along either b or b l is primarily mode II for this
analysis. The G-values for delamination along a are
very small compared to the other interfaces, and are
primarily mode I.
The ABAQUS analysis was also used to calculate
GI, GII, and mode ratio for delaminations growing
along a, b , and bl in the GRMS model. Individual
components of energy release rate and mode ratio
results are presented in fig. 21 and 22 for
completeness. The mode percentages, plotted in fig.
22 as GII/Gtotal, also follow the same trend as the
ANSYS model, with growth along b and bl
predominantly mode II, and along a predominantly
mode I. A quantitative comparison of ABAQUS and
ANSYS SERR solutions is provided later for critical
fracture modes and paths. A study of the SERR
results of both models suggests that based on the
magnitude of GII, the critical ply-ending location is
311. This was confirmed in the experiments, since no
delaminations formed at location 111 for any
specimen for the full duration of testing. The analysis
also showed that, of the three paths modeled,
delamination is most likely to occur along interface bl.
Strain energy release rate values along interface a
were very small compared to those along b and bl,
suggesting that delamination growth in that direction
is less likely. Both these trends were observed in the
test specimens. The results from these analyses
indicate that for a delamination initiating at location
311, delaminations are most likely to grow along
interface bl.
Figures 23-25 compare the ERR results from
ANSYS and ABAQUS for the dominant mode for
interfaces a, b, and bl, respectively. For delamination
along a, fig. 23 shows good agreement of the
magnitude and shape of the GI curves within 5%.
Similarly good agreement of both GII solutions is
shown in fig. 24 for the b interface. Figure 25
compares the GII results for a delamination along bl.
The trends of the two curves are similar and the first
peak is well matched. However, the values at the
second peak location are reasonable, i.e., within
11%. The labels at the top of fig. 25 show the
changing nature of the interface where delamination
bl grows (i. e., between two graphite plies, or
between resin and a ply). As the curves show, as a
resin pocket is encountered, G-values decrease; then
they increase again as the delamination approaches
a new ply-ending, reaching a peak, and then
decreasing as the delamination tip approaches
another resin pocket.
The trends observed in this study are similar to
those observed in ref. 3, for a different nonlinear
tapered flexbeam, where the terminated plies were
dropped in a non-uniform staggered manner, and the
ply-ending was modeled as a group with smeared
properties, rather than as individual dropped plies. In
that study, delaminations grew first toward the thick
end of the laminate, at the interfaces above and
below the ply-ending group. The results from the FE
model in ref. 3 showed that delamination toward the
thick end was largely mode II, and toward the thin
region was primarily mode I.
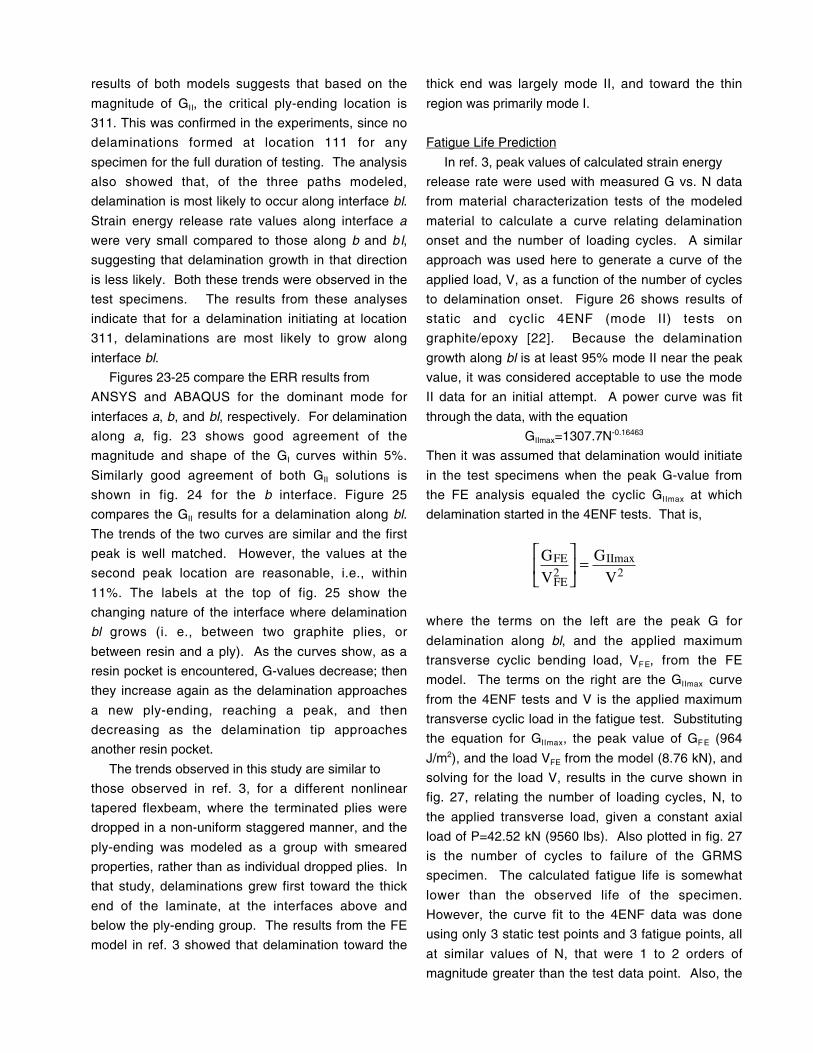
Fatigue Life Prediction
In ref. 3, peak values of calculated strain energy
release rate were used with measured G vs. N data
from material characterization tests of the modeled
material to calculate a curve relating delamination
onset and the number of loading cycles. A similar
approach was used here to generate a curve of the
applied load, V, as a function of the number of cycles
to delamination onset. Figure 26 shows results of
static and cyclic 4ENF (mode II) tests on
graphite/epoxy [22]. Because the delamination
growth along bl is at least 95% mode II near the peak
value, it was considered acceptable to use the mode
II data for an initial attempt. A power curve was fit
through the data, with the equation
GIImax=1307.7N-0.16463
Then it was assumed that delamination would initiate
in the test specimens when the peak G-value from
the FE analysis equaled the cyclic GIImax at which
delamination started in the 4ENF tests. That is,
FE
FE
IImax2
GV
GV2
=
where the terms on the left are the peak G for
delamination along bl, and the applied maximum
transverse cyclic bending load, VF E, from the FE
model. The terms on the right are the GIImax curve
from the 4ENF tests and V is the applied maximum
transverse cyclic load in the fatigue test. Substituting
the equation for GIImax, the peak value of GF E (964
J/m2), and the load VFE from the model (8.76 kN), and
solving for the load V, results in the curve shown in
fig. 27, relating the number of loading cycles, N, to
the applied transverse load, given a constant axial
load of P=42.52 kN (9560 lbs). Also plotted in fig. 27
is the number of cycles to failure of the GRMS
specimen. The calculated fatigue life is somewhat
lower than the observed life of the specimen.
However, the curve fit to the 4ENF data was done
using only 3 static test points and 3 fatigue points, all
at similar values of N, that were 1 to 2 orders of
magnitude greater than the test data point. Also, the
peak value of G was calculated to occur at a
delamination length of 2 ply-thicknesses (2tply).
However, the mesh reduction study was done using a
delamination length of 8tply. It is not known whether a
finer mesh in peak-G area would change the
calculated G-values there. It is important also to
realize that this life prediction methodology calculates
the cycles to the onset of delamination growth once
the tension crack has formed behind the resin pocket,
but does not account for the number of cycles
necessary to open the tension crack. A life prediction
methodology that could also account for the cycles to
open the resin crack would result in more accurate
life predictions, especially for tests of short duration,
such as the example discussed in fig. 27.
Several issues need to be considered in
evaluating this fatigue life prediction methodology for
these flexbeams. More 4ENF data points are
necessary to achieve a more accurate G vs. N curve.
Also, another mesh reduction study is necessary in
the area around the calculated peak G values.
Additionally, more fatigue data from flexbeam testing
is necessary for comparison with calculated fatigue
lives. The number of cycles to open the resin crack
where delaminations growth starts should be
accounted for in the life prediction, as this may be a
significant part of the total life, especially for short
duration tests. These concerns will be dealt with in
future work, where the above procedure will be
repeated using FE results from the GLMS model and
comparing with a larger number of test results.
CONCLUSIONS
Nonlinear tapered flexbeam laminates were cut
from a full-size composite helicopter rotor hub
flexbeam and were tested under combined constant
axial tension and cyclic bending loads. Two
configurations were studied. They both used a hybrid
graphite/glass material system, but differed in the use
of graphite or glass plies near the midplane. The
terminated plies were dropped in an overlapping
stepwise pattern. All of the specimens failed by
delaminations first starting around the tip of the
outermost ply-drop group in the tapered region, and
growing toward the thick region of the flexbeam. As
the cyclic loading was continued, delaminations
continued to grow at those interfaces, until the
delaminations extended to the base of the flexbeam.
Delaminations also grew along the same direction at
adjacent ply-ending interfaces. At all ply-ending
locations there was significantly less delamination
growth into the thin region of the flexbeam.
A 2D finite element model was developed which
closely approximated the flexbeam geometry,
boundary conditions, and loading. The model was
analyzed using two geometrically nonlinear FE
codes, ANSYS and ABAQUS. Both analysis codes
showed that the FE model was able to accurately
replicate the global response and measured surface
strains of the coupon specimens under the combined
loading. Delaminations of various lengths were
simulated in the model by releasing multipoint
constraints (MPC) and defining contact elements.
Strain energy release rates (G) were calculated using
the virtual crack closure technique (VCCT). The
ANSYS code was used to calculate strain energy
release rates for delaminations starting at two
different ply-ending locations in the model, and
growing at each of three interfaces. Those results
clearly showed that delaminations were more likely to
grow at ply-ending interface 311, in good agreement
with experimental observations. Both ANSYS and
ABAQUS were used to calculate strain energy
release rates for delaminations initiating at that ply-
ending location, and growing along three possible
delamination paths. The peak calculated G values
were used with material characterization data to
calculate fatigue life curves, for comparison with test
data. The following results were determined:
(1) Delaminations originated at the tip of the
outermost ply-ending group and showed a
strong preference to grow at the interfaces
above and below the ply-ending, toward the
thick end of the flexbeam, rather than toward the
thin region of the flexbeam.
(2) Delamination growth was slow and stable for
both specimen types. As the initial
delaminations grew close to the bottom grip,
multiple delaminations could appear at parallel
interfaces, on both faces of the flexbeams.
(3) Calculated G-values for delamination growth
along 3 different interfaces using the ANSYS
and ABAQUS FE codes indicated the same
trends and relatively good agreement of
magnitude, 5-11%.
(4) Both analyses indicated that delamination
should be more likely to grow along the interface
below the ply-ending, toward the thick end of the
flexbeam.
(5) Calculation of the mode ratios from both
analyses for the different modeled delaminations
showed that delamination growth toward the
thick region was mostly Mode II, whereas
delamination growth in the opposite direction
was predominantly Mode I.
(6) A curve relating applied transverse load V and
loading cycles to delamination onset was
calculated using cyclic GIImax data from 4ENF
tests and calculated peak G values. The
observed failure point of the GRMS test
specimen occurred later than the V vs. N curve
predicted. A mesh refinement study at the
delamination length where the peak G-value
occurred may result in a different calculated
peak G. Additional flexbeam test data are
necessary to adequately evaluate this fatigue life
prediction method.
ACKNOWLEDGMENT
Technical tasks described in this document
include tasks supported with shared funding
by the U.S. rotorcraft industry and the
Government under the RITA/NASA
cooperative agreement number 0076,
Advanced Rotorcraft Technology, August 16,
1995.
REFERENCES
(1) O’Brien, T. K., “Towards a Damage Tolerance
Philosophy for Composite Materials and
Structures,” Composite Materials: Testing and
Design, Vol. 9, ASTM STP 1059, S. P. Garbo,
Ed., American Society for Testing and Materials,
Philadelphia, 1990, pp. 7-33.
(2) Martin, R. H., “Incorporating Interlaminar
Fracture Mechanics into Design,” International
Conference on Designing Cost- Effective
Composites, ImechE Conference Transactions,
London, Sep. 15-16, 1998, pp. 83-92.
(3) Murri, G. B., O’Brien, T. K., and Rousseau, C.
Q., "Fatigue Life Methodology for Tapered
Composite Flexbeam Laminates," Journal of the
American Helicopter Society, Vol. 43, No. 2,
April 1998, pp. 146-155.
(4) Fish, J. C. and Lee, S. W., "Tensile Strength of
Tapered Composite Structures," AIAA Paper No.
88-2252, Proceedings of the 30th
AIAA/ASME/ASCE/AHS Structures, Structural
Dynamics and Materials (SDM) Conference,
Williamsburg, VA, April 1988, pp. 324-333.
(5) Hoa, S. V., Daoust, J., and Du, B. L.,
"Interlaminar Stresses in Tapered Laminates,"
Polymer Composites, Vol. 9, No. 5, October
1988, pp. 337-344.
(6) Llanos, A. S., Lee, S. W., and Vizzini, A. J.,
"Delamination Prevention in Tapered Composite
Structures under Uniaxial Tensile Loads," AIAA
Paper No. 90-1063, Proceedings of the 31st
AIAA/ASME/ASCE/AHS Structures, Structural
Dynamics and Materials (SDM) Conference,
Long Beach, CA, April 1990, pp. 1242-1252.
(7) Murri, G. B., Salpekar, S. A., and O'Brien, T. K.,
"Fatigue Delamination Onset Prediction in
Unidirectional Tapered Laminates," Composite
Materials: Fatigue and Fracture (Third Volume),
ASTM STP 1110, T. K. O'Brien, Ed., American
Society for Testing and Materials, Philadelphia,
1991, pp. 312-339.
(8) Wisnom, M. R., "Delamination in Tapered
Unidirectional Glass Fibre-Epoxy Under Static
Tension Loading," AIAA Paper No. 91-1142,
P r o c e e d i n g s o f t h e 3 2 n d
AIAA/ASME/ASCE/AHS Structures, Structural
Dynamics and Materials (SDM) Conference
(Part 2), Baltimore, MD, April 1991, pp. 1162-
1172.
(9) Daoust, J. and Hoa, S. V., "Parameters Affecting
Interlaminar Stresses in Tapered Laminates

Under Static Loading Conditions," Polymer
Composites, Vol. 10, No. 5, October 1989, pp.
374-383.
(10) Trethewey, B. R., Jr; Gillespie, J. W., Jr; and
Wilkins, D. J., "Interlaminar Performance of
Tapered Composite Laminates," Proceedings of
the American Society for Composites, 5th
Technical Conference, East Lansing, MI, June
1990, pp. 361-372.
(11) Botting, A. D., Vizzini, A. J., and Lee, S. W.,
“The Effect of Ply-Drop Configuration on the
Delamination Strength of Tapered Composite
S t r u c t u r e s , ” Proceed ings o f t he
AIAA/AHS/ASME/ASCE/ASC 33rd Structures,
Structural Dynamics and Materials Conference,
Dallas, TX, Apr. 1992, pp. 40-47.
(12) Fish, J. C. and Vizzini, A. J., “Delamination of
Ply-Drop Configurations,” Composite Materials:
Testing and Design (Eleventh Volume), ASTM
STP 1206, E. T. Camponeshi, Jr., Ed., American
Society for Testing and Materials, Philadelphia,
1993, pp. 323-332.
(13) Kemp, B. L. and Johnson, E. R., "Response and
Failure Analysis of a Graphite-Epoxy Laminate
Containing Terminating Internal Plies," AIAA
Paper No. 85-0608, Proceedings of the 26th
AIAA/ASME/ASCE/AHS Structures, Structural
Dynamics and Materials (SDM) Conference,
Orlando, FL, April 1985, pp. 13-24.
(14) Curry, J. M., Johnson, E. R., and Starnes, J. H.,
"Effect of Dropped Plies on the Strength of
Graphite-Epoxy Laminates," Proceedings of the
29th AIAA/ASME/ASCE/-9AHS Structures,
Structural Dynamics and Materials (SDM)
Conference, Monterey, CA, April 1987, pp. 737-
747.
(15) Armanios, E. A. and Parnas, L., "Delamination
Analysis of Tapered Laminated Composites
Under Tensile Loading,” Composite Materials:
Fatigue and Fracture (Third Volume), ASTM
STP 1110, T. K. O'Brien, Ed., American Society
for Testing and Materials, Philadelphia, 1991,
pp. 340-358.
(16) Salpekar, S. A., Raju, I. S., and O'Brien, T. K.,
"Strain Energy Release Rate Analysis of
Delamination in a Tapered Laminate Subjected
to Tension Load," Proceedings of the American
Society for Composites, Third Technical
Conference, Seattle, WA, Sept. 1988, pp. 642-
654.
(17) Murri, G. B., O'Brien, T. K., and Salpekar, S. A.,
"Tension Fatigue of Glass/Epoxy and
Graphite/Epoxy Tapered Laminates," Journal of
the American Helicopter Society, Vol. 38, No. 1,
Jan. 1993, pp. 29-37.
(18) O'Brien, T. K., Murri, G. B., Hagemeier, R., and
Rogers, C., "Combined Tension and Bending
Testing of Tapered Composite Laminates,"
Applied Composite Materials, Vol. 1, No. 6,
1995, pp. 401-413.
(19) Rybicki, E. F., and Kanninen, M. F., "A Finite
Element Calculation of Stress-Intensity Factors
by a Modified Crack-Closure Integral,"
Engineering Fracture Mechanics, Vol. 9, 1977,
pp. 931-938.
(20) Raju, I. S., “Simple Formulas for Strain-Energy
Release Rates with Higher Order and Singular
Finite Elements,” NASA Contractor Report
178186, December 1986.
(21) Krueger, R., Minguet, P. J., and O’Brien, T. K.,
“A Method for Calculating Strain Energy Release
Rates in Preliminary Design of Composite
Skin/Stringer Debonding Under Multiaxial
Loading,” Composite Structures: Theory and
Practice, ASTM STP 1383, P. Grant and C. Q.
Rousseau, Eds., American Society for Testing
and Materials, West Conshohocken, PA, 2000,
pp. 105-128.
(22) Hansen, P., and Martin, R., “DCB, 4ENF, and
MMB Delamination Characterisation of S2/8552
and IM7/8552,” Materials Engineering Research
Laboratory Ltd. (MERL), Hertford, U.K., N68171-
98-M-5177, 1999.

Figure 1. Hybrid tapered flexbeam test specimen.
BOTTOM GRIP“Outboard”
101.600 mm(4.00 in)
77.724 mm(3.06 in)
76.200 mm(3.0 in)
87.376 mm(3.44 in)
TOP GRIP“Inboard” 8 5 4 3 2 16
7
8a 4a 3a 2a 1a
0.00 96.52 127.00 160.02 187.96 223.52 342.90
STA23.34 27.14 28.34 29.64 30.74 32.14 STA36.84
5a6a
7aDistance from tip (mm)
115.8 mm (4.56 in)for GRMS specimen
205.74
31.44
Figure 2. Schematic of glass midplane specimen
(GLMS) with net dimensions and strain gages.
Region 1 Region 2 Region 3
111 3115.59 mm
1st ply-ending
2nd ply-ending
1st ply-ending
2nd ply-endingresin pocket
Figure 3. Photograph of edge of hybrid composite
flexbeam with internal ply-drops.
Crosshead
Specimen Top grip
Transverse actuator
Axial actuator
Axial load cell
Bottom grip
(a) schematic (b) deformed specimen
Figure 4. Axial tension and bending test stand
(ATB) and deformed flexbeam specimen.
X
V
165 or 203 mm
337 or 375 mm
172 mm
taper
v
P
δ
Bottom grip
Load cell
Top grip
Pin assembly
P
θ
Yflexbeamwith strain
gages
thin
Figure 5. Schematic of test specimen and loading
fixtures with combined loading.
-10
0
10
20
30
40
50
0.0 0.1 0.2 0.3 0.4 0.5 0.6
fatigueloadkN
time, seconds
axial load
transverse load
Figure 6. Typical load-time history of GLMS
specimen under axial tension and cyclic bending
fatigue loading.
Note: Not to scale
X
YY
Figure 7. Finite element model of GLMS specimen:
full model (above) and taper region showing discrete
materials by color.
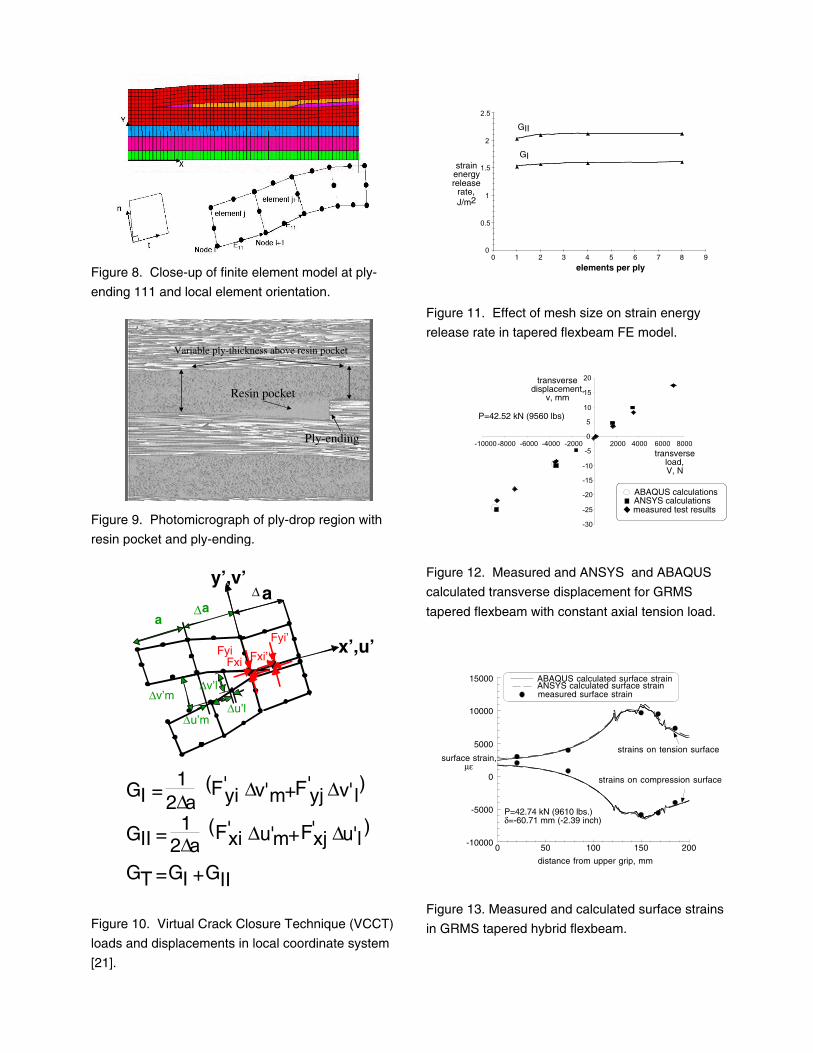
Figure 8. Close-up of finite element model at ply-
ending 111 and local element orientation.
Resin pocket
Ply-ending
Variable ply-thickness above resin pocket
Figure 9. Photomicrograph of ply-drop region with
resin pocket and ply-ending.
y’,v’
x’,u’’
’
a∆a
∆ a
∆v’m∆v’l
∆u’m∆u’l
FyiFxi Fxi’
Fyi’
GI =1
2∆a yi'F ∆v'm+ yj
'F ∆v' l( )
GII = 12∆a xi'F ∆u'm+ xj'F ∆u'l
( )
GT =GI +GII
Figure 10. Virtual Crack Closure Technique (VCCT)
loads and displacements in local coordinate system
[21].
0
0.5
1
1.5
2
2.5
0 1 2 3 4 5 6 7 8 9
elements per ply
GI
GII
strainenergyrelease
rate,J/m2
Figure 11. Effect of mesh size on strain energy
release rate in tapered flexbeam FE model.
-30
-25
-20
-15
-10
-5
0
5
10
15
20
-10000 -8000 -6000 -4000 -2000 2000 4000 6000 8000
transversedisplacement,
v, mm
transverseload,V, N
P=42.52 kN (9560 lbs)
measured test resultsANSYS calculationsABAQUS calculations
Figure 12. Measured and ANSYS and ABAQUS
calculated transverse displacement for GRMS
tapered flexbeam with constant axial tension load.
-10000
-5000
0
5000
10000
15000
0 50 100 150 200
surface strain,µε
distance from upper grip, mm
strains on tension surface
strains on compression surface
P=42.74 kN (9610 lbs.)δ=-60.71 mm (-2.39 inch)
ABAQUS calculated surface strain
measured surface strain ANSYS calculated surface strain
Figure 13. Measured and calculated surface strains
in GRMS tapered hybrid flexbeam.
0
1000
2000
3000
4000
5000
6000
7000
8000
0 50 100 150 200
surface strain,µε
distance from upper grip, mm
measured dataABAQUS calculated surface strainsANSYS calculated surface strains
P=35.14 kN (7900 lbs.)δ=-33.78 mm (-1.33 inch)
Figure 14. Measured and calculated surface strains
in GLMS tapered hybrid flexbeam.
initial failure at ply-ending 311
second failure at ply-ending
third failure at ply-ending
initial delaminationinterfaces
Figure 15. Delamination damage in GRMS flexbeam
specimen with N=43,900 cycles.
0 graphite
±45 glass
0 graphite
0 graphitea
b
blResin zone
311312
Resin pocket
delamination along b
delamination along bl
delamination along a
tension crack
ply-ending
Figure 16. Photomicrograph of 311 ply-drop region
of GRMS specimen after 43,900 fatigue cycles and
schematic of FE modeling at ply-ending.
(a) N=49,000 cycles
delamination towardthick-end
(b) N=55,880 cycles
delamination toward thick-end
(c) N=119,300 cycles
delamination toward thin-end
Multipledelaminationsextending to baseof flexbeam
Figure 17 (a), (b), (c). Delamination growth on back
edge of GLMS1 hybrid flexbeam under fatigue
tension-bending loading.
Initial damage location
N=486,000 cycles N>500,000 cycles
Figure 18. Delamination growth on front edge of
GLMS2 flexbeam.
0
10
20
30
40
50
60
70
80
0 0.2 0.4 0.6 0.8 1 1.2 1.4delamination length, mm
111 a g1111 a g2111b g1111b g2111bl g1111bl g2
strainenergyrelease
rateJ/m2
P= 42.52 kN (9560 lbs)V= -8.76 kN (-1970 lbs.)
GI GIIinterface bl
interface ainterface b
Figure 19. ANSYS calculated strain energy release
rates along a, b, and bl paths at ply-ending 111 for
GRMS specimen.
0
200
400
600
800
1000
0 0.5 1 1.5 2 2.5 3
strainenergyrelease
rate,
J/m2
delamination length, mm
P=42.52 kN (9560 lbs)V=-8.76 kN (-1970 lbs)
GI G
II
�∆
interface blinterface binterface a
Figure 20. ANSYS calculated strain energy release
rates along a, b, and bl paths at ply- ending 311 for
GRMS specimen.
0
200
400
600
800
1000
0 0.5 1 1.5 2 2.5 3
strainenergyrelease
rate,
J/m2
delamination length, mm
P=42.52 kN (9560 lbs)V=-8.76 kN (-1970 lbs)
GI G
II
�∆
interface blinterface binterface a
Figure 21. ABAQUS calculated strain energy release
rates along a, b, and bl paths at ply-ending 311 for
GRMS specimen.
0.00
0.20
0.40
0.60
0.80
1.00
0 0.5 1 1.5 2 2.5 3 3.5 4delamination length, mm
�
interface blinterface binterface a
GII/Gtotal
Figure 22. ABAQUS calculated percentage of mode
II for delamination along a, b, and bl, at ply-ending
311, in GRMS specimen.
0
10
20
30
40
50
60
0 0.2 0.4 0.6 0.8 1 1.2 1.4
GI, J/m2
delamination length along interface a, mm
ABAQUS FE codeANSYS FE code
P=42.25 kN (9560 lbs)V=-8.76 kN (-1970 lbs)
Figure 23. Comparison of GI calculations from
ANSYS and ABAQUS for delamination along
interface a at ply-ending 311.

0
100
200
300
400
500
0 0.2 0.4 0.6 0.8 1 1.2 1.4
GII, J/m2
delamination length along interface bl, mm
ABAQUS FE codeANSYS FE code
P=42.25 kN (9560 lbs)V=-8.76 kN (-1970 lbs)
Figure 24. Comparison of GII calculations from
ANSYS and ABAQUS for delamination along
interface b at ply-ending 311.
200
300
400
500
600
700
800
900
1000
0 0.5 1 1.5 2 2.5 3
GII, J/m2
delamination length along interface bl, mm
ABAQUS FE codeANSYS FE code
P=42.25 kN (9560 lbs)V=-8.76 kN (-1970 lbs)
ply/ply
resin/ply ply/ply
new ply-
ending
resinpocket
tip
Figure 25. Comparison of GII calculations from
ANSYS and ABAQUS for delamination along
interface bl at ply-ending 311.
0
500
1000
1500
2000
1 10 100 1000 104 105 106
GIImax
, J/m2
cycles, N
GIImax
(N)=1307.7N -0.16463
R=0.9555
4ENF data from ref. 22
Figure 26. Delamination onset data and fitted curve
for cyclic mode II 4ENF tests of graphite/epoxy.
0.00
2.00
4.00
6.00
8.00
10.00
12.00
1 10 100 1000 104 105 106
V, kN
loading cycles, N
observed delamination onsetin GRMS specimen
N=2900N=6
Figure 27. Fatigue life vs. transverse bending load
for tapered hybrid flexbeam laminate with constant
axial tension load.