fatigue behaviour of clinched joints · supported by fem analyses of the clinched joints....
TRANSCRIPT

ECF15
FATIGUE BEHAVIOUR OF CLINCHED JOINTS
M. Carboni, S. Beretta, M. MonnoPolitecnico di Milano
Via La Masa 34, 20158 Milano, [email protected], [email protected], [email protected]
AbstractThe last years have seen the development of a new generation of industrial interestingmechanical joining techniques for thin sheets such as self piercing riveting, clinching,friction stir welding and laser welding. The present work concentrates on fatigue behaviourof joints obtained by clinching, a cold welding technology for thin sheets which is quicklydeveloping in automobile, electronic and white goods industries, even if mainly in terms ofstatic properties. The activity firstly dealt with fatigue tests and fractographic observationswhich evidenced different failure modes at different stress ratios. Results were thensupported by FEM analyses of the clinched joints.
IntroductionLightweight structures and high productive rate are two of the main goals for
automotive, electronic and white goods industries. The last years have seen thedevelopment, as an answer to the drawbacks of the more traditional spot welding, of a newgeneration of industrial interesting mechanical joining techniques for thin sheets (Barnesand Pashby [1, 2]), such as self piercing riveting, clinching, friction stir welding and laserwelding. For some of this new technologies, mechanical studies are present in literature (asan example for self piercing riveting see Fu and Mallick [3]), but for others not. From thispoint of view, the present work concentrates on fatigue behaviour of clinching, a coldwelding technology for thin sheets which is quickly developing in the industries mentionedabove (Fig.1).
FIGURE 1. Clinching in automotive industry.
Clinching technology allows to join two or more metal sheets (of the same or differentmaterial, up to a total joint thickness of about 5÷6 mm), whatever their surface condition is(painted, lubricated, coated or oxidised) and without any edge preparation. After the jointhas been made, there is no need for repainting the sheets or performing stress relievingtreatments. The joint is made by a punch (Fig. 2a) which, penetrating in a die, forces a slipin the sheets and the formation of the local permanent set (indentation), as shown in Fig.

ECF15
2b. The tools are designed in order to create an undercut which guarantees the mechanicalinterlock between the sheets. One of the main features of the clinching process is theabsence of thermal flow during the joint making, avoiding residual stresses inducted bythermal distortion and also grain flaws, such as coarsening. Compared to other joiningtechniques, clinching is a fast process, easy to automate, and so particularly suited whenhigh productivity is needed; moreover, since no welding material is used, there are nosupply or storage costs and chemical contamination of the joint is lower. The absence offumes, emissions or high currents also ensures high safety for the operator and a lowenvironmental impact. Finally, the quality of the joint can be investigated with simple nondestructive geometric checks of the indentation, like indentation bottom thicknessmeasurement. Drawbacks of this technology can be found in the fact that the maximumthickness that can be welded is 6 mm and that the maximum thickness for the singleinvolved sheet is 3 mm. Furthermore, during the process both the faces of the joint must befree in order to apply the technology to the component. From the structural point of view,it’s interesting to note (see Fig. 2b) that the sheets thickness in the button neck can becomevery thin respect to the original one: this is an important consideration (Bini et al. [4]) forthe shear strength against loads acting in the plane of the sheets.
(a)
2 mm
(b)
FIGURE 2. Schematic representation of the clinching process: a) technologicalprocess; b) section of a “clinched point” showing the indentation.
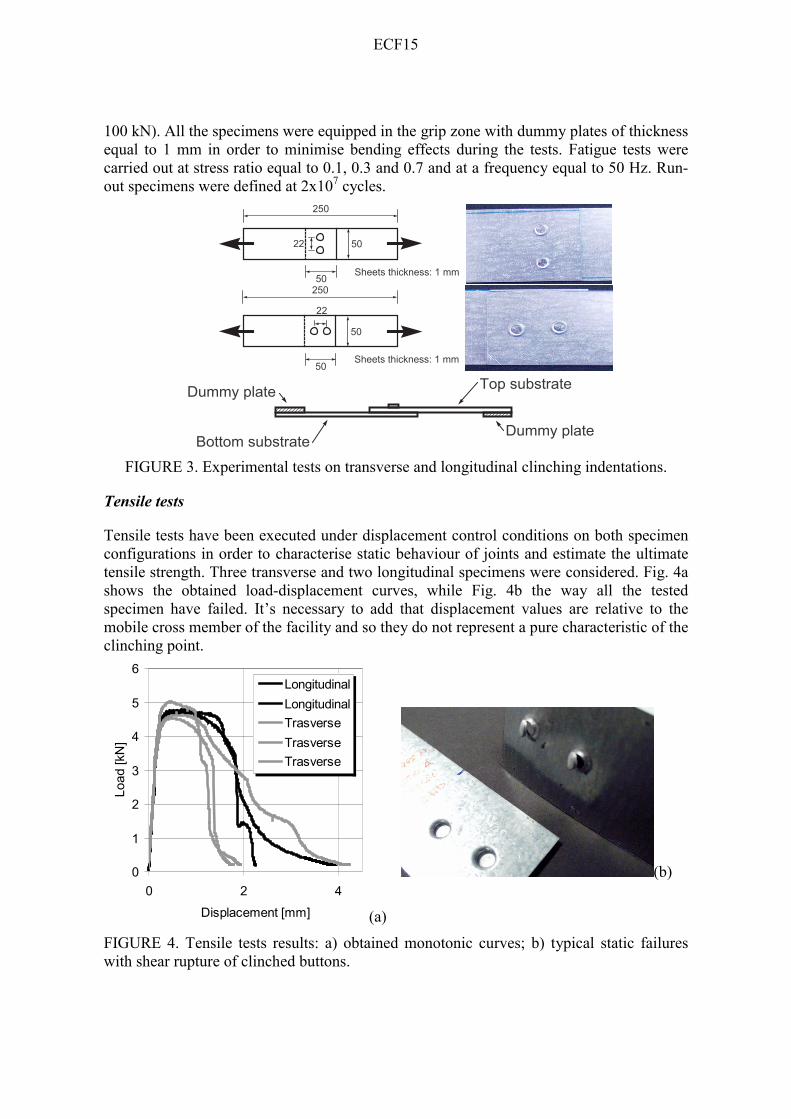
Experimental set-up and resultsIn order to analyse the mechanical behaviour of clinched joints, specimens consisting oftwo thin sheets (150x50x1 mm) made in FePO2 steel were considered. Particularly (Fig.3): i) the superimposed area of the top and bottom substrates is 50x50 mm; ii) the positionof the indentations was symmetrical in respect of the specimen axis; iii) the distancebetween the indentation points was equal to 22 mm. Transverse joints and longitudinaljoints were analysed in order to investigate the influence of load direction on strength ofjoints. All the indentations were realised using the same tools and pressing force equal to40 kN. Specimens were subjected to tensile tests and fatigue tests at different stress ratiosby means of an INSTRON8501 uni-axial servo-hydraulic facility (maximum nominal load
ECF15
100 kN). All the specimens were equipped in the grip zone with dummy plates of thicknessequal to 1 mm in order to minimise bending effects during the tests. Fatigue tests werecarried out at stress ratio equal to 0.1, 0.3 and 0.7 and at a frequency equal to 50 Hz. Run-out specimens were defined at 2x10⁷ cycles.
250
5022
50Sheets thickness: 1 mm
50
22
250
50
Sheets thickness: 1 mm
xxxxxxxxxxxxxxxxxxxx
Dummy plate
Dummy plate Top substrate
Bottom substrate
xxxxxx
xxxxxx
xxxxxxxxxxxxxxxxxxxxxxxxxxxxxx
xxxxxxxxxxxxxxxxxxxxxxxxxxxxxxxxxxxx
xxxxxxxxxxxxxxxxxxxxxxxxxxxxxx
FIGURE 3. Experimental tests on transverse and longitudinal clinching indentations.
Tensile tests
Tensile tests have been executed under displacement control conditions on both specimenconfigurations in order to characterise static behaviour of joints and estimate the ultimatetensile strength. Three transverse and two longitudinal specimens were considered. Fig. 4ashows the obtained load-displacement curves, while Fig. 4b the way all the testedspecimen have failed. It’s necessary to add that displacement values are relative to themobile cross member of the facility and so they do not represent a pure characteristic of theclinching point.
0
1
2
3
4
5
6
0 2 4
Displacement [mm]
Load
[kN
]
LongitudinalLongitudinalTrasverseTrasverseTrasverse
(a)
(b)
FIGURE 4. Tensile tests results: a) obtained monotonic curves; b) typical static failureswith shear rupture of clinched buttons.

ECF15
It seems that the ultimate stress is not dependent on joint configuration: a statisticalanalysis of the whole sample produced a mean value equal to 4.75 kN and a standarddeviation of 0.16 kN. Furthermore, also the curves shape are very similar: a macroscopicductile behaviour can be seen for both the two different joints and the Young’s Modulus isvery similar for all the tested specimens.
Fatigue tests
Fatigue tests have been carried out in order to define and to compare S-N curves. Ingeneral, given the applied maximum load during a single test, a specimen was consideredbroken when the displacement of the mobile cross member of the testing machine was 0.5mm higher than the one occurring in static tensile test performed with the same maximumload. Figs. 5a and 5b show the S-N curves obtained for the two indentation configurationsin terms of applied load range.
104 105 106 107 1080
1
2
3
4
5
Longitudinal
(a)
R=0.1 R=0.1: run-outs R=0.3 R=0.3: run-outs R=0.7: run-outs
∆P [k
N]
Cycles
103 104 105 106 107 1080
1
2
3
4
5Transverse
(b)
R=0.1 R=0.1: run-outs R=0.3 R=0.3: run-outs R=0.7 R=0.7: run-outs
∆P [k
N]
Cycles
FIGURE 5. S-N curves obtained by means of fatigue tests.
It is possible to see that experimental data obtained at R=0.1 and R=0.3 for the twodifferent joint configurations are well mixed and so it’s possible to conclude that the jointconfiguration has not a significant influence on the fatigue behaviour of clinched joints.Furthermore, the fatigue limit for R=0.1 and R=0.3 is also very similar (∆Plim=2.25÷2.5kN)and equal to about 50% of the obtained ultimate stress, a percentage significantly higherthan the typical one in spot welding (i.e. 30÷40%, Satoh et al. [5]). In the case of R=0.7,fatigue limit is quite different from the other considered R values, suggesting that for highmean stresses a different failure mechanism takes place. This fact is supported by theobservation of different macroscopic failure modes as shown in Fig. 6. Particularly, Fig. 6afailures have always been observed on the bottom substrate and at the indentation pointnearer to load application, in the case of longitudinal joints, or at both the indentationpoints, in the case of transverse joints. Furthermore, these failures could be seen for bothkind of indentation configurations when low mean stresses (i. e. R=0.1 and R=0.3) and lowmaximum loads were applied. Fig. 6b shows a failure occurred for the same case of Fig.6a, but under high maximum applied loads. This difference can explain why the crack hadno possibility to propagate. Fig. 6c failures have sometimes been observed at R=0.1 andhigh maximum applied load. They are characterised by a crack nucleation and propagationalong the indentation neck. Finally, Fig. 6d failures have been observed on all the broken

ECF15
R=0.7 specimens and on some of R=0.3 at high maximum applied loads. This kind offailure is characterised by a disassembly of the joint sometimes due to the nucleation andpropagation of a crack along the indentation neck, sometimes without any crack like duringtensile tests.
(a) (b)
(c) (d)
FIGURE 6. Failures observed during fatigue tests: a) low maximum applied stress atR=0.1 and R=0.3; b) high maximum applied stress at R=0.1 and R=0.3; c) sometimesobserved for high maximum applied stress at R=0.1; d) all R=0.7 and high maximumapplied stress at R=0.3
It’s interesting also the comparison of the Pmax vs. R curves shown in Fig. 7: it’spossible to note that increasing the R value the curves tend to be more and more flat. In thecase of longitudinal joints, approaching R=0.7 the fatigue region almost disappears andrun-out specimens are very near to tensile ultimate strength. Different is the case oftransverse joints, where at R=0.7 the simple joint configuration does not prevent thedisassembly of the clinched buttons under cyclic loads.
0.0 0.2 0.4 0.6 0.8 1.00
1
2
3
4
5
Longitudinal
(a)
Lower failed specimen Higher run-out specimen Ultimate tensile strength
P max
[kN
]
R0.0 0.2 0.4 0.6 0.8 1.0
0
1
2
3
4
5
Transverse
(b)
Lower failed specimen Higher run-out specimen Ultimate tensile strength
P max
[kN
]
R
FIGURE 7. Pmax vs. R curves.

ECF15
FractographyAll the specimens failed at stress ratio equal to 0.1 and 0.3 were observed by means of ascan electron microscope. Firstly, it was possible to understand that crack nucleation takesplace in the contact region between the top and bottom substrates where fretting fatigue ispresent. As an example, Fig. 8a shows a case regarding a transverse joint tested at R=0.1and high applied maximum load, while Fig. 8b the transverse section of an analogous casefor a longitudinal joint. This type of non-propagating cracks were also observed inspecimens failed for shear rupture (Fig. 6c) of the indentation point.
Fretting region
(a) (b)
Bottom substrateContact face
(c)
FIGURE 8. SEM observations on failed specimens: a) crack in the contact region of atransverse joint; b) section of a crack in the contact region of a longitudinal joint; c)analysis of the crack surface of a transverse joint.

ECF15
Eventually, all the specimens failed for crack propagation in the bottom substrate weremanually broken and crack surfaces were investigated. Fig. 8c shows an example regardinga transverse joint subjected to R=0.1 and high maximum applied load. It’s possible to notethat near the contact region a mixed microscopic mode of failure, formed by propagationstriations plus fragile failure, is present. The presence of fragile failure in the nucleationregion suggests that, at this stage, the material sees a three dimensional stress state. Thisstress state then vanishes with crack propagation toward the other side of the sheet, where aductile failure mode is present, even if no typical dimples could be observed. It’s importantto add that all the observed specimens, independently on joint configuration, stress ratioand maximum applied load, showed the same morphology of crack surfaces just described.
FEM analysesFEM analyses were carried out in order to investigate the stress distribution in the sheetscomposing the joints. Both the joint configurations were modelled by means of thick shellelements with 8 nodes, while truss elements were adopted to model the shape contactbetween the indentation points (Fig. 9a and b). Dummy plates were included at the ends ofthe sheets, too.
(a) (b)
(c) (d)
FIGURE 9. FEM models of clinched joints: a) and b) longitudinal and transverse joints; c)and d) maximum principal stress for the internal shell layer (contact region) and theexternal one (external face) of the bottom substrate.
The applied load was equal to the previously determined ultimate tensile strength.Considering the transverse joint, the most critical point, in terms of maximum principal

ECF15
stress, was found in the shell layer (section point) corresponding to the internal face of thebottom substrate (Fig. 9c). This layer represents the region were contact is present and isthe same were short surface cracks were observed by SEM, as described in the precedingparagraph. It’s also interesting to check the trend of the maximum principal stress for theexternal layer of the bottom substrate (Fig. 9d), that is the one relative to the external face.In this case, stresses are low in magnitude and near to zero denoting the non-criticality ofthis region and the presence of secondary out of plane bending with shape, in the sheetthickness, without compressive contributes. In the case of the longitudinal joint, the sameconclusions can be made at the indentation point nearer to load application, that is wherethe failures were observed during the tests. Furthermore, the analysis of the hydrostaticstress at the internal shell layer has shown for both the configurations the presence of athree dimensional stress state, as seen in SEM observations.
Concluding remarksIn the present work, fatigue behaviour of clinched joint has been analysed. It has been
found that the influence of joint configuration is not significant. More critical is theinfluence of stress ratio that in fatigue tests can change completely the failure mode. Fromthe point of view of design, the fatigue limit has been found to be 50% of ultimate strength:a value significantly higher that the one of spot welding. SEM observations have shownthat the microscopic failure modes can be ascribed to fretting fatigue on parts in contact(crack nucleation) and to secondary out of plane bending effects (crack propagation). FEManalyses supported the second phenomenon showing great stress concentrations in thecritical region where all the failures (for low applied stress ratios) were observed.
References1. Barnes, T.A. and Pashby, I.R., J. Mat. Proc. Tech., vol. 99, 62-71, 2000.
2. Barnes, T.A. and Pashby, I.R., J. Mat. Proc. Tech., vol. 99, 72-79, 2000.
3. Fu, M. and Mallick, P.K., Int. J. Fatigue, vol. 25, 183-189, 2003.
4. Bini, R., Carboni, M. and Monno, M., In Proceedings of the Sixth AITeM Conference“Enhancing the Science of Manufacturing”, Gaeta, Italy, 2003.
5. Satoh, T., Abe, H., Nakaoka, T. and Hayata, Y., Welding in the World, vol. 37, 12-15,1996.