fatigue resistant design criteria for md sha cantilevered ... … · 7.1 shaft foundation design...
TRANSCRIPT
MARYLAND DEPARTMENT OF TRANPORTATION STATE HIGHWAY ADMINISTRATION
RESEARCH REPORT
FATIGUE RESISTANT DESIGN CRITERIA FOR MD SHA CANTILEVERED MAST ARM SIGNAL STRUCTURES
DR. CHUNG C. FU, P.E. YUNCHAO YE CHAORAN XU
KUANGYUAN HOU
University of Maryland
FINAL REPORT
DECEMBER 2017
MD-17-SHA/UM/4-20

The contents of this report reflect the views of the author who is responsible for the facts and the accuracy of the data presented herein. The contents do not necessarily reflect the official views or policies of the Maryland Department of Transportation. This report does not constitute a standard, specification, or regulation.

Technical Report Documentation Page 1. Report No.MD-17-SHA/UM/4-20
2. Government Accession No. 3. Recipient's Catalog No.
4. Title and SubtitleFatigue Resistant Design Criteria for MD SHA Cantilevered Mast Arm Signal Structures
5. Report DateDecember 2017
6. Performing Organization Code
7. Author/sChung C. Fu, Ph.D., P.E.; Yunchao Ye; Chaoran Xu; Kuangyuan Hou
8. Performing Organization Report No.
9. Performing Organization Name and AddressThe Best Center, 4116 Technology Ventures Building, 5018 College Ave, University of Maryland College Park, MD, 20740
10. Work Unit No. (TRAIS)
11. Contract or Grant No.SP609B4F
12. Sponsoring Organization Name and AddressMaryland Department of Transportation State Highway Administration Office of Policy & Research 707 North Calvert Street Baltimore MD 21202
13. Type of Report and Period CoveredFinal Report
14. Sponsoring Agency Code(7120) STMD - MDOT/SHA
15. Supplementary Notes16. AbstractThe fatigue design of the mast arm structures and connections vary significantly based on the Category of Importance factor adopted and the load cases for fatigue design loads. Consideration should include the cost and size of the structures for both urban and rural applications, and the type of vibration mitigation devices to be adopted for use on cantilevered mast arm structures. The objectives of this study were as follows: • Update the existing Maryland (MD) SHA Book of Standards for Highway, Incidental Structures and
Traffic Control Applications to meet the current AASHTO design criteria. • Analyze the current MD structure designs and provide a cost analysis for recommending an economical
and fatigue resistant design. • Define the design parameters for the signal structures by identifying the suitable Category of
Importance Factor (I, II, or III) to be adapted by SHA, and to define the allowable load for the signal structure design.
Provide complete structural details including foundation details, base plate size and thickness, size and numbers of anchor bolts, hand hole size and locations for fatigue resistant design.
17. Key Words
Signal pole, mast arm, fatigue, stress category, wind
18. Distribution Statement: No restrictionsThis document is available from the Research Division upon request.
19. Security Classification (of this report)None
20. Security Classification (of this page)None
21. No. Of Pages85
22. Price
Form DOT F 1700.7 (8-72) Reproduction of form and completed page is authorized.
1
Table of Contents
List of Figures .................................................................................................................................. 3
List of Tables................................................................................................................................ 4 Chapter 1 Introduction ................................................................................................................... 5
Research Problem ....................................................................................................................... 5 Background ................................................................................................................................. 5 Objectives. ................................................................................................................................... 6 Tasks ............................................................................................................................................ 6
Chapter 2 Literature Review .......................................................................................................... 9 2.1 Fatigue Design ....................................................................................................................... 9 2.2 Mitigation Devices ............................................................................................................... 11
2.2.1 Mechanical mitigation devices ..................................................................................... 11 2.2.2 Aerodynamic mitigation devices .................................................................................. 12
Chapter 3 National Survey ........................................................................................................... 13 3.1. Survey Feedback ................................................................................................................ 13 3.2 Survey Question Summary. ................................................................................................. 14
3.2.1 Survey Section I: Traffic Signal Specifications .............................................................. 14 3.2.2 Survey Section II, State Practices ................................................................................. 15 3.2.3 Survey Section II, Mitigation Device ............................................................................ 22
Chapter 4 Design Criteria based on AASHTO Specifications ....................................................... 23 4.1 Maryland Wind Speed Study ............................................................................................... 23 4.2 Definition of Wind Load Pressure by AASHTO Specifications ............................................. 26 4.3 Fatigue Design of Signal Structures ..................................................................................... 27
4.3.1 AASHTO Fatigue Design Criteria ................................................................................... 27 4.3.2 Fatigue Threshold CAFT ............................................................................................... 28 4.3.3 Fatigue Importance Factor ........................................................................................... 33 4.3.4 Fatigue Design Loads .................................................................................................... 33
4.4 Verification of Equivalent Static Pressure Range ................................................................ 34 4.4.1 Obtaining equivalent static pressure range using NCHRP‐412 (1998) ......................... 34 4.4.2 Equivalent static analysis vs time history ..................................................................... 35
Chapter 5 Vibration Mitigation Devices for Signal Poles ............................................................ 39 5.1 Mechanical Mitigation Device ............................................................................................. 39 5.2 Aerodynamic Mitigation Device .......................................................................................... 41
5.2.1 Theory of Galloping ...................................................................................................... 41 5.2.2 Previous studies on galloping of traffic signal structures ............................................ 42 5.2.3 The Mitigation Ability of Wing Plate ............................................................................ 44 5.2.4 Louvered Backplate ...................................................................................................... 48
5.3 Numerical Analysis .............................................................................................................. 49 5.3.1 Aerodynamic parameters ............................................................................................ 49 5.3.2 One‐way FSI analysis .................................................................................................... 50 5.3.3 Two‐way FSI analysis .................................................................................................... 51
2
5.4 Summary ............................................................................................................................. 53 Chapter 6 Signal Pole Design based on Maryland's Assumptions .............................................. 55
6.1 Maryland assumption in SABRE model ............................................................................... 55 6.2 Structure Design Based on SABRE model .......................................................................... 57
6.2.1 Tube‐to‐transverse plate connection ........................................................................... 57 6.2.2 Connection Bolt............................................................................................................ 57
6.3 Case Study of 60’ Arm Cost Comparison ............................................................................ 61 Chapter 7 Investigation of Maryland Signal Pole Foundation .................................................... 62
7.1 Shaft Foundation Design Based on Brom’s Method ........................................................... 62 7.2 Torsional Design on the Foundation Shaft .......................................................................... 62 7.3 Case Study of Maryland Signal Pole Foundation................................................................. 66
Chapter 8 Summary and Conclusions .......................................................................................... 70

3
List of Figures Figure 1.1 ‐ Cantilevered Mast Arm Signal Structure and Fatigue Detail Locations ........................ 8 Figure 2.1 ‐ Stress Range Vs. Number of cycles ............................................................................. 10 Figure 3.1 ‐ Map of State Survey Responses ................................................................................. 13 Figure 3.2 ‐ Graph of Survey Responses for Question 2 ............................................................... 14 Figure 3.3 ‐ Graph of Survey Responses for Question 3 ............................................................... 15 Figure 3.4 ‐ Graph of Survey Responses for Traffic Signal Structure Manufacturers .................... 16 Figure 3.5 ‐ Graph of Survey Responses for Question 4 ............................................................... 16 Figure 3.6 ‐ Graph of Survey Responses of Bolt Pattern ............................................................... 17 Figure 3.7 ‐ Graph of Survey Responses for Connection Type ...................................................... 17 Figure 3.8 ‐ Graph of Survey Responses for signal head back plate usage ................................... 18 Figure 3.9 ‐ Graph of Survey Responses for stiffened base plate ................................................. 19 Figure 3.10 ‐ Graph of Survey Responses for Anchor Bolt Pattern ............................................... 20 Figure 3.11 ‐ Graph of Survey Responses for Load Indicator Washer usage ................................. 21 Figure 3.12 ‐ Graphs of Survey Responses for Holes and Cutouts ................................................ 21 Figure 3.13 ‐ Graph of Survey Responses for Mitigation Devices ................................................. 22 Figure 4.1 ‐Maryland Routes with AADT Counts ........................................................................... 24 Figure 4.2 ‐ 700‐year and 1700‐year MRI Basic Wind Speed on the Eastern U.S. Provided by AASHTO LRFD Specifications (2015) .............................................................................................. 25 Figure 4.3.1 ‐ Survey Responses for Stiffened/Unstiffened Base Plates ....................................... 28 Figure 4.3.2 ‐ Stiffened Plate Types .............................................................................................. 29 Figure 4.3.3 ‐ Survey Responses for Stiffened Plate Types ........................................................... 29 Figure 4.4.1 ‐ Survey Responses for Angle Box Connection Types ................................................ 30 Figure 4.4.2 ‐ Angle Box Connection Types ................................................................................... 30 Figure 4.5.1 ‐ Survey Responses for Holes and Cutouts ................................................................ 32 Figure 4.5.2 ‐ Graph of Survey Responses for Access Hole ........................................................... 32 Figure 4.6 ‐ Signal Pole and Corresponding Model ....................................................................... 35 Figure 4.7 ‐ Location of signs and signals on the arm ................................................................... 36 Figure 4.8 ‐ FEM for 75‐ft mast arm in ANSYS ............................................................................... 37 Figure 4.9 ‐ Time history of deflection at tip of mast arm............................................................. 37 Figure 4.10 ‐ Time history of stress at fixed end of mast arm ....................................................... 38 Figure 5.1 ‐ Damping test conducted at the University of Maryland ............................................ 41 Figure 5.2 ‐ Galloping force coefficient with specific traffic signal configuration ......................... 45 Figure 5.3 ‐ Mounting arrangement for large damping plate (wing) ............................................ 45 Figure 5.4 ‐ RMS vertical pole strain versus run number for 48ft signal structure ....................... 46 Figure 5.5 ‐ Effect of wing location on galloping ........................................................................... 47 Figure 5.6 ‐ Effect of wing length and wing alignment with the tip of the mast arm on galloping
.......................................................................................................................................................... 47 Figure 5.7 ‐ Percentages of adopting louvered and non‐louvered backplate ............................... 49 Figure 5.8 ‐ Dimension of the wing plate ...................................................................................... 50 Figure 5.9 ‐ Variation of galloping force coefficient with attack of angle ..................................... 51 Figure 5.10 ‐ Geometry of the two‐way FSI analysis ..................................................................... 52 Figure 5.11 ‐ Time history of the displacement at tip of the arm with wind speed at 5m/s ......... 52 Figure 6.1 ‐ SABRE input for a typical 50’ signal pole .................................................................... 55
4
Figure 6.2 ‐ Comparison for Maryland typical 60’ layout sketch and SABRE model simulation ....56 Figure 7.1 ‐ Torsional Resistance Tr .............................................................................................. 63 Figure 7.2 ‐ Shaft Rebar P‐M interaction diagram ........................................................................ 68
List of Tables Table 1.1 ‐ AASHTO Fatigue Importance Factors ............................................................................ 7 Table 2.1 ‐ Fatigue Importance Factor .......................................................................................... 10 Table 4.1 ‐ Mean recurrence intervals (MRI) specified by AASHTO LRFD ..................................... 23 Table 4.2 ‐ Wind pressures based on different wind speeds and Specifications for B‐W Corridor
.......................................................................................................................................................... 27 Table 4.3 ‐ Wind pressures based on different wind speeds & Specifications for MD coastal line ........................................................................................................................................................ 27 Table 4.4 ‐ Fatigue Importance Factors Provided by the AASHTO Specifications ......................... 33 Table 4.5 ‐ Equivalent static analysis ............................................................................................ 37 Table 5.1 ‐ Various dampers with their performance ................................................................... 40 Table 5.2 ‐ Air properties .............................................................................................................. 50 Table 6.1 ‐ New diameter and thickness for structure pole/arm.................................................. 57 Table 6.2 ‐ Connection fatigue resistance of pole and arm .......................................................... 58 Table 6.3 ‐ 6‐bolt row bolt pattern for arm connection ................................................................ 59 Table 6.4 ‐ Simpler 6‐bolt circle bolt pattern for pole connection ................................................ 60 Table 6.5 ‐ 60ft Arm Design Cost Comparison .............................................................................. 61 Table 7.1 ‐ Properties of cohesive and cohesionless soils ............................................................ 67 Table 7.2 ‐ Case Study comparison ............................................................................................... 69

5
Chapter 1 Introduction Research Problem The fatigue design of the mast arm structures and connections vary significantly based on the Category of Importance Factor adopted and the load cases for fatigue design loads. Consideration should include the cost and size of the structures for both urban and rural applications, and the type of vibration mitigation devices to be adopted for use on cantilevered mast arm structures. The fatigue design criteria were first introduced in the 4th edition of the AASHTO Standard Specifications for Structural Supports for Highway Signs, Luminaries and Traffic Signals (LTS‐4) in 2001. Section 11, “Fatigue Design,” of the AAHSTO LTS is the specific reference where it discusses the design criteria. The 2009 (LTS‐5), 2013 (LTS‐6) and 2015 (LTS‐LRFD) interim AASHTO Specifications were further revised to account for the research with connection details and fatigue load design. The fatigue design loads allow state agencies some leeway in defining the design fatigue load categories and significantly impact the size of the structures and type of connection details. Background Over the past two decades, wind induced fatigue cracking of highway signs, luminaires, and traffic signal support structures have been increasingly reported all over the United States. While fatalities associated with these failures have been limited, the nuisance of dealing with a large number of fatigue cracks in the sheer volume of these structures in the national inventory, along with the cost of inspecting, repairing and/or replacing the cracked structures, has been substantial. As such, a reliable assessment of the fatigue performance of these structures and their improved cost‐effective design of fatigue critical details are of great importance. In response to the fatigue failure of sign, signal and luminaire support structures in the early 1990s, NCHRP Project 10‐38: Fatigue‐Resistant Design of Cantilevered Signal, Sign, and Light Supports (NCHRP Report 469, 2002) was conducted. The findings in this project were introduced as a new chapter called Section 11: Fatigue Design in the AASHTO Standard Specifications for Structural Supports for Highway Signs, Luminaires, and Traffic Signals, 4th Edition, 2001. In Table 11‐9.3.1 of the AASHTO specifications (LTS‐6, 2013), the fatigue categories of typical connection details in the subject structures are defined. There are significant changes in Section 11, “Fatigue Design,” from the 5th edition of AASHTO Standard Specifications (LTS‐5, 2009) for Structural Supports for Highway Signs, Luminaires, and Traffic Signals to the 6th edition (LTS‐6, 2013), and they are carried over to the LRFD edition (LTS‐LRFD, 2015). Chapters 11 of the 5th and 6th editions of the AASHTO specifications were reviewed with respect to the objectives of this project, which is focused on defining the fatigue resistance of various connection details in the subject structures. Chapter 11 of the specifications contains provisions for the fatigue design of cantilevered steel and aluminum

6
structural supports for highway signs, luminaires, and traffic signals. Finite and infinite life resistances were established by fatigue testing of full scale galvanized specimens. Objectives The objectives of this study were as follows: • Update the existing Maryland (MD) SHA Book of Standards for Highway, Incidental
Structures and Traffic Control Applications to meet the current AASHTO design criteria.
• Analyze the current MD structure designs and provide a cost analysis for recommending an economical and fatigue resistant design.
• Define the design parameters for the signal structures by identifying the suitable Category of Importance Factor (I, II, or III) to be adapted by SHA, and to define the allowable load for the signal structure design.
• Provide complete structural details including foundation details, base plate size and thickness, size and numbers of anchor bolts, hand hole size and locations for fatigue resistant design.
Tasks The study involved the execution of the following tasks: Task 1 – Conduct literature review and a survey from federal and other state agencies The focus of this phase was to locate, collect, and list all the available current state‐of‐the‐ practice methods for (1) FHWA’s regulations, (2) other states’ practices, and (3) research and testing findings. A summary of this task is in Chapter 2, Literature Review. Preliminary contact was made to members of the AASHTO Subcommittee on Bridges and Structures, T‐12 Structural Supports and TRB Committee on General Structures (AFF10). More details will be discussed in Chapter 3, National Survey. Fabricators and design engineers were also contacted. Task 2 ‐ Develop scenario and work plans of the cantilevered mast arm signal structures In this task, a comparison was made between the yet‐adopted AASHTO LRFD Specifications for Structural Supports for Highway Signs, Luminaires, and Traffic Signals (LTS‐LRFD, 2015) and the existing MD SHA Book of Standards for Highway, Incidental Structures and Traffic Control Applications to make sure that the current AASHTO design criteria were met. A fatigue importance factor, IF , accounts for the risk of hazard to traffic and damage to property and was applied to the limit state wind‐load effects. Based on the latest AASHTO Specifications 6th edition (LTS‐6, 2013), fatigue importance factors for traffic signal and sign support structures were exposed to three wind load effects and are presented below in Table 1.1. The bolded importance factors, which are for cantilevered mast arm signal structures, were used for this study.

7
Table 1.1 – AASHTO Fatigue Importance Factors
Fatigue Importance Category Galloping Natural Wind Gusts Truck‐Induced Gusts Ca
ntile
vere
d I Sign Traffic Signal
1.0 1.0
1.0 1.0
1.0 1.0
II Sign Traffic Signal
0.70 0.65
0.85 0.80
0.90 0.85
III Sign Traffic Signal
0.40 0.30
0.70 0.55
0.80 0.70
Non
‐ Ca
ntile
vere
d
I Sign Traffic Signal x x
1.0 1.0
1.0 1.0
II Sign Traffic Signal x x
0.85 0.80
0.90 0.85
III Sign Traffic Signal x x
0.70 0.55
0.80 0.70
Structures classified as Category I present a high hazard in the event of failure and should be designed to resist rarely occurring wind loading and vibration phenomena. It is recommended that a l l structures to be classified as Category I if there are no effective mitigation devices on the structures on roadways with a speed limit exceeding 60 km/h (35 mph), and a roadway which has average daily traffic (ADT) exceeding 10,000 or average daily truck traffic (ADTT) exceeding 1000. Structures should be classified as Category III if they are located on roads with speed limits 60km/h (35 mph) or less. Structures that are located such that a failure will not affect traffic may be classified as Category III. All structures not explicitly meeting the Category I or Category III criteria should be classified as Category II. Maintenance and inspection programs should be considered integral to the selection of the fatigue importance category. There are many factors that affect the selection of the fatigue category and engineering judgment is required. Reviews were made on the AASHTO LRFD Specifications (LTS‐LRFD, 2015) with previous 4th to 6th editions and MD SHA Standard for the best and most cost‐effective design. More details will be discussed in Chapter 4, Design Criteria Based on AASHTO Specifications. Also, a discussion on the basis for using Category II in design is covered in Chapter 5, Vibration Mitigation Devices for Signal Poles. Task 3 – Collect, analyze, evaluate and assess the current MD structure designs Representative samples of cantilevered mast arm signal structures were collected from the SHA inventory based on their categories, single or multiple arms, and level or curved arms. Based on the MD SHA Standards for Highway and Incidental Structures (Standard No MD800.01), leveled and curved cantilevers with four different arm lengths (50’, 60’, 70’ and 75’) were
8
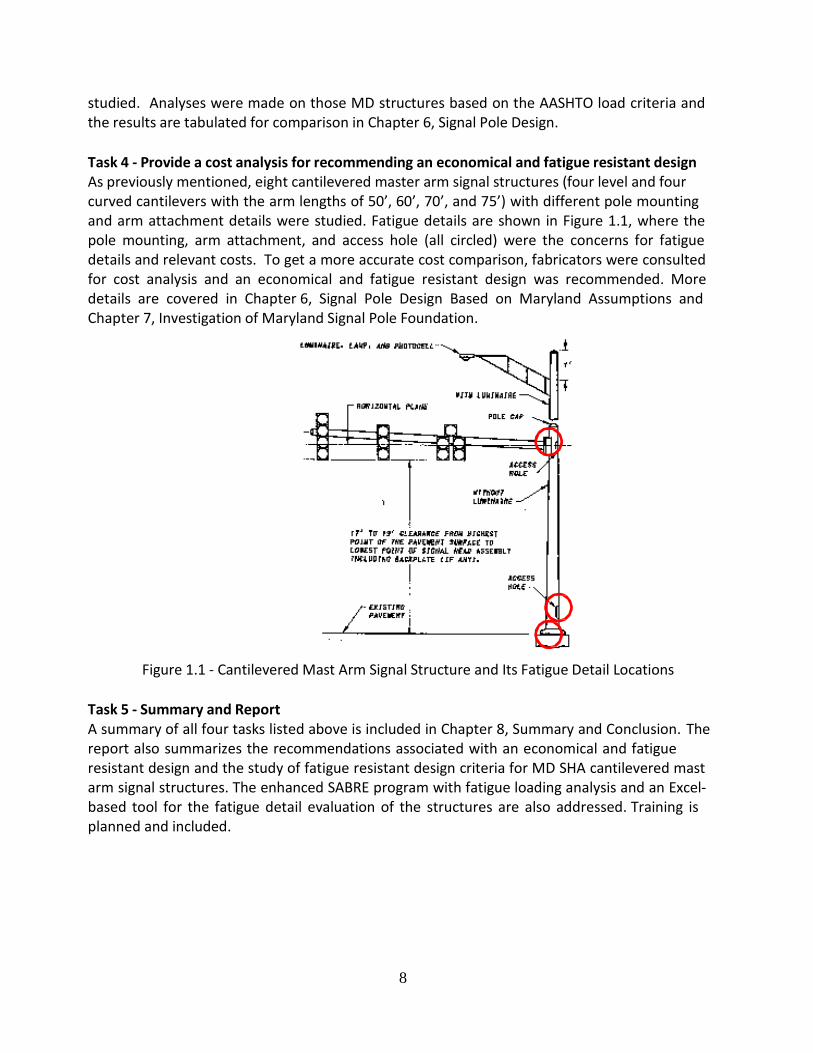
studied. Analyses were made on those MD structures based on the AASHTO load criteria and the results are tabulated for comparison in Chapter 6, Signal Pole Design. Task 4 ‐ Provide a cost analysis for recommending an economical and fatigue resistant design As previously mentioned, eight cantilevered master arm signal structures (four level and four curved cantilevers with the arm lengths of 50’, 60’, 70’, and 75’) with different pole mounting and arm attachment details were studied. Fatigue details are shown in Figure 1.1, where the pole mounting, arm attachment, and access hole (all circled) were the concerns for fatigue details and relevant costs. To get a more accurate cost comparison, fabricators were consulted for cost analysis and an economical and fatigue resistant design was recommended. More details are covered in Chapter 6, Signal Pole Design Based on Maryland Assumptions and Chapter 7, Investigation of Maryland Signal Pole Foundation.
Figure 1.1 ‐ Cantilevered Mast Arm Signal Structure and Its Fatigue Detail Locations
Task 5 ‐ Summary and Report A summary of all four tasks listed above is included in Chapter 8, Summary and Conclusion. The report also summarizes the recommendations associated with an economical and fatigue resistant design and the study of fatigue resistant design criteria for MD SHA cantilevered mast arm signal structures. The enhanced SABRE program with fatigue loading analysis and an Excel‐ based tool for the fatigue detail evaluation of the structures are also addressed. Training is planned and included.

9
Chapter 2 Literature Review 2.1 Fatigue Design For nominal stress design specified by AASHTO LRFD Specification for Structural Supports for Highway Signs, Luminaries, and Traffic Signals (hereafter referred to as the AASHTO LRFD Specifications 2015 or LTS‐LRFD), the fatigue stress has the limit (AASHTO Specifications, P 11‐4, 2015, which is the same as LTS‐5) that
(2.1)
where: (∆f)n = the wind included nominal stress that shall be used when fatigue design of
connection detail is carried out and shall be calculated at the site of potential fatigue cracking. Some details related to this study were provided in AASHTO specification 11.9.2 that:
‘For potential penetration, groove‐welded, mast arm‐to‐column pass‐through connections,
the nominal stress shall be calculated on the gross section of the column at the base of the connections.
For fillet‐welded tube‐to‐transverse plate connections (socket connections), nominal stress
shall be calculated on the gross section of the tube at the fillet‐weld toe on the tube.’
(∆F)n = the nominal fatigue resistance as specified for the various detail classes identified, which depends on tube connection geometry and
(2.2)
N = the number of wind load induced stress cycles expected during the life time of the
structures Finite Life Constant = A x 108 Ksi3, γ = the load factor per the Fatigue I limit state, and ϕ = the resistance factor equal to 1.0
Also, an important relationship between the stress range ((∆f)n ) and the number of cycles (N) is shown in Figure 2.1.

10
Figure 2.1 Stress Range versus Number of cycles (AASHTO Specification Figure C11.9.3‐1)
Fatigue Importance Factors (IF) were introduced by the AASHTO Specification to adjust the structural reliability of cantilevered and non‐cantilevered support structures which are determined by the owner (AASHTO Specifications, C11.6, 2015). It is set by multiple conditions ‐ the wind speed, traffic situation and the structure conditions. In this study, only one kind of signal support structure ‐single mast arm signal pole structure‐ had been analyzed so only cantilever structures would be introduced as follows: The AASHTO specification (AASHTO Specifications, P 11‐4 to P11‐6, 2015) suggested that ‘all structures without effective mitigation device on roadways with a speed limit exceed 35 mph (56 kph) and average daily traffic (ADT) exceeding 10,000 (one direction, regardless of number of lanes) or average daily truck traffic ( A D T T ) exceeding 1,000 (one direction, regardless of number of lanes) should be classified as Category I structures. Also, NCHRP report 718 suggests that cantilever structures exceeding 50’ and without a vibration mitigation device should be defined as Category I. For traffic signal support structures exposed to the three wind load effects, they are presented in Table 2.1.
Table 2.1 Fatigue Importance Factor (AASHTO specification Table 11.6‐1) Fatigue Category Fatigue Importance Factor, IF
Galloping
Natural Wind Gusts
Truck‐induced Gusts
Cantilever
I Sign Traffic
Signal 1.0 1.0 1.0 1.0 1.0 1.0
II Sign Traffic
Signal 0.70 0.85 0.90 0.65 0.80 0.85
III Sign Traffic Signal
0.40 0.70 0.80 0.30 0.55 0.70
The AASHTO specification (AASHTO Specification P11‐12, 2015) suggests that when the equivalent static design wind effect from galloping and truck‐induced gusts are applied to the structure, the deflection of the single mast arm sign and traffic signal support structures should not be excessive and recommends the total vertical deflection at the free end of signal arm be limited to 8” based on NCHRP Report 412 (1998).

11
The AASHTO (LTS‐5 and LTS‐LRFD) specified that the deflection limit is a serviceability problem such that the motorists cannot clearly see the attachments or are concerned about passing under the structures. The detailed limitation value of 8 inches is only stated in the comments as a supplementary reference which is not considered mandatory. Besides, the application of an 8‐in deflection limitation of the different NCHRP report does not reach an agreement. For example, although the NCHRP 412 recommends applying the limitation to all the signal structures, the much later published NCHRP 494 recommends this limitation to be applied only to non‐cantilevered support structure. The comment also states that the primary purpose of the provision is to minimize the number of motorist complaints. Single mast arm traffic signal support structures are usually flexible and with properties of lightly damped, which are highly susceptible to wind‐induced vibration, such as vortex shedding, galloping, natural wind gusts, and truck induced gusts as specified in the previous chapter. The cyclic large amplitude deflection in a high frequency and sustained for a long period caused by the vibration could easily cause a fatigue crack in a relatively short period. NCHRP – IDEA 141 Report had observed data of 3% of signal support structures in Connecticut and over 30% in Wyoming. Such poor fatigue performance will l e a d easily to t h e brittle failure of structures. S tudies on the fatigue‐reduced methods had b e e n done by many states and many vibration mitigation devices had been designed and tested. Lehigh University (NCHRP Project 10‐70, 2006) had done the project with analytical and experimental evaluations. The result they provided found that the most critical details are the tube‐to‐transverse plate connections, which include the mast arm‐to‐transverse plate and pole‐ to‐base plate connection, followed by the handholes, which are more focused on the fatigue stress concentration and may cause fatigue cracks; this has been another issue that is relatively minor but needs to be considered with all the design requirements. Also, the mast arm‐to‐pole connection and mast arm‐to pole pass‐through connection should be considered as critical conditions. Some results had been used to revise the AASHTO Specification, 2013. The new Specifications include both finite and infinite lives in fatigue design, defined fatigue resistance as function of geometric parameters, and two‐level specification, i.e. nominal stress‐based design for most cases (AASHTO Specification 11.9), and local stress‐based and experiment‐based design for special cases (AASHTO Specification Chapter 11. Appendix D). The University of Minnesota (NCHRP REPORT 469: Fatigue‐Resistant Design of Cantilevered Signal, Sign, and Light Support had found and summarized. 2002) did research on wind load, dynamic response, and fatigue of cantilever signal support structures. Some of their conclusions show the evidence that the vibration mitigation devices working on the signal support structures effectively would be able to change the Fatigue Importance Category I to Fatigue Importance Category II so that the magnitude of designed wind load would be reduced but the galloping load still cannot be completely ignored in this situation.

12
2.2 Mitigation Devices Many researchers have studied different types of mitigation devices to find out the most efficient way to minimize the fatigue dynamic loads. The devices can be categorized into two groups – aerodynamic and mechanical. 2.2.1 Mechanical mitigation devices
Mechanical mitigation devices typically reduce the response under specific dynamic load by modifying dynamic properties, such as the mass and damping ratio of the sign support structure in the field. Many researchers designed and tested vibration mitigation devices in the lab and field. Gray, et al. (1999) and Hamilton, et al. (2000) have conducted field tests and finite element analysis on mast arm signal support structures and reported that failure occurs between the mast arm‐to‐ pole connection and pole‐to‐base connections because of fatigue cracks. They also reported that these cracks were caused by wind. Both the in‐plane (galloping) and out‐of‐plane (gust) motions have major contributions on that fatigue damage (Christopher and Hetor, 2008). Researchers from the University of Wyoming (Gray D., 1999), the University of Florida (Cook, R. A., et al, 2000), and the University of Connecticut (Christenson, R., 2011) have done extensive work on the effectiveness of current vibration mitigation devices and have provided new types of devices that may produce better results. 2.2.2 Aerodynamic mitigation devices McDonald and Pulipaka (1995) studied the aerodynamic properties of different configurations of signal light and the effect of wing plate in reducing galloping. NCHRP report 469 (2002) mentioned that applying a n effective aerodynamic device could change the fatigue importance category from Category I to Category II, but t h e louvered backplate is not that effective. Report FHWA/TX‐08/0‐4586‐1 (2007) also conducted a parametric study on wing plate in mitigation and found that galloping rarely happens. Christopher and Hector (2008) in FHWA/TX‐08/0‐ 4586‐3 and FHWA/TX‐08/0‐4586‐3 verified the rare occurrence of galloping in practice, but also stated the possibility of galloping in analysis. FDOT (2016) emphasized the fatigue design even equipped with mitigation devices.

13
Chapter 3 National Survey
3.1. Survey Feedback The University of Maryland Bridge Engineering Software and Technology (BEST) Center sent a 21‐question signal structure survey form to all 50 states’ Department of Transportation (DOT). The survey addressed various topics that pertained to Traffic Signal Structure. The survey examined the following topics: • Section I, Traffic Signal Specifications (2 questions) • Section II, State Practices (16 questions) • Section III, Mitigation Devices (3 questions)
Figure 3.1 shows the 27 out of 50 state DOTs that responded to the survey.
Figure 3.1 ‐ Map of State Survey Responses

14
3.2 Survey Question Summary 3.2.1 Survey Section I: Traffic Signal Specifications
Q1. If fatigue design is used for cantilever mast arm signal structures, what economic consideration is required for the fatigue design criteria, particularly for urban applications?
This survey starts with the basic information of traffic signal structures that each state applies. More than half of the survey states (16) responded that their signal structures are designed to fit fatigue Category II or both Category I and II. Detailed responses are listed in Appendix A, including ones that address the economic consideration for fatigue design.
Figure 3.2 ‐ Graph of Survey Responses for Question 2
Q2. Considering regular urban and rural cantilever traffic signal structures, for which Fatigue Importance Category (I, II or II) does your state design? If your state’s Category I designation is not conforming to what is specified in AASHTO LTS, “Structures without effective mitigation devices on roadway with speed limit in excess of 35 mph, and ADT over 10,000 or ADTT over 1,000,” then what actions are you taking?
As shown in Figure 3.2, most states currently apply Category I and II for their signal fatigue design. Five of them adopt both Category I and Category II by setting a boundary for mast arm length or AADT value, which was that of the Massachusetts DOT. Indiana and Virginia set a maximum mast arm length of 50ft and 75ft for Category II design. Massachusetts considers a mast arm with a roadway that has AADT exceeding 4000 and a truck percentage of at least 10% to be a Category I design. Maryland and Texas are the only two states that do not apply a fatigue importance category, since their designs are currently based on AASHTO LTS‐3 (1994). To make up the lack of the fatigue design, the standard design approach for Texas is to minimize the number of different designs and limit the variations to mast arm length mounting height and wind velocity.
Which fatigue importance category (I, II or III) applied in state design? (25 states)
States apply CATEGORY III 2
I &II COMBINE 5
CATEGORY II 11
CATEGORY I 7
0 2 4 6 8 10 12
15
3.2.2 Survey Section II, State Practices 3.2.2.1 General Questions
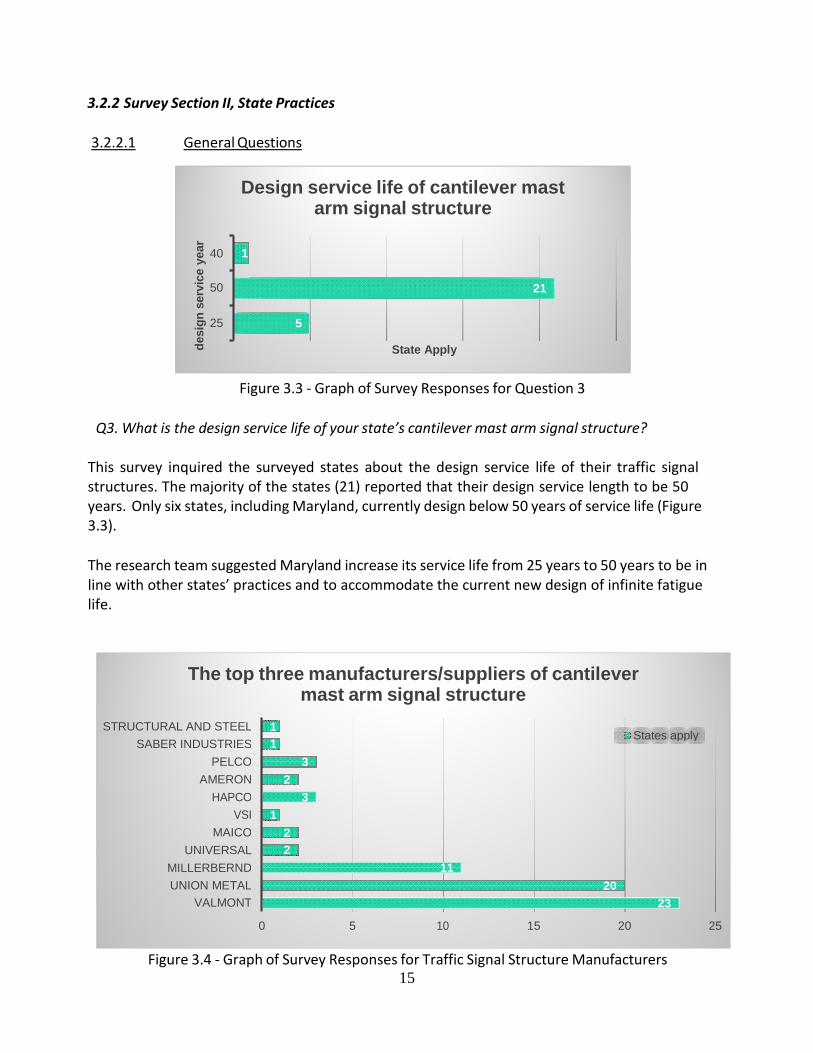
Figure 3.3 ‐ Graph of Survey Responses for Question 3
Q3. What is the design service life of your state’s cantilever mast arm signal structure? This survey inquired the surveyed states about the design service life of their traffic signal structures. The majority of the states (21) reported that their design service length to be 50 years. Only six states, including Maryland, currently design below 50 years of service life (Figure 3.3). The research team suggested Maryland increase its service life from 25 years to 50 years to be in line with other states’ practices and to accommodate the current new design of infinite fatigue life.
Figure 3.4 ‐ Graph of Survey Responses for Traffic Signal Structure Manufacturers
The top three manufacturers/suppliers of cantilever mast arm signal structure
STRUCTURAL AND STEEL SABER INDUSTRIES
PELCO AMERON
HAPCO VSI
MAICO UNIVERSAL
MILLERBERND UNION METAL
VALMONT
1 1
States apply
3 2
3 1
2 2
11 20
23
0 5 10 15 20 25
Design service life of cantilever mast arm signal structure
40 1 50 21
25 5
State Apply desi
gn s
ervi
ce y
ear

16
Q10. The top three manufacturers/suppliers of your state’s cantilever mast arm signal structures.
The survey asked the state DOTs their traffic signal structure manufacturer preference (Figure 3.4). The Valmont, Union Metal, and Millerbernd were the top three suppliers and they were also the preeminent manufacturers for the Maryland DOT. 3.2.2.2 Signal Arm Questions
Figure 3.5 ‐ Graph of Survey Responses for Question 4 Q4. In your state practice, what is the maximum arm length of a cantilever mast arm signal structure?
In Figure 3.5, more states design to limit their maximum arm length to be between 50 feet to 75 feet. While some states (Alaska, Kentucky, and North Carolina) do not set a limit in their state design specifications, there are only a few cases where arm length exceeds 75 feet. Maryland designs for 70 feet, but allows a five‐ foot extension, which the research team considered to be adequate for Maryland signal design. The survey also addressed the allowable dead load and wind load on the mast arm. Detailed responses are listed in Appendix A.
Maximum arm length of cantilever mast arm
signal structure NO LIMIT 3
>75 60~75
5
9
50~60
<50 3
0 1 2 3 4 5 6 7 8 9 10 State Apply
Arm
Len
gth
17
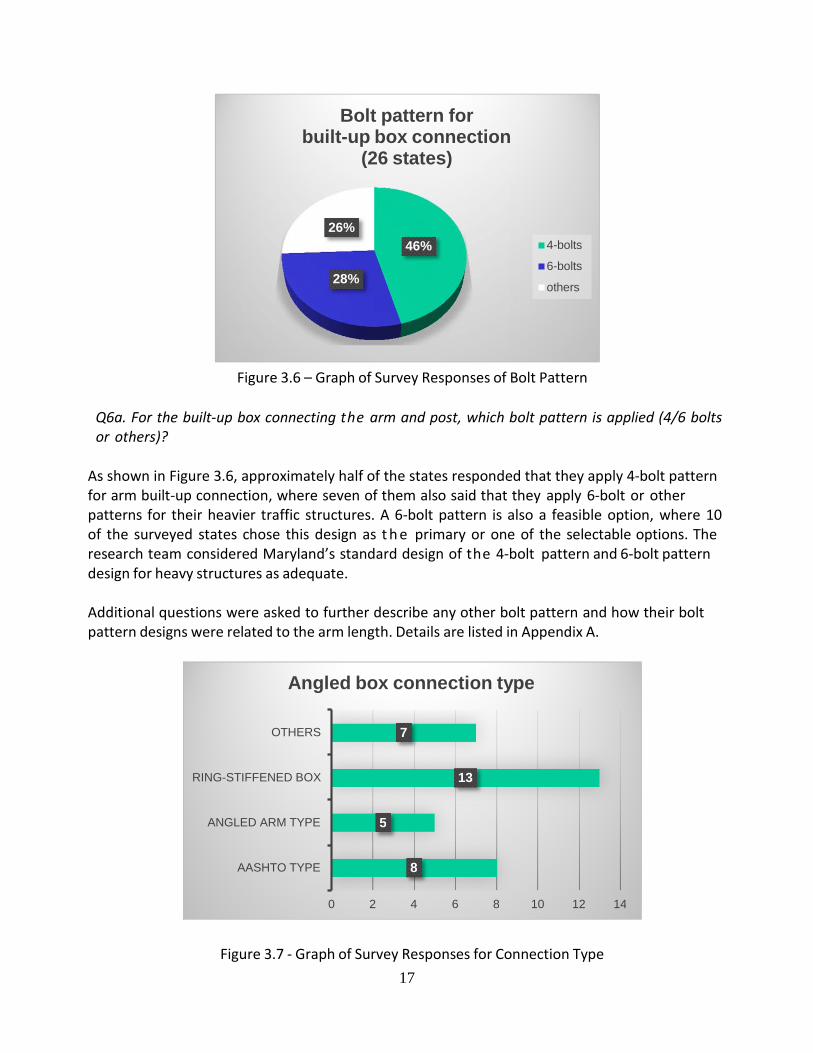
Figure 3.6 – Graph of Survey Responses of Bolt Pattern
Q6a. For the built‐up box connecting the arm and post, which bolt pattern is applied (4/6 bolts or others)?
As shown in Figure 3.6, approximately half of the states responded that they apply 4‐bolt pattern for arm built‐up connection, where seven of them also said that they apply 6‐bolt or other patterns for their heavier traffic structures. A 6‐bolt pattern is also a feasible option, where 10 of the surveyed states chose this design as t h e primary or one of the selectable options. The research team considered Maryland’s standard design of the 4‐bolt pattern and 6‐bolt pattern design for heavy structures as adequate. Additional questions were asked to further describe any other bolt pattern and how their bolt pattern designs were related to the arm length. Details are listed in Appendix A.
Figure 3.7 ‐ Graph of Survey Responses for Connection Type
Bolt pattern for built-up box connection
(26 states)
26% 46%
28%
4-bolts
6-bolts
others
Angled box connection type
OTHERS 7
RING-STIFFENED BOX 13
ANGLED ARM TYPE 5
AASHTO TYPE 8
0 2 4 6 8 10 12 14

18
Q8. For angled box connection, which type is commonly used in your state practice? There are a few options available for angled built‐up box connection in traffic signal arm design. Aside from the most favored Ring‐Stiffened Box, the survey in Figure 3.7 shows an equal preference for the other three angled box connection types. Maryland and four other states (California, Massachusetts, North Carolina, and Ohio) are using the less favored Angled Arm Type. Considering the serviceability for the suggested groove weld connection, the ring‐Stiffened box connection is considered, but the AASHTO built‐up box Type is preferred.
(a) (b)
Figure 3.8 ‐ Graphs of Survey Responses for (a) Signal Head Back Plates, (b) Back Plate Types Q6d. Use of signal head back plate and type.
Aside from the arm built‐up box connection, the application for signal head back plate also becomes a concern for traffic signal arm design. As a result, states were asked to describe their back‐plate usage. Figure 3.8(a) shows that Maryland is the only state that has not applied signal head back plate (BP) in their traffic signal design. As for the type of back plate, over half (59%) of surveyed states shown in Figure 3.8(b) choose the non‐louvered back plate, while four of them (Alaska, New Jersey, Texas and Wisconsin) choose both types for their traffic signal. The non‐louvered signal back plate is suggested for the Maryland DOT. This survey also inquired the back‐plate suppliers for each state. These suppliers included Peek Traffic, McCain, Eagle, Temple Incorporated, Econolite, Siemens and TAPCO.
Use of Signal Head Back Plates (27 states)
No BP 4%
Use BP 96%
Use BP
No BP
Back Plate Type (23 states)
louvered 41%
non- louvered
59%
louvered
non-louvered

19
0%
3.2.2.3 Pole Questions
(a) (b) Figure 3.9 ‐ Graphs of Survey Responses for (a) Stiffened/Unstiffened Base Plates, (b) Stiffened Plate Types
Q7. In your state practice, are stiffened base plates commonly used for traffic signal poles?
The survey addressed the design of traffic signal structure pole design with regards to the usage of base stiffened plates. In Figure 3.9, most states (21 states) prefer the non‐stiffened base. Only five states (California, Colorado, Indiana, Michigan, and New Mexico) use a regular stiffened base plate in their design. None of the states has used the new Stool Type, which was first introduced in AASHTO, Sixth Edition, 2013. The research team considered the non‐stiffened base plate with groove welds as an adequate design choice.
Are stiffened base plates commonly used for traffic signal poles? (26 states)
19%
81%
Yes
No
Which stiffened plate is used? (5 states)
0%
100%
Regular Type
Stool Type
Others

20
Figure 3.10 ‐ Graph of Survey Responses for Anchor Bolt Pattern
Q7b. Which anchor bolt pattern is applied (4/6/8 bolts or other)? For the design of the anchor bolt pattern, most states used the 4‐bolt pattern or 6‐bolt pattern, as shown in Figure 3.10. Nine of the surveyed states chose more than one pattern to cope with different scenarios. Only Connecticut, Massachusetts and Oregon design with the 8‐bolt pattern for all traffic signal structure bases. The research team considered Maryland’s current 4‐bolt pattern design for regular structure and 6‐bolt pattern design for heavy structure as adequate. However, the Structural Committee for Economic Fabrication (SCEF) has discussed standardizing the number of anchor bolts of traffic signal poles for the past few years, and the consensus suggested, at minimum, the 6‐bolt pattern, but there has been no official decision yet. With the possible increased arm diameter and base plate sizes, Maryland may consider adopting the 6‐bolt pattern, which is already used in heavy structures. Question 7c asked how signal arm length is related to anchor bolt pattern and if their state designs were dependent on arm length. Most of the states responded that the boundary between 4‐bolts and 6‐bolts (or above) is 50 feet to 75 feet, while the rest of the states responded that it depends on the manufacturer and moment capacity at the base. Detailed responses are listed in Appendix A.
Anchor Bolt Pattern
OTHERS 2
8-BOLTS 7
6-BOLTS 13
4-BOLTS 16
0 2 4 6 8 10 12 14 16 18

21
Figure 3.11 ‐ Graph of Survey Responses for Load Indicator Washer usage
Q7d. Use of Load Indicator Washers (DTI) at the base plate – anchor bolt connection? If Yes, please specify the type
This survey asked the state DOTs about their usage of Load Indicator Washers. Alaska is the only state that applies such a device (Figure 3.11). The research team considered not using DTI is justifiable for Maryland.
(a) (b)
Figure 3.12 – Graphs of Survey Responses for (a) Holes and (b) Cutouts
Use of Load Indicator Washers (DTI) at the base plate – anchor bolt connection?
(25 states)
4%
Use Load indicator
96% No Load Indicator
Are holes and cutouts designs considered
important? (25 states)
8%
Yes
92% No
Which cutout type is commonly applied?
(26 states)
8% Reinforced Type
92% Unreinforced Type
22
Q9. Are holes and cutouts designs considered important in cantilever mast arm signal structure?
Q9a. Which cutout type is commonly applied?
The survey also inquired about the importance of holes and cutouts for surveyed states and how their cutout was designed (Figure 3.12). Only two states (California and Virginia) consider the cutouts not important, but California also stated that, although they had almost no trouble, cutout design will probably become a bigger consideration as they move forward with LTS‐6. For the cutout type, 24 of the surveyed states including Maryland apply reinforced cutout. The research team considered the current reinforced type cutout used by Maryland is adequate. 3.2.3 Survey Section II, Mitigation Device
Figure 3.13 ‐ Graph of Survey Responses for Mitigation Devices
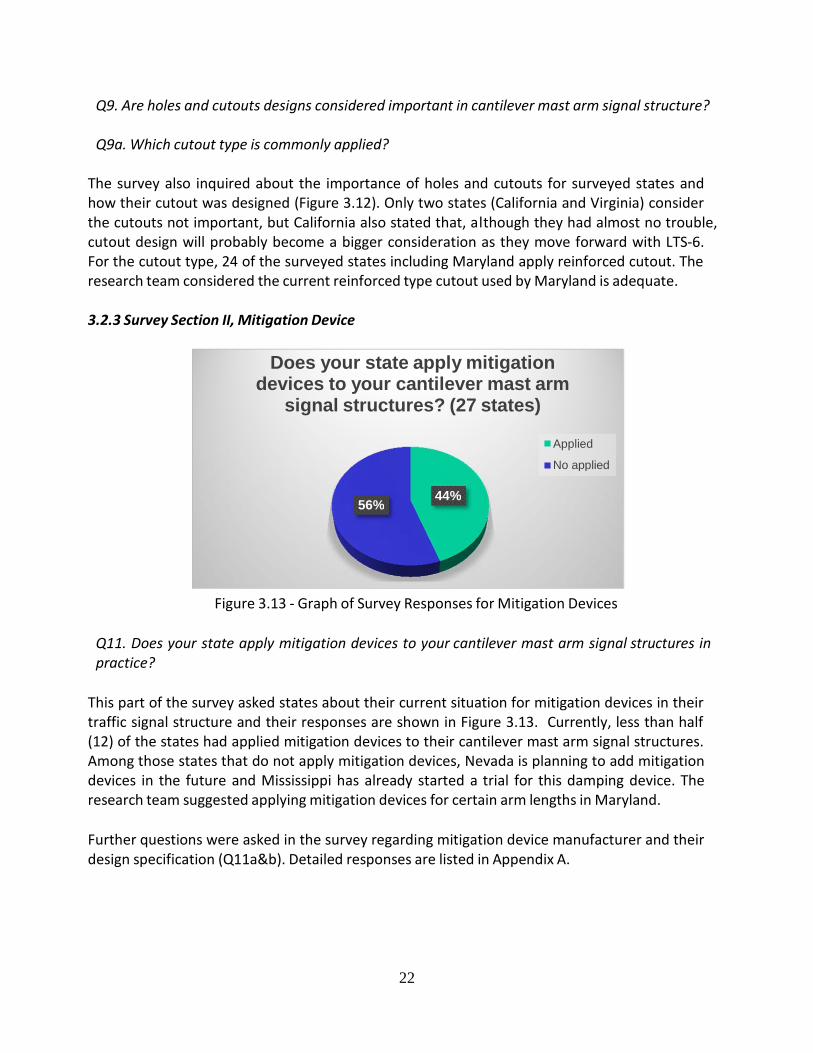
Q11. Does your state apply mitigation devices to your cantilever mast arm signal structures in practice?
This part of the survey asked states about their current situation for mitigation devices in their traffic signal structure and their responses are shown in Figure 3.13. Currently, less than half (12) of the states had applied mitigation devices to their cantilever mast arm signal structures. Among those states that do not apply mitigation devices, Nevada is planning to add mitigation devices in the future and Mississippi has already started a trial for this damping device. The research team suggested applying mitigation devices for certain arm lengths in Maryland. Further questions were asked in the survey regarding mitigation device manufacturer and their design specification (Q11a&b). Detailed responses are listed in Appendix A.
Does your state apply mitigation devices to your cantilever mast arm
signal structures? (27 states)
Applied
No applied
56% 44%

23
Chapter 4 Design Criteria based on AASHTO Specifications
4.1 Maryland Wind Speed Study AASHTO LRFD Specifications (2015) specified the Mean Recurrence Intervals (MRI) as determined in Table 4.1 shown below. The selection of the MRI accounts for the consequence of failure. As defined in the commentary of the AASHTO LRFD Specifications, a “typical” support could cross the travel way during a failure thereby creating a hazard for travelers (MRI = 700 years). All supports that could cross lifeline travel ways are assigned a high‐risk category to consider the consequence of failure (MRI=1700 years).
Table 4.1 ‐ Mean recurrence intervals (MRI) specified by AASHTO LRFD
As far as the roadside structure design is concerned, Maryland can be divided into three regions, the Eastern Shore, the Appalachia Mountain and the Baltimore‐Washington corridor. In general, Average Daily Traffic (ADT) in the Eastern Shore and Appalachia Mountain regions can be considered 1000 < ADT ≤ 10,000 and structures can be designed as “typical” supports (MRI = 700 years) while the Baltimore‐Washington corridor should be considered ADT > 10,000 where travel ways are assigned a high‐ r i s k category so that the consequence of failure (MRI=1700 years) is considered. The research team plotted 14 counties in the eastern part of Maryland (the Baltimore‐Washington corridor and Eastern Shore) and, based on the MSHA 2015 Traffic Volume Maps, drew lines that would define the ADT of their routes. In Figure 4.1, the red line indicates that the route had an AADT (Annual Average Daily Traffic) larger than 10,000 (based on 2015 data). The primary results are close to what the research team originally assumed. For the Eastern Shore area, the most routes that got an AADT larger than 10,000 were always the primary routes (inter‐state, part of the US or MD route). For the counties that have large cities (i.e. Baltimore county and Anne Arundel county), the AADTs of primary routes were always higher than 10,000, the maximum reaching 260,000.

24
Figure 4.2 shows AASHTO LRFD Specifications (2015) of the 700‐year and 1,700‐year MRI Basic wind speed on the Eastern U.S. The Baltimore‐Washington corridor has traffic volume ADT greater than 10,000 on many routes and it can be in the “high” risk category. Using the AASHTO Figure 3.8‐2b (Figure 4.2b), the 1,700‐year wind speed map shows that Baltimore‐ Washington corridor pretty much follows the 120‐ m p h line, while the Eastern Shore follows the 130‐mph line. Except for a few routes, the Eastern Shore area had ADTs between 1,000 and 10,000. The area can also be considered a “typical” risk category, so the AASHTO LRFD Specifications Figure 3.8‐1b (Figure 4.2a) showing the 700‐year wind speed map reveals that the Eastern shore follows the 120‐mph line and the Baltimore‐Washington corridor follows the 115‐mph line. Therefore, the LRFD design for Maryland can use 120‐mph for the traffic support design.
Figure 4.1 ‐ Maryland Routes with AADT Counts

25
(a) AASHTO Figure 3.8.1b ‐ 700‐year and 700‐year MRI Basic wind speed on the Eastern U.S.
(b) AASHTO Figure 3.8.2b ‐ 1,700‐ year and 1,700‐year MRI Basic wind speed on the Eastern U.S.
Figure 4.2 ‐ 700‐year and 1,700‐year MRI Basic Wind Speed on the Eastern U.S. Provided by
AASHTO LRFD Specifications (2015)
26
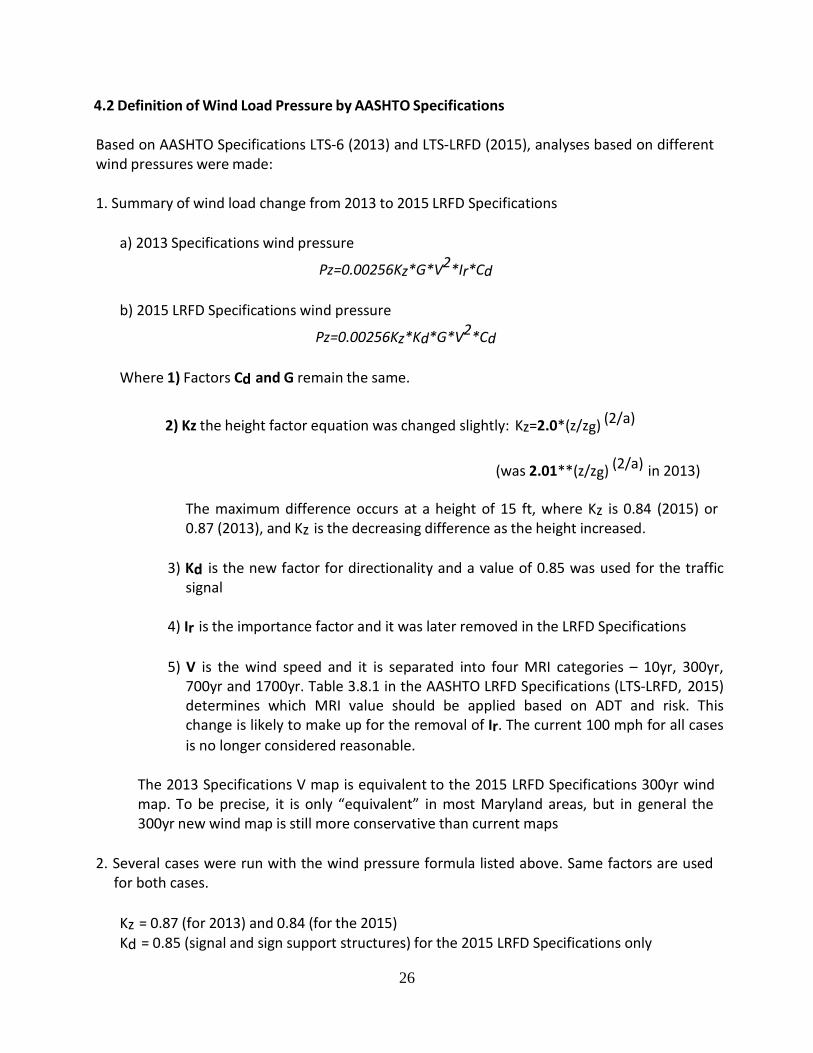
4.2 Definition of Wind Load Pressure by AASHTO Specifications
Based on AASHTO Specifications LTS‐6 (2013) and LTS‐LRFD (2015), analyses based on different wind pressures were made:
1. Summary of wind load change from 2013 to 2015 LRFD Specifications
a) 2013 Specifications wind pressure
Pz=0.00256Kz*G*V2*Ir*Cd
b) 2015 LRFD Specifications wind pressure
Pz=0.00256Kz*Kd*G*V2*Cd
Where 1) Factors Cd and G remain the same.
2) Kz the height factor equation was changed slightly: Kz=2.0*(z/zg) (2/a)
(was 2.01**(z/zg) (2/a) in 2013)
The maximum difference occurs at a height of 15 ft, where Kz is 0.84 (2015) or 0.87 (2013), and Kz is the decreasing difference as the height increased.
3) Kd is the new factor for directionality and a value of 0.85 was used for the traffic
signal
4) Ir is the importance factor and it was later removed in the LRFD Specifications
5) V is the wind speed and it is separated into four MRI categories – 10yr, 300yr, 700yr and 1700yr. Table 3.8.1 in the AASHTO LRFD Specifications (LTS‐LRFD, 2015) determines which MRI value should be applied based on ADT and risk. This change is likely to make up for the removal of Ir. The current 100 mph for all cases is no longer considered reasonable.
The 2013 Specifications V map is equivalent to the 2015 LRFD Specifications 300yr wind map. To be precise, it is only “equivalent” in most Maryland areas, but in general the 300yr new wind map is still more conservative than current maps
2. Several cases were run with the wind pressure formula listed above. Same factors are used
for both cases.
Kz = 0.87 (for 2013) and 0.84 (for the 2015) Kd = 0.85 (signal and sign support structures) for the 2015 LRFD Specifications only

27
G = 1.14 for both LRFD Specifications Cd = 1.20 for both LRFD Specifications Ir = 1.00 for the 2013 LRFD Specifications only
The results for the Baltimore‐Washington Corridor wind pressures are shown below in Table 4.2. Table 4.2 – Wind pressures based on different wind speeds and Specifications for B‐W Corridor
Specification 2013 ASD 2015 LRFD 2015 LRFD 2015 LRFD Wind speed (V) 100mph 100mph 115mph 120mph
Pz 30.47psf 25.01psf 33.06psf 36.01psf
It appears that the new 2015 LRFD Specifications 700yrs map fits with the old 2013 Specifications figures. Another case was run on the Maryland coastal line with wind speed of 120mph in the 2013 Specifications and 130mph in the 2015 LRFD Specifications and the results are shown in below in Table 4.3
Table 4.3 – Wind pressures based on different wind speeds & Specifications for MD coastal line
Specification 2013 ASD 2015 LRFD 2015 LRFD Wind speed (V) 120mph 120mph 130mph
Pz 43.88psf 36.01psf 42.26psf 4.3 Fatigue Design of Signal Structures 4.3.1 AASHTO Fatigue Design Criteria Stress ranges on all components, mechanical fasteners, and weld details were limited to satisfy:
(Δf) ≤ (ΔF) (AASHTO eq.11.5‐1) Where Δf is the wind‐load‐induced stress range and ΔF is the fatigue resistance. Fatigue design of the support structures may be conducted using:
a. The nominal stress‐based classifications of typical connection details (AASHTO LTS‐6 Article 11.9.1 and Table 11.9.3.1‐1)
(Δf)n ≤ (ΔF)n (AASHTO eq.11.5.1‐1)
b. The alternate local stress‐based and/or experiment‐based methodologies (AASHTO LTS‐6
Appendix 6)
(Δf)l ≤ (ΔF)l (AASHTO eq.D.3‐1)

28
Due to their complicity and cost, the alternate local stress‐based and experiment‐based methodologies are not considered in this study.
New support structures shall be proportioned such that the wind‐load‐induced stress is below the constant amplitude fatigue threshold (CAFT) providing infinite life.
(Δf)n ≤ (ΔF)n = (ΔF)TH (AASHTO eq.11.9.3‐1)
Existing structures shall be assessed using the remaining fatigue life based on a finite life.
(Δf)n ≤ (ΔF)n = (AASHTO eq.11.9.3‐2) This study is about the new structure design, so AASHTO eq.11.9.3‐1 was applied. 4.3.2 Fatigue Threshold CAFT Referring to Figure 1.1, it was mentioned that the pole mounting, arm attachments, and access holes are concerns for the fatigue details and relevant costs of traffic sign structures. Survey feedback and design calculations associated with each of these concerns are provided in the following sections.
Pole Mounting
Figure 4.3.1 ‐ Survey Responses for Stiffened/Unstiffened Base Plates
Are stiffened base plates commonly used for traffic signal poles? (23 states)
22%
78% Yes
No

29
0%
(a) (b)
Figure 4.3.2 – Stiffened Plate Types (a) Regular Type and (b) Stool Type
Figure 4.3.3 ‐ Survey Responses for Stiffened Plate Types Maryland is currently using non‐stiffened based plates with a 4‐bolt pattern and socketed tubes into the lateral plate with fillet welds. In the spreadsheet design, this is covered under the “Tube‐transverse‐plate” tab. Check A: Bolt connection (AASHTO Table 11.9.3.1‐1, Section 2.3)
(ΔF)TH = 7.0 ksi
Check B: Welded connection
Case A: Fillet‐welded toe on tube wall (AASHTO Table 11.9.3.1‐1, Section 5.4)
If Ki ≤ 4.0 (ΔF)TH = 7.0 ksi 4.0 < Ki ≤ 6.5 (ΔF)TH = 4.5 ksi 6.5 < Ki ≤ 7.7 (ΔF)TH = 2.6 ksi
Which stiffened plate is used? (8 states)
0%
100%
Regular Type
Stool Type
Others

30
Case B: Groove‐welded toe on tube wall (AASHTO Section 4.4)
KI = [(1.76 + 1.83tT) ‐ 4.76 x 0.22KF] x KF
If Ki ≤ 3.0 (ΔF)TH = 10. ksi 3.0 < Ki ≤ 4.0 (ΔF)TH = 7.0 ksi 4.0 < Ki ≤ 6.5 (ΔF)TH = 4.5 ksi
Where KF is the Fatigue Stress Concentration Factor for Finite Life and KI is the Fatigue Stress Concentration Factor for Infinite Life. Arm Attachment
Figure 4.4.1 – Survey Responses for Angle Box Connection Types
Figure 4.4.2 – Angle Box Connection Types (a) AASHTO (b) Angled Arm and (c) Ring‐Stiffened
Angled Box Connection Type
OTHERS 6
RING-STIFFENED BOX 12
ANGLED ARM TYPE 5
AASHTO TYPE 7
0 2 4 6 8 10 12 14

31
Maryland currently uses the angled arm box connection with a 4‐bolt pattern and the f i l let welded arm plate, and the AASHTO box connection type with a 6‐bolt pattern, where the latter is for heavy signal structures with lane use control signals. In the spreadsheet design, this is covered under the “Built‐up Box” tab with two checks. Check A: Bolt connection (AASHTO Table 11.9.3.1‐1 Section 2.3)
(ΔF)TH = 7.0 ksi
Check B: Welded connection
Case A: Fillet‐welded toe on tube wall (AASHTO Table 11.9.3.1‐1, Section 5.4)
If Ki ≤ 4.0 (ΔF)TH = 7.0 ksi 4.0 < Ki ≤ 6.5 (ΔF)TH = 4.5 ksi 6.5 < Ki ≤ 7.7 (ΔF)TH = 2.6 ksi
Case B: Groove‐welded toe on tube wall (AASHTO Sections 4.4 – 4.7)
KI = [(1.76 + 1.83tT) ‐ 4.76 x 0.22KF ] x KF
If Ki ≤ 3.0 (ΔF)TH = 10. ksi 3.0 < Ki ≤ 4.0 (ΔF)TH = 7.0 ksi 4.0 < Ki ≤ 6.5 (ΔF)TH = 4.5 ksi
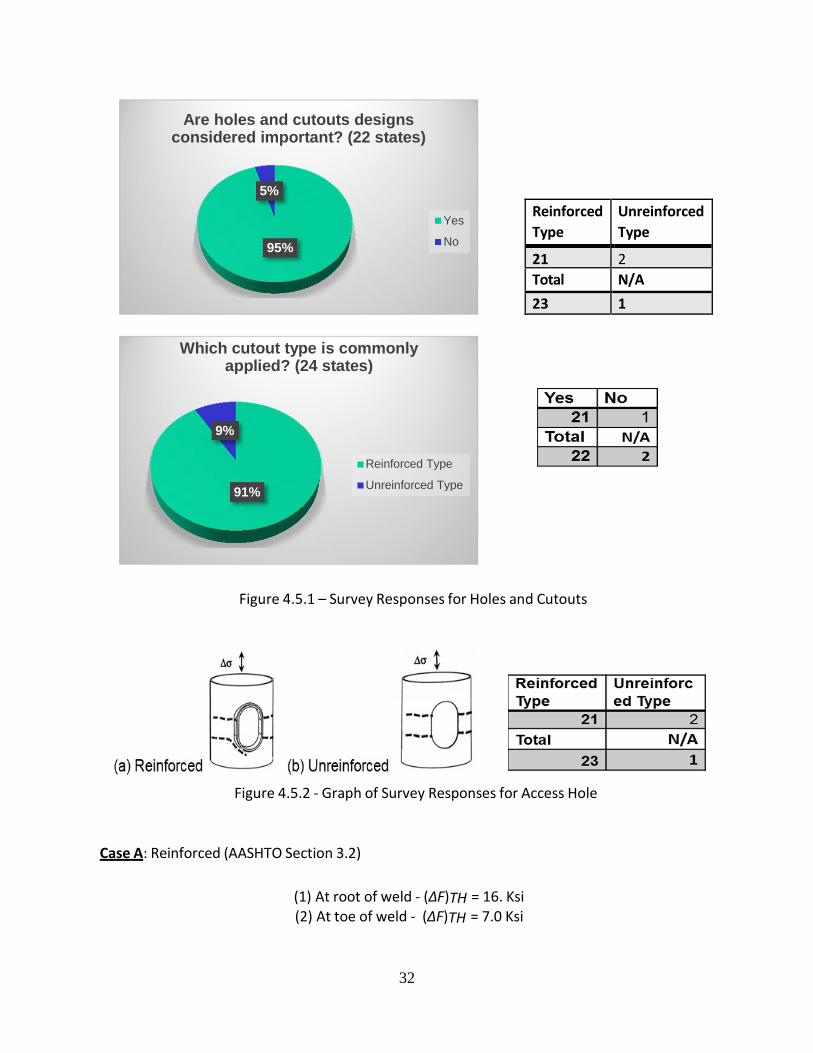
Access Hole Reinforced and unreinforced holes and cutouts shall be detailed as shown in AASHTO Figures 5.6.6.1‐1, 5.6.6.1‐2, and 5.6.6.1‐3. In the spreadsheet design, they are covered under the “Handhole (Unreinforced)” and “Handhole (Reinforced)” tabs.
32
Figure 4.5.1 – Survey Responses for Holes and Cutouts
Figure 4.5.2 ‐ Graph of Survey Responses for Access Hole
Case A: Reinforced (AASHTO Section 3.2)
(1) At root of weld ‐ (ΔF)TH = 16. Ksi (2) At toe of weld ‐ (ΔF)TH = 7.0 Ksi
Are holes and cutouts designs considered important? (22 states)
5%
Yes
95% No
Reinforced Type
Unreinforced Type
21 2 Total N/A 23 1
Which cutout type is commonly applied? (24 states)
9%
Reinforced Type
91% Unreinforced Type

33
Case B: Unreinforced (AASHTO Section 3.1)
(ΔF)TH = 24.0 Ksi 4.3.3 Fatigue Importance Factor
A fatigue importance factor, IF , accounts for the risk of hazard to traffic and damage to property and it was applied to the limit state wind‐load effects. Based on the latest AASHTO Specifications (LTS‐6, 2013), fatigue importance factors for traffic signal and sign support structures exposed to the three wind load effects are presented in the Table 4.5 below. The importance factors for cantilevered mast arm signal structures were used for this study and are bolded.
Table 4.4 ‐ Fatigue Importance Factors Provided by the AASHTO Specifications
Fatigue Importance Category Galloping Natural Wind Gusts Truck‐Induced Gusts
Cant
ileve
red I Sign
Traffic Signal 1.0 1.0
1.0 1.0
1.0 1.0
II Sign Traffic Signal
0.70 0.65
0.85 0.80
0.90 0.85
III Sign Traffic Signal
0.40 0.30
0.70 0.55
0.80 0.70
Structures classified as Category I present a high hazard in the event of failure and should be designed to resist rare wind loadings and vibration phenomena. It is recommended that all signal pole structures that do not have effective mitigation devices should be classified as Category I structures if they are located on roadways with speed limits that exceed 60km/h (35mph), and average daily traffic (ADT) that surpass 10,000 or average daily truck traffic (ADTT) above 1,000. Structures should be classified as Category III if they are located on roads with speed limits 60km/h (35 mph) or less. Structures that are located such that a failure will not affect traffic may be classified as Category III as well. All structures not explicitly meeting the Category I or Category III criteria should be classified as Category II. 4.3.4 Fatigue Design Loads
(1) Galloping (AASHTO Section 11.7.1.1)
PG = 21IF (psf) (AASHTO eq.11‐1)
(2) Natural Wind Gust (AASHTO Section 11.7.1.2)

34
PNW = 5.2CdIF (psf) (AASHTO eq.11‐5)
(3) Truck‐Induced Gust (AASHTO Section 11.7.1.3)
PTG = 18.8CdIF (psf) (AASHTO eq.11‐6) Referring to Table 4.5 once more, the Importance Factors for Category I are all baseline 1.0 for galloping, natural wind gusts, and truck‐induced gusts. If a mitigation device is used, a Category II structure with factors of 0.65, 0.80, and 0.85 for galloping, natural wind gusts, and truck‐ induced gusts, respectively, can be assumed. Galloping and natural wind gust loads are major integral parts of fatigue design loads and should be considered. Truck‐induced gust load causes minor effects and can be ignored during the fatigue checking process. However, it is still questioned if the signal structures should be classified as Category I or II, especially when galloping is considered. It was concluded that the majority of Maryland signal structures located along state routes are on roadways with a speed limit above 35 mph (56 kph) and ADT above 10,000; therefore, this puts almost all signals in the Category I condition. However, by having effective mitigation devices like wing plate, we can lower the importance factor of galloping, which usually govern the fatigue design, to Category II. Even though the effect of truck induced gust loads is relatively small compared to galloping loads, the research team suggests that they be included in the design, since there are several signal controlled roadways in the estimated 85th percentile speed of 65mph (105 kph). Another question that arises is if structures with mitigation devices galloping can be considered lower than Category I and if those mitigation devices are effective. NCHRP 469 Project research recommended that if mitigation device i s provided, the designer can use Category II instead rather than Category I, which is discussed next in section 5.2.2 (bullet B, Page 43). 4.4 Verification of Equivalent Static Pressure Range To verify the AASHTO equivalent static pressure range for fatigue, a study was conducted, and the methodology and results are discussed below. 4.4.1 Obtaining equivalent static pressure range using NCHRP‐412 (1998) The load to which each of the structures was subjected was assumed to be a sinusoidal wave in the form of:
F(t) = F0 sin wt
where F0 is the amplitude of the dynamic load required to simulate the known dynamic response amplitude, w is the circular natural frequency of the structure corresponding to the first mode of vibration in the vertical‐plane, and t is the time.

35
4.4.2 Equivalent static analysis vs time history Static Analysis
(a) (b)
Figure 4.6 – (a) Signal Pole and (b) Its Corresponding Model
The static load range was applied to the structure with the same load distributions that were used in the dynamic analyses. The static analyses were performed to evaluate the accuracy of using equivalent static load models to simulate the forces to which cantilevered support structures are subjected during occurrences of galloping and vortex shedding. The use of equivalent static load models avoids the necessity for using dynamic analyses for design. The equation below shows the model used in this study, where Fstatic is the amplitude of the load required to simulate the lift moment amplitudes measured during the wind tunnel test, and A is the projected area of the member subjected to loading.
Equivalent static pressure range The results of finite‐element simulations of the wind tunnel experiments indicate that the model cantilevered sign and signal support structures were subjected to equivalent static lift‐ pressure ranges between 1,150 and 1,770 Pa (24 and 37 psf) during occurrences of galloping‐ induced vibrations. These pressures were derived from the maximum loads obtained from the wind tunnel tests. The actual structures for which field observations of galloping were available were subjected to equivalent static pressure ranges from 775 to 1,290 Pa (16.2 to 27.0 psf) under continuous steady conditions, with one observation equivalent to a static pressure range of 1861 Pa (38.9 psf) during a brief increase in wind velocity. Thus, the wind tunnel data are conservative and reasonably consistent with respect to the field observations. It is recommended that an equivalent static lift‐pressure range equal to 1000 Pa (21 psf) be used in the design of cantilevered sign and signal support structures for galloping‐induced

36
fatigue because the value of it was the median of the loads from the field observations (775 to 1290 Pa). Taking NCHRP‐796’s (2016) second design example in Appendix C for demonstration and extending the length of arm to 75 ft, there are four signs and three signal lights in this structure. Considering Category I, its importance factor should be 1.0. The surface area for a 45‐lb signal is 520 in2, and 867 in2 for a 65‐lb signal. Equivalent static pressure on the surface is 21 psf. Summary of data under equivalent static analysis in ANSYS is shown in Table 4.6. The equivalent force was then changed to the sinusoidal force with a frequency 0.4607Hz, which is the natural frequency of the first vertical mode. The deflection due to sinusoidal dynamic load was obtained and is shown in Figure 4.9. Note that the moments under the dynamic load have the same range as the equivalent static load.
Figure 4.7 ‐ Location of signs and signals on the arm

37
Equivalent Static Force Range (lbf) 252.84 158.76 75.83 158.76 75.83 106.31 126.44
Figure 4.8 ‐ FEM for 75‐ft mast arm in ANSYS
Table – 4.5 Equivalent static analysis
Sign I Sign II Signal I Sign III Signal II Sign IV Signal III
Location (in) 127.5 393.75 468.75 618.75 669.375
849.375
900
Area (ft2) 12.04 7.56 3.61 7.56 3.61 5.06 6.02
Stress range (ksi) 14.4
Deflection range (in) 37.996
Figure 4.9 – Time history of deflection at tip of mast arm
0 2 0 4 0 6 0 8 0 1 0 1 0 1 0 1 0 1 0 2
20
15
10
5
0
‐5
‐10
‐15
‐20
0 2 4 6 8 00
Time (s)
Defle
ctio
n (in
)

38
Figure 4.10 – Time history of stress at fixed end of mast arm
0 2 0 4 0 6 0 8 0 1 0 1 0 1 0 1 0 1 0 2
8
6
4
2
0
‐2
‐4
‐6
‐8
0 2 4 6 8 00
Time (s)
Stre
ss (k
si)

39
Chapter 5 Vibration Mitigation Devices for Signal Poles Vibration and fatigue in cantilevered structures can be mitigated in one of three ways (NCHRP 469, 2002):
A. Increase the stiffness of the structure by increasing member sizes or changing structural configuration (e.g., trusses instead of monotubes). This is the simplest, but most expensive, method.
B. Damping out motion by using mechanical devices. C. Adding damping plates and louvered backplates, among other techniques, to alter the
aerodynamic characteristics of the structure and preclude the possibility of galloping. Examples of the first method include the use of bridge supports rather than cantilevered structures and the use of box trusses for mast arms (the latter use is common in Minnesota and other states). These configurations are believed to be too stiff to allow galloping to occur. This is also the reason why specifications exclude the galloping loads for the fatigue design of overhead cantilevered sign support structures with quadric‐chord horizontal trusses. Although the first method can be effective, it is sometimes perceived as too expensive. The second and third methods can both be categorized into adding a mitigation device. 5.1 Mechanical Mitigation Device Several states have studied different kinds of mechanical mitigation devices. Table 5.1 lists some of the dampers and their performances. All data in Table 5.1 is from NCHRP Report IDEA 141 (2011), NCHRP Report 469 (2002), and originally from researches d o n e b y t h e Florida Department of Transportation (Cook, et al., 2001), the University of Wyoming (Hamilton, et al. 2000), and NCHRP Report 141 (2011). Each of these feasible mitigation devices (based on tests d on e at t h e University of Florida, at the University of Wyoming, in the field of Tampa, and at Texas Tech) has one or more disadvantages. Therefore, it is tough to make a firm recommendation for one mitigation configuration over another. For locations where out‐of‐plane vibrations are not a major concern, the in‐plane strut and Florida damper (Vertical Spring‐Mass Impact Damper) appear to be the most viable options. If the owner finds the aesthetics of the strut acceptable and if the structure contains a luminaire extension, the in‐plane strut is the best option. However, if no extension exists, the Florida damper becomes the device of choice. If the owner deems impact noise a problem, a soundproofing medium could be placed between the impact surfaces. The degree to which the device is effective would likely decrease, but would still be quite effective. For locations where vibrations in both directions are concerned, the strand damper (an impact damper that functioning as a semi‐tuned mass damper after the first few cycles) appears to be the best option. In addition to the noise problem, housing will need to be constructed for the device before it can be installed. Wyoming researchers suggest the use of a large tube, which could also be used as the impact surface for the mass. For a tuned mass damper and tuned liquid damper, McDonald, et al. (1995) investigated their effectiveness in mitigating vibrations caused by galloping. The practical application of the tuned mass damper for a real traffic structure is difficult and the liquid tuned damper was ineffective in dissipating sufficient energy.

40
Table 5.1 – Various dampers with their performance
Type of Dampers Variation % Critical damping
% Increase
Commons by Prior Research
Tuned Mass Damper
Traditional 8.71 32 Frequency sensitive Stockbridge 0.42 1.5 Ineffective Batten 1.82 6.7 Frequency sensitive
Liquid Damper Horizontal 0.38 1.4 Ineffective U‐tube 0.4 1.5 Ineffective
Friction Damper 6.49 23.9 Unattractive
Strut 2.4‐6.0 16‐40 Required Luminary extension
Alcoa Dumbbell 0.26 1.7 Ineffective
Impact
Vertical Spring‐Mass Impact Damper
6.97 25 Lab free vibration
Horizontal Spring‐Mass Impact Damper
0.78 2.9 Ineffective
Spring/mass liquid impact damper
6.12 22.5 Frequency sensitive and noisy
Signal Head Vibration Absorber (SHVA)
10.1
50.5
Lab test
A University of Maryland testing team led by Drs. Zhang and Fu also conducted an experiment and compared the dissipation ability of two kinds of mechanical dampers – the tuned mass damper and the spring‐mass friction‐impact damper in 2016 (as shown in Figure 5.1). The 50‐ft full‐scale mast arm with three signals was offered by the Maryland State Highway Administration for conducting a dynamic experiment. The three signals weighed 45 lbs, 45 lbs, and 65 lbs and were located at 15 ft, 27 ft and 45 ft, respectively. The spring‐mass friction‐impact damper dissipated energy when the mass moved up and down by friction, and was also impacted when the displacement of the mass exceeded a certain range. It was found that the tuned mass damper is less effective in dissipating vertical vibration, while the spring‐mass friction‐impact damper shows better damping capability.

41
Figure 5.1 ‐ Damping test conducted at the University of Maryland
5.2 Aerodynamic Mitigation Device
For wind‐induced fatigue loads, galloping loads usually contribute more to galloping for cantilever mast‐arm traffic signal structures than truck‐induced gust and natural wind gust.
5.2.1 Theory of Galloping
Aerodynamic characteristics must be mentioned with regard to galloping. For galloping, the equation of motion of the Single‐Degree‐of‐Freedom (SDOF) system for small amplitudes of vibration can be written as:
(1)
where p is the density of fluid, V is the velocity of fluid, and A is the characteristic area of the bluff body. The force coefficient CFy can be written as:
(2) where CL and CD are lift and drag coefficients, respectively, and a is the attack of angle. So, the differentiation of CFy can be obtained at a = 0:
(3)
Moving the right side of the equation of motion to the left, for the damping term there is
FDOT mitigation device

42
( (4) And the equivalent damping coefficient is:
(5)
the first term is the mechanical damping and the second is known as the aerodynamic damping. When ce < 0, the system will have negative damping and is aerodynamically unstable.
Since the first term (mechanical damping) is surely positive, instability will only occur if
(6)
This is the well‐known Den Hartog’s criterion (1956), a necessary condition for galloping. i s the
key property for whether or not resulting galloping in the structure. 5.2.2 Previous studies on galloping of traffic signal structures Many previous studies show the theory and importance of galloping. Some of them also investigated the ability of an aerodynamic mitigation device in reducing the galloping affect. The following explains relevant details from different galloping studies on traffic signal structure:
A. Wind‐Induced Vibrations of Cantilevered Traffic Signal Structures, 1995 Wind Load Effects on Signs, Luminaires, and Traffic Signal Structures (TXDOT report No. 1303‐1F), 1995 The signal structures were observed to be vibrating under a narrow set of conditions. These conditions were first identified from the tow tank experiments. Large amplitude vibrations occur when the wind blows from the backside of the signal lights with a backplane attached. These large amplitude vibrations are due to the galloping phenomenon, which is caused by aerodynamic instability. It also shows that adding a wing plate with enough size onto the signal structure at the right location can prevent galloping from happening.
Comments: Based on this report, the specification explains how galloping affects fatigue. Also, it states that a wing plate can stop the occurrence of galloping.
B. NCHRP REPORT 469 Fatigue‐Resistant Design of Cantilevered Signal, Sign, and Light Supports,
2002 The 2001 Specifications allow the designer to ignore the galloping loads if an approved vibration mitigation device is used. The device can be applied either at the time of erection or later after a galloping problem has been observed. The 2001 Specifications also allow for the exclusion of galloping loads in the design of box‐truss (i.e., four‐chord) structures. Such structures have never been observed to gallop presumably because of their inherently high degree of three‐dimensional stiffness.

43
Vibration mitigation testing has identified three devices that will likely decrease galloping‐ induced stresses by at least 35 percent. Based on these results, it is recommended that if mitigation devices are provided, the designer should not be allowed to totally ignore the galloping load. The designer can instead use Category II rather than Category I, which will reduce the magnitude of the loads. Also, it is mentioned in the NCHRP 469 report that adding damping plates and louvered backplates, among other techniques, can alter the aerodynamic characteristics of the structure and preclude the possibility of galloping. Comments: It is mentioned in the 2001 Specifications that the galloping loads can be ignored only if an approved vibration mitigation device is used in Section 3.1.1. The study of the research shows that the device can reduce the amplitude. But rather than ignoring the galloping, it is better to shift the Importance Category from I to II.
C. Field Tests and Analytical Studies of the Dynamic Behavior and the Onset of Galloping in
Traffic Signal Structures (TXDOT report No. FHWA/TX‐08/0‐4586‐1), 2007 With specific reference to the design equation for galloping (Eq. 11‐1) in Section 11.7.1 of the AASHTO Specifications (2002), no actual galloping events were recorded in the field tests of the present study from which one can assess the acceptability of the equivalent static pressure used for design. However, based on the analytical studies conducted as part of this study, it was shown that the forces induced by galloping depend on the location of the attachments (signals, panels, etc.) on the arm. Greater forces are expected at locations closer to the tip of the arm. The expectation is that Eq.11‐1 in the Specifications should probably recognize that a panel of the same area at different locations along the arm is unlikely to experience the same vertical shear range. Additional work in this area is suggested so that the design equation may be appropriately modified in the future.
Comments: The field study in this report shows that galloping is a rare occurrence. But it is also said that the installment of attachments will affect the galloping. To reduce galloping the plate should be located closer to the tip of the arm. It is also imperative to mention that the higher the wind speed, the larger the size of the wing plate should be to prevent galloping.
D. Risk Assessment Model for Wind‐Induced Fatigue of Cantilever Traffic Signal Structures, 2008
The findings of these wind tunnel experiments agree with some of the findings initially reported by TTU researchers. On finding claimed that large‐amplitude vibrations of mast arms are more prone to occur when the signals have backplates and when the wind blows from the back of the signals. On the other hand, galloping, which is generally considered to be the main cause of fatigue failures, was found to occur rarely in this study. Typical galloping behavior would be to increase the magnitude of the vibrations with an increase of wind speed, yet this was only observed for an angle of attack of 135° under very smooth flow. This contradicts the notion that galloping is the main cause of fatigue failures of cantilever traffic

44
signal structures. The experiments did reveal that there are complex interactions between angle of attack and response, which is likely to be the case with vortices being shed from upwind backplates and interacting with downwind structures (visors) for oblique wind direction.
E. Full‐Scale Controlled Tests of Wind Loads on Traffic Signal Structures, 2008
It has been observed throughout this experiment that large amplitude vertical vibrations of mast arms having signals with backplates occur for the most part at low wind speed ranges, and as the wind speed increases the amplitude of the vertical vibrations decreases. Having large vibrations at a certain wind speed range reflects the typical behavior of vibrations induced by vortex shedding. This contradicts the theory that vortex shedding does not cause large enough vibrations of mast/arms that could lead to fatigue failure. Large vibrations are generally attributed to galloping (AASHTO; Cook, et al.; Dexter & Ricker, Kaczinski, et al.; Pulipaka, et al.) where vibration amplitude increases with wind speed. Such galloping was not observed in this study.
Comments: Once considered ignoring galloping by VDOT may have been based on these two reports from TxDOT. These reports state that the vortex is the main reason for vertical vibration, which contradicts the conclusion of Pulipaka (1995) that galloping is the main reason. But in the analysis, galloping could occur. Under specific configurations, wind speed, and attack angle, galloping could also appear.
F. FDOT Modifications to Standard Specifications for Structural Supports, 2016
The 2nd, 3rd and 4th paragraphs of 11.7.1 galloping in the Specifications were replaced with the following:
Vibration Mitigation devices are not allowed in lieu of designing for galloping. Exclude galloping loads for the fatigue design of overhead cantilevered sign and VMS support structures with three or four chord horizontal trusses with bolted web to chord connections.
Comments: The Vibration Mitigation cannot replace the current designs for galloping, while in the old specification the galloping could be ignored. It is listed here as a reference for Maryland signal pole design.
5.2.3 The Mitigation Ability of Wing Plate Adding damping plates and louvered backplates, among other techniques, can alter the aerodynamic characteristics of the structure and preclude the possibility of galloping. Research performed at Texas Tech University in 1995 showed that wing plates were effective for signal poles with horizontal signal heads in McDonald, et al. (1995). The horizontal damping plate can alter the aerodynamic damping of the traffic structure.

45
(a) (b)
Figure 5.2 – Galloping force coefficient with specific traffic signal configuration (a) traffic light tilt 15° and (b) arm with horizontal damping plate
Figure 5.2(a) shows that for a specific configuration the traffic light may result in negative aerodynamic damping. For the horizontal damping plate (Figure 5.2(b)), the dCFy/da keeps positive to obtain positive dynamic stability (McDonald, et al., 1995). Also, McDonald conducted a field test to investigate the mitigation of a wing plate for galloping. The configuration of the wing and traffic light is shown below. It should be mentioned that the plate must be mounted directly above the signal light to be effective.
Figure 5.3 ‐ Mounting arrangement for large damping plate (wing)

46
Figure 5.4 – RMS vertical pole strain versus run number for a 48‐ft signal structure
The field test result of a 48‐ft signal structure is shown above in Figure 5.4 and the configuration of the signal is shown in Figure 5.3 (McDonald, et al., 1995). The RMS, which is the root mean square of the fluctuating strain component for each five‐ m i n u t e record, is a measure of the amount of fluctuation of the strain about a zero mean. A large value of RMS implies large fluctuation (displacements) of the signal structure. From the figure shown above, galloping is expected from record 27 to 91 when the wind direction is favorable for galloping due to certain wind directions and speeds. Little or no galloping is indicated for records from 27 to 75, as shown by the relatively small values of RMS during that time. At about record 73, the plate was quickly removed from the signal structure. Values of RMS in Figure 5.4 indicate very strong galloping from record 75 to 91. At record 91 the wind direction has shifted more than 10°, so it is no longer normal to the back side of the signal structure. Thereafter, galloping is not observed in Figure 5.4. The absence of galloping is further verified by observing the variations of wind speed between records 115 and 172, yet the RMS remained essentially constant. The report also clarified that, to be effective, the plate must be mounted above the signal light with at least a 3‐in. (8‐cm) separation between the damping plate and the top of the signal light backing plate. The large wing, which is a standard sign blank, is essential for effective mitigation of the vibration. TXDOT report FHWA/TX‐07/4586‐1 (Florea, et al., 2007) did parametric studies on the size and location of wing plate and the following figures exhibit the ones related to the minimum required speed for galloping.
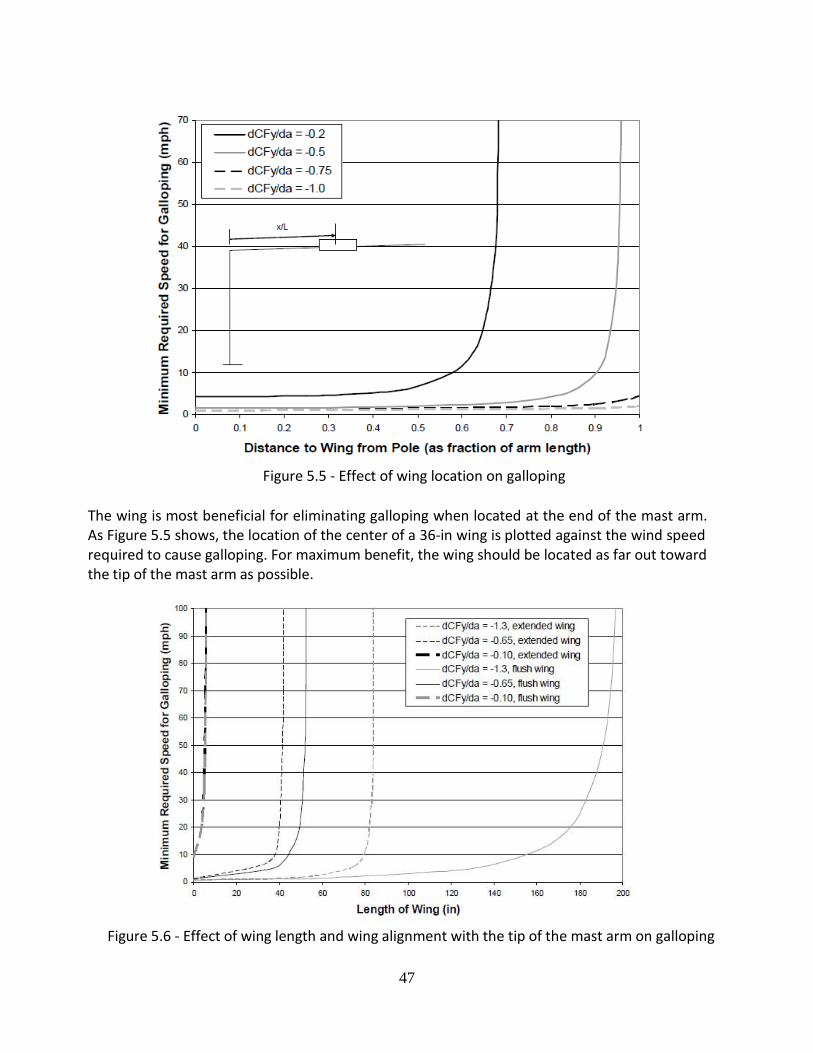
47
Figure 5.5 ‐ Effect of wing location on galloping
The wing is most beneficial for eliminating galloping when located at the end of the mast arm. As Figure 5.5 shows, the location of the center of a 36‐in wing is plotted against the wind speed required to cause galloping. For maximum benefit, the wing should be located as far out toward the tip of the mast arm as possible.
Figure 5.6 ‐ Effect of wing length and wing alignment with the tip of the mast arm on galloping

48
A longer wing needs a higher wind speed to initiate galloping. As Figure 5.6 demonstrates, to prevent galloping at a given wind speed the minimum length of the wing varies considerably for different dCFy/da values of the signals. It also varies considerably with small changes in location of the wing – flush with the end of the mast arm or with its center lined up with the end of the arm and extending beyond it. As an example, for medium negative dCFy/da, a 60‐in wing can prevent the occurrence of galloping. 5.2.4 Louvered Backplate Most states have been applying backplates on signals for safety reasons. But adding the backplate will increase the area of signal light, which largely increases the galloping load in the specification. NCHRP REPORT 469 (2002) mentioned that a louvered backplate can reduce the galloping effect. Based on t h e specification, a louvered backplate can certainly reduce t h e equivalent static galloping load due to deducted area compared with same size non‐louvered backplate. But there is no study on how much the louvered backplate can reduce the galloping or if the louvered backplate can completely prevent galloping. Furthermore, it is also mentioned in NCHRP 469 (2002) that signal poles outfitted with louvered backplates were still observed to gallop in Colorado, which cast doubt on the efficiency of louvered backplates in mitigating galloping. The following figure (Figure 5.7) shows the percentages of applying non‐louvered and louvered backplates. Maryland currently adopts not using signal head backplates and is considering applying non‐ louvered backplates.

49
Figure 5.7 ‐ Percentages of states adopting louvered and non‐louvered backplate 5.3 Numerical Analysis
To investigate the damping effect of the wing plate, fluid‐ solid interaction (FSI) analysis is required to proceed the numerical analysis. There are two types of fluid‐solid interaction in the numerical analysis: one‐way FSI analysis and two‐way FSI analysis. This section shows the FSI analysis of the 75‐ft mast arm with a wing plate based on the software ANSYS workbench 5.3.1 Aerodynamic parameters The wind speed inducing galloping is not the same as the extreme wind speed. Galloping happens when the wind speed is low but steady. In NCHRP Report 469 (2002), it depicts that 285 U.S. cities found that 87 percent of the cities had yearly mean velocities of less than 5 m/s (11.18 Mph), and 98 percent were less than 5.8 m/s (12.97 Mph). Thus, it was decided to use 5 m/s as the baseline yearly mean wind speed (corresponding to a fatigue‐limit‐state wind velocity of 17 m/s) in the recommended equivalent natural wind‐gust pressure range equation in the AASHTO LTS code. Therefore, the 5 m/s (11.18 Mph) wind speed is adopted here for FSI analysis.
Use of Signal Head Back Plates (24 states)
No BP
4% Use BP
Use BP No BP 96%
Back Plate Type (20 states)
louvered 39%
non- louvered
61%
louvered
non-louvered

50
Reynolds number needs to be decided first before FSI analysis. For the 70‐ft and 75‐ft arm, the diameter of the section at the tip is 6.95 in (0.1765 m). Therefore, its Reynolds number can be calculated based on the formula:
where ρ is the density of the fluid (kg/m3); u is the velocity of the fluid with respect to the object (m/s); L is a characteristic linear dimension, which is same as the diameter when fluid flows around the cylinder (m); and μ is the dynamic viscosity of the fluid (kg/m∙s). Table 5.2 shows the properties of the air used in this study. Based on the high Reynolds Number, the turbulent flow should be used in FSI analysis.
Table 5.2 Air properties Parameters SI units USC units Density (ρ) 1.225 (kg/m3) 0.0765 (lb/ft3) Velocity (u) 5 (m/s) 11.185 (Mph) Characteristic linear dimension (L) 0.17653 (m) 6.95 (in) Dynamic viscosity (µ) 1.7894e‐05 kg/(m∙s) 1.202421e‐05(lb/ft∙s) Reynolds number(Re) 60425
5.3.2 One‐way FSI analysis For one‐way FSI analysis, the structural part only plays the role of rigid obstacle in fluid flow, which means that the structural part itself will not yield deformation to affect the fluid field. 2D on‐way FSI analysis is adopted to investigate the drag coefficient and lift coefficient of the mast arm structure with wing plate. The dimension of the arm plus the wing plate was shown in Figure 5.8
. Figure 5.8 Dimension of the wing plate
The initial run for a cylinder was executed in ANSYS Fluent. Based on the LTS code, the drag coefficient is about 1.1 corresponding to the Reynolds number 60425. In Fluent the cylinder has a drag coefficient about 1.035, which is close to the theoretic value.

51
The lift coefficient at a different attack angle of the arm attached with wing plate was analyzed then in ANSYS Fluent. The variation of the lift coefficient with attack of angle is shown in Figure 5.9. Based on the Den Hartog’s criterion shown in Part 5.2.1,
So, the wind plate has the damping effect when galloping occurred. Its equivalent damping effect can be expressed as:
Angle of Attack (°)
Figure 5.9 Variation of galloping force coefficient with attack of angle 5.3.3 Two‐way FSI analysis Two‐way FSI analysis can simulate the transient structural response due to the flow in the fluid domain and the change of fluid flow due to the structural interruption in the fluid domain simultaneously. Two‐way FSI analysis requires very high computational performance, and it requires much more time for calculation. Due to the computational limit of personal computers, the fluid domain in this study was limited only to the tip plate zone to obtain a smaller mesh size and cut down on the computational time. The fluid domain is shown in Figure 5.10.
0 ‐2 0 0 2 0 4
1.5
1
0.5
0 ‐4 0
‐0.5
‐1
‐1.5
Lift
Coe
ffici
ent C
Fy

52
Figure 5.10 Geometry of the two‐way FSI analysis (the cuboid zone is the fluid domain)
Air properties are the same as in the 2D one‐way FSI analysis. The three‐point mass of 45 lb, 45 lb and 65 lb was located at 39ft, 56ft, and 75ft respectively. The point mass configuration is much smaller than the mass of signal and signs in real practice. But here, the mass just uses to offer the mass matrix in dynamic analysis. The main purpose of this part is to review the feasibility of the wing plate in aerodynamic damping. The 100‐lbf upward force was applied at the tip of the arm to initiate the vibration in the first second. The time history of the displacement at the tip of the arm is shown in Figure 5.11. It shows that the wing plate p lus st ructura l damping mitigated the vertical vibration in the fluid domain with means wind speed of 5m/s. After 10 seconds, the vertical displacement at the tip with the wing plate will be reduced to 65% of displacement under free vibration. Further studies are needed to ensure whether the wing plate can satisfy all the configuration of signs and signals with different arm lengths. This analysis only provides preliminary results. To study the effectiveness of the damping plate, parametric study based on proper parameter must be made. Further studies are needed to ensure whether the wind plate can satisfy all the configuration of signs and signals with different arm length.
Figure 5.11 Time history of the displacement at the tip of the arm with wind speed of 5m/s (11.18Mph)
Defle
ctio
n (in
)
W
0 1 2 3 4 5 6 7 8 9 1
15
10
5
0
0 ‐5
‐10 ‐15
Time (s)
With wing plate Free vibration

53
5.4 Summary Qualified mitigation devices can be classified as mechanical damping devices and aerodynamic damping devices. Table 5.1 lists comparison for current mechanical vibration mitigation devices on signal support structures. Horizontal damping plates and louvered backplates, among other techniques, can alter the aerodynamic characteristics of the structure and are classified as aerodynamic damping devices. Some devices are more effective than others for a certain loading, but AASHTO did not state which ones are considered “effective mitigation devices” and where Category II with lower factors can be used. The ongoing NCHRP 12‐111 (2017) “Evaluating the Effectiveness of Vibration‐Mitigation Devices for Structural Supports of Signs, Luminaires, and Traffic Signals” is trying to fill the gap. Among mechanical damping devices, spring‐mass impact damper is the most effective mitigation device, but different kinds of impact damper may still have different effectiveness (e.g. vertical spring‐mass impact damper is effective in in‐plane vibration). If spring‐mass impact damper on both vertical and horizontal directions is used, all fatigue load categories can be lowered from Category I to II. Among aerodynamic damping devices, according to NCHRP 469 (2002), signal poles outfitted with louvered backplates were still observed to gallop in Colorado. It is recommended that louvered backplate is not considered an effective mitigation device. For cost considerations, the horizontal damping plate is an effective aerodynamic mitigation device for a galloping load. If t h e horizontal damping plate is used, it is recommended that only galloping be lowered to Category II. The case of the 75‐ft arm with 24inX24in wing plate (adopted by PennDOT) was analyzed in ANSYS fluent in ANSYS Workbench. The 2D one‐way FSI analysis proved that the variation of lift coefficient to the angle of attack is positive, which means the device could prevent the occurrence of galloping based on the Den Hartog’s criterion. A more detailed 3D two‐way FSI analysis shows the time history of the vibration of the arm in 10 seconds with the initial upward load o f 100 lbf in 1 second. Compared with the structures under free vibration, the wing plate demonstrates visible damping effect in the numerical analysis. It should still be noted that studies of aerodynamic mitigation are fewer than studies of mechanical mitigation devices due to the difficulties of simulation of the wind field in the lab, along with long‐term and uncertainty of field tests. Further studies and reviews should be conducted. Among aerodynamic damping devices, according to NCHRP 469 (2002), signal poles outfitted with louvered backplates were still observed to gallop in Colorado. It is recommended that the louvered backplate not be considered as an effective mitigation device. For cost consideration, the horizontal damping plate is an effective aerodynamic mitigation device for galloping load. If horizontal damping plate is used, it is recommended that only galloping be lowered to Category II.

54
It should be noted that studies of aerodynamic mitigation are fewer than studies of mechanical mitigation devices due to the difficulties of simulation of the wind field in the lab, along with long‐term and uncertainty of field tests. Further studies and reviews should be conducted.

55
Chapter 6 Signal Pole Design based on Maryland's Assumptions
6.1 Maryland assumption in SABRE model A series of signal pole models is designed based on Maryland’s assumptions.
1.) Structure Design Parameter
The mast arm structure has a pole height of 27 ft and an arm elevation of 18 ft (Figure 6.1). Four sets of models are created with various mast arm lengths (50, 60, 70 and 75 ft). Both pole and arm have a taper value of 0.14 in/ft. For the fatigue analysis, both the base and arm connections were designed as full‐penetration groove‐welded connections, which have a maximum threshold of stress range of 10 ksi. The connection anchor bolt designs are in a circular 6‐bolt pattern at the pole base and in a row bolt pattern at the mast arm connection. The stress range threshold for each bolt is 7 ksi. For the Combined Stress Ratio (CSR), the limit is conservatively set to 0.75 instead of 1.0 to allow design variations.
Figure 6.1 – SABRE input for a typical 50’ signal pole
2.) Layout A typical layout for the signal pole arm was modeled in the SABRE program (Figure 6.1). This layout includes five 3‐head signals, one 8×1.333 street name sign and two 2.5×3 regulatory signs at the tip of the arm. Figure 6.2 shows the comparison for Maryland typical layout (60 ft) and SABRE model layout. The street name sign and regulatory sign weighed 15 lbs. and 10 lbs., respectively, while the 3‐head signal weighed 55 lbs.

56
Figure 6.2 ‐ Comparison for Maryland typical 60’ layout sketch and SABRE model simulation
3.) Fatigue Related Factors
The model was assumed to be equipped with a mitigation device. The fatigue design was lowered to Category II, with a galloping factor of 0.65, a natural wind factor of 0.80, and a truck‐ induced factor of 0.85. Based on the yearly mean wind velocity of 11.2 mph and truck‐induced gust vehicle speed of 65 mph, the drag coefficient Cd in this model was 1.2.
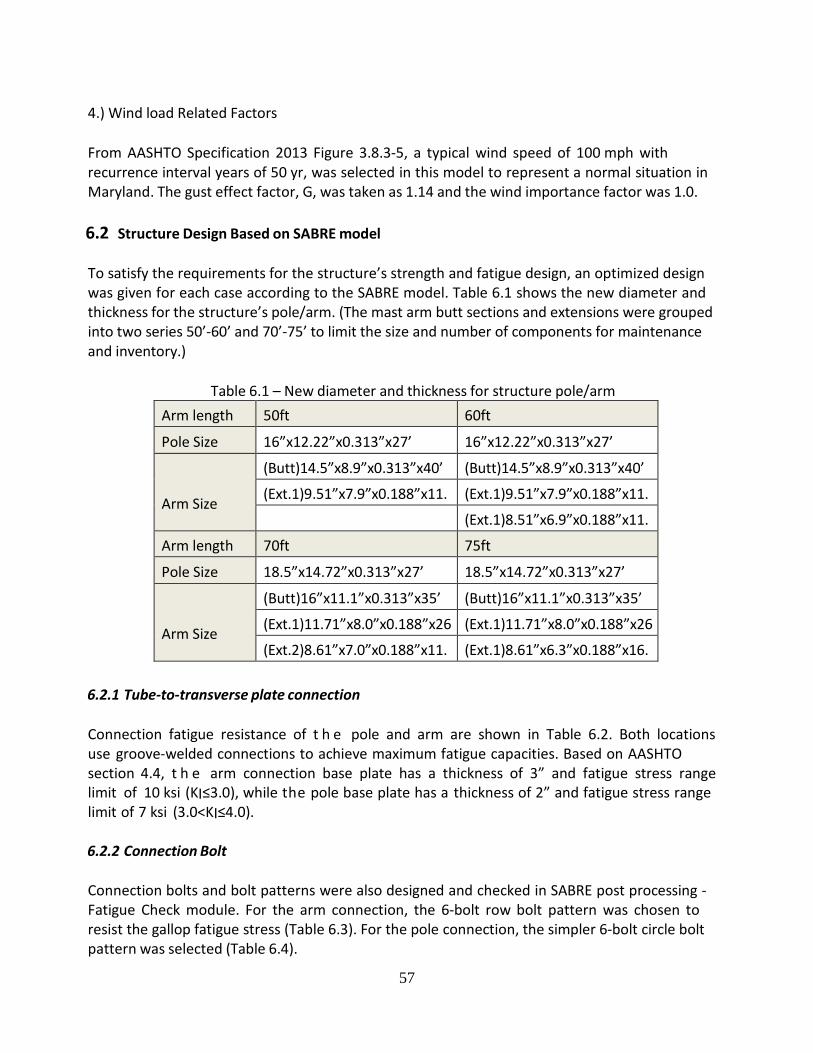
57
4.) Wind load Related Factors From AASHTO Specification 2013 Figure 3.8.3‐5, a typical wind speed of 100 mph with recurrence interval years of 50 yr, was selected in this model to represent a normal situation in Maryland. The gust effect factor, G, was taken as 1.14 and the wind importance factor was 1.0. 6.2 Structure Design Based on SABRE model To satisfy the requirements for the structure’s strength and fatigue design, an optimized design was given for each case according to the SABRE model. Table 6.1 shows the new diameter and thickness for the structure’s pole/arm. (The mast arm butt sections and extensions were grouped into two series 50’‐60’ and 70’‐75’ to limit the size and number of components for maintenance and inventory.)
Table 6.1 – New diameter and thickness for structure pole/arm Arm length 50ft 60ft
Pole Size 16”x12.22”x0.313”x27’ 16”x12.22”x0.313”x27’ Arm Size
(Butt)14.5”x8.9”x0.313”x40’ (Butt)14.5”x8.9”x0.313”x40’
(Ext.1)9.51”x7.9”x0.188”x11.
(Ext.1)9.51”x7.9”x0.188”x11. (Ext.1)8.51”x6.9”x0.188”x11. Arm length 70ft 75ft
Pole Size 18.5”x14.72”x0.313”x27’ 18.5”x14.72”x0.313”x27’ Arm Size
(Butt)16”x11.1”x0.313”x35’ (Butt)16”x11.1”x0.313”x35’
(Ext.1)11.71”x8.0”x0.188”x26
(Ext.1)11.71”x8.0”x0.188”x26 (Ext.2)8.61”x7.0”x0.188”x11.
(Ext.1)8.61”x6.3”x0.188”x16.
6.2.1 Tube‐to‐transverse plate connection Connection fatigue resistance of t h e pole and arm are shown in Table 6.2. Both locations use groove‐welded connections to achieve maximum fatigue capacities. Based on AASHTO section 4.4, t h e arm connection base plate has a thickness of 3” and fatigue stress range limit of 10 ksi (KI≤3.0), while the pole base plate has a thickness of 2” and fatigue stress range limit of 7 ksi (3.0<KI≤4.0). 6.2.2 Connection Bolt Connection bolts and bolt patterns were also designed and checked in SABRE post processing ‐ Fatigue Check module. For the arm connection, the 6‐bolt row bolt pattern was chosen to resist the gallop fatigue stress (Table 6.3). For the pole connection, the simpler 6‐bolt circle bolt pattern was selected (Table 6.4).

58
Table 6.2 – Connection fatigue resistance of pole and arm
Column Base Check 50ft
Arm (plate thickness 3
inch.)
(Mz) max = 382.8 kip‐in C.S.R
(fR)col= 7.91 Ksi Groove‐Welded toe on tube wall
0.496 CAFT 10 OK
Pole (plate thickness 2
inch.)
(Mz) max = 394.8 kip‐in C.S.R
(fR)col= 6.66 Ksi Groove‐Welded toe on tube wall
0.544 CAFT 10 OK
Column Base Check 60ft
Arm (plate thickness 3
inch.)
(Mz) max = 458.4 kip‐in C.S.R
(fR)col= 9.47 Ksi Groove‐Welded toe on tube wall
0.588 CAFT 10 OK
Pole (plate thickness 2
inch.)
(Mz) max = 470.4 kip‐in C.S.R
(fR)col= 7.91 Ksi Groove‐Welded toe on tube wall
0.683 CAFT 10 OK
Column Base Check 70ft
Arm (plate thickness 3
inch.)
(Mz) max = 522 kip‐in C.S.R
(fR)col= 8.8 Ksi Groove‐Welded toe on tube wall
0.599 CAFT 10 OK
Pole (plate thickness 2
inch.)
(Mz) max = 532.8 kip‐in C.S.R
(fR)col= 6.67 Ksi Groove‐Welded toe on tube wall
0.625 CAFT 10 OK
Column Base Check 75ft
Arm (plate thickness 3
inch.)
(Mz) max = 560.4 kip‐in C.S.R
(fR)col= 9.45 Ksi Groove‐Welded toe on tube wall
0.666 CAFT 10 OK
Pole (plate thickness 2
inch.)
(Mz) max = 572.4 kip‐in C.S.R
(fR)col= 7.16 Ksi Groove‐Welded toe on tube wall
0.651 CAFT 10 OK

59
Table 6.3 ‐ 6‐bolts row bolt pattern for arm connection
Arm Dia dar = 1.75 in
Row bolt pattern Thread series = 6 unc. CAFT 7
(M)xbot = 382.8 kip‐in (fR)x,rod = 5.62 (M)zbot = 132 kip‐in (fR)z,rod = 1.38
Outer bolt circle Inner bolt circle OK No. of bolts = 4 No. of bolts = 2 Z from neutral 8.5 Z from neutral 0 X from neutral 10 X from neutral 10
Arm Dia dar = 1.75 in Row bolt pattern Thread series = 6 unc CAFT 7
(M)xbot = 458.4 kip‐in (fR)x,rod = 6.73 (M)zbot = 158.4 kip‐in (fR)z,rod = 2.31
Outer bolt circle Inner bolt circle OK No. of bolts = 4 No. of bolts = 2 Z from neutral 8.5 Z from neutral 0 X from neutral 10 X from neutral 10
Arm Dia dar = 2 in Row bolt pattern Thread series = 4.5 unc CAFT 7
(M)xbot = 522 kip‐in (fR)x,rod = 5.72 (M)zbot = 146.4 kip‐in (fR)z,rod = 1.3
Outer bolt circle Inner bolt circle OK No. of bolts = 4 No. of bolts = 2 Z from neutral 9 Z from neutral 0 X from neutral 11 X from neutral 11
Arm Dia dar = 2 in Row bolt pattern Thread series = 4.5 unc CAFT 7
(M)xbot = 560.4 kip‐in (fR)x,rod = 6.14 (M)zbot = 193.2 kip‐in (fR)z,rod = 1.15
Outer bolt circle Inner bolt circle OK No. of bolts = 4 No. of bolts = 2 Z from neutral 9 Z from neutral 0 X from neutral 11 X from neutral 11
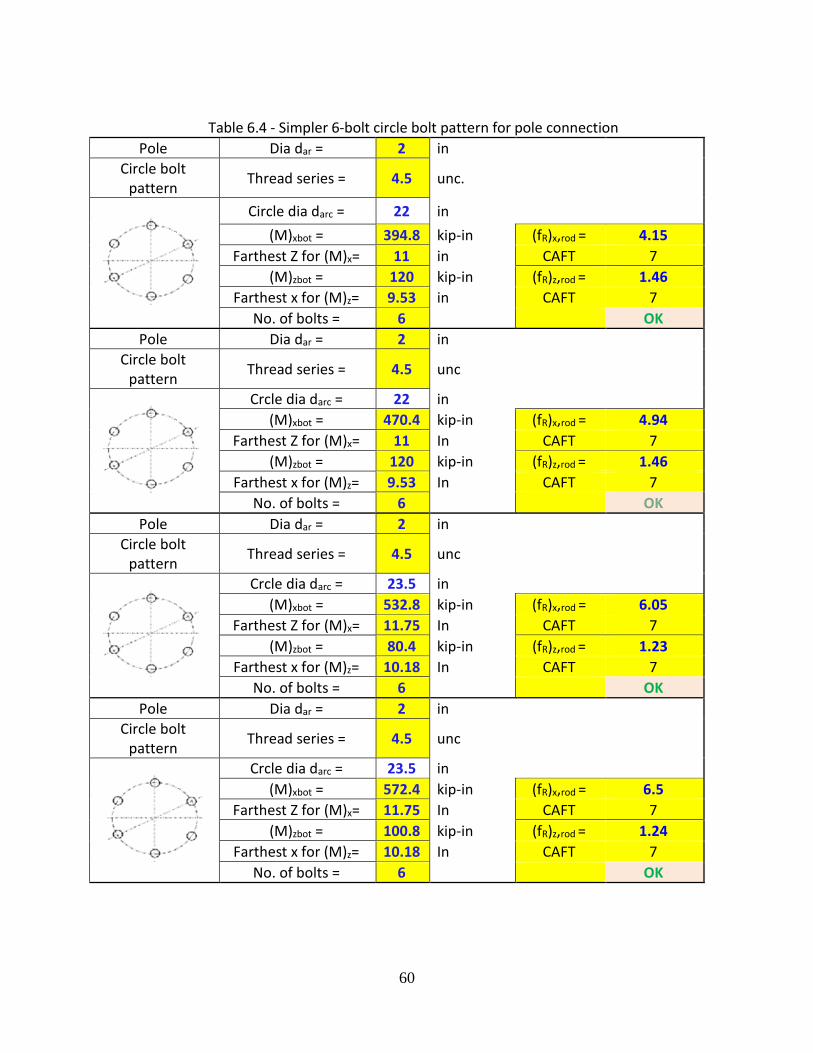
60
Table 6.4 ‐ Simpler 6‐bolt circle bolt pattern for pole connection
Pole Dia dar = 2 in Circle bolt
pattern Thread series = 4.5 unc.
Circle dia darc = 22 in (M)xbot = 394.8 kip‐in (fR)x,rod = 4.15
Farthest Z for (M)x= 11 in CAFT 7 (M)zbot = 120 kip‐in (fR)z,rod = 1.46
Farthest x for (M)z= 9.53 in CAFT 7 No. of bolts = 6 OK
Pole Dia dar = 2 in Circle bolt
pattern Thread series = 4.5 unc
Crcle dia darc = 22 in (M)xbot = 470.4 kip‐in (fR)x,rod = 4.94
Farthest Z for (M)x= 11 In CAFT 7 (M)zbot = 120 kip‐in (fR)z,rod = 1.46
Farthest x for (M)z= 9.53 In CAFT 7 No. of bolts = 6 OK
Pole Dia dar = 2 in Circle bolt
pattern Thread series = 4.5 unc
Crcle dia darc = 23.5 in (M)xbot = 532.8 kip‐in (fR)x,rod = 6.05
Farthest Z for (M)x= 11.75 In CAFT 7 (M)zbot = 80.4 kip‐in (fR)z,rod = 1.23
Farthest x for (M)z= 10.18 In CAFT 7 No. of bolts = 6 OK
Pole Dia dar = 2 in Circle bolt
pattern Thread series = 4.5 unc
Crcle dia darc = 23.5 in (M)xbot = 572.4 kip‐in (fR)x,rod = 6.5
Farthest Z for (M)x= 11.75 In CAFT 7 (M)zbot = 100.8 kip‐in (fR)z,rod = 1.24
Farthest x for (M)z= 10.18 In CAFT 7 No. of bolts = 6 OK
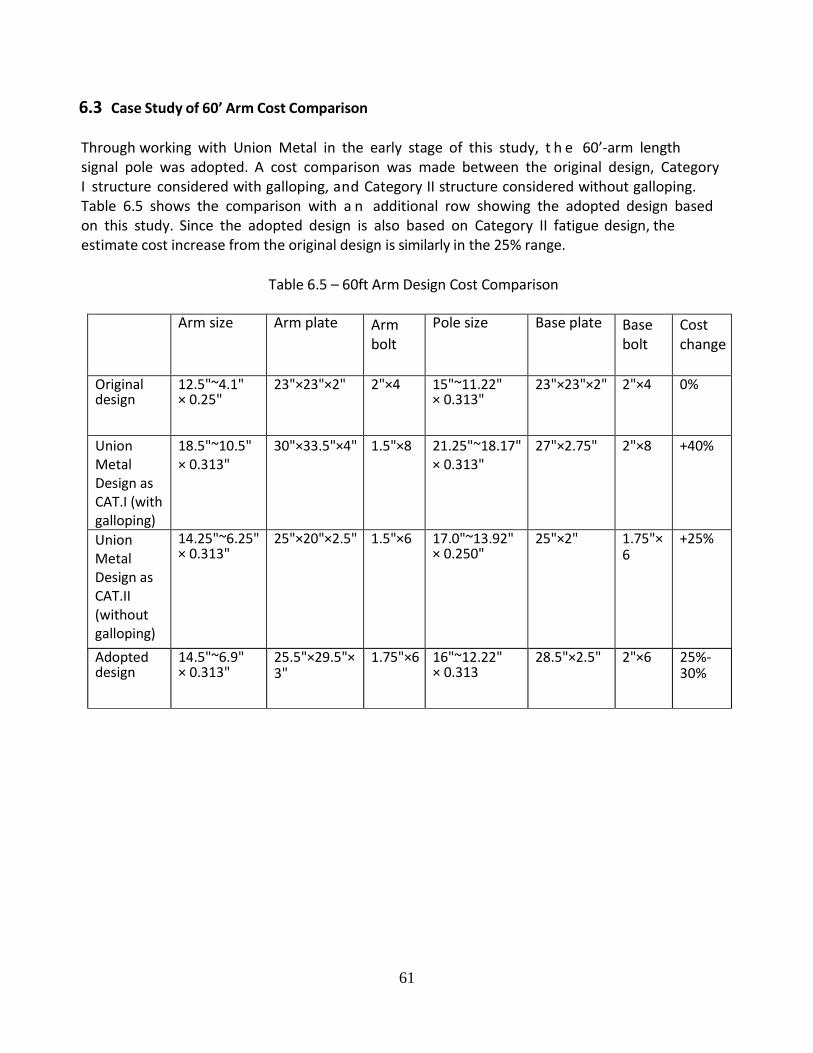
61
6.3 Case Study of 60’ Arm Cost Comparison Through working with Union Metal in the early stage of this study, t h e 60’‐arm length signal pole was adopted. A cost comparison was made between the original design, Category I structure considered with galloping, and Category II structure considered without galloping. Table 6.5 shows the comparison with a n additional row showing the adopted design based on this study. Since the adopted design is also based on Category II fatigue design, the estimate cost increase from the original design is similarly in the 25% range.
Table 6.5 – 60ft Arm Design Cost Comparison Arm size Arm plate Arm
bolt Pole size Base plate Base
bolt Cost change
Original design
12.5"~4.1" × 0.25"
23"×23"×2" 2"×4 15"~11.22" × 0.313"
23"×23"×2" 2"×4 0%
Union Metal Design as CAT.I (with galloping)
18.5"~10.5" × 0.313"
30"×33.5"×4" 1.5"×8 21.25"~18.17" × 0.313"
27"×2.75" 2"×8 +40%
Union Metal Design as CAT.II (without galloping)
14.25"~6.25" × 0.313"
25"×20"×2.5" 1.5"×6 17.0"~13.92" × 0.250"
25"×2" 1.75"×6
+25%
Adopted design
14.5"~6.9" × 0.313"
25.5"×29.5"×3"
1.75"×6 16"~12.22" × 0.313
28.5"×2.5" 2"×6 25%‐30%

62
Chapter 7 Investigation of Maryland Signal Pole Foundation 7.1 Shaft Foundation Design Based on Brom’s Method
For cohesive soil, the shaft embedment length (L) is determined by shaft diameter (D), ultimate shear strength of soil, moment, and shear at ground line. The required embedment length (L) by AASHTO LTS‐1 to 6 and LTS‐LRFD Specifications can be found:
(AASHTO C13.6.1.1‐1)
where:
(AASHTO C13.6.1.1‐2)
(AASHTO C13.6.1.1‐3)
Maximal moment (Mu) is located at (1.5D + q) below ground line. For cohesionless soil, shaft embedment length is determined by shaft diameter, angle of internal friction, effective unit weight, moment, and shear at ground line. Required embedment length L by AASHTO LTS‐1 to 6 and LTS‐LRFD Specifications can be found by using the trial and error equation shown below:
MF = Factored moment at ground line (kip‐ft) VF = Factored shear at ground line (kip) D = Diameter of shaft (ft) c = the ultimate shear strength of cohesive soil (ksf)
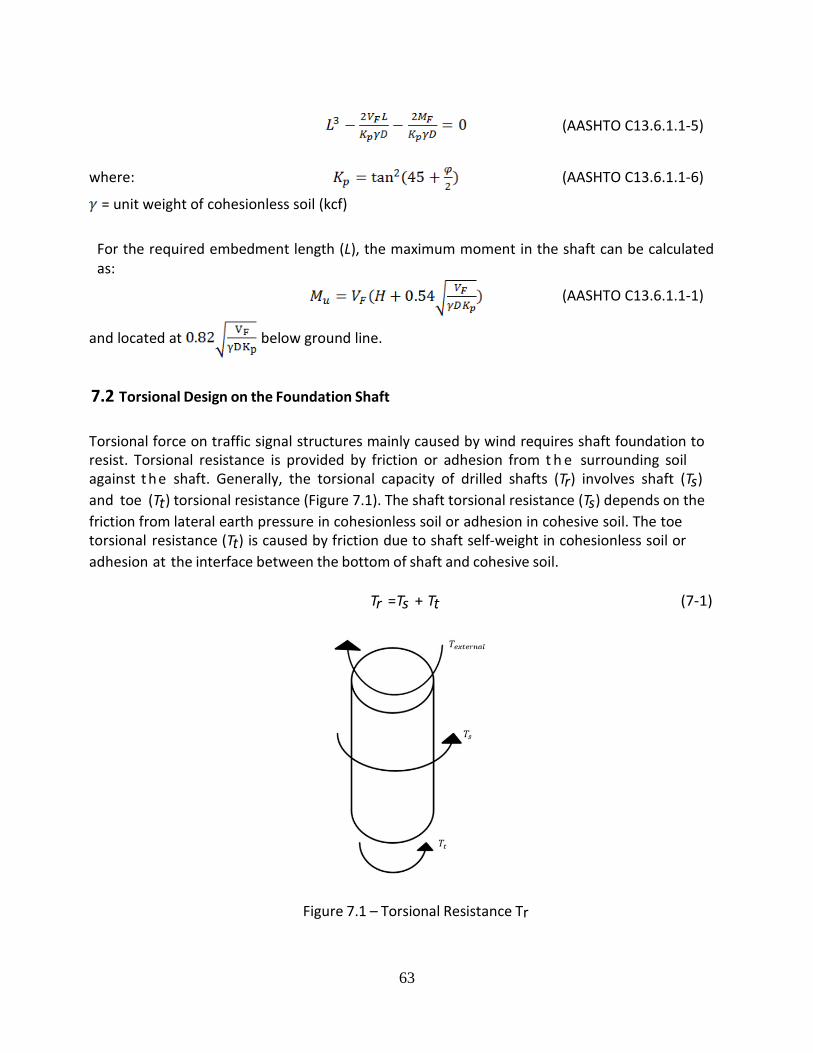
63
(AASHTO C13.6.1.1‐5)
where: (AASHTO C13.6.1.1‐6)
= unit weight of cohesionless soil (kcf)
For the required embedment length (L), the maximum moment in the shaft can be calculated as:
(AASHTO C13.6.1.1‐1)
and located at below ground line.
7.2 Torsional Design on the Foundation Shaft Torsional force on traffic signal structures mainly caused by wind requires shaft foundation to resist. Torsional resistance is provided by friction or adhesion from t h e surrounding soil against t he shaft. Generally, the torsional capacity of drilled shafts (Tr) involves shaft (Ts) and toe (Tt) torsional resistance (Figure 7.1). The shaft torsional resistance (Ts) depends on the friction from lateral earth pressure in cohesionless soil or adhesion in cohesive soil. The toe torsional resistance (Tt) is caused by friction due to shaft self‐weight in cohesionless soil or adhesion at the interface between the bottom of shaft and cohesive soil.
Tr =Ts + Tt (7‐1)
Figure 7.1 – Torsional Resistance Tr

64
There is no mention of torsion and torsional resistance in the current AASHTO LTS‐1 to 6 and LRFD Specifications, so the torsional resistance must come from other sources. Method I ‐ The Florida Structure Design office method (2003) is merely applicable in cohesionless soil. This method assumes that the soil behaves as a rigid, perfectly‐plastic material and the shaft behaves as a rigid body under simple torsional load at the ultimate or fully‐mobilized soil resistance. The shaft torsional resistance is developed by a unit resistance rs which is the unit friction caused by lateral earth pressure. (7‐2) where K0 = at‐rest lateral earth pressure coefficient, C′vz= effective vertical stress at the midpoint of the layer of interest, and o = external friction angle between the soil and shaft. The total shaft resistance can be obtained by: (7‐3)
where D = shaft diameter, L = shaft length. The toe resistance is caused by t h e shaft self‐weight and t h e axial load applied on drilled shafts is neglected in this design method.
(7‐4)
where W = shaft weight. Method II ‐ Florida District 5 Method (2003) consists of two approaches to evaluate shaft torsional capacity in cohesionless soil.
II.1 ‐ The first approach is the use of SHAFTUF software.
(7‐5)
(7‐6)
where Qa = axial load applied on drilled shafts, Qs = ultimate shaft resistance obtained from SHAFTUF program.
II.2 ‐ The second approach employs the β Method for unit resistance when t h e shaft is under axial loading. The β coefficient is associated with the depth of soil layers and the unit shaft resistance (rs) can be obtained by substituting vertical earth pressure (C′vz). The unit shaft resistance soil is given by:

65
(7‐7)
where β = load transfer ratio for effective‐stress normalized unit shaft resistance and has been correlated to depth and the STP blow count, N:
(7‐8) (7‐9) (7‐10)
where z = depth from the ground surface to the mid‐layer. The shaft resistance is given by:
(7‐11)
The toe resistance is estimated using: (7‐12)
Method III ‐ The Florida District 7 Method (2003) is applicable on cohesive and cohesionless soil. The unit shaft resistance rs is generalized as:
(7‐13) where Su = average undrained shear strength over the depth of interest and Su=0 if t h e soil is cohesionless, K= coefficient of lateral earth pressure ranging from K0 to 1.75, and α= an adhesion factor, which is a function of the average undrained shear strength. (7‐14)
(7‐15)
(7‐16)
where Pa = atmospheric pressure in the same units as .
The unit soil resistance from the ground surface to a depth of L′ (1.5 m or 5 ft) or to the depth of seasonal moisture change is neglected due to the potential loss of shaft resistance near the ground surface. The shaft resistance ( ) is given by: (7‐17)

66
The toe resistance ( ) is estimated by: (7‐18)
Method IV ‐ In the CDOT Design Method (2004), unit resistance is categorized into cohesive soil and cohesionless soil. In cohesive soil, the unit resistance is equal to the undrained shear strength, and the shaft resistance from the ground surface to 1.5D below is neglected. The shaft resistance (Ts) for cohesive soils is given by: (7‐19)
The toe resistance, Tt, is given by: (7‐20)
For shafts in cohesionless soils, the shaft resistance ( ) for cohesive soils is given by: (7‐21)
where the unit shaft resistance ( and K = the coefficient of lateral earth pressure is given by: (7‐22)
where = friction angle of cohesionless soil. The toe resistance ( ) is estimated by: (7‐23)
Method V ‐ In the Ohio design method (2011), the shaft resistance (Ts) is considered and the toe resistance (Tt) is neglected. The torsion resistance is simplified as unit resistance applied on lateral shaft surface uniformly. The unit resistance for cohesionless soil or adhesion factor for cohesive soil is provided by the following equations: (7‐24) (7‐25) where is adhesion of cohesive soil (ksf), = adhesion factor =0.55, is effective vertical earth pressure to the mid‐depth of the soil layer (ksf) and = .
= (cohesive soil) (7‐26)
= (cohesionless soil) (7‐27)

67
7.3 Case Study of Maryland Signal Pole Foundation Step 1 ‐ Length and diameter check In the foundation check, the 75’ mast arm signal structure is selected as the check model since the base reaction force and moment are the largest among Maryland mast arm signal structures. The soil conditions are assumed as general properties in the State of Maryland for the shaft current design check including diameter, embedment length and longitudinal reinforcement. The properties of cohesive and cohesionless soils are listed in the below table.
Table 7.1 ‐ Properties of cohesive and cohesionless soils Soil Type Soil Category Shear Strength Unit Weight Internal Friction Angle Cohesive Stiff clay 2.16 ksf N/A N/A Cohesionless Clean gravel‐sand N/A 0.12 kcf 30
The external load is t h e base reaction of t h e 75’ mast arm signal structure obtained from SABRE software. Factored ground moment is 174.7kip‐ft and Factored ground shear is 5.35 kip.
where: Cohesive soil: required embedment length (L) = 9.3 ft < 10 ft (current design length) Cohesion soil: required embedment length (L)= 8.9 ft < 10 ft (current design length). Step 2 ‐ Longitudinal reinforcement check For cohesive soil, maximal ( is located at below the ground line.
207 kip‐ft
For cohesionless soil, maximal ( is located at below the
ground line.
183.1 kip‐ft Current longitudinal reinforcement design (75’):
fc’ fy Number of rebar Size of rebar 4 ksi 60 ksi 16 #10
D= 4 ft

68
Figure 7.2 Shaft Rebar P‐M interaction diagramWhere:
Step 3 ‐ Torsion check
For cohesive soil, the torsional resistance is provided by the adhesion of soil. According to the Illinois DOT design method, the torsional resistance (Tr) is mainly from lateral side soil and resistance at the bottom of the shaft is neglected. Base torsion is 131.8 (kip‐ft) obtained from SABRE software.
=0.5⋅D⋅A⋅α⋅
kip‐ft > 131.8 kip‐ft
Where: D= Diameter of shaft (ft) L= Length of shaft (ft) A= Lateral surface area of shaft (ft2) Su= Average soil undrained shear strength (ksf) α= Adhesion factor = 0.55
For cohesionless soil, the torsional resistance (Tr) is provided by friction between the soil and shaft. Based on t h e Beta method adopted by the Illinois DOT, torsional resistance is
Interaction Diagram 1.200 1.000 0.800 0.600 0.400 0.200 0.000
0 0.02 0.04 0.06 0.08 0.1 0.12 0.14 Rn
Kn
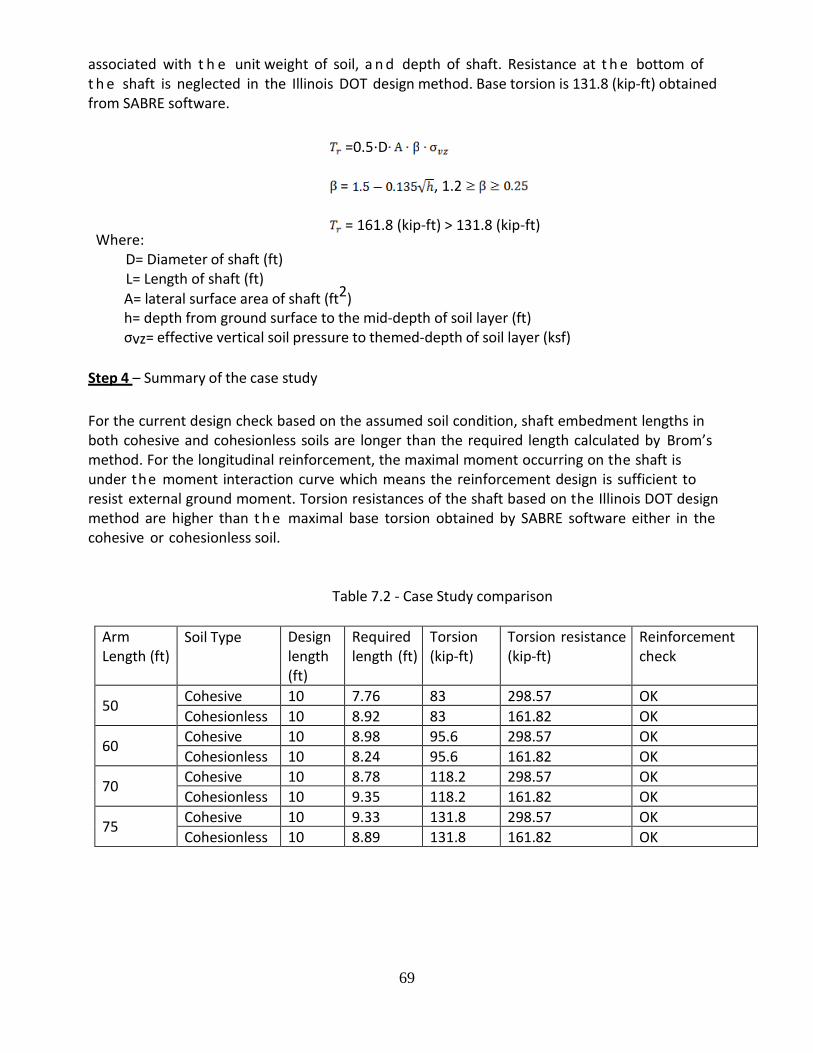
69
associated with t h e unit weight of soil, a n d depth of shaft. Resistance at t h e bottom of t h e shaft is neglected in the Illinois DOT design method. Base torsion is 131.8 (kip‐ft) obtained from SABRE software.
Where:
D= Diameter of shaft (ft) L= Length of shaft (ft)
A= lateral surface area of shaft (ft2) h= depth from ground surface to the mid‐depth of soil layer (ft) σvz= effective vertical soil pressure to themed‐depth of soil layer (ksf)
Step 4 – Summary of the case study For the current design check based on the assumed soil condition, shaft embedment lengths in both cohesive and cohesionless soils are longer than the required length calculated by Brom’s method. For the longitudinal reinforcement, the maximal moment occurring on the shaft is under the moment interaction curve which means the reinforcement design is sufficient to resist external ground moment. Torsion resistances of the shaft based on the Illinois DOT design method are higher than t h e maximal base torsion obtained by SABRE software either in the cohesive or cohesionless soil.
Table 7.2 ‐ Case Study comparison
Arm Length (ft)
Soil Type Design length (ft)
Required length (ft)
Torsion (kip‐ft)
Torsion resistance (kip‐ft)
Reinforcement check
50 Cohesive 10 7.76 83 298.57 OK Cohesionless 10 8.92 83 161.82 OK
60 Cohesive 10 8.98 95.6 298.57 OK Cohesionless 10 8.24 95.6 161.82 OK
70 Cohesive 10 8.78 118.2 298.57 OK Cohesionless 10 9.35 118.2 161.82 OK
75 Cohesive 10 9.33 131.8 298.57 OK Cohesionless 10 8.89 131.8 161.82 OK
=0.5⋅D = , 1.2
= 161.8 (kip‐ft) > 131.8 (kip‐ft)

70
Chapter 8 Summary and Conclusions
In the present research, the fatigue design of mast arm structures is thoroughly studied. The study gathered and discussed the current state‐of‐the‐practice methods. Complete model analysis of traffic signal structure, including structure foundation, was conducted using ANSYS and SABRE programs and self‐developed Excel calculation sheets. Recommendation of current Maryland structure design has then been proposed. Cost analysis of a 60’‐arm length pole was studied for reference. Conclusions can be drawn as follows:
1. The latest fatigue design in AASHTO LRFD Specification for structural support and different types of mitigation devices were surveyed and studied. Twenty‐seven (27) out of 50 state DOTs replied to the 21‐question signal structure questionnaire. Information about other states’ practices and current mitigation devices was also gathered for reference. Following are the new criteria adopted by the State of Maryland: • Using Importance Category II with mitigation device in the fatigue design for galloping
and Importance Category I without; using Category I for other fatigue loading • Using 50‐year design life • Applying grove welds for both arm and pole connections • Adopting AASHTO built‐up box type • Using signal head back plate • Using non‐stiffened pole base (as currently practiced) • Using 6‐bolt pattern for both arm and based connection plates • Adopting PennDOT 24”x24” wing plate as the mitigation device • Using 100‐mph wind speed for LTS‐6 design (as currently practiced).
2. A detailed comparison was made between AASHTO LRFD Specifications for Structural
Supports for Highway Signs, Luminaires, and Traffic Signals and the existing MD SHA Book of Standards. It is concluded that the majority of Maryland signal structures located along state routes are classified as Category I due to t h e speed limit and ADT. However, by having effective mitigation devices, the fatigue load category for galloping could be lowered from Category I to II. Among mechanical damping devices, the spring‐mass impact damper is an effective mechanical mitigation device, but t h e wing plate is considered a feasible aerodynamic mitigation device.
3. Several models with different arm lengths (50’, 60’, 70’ and 75’) based on MD SHA
Standards for Highway and Incidental Structures were studied using SABRE program authored by the research team. Suggested design improvements based on the latest AASHTO fatigue criteria are proposed. To satisfy new fatigue design requirements, new groove weld tube‐to‐transverse plate connection and new pole/arm size should be adopted into the current design standards.
4. Based on NCHRP 469 report, preliminary fluid‐solid‐interaction numerical analyses were made in this study with horizontal damping plate to provide the basis of reducing the galloping from Category I to II. For the selected 75’‐arm signal pole model with damping
71
plate, dynamic moment, after few cycles, can be reduced to 65% of the first cycle. This reduction happens to match the importance factor 1.0 of Category I to 0.65 of Category II. To study the effectiveness of the damping plate, a future parametric study based on proper parameters must be made.
5. The current Maryland signal pole foundation design based on assumed soil properties is
also checked under the new proposed signal structure design. Both foundation embedment length and longitudinal reinforcement are within AASHTO requirement. Torsional resistance is also checked and found adequate using the Illinois DOT method.
72
References
AASHTO, Standard Specifications for Structural Supports for Highway Signs, Luminaries and Traffic Signals, 1994(LTS‐3), 2001 (LTS‐4), 2009 (LTS‐5), 2013 (LTS‐6)
AASHTO, AASHTO LRFD Specifications for Structural Supports for Highway Signs, Luminaries and Traffic Signals, 2015(LTS‐LRFD)
Christenson, Richard (2011), IDEA Project NCHRP‐141 Final Report. Reducing Fatigue in Wind‐ Excited Traffic Signal Support Structures using Smart Damping Technologies, University of Connecticut, Storrs, CT, January 2011.
Cook, R. A., D. Bloomquist, D. S. Richard, M. A. Kalajian, V. A. Cannon, and D. P. Arnold(2000), Structure and Material Research Report No. BC‐050 Final Project Report. Design, Testing, and Specification of a Mechanical Damping Device for Mast Arm Traffic Signal Structures, University of Florida, Gainesville, FL, January 2000.
Connor, R. J., S. H. Collicott, A. M. DeSchepper, R. J. Sherman, and J. A. Ocampo. NCHRP Report 718: Fatigue Loading and Design Methodology for High‐Mast Lighting Towers. Transportation Research Board of the National Academies, Washington, D.C., 2012.
Dexter, R. J and Ricker M.J (2002), NCHRP REPORT 469. Fatigue‐Resistant Design of Cantilevered Signal, Sign, and Light Supports. University of Minnesota, Minneapolis, MN, 2002
FDOT Modifications to Standard Specifications for Structural Supports for Highway Signs, Luminaires and Traffic Signals (LTS‐6), FDOT Structures Manual, Volume 3, January 2016
Florea, Micah J., Lance Manuel, et al., (2007), Report FHWA/TX‐08/0‐4586‐1. Field Tests and Analytical Studies of the Dynamic Behavior and the Onset of Galloping in Traffic Signal Structures. Texas Tech University, Lubbock, TX, November 2007
Florea, Micah J., Lance Manuel, et al., (2008), Report FHWA/TX‐07‐4586‐3. Full‐Scale Controlled Tests of Wind Loads on Traffic Signal Structures. Texas Tech University, Lubbock, TX, May 2008
Gray, D. (1999), Fatigue Effects On Traffic Signal Structures, Master Dissertation, University of Wyoming, Laramie, WY
Hamilton, H.R, Riggs G.S and Puckett J.A (2000), Increased Damping In Cantilevered Traffic Signal Structures. Journal of Structural Engineering, April 2000.
Kaczinski, M.R., Dexter, R.J.,Van Dien, J.P. (1998), NCHRP Report 412: Fatigue‐Resistant Design of Cantilevered Signal, Sign and Light Supports.

73
Letchford, Christopher; Hector Cruzado (2008), Risk Assessment Model for Wind‐Induced Fatigue Failure of Cantilever. Report FHWA/TX‐07/4586‐4. Texas Tech University, Lubbock, TX, May 2008
McDonald, J.R., et al., (1995), Report 1303‐1F.Wind Load Effects on Signals, Luminaires and Traffic Signal Structures. Wind Engineering Research Center, Texas Tech University, Lubbock, TX, February 1995.
MD SHA Standards for Highway and Incidental Structures (Standard No MD800.01 Rev. Jan. 10, 2017) http://apps.roads.maryland.gov/businesswithsha/bizstdsspecs/desmanualstdpub/publicationso nline/ohd/bookstd/index.asp
Puckett, J.A., Garlich, M.G., Nowak, A., Barker, M. (2014), NCHRP Report 796: Development and Calibration of AASHTO LRFD Specifications for Structural Supports for Highway Signs, Luminaires, and Traffic Signals.
Sause, Richard, NCHRP 10‐70, Cost‐Effective Connection Details for Highway Sign, Luminaire, and Traffic Signal Structures, 2011

74
Appendix A.
• Q1 If fatigue design is used for cantilever mast arm signal structures, what economic consideration is required for the fatigue design criteria particularly for urban applications?
• Alaska
• If specific loading or mast arm length exceeds standard drawing, the design must be reanalyzed by the pole manufacturer.
• Arizona
• None‐ Category I – Currently department is undergoing an update to 6th edition AASHTO LTS
• California
• Our 2010 Standard Plans made some changes to base plate thicknesses and welded connection detailing for large tubes. These were thought to present a reasonably practical way to improve fatigue performance, even if explicit design to the code was still thought impractical. In application of new standards, economic considerations can come into play.
• Colorado
• Using Ubolt at arm connection & galvanized to reduce future repairs
• Connecticut • On state projects, all mast arms are designed for fatigue.
• Indiana
• Fatigue design is used but no special allowances are made for structures in an urban environment. Local agencies may do so for projects on their own roads.
• Kansas
• KDOT’s design requirements are only considering what is safe and reasonable for signalized state highway locations. No economic considerations were made.
• Kentucky • Use Category II to decrease size and reduce cost.
• Louisiana • On all cantilever mast arm signals, only fatigue due to natural
wind gusts is considered.
• Maryland • SHA signal structure design standards are per AASHTO
1994 standard which doesn’t include Fatigue design.
• Massachusetts • Except as noted in Question 2, all mast arms are designed to
fatigue Category 2.
• Michigan
• MDOT standard is Category 1. If local agencies wish to use Cat. II or III for aesthetic reasons they must reimburse MDOT for biennial inspection costs.
• Minnesota
• We are in the process to convert the standards to meet 2015 LRFD and fatigue requirements. This work will be done in the next few months. I don’t know what the economic consideration will be, but meeting code requirements is the key.

75
• New Jersey
• We are in process of moving forward for AASHTO LRFD to consider fatigue design for all support structures. Existing practice for economic fatigue design of mast arm signal structures is: 1) for steel, waived for arm <=50 ft.; 2) for aluminum, waived for standard signal structures
• North Carolina
• No specific economic criteria are used for fatigue considerations.
• Oregon
• The fatigue is a direct relation to the loading on the pole and this can significantly affect the cost of the structure.
• Pennsylvania
• PennDOT has a modified foundation design for situations in urban areas that involve a smaller foot print.
• Tennessee
• Tennessee ignores galloping on mast arms with vibration dampers.
• Texas
• TxDOT uses standard designs and details for these structures with whatever economic considerations the engineer who developed these designs employed. We have no formal guidelines for such considerations. Two wind velocities were used in the development of all TxDOT’s traffic signal structure standard design: sustained (fastest mile) velocities of 80 mph and 100 mph.
• Virginia
• The same design criteria are applied to both urban and rural traffic signals. It is impractical to have different designs based on ADT or speed limit. To reduce the economic impacts of fatigue design, the Department is electing to not design for galloping and allow the use of full penetration welds for connections
• Wisconsin • Simple structure meeting AASHTO design requirements

76
• Q5. In your state practice, what are the allowable dead load and wind load on the mast arm?
• Alaska
• Design wind loading is based on 100 MPH and Fatigue Category III with galloping, which addresses 50‐year interval wind isotachs for most of the state.
• Arizona • Not specified use standard
• Connecticut
• Mast arms are a designed for the load effects due to the actual traffic appurtenances (signals, signs, luminaires, cameras, etc.)
• Indiana
• Various dead loads pending arm length‐ see standard drawings, the design wind velocity is 90 mph plus gust factor.
• Iowa • Details at the end of the survey.
• Kansas
• Wind, Ice and Dead Loads (Signal Heads and back plates, 9’ x 18” Street Sign and Video Detection (See attached table and detail below).
• Kentucky
• The allowable is based on materials and designs based on AASHTO SPEC.
• Louisiana
• Dead loads are per the loading tree provided in our specs (see attached). Wind load is based on a 130‐mph design speed.
• Maryland
• Current standard design for 150lb dead load, and 750lb wind load applied at the tip of a cantilever mast arm. The max. CSR with this load combination is restricted to 0.55 to allow for variance in signal and sign loadings on the structure.
• Massachusetts
• Mass DOT uses a design wind speed of 130 mph for the coastal and Berkshire Mountains regions and 110 mph for the rest of the state. The actual loading for our standard designs has been calculated by a professional structural engineer and may be sent by request (there are several hundred pages of calculations).
• Michigan
• Wind load is per AASHTO LTS 16th Ed. Max. Dead load is 365lb (4 signals plus signs)
• Minnesota
• We have a program that was developed based on our design that we insert signal heads and sign panels along with location on the mast arm to determine if load is acceptable.
• Nevada • Wind speed 90 mph.
• New Jersey
• It varies for standard loads. At arm tip, 4X12” sections back to back; 3x12” sections 12’, 24’, 36’ away; sign plates in between; all signals with back plates; and so on. WL – 80 mph Appendix C.
• North Carolina • Allowable DL/WL/Combo is set to obtain CSR’s less than or equal to
• Oregon
• Calculated according to AASHTO Standard Specifications for Structural Supports for Highway Signs, Luminaires and Traffic Signals 4th edition, 2001, 2002, and 2003 interim revisions.

77
• Ohio • We do not design with dead load, only wind load. Design data’s
table are in Ohio traffic engineering manual.
• Pennsylvania
• Dead Load: The following shall supplement
A3.5. Wind Load: The following shall replace A3.8.
• Tennessee
• Pole fabricator sets member sizes, allowable dead load and wind load are dependent on member cross‐sectional properties. Detail information is not available as one manufacturer might be use a large diameter thin wall section, and another might use smaller diameter thicker wall section.
• Texas
• Virginia
• For dead load, a link to the road and bridge standards is provided. (http://www.extranet.vdot.state.va.us/LocDes/Electronic_Pubs/2008 Standards/TOC1300.pdf) The loading requirements are shown in Standard MP‐3. For wind load, we have elected to use the
• Wisconsin
5‐3 signal heads @ 8’ spacing, 3‐24”*30” signs, 1‐18”*108” sign @ 15’ from C/L of pole 3psf sign weight.
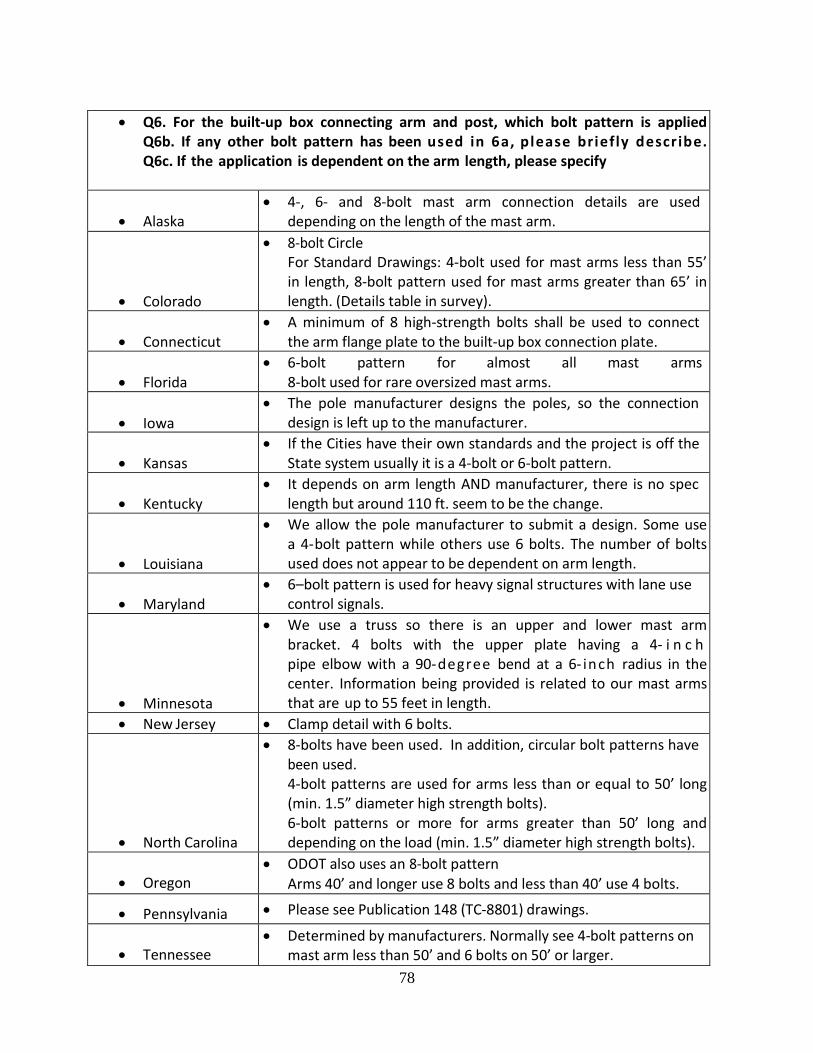
78
• Q6. For the built‐up box connecting arm and post, which bolt pattern is applied
Q6b. If any other bolt pattern has been used in 6a, please briefly describe. Q6c. If the application is dependent on the arm length, please specify
• Alaska
• 4‐, 6‐ and 8‐bolt mast arm connection details are used depending on the length of the mast arm.
• Colorado
• 8‐bolt Circle For Standard Drawings: 4‐bolt used for mast arms less than 55’ in length, 8‐bolt pattern used for mast arms greater than 65’ in length. (Details table in survey).
• Connecticut
• A minimum of 8 high‐strength bolts shall be used to connect the arm flange plate to the built‐up box connection plate.
• Florida
• 6‐bolt pattern for almost all mast arms 8‐bolt used for rare oversized mast arms.
• Iowa
• The pole manufacturer designs the poles, so the connection design is left up to the manufacturer.
• Kansas
• If the Cities have their own standards and the project is off the State system usually it is a 4‐bolt or 6‐bolt pattern.
• Kentucky
• It depends on arm length AND manufacturer, there is no spec length but around 110 ft. seem to be the change.
• Louisiana
• We allow the pole manufacturer to submit a design. Some use a 4‐bolt pattern while others use 6 bolts. The number of bolts used does not appear to be dependent on arm length.
• Maryland
• 6–bolt pattern is used for heavy signal structures with lane use control signals.
• Minnesota
• We use a truss so there is an upper and lower mast arm bracket. 4 bolts with the upper plate having a 4‐ i n c h pipe elbow with a 90‐degree bend at a 6‐ inch radius in the center. Information being provided is related to our mast arms that are up to 55 feet in length.
• New Jersey • Clamp detail with 6 bolts.
• North Carolina
• 8‐bolts have been used. In addition, circular bolt patterns have been used. 4‐bolt patterns are used for arms less than or equal to 50’ long (min. 1.5” diameter high strength bolts). 6‐bolt patterns or more for arms greater than 50’ long and depending on the load (min. 1.5” diameter high strength bolts).
• Oregon
• ODOT also uses an 8‐bolt pattern Arms 40’ and longer use 8 bolts and less than 40’ use 4 bolts.
• Pennsylvania • Please see Publication 148 (TC‐8801) drawings.
• Tennessee • Determined by manufacturers. Normally see 4‐bolt patterns on
mast arm less than 50’ and 6 bolts on 50’ or larger.
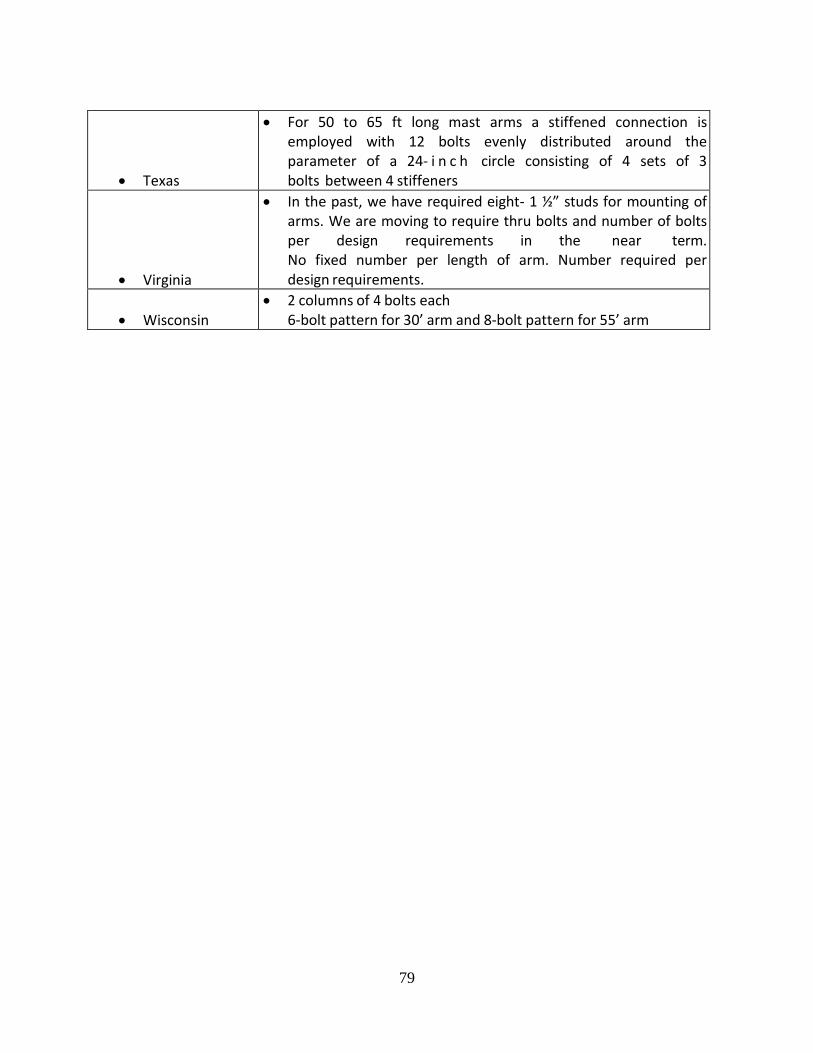
79
• Texas
• For 50 to 65 ft long mast arms a stiffened connection is employed with 12 bolts evenly distributed around the parameter of a 24‐ i n c h circle consisting of 4 sets of 3 bolts between 4 stiffeners
• Virginia
• In the past, we have required eight‐ 1 ½” studs for mounting of arms. We are moving to require thru bolts and number of bolts per design requirements in the near term. No fixed number per length of arm. Number required per design requirements.
• Wisconsin
• 2 columns of 4 bolts each 6‐bolt pattern for 30’ arm and 8‐bolt pattern for 55’ arm

80
• Q7c. If the application is depending on the arm length, specify which anchor bolt pattern used for what mast arm length?
• Alaska
• Standard Drawing uses 8‐bolt pattern for mast arms 70’ or greater, and 4‐bolt pattern is used for mast arms 65’ and shorter
• Colorado
• Arm length < 55ft – 4 bolts
Arm length >75ft – 6 bolts
• Connecticut
• The minimum number of anchor bolts is independent of the arm length.
• Iowa
• The pole manufacturer designs the poles, so the base plate and anchor bolt pattern is left up to the manufacturer
• Kentucky
• Depends o n b o l t dia. chosen, bolt circle and manufacturer. Longer arms higher loads lead to more bolts.
• Louisiana
• Single mast arms 55 ft. and under use 4 bolts. Single mast arms 60 ft. and over use 6 bolts. Dual mast arms 45 ft. x 40 ft. and under use 4 bolts. Dual mast arms 50 ft. x 35 ft. use 6 bolts.
• Maryland
• 6–bolt pattern is used for the heavy signal structures for lane use control signals.
• New Jersey
• Current practice is, for steel, (a) for arm length without fatigue design; (b) for arm length with fatigue design
• North Carolina
• Currently we use a minimum 8‐bolt anchor bolt pattern, regardless of arm length. The bolt patterns along with the mast arms and uprights are custom designed.
• Tennessee
• Anchor bolt pattern is dependent on moment capacity at the base. This is only indirectly related to mast arm length, as longer arms generally accommodate more signal heads.
• Virginia • We allow 6 bolts for arms 50 feet or less
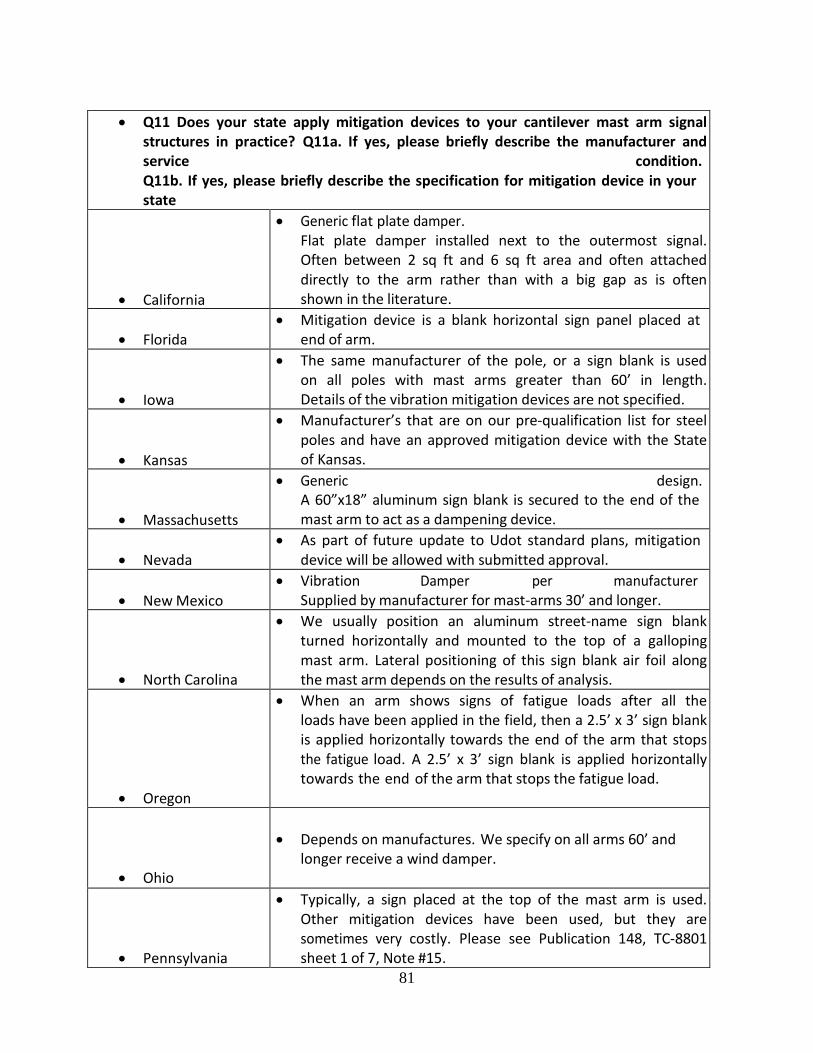
81
• Q11 Does your state apply mitigation devices to your cantilever mast arm signal
structures in practice? Q11a. If yes, please briefly describe the manufacturer and service condition. Q11b. If yes, please briefly describe the specification for mitigation device in your state
• California
• Generic flat plate damper. Flat plate damper installed next to the outermost signal. Often between 2 sq ft and 6 sq ft area and often attached directly to the arm rather than with a big gap as is often shown in the literature.
• Florida
• Mitigation device is a blank horizontal sign panel placed at end of arm.
• Iowa
• The same manufacturer of the pole, or a sign blank is used on all poles with mast arms greater than 60’ in length. Details of the vibration mitigation devices are not specified.
• Kansas
• Manufacturer’s that are on our pre‐qualification list for steel poles and have an approved mitigation device with the State of Kansas.
• Massachusetts
• Generic design. A 60”x18” aluminum sign blank is secured to the end of the mast arm to act as a dampening device.
• Nevada
• As part of future update to Udot standard plans, mitigation device will be allowed with submitted approval.
• New Mexico
• Vibration Damper per manufacturer Supplied by manufacturer for mast‐arms 30’ and longer.
• North Carolina
• We usually position an aluminum street‐name sign blank turned horizontally and mounted to the top of a galloping mast arm. Lateral positioning of this sign blank air foil along the mast arm depends on the results of analysis.
• Oregon
• When an arm shows signs of fatigue loads after all the loads have been applied in the field, then a 2.5’ x 3’ sign blank is applied horizontally towards the end of the arm that stops the fatigue load. A 2.5’ x 3’ sign blank is applied horizontally towards the end of the arm that stops the fatigue load.
• Ohio
• Depends on manufactures. We specify on all arms 60’ and
longer receive a wind damper.
• Pennsylvania
• Typically, a sign placed at the top of the mast arm is used. Other mitigation devices have been used, but they are sometimes very costly. Please see Publication 148, TC‐8801 sheet 1 of 7, Note #15.

82
• Tennessee
• Tennessee does not utilize commercially available viscous damper for vibration. 18”*16” sign blank mounted horizontally near the tip of all mast arms 50’ or greater in length.
• Texas
• Contractors typically provide and install the damping device specified in contract plans. TxDOT standards provide only a damping plate device to be mounted over the signal head at or near the free end of the arm. Recommended size and placement are based on findings of TxDOT research. Actual place size and device placement varies widely.
• Wisconsin
• Signals and signs must be installed with 5 days of structure erection.